Applying the Theory of Planned Behavior to Recycling Behavior in South Africa

Natural Resources and the Environment, Council for Scientific and Industrial Research, P.O. Box 395, Pretoria 0001, South Africa
Recycling 2018, 3(3), 43; https://doi.org/10.3390/recycling3030043
Submission received: 30 July 2018
/
Revised: 30 August 2018
/
Accepted: 5 September 2018
/
Published: 8 September 2018
(This article belongs to the Special Issue Waste Management Practices in Developing Countries)
Abstract
:This paper reports on an application of the Theory of Planned Behavior to understand the relationships between the determinants (latent variables) comprising the Theory of Planned Behavior and, based on these findings, to guide decision-making related to household recycling in South Africa. Data from a representative sample of respondents in large urban areas (n = 2004) was analyzed using Structural Equation Modeling (SEM). The results of the SEM analysis showed a good fit of the survey data to the Theory of Planned Behavior theoretical model. The Theory of Planned Behavior explains 26.4% of the variance in recycling behavior and 46.4% of the variance in intention to recycle. Only 3.3% of South Africans in large urban areas show dedicated recycling behavior, considering the recycling of five materials: paper, plastic, glass, metal, and compostable organic waste. The recycling frequency item in the recycling behavior construct is the most likely to be over-reported. South Africans lack sufficient knowledge, positive attitudes, social pressure, and perceived control that would encourage recycling behavior. Awareness drives containing moral values (injunctive norms) and information about available recycling schemes, combined with the provision of a curbside collection service for recyclables, have the greatest chance to positively influence recycling behavior amongst South Africa’s city dwellers.
1. Introduction
The waste management challenge is not unique to South Africa. The urban areas in “most low- and middle-income countries” receive unreliable and inadequate municipal solid waste management services (Bartone 2004:3). Similar to other developing countries [1,2,3,4,5], many municipalities in South Africa struggle to supply adequate waste management services [6,7]. Waste collection coverage in Africa varies between 25% and 70% [8]. In 2012 about 68 million tons of the estimated 125 million tons of waste generated in Africa, was collected [9]. It is projected that by the year 2025 urban waste generation in Africa will reach 441,840 tons per day [10]. In addition to population growth that adds to the volumes of waste generated, increased consumption rates, excessive packaging, and throw-away attitudes aggravate the waste problem and puts pressure on the environment and on limited resources [11,12,13].
In South Africa, the implementation of the waste management hierarchy, as envisaged in national legislation [14,15], provides the required enabling regulatory environment to support a circular economy, i.e., a closed loop system where secondary resources are reintroduced back into the economy. One of the many benefits of moving waste up the hierarchy is that recycling and energy recovery from waste displace the use of virgin resources, which in turn reduce the costs (financial, social, and environmental) associated with virgin resource extraction [16,17,18]. In 2011, the annual resource value of waste in South Africa was estimated at R25.2b—about 0.86% of South Africa’s gross domestic product (GDP) [18]. Ambitious targets for diverting these recyclables from landfill add to the waste management challenge [19].
In an attempt to divert recyclables from landfill, the South African recycling sector has mostly been active to recover recyclables from preconsumer waste, i.e., the recovery of recyclable materials from commercial and industrial processes without a consumer being involved as the end-user. The important role of the informal sector in postconsumer recycling is acknowledged [20], but postconsumer recycling should receive more attention in order to increase recycling rates on a national level, especially if the targets for diversion is to be reached [21,22].
This paper reports on the findings from a baseline study in South Africa to ascertain recycling behavior at household level at a given point in time before the National Environmental Management: Waste Act (NEMWA) (Act No. 59 of 2008) [14] was widely implemented. As a theoretical framework, the Theory of Planned Behavior (TPB) is applied to show the relationships between attitude, social pressures, and perceived control over the act of recycling, as determinants of intention to recycle as well as recycling behavior. It is envisaged that the results from this study would inform waste management decision-making and highlight areas of possible intervention that would have the most impact at household level to positively change behavior towards increased recycling. Knowing which variables have a greater effect on recycling behavior can guide government and industry initiatives and interventions towards implementation of the NEMWA and reaching separation at source targets. Decision-making related to household recycling includes the structure, functioning, and placement of recycling programs, the infrastructure requirements to support behavioral expectations, and the focus of communication strategies and awareness programs.
Following on this short introduction, the rationale for selecting the TPB and a brief introduction to the theoretical framework is provided in the literature section. The third section describes the methodological approach, including a description of the questionnaire content, followed by the statistical method in the fourth section. Section 5 presents the results and discussion and the sixth section summarizes the main conclusions.
2. Literature
For decades researchers have been searching for variables that influence behavior and to identify the variables affecting behavior the most. Published in the mid-1970s, some of the first studies on recycling behavior include the effect of information and incentives on paper recycling amongst resident university students [23], the effect of attitude and personality on recycling [24], the ascription of recycling behavior to ideological and demographic variables [25], and the willingness to recycle glass and paper [26]. Over the years, conflicting results were published, for example, Weigel (1977) ascribed recycling to, amongst others, demographic variables [25], but later studies showed no direct effect of demographic variables on behavior [27,28,29,30].
In the waste management domain popular theories that have been applied in an attempt to explain recycling behavior include, amongst others, the Theory of Reasoned Action (TRA), the TPB, and Schwartz’s (1977) Theory of Normative Conduct [31], to name a few. Over the years the TPB has been used in many research fields to understand behavior [32]. Examples include human health (refer to the 1996 Godin and Kok review of studies using the TPB in behavior related to health [33]), water conservation [34], and waste recycling [35,36,37,38]. Thus, a wealth of empirical data supports and contributes to the popularity of the TPB [39].
Critique against the TPB is also documented. One of the main criticisms of the TPB is that the model finds it difficult to predict behavior that is not out of choice or preference, or that requires resources and skills [40]. In addition, acknowledging that beliefs and attitudes are important; Boldero (1995) concluded that the TPB is inadequate to explain recycling behavior [41]. Ajzen and Madden (1986) noted that although a person can decide to act a certain way, the successful execution of the behavior relies on external factors such as the availability of resources [42]. If barriers that prevent the action are removed, the action is also more likely to happen [43]. Despite being criticized [41,44], the TPB is one of the most widely-used and most-supported theories to explain recycling behavior [45,46,47,48].
2.1. Theoretical Framework
Based on the concepts explained in Dulany’s Theory of Propositional Control, Ajzen and Fishbein developed the TRA, the forerunner of the TPB, with the addition of predictions of specific intentions and behavior [49]. The Theory of Propositional Control explains that behavior is not necessarily strengthened by reward or discouraged by punishment [50,51]. Rather, “people form a conscious intention [a] behavioral intention” to act a certain way [50,51] (p. 440). The behavioral intention (BI) is determined by the beliefs that a specific behavior will have a desired outcome, the value attributed to the outcome, the perception that a specific behavior will contribute to the outcome, the perception of the correctness of the behavior, and perceptions of the degree to which the specific behavior is expected [50]. In other words, people’s intentions depend on their motivation to comply with what they believe is a desired action, what they feel is expected of them and “what they think they are supposed to do” [50] (p. 440). Dulany’s theory of BI does not nullify the value of positive reinforcement, but emphasizes the role of people’s beliefs [50].
According to the TRA, an intention to act is a precursor to the behavior related to the same act [49]. In turn, attitude towards the behavior and social pressures (subjective norm) are determining factors of the intention to perform a certain action [49]. Attitude is a personal factor which refers to a person’s evaluation of the behavior. Subjective norm is a social factor which refers to the “perceived social pressure” to comply with a certain behavior, where social pressure is defined as the perceptions, beliefs, and judgments of other household members and community members related to recycling. Both attitude and subjective norm are grounded in the belief systems of a person [42] (p. 454). While subjective norms are the construct where the “influence of relevant others” are expressed [52], attitude is a more personal construct—an expression of the “self” [31].
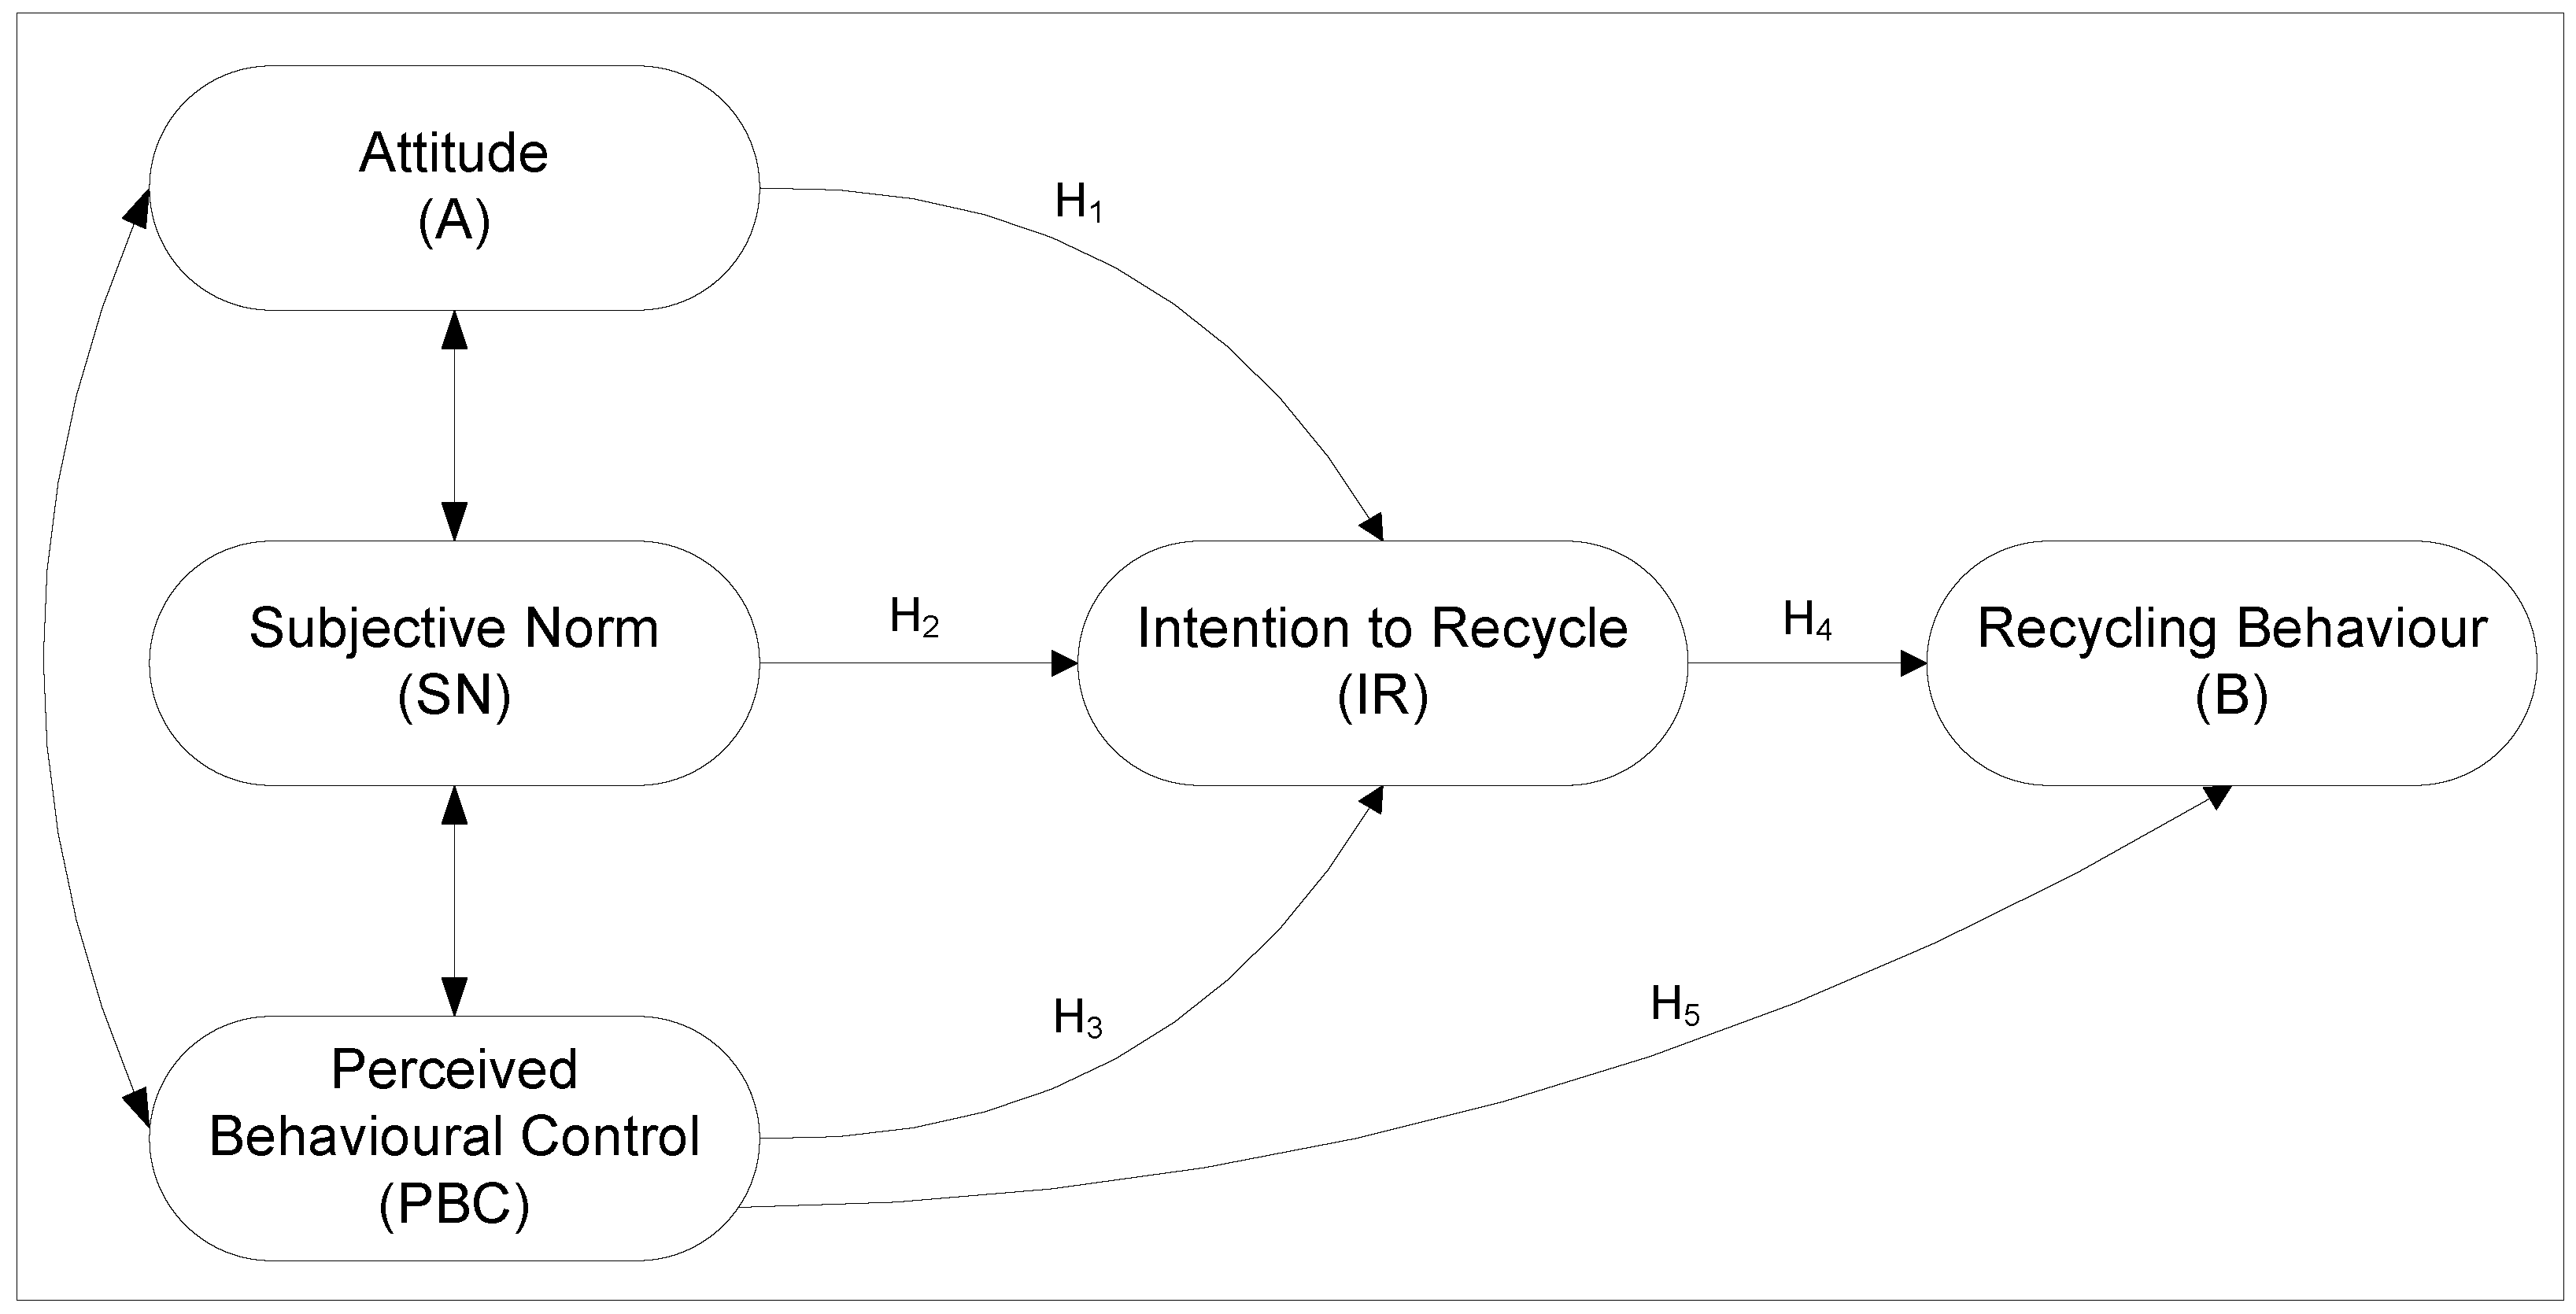
The TPB expand on the TRA by including perceived behavioral control (PBC), which is a reflection of people’s beliefs or “confidence in their ability to perform” a certain action [42] (p. 457), as well as an indication of the “available resources and opportunities” [42] (p. 459) (Figure 1). PBC has an additional effect on people’s intention to act, which is independent of either attitude or subjective norm [42]. Apart from the intention to act, the executing of a behavior is also dependent on a person’s perception of the ability to perform the specific behavior—how easy or difficult it is to perform the specific action. Thus, PBC exerts pressure on the intention to behave, but also independently on the behavior itself [53].
2.2. Research Question
This study addresses the following research question. Within the context of the status of postconsumer recycling in South Africa, which interventions at household level would be the most successful to encourage and maximize postconsumer recycling behavior in South Africa?
The subquestions interrogated in this paper are listed below.
- Which variables have the greater effect on recycling behavior (within the framework of the TPB)?
- Are the findings from the South African baseline study similar to the findings of international studies of domestic waste recycling behavior to allow generalization and thus co-learning across boundaries?
2.3. Hypotheses
Figure 1 shows the TPB model as described in the theoretical framework (Section 2.1). The hypotheses are defined as follows:
- H1
- A positive attitude towards recycling has a positive and direct effect on the intention to recycle.
- H2
- Subjective norm, i.e., the social pressures to recycle (the beliefs and the judgments) has a positive and direct effect on the intention to recycle.
- H3
- Perceived behavioral control has a positive and direct effect on the intention to recycle.
- H4
- Intention to recycle has a positive and direct effect on recycling behavior.
- H5
- Perceived behavioral control has a positive and direct effect on recycling behavior.
3. Method
3.1. Research Design
A quantitative research method was followed to apply the TPB to waste recycling behavior in South Africa. A fixed form survey which allowed the selection of options was used to gather data from a relatively large sample (n = 2004) within a short period of time [56,57]. A structured questionnaire standardized the interview process and ensured that the same questions were posed in the same way [57].
3.2. Sampling
A random probability sampling method was followed to obtain a representative sample of the South African population in the large urban areas [56], i.e., metropolitan areas and cities with a population size of 250,000 or more and included Cape Town, Johannesburg, Durban, East Rand, Pretoria, Port Elizabeth, the Vaal area, East London, Pietermaritzburg, Bloemfontein, and Welkom (Figure 2). For the standard random selection procedure starting points were selected at random and a Kish-grid used to select individual respondents [58]. A large sample size of 2000 was chosen to reduce the effect of sampling errors [56,59,60].
3.3. Questionnaire Design
Being part of a larger survey, one of the questionnaire sections made up the constructs of the TPB. The TPB constructs contain statements which measured respondents’ behavior, intentions to behave, attitudes, subjective norms, and perceived behavioral control. The sequence of questions can influence survey results [60]. Therefore, the behavior questions preceded the attitude questions to prevent alignment of the easier factual accounts of behavior to the aspirations acquired with answering the attitude and other questions [60]. The starting point of items within a set, e.g., the attitude items, was also rotated.
Where applicable, and similar to many other TPB studies [54], 7-point Likert-type rating scales [61] and 7-point semantic differential scales were used. The statements were anchored on either side with strongly agree/strongly disagree or, for example, with bad/good.
3.3.1. Theory of Planned Behavior Latent Variables
A summary of the items that made up each of the constructs of the TPB is provided below.
- Recycling behavior—seven items in total: recycling frequency (one item with seven options: never, almost never, seldom, sometimes, often, almost always, always); taking responsibility for recycling in the household (one item with four options: no one, not me/someone else, I am, I am and sometimes someone else is); and, a qualitative measurement of recycling quantity (five items with seven options: nothing, very little, some things, about half, most of everything, almost all, everything) for five streams of recyclables with space to specify additional recyclables.
- Intention to recycle—seven items, four items testing the probability of recycling under various circumstances and three items testing the probability of executing various recycling activities: sorting; putting out recyclables for collection; and, taking recyclables to collection points (refer to Table 3 for set of items).
- Attitude towards recycling—seven items starting with “For your household to recycle is” anchored on either side with, e.g., bad/good (refer to Table 4 for set of items).
- Subjective norm—five items: two statements about motivation to comply and three items about the perceptions of others (refer to Table 5 for set of items).
- Perceived behavioral control—six items: three items measure opportunity to recycle and three items ability to recycle (refer to Table 6 for set of items).
3.3.2. Testing of the Questionnaire
The draft questionnaire was tested in a pilot study to be able to sharpen the measuring instruments, to identify ambiguities and questions which might cause uneasiness, and to ensure workability of the data [56,60]. During the course of one day, tenants and shoppers in a shopping center were approached and the purpose of the study explained. The volunteers were offered a paid-for hot drink at a pre-arranged coffee shop where they could sit and relax while completing the questionnaire.
Fifty-nine individuals completed the pilot questionnaire on an anonymous basis. Each construct (measuring tool) was tested statistically for consistency and reliability. After completion of the pilot study the questionnaire was shortened to only include those questions that would add the most value.
3.3.3. Data Collection
Due to the nature, sample size, time frames, and geographical distribution of the proposed sample, a professional survey company that was able to meet the survey requirements, was contracted to include the questions in their annual survey. The interviews were conducted face-to-face at respondents’ homes. If a respondent refused to participate, the respondent was substituted using the same procedure in another household. At no stage was or can the identity of the individual respondent be linked back to the data.
The CSIR provided the wording of an accompanying briefing pamphlet which stated the purpose of the study, how the information will be used, and on whose behalf the specific part of the survey is conducted. The relevant contact details of the principle researcher and the CSIR Research Ethics Committee member were provided. The first statement on the questionnaire was a tick box with an acknowledgement from the participant that he/she received the pamphlet and was sufficiently informed before answering the questions. Participation was on a voluntary basis without receiving any rewards or incentives for taking part in the survey.
4. Statistical Method
4.1. Analysis
The TPB was tested by fitting a structural equation model (SEM) to the latent variables. First, each of the constructs was examined for reliability (i.e., if similar results are likely to be obtained with a retest) and unidimensionality (whether the items in a construct work together to measure one latent trait). The Guttman’s lambda 6 (λ6) [62], as well as the criticized [63], but still widely used Cronbach alpha (α) [64] and McDonald’s omega (ω) report reliability, and Revelle’s beta (β) report internal consistency [65].
Thereafter, the mean score of the items within each construct was calculated in order to obtain a summary score for each construct (measuring instrument). The next step was to test the effect(s) of the constructs on recycling behavior. The objective of the statistical analysis was to test whether the theoretical TPB model could be supported with a statistical significant model based on the collected data. Structural equation modeling (SEM), using partial least squares path modeling (PLSPM) was used. As a final check, classification and regression trees and random forests (results not shown) were also used to confirm the predictive ability of the various constructs on recycling behavior. The package R was used for the statistical analysis [66,67].
MS Excel was used for descriptive statistics (graphs, frequency tables, etc.), to describe averages and for determining measures for variability and relationships between variables (correlation and regression analyses).
4.1.1. Treatment of Inappropriate Answers
A small number of respondents gave “not applicable” or “do not know” answers which do not form part of the 7-point scales. Of the 33 respondents that indicated they do not know how often their households recycle, 29 respondents selected the “nothing” option in the statements that tested the quantity households recycle and their “do not know” option was subsequently changed to “never”. The remaining four respondents’ “do not know” option for frequency of recycling was also scored to match their recycling quantity scores. The 33 respondents represent 1.65% of the total sample group. Given the large sample size (n = 2004), these adjustments should have no significant effect, even if the modified scores are incorrect by more than 2 units. The occurrence of inappropriate answers to other items was low and was thus treated as missing. The statistical methods make provision for such instance by dropping those observations with missing values in the specific analyses affected by the missing information, but retaining information of non-missing values in other analyses.
4.1.2. Assumption
It was assumed that if the respondent reports no recycling behavior in his/her household, then the respondent do not recycle at home. However, some over-reporting of individual recycling behavior is possible where the respondent do not recycle but someone else in the household does. This possibility is captured in the responsibility item of the recycling behavior construct.
5. Results and Discussion
5.1. Sample Profile (Demographic Composition)
This study targeted a representative sample of households in the larger urban areas in South Africa. A total of 2004 households in 11 large urban areas, including all metropolitan municipalities, were interviewed. The demographic composition of the sample is provided in Appendix A, Table A1. Table 1 shows the descriptive statistics for each of the constructs (the latent variables), i.e., the means, as well as the values per percentiles. Table 2, Table 3, Table 4, Table 5 and Table 6 include descriptive statistics for each of the items per construct. The results from each construct are discussed in detail in the sections to follow, concluding with the TPB structural equation model (Table 7, Table 8, Table 9 and Table 10).
5.2. Recycling Behavior
Of the total sample group (n = 2004), 540 of the respondents’ households (26.9%) reported recycling behavior. The rest of the respondents (n = 1464; 73.1%) with a recycling behavior score of 1 (B = 1), reported no recycling activity in their households. The 26.9% recycling households includes those who, for example, reported very little recycling of one type of recyclable material only. Eighteen percent (18.5%) show very little recycling activity, which is indicated with a recycling score of 2–3. Only 3.3% of the respondents reported that their households often recycle about half or more of all their recyclables (recycling scores greater than 4). The low mean recycling behavior score (x-bar =1.44) confirms the low percentage of households in which recycling behavior is reported (Table 2).
The recycling behavior construct consists of three components: a “recycling frequency”-item; a “taking responsibility for recycling in the household”-item; and a “recycling quantity”-item (Table 2). Recycling quantity is measured by the average of the “quantities” reported to be recycled of each of five recyclables (paper, plastic, glass, metal, and compost) reported as being recycled. A comparison of the three main components that make up the recycling behavior construct shows that the average for recycling frequency (x-bar = 1.76) is higher than for taking responsibility (x-bar = 1.44) and for quantities recycled (x-bar = 1.35) (Table 2, main components). In addition, some respondents (3.4%) indicated that their households sometimes recycle, but failed to indicate recycling quantities of any recyclable materials. These 68 respondents form part of the 18.5% respondents that reported very little recycling activity. The data thus suggest some over-reporting of recycling behavior which mainly originates from the frequency item. Being one of seven items in the behavior construct, the effect of the over-reporting of recycling frequency on recycling behavior is smaller than it would have been if recycling frequency was the only item measured for recycling behavior.
The overall higher self-reporting for recycling frequency compared to recycling quantities is most probably due to two reasons: firstly, it is easier to over-report recycling behavior on a “soft” frequency measurement than on actual physical quantities of items recycled; and secondly, the frequency question was asked first and thus before the reality check of the actual quantities. A possible third reason is that there is no correlation between recycling frequency and recycling quantities. However, the data show that the correlations are significant (p < 0.001) and of medium to high strength, depending on the recyclable material [68], i.e., correlation factors between recycling frequency and the “quantity” of paper, glass, metal, plastic, and compostables are 0.723, 0.648, 0.496, 0.671, and 0.467, respectively (Appendix A, Table A2). It is noteworthy that paper recycling is probably the most-established in South Africa, with the Ronnie bag collection system operating in many areas for more than 30 years.
Due to the random probability-sampling method the results for recycling behavior can be extrapolated to the South African population in the larger urban areas of the country. Given that the self-reported recycling behavior is expected to be higher than what it would be if measured [30,45], the reported results may reflect an optimistic view of the domestic recycling situation in South Africa. However, it should be noted that the purpose of the study was not to gather actual recycling-rate data. Although self-reported, the recycling behavior results provide valuable insight into recycling tendencies in South Africa at a given point in time—after the NEWWA came into effect but before wide implementaton of separation of waste.
The domestic recycling reality, as indicated by the results of this South African study, is that, at the time of the waste recycling survey (November 2010), the majority of South African households (73.1%) in large urban areas did not recycle. Only a small fraction of urban households (3.3%) recycled most of their household waste on a fairly frequent basis.
5.3. Intention to Recycle
The majority of respondents either expressed no intention to recycle or low levels of intention to recycle (x-bar = 3.76) (Table 3). The results suggest that respondents are more likely to recycle if their recyclables are collected at curbside (x-bar = 4.21) than when they have to take recyclables to collection points (x-bar = 3.42). The likelihood that respondents will recycle also decrease the further the collection points are from their homes. The item that shows the lowest mean score (x-bar = 3.33) is the one implying travelling to a collection point the furthest away.
It should be noted that the items are phrased to capture perceived distances, because a 2 km distance is just around the corner for someone who can drive there, but for someone who has to carry a bag of recyclables, it is a long distance. The role of the convenience factor in intention to recycle is emphasized by the difference in mean scores of two of the items, namely “… if curbside collection for recyclables in area” (x-bar = 4.21) and “if to put recyclables out separately for curbside collection” (x-bar = 3.92). The latter, through the use of the word “separately”, implies multiple sorting of recyclables, which is not so explicitly expressed in the first item. The results thus suggest that people would be more willing to recycle should they be serviced with a 2-bag system which is collected at curbside, compared to multiseparation of recyclables.
The results suggest that the intention to recycle is overruled by the practical reality of being able to recycle. The curbside collection item is the only item with a positive score (x-bar > 4.00) in the IR construct. The majority of respondents feel negative about taking their recyclables to drop-off points (x-bar < 4.00). The willingness to take recyclables to collection points decrease significantly the further the perceived distance to the collection point is. Since the majority of the respondents reported that the household does not have a motor vehicle in the household (Appendix A, Table A1), longer distances to recycling points are problematic for household recycling behavior.
5.4. Attitude Towards Recycling
With the mean score for attitude towards recycling (x-bar = 3.86) being less than the neutral point of 4.0 (Table 4), the majority of respondents has a negative attitude towards recycling. Only four respondents in total chose the “do not know”-option and only on a single item, which suggest that the respondents do have an attitude and that this attitude leans towards the negative, rather than not having formed an attitude, yet. Due to the random sampling method the results can thus be extrapolated to suggest the existence of an overall negative attitude towards recycling among South African city dwellers.
Within the attitude construct, the moral component as represented by the item “for your household to recycle is bad/good”, shows the highest score (x-bar = 4.12) of all the attitude items. The “for your household to recycle is a hassle/easy” item shows the lowest mean score (x-bar = 3.48), and could be an indication of the influence of perceived convenience of recycling on householders’ attitude towards recycling.
5.5. Social Pressure to Recycle (Subjective Norm)
The majority of respondents reported that they experience a lack of social pressure to recycle (x-bar = 3.37) (Table 5). The two items, “most of the people important to you want you to recycle” and “it is expected of you to recycle” show the lowest mean scores (x-bar = 2.96 and 3.27, respectively), and could indeed be a true reflection of the situation in South Africa, given the small percentage (3.3%) of respondents that reported that they engage in meaningful recycling (B > 4). Thus, extrapolated to the South African population, the individuals among family, friends, neighbors, and other significant people that would expect of others or exert pressure to recycle on others is part of a small group of South Africans. Nonrecyclers do not recycle and therefore would not be able to either be a recycling role-model or exert pressure to recycle in the manner that recyclers would be able to. In fact, someone who recycles would fall outside the norm of this-is-how-things-are-done-around-here, which suggests that the descriptive norm would not be pro-recycling. This is in line with the conclusion of Cialdini and coworkers [69] (p. 231) that an intervention which focuses on the descriptive social norm will only be successful in cases where the majority of people already conform to the desired behavior. If the majority do not recycle, the person who recycles would rather be considered and feel the odd one out. Minato (2012) also warns that the pressure through descriptive norms decline due to degrading social networks [70].
Another angle from which to interpret the results is that one would suspect that the respondents with high recycling behavior scores are represented by the high subjective norm scores, but with a correlation of 0.49 this only suggest a relationship of medium strength (Appendix A, Table A3). A large percentage of those respondents from reportedly recycling households also do not experience any social pressure to recycle. Thus, it can be argued that the recyclers tap their motivation to recycle from a source independent of what others expect of them. It can be speculated that injunctive norms (moral values) could be a driver for recycling behavior, but because the questionnaire is weak on injunctive norm items, this possibility should be further researched.
5.6. Perceived Control over the Act of Recycling
The average (x-bar = 3.30) of the perceived behavioral control measurement is less than the neutral point (x-bar = 4.00). This result suggests that respondents do not feel that they have control over their ability to recycle (Table 6). All items making up this construct scored less than the neutral point. Albeit negative (x-bar < 4.00), the item “you know how to recycle” which represents a knowledge component, has the highest average (x-bar = 3.81) of all the perceived behavioral control items. The item “To recycle is difficult/easy” addressing the perceived difficulty to recycle and, also suggesting an underlying knowledge component, has the second highest score (x-bar = 3.59). The data thus suggests that, although the knowledge component of perceived behavioral control is not the main hurdle to overcome to change people’s perceptions of their control over their ability to recycle, there is still a lack of sufficient knowledge among the majority of South Africans.
The respondents perceived the opportunity to recycle (“The opportunities for you to recycle are none/plenty”) less favorably (x-bar = 3.49) than the two knowledge items discussed above. But, the availability of recycling scheme items (“There are recycling schemes in your area” and “The necessary resources and facilities are available”; x-bar = 3.01 for both items) and the awareness of recycling scheme item fared the worst (x-bar = 2.94). Respondents thus feel that they do not have control over the act of recycling, especially in terms of where to recycle. Focused awareness-creation initiatives on the location of recycling drop-off infrastructure are thus needed.
5.7. Testing the Theory of Planned Behavior Model
The behavior, intention to recycle and attitude constructs show excellent reliability and internal consistency (Table 7). The reliability and internal consistency of the subjective norm and perceived behavioral control constructs are good. Thus, it was decided to keep all the items of all constructs.
The results of the SEM analysis show a good fit of the survey data to the TPB theoretical model (Table 8).
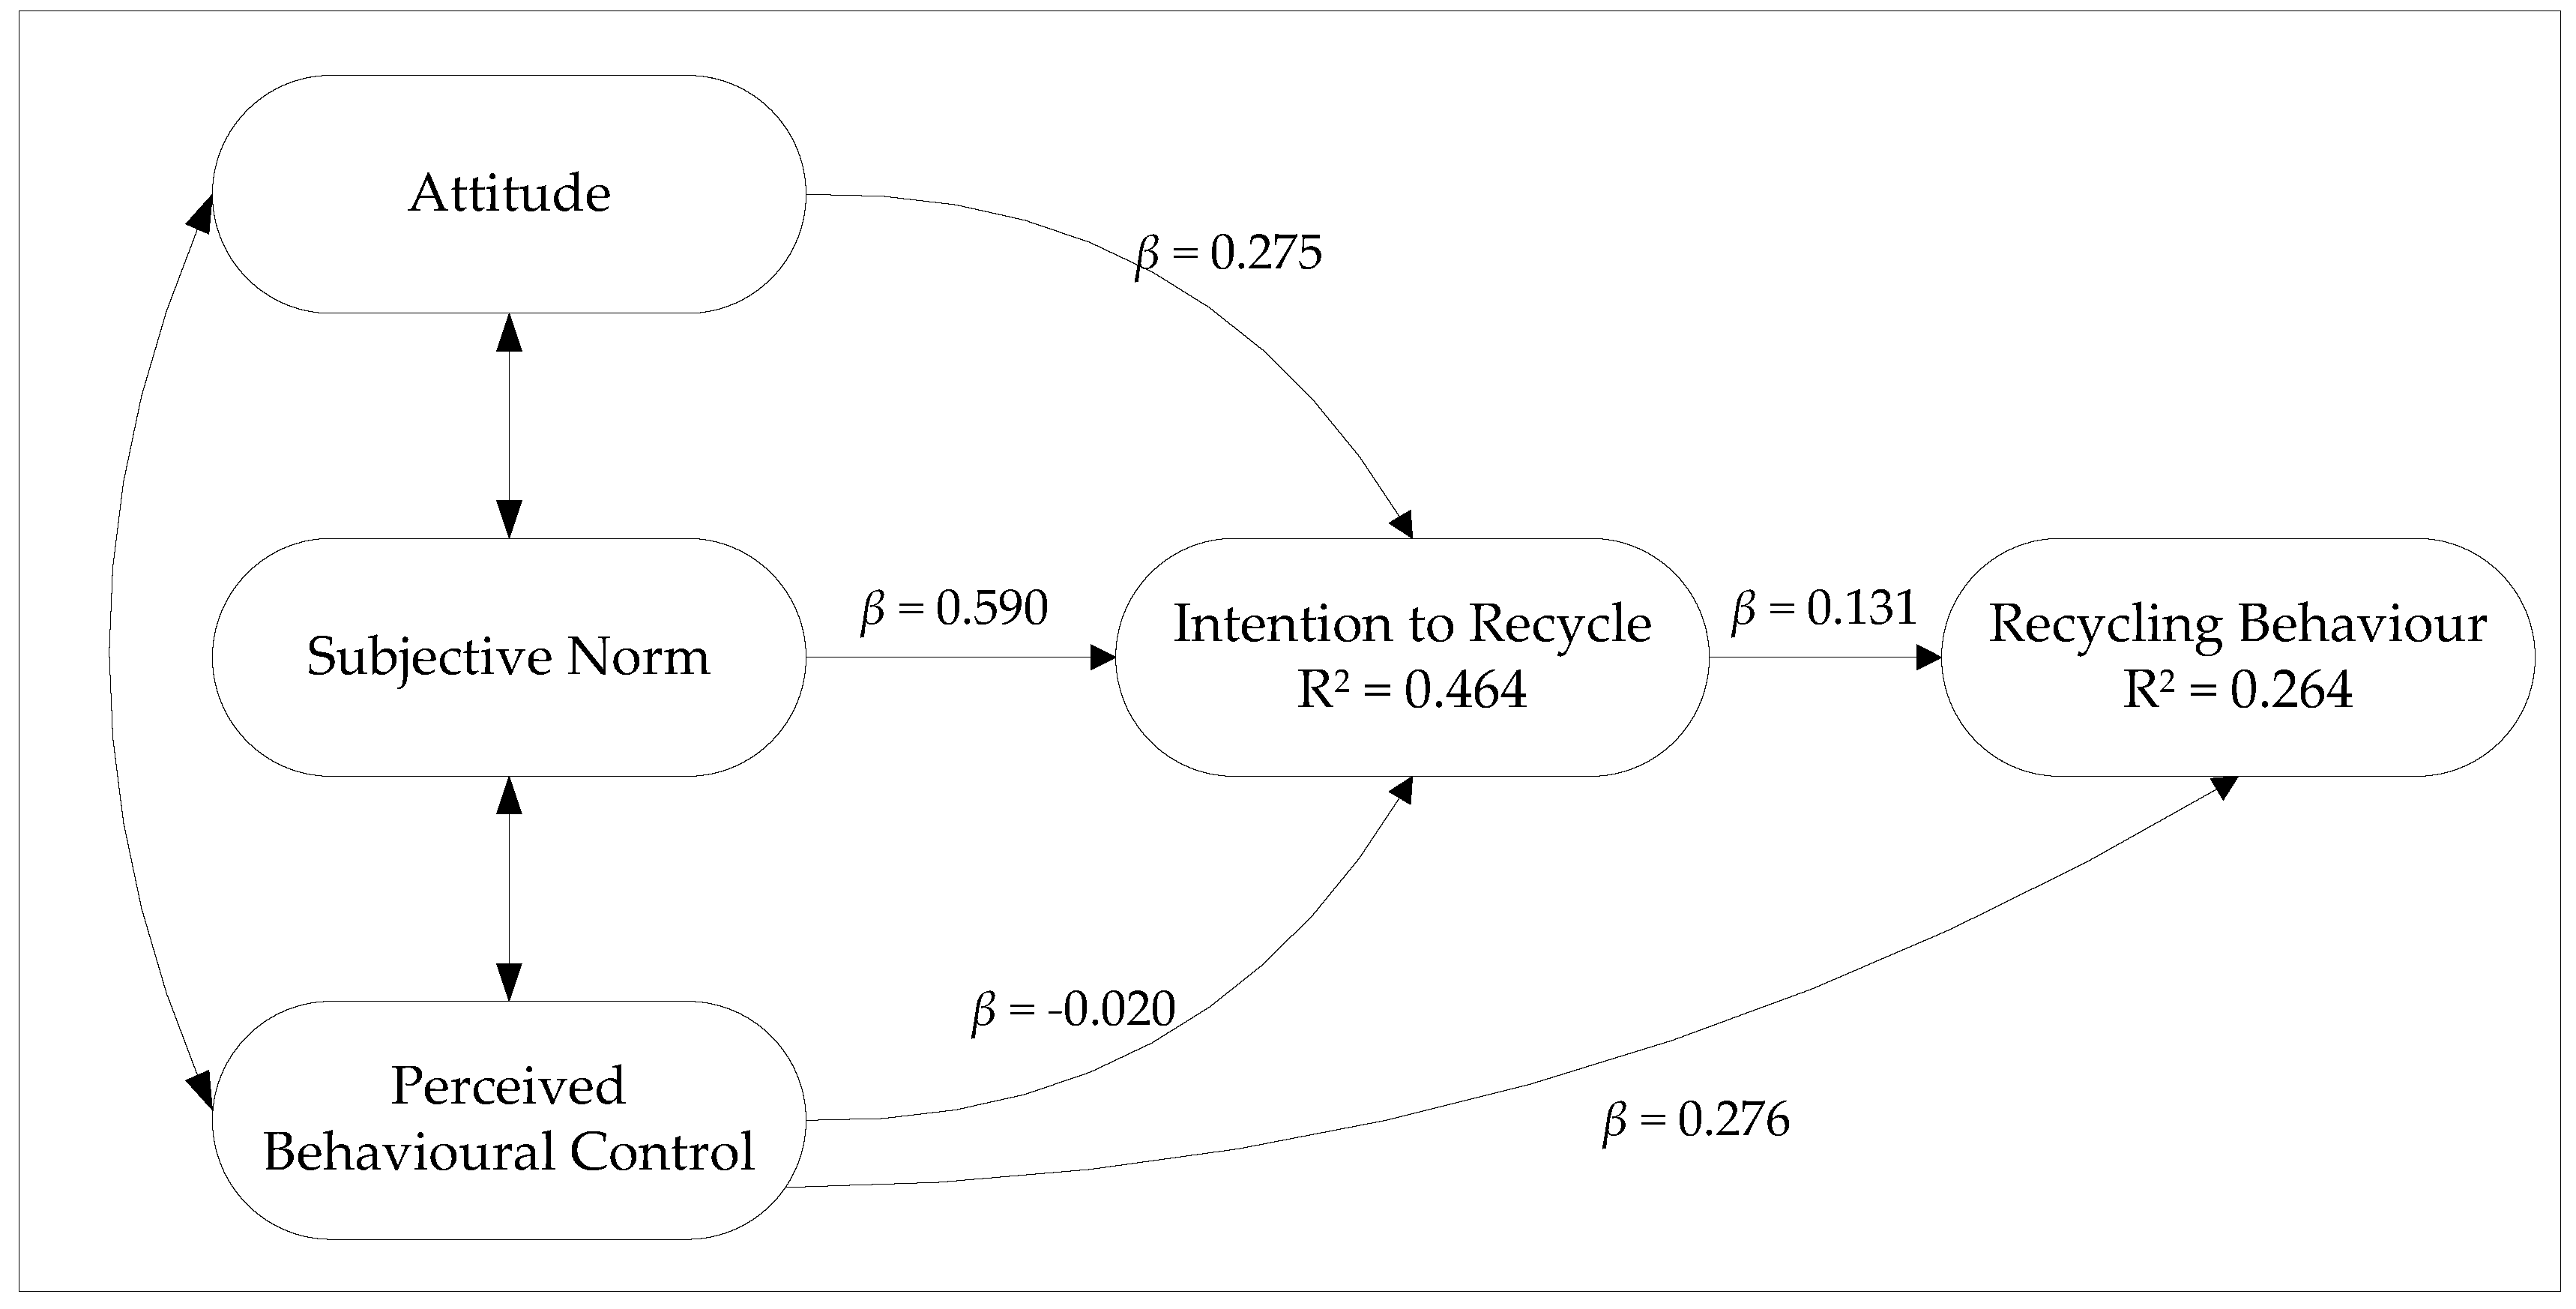
The regression coefficients (βeta) are shown in Table 9. The proportion of variance explained for IR and B is shown in Table 10 and Figure 3.
The TPB explain 46.4% of the variance in intention to recycle and 26.4% of the variance in recycling behavior (B) (Figure 3).
Fitting the TPB model to the survey data shows that the subjective norm (SN) (β = 0.590) has greater influence than either attitude (A) (β = 0.275) or perceived behavioral control (β = 0.020) on intention to recycle. The relatively strong and significant relationship (β = 0.590; p < 0.0001) between subjective norm and intention to recycle supports H2. Overshadowed by the effect of subjective norm on intention to recycle, attitude results in having a smaller (β = 0.275), though significant (p < 0.0001), effect on intention to recycle (H1). Perceived behavioral control shows an insignificant effect on intention to recycle (β = −0.020; p = 0.54) and thus rejects H3. With R2 = 0.464, the three variables attitude, subjective norm, and perceived behavioral control together account for 46.4% of the variance in intention to recycle. Both intention to recycle and perceived behavioral control influence recycling behavior, accounting for 26.4% of the variance in recycling behavior (R2 = 0.264). Perceived behavioral control has a significant effect on recycling behavior (β = 0.276; p < 0.0001) (H5).
The results from this study suggest that perceived behavioral control carries more weight (H5) than intention to recycle (H4) in explaining recycling behavior. Typically, in studies where the behavior is likely to not only be affected by personal motivation, but also by other factors such as the availability of resources and access to services, perceived behavioral control appears to have a greater influence on intention [33]. This is in line with the argument that the effect of perceived behavioral control varies with the availability of curbside recycling schemes [36].
The small influence of attitude on intention to recycle (β = 0.275) is in line with findings of Martin et al. (2006) that a positive attitude towards recycling does not guarantee recycling behavior [72]. The attitude-behavior link proves to be strong where there is no “resources and cooperation” needed [40]. The relatively weak link between attitude and intention to recycle, which was found in this study, could thus be ascribed to ancillary variables and situational factors not accommodated or explained through the TPB. Although A is not the variable with the strongest/largest effect, attitude does contribute to the intention to recycle. Awareness-raising initiatives to improve people’s attitudes towards recycling have a better chance for success should it include a moral component.
With the TPB explaining 26.4% of the variance in recycling behavior, the results from this study compares well with the Armitage and Conner meta-analysis of 185 behavioral studies dated pre-1998 [45]. The meta-analysis found that, on average, the TPB explained 27% of the variance in behavior and 39% of the variance in intention to act [45].
Armitage and Conner (2001) point out that, over the years, researchers measured the IR construct in different ways [45]. The IR construct is a measure of “how hard people are willing to try or how much effort they would exert to perform the behavior” [43] (p. 181). Distinguishing between intentions and self-predictions of behavior, it is argued that self-predictions (the likelihood to perform a behavior) provide a better prediction of behavior than intentions [45]. The inclusion of likelihood to recycle statements in the IR construct is a possible explanation for this study’s higher explanation value of intention to recycle (46.4%) than Armitage and Conner’s meta-analysis average of 39% [45].
Respondents show a higher probability that they intend to recycle than what their self-reported behavior suggests. In the behavioral sciences this is one of the challenges of predicting behavior [40]. There are several external factors that influence the path between intention and action even though the best intentions might exist. Examples may include a family crisis, or just forgetting to put out the recyclables, or a breakdown of a motor vehicle which makes it impossible to take recyclables to the drop-off center. The best intention might also be deliberately suppressed or ignored, for example due to unfavorable weather conditions on recycling day. Thus, from a personal point of view a person may be a recycler, but the actual recycling behavior may be absent.
Similar to what other studies showed [30,55,73], this study with 26.4% of the variance explained by the TPB, suggests that there are other variables than those proposed in the TPB that appears to have an effect on recycling behavior.
The importance of perceived behavioral control as the construct with the largest effect on recycling behavior in the TPB model, confirms that people should feel in control of their ability to recycle. One manner in which to promote a sense of control is through buy-in, e.g., through allowing communities to co-design their recycling services, because a waste scheme that is acceptable and functional in one area might not be suitable for another area [74]. Thus, through co-designing of recycling schemes, the necessary buy-in and awareness of the recycling facilities can be created. Co-designing also creates opportunity for established co-responsibility—a moral imperative (injunctive norm) which has the potential to be more successful at creating social pressure than descriptive norms in a society where recycling behavior is very low. Co-designing of a recycling scheme would also serve as a direct communication of the importance of the communities’ participation in recycling and indicate that the municipality/recycling company takes recycling seriously (descriptive norm). Another advantage of co-designing of recycling schemes would be that potential leaders of the recycling initiative in communities would be identified. These leaders could assist with future recycling related communications and also through playing the part of much-needed role-models. In addition, recycling needs to be reinforced as a normative behavior through, e.g., well-targeted recycling advertisements, awareness creation, and the deliberate visibility of recycling bins.
6. Conclusions and Recommendations
The study shows that at a point in time, November 2010, before the NEMWA was widely implemented, about a quarter (26.9%) of South Africa’s city dwellers engaged in some form of recycling which include their paper and packaging waste as well as compostable garden and/or food waste. Only 3.3% of the respondents reported that they recycle about half or more of their recyclables on a frequent basis. While the TPB remains a useful model for examining the variables that affects recycling behavior, the TPB explains 26.4% of the variance in recycling behavior and 46.4% of the variance in intention to recycle. Compared to intention to recycle, which has a far smaller effect on recycling behavior than expected, perceived behavioral control appears to be the most important variable to explain recycling behavior. This confirms that there are other variables than those proposed in the TPB that appears to play an important role in recycling behavior.
It is encouraging that respondents are positive about their intention to recycle should they have a curbside collection for their recyclables, especially given the very low self-reported recycling score and the negativity that is overwhelmingly present in all the variables. The results also suggest that a less complicated and more convenient 2-bag waste collection system to accommodate the collection of recyclables at curbside has the greatest potential to be supported and thus encourage household recycling. The results strongly suggest that awareness raising that has the greatest chance to influence recycling behavior positively, should contain a balanced mix of moral values (injunctive norms) and information about available recycling schemes. However, raising awareness would be meaningless without a positive contribution to householders’ perceived behavioral control over their ability to recycle. One way to alleviate perceived behavioral control is through the provision of tailor-made recycling schemes to fit communities’ particular needs. While co-designing of recycling schemes would be beneficial for creating buy-in, such schemes should continue to operate as designed to ensure that the sense of having control over the act of recycling is obtained and maintained. For example, even the best designed recycling scheme will not show the envisaged results if such a scheme is failing or not well maintained.
The recommendation to policy-makers is to provide the most convenient and least complicated curbside collection for recyclables, such as a 2-bag collection system. However, it is important to acknowledge the need for diversity in designing recycling schemes, as well as the effect of continuity, reliability, and maintenance of recycling schemes on recycling behavior. Thus, the challenge for waste management is the ability to create an enabling environment in South Africa that would not only encourage recycling behavior, but also ensure continuation of recycling behavior. In particular recycling of the materials currently recycled in the lowest quantities, i.e., garden and food waste, metals, and glass, would benefit from improved recycling facilities.
The implication of this research is that over time, as South Africans become more aware of recycling, and recycling behavior thus would have shifted from the current baseline for recycling, that the strategies to further improve recycling behavior needs to be adapted to the changed needs at the particular point in time. It should also be acknowledged that South Africa is a country with much diversity which complicates generalization. It can thus be dangerous to be prescriptive on the best ways for improving recycling behavior without considering specific areas, its unique characteristics due to its local set-up, and operating within its local constraints. Furthermore, some of the findings need clarification which confirms the need for further research.
Funding
This research was funded by the Council for Scientific and Industrial Research (CSIR).
Acknowledgements
Ipsos-Markinor was contracted to conduct the survey on behalf of the CSIR and included the set of questions in their biannual survey. The analysis of the data was partly outsourced to Mark Difford at the Nelson Mandela Metropolitan University. Suzan Oelofse assisted with pilot study logistics on the day of pilot data collection. Several colleagues in employment of the CSIR at the time, assisted with the initial literature review. Heidi van Deventer compiled the map (Figure 2) for this publication.
Conflicts of Interest
The author declares no conflict of interest.
Appendix A

Table A1.
Demographic variables of the sample group (n = 2004).
| Parameter | Sample Distribution | |
|---|---|---|
| n | % | |
| Gender | ||
| Male | 1002 | 50 |
| Female | 1002 | 50 |
| Total | 2004 | 100 |
| Age (years) | ||
| 16–17 | 69 | 3.4 |
| 18–19 | 85 | 4.2 |
| 20–24 | 271 | 13.5 |
| 25–29 | 215 | 10.7 |
| 30–34 | 222 | 11.1 |
| 35–39 | 256 | 12.8 |
| 40–44 | 205 | 10.2 |
| 45–49 | 176 | 8.8 |
| 50–54 | 133 | 6.6 |
| 55–59 | 95 | 4.7 |
| 60–64 | 103 | 5.1 |
| 65+ | 173 | 8.6 |
| Refused | 1 | 0 |
| Population | ||
| Black | 1338 | 67 |
| White | 290 | 14 |
| Colored | 255 | 13 |
| Indian/Asian | 121 | 6 |
| Working status | ||
| Full-time | 665 | 33.2 |
| Part-time | 233 | 11.6 |
| Not working: Housewife | 126 | 6.3 |
| Student | 199 | 9.9 |
| Retired | 232 | 11.6 |
| Unemployed: Looking for work | 481 | 24.0 |
| Not looking for work | 68 | 3.4 |
| Education (formal) | ||
| No schooling | 29 | 1.4 |
| Some primary | 113 | 5.6 |
| Primary school | 115 | 5.7 |
| Some high school | 725 | 36.2 |
| Matric/Grade 12 | 678 | 33.8 |
| Artisans certificate obtained | 73 | 3.6 |
| Technicon diploma/degree completed | 148 | 7.4 |
| University degree completed | 87 | 4.3 |
| Professional | 15 | 0.7 |
| Technical | 15 | 0.7 |
| Secretarial | 2 | 0.1 |
| Other | 4 | 0.2 |
| Type of dwelling | ||
| House/cluster house | 1213 | 60.5 |
| Flat | 85 | 4.2 |
| Matchbox/RDP | 348 | 17.4 |
| Hostel/compound/boarding house | 16 | 0.8 |
| Room in backyard | 57 | 2.8 |
| Shack | 276 | 13.8 |
| Other | 9 | 0.5 |
| Financial status (household income) | ||
| None | 46 | 2.3 |
| R1-<R2k | 321 | 16.0 |
| R2k-<R5k | 434 | 21.7 |
| R5k-<R10k | 285 | 14.2 |
| R10k-<R20k | 175 | 8.7 |
| R20k+ | 148 | 7.4 |
| Refused | 564 | 28.1 |
| Do not know | 31 | 1.6 |
| Motor vehicle in household | ||
| Yes | 833 | 41.6 |
| No | 1171 | 58.4 |
| Telephone in house (land line) | ||
| Yes | 432 | 21.6 |
| No | 1572 | 78.4 |
| Television set in household | ||
| Yes | 1919 | 95.8 |
| No | 85 | 4.2 |
| Radio set in household (in working order): 1 | 1207 | 60.2 |
| 2 | 300 | 15.0 |
| 3 | 83 | 4.1 |
| None | 414 | 20.7 |
Table A2.
Correlation values between items making up the recycling behavior construct.
| Items | B | Responsibility | Frequency | Paper | Glass | Metal | Plastic | Compost |
|---|---|---|---|---|---|---|---|---|
| B | 1 | - | - | - | - | - | - | - |
| Responsibility | 0.815 | 1 | - | - | - | - | - | - |
| Frequency | 0.882 | 0.829 | 1 | - | - | - | - | - |
| Paper | 0.833 | 0.651 | 0.723 | 1 | - | - | - | - |
| Glass | 0.805 | 0.584 | 0.648 | 0.607 | 1 | - | - | - |
| Metal | 0.709 | 0.468 | 0.496 | 0.493 | 0.528 | 1 | - | - |
| Plastic | 0.835 | 0.609 | 0.671 | 0.640 | 0.612 | 0.553 | 1 | - |
| Compost | 0.695 | 0.418 | 0.467 | 0.463 | 0.511 | 0.544 | 0.556 | 1 |
Table A3.
Correlation values between latent variables.
| Variables | B | IR | A | SN | PBC |
|---|---|---|---|---|---|
| B | 1 | - | - | - | - |
| IR | 0.408 | 1 | - | - | - |
| A | 0.365 | 0.597 | 1 | - | - |
| SN | 0.494 | 0.662 | 0.739 | 1 | - |
| PBC | 0.480 | 0.523 | 0.658 | 0.766 | 1 |
References
- Abdrabo, M.A. Assessment of economic viability of solid waste service provision in small settlements in developing countries: Case study Rosetta, Egypt. Waste Manag. 2008, 28, 2503–2511. [Google Scholar] [CrossRef] [PubMed]
- Imam, A.; Mohammed, B.; Wilson, D.C.; Cheeseman, C.R. Solid waste management in Abuja, Nigeria. Waste Manag. 2008, 28, 468–472. [Google Scholar] [CrossRef] [PubMed]
- Parrot, L.; Sotamenou, J.; Dia, B.K. Municipal solid waste management in Africa: Strategies and livelihoods in Yaoundé, Cameroon. Waste Manag. 2009, 29, 986–995. [Google Scholar] [CrossRef] [PubMed]
- Kgosiesele, E.; Zhaohui, L. An evaluation of waste management in Botswana: Achievements and challenges. J. Am. Sci. 2010, 6, 144–150. [Google Scholar]
- United Nations Environment Programme (UNEP). Africa Waste Management Outlook; United Nations Environment Programme: Nairobi, Kenya, 2018. [Google Scholar]
- Department of Environmental Affairs (DEA). White Paper on Integrated Pollution and Waste Management for South Africa. A Policy on Pollution Prevention, Waste Minimisation, Impact Management and Remediation; Government Gazette Vol. 417, No. 20978, General Notice 227 of 17 March 2000; Government of South Africa: Pretoria, South Africa, 2000.
- Nhamo, G.; Oelofse, S.; Godfrey, L.; Mvuma, G. WasteCon’08 Workshop Report: Unpacking Governance Opportunities and Challenges for Integrated Municipal Waste Management in South Africa; CSIR Report No. CSIRNRE/PW/IR/2009/0034/B; CSIR: Pretoria, South Africa, 2009. [Google Scholar]
- United Nations Environment Programme (UNEP). Global Waste Management Outlook (GWMO); UNEP DTIE International Environmental Technology Centre: Osaka, Japan, 2015. [Google Scholar]
- Scarlat, N.; Motola, V.; Dallemand, J.F.; Monforti-Ferrario, F.; Mofor, L. Evaluation of energy potential of municipal solid waste from African urban areas. Renew. Sustain. Energy Rev. 2015, 50, 1269–1286. [Google Scholar] [CrossRef]
- Hoornweg, D.; Bhada-Tata, P. What a Waste: A Global Review of Solid Waste Management; Urban Development Series Knowledge Papers; World Bank: Washington, DC, USA, 2012. [Google Scholar]
- United Nations Human Settlements Programme (UN-HABITAT). Solid Waste Management in the World’s Cities: Water and Sanitation in the World’s Cities 2010; UN-HABITAT: Nairobi, Kenya, 2010. [Google Scholar]
- Curtis, J.; Lyons, S.; O’Callaghan-Platt, A. Managing household waste in Ireland: Behavioural parameters and policy options. J. Environ. Plan. Manag. 2011, 54, 245–266. [Google Scholar] [CrossRef]
- Organisation for Economic Co-operation and Development (OECD). Greening Household Behaviour: Overview from the 2011 Survey (Revised Edition); OECD Studies on Environmental Policy and Household Behaviour; OECD Publishing: Paris, France, 2014. [Google Scholar]
- Republic of South Africa (RSA). National Environmental Management: Waste Act, 2008 (Act 59 of 2008); Government Notice 278 Government Gazette 32000 of 10 March 2009; Government of South Africa: Pretoria, South Africa, 2008.
- Republic of South Africa (RSA). National Environmental Management: Waste Amendment Act, 2014. (Act 26 of 2014); Government Notice 449 Government Gazette 37714 of 2 June 2014; Government of South Africa: Pretoria, South Africa, 2014.
- European Environment Agency. Earnings, Jobs and Innovation: The Role of Recycling in a Green Economy; European Environment Agency (EEA): Copenhagen, Denmark, 2011. [Google Scholar]
- United Nations Environment Programme (UNEP). Guidelines for National Waste Management Strategies: Moving from Challenges to Opportunities; United Nations Institute for Training and Research (Unitar); UNEP: Geneve, Switzerland, 2013; Available online: http://cep.unep.org/meetings/documents/41ff9f7eb276c7989419dca11245970c (accessed on 28 August 2018).
- Department of Science and Technology (DST). A National Waste R&D and Innovation Roadmap for South Africa: Phase 2 Waste RDI Roadmap. The Economic Benefits of Moving Up the Waste Management Hierarchy in South Africa: The Value of Resources Lost through Landfilling; Department of Science and Technology: Pretoria, South Africa, 2014.
- African Union Commission. Agenda 2063: The Africa We Want; Final Edition; African Union Commission: Addis Ababa, Ethiopia, 2015; Available online: https://au.int/sites/default/files/pages/3657-file-agenda2063_popular_version_en.pdf (accessed on 28 August 2018).
- Godfrey, L.; Strydom, W.; Phukubye, R. Integrating the Informal Sector into the South African Waste and Recycling Economy in the Context of Extended Producer Responsibility; Briefing Note; CSIR: Pretoria, South Africa, 2016. [Google Scholar]
- Oelofse, S.H.; Strydom, W.F. Trigger to Recycling in a Developing Country: In the Absence of Command-and-Control Instruments. In Proceedings of the Conference Waste 2010: Waste and Resource Management—Putting Strategy into Practice, Warwhickshire, UK, 28–29 September 2010. [Google Scholar]
- Godfrey, L.; Oelofse, S. Historical review of waste management and recycling in South Africa. Resources 2017, 6, 57. [Google Scholar] [CrossRef]
- Witmer, J.F.; Geller, E.S. Facilitating paper recycling: Effects of prompts, raffles and contests. J. Appl. Behav. Anal. 1976, 9, 315–322. [Google Scholar] [CrossRef] [PubMed]
- Arbuthnot, J. The roles of attitudinal and personality variables in the prediction of environmental behavior and knowledge. Environ. Behav. 1977, 9, 217–232. [Google Scholar] [CrossRef]
- Weigel, R.H. Ideological and demographic correlates of proecology behavior. J. Soc. Psychol. 1977, 103, 39–47. [Google Scholar] [CrossRef]
- O’Riordan, T.; Turner, R.K. Recycling and householder attitudes: A survey of Norwich. Resour. Policy 1979, 5, 42–50. [Google Scholar] [CrossRef]
- Ajzen, I.; Fishbein, M. Understanding Attitudes and Predicting Social Behaviour; Prentice-Hall: Upper Saddle River, NJ, USA, 1980. [Google Scholar]
- Vining, J.; Ebreo, A. What Makes a Recycler? A comparison of recyclers and non-recyclers. Environ. Behav. 1990, 22, 55–73. [Google Scholar] [CrossRef]
- Oskamp, S.; Harrington, M.J.; Edwards, T.C.; Sherwood, D.L.; Okuda, S.M.; Swanson, D.C. Factors Influencing Household Recycling Behavior. Environ. Behav. 1991, 23, 494–519. [Google Scholar] [CrossRef]
- Gamba, R.J.; Oskamp, S. Factors influencing community residents’ participation in commingled curbside recycling programs. Environ. Behav. 1994, 26, 587–612. [Google Scholar] [CrossRef]
- Schwartz, S.H. Normative influences on altruism. Adv. Exp. Soc. Psychol. 1977, 10, 221–279. [Google Scholar]
- Jackson, T. Motivating sustainable consumption. Sustain. Dev. Res. Netw. 2005, 29, 30. [Google Scholar]
- Godin, G.; Kok, G. The theory of planned behavior: A review of its applications to health-related behaviors. Am. J. Health Promot. 1996, 11, 87–98. [Google Scholar] [CrossRef] [PubMed]
- Trumbo, C.W.; O’Keefe, G.J. Craig Intention to conserve water: Environmental values, planned behavior, and information effects. A comparison of three communities sharing a watershed. Soc. Nat. Resour. 2001, 14, 889–899. [Google Scholar]
- Knussen, C.; Yule, F.; MacKenzie, J.; Wells, M. An analysis of intentions to recycle household waste: The roles of past behaviour, perceived habit, and perceived lack of facilities. J. Environ. Psychol. 2004, 24, 237–246. [Google Scholar] [CrossRef]
- Tonglet, M.; Phillips, P.S.; Read, A.D. Using the Theory of Planned Behaviour to investigate the determinants of recycling behaviour: A case study from Brixworth, UK. Resour. Conserv. Recycl. 2004, 41, 191–214. [Google Scholar] [CrossRef]
- Davies, J.; Foxall, G.R.; Pallister, J. Beyond the intention–behaviour mythology an integrated model of recycling. Mark. Theory 2002, 2, 29–113. [Google Scholar] [CrossRef]
- Ioannou, T.; Zampetakis, L.A.; Lasaridi, K. Using the theory of planned behavior for understanding the drivers of household recycling behavior. In Proceedings of the 3rd International CEMEPE & SECOTOX Conference, Skiathos, Greece, 19–24 June 2011; pp. 429–434. [Google Scholar]
- Conner, M.; Armitage, C.J. Extending the theory of planned behavior: A review and avenues for further research. J. Appl. Soc. Psychol. 1998, 28, 1429–1464. [Google Scholar] [CrossRef]
- Eagly, A.H.; Chaiken, S. The Psychology of Attitudes; Thomson Wadsworth: Belmont, CA, USA, 1993; p. 794. [Google Scholar]
- Boldero, J. The Prediction of Household Recycling of Newspapers: The Role of Attitudes, Intentions, and Situational Factors 1. J. Appl. Soc. Psychol. 1995, 25, 440–462. [Google Scholar] [CrossRef]
- Ajzen, I.; Madden, T.J. Prediction of goal-directed behaviour: Attitudes, intentions, and perceived behavioural control. J. Exp. Soc. Psychol. 1986, 22, 453–474. [Google Scholar] [CrossRef]
- Ajzen, I. The theory of planned behavior. Organ. Behav. Hum. Decis. Process. 1991, 50, 179–211. [Google Scholar] [CrossRef]
- Sniehotta, F.F.; Presseau, J.; Araújo-Soares, V. Time to retire the theory of planned behaviour. Health Psychol. Rev. 2014, 8, 1–7. [Google Scholar] [CrossRef] [PubMed] [Green Version]
- Armitage, C.J.; Conner, M. Efficacy of the theory of planned behaviour: A meta-analytic review. Br. J. Soc. Psychol. 2001, 40, 471–499. [Google Scholar] [CrossRef] [PubMed]
- Kollmuss, A.; Agyeman, J. Mind the gap: Why do people act environmentally and what are the barriers to pro-environmental behavior? Environ. Educ. Res. 2002, 8, 239–260. [Google Scholar] [CrossRef]
- Oom do Valle, P.; Rebelo, E.; Reis, E.; Menezes, J. Combining behavioral theories to predict recycling involvement. Environ. Behav. 2005, 37, 364–396. [Google Scholar] [CrossRef]
- Armitage, C.J. Time to retire the theory of planned behaviour? A commentary on Sniehotta, Presseau and Araújo-Soares. Health Psychol. Rev. 2015, 9, 151–155. [Google Scholar] [CrossRef] [PubMed]
- Fishbein, M.; Ajzen, I. Belief, Attitude, Intention and Behavior: An Introduction to Theory and Research; Addison-Wesley Pub. Co.: Boston, MA, USA, 1975. [Google Scholar]
- Ajzen, I. The theory of planned behavior. In Handbook of Theories of Social Psychology; SAGE Publications: London, UK, 2012; Volume 1, pp. 438–459. [Google Scholar]
- Dulany, D.E. Awareness, Rules, and Propositional Control: A Confrontation with SR Behavior Theory; Prentice-Hall: Upper Saddle River, NJ, USA, 1968. [Google Scholar]
- Salazar, H.A.; Oerlemans, L.; van Stroe-Biezen, S. Social influence on sustainable consumption: Evidence from a behavioural experiment. Int. J. Consum. Stud. 2013, 37, 172–180. [Google Scholar] [CrossRef]
- Ajzen, I. From intentions to actions: A theory of planned behavior. In Action Control from Cognition to Behavior; Springer: Heidelberg, Germany, 1985; pp. 10–39. [Google Scholar]
- Francis, J.; Eccles, M.P.; Johnston, M.; Walker, A.E.; Grimshaw, J.M.; Foy, R.; Kaner, E.F.; Smith, L.; Bonetti, D. Constructing Questionnaires Based on the Theory of Planned Behaviour: A Manual for Health Services Researchers; Centre for Health Services Research, University of Newcastle upon Tyne: Newcastle upon Tyne, UK, 2004. [Google Scholar]
- Barr, S. Factors influencing environmental attitudes and behaviors: A UK case study of household waste management. Environ. Behav. 2007, 39, 435–473. [Google Scholar] [CrossRef]
- Babbie, E.R.; Mouton, J. The Practice of Social Research; Oxford University Press: Cape Town, South Africa, 2001. [Google Scholar]
- Kempton, W.; Boster, J.S.; Hartley, J.A. Environmental Values in American Culture; MIT Press: Cambridge, MA, USA, 1995. [Google Scholar]
- Kish, L. A Procedure for Objective Respondent Selection within the Household. J. Am. Stat. Assoc. 1949, 44, 380–387. [Google Scholar] [CrossRef]
- Page, C.; Meyer, D. Applied Research Design for Business and Management; McGraw-Hill Higher Education: Sydney, Australia, 2003; p. 331. [Google Scholar]
- Brace, I. Questionnaire Design: How to Plan, Structure and Write Survey Material for Effective Market Research; Kogan Page Publishers: London, UK, 2018. [Google Scholar]
- Likert, R. A technique for the measurement of attitudes. Arch. Psychol. 1932, 140, 55. [Google Scholar]
- Guttman, L. A basis for analyzing test-retest reliability. Psychometrika 1945, 10, 255–282. [Google Scholar] [CrossRef] [PubMed]
- Sijtsma, K. On the use, the misuse, and the very limited usefulness of Cronbach’s alpha. Psychometrika 2009, 74, 107. [Google Scholar] [CrossRef] [PubMed]
- Cronbach, L.J. Coefficient alpha and the internal structure of tests. Psychometrika 1951, 16, 297–334. [Google Scholar] [CrossRef] [Green Version]
- Revelle, W. Hierarchical cluster analysis and the internal structure of tests. Multivar. Behav. Res. 1979, 14, 57–74. [Google Scholar] [CrossRef] [PubMed]
- R Core Team. R: A Language and Environment for Statistical Computing; R Foundation for Statistical Computing: Vienna, Austria, 2012. [Google Scholar]
- Difford, M.; Nelson Mandela Metropolitan University, Port Elizabeth, South Africa. Addendum to Results of Statistical Analysis Contract Report. Personal communication, Unpublished report. 2010. [Google Scholar]
- Cohen, J. A power primer. Psychol. Bull. 1992, 112, 155. [Google Scholar] [CrossRef] [PubMed]
- Cialdini, R.B.; Kallgren, C.A.; Reno, R.R. A focus theory of normative conduct: A theoretical refinement and reevaluation of the role of norms in human behavior. Adv. Exp. Soc. Psychol. 1991, 24, 201–235. [Google Scholar]
- Minato, W.L.; Curtis, A.L.; Allan, C. Understanding the role and influence of social norms: Lessons for NRM. Local Environ. 2012, 17, 863–877. [Google Scholar] [CrossRef]
- Hooper, D.; Coughlan, J.; Mullen, M. Structural equation modelling: Guidelines for determining model fit. Electron. J. Bus. Res. Method 2008, 6, 53–60. [Google Scholar]
- Martin, M.; Williams, I.D.; Clark, M. Social, cultural and structural influences on household waste recycling: A case study. Resour. Conserv. Recycl. 2006, 48, 357–395. [Google Scholar] [CrossRef]
- Vicente, P.; Reis, E. Factors influencing households’ participation in recycling. Waste Manag. Res. 2008, 26, 140–146. [Google Scholar] [CrossRef] [PubMed]
- Korfmacher, K.S. Solid waste collection systems in developing urban areas of South Africa: An overview and case study. Waste Manag. Res. 1997, 15, 477–494. [Google Scholar] [CrossRef]
Figure 1.
The Theory of Planned Behavior (adapted from Azjen & Madden, 1986 [42]).
Figure 1.
The Theory of Planned Behavior (adapted from Azjen & Madden, 1986 [42]).
Figure 2.
Metropolitan areas and cities included in the study.
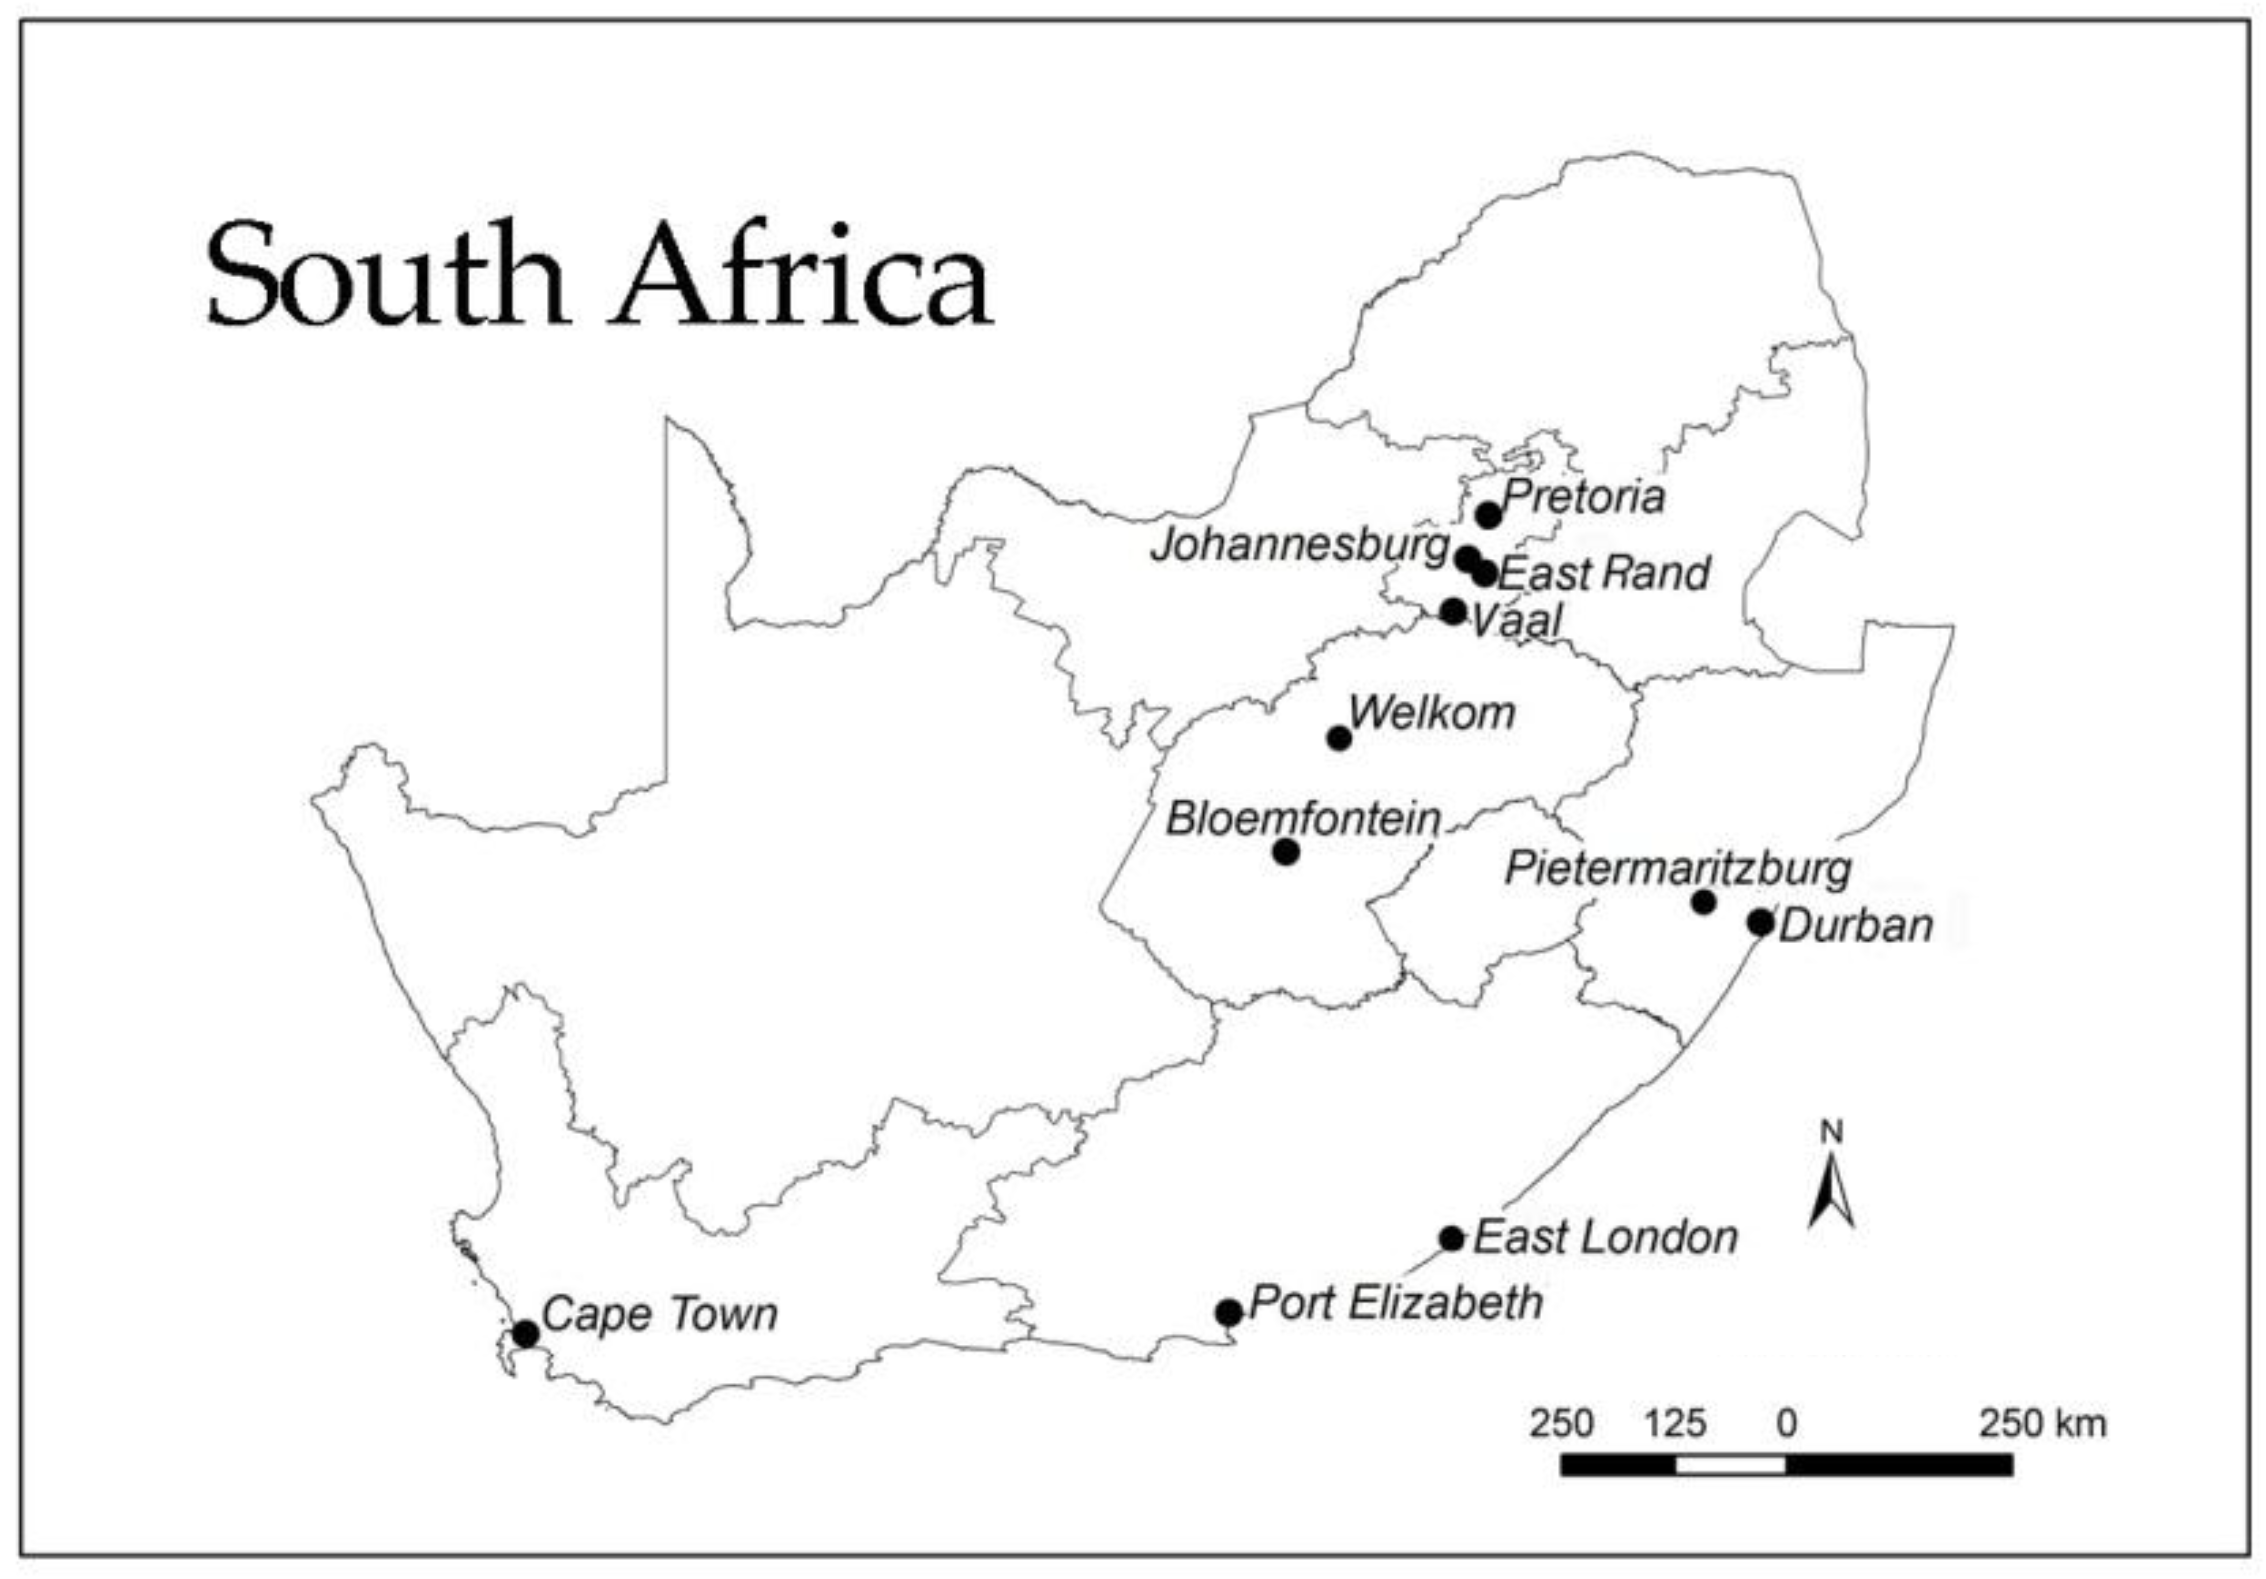
Figure 3.
Path diagram of the TPB fitted to the unstandardized/raw latent variables.
Table 1.
Descriptive statistics for the latent variables, mean scores, and percentiles (n = 2004).
| Construct (Latent Variables) | Percentiles | |||||||
|---|---|---|---|---|---|---|---|---|
| 0.05 | 0.10 | 0.25 | 0.50 | 0.75 | 0.90 | 0.95 | ||
| B (Recycling behavior) | 1.44 | 1.00 | 1.00 | 1.00 | 1.00 | 1.14 | 2.86 | 3.57 |
| IR (Intention to recycle) | 3.76 | 1.00 | 1.43 | 2.57 | 3.86 | 4.86 | 5.71 | 6.29 |
| A (Attitude) | 3.86 | 1.45 | 2.00 | 2.96 | 3.86 | 4.71 | 5.67 | 6.00 |
| SN (Subjective norm) | 3.37 | 1.40 | 1.60 | 2.40 | 3.40 | 4.20 | 5.00 | 5.60 |
| PBC (Perceived behavioral control) | 3.30 | 1.17 | 1.67 | 2.33 | 3.33 | 4.00 | 5.00 | 5.50 |
Where 1 = the lowest possible score, and 7 = highest possible score.
Table 2.
Descriptive statistics for the recycling behavior measurement and the separate items that make up the construct.
Table 2.
Descriptive statistics for the recycling behavior measurement and the separate items that make up the construct.
| Item | Recycling Behavior Average and per Item | Main Components | ||
|---|---|---|---|---|
| SD | SD | |||
| Recycling behavior (Average of all items below) | 1.44 | 0.94 | ||
| Recycling frequency | 1.76 | 1.55 | 1.76 | 1.55 |
| Taking responsibility for recycling in your household | 1.44 | 0.89 | 1.44 | 0.89 |
| Recycling quantities *: (Average of items below) | - | - | 1.35 | 1.11 |
| Paper | 1.48 | 1.32 | - | - |
| Plastic | 1.44 | 1.24 | - | - |
| Glass | 1.41 | 1.17 | - | - |
| Metal | 1.27 | 0.95 | - | - |
| Compost | 1.27 | 1.06 | - | - |
Where 1 represents no recycling activity and 7 represents the best possible mean value for recycling behavior. * Qualitative measurement of recycling quantities (refer to Section 3.3.1).
Table 3.
Descriptive statistics for the intention of respondents to recycle.
| Item | SD | |
|---|---|---|
| Intention to recycle (Average of items below) | 3.76 | 1.54 |
| The willingness or likelihood to recycle… If curbside collection for recyclables in area | 4.21 | 2.01 |
| If to put recyclables out separately for curbside collection | 3.92 | 1.91 |
| If to sort your recyclable waste from rest of household waste | 3.86 | 0.98 |
| If have to take recyclables to a collection point in area close to house | 3.81 | 1.91 |
| If have to take recyclables to support a charity initiative | 3.75 | 1.86 |
| If to take recyclables to collection points | 3.42 | 1.77 |
| If have to take recyclables to a collection point further away from house | 3.33 | 1.73 |
Where 1 = the option very unlikely or not willing at all (no intention), and 7 = the option very likely or very willing (high level of intention).
Table 4.
Descriptive statistics for the attitude of respondents towards recycling.
| Item | SD | |
|---|---|---|
| Attitude (Average of items below) | 3.86 | 1.34 |
| For your household to recycle is… | ||
| Bad/good | 4.12 | 1.60 |
| Useless/useful | 3.99 | 1.59 |
| Unimportant/important | 3.95 | 1.65 |
| Awakens negative emotions/positive emotions | 3.89 | 1.44 |
| A waste of time/useful | 3.82 | 1.64 |
| Undesirable/desirable | 3.76 | 1.67 |
| A hassle/easy | 3.48 | 1.58 |
Where 1 implicates a most negative attitude towards recycling, and 7 implicates a most positive attitude towards recycling.
Table 5.
Descriptive statistics for the subjective norm variable.
| Item | SD | |
|---|---|---|
| Social pressure to recycle (Average of items below) | 3.37 | 1.30 |
| Your household does not want to recycle/wants to recycle | 3.70 | 1.62 |
| For your household to recycle is difficult/easy | 3.55 | 1.55 |
| Your municipality thinks it is important for your household to recycle: strongly disagree/strongly agree | 3.37 | 1.75 |
| It is expected of your household to recycle: strongly disagree/strongly agree | 3.27 | 1.79 |
| Most of the people important to you want you to recycle: strongly disagree/strongly agree | 2.96 | 1.67 |
Where 1 implicates a most negative attitude towards recycling, and 7 implicates a most positive attitude towards recycling.
Table 6.
Descriptive statistics for respondents’ perceived behavioral control over recycling behavior.
Table 6.
Descriptive statistics for respondents’ perceived behavioral control over recycling behavior.
| Item | SD | |
|---|---|---|
| Perceived control over the act of recycling (Average of items below) | 3.30 | 1.25 |
| You know how to recycle false/true | 3.81 | 1.65 |
| To recycle is difficult/easy | 3.59 | 1.58 |
| The opportunities for you to recycle are none/plenty | 3.49 | 1.56 |
| There are recycling schemes in your area: strongly disagree/strongly agree | 3.01 | 1.74 |
| The necessary resources and facilities are available that allow you to recycle: strongly disagree/strongly agree | 3.01 | 1.68 |
| You are aware of recycling schemes in your area: strongly disagree/ strongly agree | 2.94 | 1.74 |
Where 1 implicates a most negative attitude towards recycling, and 7 implicates a most positive attitude towards recycling.
Table 7.
Reliability and internal consistency of the TPB constructs.
| Construct | Instrument Quality | Coefficients * | |||||
|---|---|---|---|---|---|---|---|
| α | λ6 | β | ωh | ωlim | ωt | ||
| B | Excellent | 0.965 | 0.965 | 0.944 | 0.883 | 0.906 | 0.974 |
| IR | Excellent | 0.931 | 0.938 | 0.897 | 0.811 | 0.856 | 0.948 |
| A | Excellent | 0.941 | 0.936 | 0.808 | 0.905 | 0.946 | 0.956 |
| SN | Good | 0.853 | 0.839 | 0.760 | 0.719 | 0.809 | 0.888 |
| PBC | Good | 0.873 | 0.884 | 0.711 | 0.720 | 0.772 | 0.932 |
* Where: α = Cronbach’s alpha, λ6 = Guttman’s lambda 6, β = Revelle’s beta, ωh = McDonald’s omega hierarchical, ωlim = McDonald’s omega asymptotic, ωt = McDonald’s omega total.
Table 8.
Goodness-of-fit statistics for the fitted SEM model.
| Model Fit Criteria | Observed Value | Interpretation/Accepted Levels [47,71] | Comment |
|---|---|---|---|
| GFI (Goodness-of-fit index) | 0.990 | 0 (no fit)—1 (perfect fit); values ≥ 0.95 suggest good fit | Good fit of model |
| AGFI (Adjusted goodness-of-fit index) | 0.924 | 0 (no fit)—1 (perfect fit); values ≥ 0.9 suggest good fit | Good fit of model |
| RMSEA (Root-mean-square error of approximation) | 0.112 | 0 = perfect fit | Good fit of model |
| Bentler–Bonnett NFI (Normed fit index) | 0.990 | 0 (no fit)—1 (perfect fit); values ≥ 0.95 suggest good fit | Good fit of model |
| Tucker–Lewis NNFI (Non-normed fit index) | 0.953 | 0 (no fit)—1 (perfect fit); values ≥ 0.95 suggest good fit | Good fit of model |
Table 9.
Parameter estimates for applying the TPB.
| Path (Hypothesis) | Path Coefficients (β-Value) | Std Error | z-Value | Pr (>|z|) | Result of Hypothesis Hest |
|---|---|---|---|---|---|
| A → IR (H1) | 0.275 | 0.029 | 9.628 | 0.000 | Statistically significant |
| SN → IR (H2) | 0.590 | 0.035 | 17.083 | 0.000 | Statistically significant |
| PBC → IR (H3) | −0.020 | 0.032 | −0.610 | 0.542 | Not significant |
| IR → B (H4) | 0.131 | 0.014 | 9.589 | 0.000 | Statistically significant |
| PBC → B (H5) | 0.276 | 0.017 | 16.326 | 0.000 | Statistically significant |
Table 10.
Model R2-values.
| Variable | Observed Variance | Estimated Variance | R2 | Std. Error Coefficient |
|---|---|---|---|---|
| B | 0.881 | 0.648 | 0.264 | 0.858 |
| IR | 2.379 | 1.275 | 0.464 | 0.732 |
© 2018 by the author. Licensee MDPI, Basel, Switzerland. This article is an open access article distributed under the terms and conditions of the Creative Commons Attribution (CC BY) license (http://creativecommons.org/licenses/by/4.0/).
Share and Cite
MDPI and ACS Style
Strydom, W.F. Applying the Theory of Planned Behavior to Recycling Behavior in South Africa. Recycling 2018, 3, 43. https://doi.org/10.3390/recycling3030043
AMA Style
Strydom WF. Applying the Theory of Planned Behavior to Recycling Behavior in South Africa. Recycling. 2018; 3(3):43. https://doi.org/10.3390/recycling3030043
Chicago/Turabian StyleStrydom, Wilma F. 2018. "Applying the Theory of Planned Behavior to Recycling Behavior in South Africa" Recycling 3, no. 3: 43. https://doi.org/10.3390/recycling3030043