
Physics-Based Electrochemical Model of Vanadium Redox Flow Battery for Low-Temperature Applications
1
Department of Chemical Engineering, Indian Institute of Technology Madras, Chennai 600036, India
2
BMS College of Engineering, Bangalore 560019, India
*
Author to whom correspondence should be addressed.
Batteries 2023, 9(7), 374; https://doi.org/10.3390/batteries9070374
Submission received: 20 May 2023
/
Revised: 28 June 2023
/
Accepted: 1 July 2023
/
Published: 11 July 2023
(This article belongs to the Section Battery Mechanisms and Fundamental Electrochemistry Aspects)
Abstract
:Vanadium redox flow batteries (VRFBs) operate effectively over the temperature range of 10 °C to 40 °C. However, their performance is significantly compromised at low operating temperatures, which may happen in cold climatic conditions. The loss of performance can be attributed to reduced kinetics and decreased diffusivity of ions in the electrolyte. In this paper, we present a physics-based electrochemical model of a vanadium redox flow battery that allows temperature-related corrections to be incorporated at a fundamental level, thereby extending its prediction capability to low temperatures. The model follows the conventional evaluation of the cell overpotential as the sum of contributions from overpotentials associated with activation, ionic conduction and mass transfer polarization. New data-driven models have been proposed to make these sub-models temperature sensitive. The overall model has been validated with a wide range of data from VRFB cells of sizes up to 900 cm2 and operating temperatures down to −10 °C. The model results indicate that enhancement of electrochemical performance of VRFB below subzero temperatures requires electrode and membrane activation and improvement in ionic conductivity of the electrolyte.
1. Introduction
In flow batteries, electrical energy is stored in and retrieved from liquid electrolytes that are circulated through an electrochemical cell containing an anode, a cathode, an ionic conductor with a separator, and an external pathway for electrons to flow from positive electrodes to negative electrodes during charging and vice versa during discharging. The heterogeneous charge transfer reactions that occur on the fibers of an electronic conductor, typically without a catalyst, are responsible for the functioning of a flow battery. Vanadium redox flow batteries (VRFBs) are one example of redox flow batteries that have reached the stage of commercial deployment for grid-scale application. Extensive research has been carried out on several variants of VRFB over the past few decades. This battery was invented by Maria Skyllas-Kazacos and co-researchers at the University of New South Wales, Australia [1] in the mid-1980s and features two tanks in which the positive and the negative electrolytes are stored. A schematic representation is given in Figure 1. The positive electrolyte is a mixture of VO2+ and VO2+ ions in dilute sulfuric acid, and the negative electrolyte has a mixture of V3+ and V2+ ions in dilute sulfuric acid. During the discharge of the battery, V2+ is transformed to V3+ on the negative electrode and VO2+ is transformed to VO2+ on the positive electrode; the reverse reactions involving the same ions occur during charge, as listed below:
- Positive electrode:
- Negative electrode:
- Overall reaction:
The all-liquid VRFB is particularly suited for large-scale energy storage applications due to safe operation. During the reactions, vanadium ions are reduced and oxidized in the liquid electrolytes; no solid deposition or dissolution is involved. However, there is crossover of vanadium species and water through the membranes, which results in self-discharge of the battery. Many studies on membranes of VRFB have focused on the reduction of cross-contamination by making the membrane as efficient a barrier layer to the vanadium species as possible [4]. The relatively simple construction of the cell enables it to be scaled up to large cell sizes and stacks [5,6]. VRFB systems are expected to be cost-competitive with Li-ion batteries when deployed in GWh-scale storage systems [7]. Large-scale systems are typically deployed in outdoor environments and are subject to climatic influences, especially in cases where there is no active temperature control system or when it fails to perform effectively because of non-availability of thermal energy. In such cases, the performance of the flow battery will be affected. Several studies [8,9,10,11] indicate that there can be a significant loss of battery performance in terms of both energy and power. A cold VRFB may not be able to be charged or deliver power at rated conditions, and its energy storage capacity may also be severely compromised. Zhang et al. [8] highlight the contrary effect: they show, through their experimental study on a 5 cm2 VRFB cell operated at 40 mA/cm2, that significant gains in energy efficiency and peak power density can be obtained as the cell operating temperature is increased from 15 °C to 55 °C. Hence, the emphasis of this work is to develop a model that can predict the electrochemical performance of a VRFB cell at low operating temperatures.
The prediction of cell level performance of a VRFB using comprehensive one-, two- or three-dimensional models has been reported in the literature [2,12,13]. Basic conservation laws and kinetic models of electrochemical reactions were used by Shah et al. [12] to create a simple mathematical model. This model predicted the relationship between cell voltage and electrolyte flow rate, concentration, and electrode porosity. Overpotential and water concentration results were displayed as contour plots. The experimental results from a 100 cm2 active area cell at room temperature were used to validate the model predictions. You et al. [2] developed a 2D static model of a VRFB single cell by combining reaction kinetics and conservation laws. The goal of this study is to ascertain the electrochemical performance of cells as a function of the current density and local mass transfer coefficient. Sathisha and Dalal [13] used a 2D unsteady-state isothermal model to analyze the performance of the VRFB through numerical techniques. The results corresponding to changes in electrode porosity, current, concentration, and electrolyte flow rate were predicted using this model.
As may be expected, proper electrolyte circulation is one of the crucial factors in redox flow batteries. Apart from its effect on electrochemical performance, electrolyte circulation has a bearing on the system efficiency, as the energy used to pump the electrolytes adds to the cost. Several modelling studies can be found in the literature on optimization and control of electrolyte flow. Tang et al. [14] used a concentration overpotential model to relate flow rate to the concentration overpotential, thereby determining the best flow rate to obtain maximum energy efficiency and the least pumping loss. Khazaeli et al. [15] developed a 2D numerical model to investigate the effects of electrolyte flow rate on battery voltage, pressure loss, and depth of discharge of a six-cell stack of VRFBs. They discovered that increasing the flow velocity of electrolytes resulted in a 50 mV rise in cell voltage. Additionally, as the flow rate of the electrolytes increased, the maximum depth of discharge and pressure drop increased. In order to calculate the power losses of the VRFB stack, Wang et al. [16] developed a transient model that estimates the overpotential as a function of the input current, electrolyte flow rate, and vanadium ion concentration. They developed a dynamic method to determine the optimal flow rate for the various discharge powers and states of charge (SOC). Analytical formulas were used by Murthy et al. [17] to evaluate the concentration overpotential in VRFB. By connecting the surface and bulk concentrations of vanadium species using the Nernst and Butler-Volmer equations, they could calculate the concentration overpotential. Experimental data were used to validate a dimensionless model that included derived equations for the mass transfer losses. The Butler–Volmer equation’s overpotential was twice as large as the Nernst equation’s overpotential. In order to increase a battery’s charge retention capacity and electrochemical performance, one must have a thorough understanding of the complex chemistry of the vanadium electrolyte. This is done by minimizing inhibitory actions such as self-discharge and promoting favorable processes at the electrode–electrolyte interfaces [18].
In the literature, there has been much work done on the thermal modelling of VRFBs. This has a significant impact on battery management systems. The temperature in the stack must be kept at an appropriate level to prevent the precipitation of vanadium electrolytes. The majority of thermal modelling forecasts are conducted between 25 and 60 °C. A thermal model of VRFBs was presented by Tang et al. [19], a utilizing mass transfer theory and thermodynamics. They performed battery simulations at various ambient temperatures and a constant electrolyte temperature. Their model was able to efficiently predict the variations of the stack temperature at different charge and discharge currents. Predictably, decreasing flow rate and increasing current resulted in a rise in the battery temperature. They recommended regulation of the values of thermal properties of reservoirs and surface area to optimize the heat flow and reduce overheating of the VRFB stack.
The experimental measurement of vanadium ion diffusivities for the temperature range of −10 °C to 60 °C was done first by Yin et al. [10], who proposed empirical models for diffusivity and mobility of ions in the electrolytes. These were used to discuss the effect of temperature on the electrochemical performance of a VRFB as measured in terms of the coulombic efficiency, voltage efficiency, and energy efficiency of the cell at various temperatures. The outcomes of a 2D mathematical model for the VRFB stack were presented by Zhang et al. [20]. They used the flow network equivalence method to determine the effect of non-uniform flow distribution of electrolytes in the flow-field. Simulation results comprising stack voltage and electrolyte reservoir temperature complied with the experimental data from the literature under various operation conditions. The results showed that temperature variation of the stack was around 10 °C at different current densities and flow rates.
The membrane, electrodes, and vanadium electrolyte are the three crucial parts of VRFB. A specified ratio of vanadium salt and aqueous sulfuric acid constitutes the electrolyte used in VRFB. The specific proportion of vanadium, sulfuric acid, and water (deionized) influences the solubility—and thereby the maximum energy density—and proton conductivity of the electrolyte. A porous carbon felt is used as an electrode to transport electrons, reactants, and products. An ion (proton) exchange membrane is maintained between the electrodes and serves to transport protons from the positive electrode to the negative electrode during charging, and vice versa. Typical proton exchange membranes used in VRFBs also allow water to cross over, which is necessary to maintain water balance in the cell. Cross-over of vanadium species also occurs across the membrane, although at a far slower rate. Effective transport of reactants and protons, both neutral and charged, is crucial for the efficient operation of the VRFB cell, and the mechanism of transport can be species-dependent. Since the transport coefficients of various species are temperature-dependent, the overall polarization characteristics of the cell are also temperature dependent. In this work, we propose a mathematical model that captures this temperature dependence using a physics-based approach that incorporates the known/derived influence of different overpotentials on temperature.
2. Description of the Model
The voltage of the cell (Ecell) is affected by the resistances offered by the electrode, membrane, and electrolyte. Overpotentials associated with reaction kinetics and mass transfer also affect cell voltage. The open circuit voltage (OCV) itself is affected by a number of factors, including the operating temperature of the cell. Using the conventional division of overpotentials into ohmic overpotential (ηOhmic), activation overpotential (ηAct), and concentration overpotential (ηConc), the cell voltage can be represented as
Here, the last two quantities on the right hand side (RHS) of the equation need to be evaluated separately for each electrode, and all four variables are typically expressed as functions of current density, flow rate, and electrolyte composition. Evaluation of each of these individually through physics-based sub-models allows temperature-related corrections to be incorporated at a fundamental level, thereby extending the prediction capability to low temperatures. Neglecting temperature variations within the cell, we develop additional data-driven correlations to evaluate each of these so that is made sensitive to the current density, temperature, and flow rates of electrolytes in addition to the composition of the cell. To simplify the model, the following assumptions are considered:
- Electrolyte flow rate is uniform, and concentration variations over the cell are small and can be neglected.
- The electrolyte is uniformly mixed, and the concentration of vanadium species is the same throughout.
- Since vanadium ion cross-over and self-discharge of the battery are slow processes, these are neglected in the present study, and the membrane is assumed to be impermeable to vanadium ions.
- Oxygen and hydrogen evolution is negligible, and no side reactions occur other than those listed in Equations (1)–(3).
The flow chart of the model used to determine the potential of VRFBs is shown in Figure 2, which also identifies important parameters appearing in the model. Various parameters appearing in the model are given in Table 1. The components of the model are given below.
2.1. Open Circuit Voltage (V)
The voltage across the battery at electrochemical equilibrium is called the open circuit voltage (OCV). It depends primarily on the temperature and concentration of the reacting species. The Nernst equation is used to obtain the open circuit voltage of any electrochemical reaction:
where E0 is the standard electrochemical potential in Volts (V); R is the universal gas constant, having a value of 8.314 J/(mol K); T is the temperature in Kelvin (K); n is the charge; F is Faraday’s constant, having a value of 96,486 A/(mol·s); Cproducts and Creactants are the concentration of products and reactants in mol/L, respectively [21]. The Nernst equation for the overall reaction (Equation (3)) of the VRFB is given below.
It has been suggested [21] that the above Nernst equation needs to be modified to account for the Donnan potential that exists across the membrane because of the non-uniform proton concentration in the anolyte and catholyte. Taking and as the proton concentration catholyte and anolyte, respectively, the modified Nernst equation is given by
The concentrations of the various ionic species appearing in Equation (7) can be related to the State of charge (SOC), which is the ratio of remaining capacity in the battery to the maximum charge stored in the battery. For a VRFB system, in which charge transfer reactions are restricted to those involving the four vanadium species participating in Equations (1) and (2), the SOC can be expressed as
In this study, we have considered that the electrolyte is prepared using vanadium oxysulphate crystals and sulfuric acid. The initial concentration of protons is estimated based on electrolyte preparation methods. The changes in proton concentration in the anode and cathode are given by Equations (9) and (10) [21]:
where CV is the initial concentration of vanadium in the electrolyte.
The reversible cell voltage ET changes with temperature. At an arbitrary temperature T ≠ T0, reversible cell voltage can be given by Equation (11) [22]:
where Δso, the change in entropy of the overall reaction of VRFB at reference conditions, is equal to −121.7 J/mol K [23]. At an arbitrary temperature T ≠ T0, the Nernst equation must be modified to
Using Equation (11), the reversible cell voltage was found to be 1.28 V and 1.303 V at 10 °C and −10 °C, respectively, using Equation (11). Thus, lower operating temperature increases the reversible cell voltage; however, poorer kinetics and higher ionic transport resistance lower the overall cell performance, as outlined below.
2.2. Ohmic Overpotential
Ohmic overpotential arises from the flow of charged species in the battery. It is determined by the sum of electrical resistances offered by the VRFB components for the flow of charged species that participate in the electrochemical reactions [16]. In a VRFB, there is an ohmic overpotential contribution from the flow of electrons through the carbon felt, bipolar plate, and current collector on each side and in the external circuit. The proton movement through the electrodes and the membrane also contributes to the ohmic overpotential. The overall ohmic overpotential can be written as Equation (13) by taking only the important contributors:
where j is the current density; de is the thickness of the carbon felt electrode; σe is the electronic conductivity of the carbon felt; dm is the thickness of the membrane; σm is the protonic conductivity of the membrane; dgp is the thickness of the graphite plate; σgp is the electronic conductivity of the graphite plate; dcc is the thickness of the copper plate; σcc is the electronic conductivity of the copper plate; keff is the effective ionic conductivity of the vanadium electrolyte. The details of materials taken in the model and their properties are listed in Table 1.
Of the various conductivities, the electrode conductivity depends on the geometric construction as well as on the materials of the electrode. It was determined empirically from in situ electrochemical impedance spectroscopy (EIS) studies, as explained later in Section 3. Since vanadium ion cross-over is not considered in this study, the membrane conductivity of protons in the Nafion membrane is modeled as per the fuel cell literature and is explained in Section 3. Conductivity of the electrolyte ions influences the total conductivity in the battery. For the VRFB system, the ions involved are V2+, V3+, VO2+, H+, VO2+, and HSO4−. Effective electrolyte conductivity is given [12] by
where is the effective diffusivity of ionic species i, and is its concentrations in the electrolyte.
The vanadium electrolyte is circulated in the VRFB using porous carbon felt, which allows the transport of ions through the pores. The ionic diffusivity of the electrolyte through the electrode is determined based on porosity using the Bruggemann correction factor [12].
where ε is the porosity of the electrode material, and is the diffusivity of the electrolyte ions. It may be noted that the values of porosity and permeability vary with the compression of the electrode [24,25]. The diffusivity of the ions is estimated from the Stokes–Einstein equation, which relates diffusivity of ions in the electrolyte to the inverse of the electrolyte viscosity and the radius of the ion:
where ri is the ionic radius, μ is the electrolyte viscosity, and T is the temperature.
2.3. Activation Overpotential
Charge-transfer reactions occur on the surface of the electrode. The reaction kinetics are assumed to follow the Butler–Volmer equation. Assuming the electron transfer coefficient to be 0.5 at both electrodes, the activation overpotential in the anode and cathode is given by [16]
where γneg and γpos are the rate constants of the negative and the positive electrode, respectively. Values of the rate constants are given in Table 1.
2.4. Concentration Overpotential
Concentration overpotential arises due to the significant variation in electrolyte concentration at the bulk and at the electrode surface, which occurs when the current density is very high. Sustaining high currents requires high fluxes of reactant species; there can be a significant reduction in the surface concentration compared to the bulk concentration. When the bulk concentration itself is low, towards the end of charge/discharge, the surface concentration may become very low and lead to the situation where the reaction rate is limited by the diffusive flux, and the charge transfer process is controlled by mass-transfer. The concentration overpotential is expressed [14] as
where km is the local mass transfer coefficient, V3+ and VO2+ concentrations are taken during charging, and V2+ and VO2+ concentrations are taken during discharging the cell. km is determined from the empirical formula developed for laminar flow over the fibers of the carbon felt [26]:
where Sh and Re are the Sherwood number and Reynolds number, respectively.
where df is the fiber diameter; v is the superficial velocity; ρ is the density of the electrolyte; μ is the viscosity of the electrolyte. Thus, the calculation of the mass transfer coefficient is done as per Equation (21).
Thus, in the model, the operating cell voltage is determined using Equation (4) by evaluating the open-circuit voltage using Equation (12) and using Equations (13), and (17)–(19) to determine the overpotentials at the operating current density. All relevant properties are evaluated at the cell operating temperature.
3. Temperature Sensitivity of the Model Parameters
As can be expected, some of the model parameters are dependent on the operating temperature of the battery. Some, such as the kinetic constants in the activation potential and the electrode conductivity in the ohmic potential, depend on the cell construction and possibly on the temperature. Methods to determine the temperature-dependent parameters are discussed in this section.
Viscosity of the liquid electrolyte depends strongly on the temperature. In view of this, kinematic viscosity of the electrolyte made up of 1.6 M VO2+/VO2+ and 5 M H2SO4 was measured using an Ubbelhode viscometer at different temperatures. The absolute viscosity of the electrolyte was obtained from the measured density at the same temperatures. These data have then been fitted into the following correlation:
where μ is in kg/m·s and T is in °C. The diffusivity of various ions in the electrolyte calculated using Equations (16) and (22) at 10 °C and −10 °C is given in Table 2. One can see a substantial decrease of diffusivity of all ions with a decrease in temperature; it is also noteworthy that the diffusivity of vanadium ions in the electrolyte is an order of magnitude less than that of the protons.
Proton conductivity of the Nafion membrane can be calculated at different temperatures using the following empirical equation [27]:
where T is in Kelvin and the proton conductivity is in S/m. Electrical (electronic) conductivities of the graphite flow-field and copper plate are very high, and their contribution to the ohmic resistance can be neglected.
Electrochemical properties, namely, ohmic and activation overpotentials, of the electrode depend on a number of factors, and the temperature sensitivity of these properties cannot be predicted through modelling; however, the overall effect can be obtained through EIS measurements. In the present study, we use the EIS data of our previous studies [11,28] to develop empirical correlations for dependence of ohmic resistance and charge transfer resistance on temperature. Accordingly, the measured ohmic resistance obtained at 40, 30, 10, and −10 °C in a VRFB cell is used to develop the following correlation for the effective ohmic conductivity (σe) as a function of inverse temperature:
where is the pre-exponential factor for the electrode conductivity, and Ea,e is the activation energy constant for the electrode conductivity. Figure 3a represents the relation between ohmic resistance and temperature. The activation energy constant was found to be 12.27 kJ/kmol, which is calculated as the slope of the graph (Figure 3a) times the universal gas constant.
Similarly, the charge transfer resistance obtained experimentally [28] through EIS at the four temperatures was used to arrive at the temperature correction factor, Rct, for the constant γ in Equations (17) and (18):
where Ea,ct the activation energy, is obtained by the slope of the graph, which gives the relationship between charge transfer resistance (Rct) and temperature (Figure 3b). The value of the activation energy obtained is 29.02 kJ/kmol, which compares well with the values of 28.59 kJ/kmol and 21.9 kJ/kmol reported by Xiao et al. [9] for the VO2+/VO2+ and the V3+/V2+ redox couples for a vanadium concentration of 1.6 M VOSO4 and 2 M H2SO4. The value of Ea is used in Equations (17) and (18) to obtain the rate constants at the required temperature.
4. Results and Discussion
4.1. Open-Circuit Voltage and Overpotentials
The variation in the OCV with respect to SOC at various temperatures is given by Figure 4. As the temperature drops, the OCV increases, especially at low SOC. At high SOC, the increase in OCV is barely noticeable. The same pattern is seen in the experimental results; however, because the increase in OCV with SOC is greater in the tests, 43 mV is added to model OCV for comparison with the experimental results.
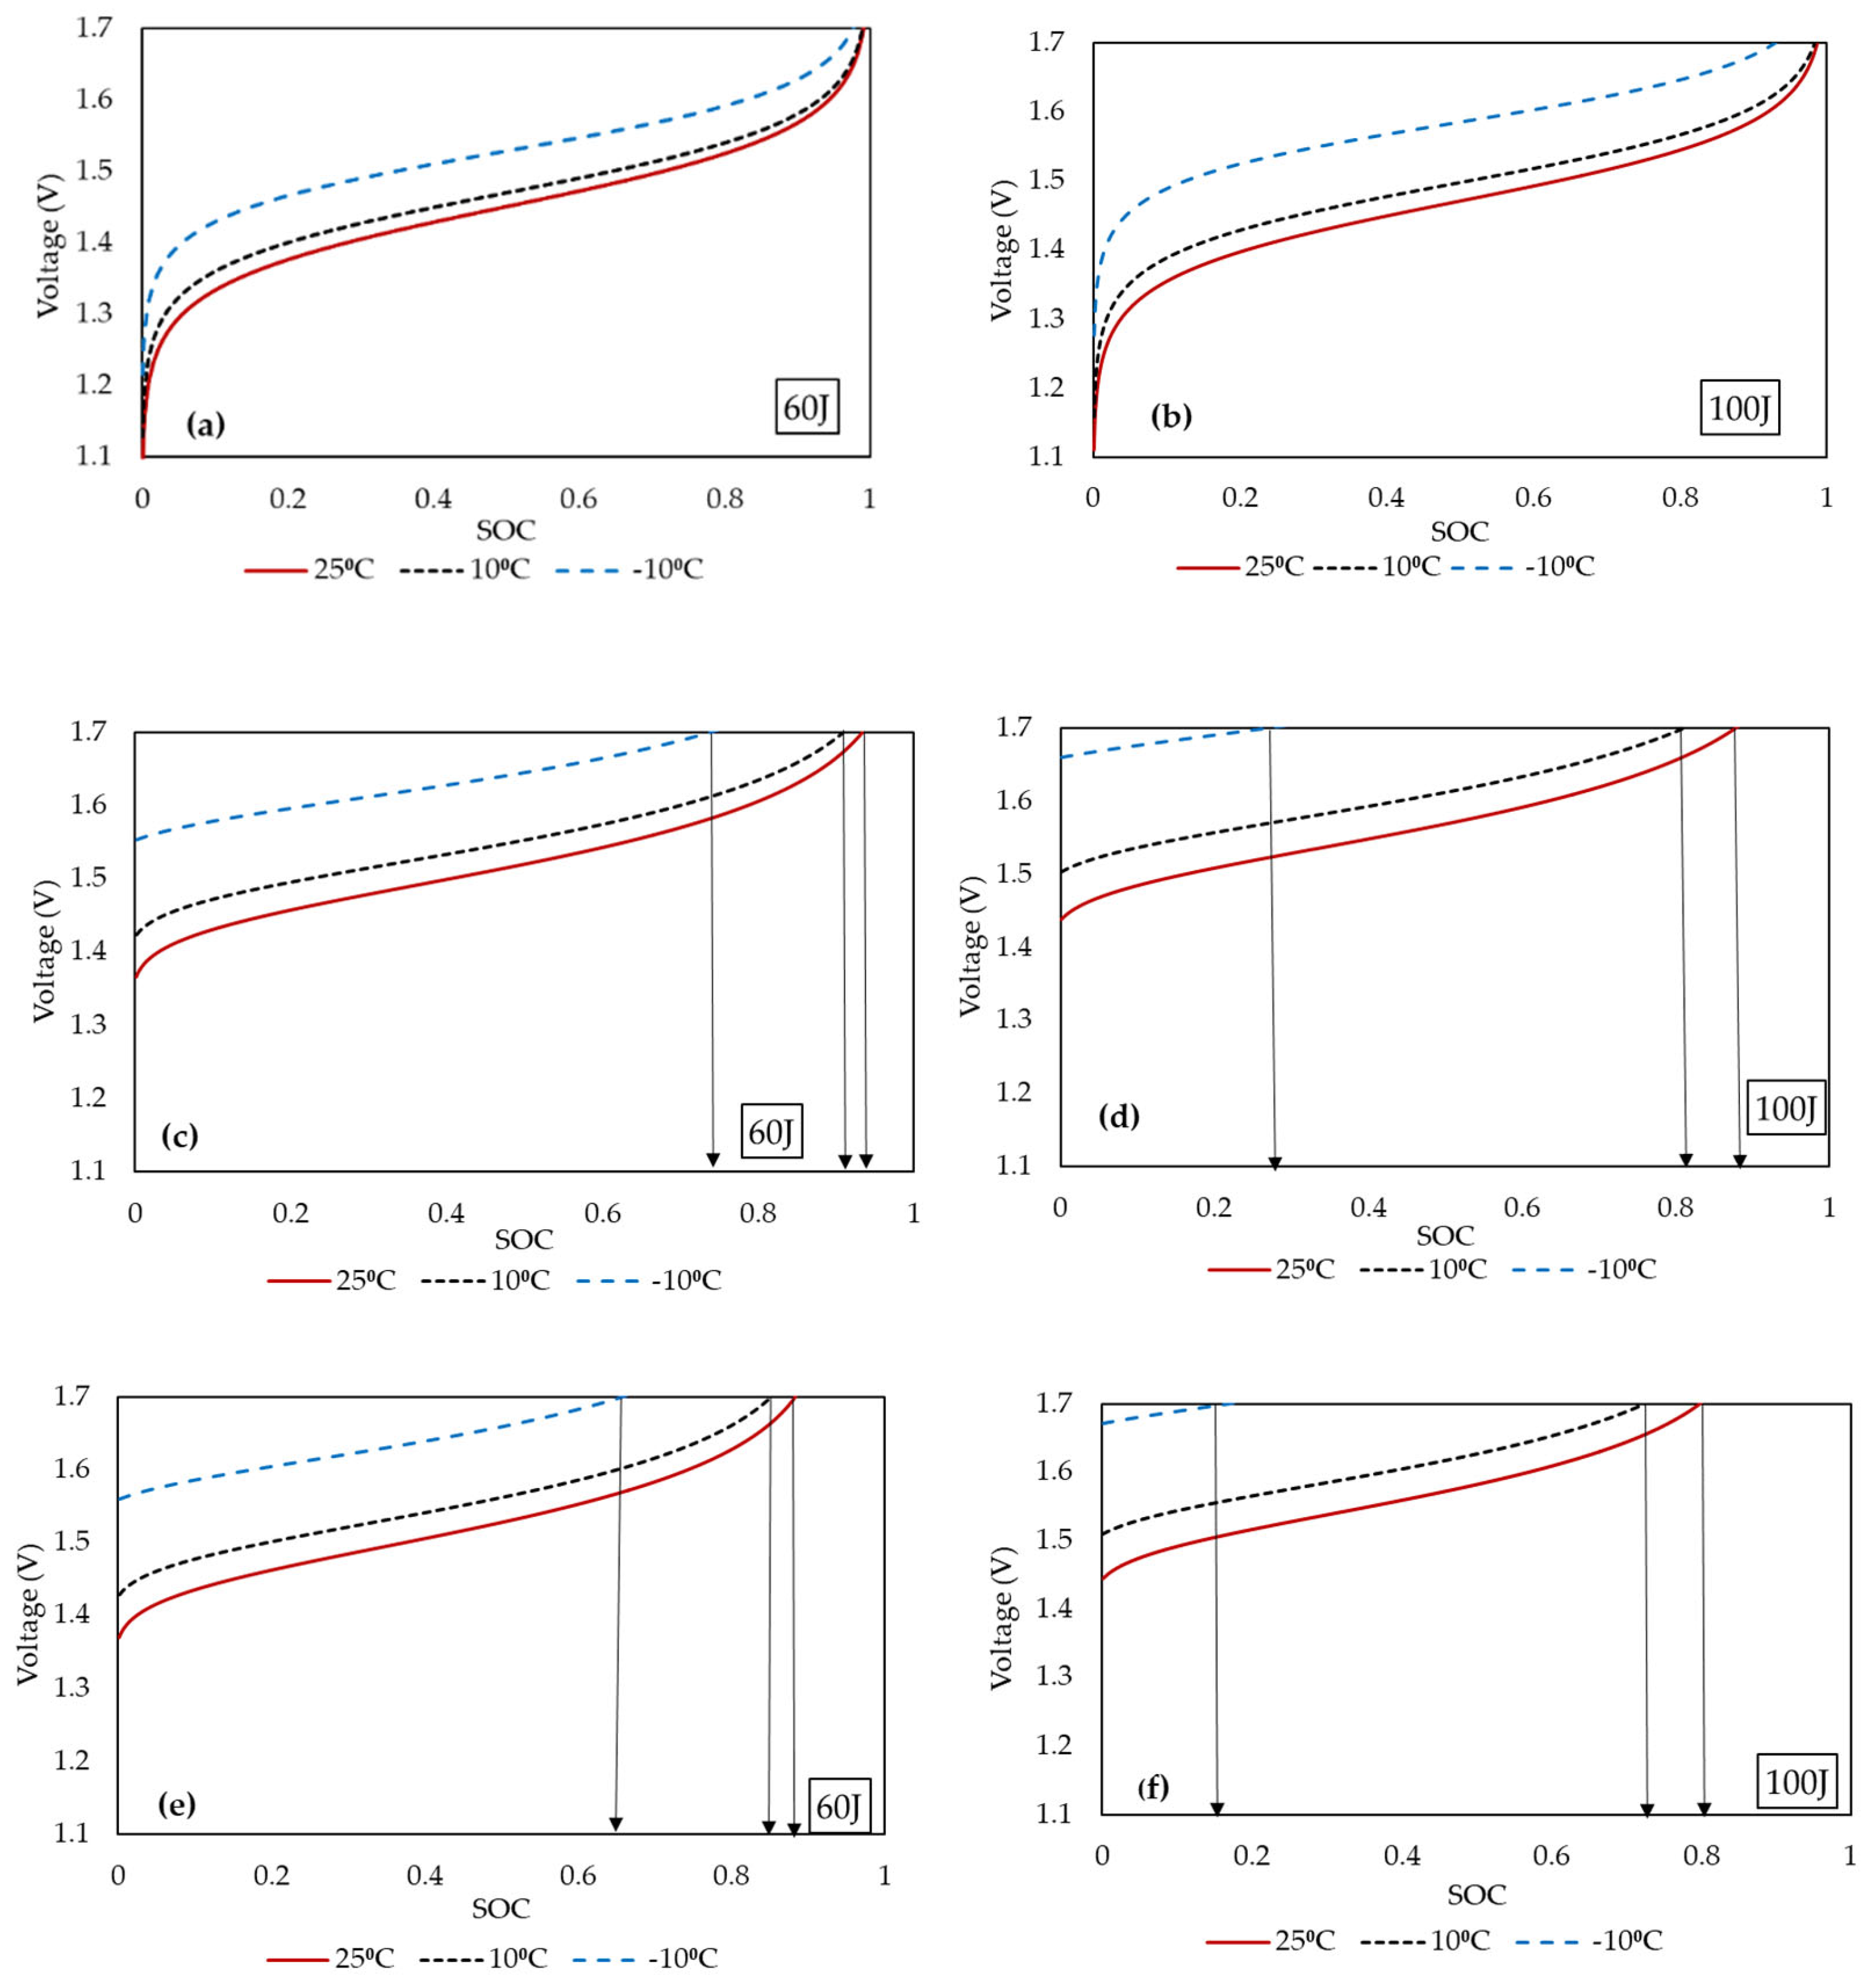
Figure 5 shows the predicted variation of the charging voltage (OCV + overpotential) with SOC for a 426 cm2 cell assembled with a 4.6 mm electrode (35% compression) with a 1.6 M VOSO4 and 3 M H2SO4 electrolyte for various conditions.
Figure 5a,b shows the charging potential for a current density of 60 and 100 mA/cm2, when only ohmic overpotential is considered. One can see a significant increase in ohmic overpotential at −10 °C. When the charge current density is increased from 60 to 100 mA/cm2 at −10 °C, the overpotential at 50% SOC increased by around 60 mV compared with the increase of only 8 mV at 25 °C.
Figure 5c,d depicts the variation in the cell potential when the activation overpotential is added to the corresponding cases in Figure 5a,b, with all other parameters being the same. One immediate consequence of including the activation overpotential is the upshift in cell voltage near conditions of SOC = 0. At each temperature, there is a noticeable shift in the initial charging potential, with the effect being more pronounced as the operating temperature decreases. For a given maximum cell voltage, this will decrease the charging capacity and reduce the potential window of operation. The activation overpotential is directly proportional to current density. Therefore, the potential window of cell operation becomes very narrow for the combination of high current densities and low temperatures. As shown in Figure 5d, the maximum chargeable SOC is less than 30% for a charging current density of 100 mA/cm2 at a cell temperature of −10 °C. At a current density of 60 mA/cm2, the limiting SOC (see Figure 5c) is close to 75%. These results are consistent with the observation that at low operating temperatures, high power operation of the cell is compromised.
Figure 5e,f shows the variation with SOC of the cell potential for two current densities when the concentration overpotential is included. The cell potential (OCV + ohmic overpotential + activation overpotential + concentration overpotential) variation at different temperatures is shown for a Reynolds number of 0.025. When the concentration overpotential is included, the maximum SOC to which the cell can be charged with a peak cell voltage of 1.7 V drops from 28% to 15% at 100 mA/cm2 and −10 °C. As a result, the SOC decreases by 8% at 25 °C, 12% at 10 °C, and 51% at −10 °C when the current density is increased from 60 mA/cm2 to 100 mA/cm2. Increasing the vanadium concentration to mitigate the concentration polarization has a relatively minor effect. For example, when the concentration of vanadium in electrolytes is increased by 25%, from 1.6 M to 2 M, the maximum SOC is increased only by 1.9% at 25 °C, 2.2% at 10 °C, and 3.9% at −10 °C. The low-temperature sensitivity to loss of power and storage capacity remains relatively unaffected by the increase in vanadium ion concentration.
4.2. Comparison with Experimental Data
Validation against experimental data, covering as wide a range of parameters as possible, is important to build confidence in the model. In this section, predictions by the model are compared with experimental results over a range of current densities, cell sizes, flow rates, and temperatures reported in the literature. Figure 6 compares the model predictions with experimental data of Praphulla [28] and Gundlapalli [29] obtained in a VRFB cell of a 100 and 916 cm2 nominal electrode area, respectively, at a cell operating temperature of 25 °C. The data for cell voltage variation with capacity during charging and discharging at current density 60 mA/cm2 are compared with the corresponding model predictions. The parameters used in this model are given in Table 1. Excellent agreement is obtained for both charging and discharging the cell potential for the two cells, and the charging and discharging capacity is captured well in both cases.
Experimental results from our previous work [11,28] in a single cell VRFB with a 100 cm2 and 426 cm2 active area with 4.6 mm felt at a compression of 35% are considered to validate the temperature effect on cell performance. The concentration of electrolytes was taken as 1.6 M VOSO4 and 3 M sulfuric acid. Figure 7 shows the comparison of experimental and model data at different operating temperatures, namely 25, 10, and −10 °C, at a current density of 60 mA/cm2 in a cell of 100 cm2 nominal electrode area (Figure 7a) and in a larger cell of 426 cm2 electrode area (Figure 7b). One can see consistently good agreement between model predictions and experimental results at all the three temperatures. The model clearly captures the broadening of the voltage window with a drop in temperature as well as the earlier onset of mass transfer polarization as the temperature is decreased in both the cells.
Finally, Figure 8 shows the comparison of model results with experimental data obtained at −10 °C using a 426 cm2 nominal electrode area with a focus on delineating the effect of current density (Figure 8a) and electrode compression (Figure 8b). The substantial reduction in capacity at the higher current density when using a 4.6 mm–thick electrode with a 35% compression ratio (CR) is well captured in Figure 8a. The compression of the electrode changes the intrinsic properties of the electrode, such as its porosity and electrical conductivity. These were estimated for different levels of compression using the data of Ghimire et al. [30] and used in the model. Figure 8b gives the changes in cell voltage with capacity while charging at a current density of 60 mA/cm2. It can be observed that a compression of 50% is more beneficial from a capacity point of view as compared to lower compression ratios at low temperatures, while earlier studies [31] show that a compression of about 35% is optimal for cell operation at 25 °C.
The above results serve to validate the model for the effect of cell size, current density, and operating temperature, in each case over a range of the parameter values.
4.3. Contributors to Overpotentials
There are various contributors to the cell overpotential at a given operating condition. A number of these have been modelled quantitatively, and it is instructive to compare their contribution to the overall cell overpotential. Table 3 lists the predicted contributions to the overall overpotential from ohmic, activation, and concentration components at different temperatures and current densities at an SOC of 50% for a cell of 426 cm2 nominal electrode area [11]. It may be recalled that the overall cell polarization characteristics have been validated for this range of current density and cell temperature.
One can see from Table 3 that at 25 °C and 10 °C, activation overpotential on the negative side is the main contributor even though ohmic overpotential is not insignificant. At −10 °C, it is the ohmic overpotential that contributes more. While the overpotentials increase with current density, as expected, the effect of cell temperature is more significantly pronounced. At 50% SOC, the contribution of concentration overpotential is relatively small, even at very low temperatures. Further examination of the contributors to the ohmic overpotential indicates that, while electrode ohmic overpotential remains significant at all temperatures and current densities, the electrolytic ohmic overpotential becomes the predominant contributor at −10 °C. This may be attributed to the substantial increase in electrolyte viscosity in the temperature interval of [+10 °C, −10 °C] [28]. Proton conductivity of the membrane also varies with temperature, it decreases with decrease in temperature. Proton conductivity is almost doubled when the temperature changes from 30 °C to 50 °C [32]. Membranes possess very poor conductivity below subzero temperatures [33]. Essentially, an increase in proton conductivity also contributes to an increase in discharge capacity and power density of the VRFB at higher temperatures [34]. Li et al. [35] used sulphate chloride mixed with electrolytes in VRFBs, which resulted in 74% energy efficiency at −5 °C. Mixed-acid-supported electrolytes, such as sulfuric acid–methanesulfonic acid, sulfuric acid–hydrochloric acid, and sulfuric acid–phosphoric acid show an energy density up to 40 Wh/L and a stability of over −20 °C to 50 °C. Hence, an increase in ionic conductivity of the vanadium electrolyte can be obtained by using mixed-acid systems [36]. Thus, improved cell performance at low temperatures requires activation of the electrode and membrane and improvement of the electrolyte conductivity.
5. Conclusions
In the present work, a simple physics-based model of vanadium redox flow batteries is developed to predict the dependency of cell potential on the current density, temperature, and electrode compression. The model computes the variations in ohmic, activation, and mass transfer overpotential over a wide range of temperatures using new data-driven models for some important parameters. The physical properties of VRFB components, kinetics, and diffusivity parameters are taken from the literature. Experimentally determined electrolyte viscosity and impedance at various cell temperatures was used to develop correction factors for model constants for operation at low temperatures. The model was validated with the experimental results of large VRFB cells (electrode area of 100, 426, and 916 cm2) operating in the temperature range of −10 to 25 °C. The validation matrix includes current density and electrolyte circulation rates typically employed in industrial-scale VRFB cells. This model can be utilized to forecast system performance under various operating and climatic environments, as its predictions exhibit good agreement with the actual data throughout a wide range of current densities, electrode compressions, circulation rates, and operating temperatures. Further, examination of the various contributors leading to an increase in the cell resistance at low temperatures indicates that electrode and membrane activation and enhancement in the ionic conductivity of electrolytes are needed to improve performance under these conditions.
Author Contributions
Conceptualization, methodology and validation, P.R. and S.J.; formal analysis, investigation, data curation and visualization, P.R.; writing—original draft preparation, P.R.; writing—review and editing, S.J.; supervision, funding acquisition and project administration, S.J. All authors have read and agreed to the published version of the manuscript.
Funding
This research was funded by Department of the Science and Technology (DST) (Grant reference no. DST/TMD/SERI/HUB/1(C)) and the Ministry of Education (MoE) (grant reference no. F.NO.41-2/2015-T.S.-I (Pt.)).
Data Availability Statement
Not applicable.
Acknowledgments
The authors would like to thank the Department of Science and Technology and the Ministry of Education for the financial support. Praphulla Rao would like to thank the Quality Improvement Programme of the Government of India and BMS College of Engineering, Bengaluru, India, for financing her Ph.D. studies.
Conflicts of Interest
The authors declare no conflict of interest.
References
- Skyllas-Kazacos, M.; Rychcik, M.; Robins, R.G.; Fane, A.G.; Green, M.A. New all vanadium redox flow cell. J. Electrochem. Soc. 1986, 133, 1057–1058. [Google Scholar] [CrossRef]
- You, D.; Zhang, H.; Chen, J. A simple model for the vanadium redox battery. Electrochim. Acta 2009, 54, 6827–6836. [Google Scholar] [CrossRef]
- Shah, A.A.; Tangirala, R.; Singh, R.; Wills, R.G.A.; Walsh, F.C. A Dynamic Unit Cell Model for the All-Vanadium Flow Battery. J. Electrochem. Soc. 2011, 158, A671–A677. [Google Scholar] [CrossRef] [Green Version]
- Sun, C.; Negro, E.; Vezzù, K.; Pagot, G.; Cavinato, G.; Nale, A.; Bang, Y.H.; Di Noto, V. Hybrid inorganic-organic proton-conducting membranes based on SPEEK doped with WO3 nanoparticles for application in vanadium redox flow batteries. Electrochim. Acta 2019, 309, 311–325. [Google Scholar] [CrossRef]
- Gundlapalli, R.; Jayanti, S. Effective splitting of serpentine flow field for applications in large-scale flow batteries. J. Power Sources 2021, 487, 229409. [Google Scholar] [CrossRef]
- Rao, P.; Gundlapalli, R.; Jayanti, S. Assessment of hydrodynamic performance of vanadium redox flow batteries at low temperatures. J. Energy Storage 2022, 55, 105746. [Google Scholar] [CrossRef]
- Mongird, K.; Viswanathan, V.; Alam, J.; Vartanian, C.; Sprenkle, V.; Baxter, R. 2020 grid energy storage technology cost and performance assessment. Energy 2020, 2020, 6–15. [Google Scholar]
- Zhang, C.; Zhao, T.; Xu, Q.; An, L.; Zhao, G. Effects of operating temperature on the performance of vanadium redox flow batteries. Appl. Energy 2015, 155, 349–353. [Google Scholar] [CrossRef]
- Xiao, S.; Yu, L.; Wu, L.; Liu, L.; Qiu, X.; Xi, J. Broad temperature adaptability of vanadium redox flow battery—Part 1: Electrolyte research. Electrochim. Acta 2016, 18, 525–534. [Google Scholar] [CrossRef]
- Yin, S.; Zhou, L.; Du, X.; Yang, Y. Influence of temperature on performance of all vanadium redox flow battery: Analysis of ionic mass transfer. Ionics 2018, 25, 593–606. [Google Scholar] [CrossRef]
- Rao, P.; Jayanti, S. Influence of electrode design parameters on the performance of vanadium redox flow battery cells at low temperatures. J. Power Sources 2020, 482, 228988. [Google Scholar] [CrossRef]
- Shah, A.; Watt-Smith, M.; Walsh, F. A dynamic performance model for redox-flow batteries involving soluble species. Electrochim. Acta 2008, 53, 8087–8100. [Google Scholar] [CrossRef] [Green Version]
- Sathisha, H.M.; Dalal, A. Two-Dimensional Unsteady Simulation of All-Vanadium Redox Flow Battery. J. Therm. Sci. Eng. Appl. 2015, 8, 011019-1–011019-14. [Google Scholar] [CrossRef]
- Tang, A.; Bao, J.; Skyllas-Kazacos, M. Studies on pressure losses and flow rate optimization in vanadium redox flow battery. J. Power Sources 2014, 248, 154–162. [Google Scholar] [CrossRef]
- Khazaeli, A.; Vatani, A.; Tahouni, N.; Panjeshahi, M.H. Numerical investigation and thermodynamic analysis of the effect of electrolyte flow rate on performance of all vanadium redox flow batteries. J. Power Sources 2015, 293, 599–612. [Google Scholar] [CrossRef]
- Wang, T.; Fu, J.; Zheng, M.; Yu, Z. Dynamic control strategy for the electrolyte flow rate of vanadium redox flow batteries. Appl. Energy 2018, 227, 613–623. [Google Scholar] [CrossRef]
- Murthy, S.K.; Sharma, A.K.; Choo, C.; Birgersson, E. Analysis of Concentration Overpotential in an All-Vanadium Redox Flow Battery. J. Electrochem. Soc. 2018, 165, A1746–A1752. [Google Scholar] [CrossRef]
- Noto, V.D.; Vezzù, K.; Crivellaro, G.; Pagot, G.; Sun, C.; Meda, L.; Rutkowska, I.A.; Kulesza, P.J.; Zawodzinski, T.A. A general electrochemical formalism for vanadium redox flow batteries. Electrochim. Acta 2022, 408, 139937. [Google Scholar] [CrossRef]
- Tang, A.; Ting, S.; Bao, J.; Skyllas-Kazacos, M. Thermal modelling and simulation of the all-vanadium redox flow battery. J. Power Sources 2012, 203, 165–176. [Google Scholar] [CrossRef]
- Zhang, B.W.; Lei, Y.; Bai, B.F.; Xu, A.; Zhao, T.S. A two-dimensional mathematical model for vanadium redox flow battery stacks incorporating non uniform electrolyte distribution in the flow fram. Appl. Therm. Eng. 2019, 151, 495–505. [Google Scholar] [CrossRef]
- Knehr, K.; Kumbur, E. Open circuit voltage of vanadium redox flow batteries: Discrepancy between models and experiments. Electrochem. Commun. 2011, 13, 342–345. [Google Scholar] [CrossRef]
- O’Hayre, R.; Cha, S.W.; Colella, W.; Prinz, F.B. Fuel Cell Fundamentals, 3rd ed.; Wiley Publications: Hoboken, NJ, USA, 1991. [Google Scholar]
- Blanc, C. Modeling of a Vanadium Redox Flow Battery Electricity Storage System. Ph.D. Thesis, EPF, Lausanne, Switzerland, 2009. [Google Scholar]
- Kumar, S.; Jayanti, S. Effect of electrode intrusion on pressure drop and electrochemical performance of an all-vanadium redox flow battery. J. Power Sources 2017, 360, 548–558. [Google Scholar] [CrossRef]
- Alipour, M.; Ziebert, C.; Conte, F.V.; Kizilel, R. A Review on Temperature-Dependent Electrochemical Properties, Aging, and Performance of Lithium-Ion Cells. Batteries 2020, 6, 35. [Google Scholar] [CrossRef]
- Schmal, D.; Van Erkel, J.; Van Buin, P.J. Mass transfer at carbon fibre electrodes. J. Appl. Electrochem. 1986, 16, 422–430. [Google Scholar] [CrossRef]
- Epan, D.E.; Choudhary, S.R.; Rengaswamy, R. Low grade heat recovery for power generation through electrochemical route: Vanadium Redox Flow Battery, a case study. Appl. Surf. Sci. 2019, 474, 262–268. [Google Scholar]
- Praphulla. Experimental and Modelling Studies on Low Temperature Performance of Vanadium Redox Flow Batteries. Ph.D. Thesis, IIT Madras, Chennai, India, 2021. Available online: https://shodhganga.inflibnet.ac.in:8443/jspui/handle/10603/463182 (accessed on 27 June 2023).
- Gundlapalli, R. Optimal Performance Conditions and Scale-Up Criteria for VANADIUM redox Flow Batteries. Ph.D. Thesis, IIT Madras, Chennai, India, 2019. [Google Scholar]
- Ghimire, P.C.; Bhattarai, A.; Schweiss, R.; Scherer, G.G.; Wai, N.; Yan, Q. A comprehensive study of electrode compression effects in all vanadium redox flow batteries including locally resolved measurements. Appl. Energy 2018, 230, 974–982. [Google Scholar] [CrossRef]
- Gundlapalli, R.; Jayanti, S. Effect of electrode compression and operating parameters on the performance of large vanadium redox flow battery cells. J. Power Sources 2019, 427, 231–242. [Google Scholar] [CrossRef]
- Wang, C.; Li, N.; Shin, D.W.; Lee, S.Y.; Kang, N.R.; Lee, Y.W.; Guiver, M.D. Fluorene-Based Poly(arylene ether sulfone)s Containing Clustered Flexible Pendant Sulfonic Acids as Proton Exchange Membranes. Macromolecules 2011, 44, 7296–7306. [Google Scholar] [CrossRef] [Green Version]
- Sun, C.; Zlotorowicz, A.; Nawn, G.; Negro, E.; Bertasi, F.; Pagot, G.; Vezzù, K.; Pace, G.; Guarnieri, M.; Di Noto, V. [Nafion/(WO3)x] hybrid membranes for vanadium redox flow batteries. Solid State Ion. 2018, 319, 110–116. [Google Scholar] [CrossRef]
- Xi, J.; Jiang, B.; Yu, L.; Liu, L. Membrane evaluation for vanadium flow batteries in a temperature, range of 20–50 °C. J. Membr. Sci. 2017, 522, 45–55. [Google Scholar] [CrossRef]
- Li, L.; Kim, S.; Wang, W.; Vijayakumar, M.; Nie, Z.; Chen, B.; Zhang, J.; Xia, G.; Hu, J.; Graff, G.; et al. A Stable Vanadium Redox-Flow Battery with High Energy Density for Large-Scale Energy Storage. Adv. Energy Mater. 2011, 1, 394–400. [Google Scholar] [CrossRef]
- Du, J.; Liu, J.; Liu, S.; Wang, L.; Chou, K.-C. Research progress of vanadium battery with mixed acid system: A review. J. Energy Storage 2023, 70, 107961. [Google Scholar] [CrossRef]

Figure 2.
Flow chart of the electrochemical model used to determine the cell potential of VRFBs.

Figure 3.
Variations in resistance with respect to temperatures obtained from EIS analysis of cell with area of 426 cm2 and electrolyte flow rate of 240 mL/min: (a) Ohmic; (b) Activation.
Figure 3.
Variations in resistance with respect to temperatures obtained from EIS analysis of cell with area of 426 cm2 and electrolyte flow rate of 240 mL/min: (a) Ohmic; (b) Activation.

Figure 4.
Predicted changes in the open-circuit voltage of the 426 cm2 cell with temperature obtained by circulating the electrolyte with concentrations of 1.6 M VOSO4 and 3 M H2SO4 at an electrolyte flow rate of 240 mL/min.
Figure 4.
Predicted changes in the open-circuit voltage of the 426 cm2 cell with temperature obtained by circulating the electrolyte with concentrations of 1.6 M VOSO4 and 3 M H2SO4 at an electrolyte flow rate of 240 mL/min.

Figure 5.
Variations in the charging voltage along with overpotentials with the SOC for a 426 cm2 cell assembled with a 4.6 mm electrode, compressed to 35% at different temperatures and electrolytes with 1.6 M VOSO4 and 3 M H2SO4; (a) (OCV + ohmic overpotential) and 60 mA/cm2; (b) (OCV + ohmic overpotential) and 100 mA/cm2; (c) (OCV + ohmic overpotential + activation overpotential) and 60 mA/cm2; (d) (OCV + ohmic overpotential + activation overpotential) and 100 mA/cm2; (e) (OCV + ohmic overpotential + activation overpotential + concentration overpotential) and 60 mA/cm2; (f) (OCV + ohmic overpotential + activation overpotential + concentration overpotential) and 100 mA/cm2.

Figure 6.
Comparison of model and experimental data in VRFB cells of 100 cm2 [28] and 916 cm2 [29] nominal electrode area at an operating temperature of 25 °C and current density of 60 mA/cm2.

Figure 7.
Charge–discharge studies of single cell at different temperatures and a current density of 60 mA/cm2 for a cell with a nominal electrode surface area of (a) 100 cm2 and (b) 426 cm2. Data are from Praphulla [28].
Figure 7.
Charge–discharge studies of single cell at different temperatures and a current density of 60 mA/cm2 for a cell with a nominal electrode surface area of (a) 100 cm2 and (b) 426 cm2. Data are from Praphulla [28].


Figure 8.
Comparison of model predictions with experimental data of Praphulla [28] at cell temperature of −10 °C for the effect of (a) current density and (b) electrode compression on cell performance. The porosity and conductivity of 6 mm–thick SGL carbon felt electrode under compressed conditions are taken from Ghimire et al. [30].


Table 1.
Properties of the constituents of VRFBs.
| Symbol | Description | Quantity |
|---|---|---|
| Conductivity of electrode with thickness 4.6 mm | 130.1 S/m (SGL datasheet) | |
| Conductivity of membrane with thickness of 18.3 μm | 8 S/m | |
| Conductivity of graphite plate with thickness of 10 mm | 71,428 S/m (SGL datasheet) | |
| Conductivity of copper plate with thickness of 3 mm | 90,000 S/m | |
| Porosity in carbon felt, uncompressed | 0.94 (SGL datasheet) | |
| Fiber diameter of electrode | 10 μm [12] | |
| diffusivity in electrolyte at 298 K | 2.4 × 10⁻¹⁰ m2/s [15] | |
| diffusivity in electrolyte at 298 K | 2.4 × 10⁻¹⁰ m2/s [15] | |
| diffusivity in electrolyte at 298 K | 3.9 × 10⁻¹⁰ m2/s [15] | |
| diffusivity in electrolyte at 298 K | 3.9 × 10⁻¹⁰ m2/s [15] | |
| in electrolyte at 298 K | 9.3 × 10⁻⁹ m2/s [15] | |
| diffusivity in electrolyte at 298 K | 1.23 × 10⁻⁹ m2/s [15] | |
| Rate constant of reaction (1) at 298 K | 3 × 10⁻⁵ m/s (fitted) | |
| Rate constant of reaction (2) at 298 K | 2.6 × 10⁻⁶ m/s [15] |
Table 2.
Diffusivity of ions of the electrolyte at +10 °C and −10 °C.
| Ions | Diffusivities at 10 °C (m2/s) | Diffusivities at −10 °C (m2/s) |
|---|---|---|
| 1.44 × 10⁻¹⁰ | 3.72 × 10⁻¹¹ | |
| 1.44 × 10⁻¹⁰ | 3.72 × 10⁻¹¹ | |
| 2.34 × 10⁻¹⁰ | 6.04 × 10⁻¹¹ | |
| 2.34 × 10⁻¹⁰ | 6.04 × 10⁻¹¹ | |
| 5.58 × 10⁻⁹ | 1.44 × 10⁻⁹ | |
| 7.38 × 10⁻⁹ | 1.91 × 10⁻⁹ |
Table 3.
Variation of components of overpotential with current density and temperature at SOC 50%.
| Temperature | Current Density (mA/cm2) | Overpotential (mV) | |||
|---|---|---|---|---|---|
| (oC) | Ohmic | Activation-Negative | Activation-Positive | Concentration | |
| 25 | 20 | 10.4 | 25.4 | 2.2 | 2.8 |
| 40 | 20.9 | 46.4 | 4.5 | 5.7 | |
| 60 | 31.3 | 62.8 | 6.7 | 8.9 | |
| 80 | 41.7 | 75.7 | 8.9 | 12.2 | |
| 100 | 52.1 | 86.3 | 11.1 | 15.8 | |
| 10 | 20 | 14.5 | 37.7 | 3.5 | 3.1 |
| 40 | 29.1 | 63.6 | 7.0 | 6.4 | |
| 60 | 43.6 | 81.4 | 10.5 | 9.9 | |
| 80 | 58.2 | 94.7 | 13.9 | 13.8 | |
| 100 | 72.7 | 105.2 | 17.2 | 18.1 | |
| −10 | 20 | 28.5 | 54.3 | 5.7 | 4.7 |
| 40 | 57.0 | 82.6 | 11.4 | 10.0 | |
| 60 | 85.5 | 100.3 | 16.9 | 16.0 | |
| 80 | 114.0 | 113.1 | 22.1 | 23.1 | |
| 100 | 142.6 | 123.1 | 27.1 | 31.8 | |
Disclaimer/Publisher’s Note: The statements, opinions and data contained in all publications are solely those of the individual author(s) and contributor(s) and not of MDPI and/or the editor(s). MDPI and/or the editor(s) disclaim responsibility for any injury to people or property resulting from any ideas, methods, instructions or products referred to in the content. |
© 2023 by the authors. Licensee MDPI, Basel, Switzerland. This article is an open access article distributed under the terms and conditions of the Creative Commons Attribution (CC BY) license (https://creativecommons.org/licenses/by/4.0/).
Share and Cite
MDPI and ACS Style
Rao, P.; Jayanti, S. Physics-Based Electrochemical Model of Vanadium Redox Flow Battery for Low-Temperature Applications. Batteries 2023, 9, 374. https://doi.org/10.3390/batteries9070374
AMA Style
Rao P, Jayanti S. Physics-Based Electrochemical Model of Vanadium Redox Flow Battery for Low-Temperature Applications. Batteries. 2023; 9(7):374. https://doi.org/10.3390/batteries9070374
Chicago/Turabian StyleRao, Praphulla, and Sreenivas Jayanti. 2023. "Physics-Based Electrochemical Model of Vanadium Redox Flow Battery for Low-Temperature Applications" Batteries 9, no. 7: 374. https://doi.org/10.3390/batteries9070374
Note that from the first issue of 2016, this journal uses article numbers instead of page numbers. See further details here.