
Dynamic Charge Acceptance Compared to Electrochemical Impedance Spectroscopy Parameters: Dependencies on Additives, State of Charge, and Prior Usage
 , ,
, ,
Abstract
:1. Introduction
2. Experimental
2.1. Test Cell Preparation
- Leady oxide (1500 g);
- Water (194 ± 16 g, depending on water absorption of carbon);
- Diluted sulfuric acid (SD 1.4 g·cm−3, 120 g);
- Barium sulfate (12 g);
- Vanisperse (3 g);
- Carbon additive (1.0 wt% = 15 g, for CX and CY unknown).
2.2. Constant Current Discharge
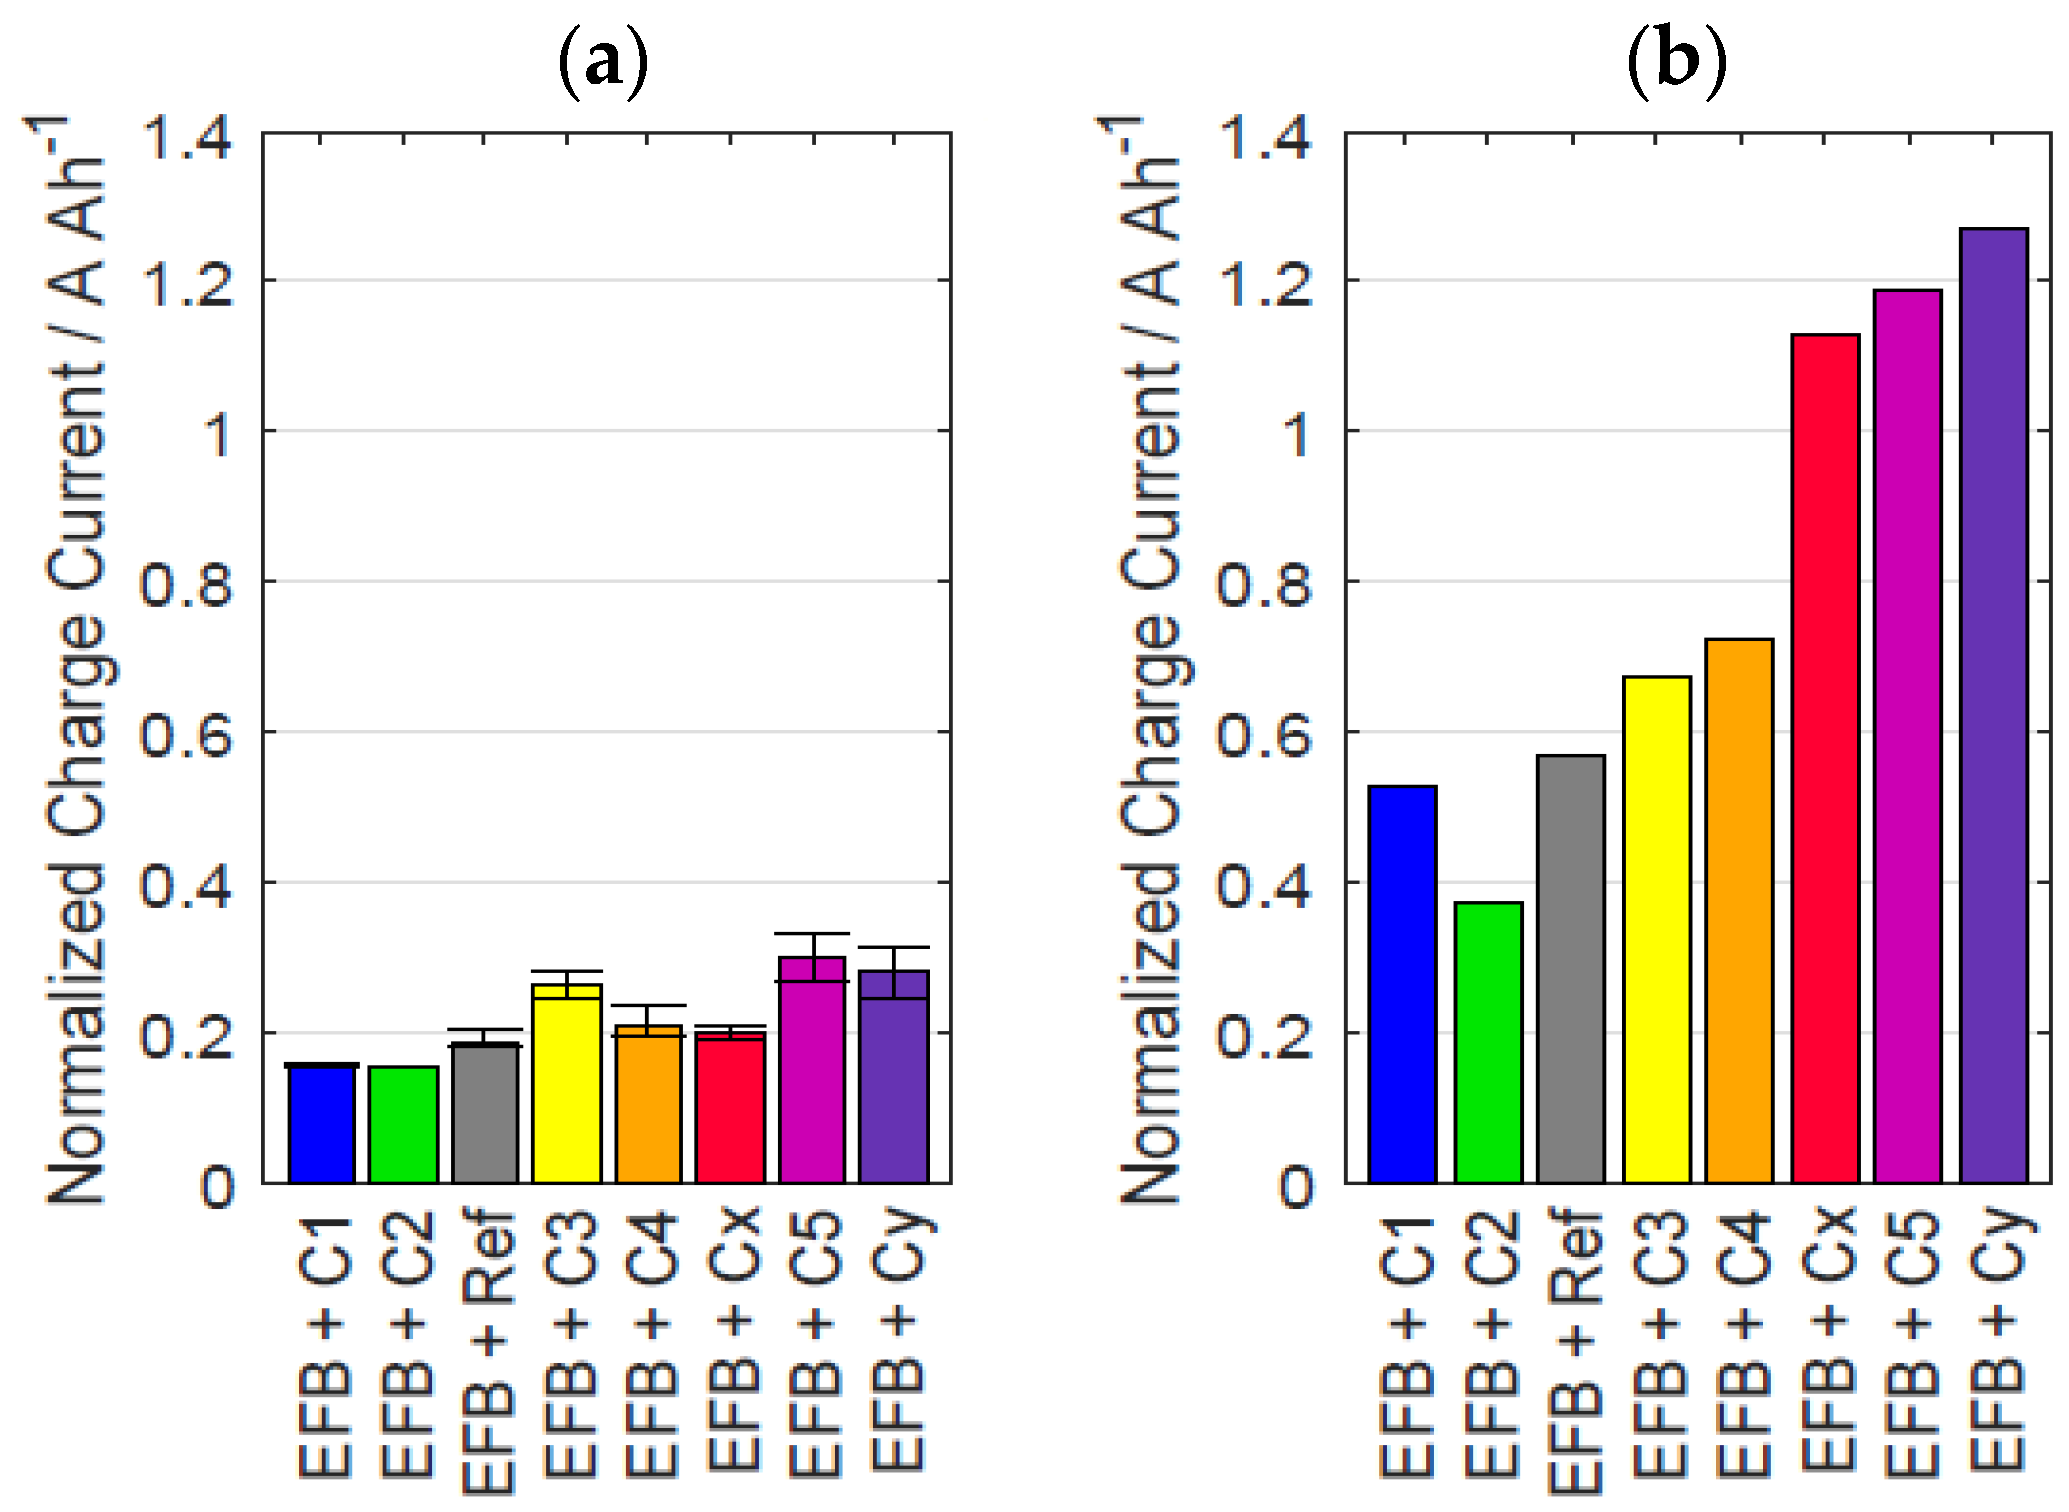
2.3. Dynamic Charge Acceptance
2.4. Test Cell Preparation for Laser Scanning Microscopy
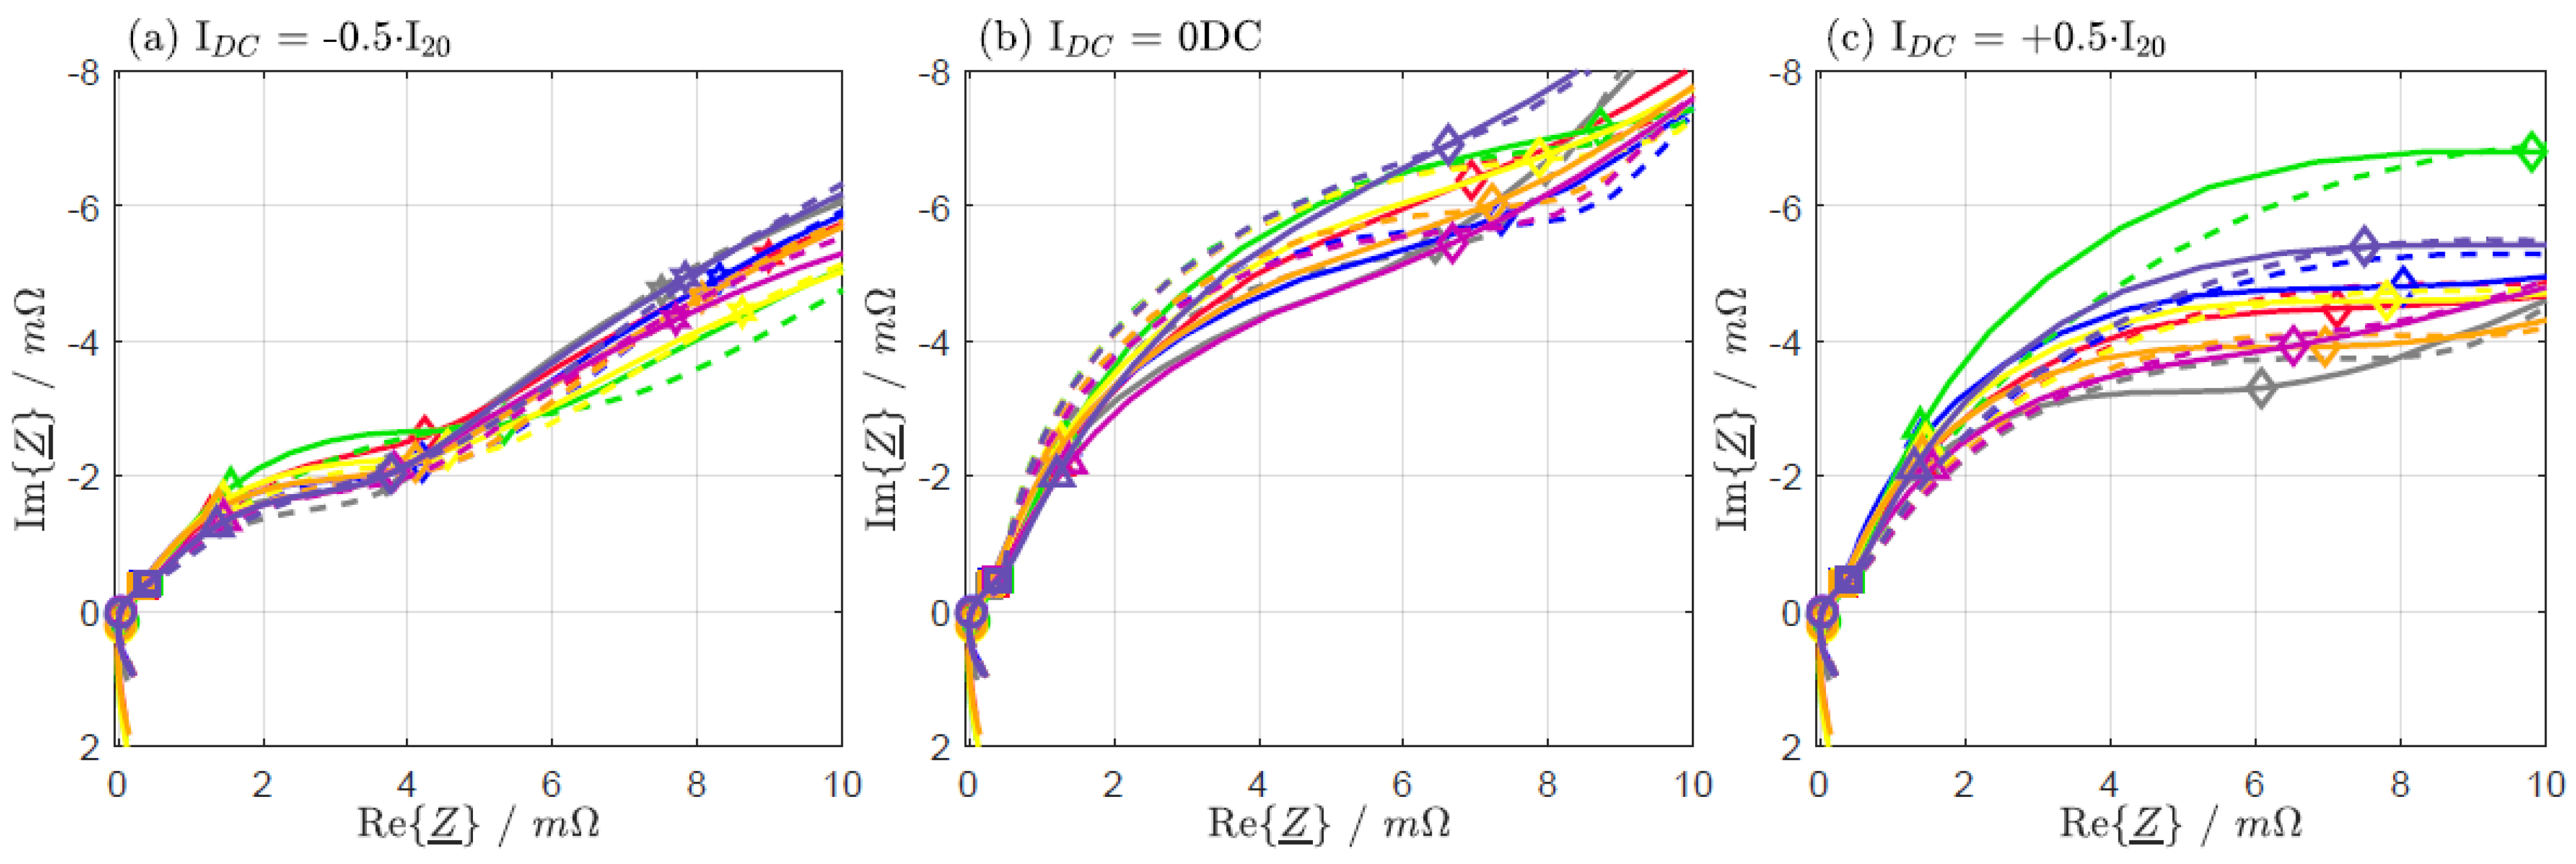
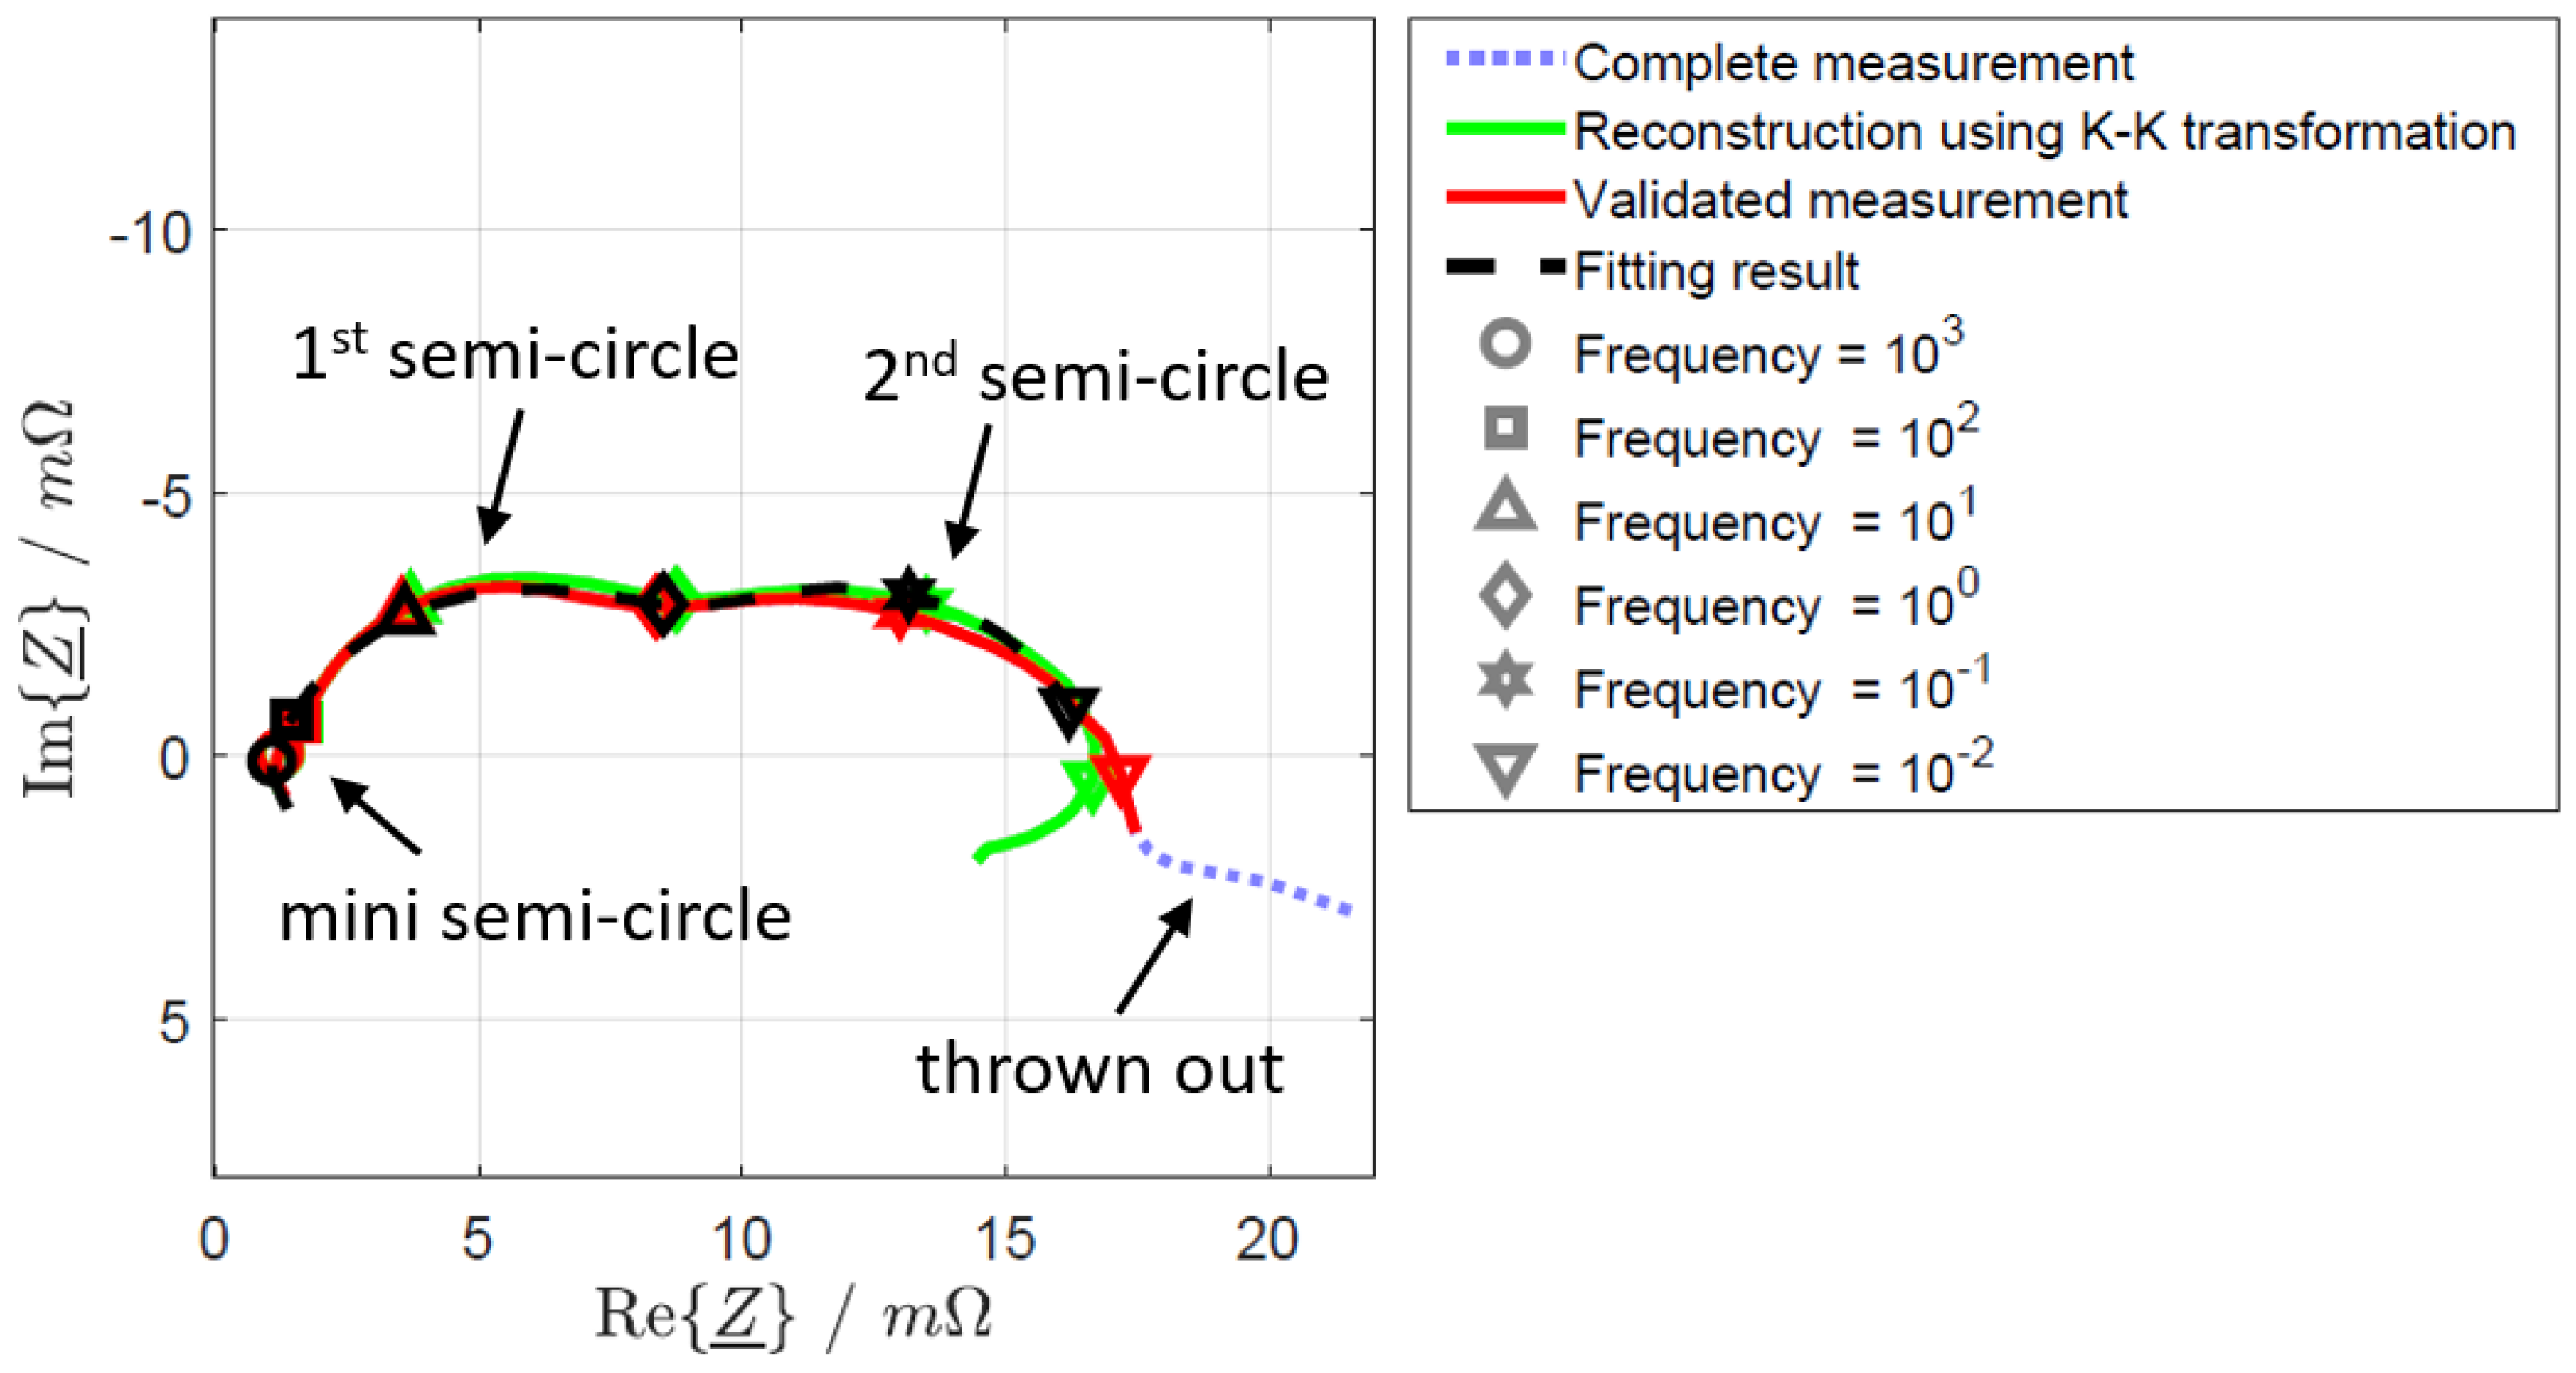
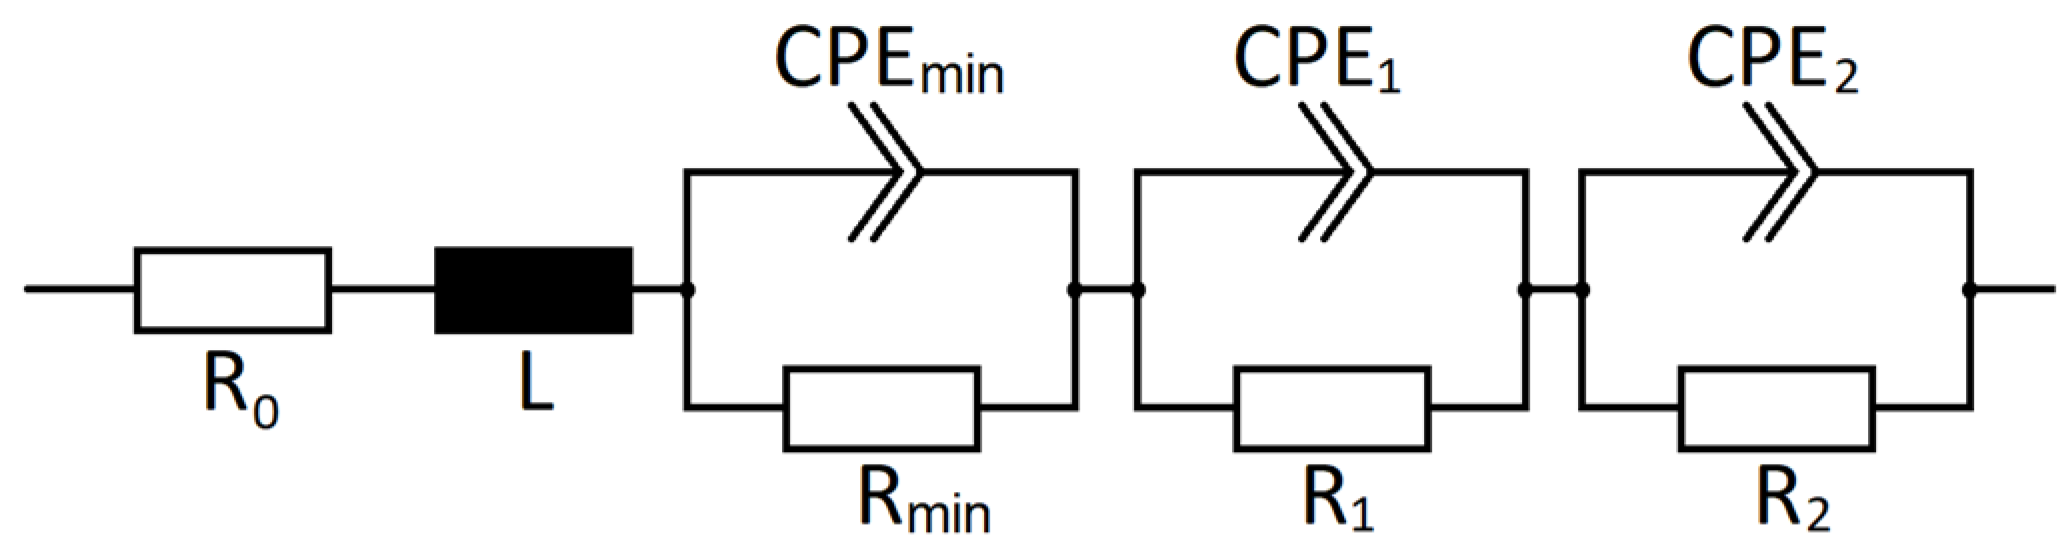
2.5. Electrochemical Impedance Spectroscopy
3. Results and Discussion
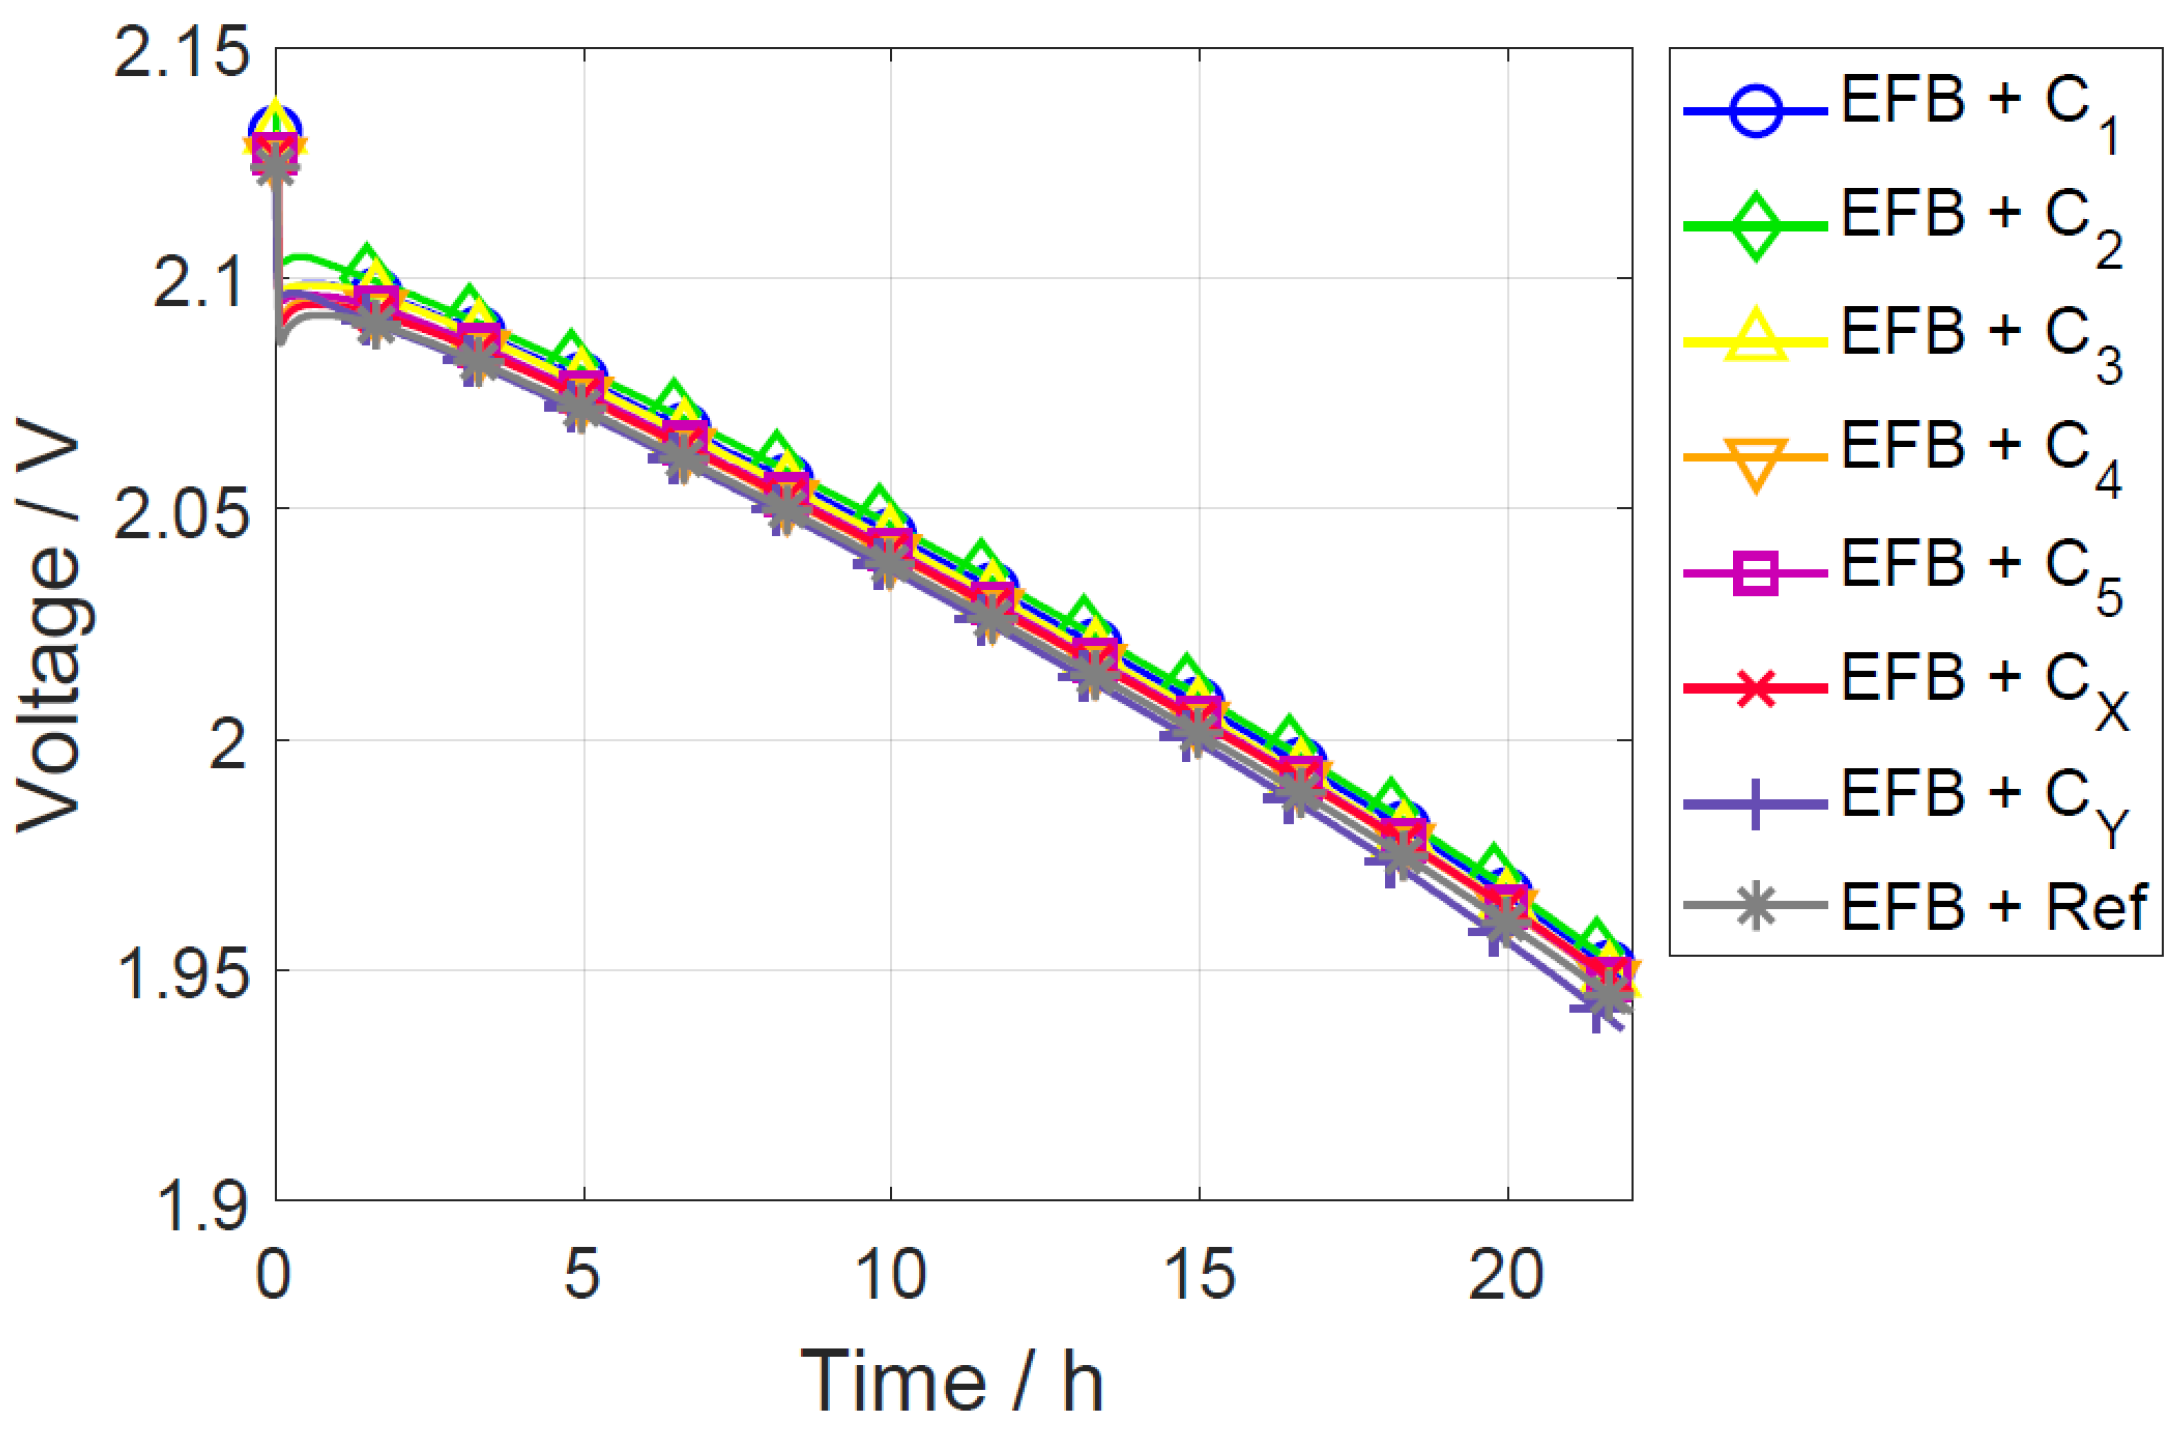
3.1. Constant Current Discharge
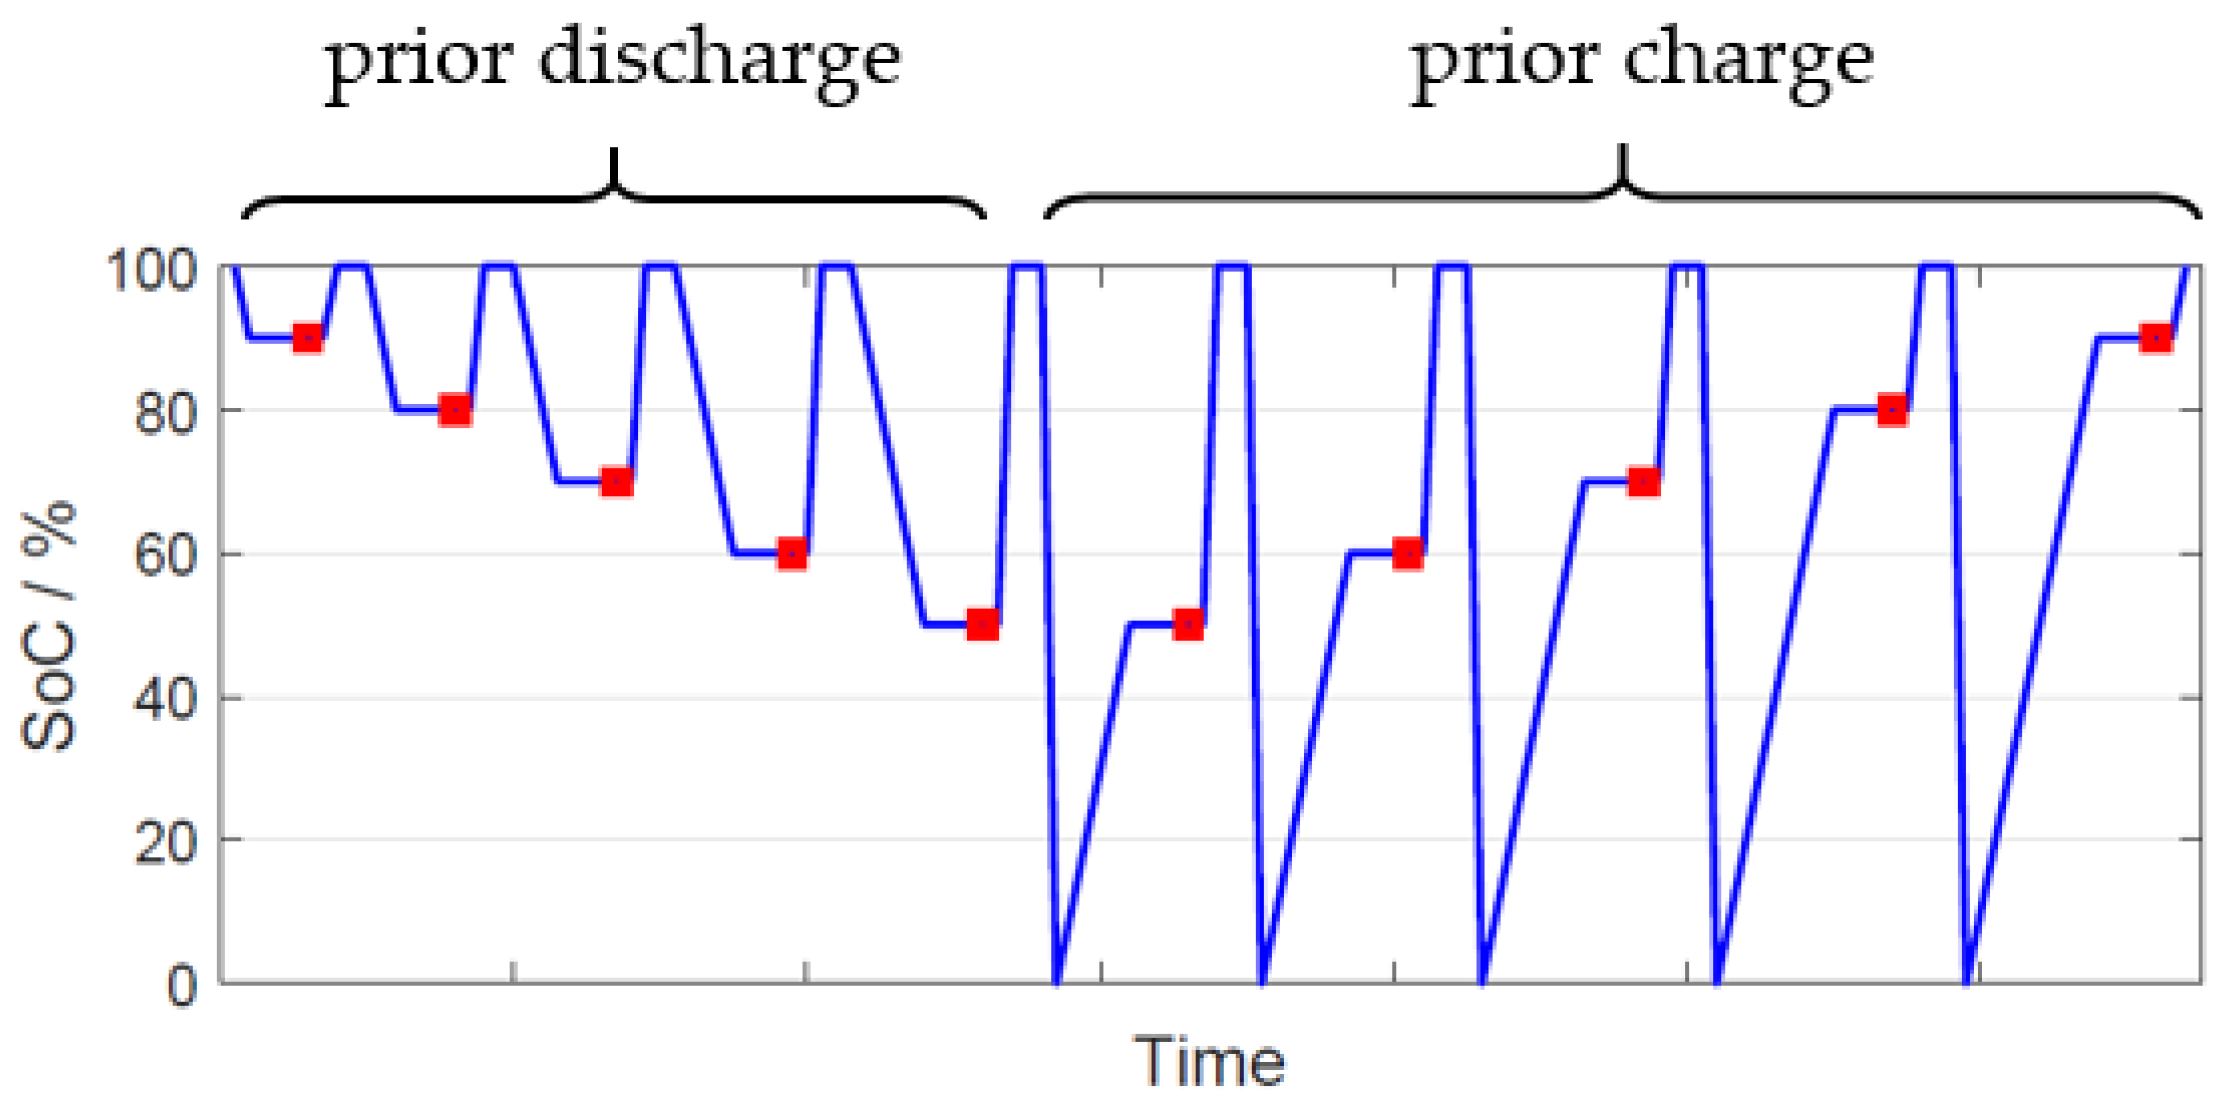
3.2. Influence of Prior Usage on DCA and EIS
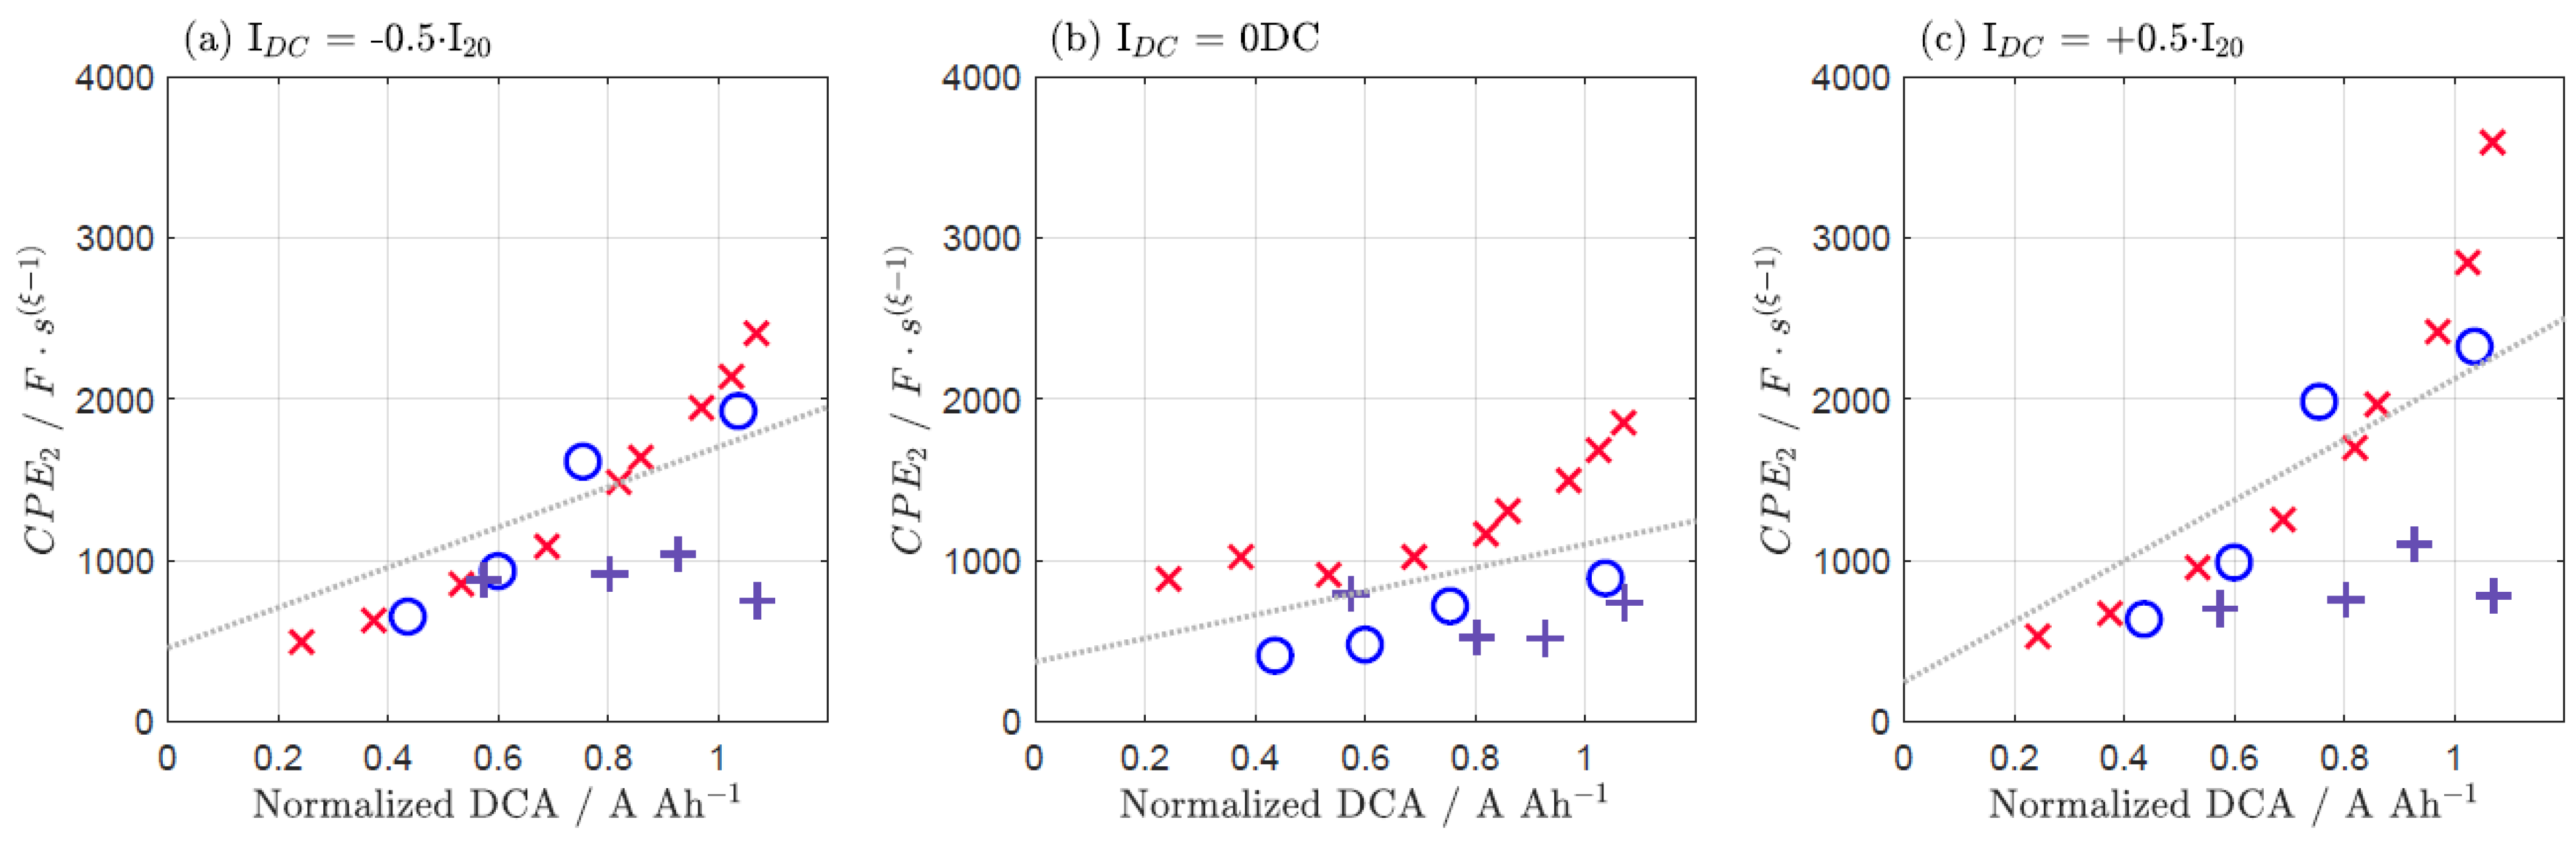
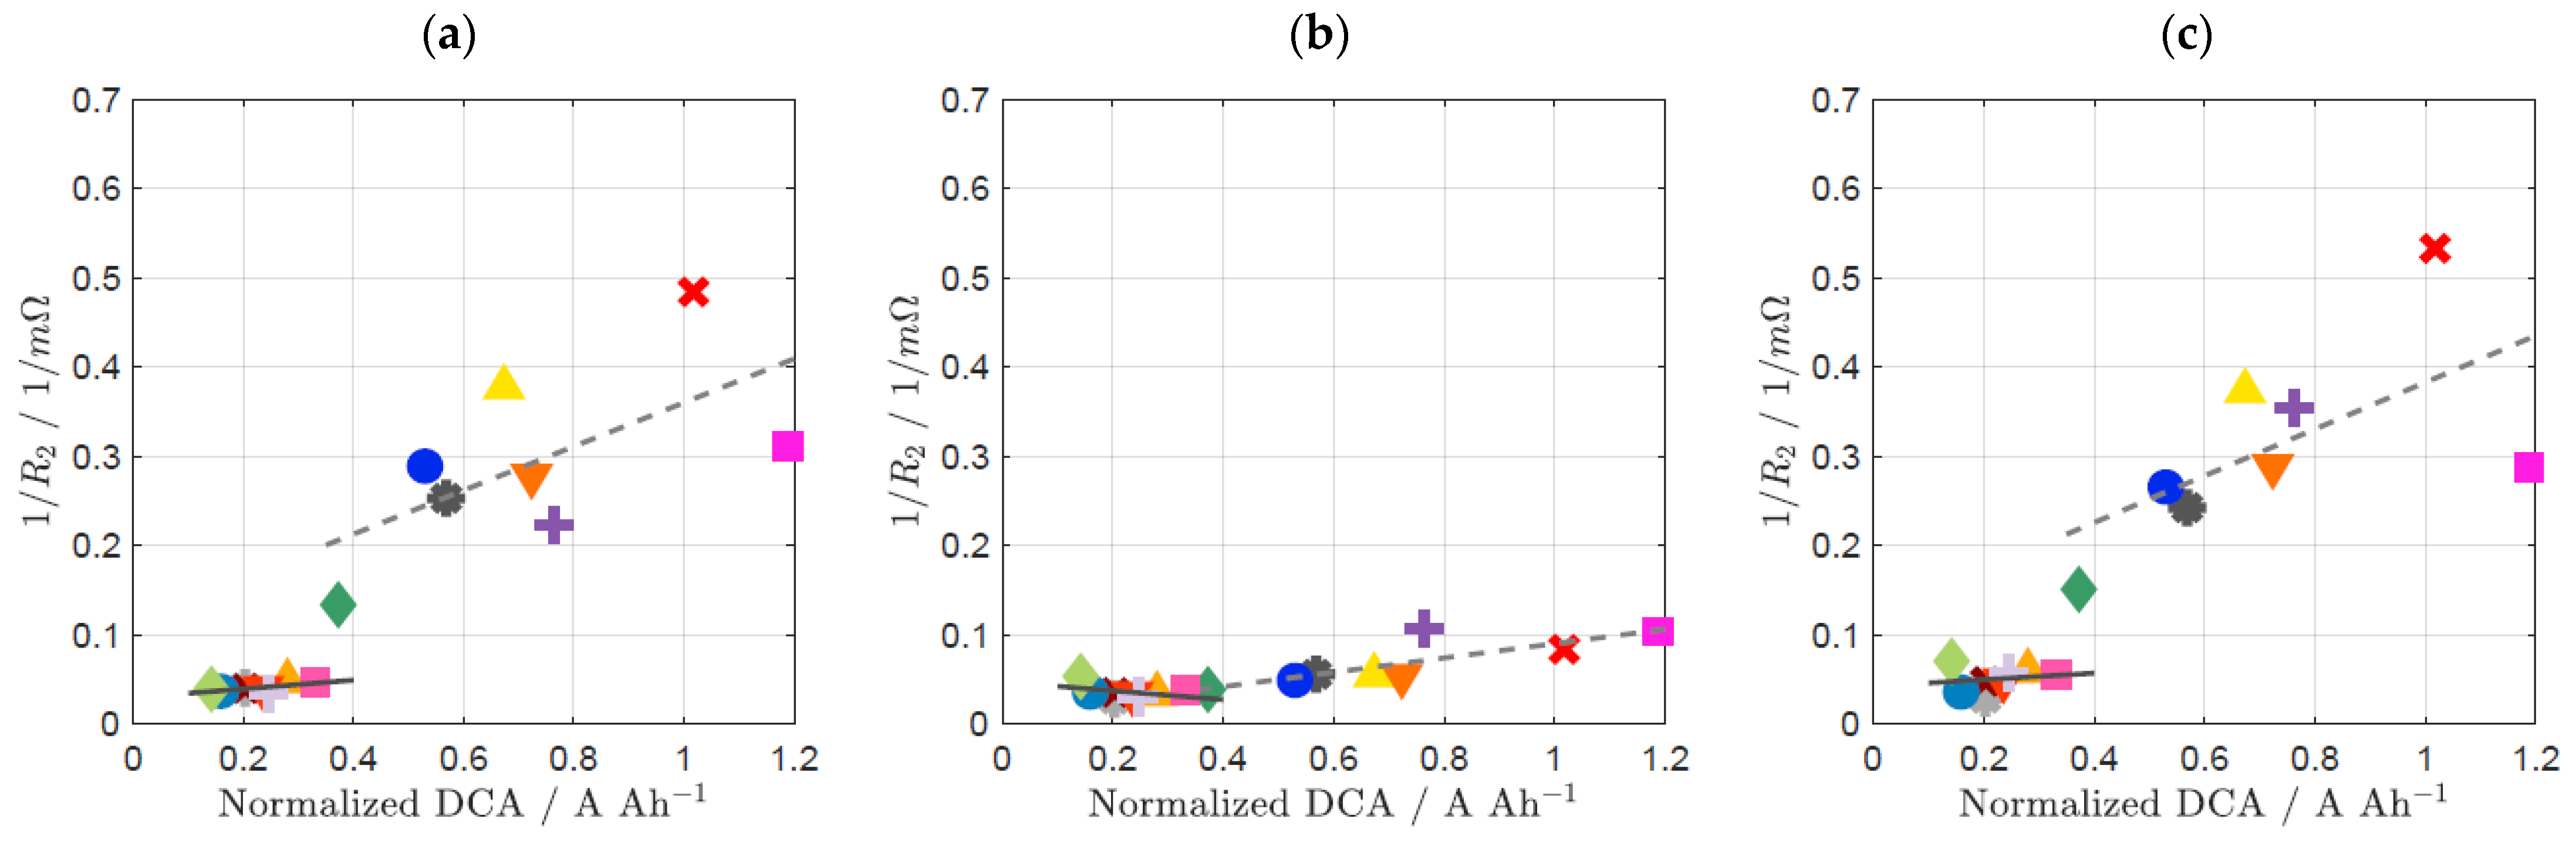
3.3. Influence of SoC on DCA and EIS
4. Conclusions
Author Contributions
Funding
Institutional Review Board Statement
Informed Consent Statement
Data Availability Statement
Acknowledgments
Conflicts of Interest
Abbreviations
| AC | alternating current | IDCA | resulting dynamic charge acceptance current |
| C20 | 20 h discharge capacity | Ir | average charge current during real-world micro cycles |
| Cn | nominal capacity | K–K | Kramers–Kronig |
| CPE | constant phase element | LAB | lead-acid battery |
| DC | direct current | LSM | laser scanning microscope |
| DCA | dynamic charge acceptance | N | negative plate |
| dpart | average particle size | NAM | negative active mass |
| DRT | distribution of relaxation times | P | positive plate |
| ECM | equivalent circuit model | PAM | positive active mass |
| EIS | electrochemical impedance spectroscopy | R | resistance |
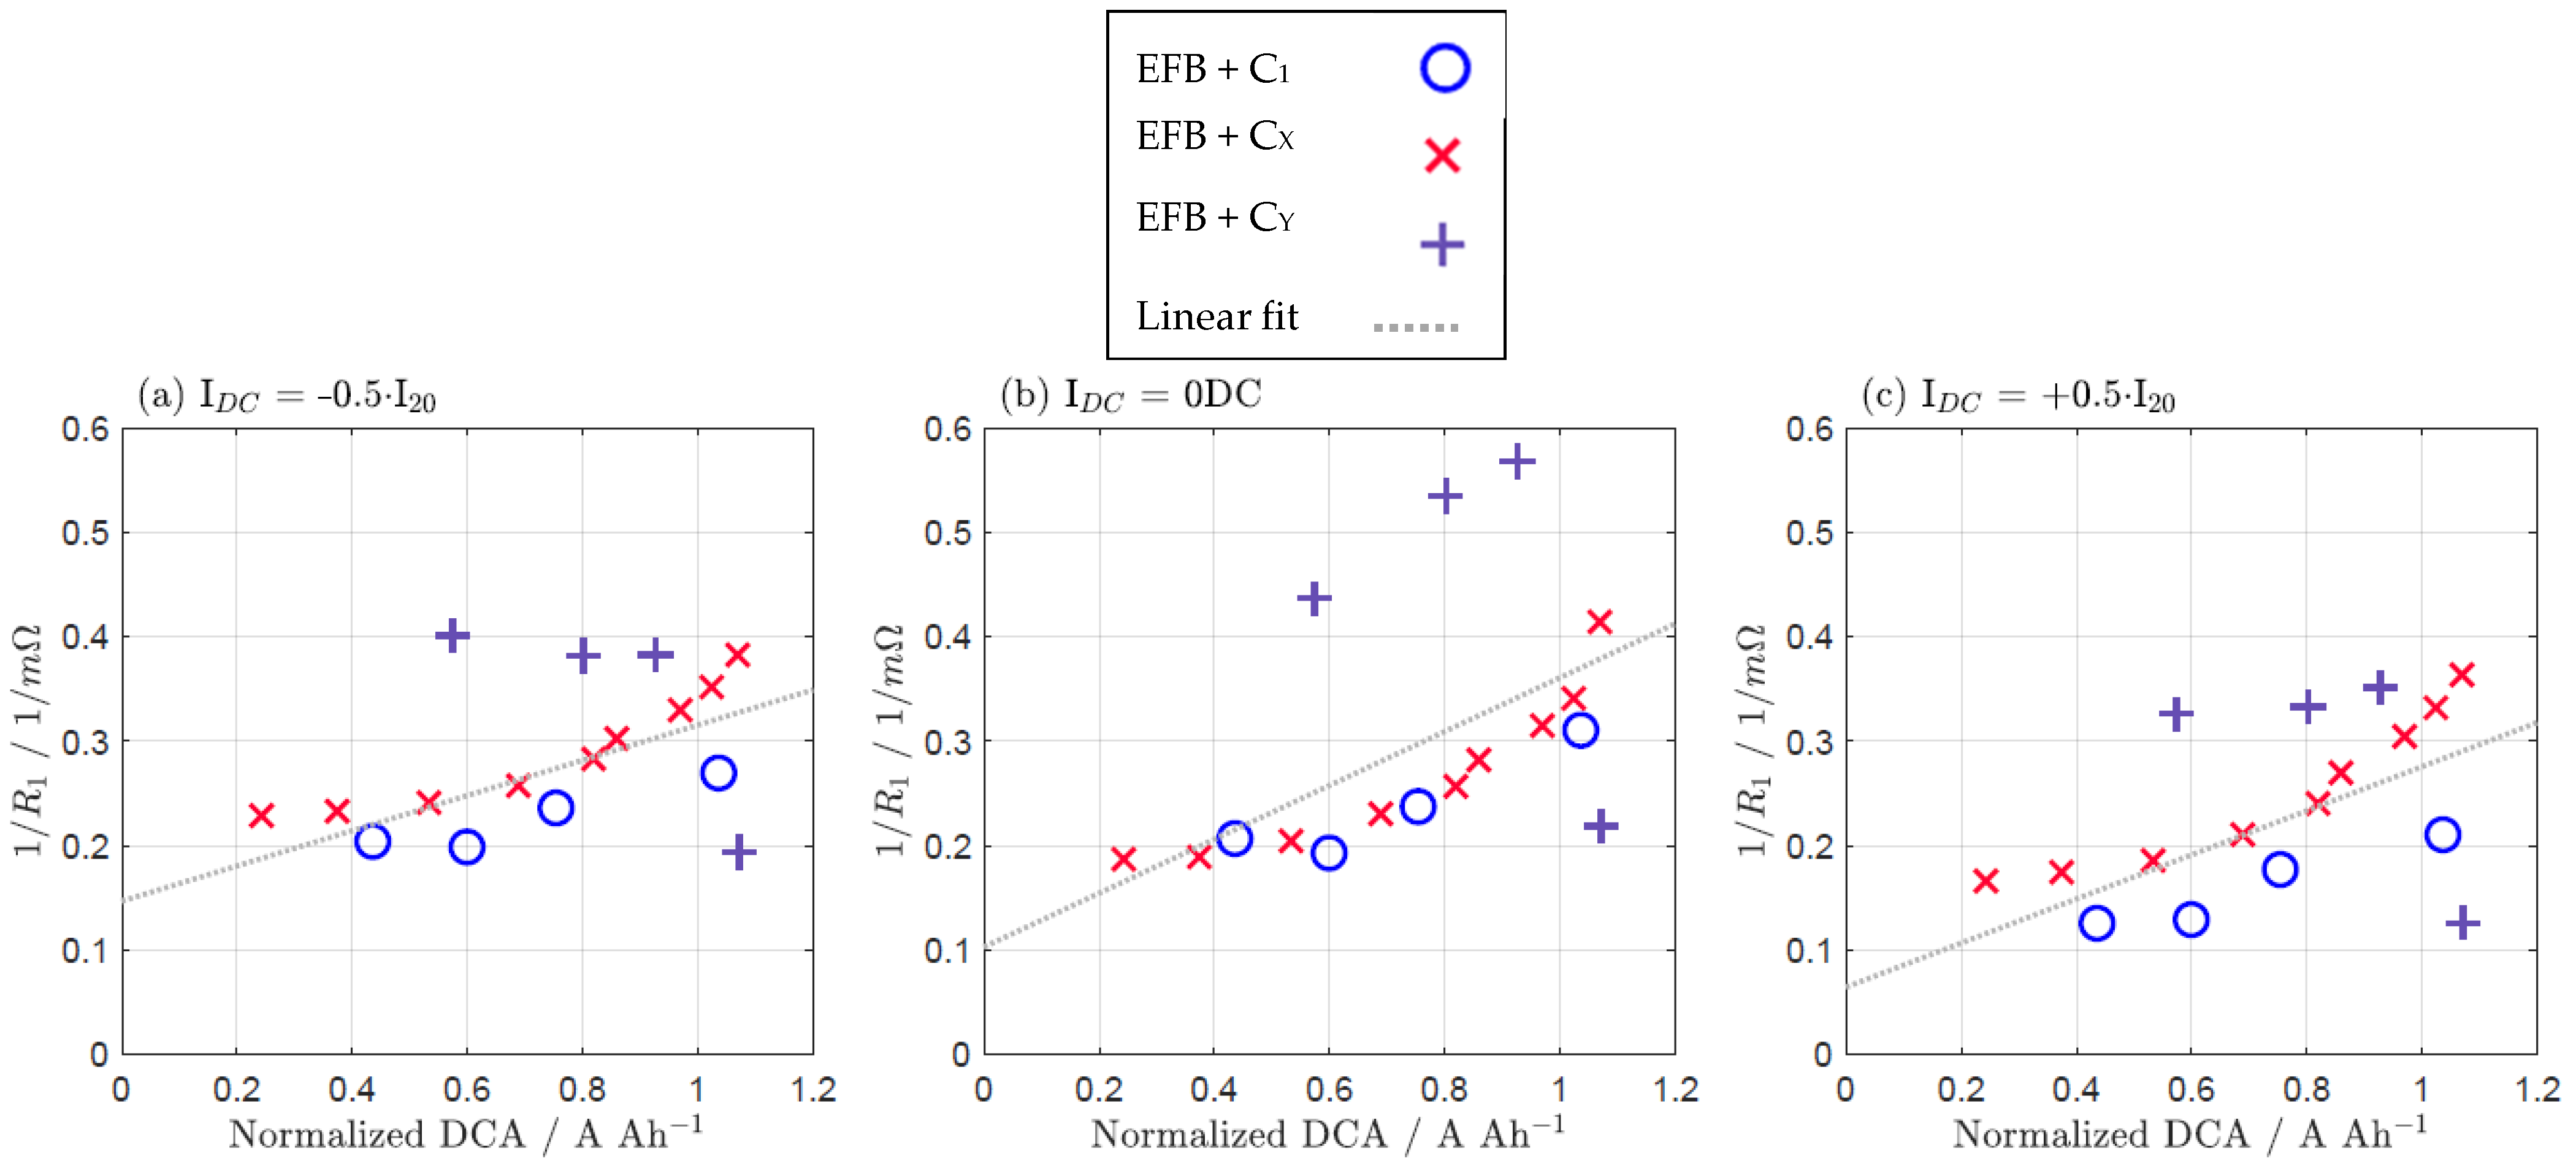
| EFB | enhanced flooded batteries | R0 | internal resistance |
| EFB + C | enhanced flooded batteries with current increasing additives | R2 | correlation coefficient |
| EN | European standard | RC | resistance-capacity |
| fmax | maximum frequency | Ref-CB | reference, carbon-black |
| fmin | minimum frequency | RH | relative humidity |
| IAC,max | maximum AC current | RSS | sum of squares of residuals |
| I20 | 20 h discharge current | SoC | state of charge |
| Ic | average charge current after prior charge | Sext | specific external surface area |
| Id | average charge current after prior discharge | T | temperature |
| IDC | DC current | TSS | total sum of squares |
| τ | time constant |
Appendix A


| IDC = −0.5·I20 | IDC = 0 DC | IDC = +0.5·I20 | |
|---|---|---|---|
| 1/R1 | 0.666 | 0.591 | 0.735 |
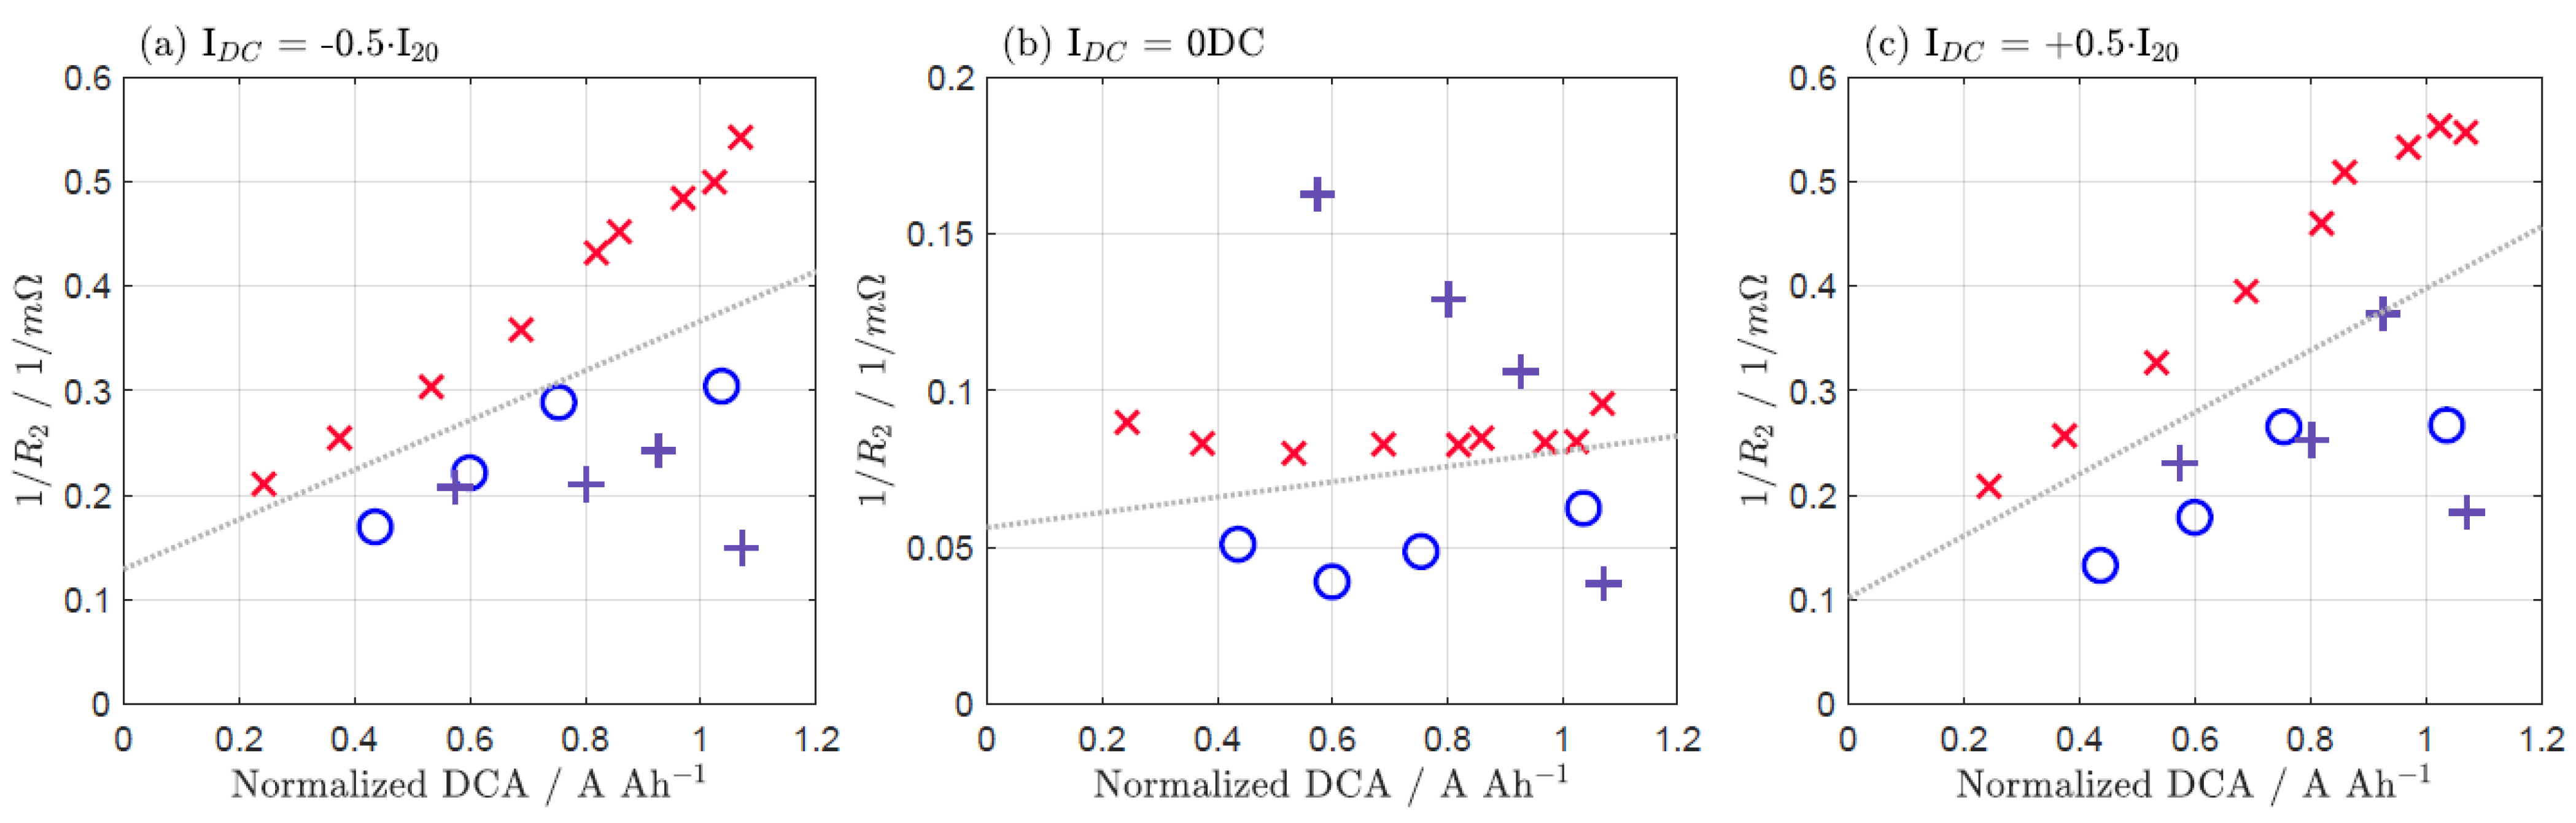
| 1/R2 | 0.449 | 0.338 | 0.650 |
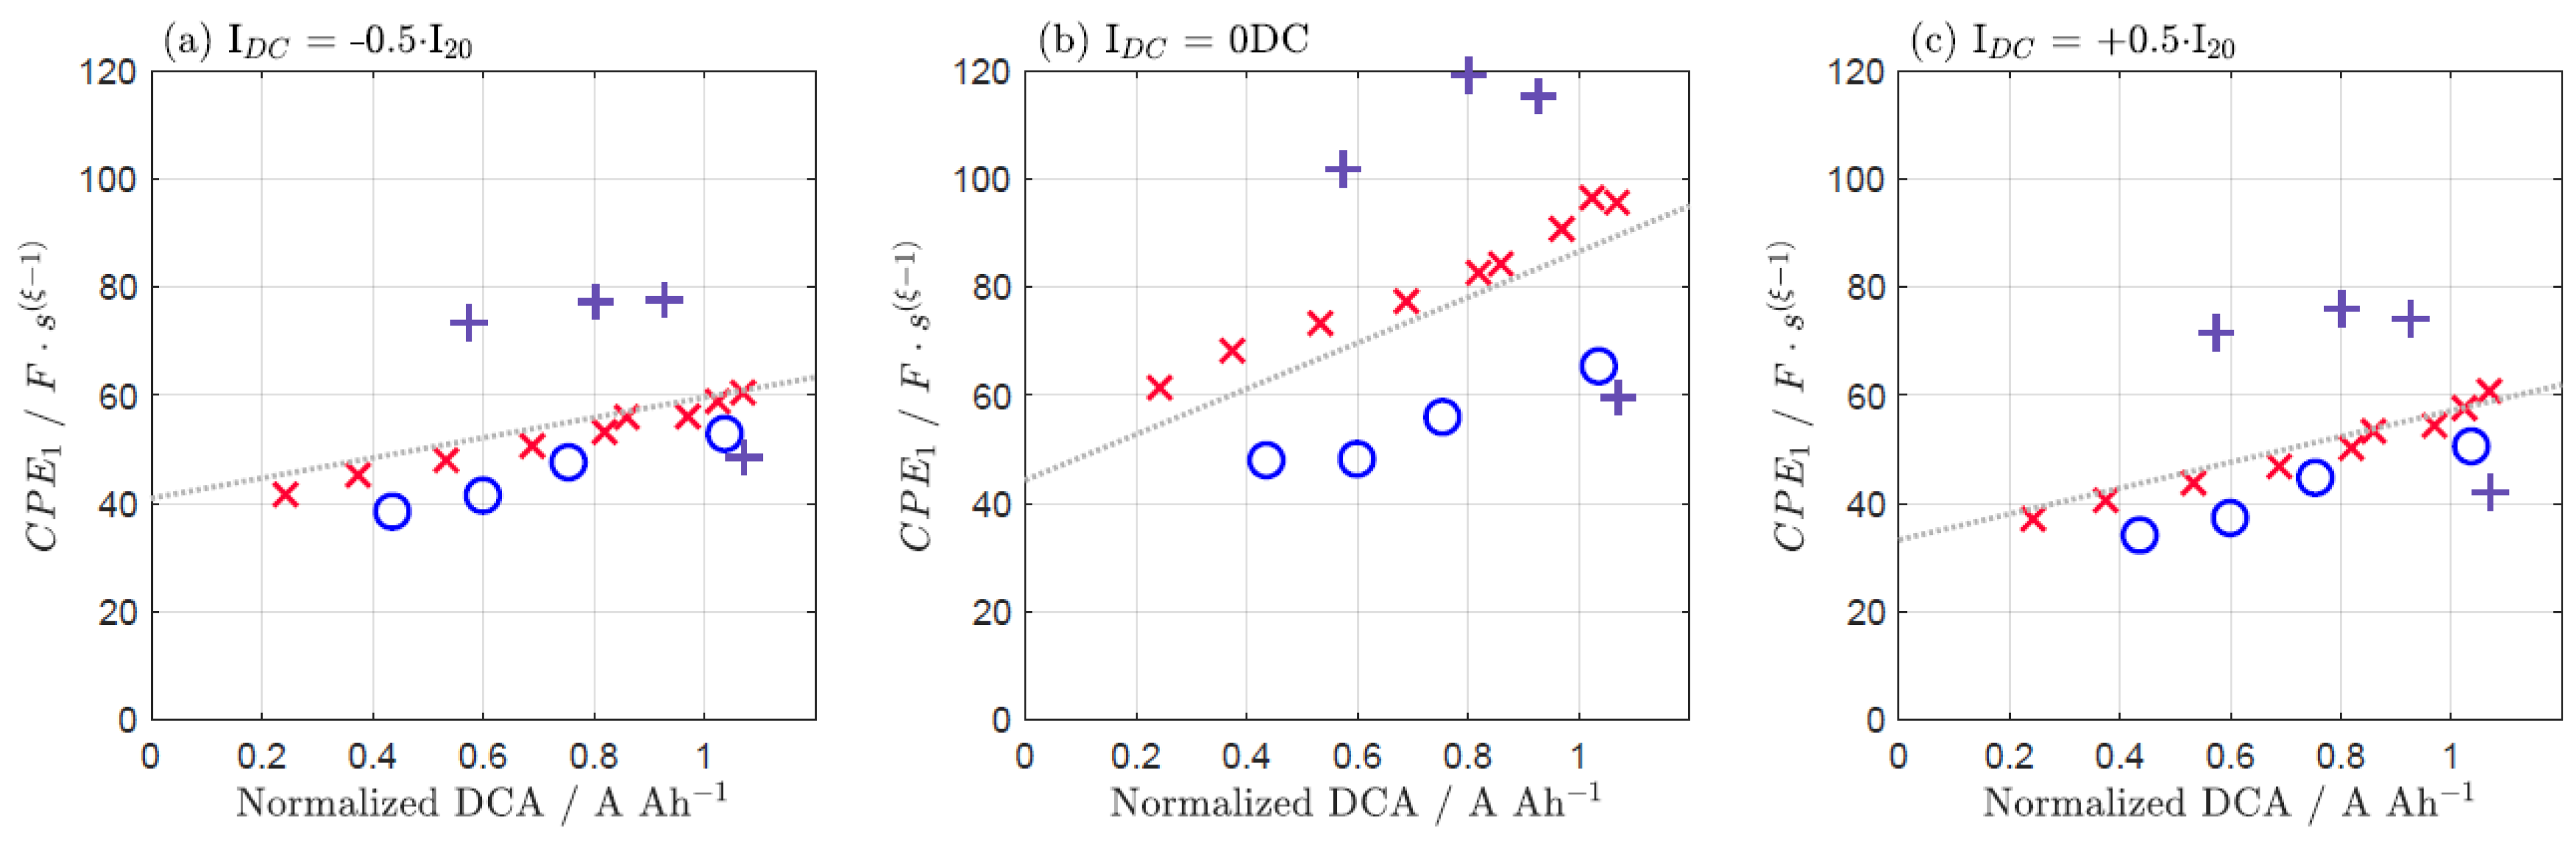
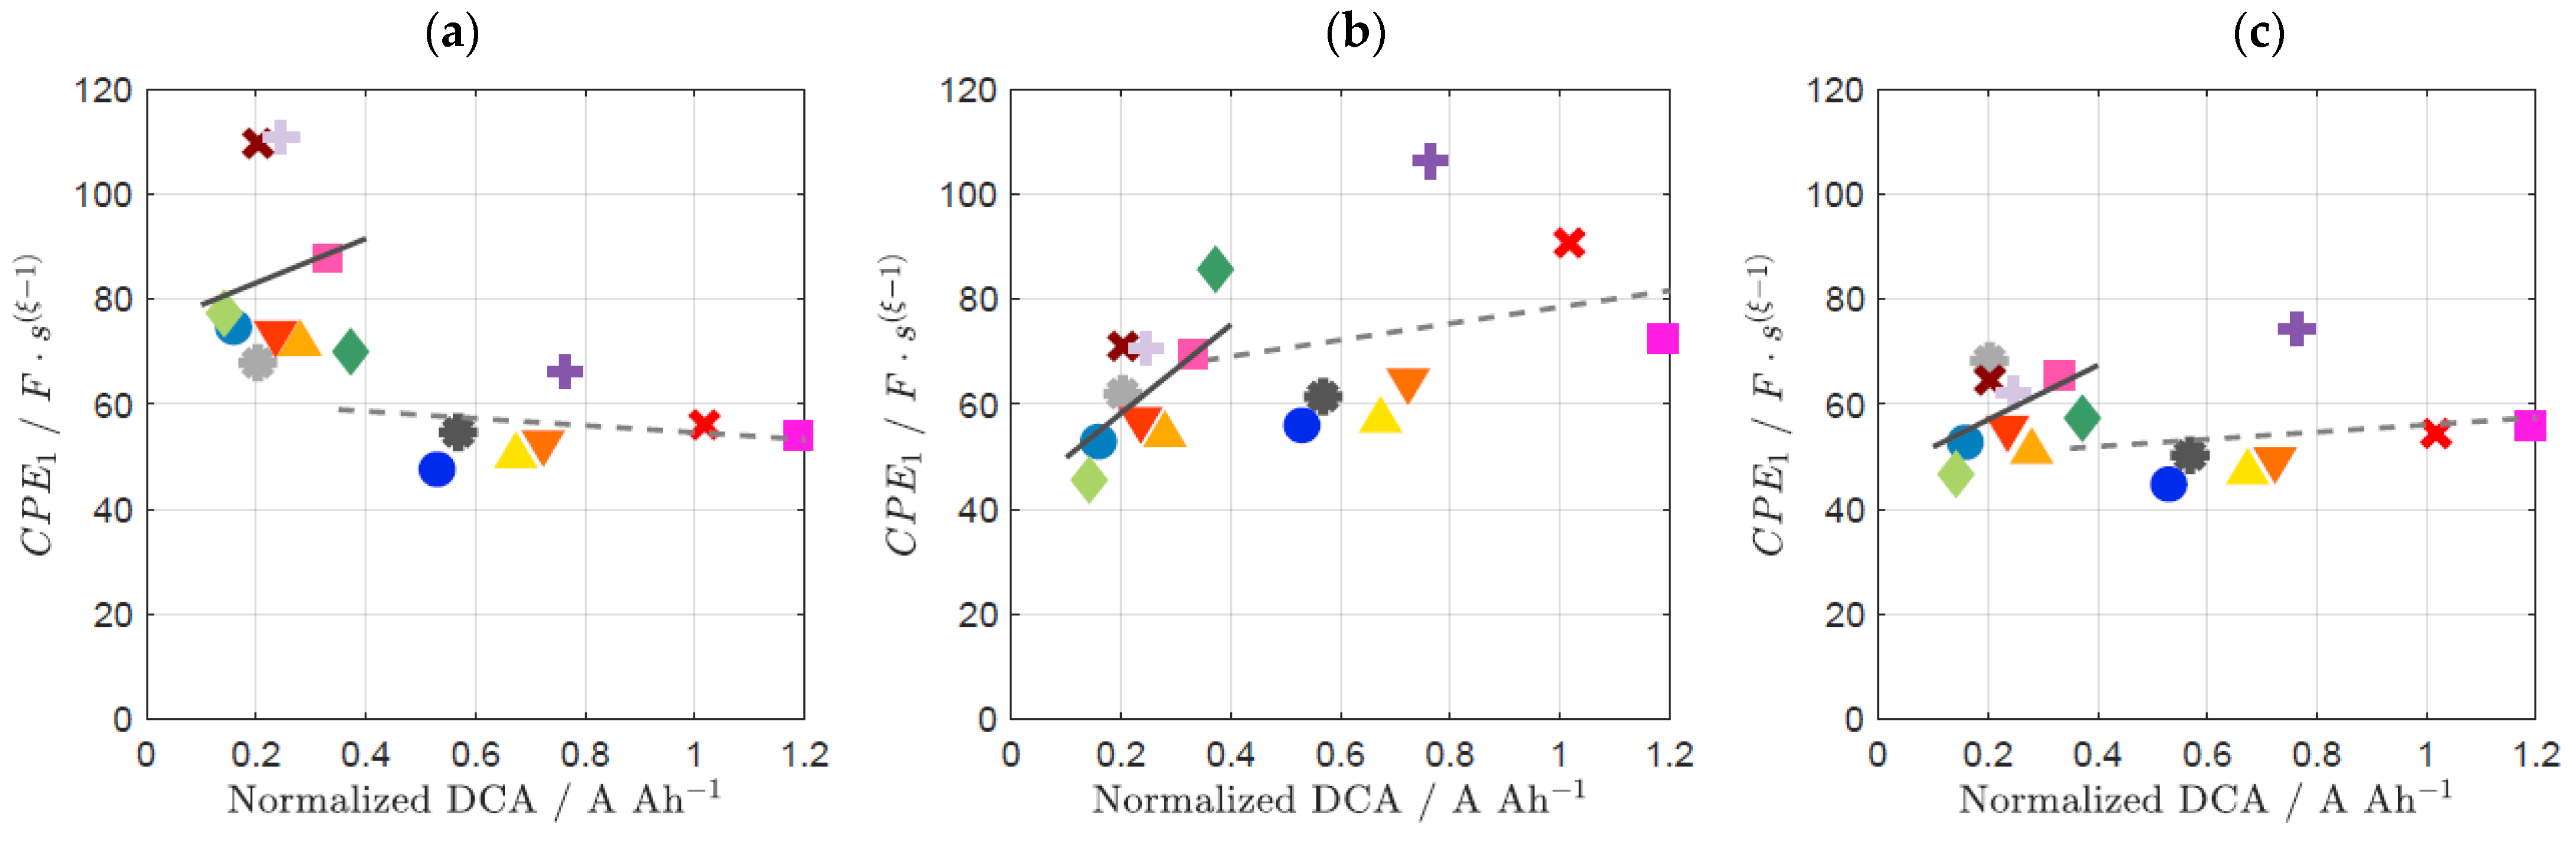
| CPE1 | 0.545 | 0.652 | 0.687 |
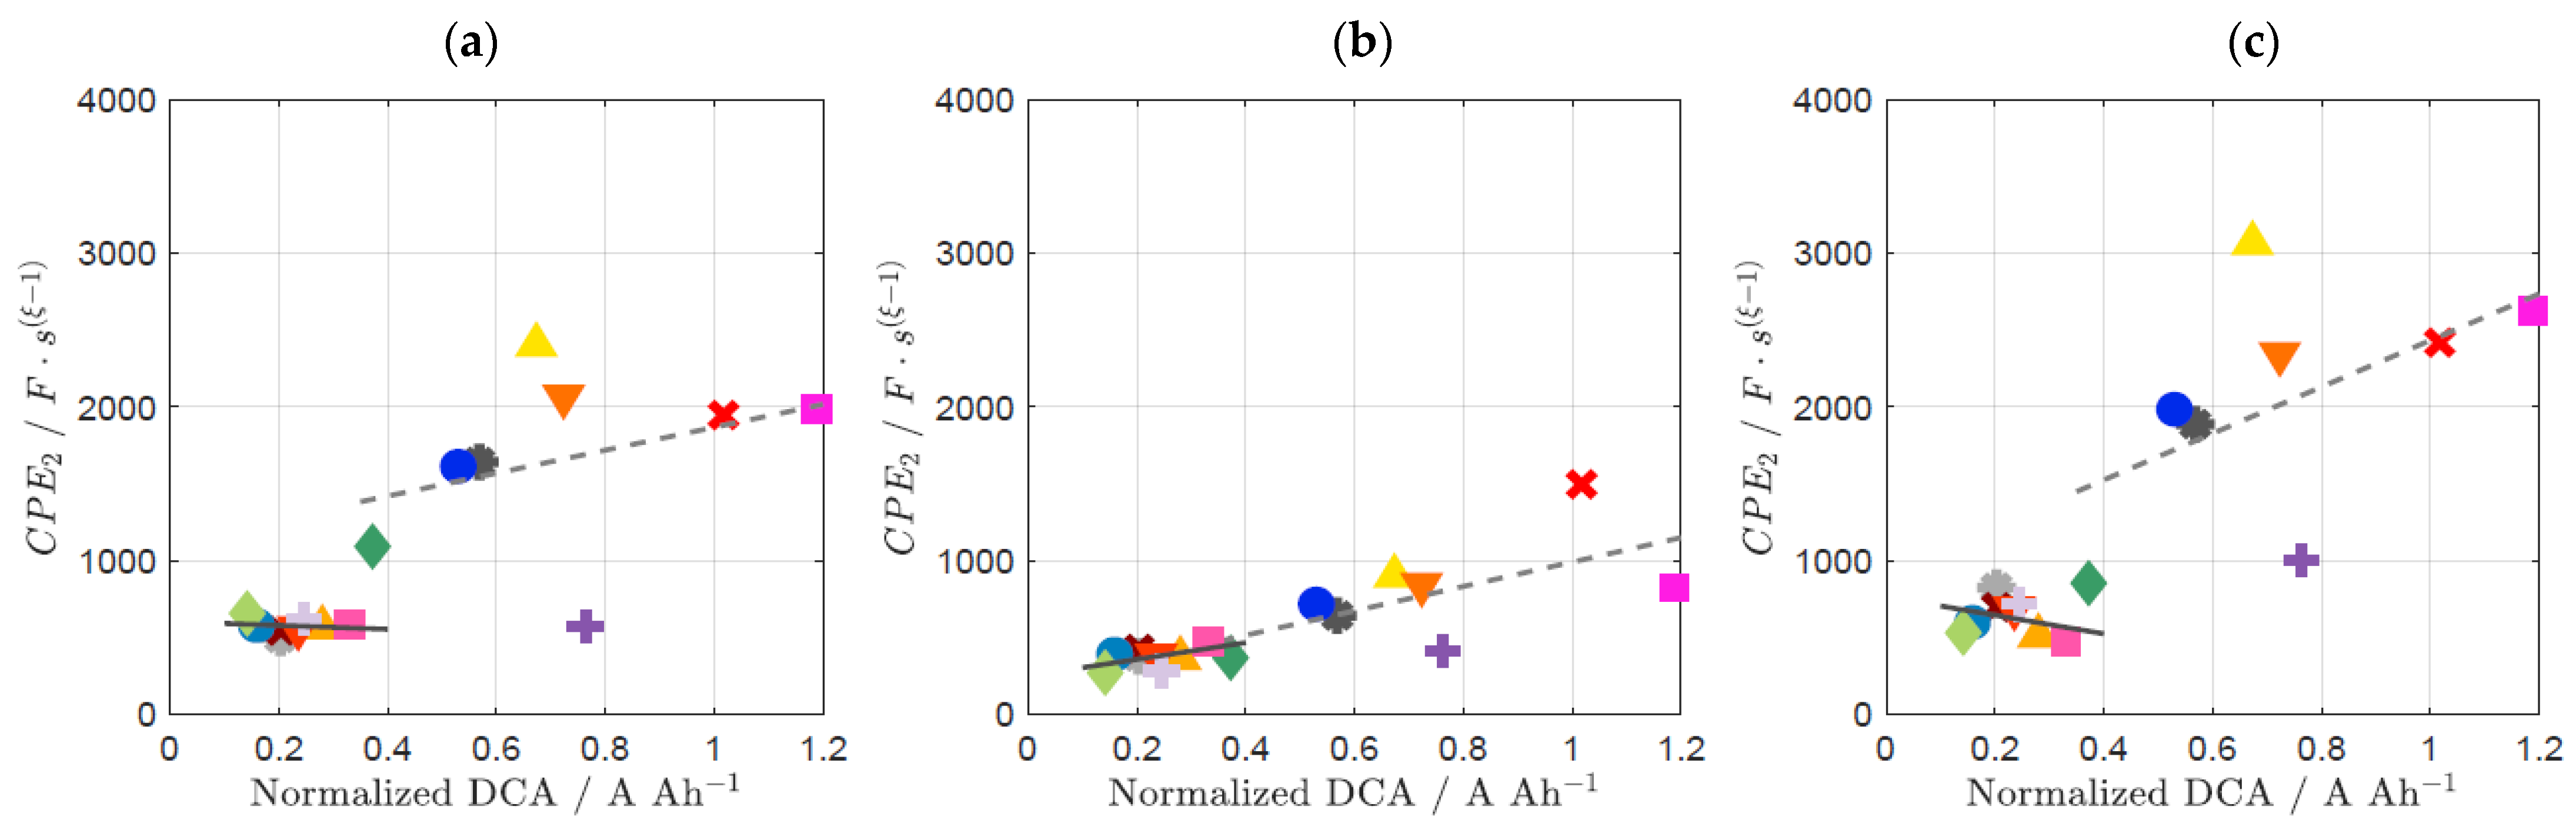
| CPE2 | 0.480 | 0.419 | 0.481 |
References and Notes
- SBA S 0101:2014; Battery Association of Japan, Lead-Acid Batteries for Vehicles with Stop and Start System. Battery Association of Japan: Tokjo, Japan, 2014.
- EN 50342-6:2015; Lead-Acid Starter Batteries—Part 6: Batteries for Micro-Cycle Applications. European Committee for Electrotechnical Standardisation: Brussels, Belgium, 2015.
- FreedomCAR Battery Test Manual for Power-Assist Hybrid Electric Vehicles; DOE/ID-11069; INEEL: Santa Clara, CA, USA, 2003.
- Karden, E.; Jöris, F.; Budde-Meiwes, H.; Sauer, D.U. Proceedings of the 13ELBC European Lead Battery Conference, Paris, France, 6–9 September 2012.
- Budde-Meiwes, H. Dynamic Charge Acceptance of Lead-Acid Batteries for Micro-Hybrid Automotive Applications. Ph.D. Thesis, RWTH Aachen University, Aachen, Germany, 2016. [Google Scholar]
- Smith, M.J.; Gladwin, D.T.; Stone, D.A. Experimental analysis of Dynamic Charge Acceptance test conditions for lead-acid and lithium iron phosphate cells. J. Energy Storage 2017, 12, 55–65. [Google Scholar] [CrossRef]
- Sauer, D.U. DCAx_results_NEDC15_2007-01-24.xls, Vorlesung Batteriespeichersysteme, RWTH Aachen, ISEA . 2007. [Google Scholar]
- Sauer, D.U.; Karden, E.; Fricke, B.; Blanke, H.; Thele, M.; Bohlen, O.; Schiffer, J.; Gerschler, J.B.; Kaiser, R. Charging performance of automotive batteries—An underestimated factor influencing lifetime and reliable battery operation. J. Power Sources 2007, 168, 22–30. [Google Scholar] [CrossRef]
- Bozkaya, B.; Bauknecht, S.; Settelein, J.; Kowal, J.; Karden, E.; Giffin, G.A. Comparison of Dynamic Charge Acceptance Tests on Lead–Acid Cells for Carbon Additive Screening. Energy Technol. 2022, 10, 2101051. [Google Scholar] [CrossRef]
- Bauknecht, S.; Kowal, J.; Bozkaya, B.; Settelein, J.; Karden, E. The Influence of Cell Size on Dynamic Charge Acceptance Tests in Laboratory Lead-Acid Cells. Energy Technol. 2022, 10, 2101053. [Google Scholar] [CrossRef]
- Pavlov, D.; Petkova, G.; Rogachev, T. Influence of H2SO4 concentration on the performance of lead-acid battery negative plates. J. Power Source 2008, 175, 586–594. [Google Scholar] [CrossRef]
- Thele, M.; Karden, E.; Surewaard, E.; Sauer, D.U. Impedance-based overcharging and gassing model for VRLA/AGM batteries. J. Power Source 2006, 158, 953–963. [Google Scholar] [CrossRef]
- Budde-Meiwes, H.; Schulte, D.; Kowal, J.; Sauer, D.U.; Hecke, R.; Karden, E. DCA of lead acid batteries comparison of methodsmfor conditioning and testing. J. Power Source 2012, 207, 30–36. [Google Scholar] [CrossRef]
- Schaeck, S.; Stoermer, A.; Albers, J.; Weirather-Koestner, D.; Kabza, H. Lead-acid batteries in micro-hybrid applications. Part II. Test proposal. J. Power Source 2011, 196, 1555–1560. [Google Scholar] [CrossRef]
- Moseley, P.T.; Rand, D.A. Partial State-of-Charge Duty: A Challenge but Not a Show-Stopper for Lead-Acid Batteries! Electrochem. Soc. 2012, 41, 3–16. [Google Scholar] [CrossRef]
- Moseley, P.T. Consequences of including carbon in the negative plates of Valve-regulated Lead-Acid batteries exposed to high-rate partial-state-of-charge operation. J. Power Sources 2009, 191, 134–138. [Google Scholar] [CrossRef]
- Pavlov, D.; Rogachev, T.; Nikolov, P.; Petkova, G. Mechanism of action of electrochemically active carbons on the processes that take place at the negative plates of lead-acid batteries. J. Power Sources 2009, 191, 58–75. [Google Scholar] [CrossRef]
- Pavlov, D.; Nikolov, P. Capacitive carbon and electrochemical lead electrode systems at the negative plates of lead-acid batteries and elementary processes on cycling. J. Power Sources 2013, 242, 380–399. [Google Scholar] [CrossRef]
- Pavlov, D.; Nikolov, P.; Rogachev, T. Influence of expander components on the processes at the negative plates of lead-acid cells on high-rate partial-state-of-charge cycling. Part II. Effects of carbon additives on the processes of charge and discharge of negative plates. J. Power Sources 2010, 195, 4444–4457. [Google Scholar] [CrossRef]
- Calábek, M.; Micka, K.; Krivák, P.; Baca, P. Significance of carbon additive in negative lead-acid battery electrodes. J. Power Sources 2006, 158, 864–867. [Google Scholar] [CrossRef]
- Bauknecht, S.; Kowal, K.; Bozkaya, B.; Settelein, J.; Karden, E. Electrochemical Impedance Spectroscopy as an Analytical Tool for the Prediction of the Dynamic Charge Acceptance of Lead-Acid Batteries. Batteries 2022, 8, 66. [Google Scholar] [CrossRef]
- Bavarian Center for Applied Energy Research (ZAE Bayern). Magdalene-Schoch-Strasse 3, 97074 Würzburg, Germany. Available online: https://www.zae-bayern.de/ (accessed on 1 February 2023).
- Scherdel, C.; Scherb, T.; Reichenauer, G. Spherical porous carbon particles derived from suspensions and sediments of resorcinol-formaldehyde particles. Carbon 2009, 47, 2244–2252. [Google Scholar] [CrossRef]
- Settelein, J.; Oehm, J.; Bozkaya, B.; Leicht, H.; Wiener, M.; Reichenauer, G.; Sextl, G. The external surface area of carbon additives as key to enhance the dynamic charge acceptance of lead-carbon electrodes. J. Energy Storage 2018, 15, 196–204. [Google Scholar] [CrossRef]
- Bauknecht, S.; Kowal, J.; Bozkaya, B.; Settelein, J.; Karden, E. The effects of cell configuration and scaling factors on constant current discharge and dynamic charge acceptance in lead-acid batteries. J. Energy Storage 2022, 45, 103667. [Google Scholar] [CrossRef]
- EN 50342-1 (VDE 0510-101:2019-05); Lead-Acid Starter Batteries—Part 1: General Requirements and Methods of Test. European Committee for Electrotechnical Standardisation: Brussels, Belgium, 2019.
- Karden, E.; Buller, S.; De Doncker, R.W. A method for measurement and interpretation of impedance spectra for industrial batteries. J. Power Sources 2000, 85, 72–78. [Google Scholar] [CrossRef]
- Kramers, H.A. Die Dispersion und Absorption von Röntgenstrahlen. Phys. Z 1929, 30, 522–523. [Google Scholar]
- Kronig, R.D.L. On the theory of dispersion of X-rays. J. Opt. Soc. Am. 1926, 12, 547–557. [Google Scholar] [CrossRef]
- Danzer, M.A. Generalized Distribution of Relaxation Times Analysis for the Characterization of Impedance Spectra. Batteries 2019, 5, 53. [Google Scholar] [CrossRef]
- Schmidt, J.P.; Chrobak, T.; Ender, M.; Illig, J.; Klotz, D.; Ivers-Tiffée, E. Studies on LiFePO4 as cathode material using impedance spectroscopy. J. Power Sources 2011, 196, 5342–5348. [Google Scholar] [CrossRef]
- Meissner, E. NAM Classics: Is low DCA caused by Ostwald Ripening? DCA and Heat Workshop 17–19 November. 2020. [Google Scholar]


| Material ID | Sext of Carbon | dpart |
|---|---|---|
| EFB + C1 | 7.1 m² g−1 | 633 nm |
| EFB + C2 | 20.3 m² g−1 | 221 nm |
| EFB + C3 | 50.4 m² g−1 | 88 nm |
| EFB + C4 | 92.1 m² g−1 | 48 nm |
| EFB + C5 | 159.3 m² g−1 | 27 nm |
| EFB + CX | - | - |
| EFB + CY | - | - |
| EFB + Ref | 28 m² g−1 | 104 nm |
| Test Sequence | Batch 1 | Batch 2 | Batch 3 |
|---|---|---|---|
| C20 | X | X | X |
| Single-pulse CA | X | X | |
| Ic at 80% SoC | X | X | X |
| Id at 90% SoC | X | X | X |
| Ir at 80% SoC | X | X | X |
| Id at 80% SoC | X | ||
| LSM pictures | X | X | |
| EIS | X |
| Parameter | Value |
|---|---|
| IDC | 0 A, ±0.5·I20, ±1·I20, ±2·I20 and ±4·I20 |
| investigated SoC | 50% till 90% SoC in 5% steps |
| investigated history | prior charge and discharge |
| IAC,max | 0.5 A |
| fmin | 10 mHz |
| fmax | 6.5 kHz |
| number of measurement points | 8 frequencies per decade |
| T | 25 °C |
| Δ SoC | ±2.5% |
| Prior charge at 80% SoC | Prior discharge at 80% SoC | ||||
| EFB + CX | EFB + CY | EFB + CX | EFB + CY | ||
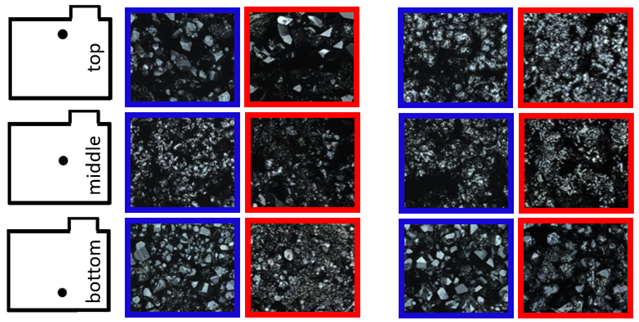 | |||||
 | |||||
| IDC = −0.5·I20 | IDC = 0 DC | IDC = +0.5·I20 | ||
|---|---|---|---|---|
| Ic at 80% SoC | 1/R1 | 0.386 | 0.105 | 0.660 |
| 1/R2 | 0.641 | −0.347 | 0.225 | |
| CPE1 | −0.036 | 0.524 | 0.435 | |
| CPE2 | 0.105 | 0.344 | 0.366 | |
| Id at 80% SoC | 1/R1 | 0.706 | 0.499 | 0.876 |
| 1/R2 | 0.624 | 0.812 | 0.622 | |
| CPE1 | −0.230 | 0.228 | 0.198 | |
| CPE2 | 0.337 | 0.600 | 0.521 |
| Complete Correlation Coefficient | Correlation Coefficient of EFB + C1 | Correlation Coefficient of EFB + CX | Correlation Coefficient of EFB + CY | |
|---|---|---|---|---|
| 1/R1 | 0.730 | 0.996 | 0.944 | 0.986 |
| 1/R2 | 0.731 | 0.878 | 0.994 | 0.972 |
| CPE1 | 0.636 | 0.975 | 0.987 | 0.417 |
| CPE2 | 0.735 | 0.900 | 0.939 | 0.956 |
Disclaimer/Publisher’s Note: The statements, opinions and data contained in all publications are solely those of the individual author(s) and contributor(s) and not of MDPI and/or the editor(s). MDPI and/or the editor(s) disclaim responsibility for any injury to people or property resulting from any ideas, methods, instructions or products referred to in the content. |
© 2023 by the authors. Licensee MDPI, Basel, Switzerland. This article is an open access article distributed under the terms and conditions of the Creative Commons Attribution (CC BY) license (https://creativecommons.org/licenses/by/4.0/).
Share and Cite
Bauknecht, S.; Kowal, J.; Settelein, J.; Föhlisch, M.; Karden, E. Dynamic Charge Acceptance Compared to Electrochemical Impedance Spectroscopy Parameters: Dependencies on Additives, State of Charge, and Prior Usage. Batteries 2023, 9, 263. https://doi.org/10.3390/batteries9050263
Bauknecht S, Kowal J, Settelein J, Föhlisch M, Karden E. Dynamic Charge Acceptance Compared to Electrochemical Impedance Spectroscopy Parameters: Dependencies on Additives, State of Charge, and Prior Usage. Batteries. 2023; 9(5):263. https://doi.org/10.3390/batteries9050263
Chicago/Turabian StyleBauknecht, Sophia, Julia Kowal, Jochen Settelein, Markus Föhlisch, and Eckhard Karden. 2023. "Dynamic Charge Acceptance Compared to Electrochemical Impedance Spectroscopy Parameters: Dependencies on Additives, State of Charge, and Prior Usage" Batteries 9, no. 5: 263. https://doi.org/10.3390/batteries9050263