Article

Electrochemical Impedance Spectroscopy as an Analytical Tool for the Prediction of the Dynamic Charge Acceptance of Lead-Acid Batteries

1
Electrical Energy Storage Technology, Technische Universität Berlin, 10587 Berlin, Germany
2
Consortium for Battery Innovation, 120 New Cavendish Street, London W1W 6XX, UK
3
Fraunhofer Institute for Silicate Research ISC, Neunerplatz 2, 97082 Würzburg, Germany
4
Advanced Power Supply & Energy Management, Ford Research & Innovation Center Aachen, 52072 Aachen, Germany
*
Authors to whom correspondence should be addressed.
Batteries 2022, 8(7), 66; https://doi.org/10.3390/batteries8070066
Submission received: 31 May 2022 / Revised: 24 June 2022 / Accepted: 28 June 2022 / Published: 5 July 2022
(This article belongs to the Section Battery Modelling, Simulation, Management and Application)

Abstract

:
The subject of this study is test cells extracted from industrially manufactured automotive batteries. Each test cell either had a full set of plates or a reduced, negative-limited set of plates. With these test cells the predictability of the dynamic charge acceptance (DCA) by using electrochemical impedance spectroscopy (EIS) is investigated. Thereby, the DCA was performed according to EN 50342-6:2015 standard. The micro cycling approach was used for the EIS measurements to disregard any influencing factors from previous usage. During the evaluation, Kramers-Kronig (K-K) was used to avoid systematic errors caused by violations of the stationarity, time-invariance or linearity. Furthermore, the analysis of the distribution of relaxation times (DRT) was used to identify a usable equivalent circuit model (ECM) and starting values for the parameter prediction. For all cell types and layouts, the resistance R1, the parameter indicating the size of the first/high-frequency semicircle, is smaller for cells with higher DCA. According to the literature, this semicircle represents the charge transfer reaction, thus confirming that current-enhancing additives may decrease the pore diameter of the negative electrode.

1. Introduction

Electrochemical impedance spectroscopy (EIS) is used to identify electrochemical processes and to characterize materials or devices [1]. The first studies on battery impedance were made in the 1940s with a limited frequency range [2] since only analog measurement technologies were used at the time. The AC resistance is still used to estimate the state of charge (SoC) and state of health (SoH) of lead-acid batteries [3,4]. By increasing the frequency range, the capacitive behavior of the impedance could also be used to estimate SoC [5], SoH [6].
Until the end of the last century, no monitoring of starting lighting and ignition (SLI) batteries existed. Indeed, it was not necessary, as the battery was considered only as an energy buffer used for starting the vehicle. However, there has been an increase in both the number of loads installed and the maximum power required, an automatic start/stop function and a brake energy regeneration system have been implemented, and many safety-related functionalities have been introduced [7]. Currently, the enhanced flooded battery (EFB) is used as the standard for SLI in automotive applications. To meet continuously growing demands, a significantly improved dynamic charge acceptance (DCA) of up to 2 A/Ah over the complete battery life is unavoidable [8]. In this context the DCA has been defined as the ability of a battery or cell to absorb high-rate charge pulses during micro cycling operation within a partial state-of-charge (PSoC). However, automotive batteries are operated at high SoCs, with the DCA of EFBs only accepting 1 A/Ah in new condition, and often less than 0.5 A/Ah after several months in service [9,10]. It has been shown that innovative negative electrode technologies, such as carbon additives or organic expanders in the negative active material (NAM), allow for up to three times more stabilized DCA after several months in operation [10]. Additives substantially influence the structure of porous active materials [11]. Moreover, they influence the processing of the electrodes. Within the context of this work, the symbol EFB − C is used to designate a classic EFB with normal DCA, whereas the symbol EFB + C is only used for EFBs that include additional current-enhancing additives.
Screening active materials with different additive combinations is a time-consuming task and is mainly performed in small test cells that allow for a high sample throughput. For this task, the EN 50342-6:2015, attempting to forecast the DCA in real applications with reasonable but not perfect correlation [12], can be used. However, several weeks of cell testing for material screening is challenging. The processes that limit DCA, as well as the mechanisms by which various additives achieve substantially higher DCA, are not fully understood yet. However, they might be visualized via EIS. Using EIS with a wide frequency range for non-destructive cell-level monitoring can show the electrochemical processes and serve as a basis for dynamic battery models. Thus, EIS has been identified as one of the most promising alternative tools for predicting battery behavior and condition, e.g., for SoC and SoH prediction [5,6,13,14].
Within this work, the experimental implementation of the EIS and its evaluation, using Kramers-Kronig (K-K) transformation and the distribution of relaxation times (DRT) is presented to determine the starting parameters of the fitting with an equivalent circuit model (ECM). The fitting results and the parameters obtained from the fitting are compared with the DCA results to find a conclusive correlation. This way, EIS measurements can be used as a technique to predict a high or low DCA for test cells.

2. Experimental

2.1. Laboratory Test Cells

Within this work, commercial EFB 12 V, 70 Ah batteries were used to separate three test cells out of one battery [15]. Therefore, the plastic case of every other cell needed to be cut. The cost on straps of the current collectors of the sacrificed cells were kept intact to use them as terminals for the retained test cells. Two of the test cells needed to be opened to reduce the number of plates (3P2N and 2P1N), while one cell was left complete. The excess space within the 3P2N and 2P1N test cell was refilled with spacers to avoid acid overage. The goal of this cutting procedure was to enable the investigation of size and symmetry effects without the eventuality of additional cost effects of handmade plates. A complete cell contains either 8 positive and 9 negative plates (8P9N) or 8 plates each (8P8N). The complete cell were compared with smaller cell setups, such as 3P2N and 2P1N, as they would typically be used in material investigation. Since the focus of this work is to investigate the processes influenced by additives in the NAM, the negative plates will be the limiting element in the cell setup.
Two different battery types were evaluated: For the first type, one version with a conventional NAM recipe (Type 1 EFB − C) was tested as a reference in comparison to a second version with enhanced DCA, but otherwise identical components (e.g., positive electrodes), manufactured the same day on the same equipment (Type 1 EFB + C). For the other battery design, only versions with enhanced DCA were studied (Type 2 EFB + C). The plate count and the nominal capacity for the three cell sizes of both test cell types are given in Table 1.

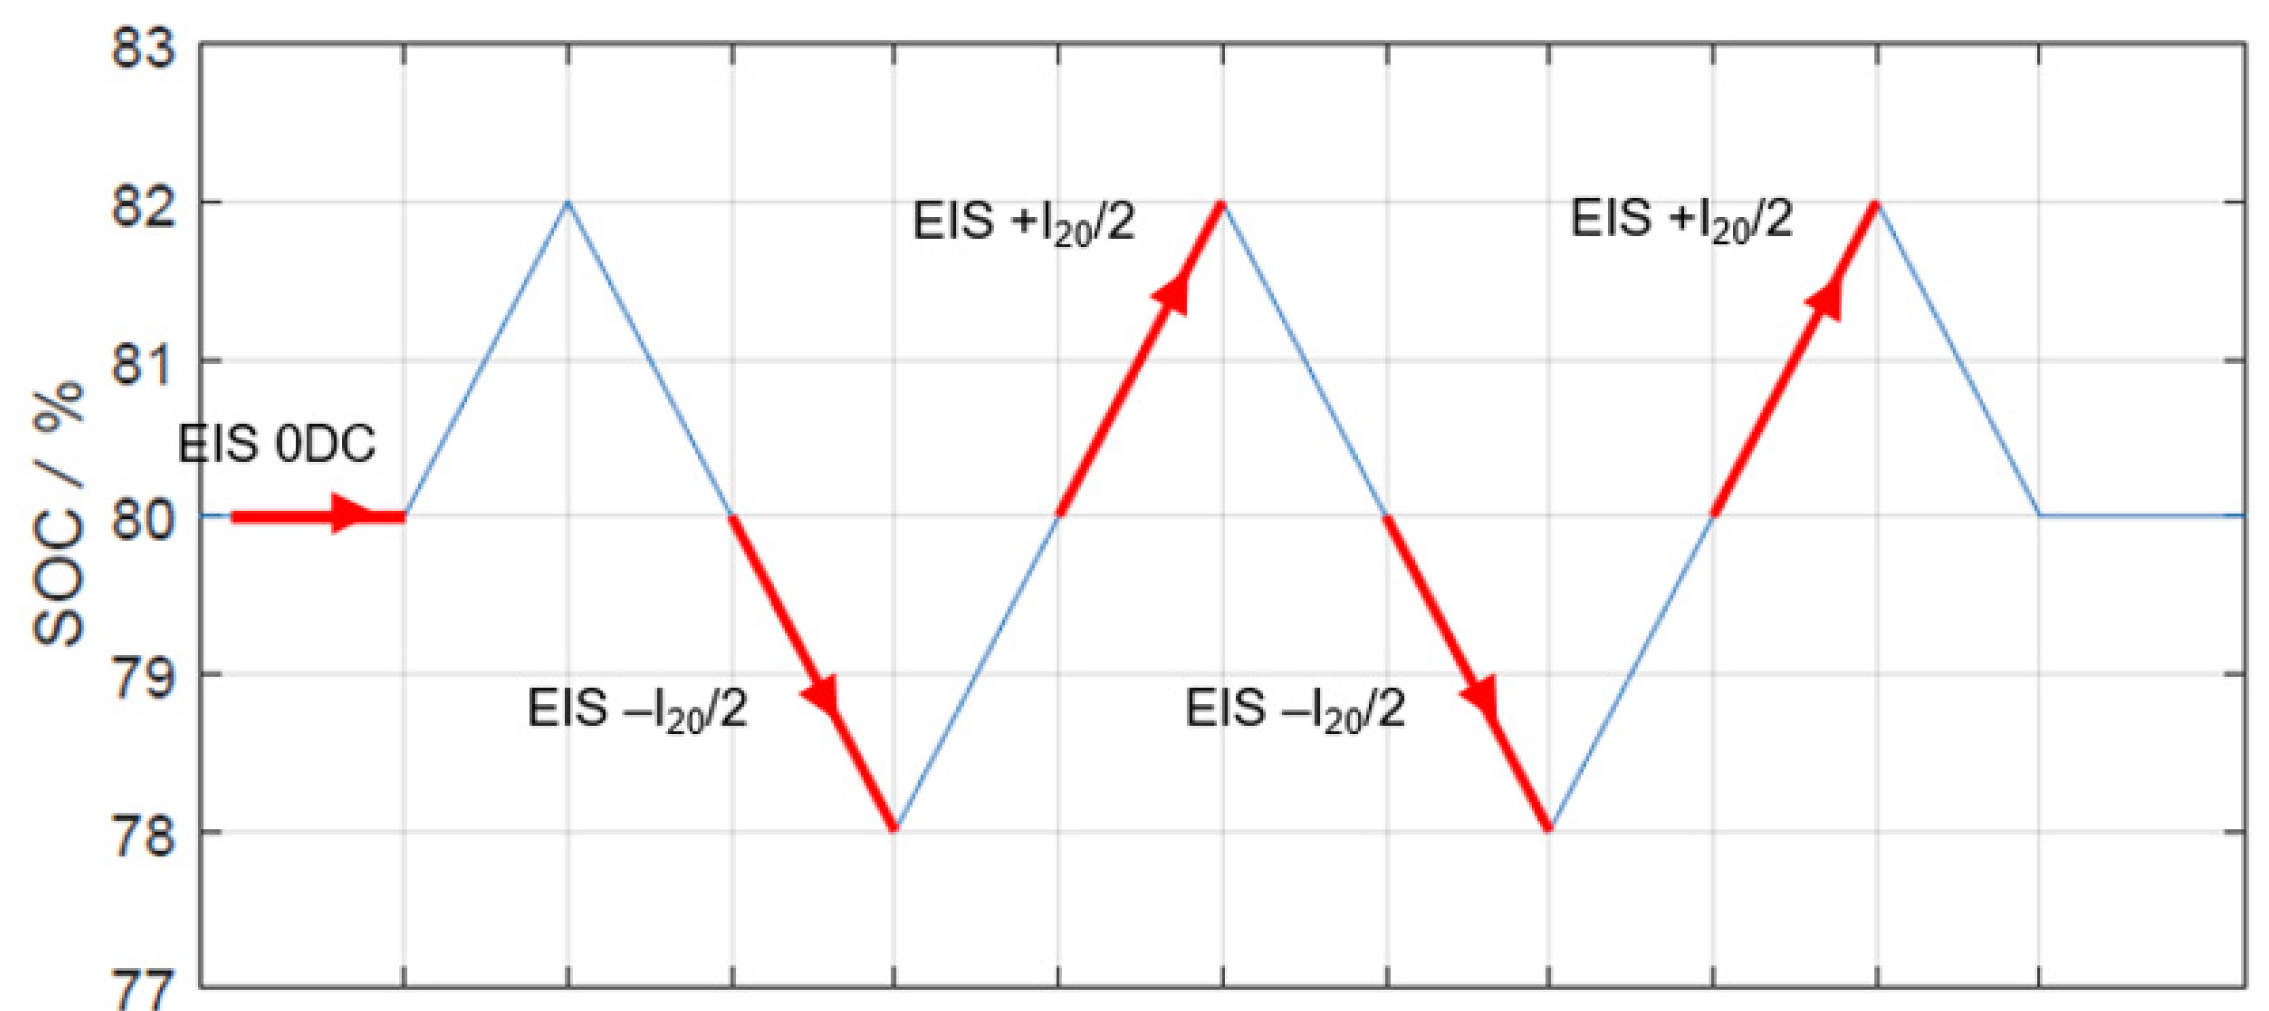
2.2. Charge Acceptance Tests

The charge acceptance test used were according to EN 50342-6:2015 where the test is defined for batteries. Therefore, small changes, such as voltage and current adjustments had to be executed. Otherwise, the test was conducted as defined within the norm. The DCA is the result of three parts: namely, after charge (Ic) at 80% SoC, discharge history (Id) at 90% SoC and during real start-stop micro cycles (Ir) at 80% SoC. Further explanations of the test usage at the cell level are given in [16], along with a quantitative comparison with other charge acceptance tests.

2.3. Electrochemical Impedance Spectroscopy

The galvanostatic EIS is used within this work. The frequency range is between 10 mHz and 6.5 kHz for each spectrum. For each frequency, 3 periods were measured, and 8 frequencies per decade were evaluated, which resulted in a test duration of ≈15 min for one spectrum. The main demand of EIS is that the system under inspection has to be (quasi-) stationary, linear or at least able to be linearized with respect to the signal amplitudes in its working point and causal.
To ensure a (quasi-) steady state during an EIS measurement the temperature, SoC and SoH changes should be kept as small as possible. To ensure the same SoH of all test cells, they all underwent the same pre-tests (e.g., C20 and DCA (EN) test) before executing the EIS measurements. Moreover, all EIS measurements were performed within a climate cabin at a temperature of 25 °C.
Starting from 80% SoC, the cell was cycled by approximately 4% SoC around the targeted SOC. Meanwhile, one impedance spectrum was recorded during each discharging and charging period, always starting at 80% SoC with a superimposed DC current of ±I20/2. A superposed charging or discharging current, IDC, was used to avoid a change of polarity during the measurement and to force only one reaction direction upon the battery. Thereby, the maximum SoC change during one spectrum was 2% SoC. The red marks in Figure 1 indicate when the EIS measurements were carried out. Moreover, the most important measurement parameters are summarized in Table 2. This micro cycling approach was first introduced by Karden et.al. [17]. The micro cycles were repeated three times, and only the last impedance spectrum with superimposed charging current was used for the respective investigations to evaluate the charging processes.
The dynamic behavior of each electrode was investigated using a hydrogen reference electrode Gaskatel 88010 form Gaskatel Gesellschaft für Gassysteme durch Katalyse und Elektrochemie mbH, Kassel, Deutschland. Since the location of a reference electrode becomes a crucial factor, its position was kept the same in each test cell.

3. Results

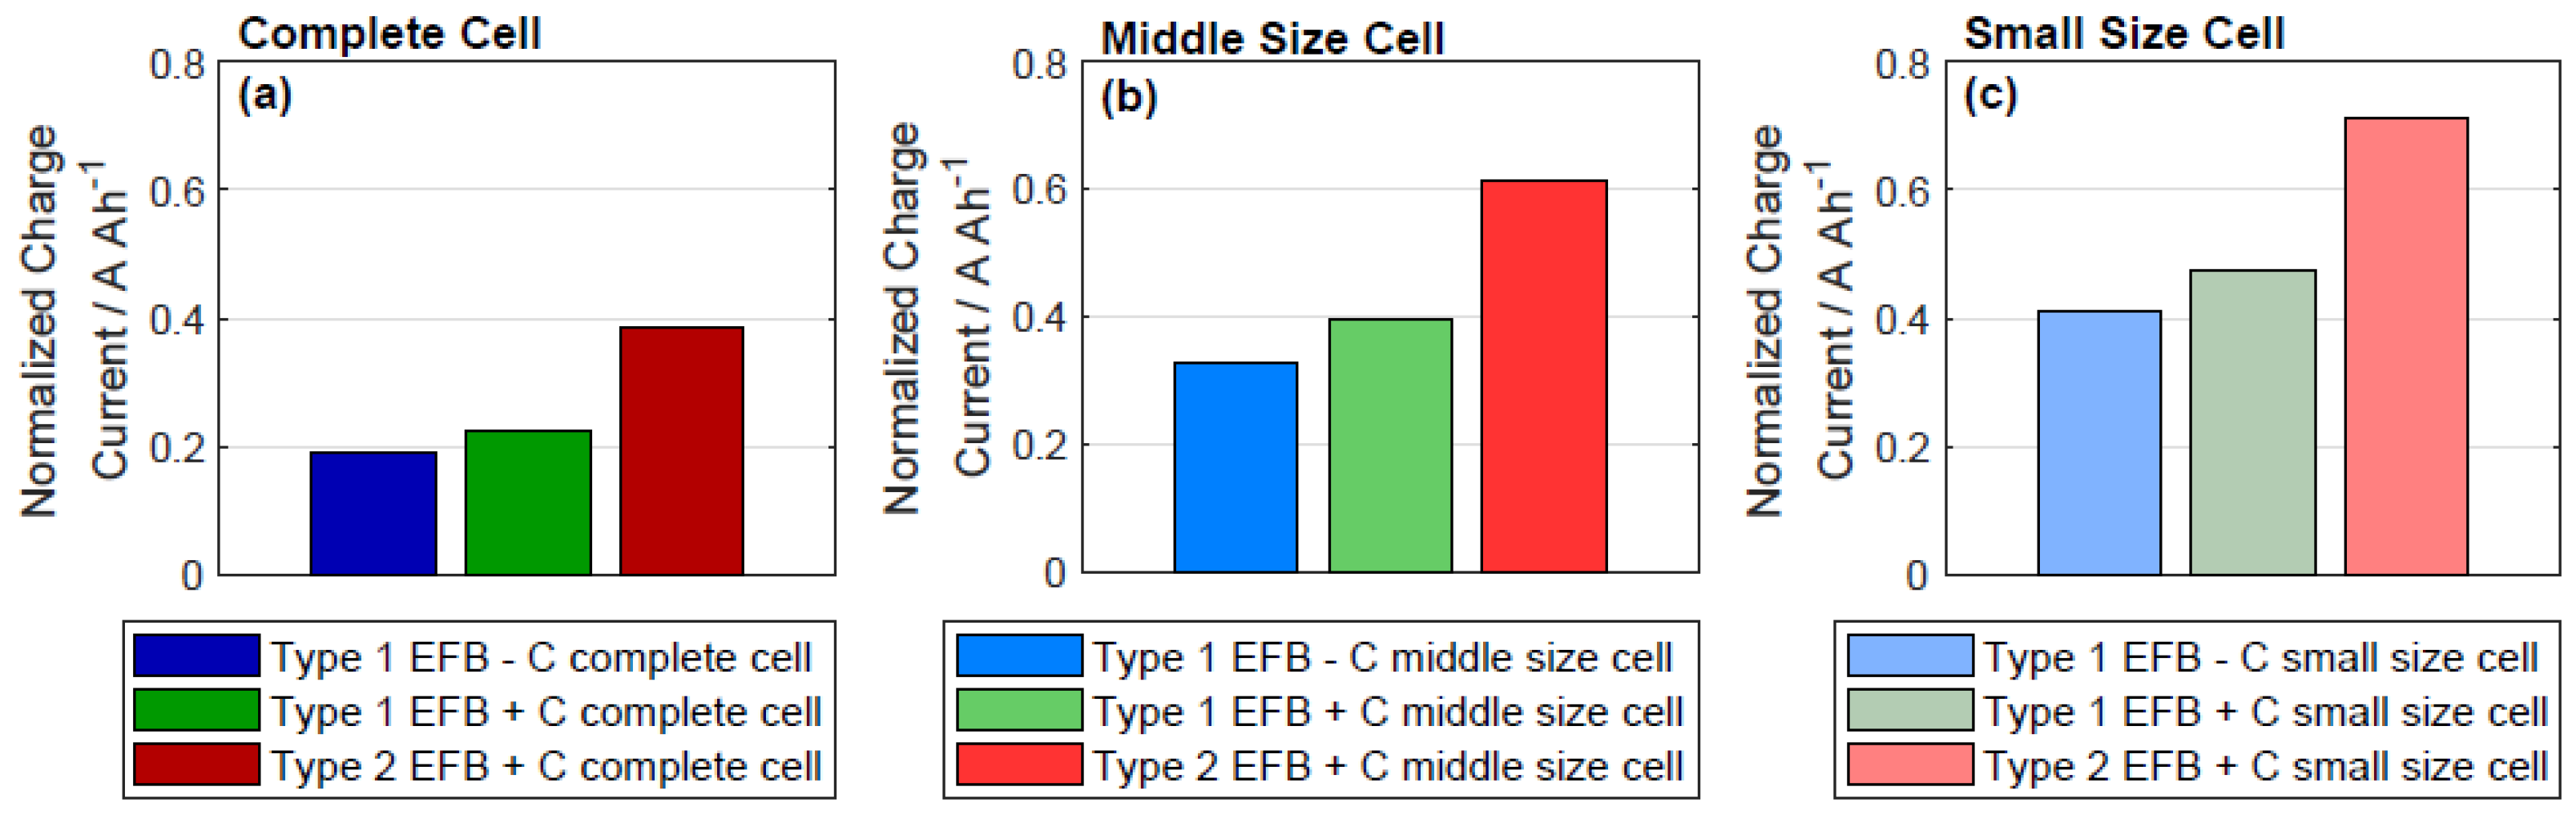
3.1. Dynamic Charge Acceptance

The DCA test results according to EN 50342-6:2015 for Type 1 EFB − C, Type 1 EFB + C and Type 2 EFB + C are shown in Figure 2a–c comparing the complete cell, the middle size cell and the small size cell. The DCA results have already been shown and discussed in [16] and will be compared with the EIS measurements within the next sections. The charge currents according to EN 50342-6:2015 are increasing in the following order: Type 1 EFB − C < Type 1 EFB + C < Type 2 EFB + C. This trend is valid for all cell layouts. In the case of the impact of plate count on charge currents, DCA of single cells are quantitatively higher for lower plate count. Even though, the acid amount within the small and middle size test cells was limited via spacers, a higher acid-to-mass ratio was found within these cells [15]. The amount of electrolyte per Ah has been found to be the most relevant influencing factor for the DCA [15]. The acid density within the test cell was adjusted to 80% SoC where the Ic and the Ir parts of the DCA (EN 50342-6:2015) test are carried out. However, the Id part of the DCA (EN) test is taking place at 90% SoC. For cells with lower plate count the acid density is lower at 90% SoC, resulting in higher charge acceptance [18,19]. Another effect is that flooded batteries rapidly suffer from acid stratification during DCA tests [20]. The decreased acid stratification due to the excess acid in cells with low plate count increases the normalized DCA [9,21,22].

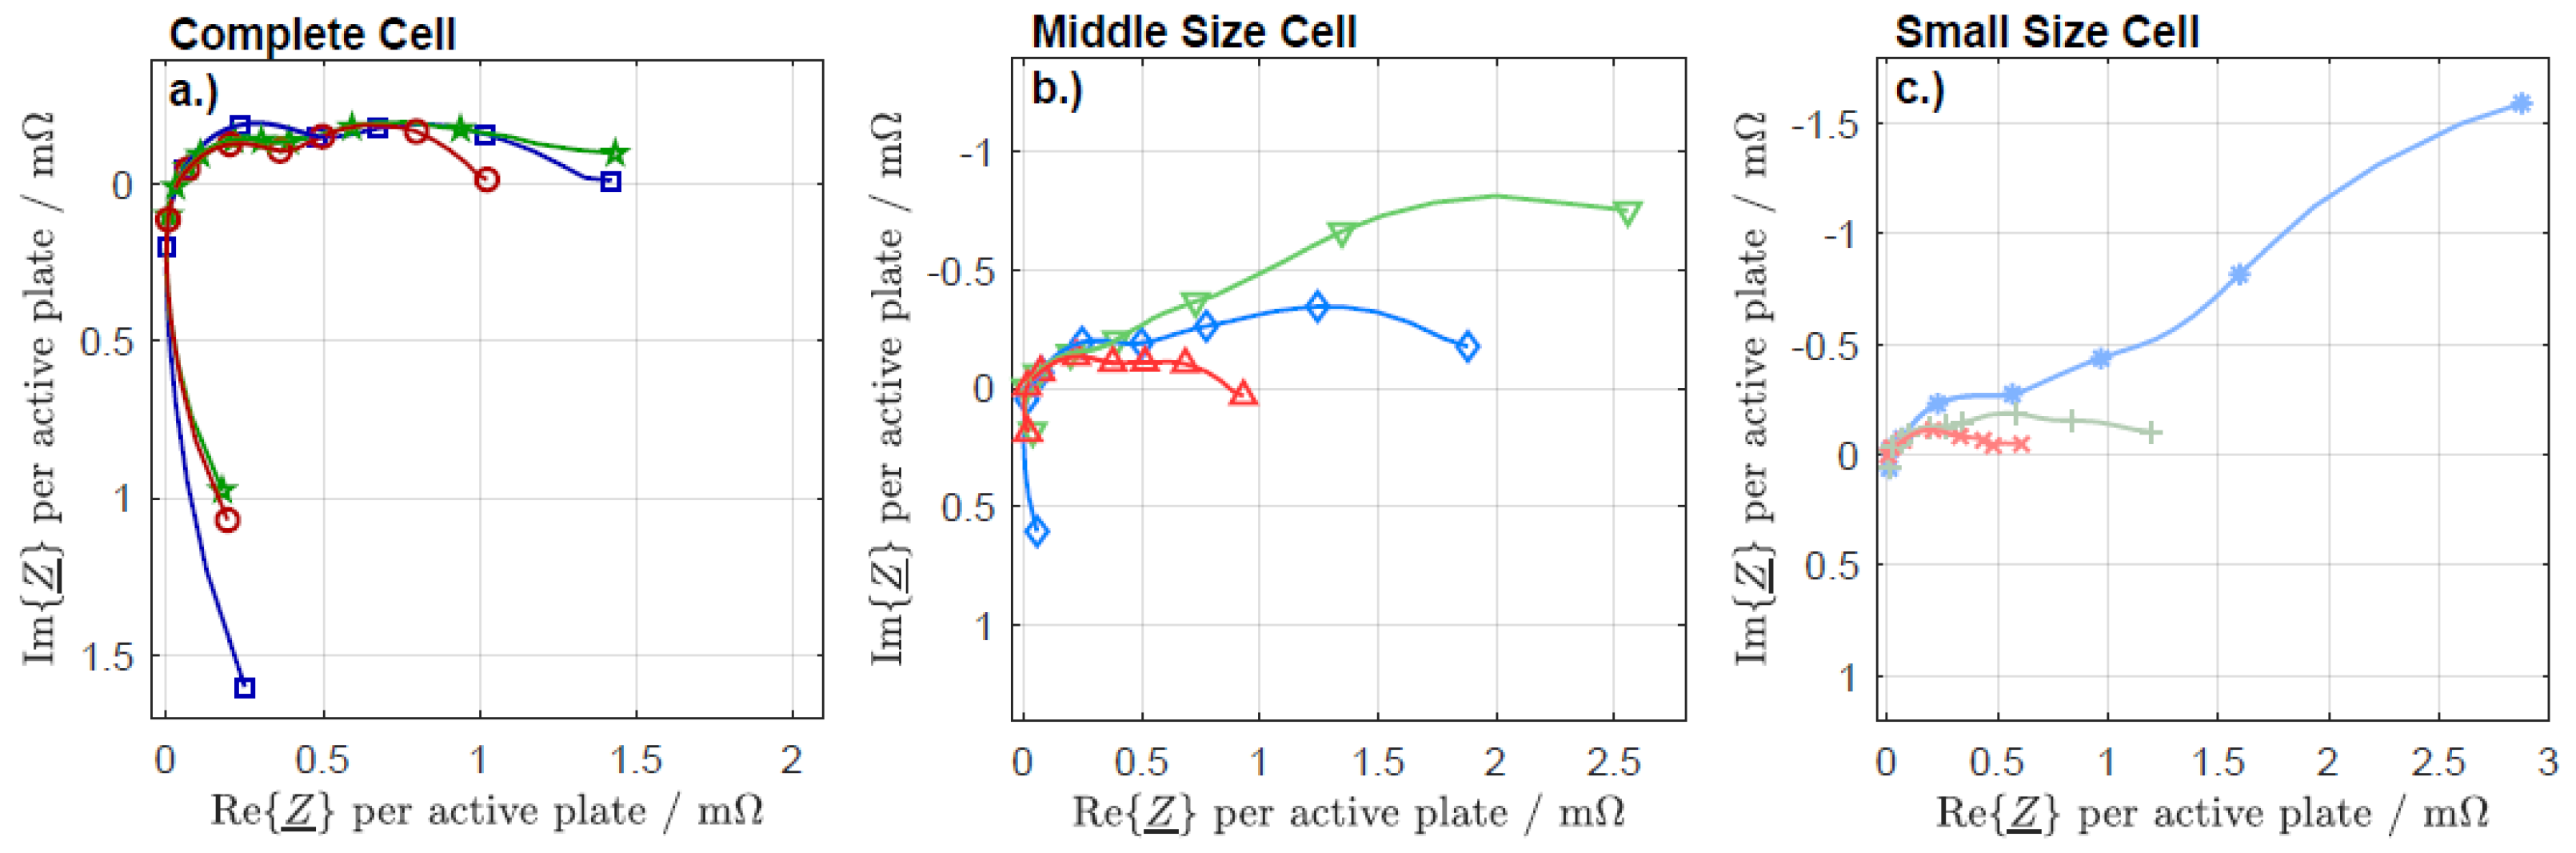
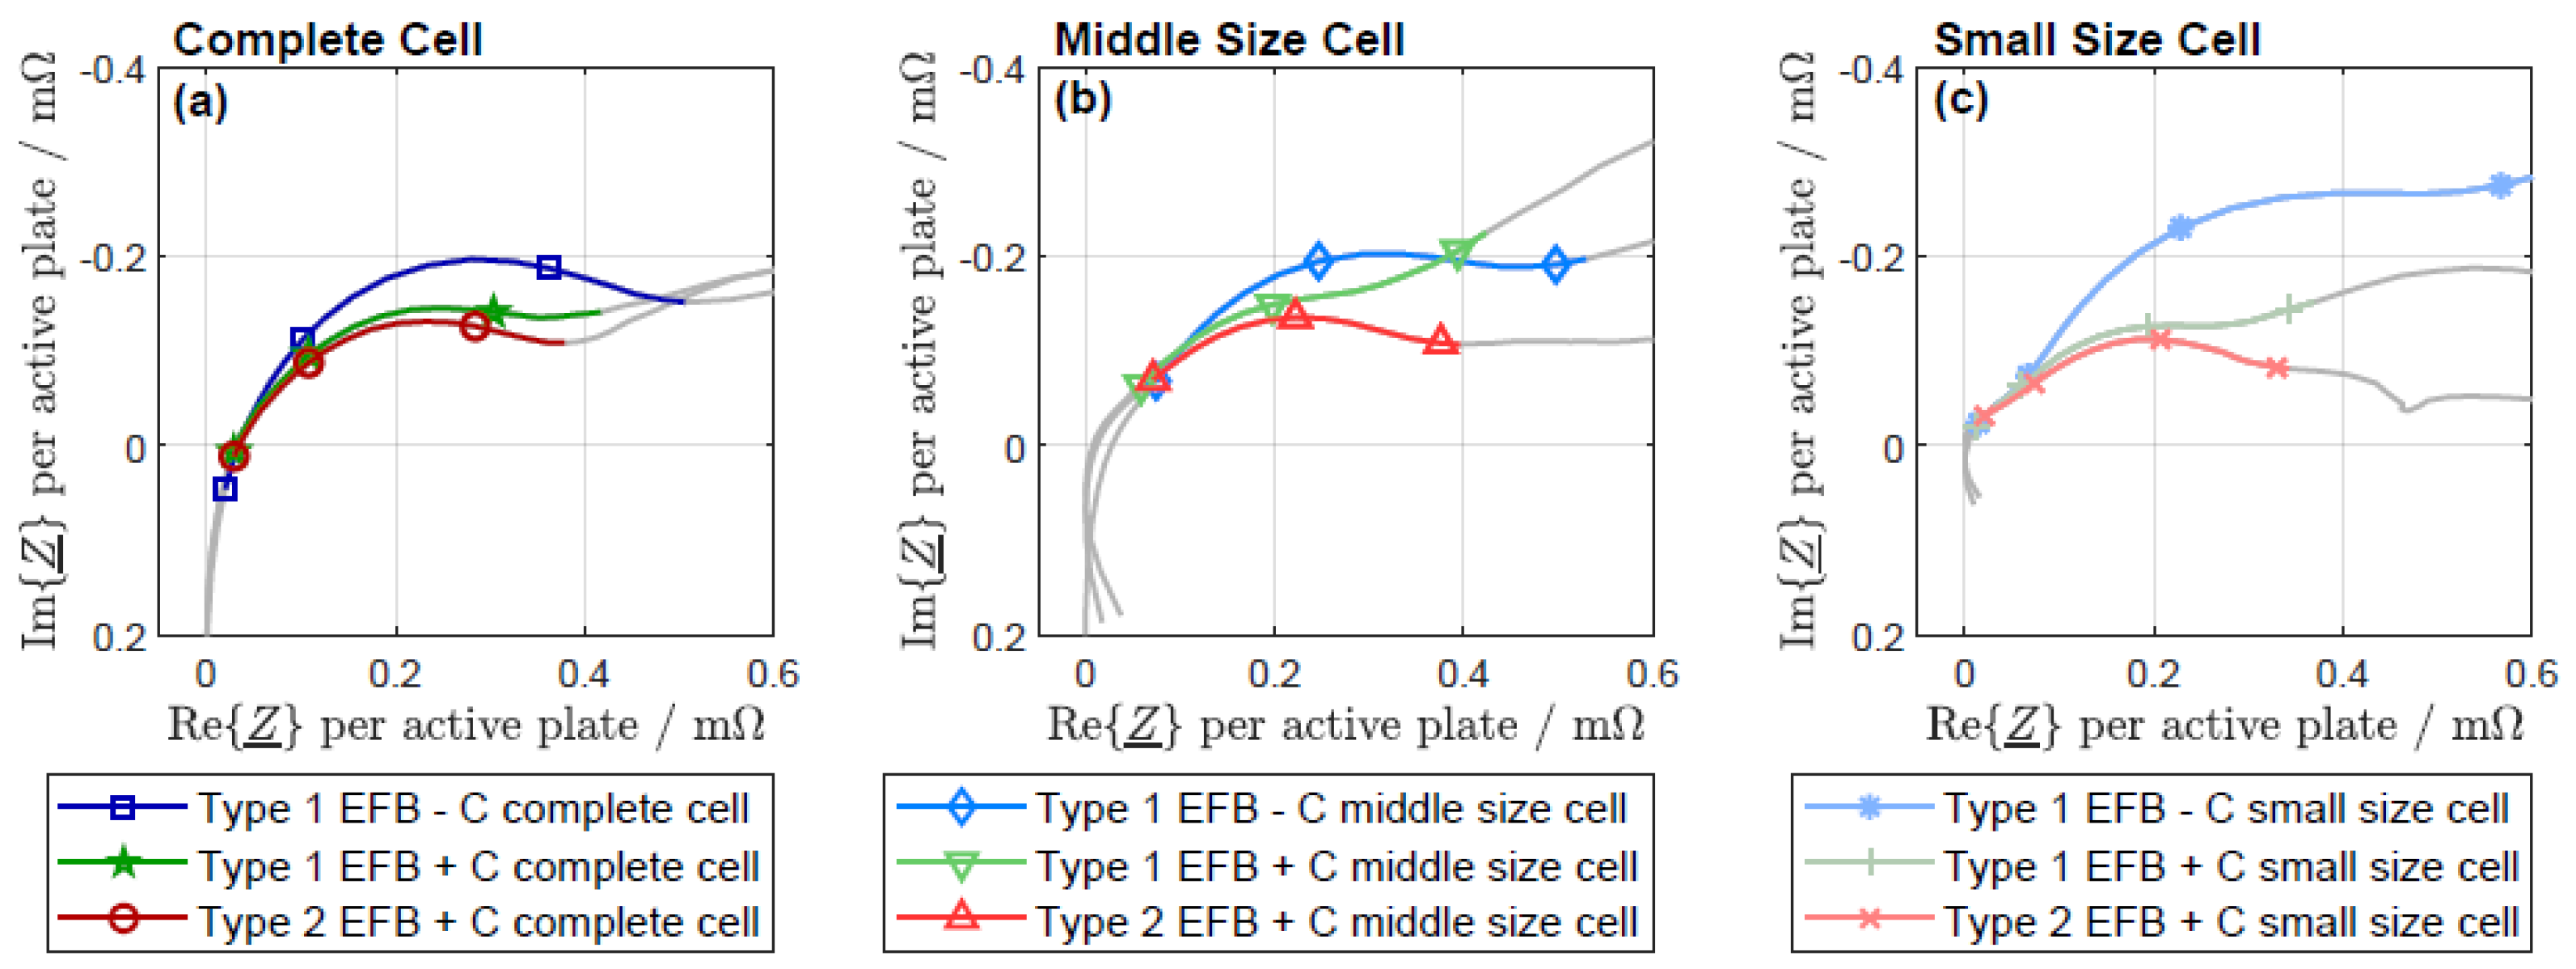
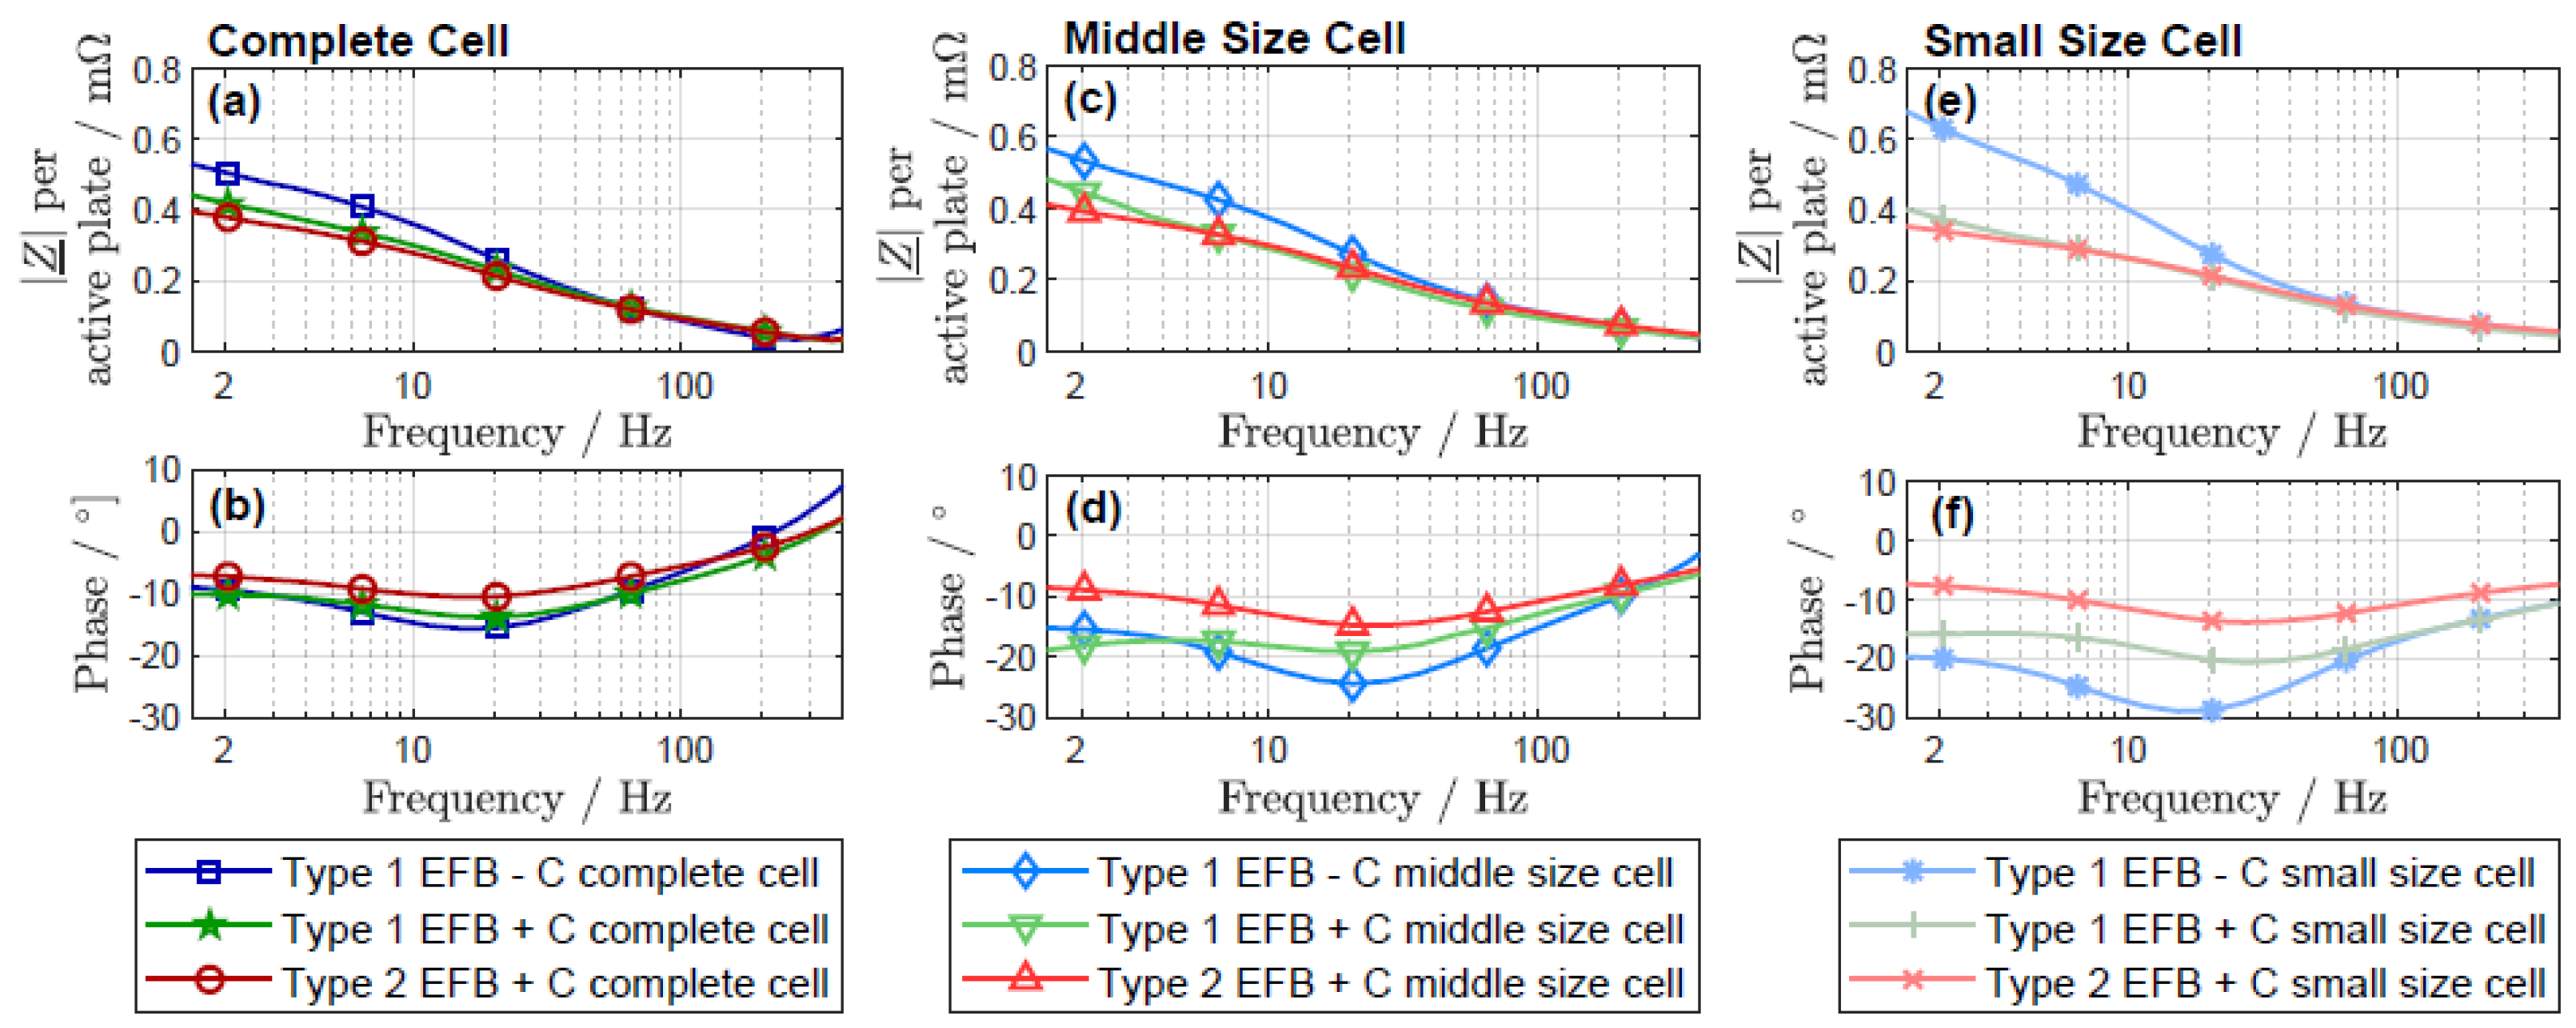
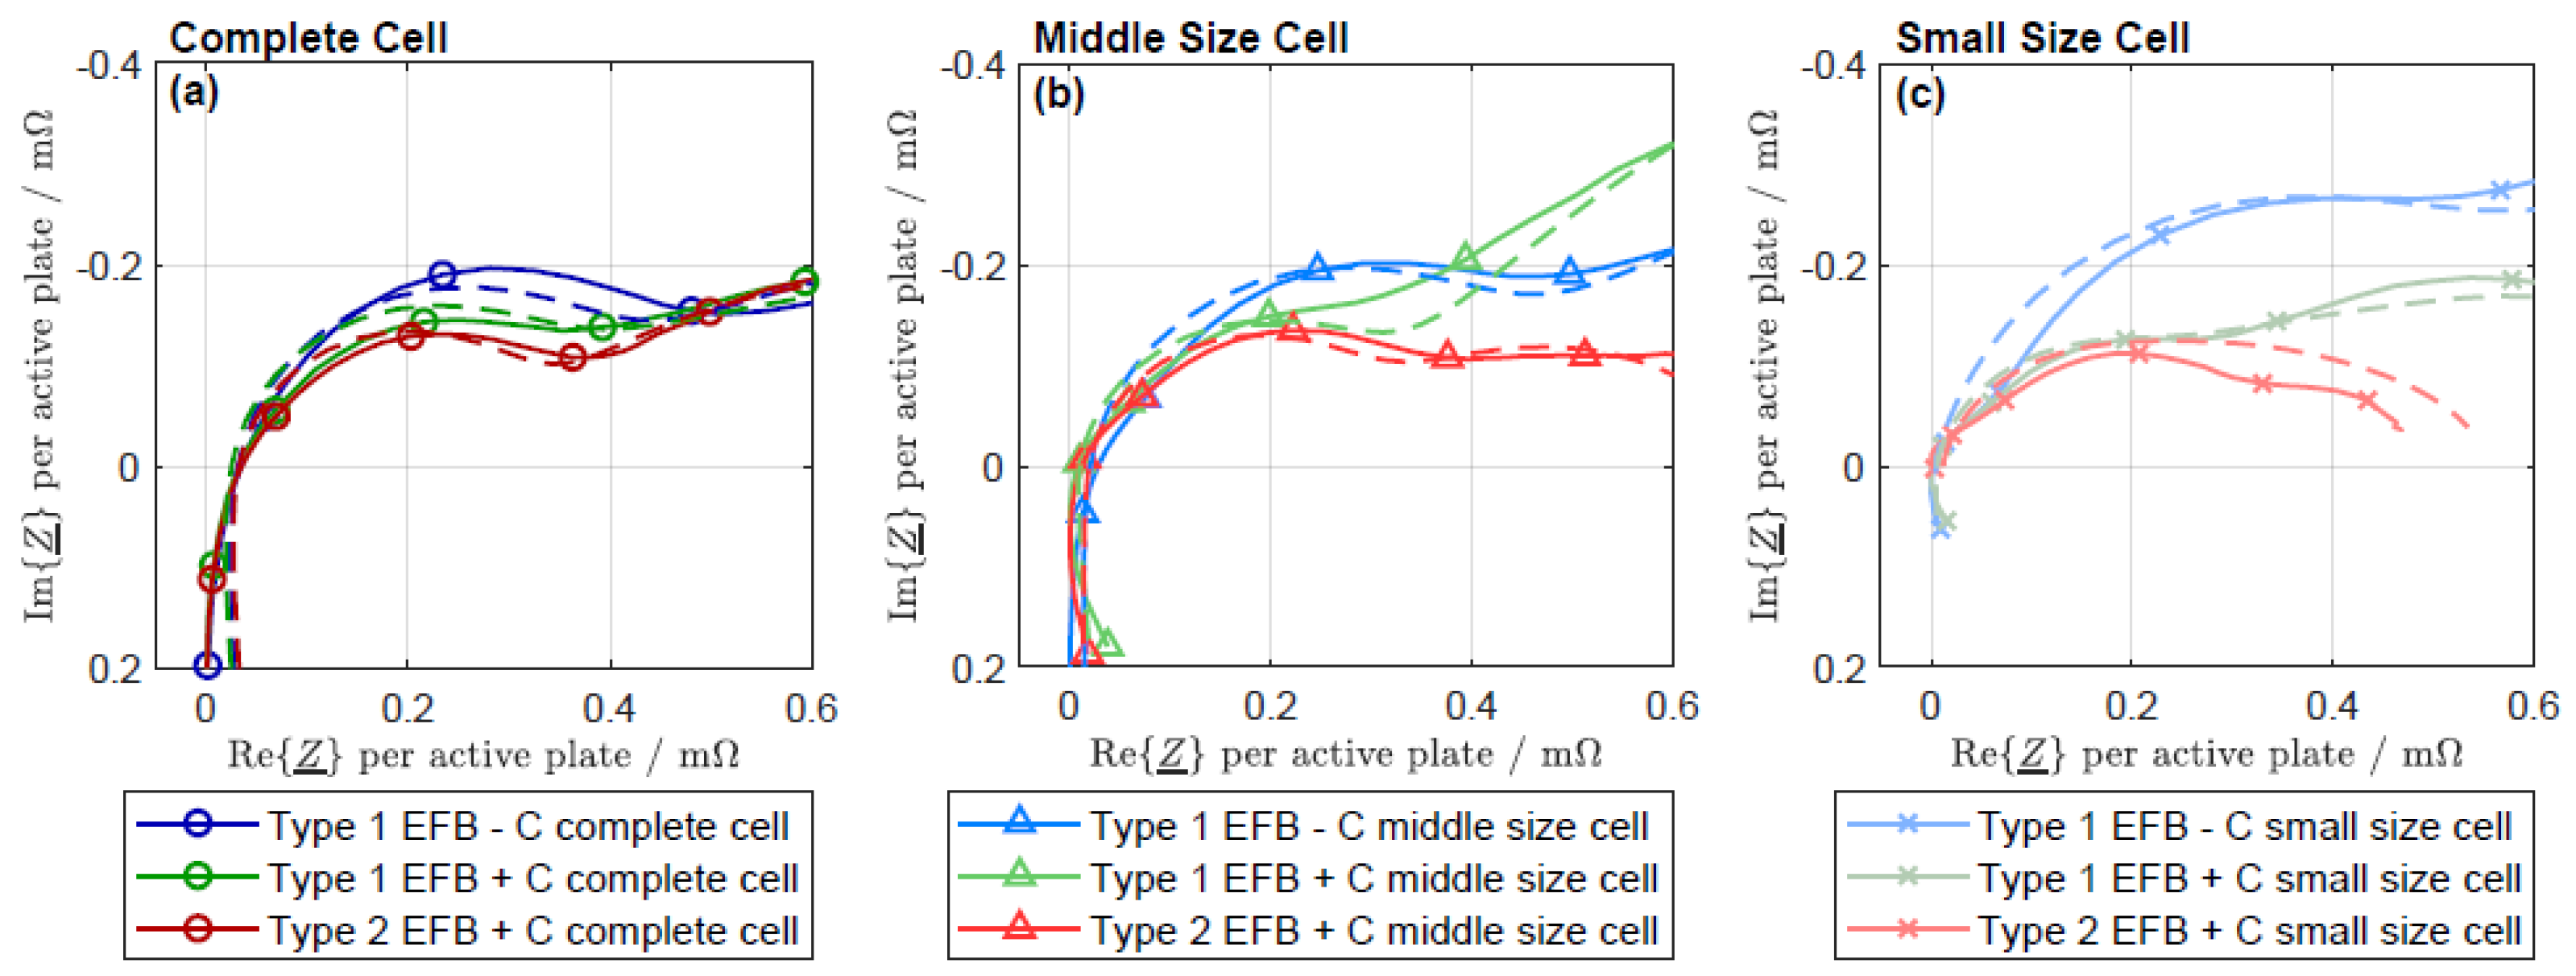
3.2. Electrochemical Impedance Spectroscopy

A close-up of the first semicircle of the negative half-cell EIS at 80% SoC for Type 1 EFB − C, Type 1 EFB + C and Type 2 EFB + C is shown in Figure 3a–c, comparing the negative half-cell spectra of the complete cells, the middle size cells and the small size cells. In Figure A1 the complete spectra of the negative half-cell EIS at 80% SoC are shown. The EIS measurements are conducted at 80% SoC, because the DCA (EN) test is executed mostly at 80% SoC. Therefore, the processes effecting the DCA are expected to be most visible in EIS measurements at this SoC. For this reason, the scope of the EIS measurements was limited to 80% SoC. To improve the comparability, all spectra are shifted along the real axis by the smallest real part of the impedance Re{Z} for all cell types and layouts. This value is referred to as the internal resistance, R0. For all cell layouts, the Type 1 EFB − C cells exhibit the biggest first semicircle under this condition, followed by the Type 1 EFB + C and the smallest first semicircle for Type 2 EFB + C. This trend can be visualized for all cell layouts. Comparing the results of the charging currents (shown in Figure 2) with the EIS results (shown in Figure 3), the conclusion can be drawn that the higher the DCA, the smaller the first semicircle of the EIS.
To enhance the comparability between the cell sizes, the impedance shown in Figure 3 and Figure 4 is scaled by the number of active half plates. Since the original cell layout of the complete cell differs between the battery types, where Type 1 test cells obtain 8P8N—resulting in 15 active negative half plates out of 16 and the Type 2 test cell obtain 8P9N—resulting in 16 active negative half plates out of 18. Within the middle size cell, four active negative half plates are left; and, in the small size cells, only two active negative half plates are left. The resulting scaling factor is given in Table 3.
Figure 4 shows the negative half-cell EIS at 80% SoC for Type 1 EFB − C, Type 1 EFB + C and Type 2 EFB + C in a Bode plot, where Figure 4a shows the absolute value of the impedance of the complete cells, Figure 4b shows the phase shift of the complete cells, Figure 4c shows the absolute value of the impedance of the middle size cells, Figure 4d shows the phase shift of the middle size cells, Figure 4e shows the absolute value of the impedance of the small size cells and Figure 4f shows the phase shift of the small size cells. The DCA test according to EN 50342-6:2015 contains very short charging pulses (10 s), where the largest part of the accepted current is taken in within the first second. That might be the reason why the processes influencing the DCA can be visualized within the first semicircle, between 1.5 and 365 Hz. This part of the spectra can also be seen within the Bode plot, where the absolute value of the impedance at 2 Hz follows this trend: Type 1 EFB − C > Type 1 EFB + C > Type 2 EFB + C. This trend is the same for all cell layouts.

3.3. Kramers-Kronig

Before identifying an ECM for the EIS data obtained, they were preprocessed to avoid systematic errors by using inaccurate measurement data due to violations of the stationarity and time-invariance. For example, large residuals may appear at low frequencies when the system was non-stationary during the measurement. A reliable method of detecting irregularities in the measurement data is the K-K transformation.
The K-K transformation verifies the EIS measurement points that are stable and causal if the real and the imaginary parts are interdependent [23,24]. The K-K transformation can be used to reconstruct the spectrum using the K-K test [25]. For this test, an ECM consisting of a series connection of a single resistance and several RC circuits with linear parameters is used. Each single RC circuit fulfills the K-K condition, and, therefore, the entire model does as well. To minimize the residuals at the ends of the frequency dispersion, the range of the time constant investigated should be extended by some decades. If the spectrum can be reconstructed with the K-K compliant RC circuits and the residuals are evenly distributed, the measured spectrum can be considered valid. The data points not fulfilling the K-K transformation are not evaluated any further.

3.4. Distribution of Relaxation Times

Finding characteristic points within an electrochemical impedance spectrum as well as the determination of the ECM for representing the spectrum requires experience and deep knowledge about the electrochemical processes at hand. The DRT features a more reproducible and model-free approach to identifying the single processes [26]. It enhances the impedance spectroscopy by transferring it from the frequency into the time domain using Fourier transformation [27]. Even when overlapping in the frequency domain, the separation of each single polarization contribution is possible in the time domain, without the need for any prior assumptions [27]. As a result, the major and minor polarization processes involved are identified, even in complex impedance spectra.
To generate the DRT from the measured impedance spectra, the following optimization problem needs to be solved
min { | | A · x b | | 2 }
By solving the algorithm, only non-negative values are allowed, since only positive resistance values have a physical meaning. A common way to solve this problem is the shift and cut-off approach: All measurements containing a positive imaginary part are repudiated, and the ohmic offset is subtracted from all measurements, leaving only RC elements. Danzer introduced the generalized DRT analysis for EIS ohmic, inductive, capacitive, resistive-capacitive and resistive-inductive effects [27]. Thus, the entire spectrum can be reproduced.
As an example, to briefly describe the determination of the DRT, the reconstruction of a series of RC elements is described. For an RC element, the imaginary and real parts are described with
I m { Z R C } = ω · τ · R 1 + ( ω · τ ) 2
and
R e { Z R C } = R 1 + ( ω · τ ) 2
where ω is the angular frequency, τ is the time constant of the RC element and R is the resistance from the respective RC element. For the transformation procedure, both the imaginary and real parts of the measured spectrum are used for the optimization function.
b = [ R e { Z R C } I m { Z R C } ]
The unknown distribution function of the DRT is
x = [ h 1 h k h N τ ] T
where Nτ is a multiple of the measured frequencies Nf in the impedance spectra Nτ = c·Nf [27] with c ϵ {1,2,3} to obtain a smoother distribution function [26]. The matrix A needs to be solved for all frequencies and predefined time constants for the real and the imaginary parts:
A = [ R e { 1 1 + j · ω 1 · τ 1 } R e { 1 1 + j · ω 1 · τ N τ } R e { 1 1 + j · ω N f · τ 1 } R e { 1 1 + j · ω N f · τ N τ } I m { 1 1 + j · ω 1 · τ 1 } I m { 1 1 + j · ω 1 · τ N τ } I m { 1 1 + j · ω N f · τ 1 } I m { 1 1 + j · ω N f · τ N τ } ]
where the number of the RC elements used to display the spectra with an ECM must usually be chosen to be higher than the number of measurements. The use of a regularization term is one way to solve this ill-posed optimization problem. For example, Tikhonov regularization can be used to calculate the DRT, adding the term |λχ|2 to the optimization function [28]. λ is the regularization parameter.
By including the regularization term in the optimization problem, the matrix A and vector b are complemented:
A R e g = [ A λ · I   ϵ   n x n ]
and
b R e g = [ b 0   ϵ   n ]
A further analysis of the number and location of peaks of the obtained distribution function reveals the number of involved processes and even allows their quantification. In Figure 5a, the DRT of the EIS at 80% SoC of the complete cells is shown. For all three types of complete cells, four peaks are visible within the DRT, meaning that four processes are involved: the peak at the smallest time constant τ0 ≈ 0.003 s, the peak at τ1 ≈ 0.07 s, a smaller peak around τ2 ≈ 1 s and the last peak at τ3 ≈ 10 s. Each peak represents a single process. Figure 5b shows the DRT of the EIS at 80% SoC of the middle size cell, 3P2N, while Figure 5c shows the DRT of the EIS at 80% SoC of the small size cell, 2P1N. The time constants identified by the DRT are given within Table 4. For these cell layouts, the peak at the small time constant is not as distinct anymore. The peak at τ1 ≈ 0.07 s is visible for middle and small size cells for all types as well. For the middle and small size cell, the last peak at τ3 ≈ 10 s is also visible, surrounded by several smaller peaks, which might be present due to the time constant τ2. These findings are used to evaluate the most important processes, to choose the ECM elements and the starting parameters of the fitting algorithm.
Assuming a Gaussian distribution within the DRT, the occurring peaks can be assigned to a single Gaussian bell shape, respectively. As a result, the location of the peak correlates with the characteristic time constant of the process. The area that a bell shape covers is equal to the polarization resistance of the correlating process. The variance σ2, or the width, correlates with the frequency range at which the process occurs. A process with a sharp peak occurs at a small range of frequencies, while wide peaks point out more distributed processes.

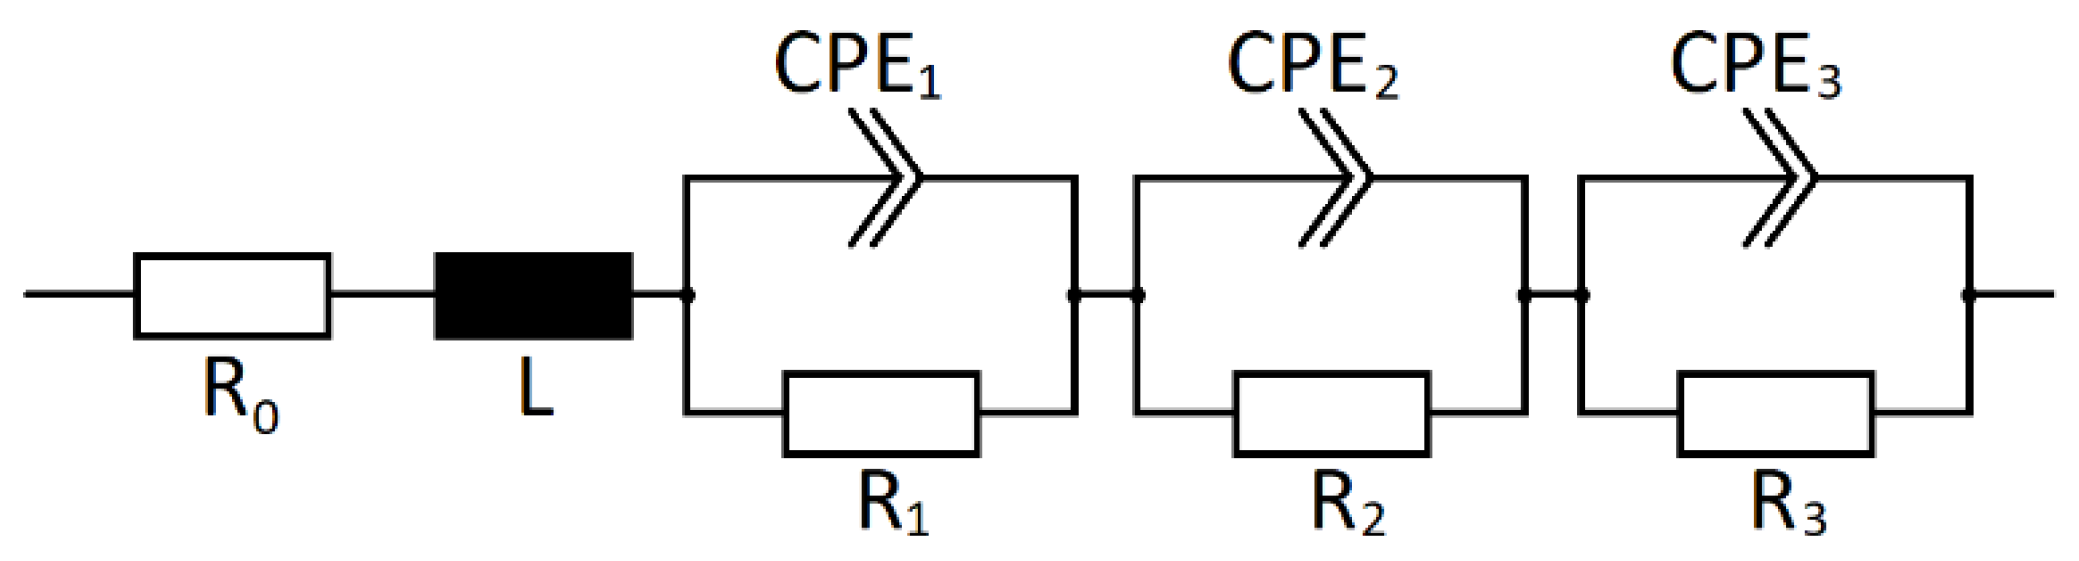
3.5. Fitting with an Equivalent Circuit Model

The measurement data can be evaluated within the frequency domain using the ECM, consisting of simple passive electrical components such as resistors, capacitors and inductors. These components are interconnected in networks and can represent electrochemical processes. The modeling approach is mainly based on Randles’ circuit [29], which has been employed with different levels of modification but always with the fundamental structure. The illustration and implementation of the model structure are very simple [30]. Compared to other models, the ECM offers a higher computing speed and can therefore be used to simulate complex systems or to implement even small simulation step sizes [30]. This makes it possible to even simulate dynamic battery operations. However, parameterization measurements must be executed, and ECMs have a restricted validity range [30].
Most ECMs consist of an internal resistance R0, an inductivity, and several semicircles, each representing a separate process, e.g., charge transfer, chemical reactions, mass transport or adsorption processes. In Figure 5, the DRT of the EIS at 80% SoC is shown. Since τ0 is only distinct for complete cells, only τ1, τ2 and τ3 are used as parameters within the ECM. Each of the time constants is dedicated to one semicircle representing one process. A semicircle can be modelled by using a parallel connection between a resistor and a capacitor. If the measurement results in a flattened semicircle, which can be explained by the porosity of the electrodes, a constant phase element (CPE) in parallel to a resistor can be used instead. The formula for a CPE in parallel to a resistance, which is also referred to as ZARC element, is:
Z A R C = 1 1 R + A · ( j ω ) ξ
The CPE element fits the spectra much better and still contains a capacitive characteristic, which is used for evaluation. In Figure 6, the chosen ECM for the electrochemical impedance spectra is given. For each time constant identified with the DRT, one ZARC element is used.
The formula of the chosen ECM is
Z = R 0 + L · ( j ω ) γ L + R 1 1 + τ 1 · ( j ω ) ξ 1 + R 2 1 + τ 2 · ( j ω ) ξ 2 + R 3 1 + τ 3 · ( j ω ) ξ 3
with
τ = R · A

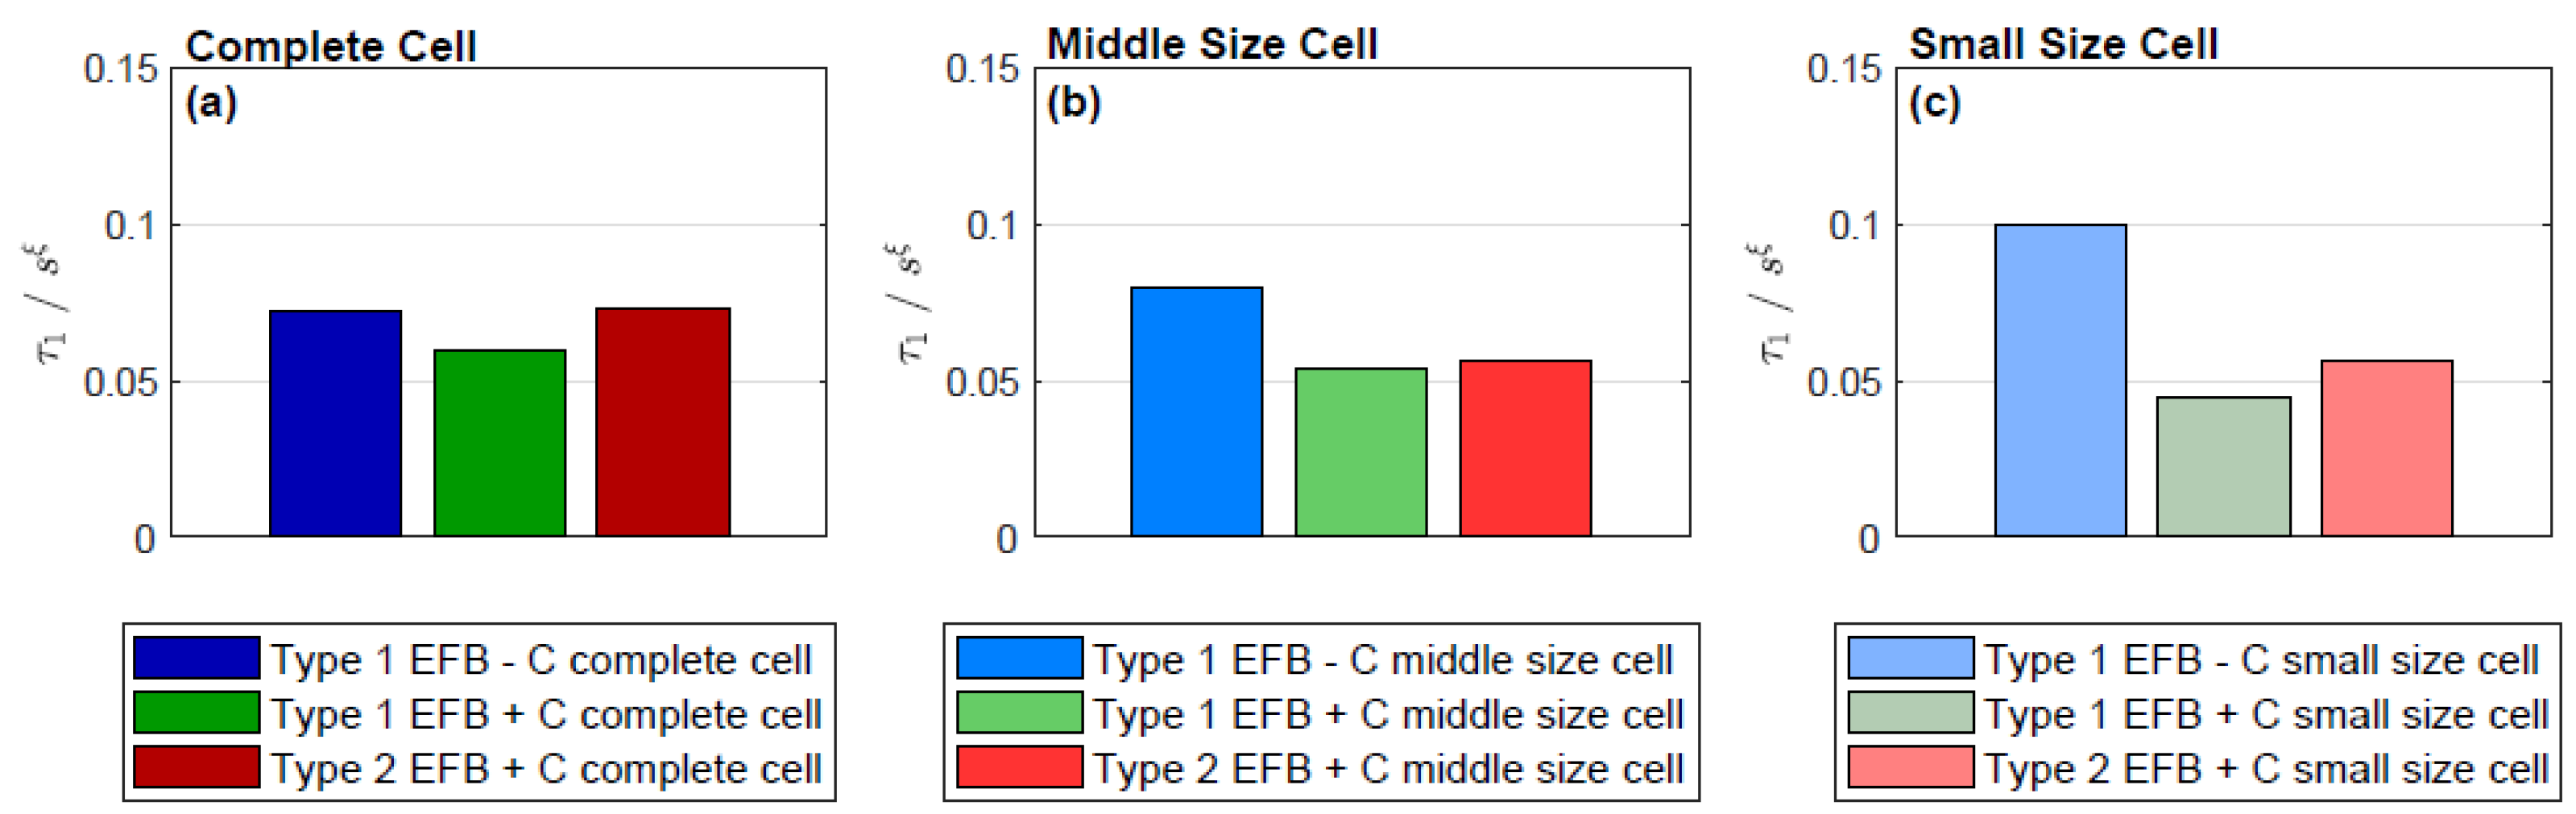
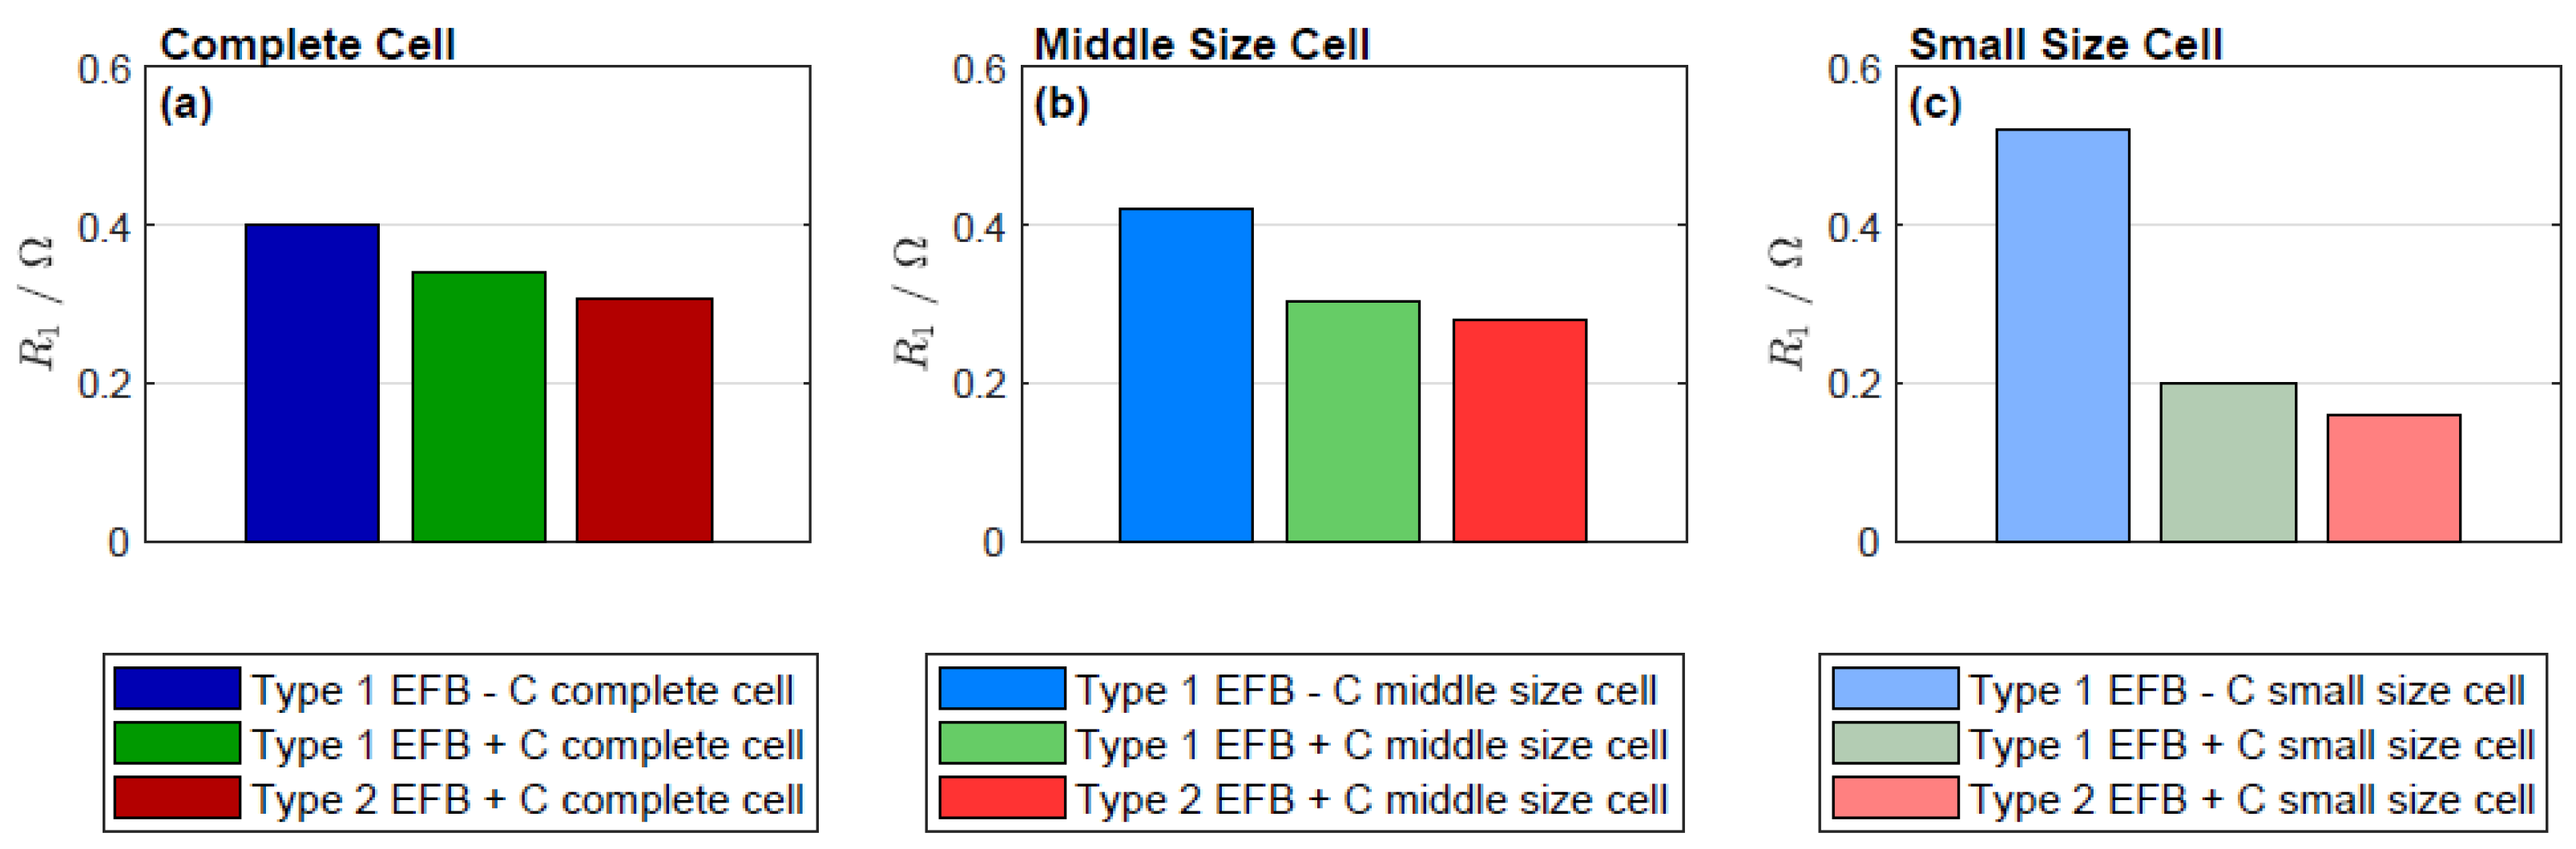
3.6. Parameterization of the Equivalent Circuit Model

The first semicircle of the negative half-cell EIS at 80% SoC for Type 1 EFB − C, Type 1 EFB + C and Type 2 EFB + C, with the corresponding fit, are shown in Figure 7a–c for the complete cells, for the middle size cells and for the small size cells, correspondingly. Even though the fitting result is not exactly the same as the measurement, the first semicircle is well represented. To minimize the deviation between the modelled data and the EIS, the complex least-squares fitting algorithm was employed [31]. The starting parameters, lower and upper limits for the ECM fit are given in Table 5. The resulting fitting parameters used are stated in Table 6.
The starting parameter for the internal resistance R0 is equal to the removed offset of the smallest real part of the impedance Re{Z}. However, for some spectra, it is not possible to take this minimum in a frequency range where the phase of the impedance crosses zero. As a result, the upper limit is extended. The time constants identified by the DRT are used as fixed parameters for the fitting. The evaluation of the fitting had previously been executed with variable values for all ξ. However, for the purposes of comparability, the average value for each ξ1, ξ2 and ξ3 are taken, and the fit is repeated with fixed values.
The fitting results of the complete laboratory test cells are shown in Figure 8a for τ1, in Figure 9a for R1 and in Figure 10a for C1. The parameters of the middle size cells are shown in Figure 8, Figure 9 and Figure 10b, and the fitting results of the small size cells are presented in Figure 8, Figure 9 and Figure 10c.

4. Discussion

It has been found that, disregarding the layout of the cells, the DCA is the largest for Type 2 EFB + C cells, followed by Type 1 EFB + C cells, while the Type 1 EFB − C cell exhibits the lowest DCA [16]. During the recuperation with voltage restriction, the charging current cannot be infinitely increased, since it is limited by the supply of Pb2+ ions. The polarization of the negative electrode is stronger compared to the positive electrode due to the double-layer capacitance of the positive electrode being approximately 10 times higher [8]. Therefore, the DCA during dynamic operation is known to be restricted by the negative electrode [32,33,34].
The mechanisms of how additives enable higher DCA are not yet fully understood. One suggestion is that the current-enhancing additives may increase the porosity of the negative electrode. This would increase the electrochemical active surface of the negative electrode, decrease the maximum PbSO4 crystal size, thus increasing its dissolution and decreasing the distance for Pb2+ ion transport. These effects should be visible within the EIS measurements.
Interpreting EIS measurement is not straightforward, as the results found in the literature showed different shapes for battery, cell and half-cell spectra, mainly depending on the measurement regime, e.g., SoC, superimposed DC current and frequency range. For most EIS measurements, two capacitive semicircles can be identified [5,6,8,17,35,36,37,38,39,40,41,42,43,44,45]. It is mostly agreed that each semicircle relates to one separate process of the electrochemical reaction, which could be charge transfer, chemical reactions, mass transport or adsorption processes. However, the interpretation of the semicircles varies between the sources. That said, it is mostly agreed that one of the found capacitive semicircles is most likely related to the charge transfer reaction alongside the double-layer capacitance; where both are related to the porosity of the electrodes and are thereby, associated with the electrochemical reaction at the electrode-electrolyte interface [45]. According to the suggested mechanisms regarding the influence of the additives, the charge transfer process might be the semicircle where the impact of additives is noticeable.
In several works, the high-frequency semicircle is attributed to the reactions inside the porous structure of both positive and negative electrodes and thus the charge transfer of the charge/discharge reaction [5,6,36,37,38,39,43,45,46,47]. The current [46,47] and SoC dependency [5,43] of the high-frequency semicircle also suggests its coherence with the charge transfer reaction. The highest correlation between DCA, the spectra and the fitting parameters is indeed obtained within the first semicircle. Therefore, the authors agree with the statements found in the literature, that the high-frequency semicircle represents the charge transfer reaction which can be differentiated by using different additives for enhancing the DCA.
However, Kowal et al. described the SoC dependency of all semicircles [40] and showed a current dependency of the low-frequency semicircle [17,40]. Both SoC and current are highly correlating to the charge transfer reaction. Instead of separating the two semicircles into two processes, others suggested that one reaction occurs in two separate semicircles, if it is executed in several consecutive or parallel steps. Hampson suggested that the oxidation from lead to Pb2+ ions takes place in a two-step electron transfer reaction [48,49]. Huck compared the spectra resulting from two charge transfer reaction steps with two additional adsorbates and different intermediate steps [50]. Using this two-step electron transfer reaction, the spectra of cells with current-enhancing additives would influence not only the high-frequency semicircle, but also the low-frequency semicircle. Even though the impact was the highest in the first semicircle, the measurement results indicate that the additives also have an effect on the low frequency semicircle as well.

5. Conclusions

To obtain convenient EIS results, all influence factors need to be kept constant during the whole measurement of each spectrum. To neglect influences from the previous usage of the test cell, a micro cycling approach was used. However, during the evaluation of electrochemical impedance spectra, enhanced care needs to be taken. A semicircle might not be observable because it occurs at low frequencies that are not accessible under the present conditions, or one semicircle might be masked by another. Therefore, the analysis of the DRT can give an idea about the usable ECM and identify starting values for the parameter prediction. This powerful method can be used to model the behavior of batteries without requiring previous knowledge.
For all cell types and layouts, the time constant τ1 is around 0.07 sξ. The resistance R1, the parameter indicating the size of the high-frequency semicircle, increases for larger semicircles. R1 is the highest considering Type 1 EFB − C for all test cell layouts. This is followed by the resistance R1 for the Type 1 EFB + C cells, which is the second highest for each cell layout. The smallest R1 for all cell layouts is that of the Type 2 EFB + C cells. Furthermore, it has been found that, disregarding the cells’ layout, the DCA is the biggest for Type 2 EFB + C cells, followed by Type 1 EFB + C cells, while the Type 1 EFB − C cell has the lowest DCA. Consequently, the inverse of the resistance R1, and thus the conductivity, shows the highest correlation to the DCA. On the other hand, there is no clear relationship between the capacitance C1 and the DCA, and no correlation between the parameters of the second semicircle and the DCA.
As a conclusion, EIS measurements can be used as a technique to predict a high or low DCA for cells. Further measurements need to be validated for more conclusive results. Thereby, different additives need to be validated to confirm the correlation between EIS parameters and DCA. Moreover, different superimposed DC currents and various SoCs should be tested in future work to indicate the best suitable testing procedure to forecast DCA.

Author Contributions

Conceptualization, S.B.; methodology, S.B. and J.K.; software, S.B.; validation, S.B., J.K. and E.K.; formal analysis, S.B.; investigation, S.B.; resources, S.B.; data curation, S.B.; writing—original draft preparation, S.B.; writing—review and editing, S.B., J.K., B.B., J.S. and E.K.; visualization, S.B.; supervision, J.K.; project administration, S.B.; funding acquisition, J.K. All authors have read and agreed to the published version of the manuscript.

Funding

This research was funded by Advanced Lead-Acid Battery Consortium, grant number 1618BST_CNP7_INTW.

Institutional Review Board Statement

Not applicable.

Informed Consent Statement

Not applicable.

Data Availability Statement

For any details regarding the data reported please contact S. Bauknecht via mail: [email protected].

Acknowledgments

The authors would like to thank Eberhard Meissner and Matt Raiford for their continuous feedback and discussions. Moreover, we would like to thank Harald Koch and his team at combatec GmbH for the tremendous work they did in disassembling the LABs to the cell level.

Conflicts of Interest

The authors declare no conflict of interest. The funders had no role in the design of the study; in the collection, analyses, or interpretation of data; in the writing of the manuscript, or in the decision to publish the results.

Appendix A

Figure A1. Complete, unprocessed negative half-cell EIS at 80% SoC for (a) complete cell: 8P8N/8P9N, (b) middle size cell: 3P2N and (c) small size cell: 2P1N visualized in a Nyquist diagram.
Batteries 08 00066 g0a1

References

  1. Barsoukov, E.; Macdonald, J.R. Impedance Spectroscopy-Theory, Experiment and Application, 2nd ed.; John Wiley & Sons: New York, NY, USA, 2005; ISBN 978-0-471-64749-2. [Google Scholar]
  2. Willihnganz, E. The Voltage of the Sponge Lead Plate During Discharge of the Storage Battery. Trans. Electrochem. Soc. 1941, 79, 243–251. [Google Scholar] [CrossRef]
  3. Yang, Y.-P.; Wang, F.-C.; Chang, H.-P.; Ma, Y.-W.; Weng, B.-J. Low power proton exchange membrane fuel cell system identification and adaptive control. J. Power Source 2007, 164, 761–771. [Google Scholar] [CrossRef]
  4. Zhan, Y.; Wang, H.; Zhu, J. Modelling and control of hybrid UPS system with backup PEM fuel cell/battery. Int. J. Electr. Power Energy Syst. 2012, 43, 1322–1331. [Google Scholar] [CrossRef]
  5. Křivík, P.; Vaculík, S.; Bača, P.; Kazelle, J. Determination of state of charge of lead-acid battery by EIS. J. Energy Storage 2019, 21, 581–585. [Google Scholar] [CrossRef]
  6. Křivík, P.; Bača, P.; Kazelle, J. Effect of ageing on the impedance of the lead-acid battery. J. Energy Storage 2021, 36, 102382. [Google Scholar] [CrossRef]
  7. Meissner, E.; Richter, G. The challenge to the automotive battery industry: The battery has to become an increasingly integrated component within the vehicle electric power system. J. Power Source 2005, 144, 438–460. [Google Scholar] [CrossRef]
  8. Budde-Meiwes, H.; Schulte, D.; Kowal, J.; Sauer, D.U.; Hecke, R.; Karden, E. DCA of lead acid batteries comparison of methods for conditioning and testing. J. Power Source 2012, 207, 30–36. [Google Scholar] [CrossRef]
  9. Pavlov, D.; Nikolov, P.; Rogachev, T. Influence of expander components on the processes at the negative plates of lead-acid cells on high-rate partial-state-of-charge cycling. Part II. Effects of carbon additives on the processes of charge and discharge of negative plates. J. Power Source 2010, 195, 4444–4457. [Google Scholar] [CrossRef]
  10. Pavlov, D.; Nikolov, P.; Rogachev, T. Influence of carbons on the structure of the negative active material of lead acid batteries and on battery performance. J. Power Source 2011, 196, 5155–5167. [Google Scholar] [CrossRef]
  11. Bozkaya, B.; Bauknecht, S.; Settelein, J.; Kowal, J.; Karden, E.; Giffin, G.A. Comparison of Dynamic Charge Acceptance Tests on Lead–Acid Cells for Carbon Additive Screening. Energy Technol. 2022, 10, 2101051. [Google Scholar] [CrossRef]
  12. Karden, E.; Jöris, F.; Budde-Meiwes, H.; Sauer, D.U. Test Methods for Dynamic Charge Acceptance (DCA) of Microhybrid Starter Batteries. In Proceedings of the 13ELBC European Lead Battery Conference, Paris, France, 25–28 September 2012. [Google Scholar]
  13. Blanke, H.; Bohlen, O.; Buller, S.; De Doncker, R.W.; Fricke, B.; Hammouche, A.; Linzen, D.; Thele, M.; Sauer, D.U. Impedance measurements on lead-acid batteries for state-of-charge, state-of-health and cranking capability prognosis in electric and hybrid electric vehicles. J. Power Source 2005, 144, 418–425. [Google Scholar] [CrossRef]
  14. Majchrzycki, W.; Jankowska, E.; Baraniak, M.; Handzlik, P.; Samborski, R. Electrochemical Impedance Spectroscopy and Determination of the Internal Resistance as a Way to Estimate Lead-Acid Batteries Condition. Batteries 2018, 4, 70. [Google Scholar] [CrossRef] [Green Version]
  15. Bauknecht, S.; Kowal, J.; Bozkaya, B.; Settelein, J.; Karden, E. The effects of cell configuration and scaling factors on constant current discharge and dynamic charge acceptance in lead-acid batteries. J. Energy Storage 2022, 45, 103667. [Google Scholar] [CrossRef]
  16. Bauknecht, S.; Kowal, J.; Bozkaya, B.; Settelein, J.; Karden, E. Jochen Settelein, Eckhard Karden, The Influence of Cell Size on Dynamic Charge Acceptance Tests in Laboratory Lead-Acid Cells. Energy Technol. 2022, 10, 2101053. [Google Scholar] [CrossRef]
  17. Karden, E.; Buller, S.; De Doncker, R.W. A method for measurement and interpretation of impedance spectra for industrial batteries. J. Power Source 2000, 85, 72–78. [Google Scholar] [CrossRef]
  18. Pavlov, D.; Petkova, G.; Rogachev, T. Influence of H2SO4 concentration on the performance of lead-acid battery negative plates. J. Power Source 2008, 175, 586–594. [Google Scholar] [CrossRef]
  19. Craig, D.; Vinal, G. Solubility of Lead Sulfate in Solutions of Sulfuric Acid, Determined by Dithizone with A Photronic Cell. J. Res. Natnl. Bur. Stand. Technol. 1939, 22, 55. [Google Scholar] [CrossRef]
  20. Schaeck, S.; Stoermer, A.; Albers, J.; Weirather-Koestner, D.; Kabza, H. Lead-acid batteries in micro-hybrid applications. Part II. Test proposal. J. Power Source 2011, 196, 1555–1560. [Google Scholar] [CrossRef]
  21. Doraswamy, S.; Srinivas, K.; Murthy, K.; Jagadish, M.; Rao, V.V. Effect of milled carbon as negative electrode additive for lead acid energy storage device. Mater. Proc. 2021, 38, 3131–3135. [Google Scholar] [CrossRef]
  22. Blecua, M.; Romero, A.; Ocon, P.; Fatas, E.; Valenciano, J.; Trinidad, F. Improvement of the lead acid battery performance by the addition of graphitized carbon nanofibers together with a mix of organic expanders in the negative active material. J. Energy Storage 2019, 23, 106–115. [Google Scholar] [CrossRef]
  23. Kramers, H.A. Die Dispersion und Absorption von Röntgenstrahlen. Phys. Z 1929, 30, 522–523. [Google Scholar]
  24. Kronig, R.D.L. On the theory of dispersion of X-rays. J. Opt. Soc. Am. 1926, 12, 547–557. [Google Scholar] [CrossRef]
  25. Boukamp, B.A. A Linear Kronig-Kramers Transform Test for Immittance Data Validation. J. Electrochem. Soc. 1995, 142, 1885–1894. [Google Scholar] [CrossRef]
  26. Hahn, M.; Schindler, S.; Triebs, L.-C.; Danzer, M.A. Optimized Process Parameters for a Reproducible Distribution of Relaxation Times Analysis of Electrochemical Systems. Batteries 2019, 5, 43. [Google Scholar] [CrossRef] [Green Version]
  27. Danzer, M.A. Generalized Distribution of Relaxation Times Analysis for the Characterization of Impedance Spectra. MDTI Batter. 2019, 5, 53. [Google Scholar] [CrossRef] [Green Version]
  28. Tikhonov, A.N. Numerical Methods for the Solution of Ill-Posed Problems; Springer: Dordrecht, The Netherlands, 2010. [Google Scholar]
  29. Randles, J.E.B. Kinetics of rapid electrode reactions. Diss. Faraday Soc. 1947, 1, 11–19. [Google Scholar] [CrossRef]
  30. Thele, M. A Contribution to the Modelling of the Charge Acceptance of Lead-Acid Batteries-Using Frequency and Time Domain Based Concepts. Ph.D. Thesis, RWTH Aachen University, Aachen, Germany, 2007. [Google Scholar]
  31. Barsoukov, E.; Kim, J.H.; Yoon, C.O.; Lee, H. Universal battery parameterization to yield a non-linear equivalent circuit valid for battery simulation at arbitrary load. J. Power Source 1999, 83, 61–70. [Google Scholar] [CrossRef]
  32. Takehara, Z.-I. Dissolution and precipitation reaction of lead sulfate in positive and negative electrodes in lead acid battery. J. Power Source 2000, 85, 29–37. [Google Scholar] [CrossRef]
  33. Soria, M.; Trinidad, F.; Lacadena, J.; Sánchez, A.; Valenciano, J. Advanced valve-regulated lead-acid batteries for hybrid vehicle applications. J. Power Source 2007, 168, 12–21. [Google Scholar] [CrossRef]
  34. Lam, L.; Louey, R. Development of ultra-battery for hybrid-electric vehicle applications. J. Power Source 2006, 158, 1140–1148. [Google Scholar] [CrossRef]
  35. Yahchouchi, N. Mesure de l’impédance d’un Accumulateur Tubulaire au Plomb: Application à la Détermination de la Capacité Électrique. Ph.D. Thesis, Université Pierre et Marie Curie, Paris, France, 1981. [Google Scholar]
  36. Huet, F. A review of impedance measurements for determination of the state-of-charge or state-of-health of secondary batteries. J. Power Source 1998, 70, 59–69. [Google Scholar] [CrossRef]
  37. Kirchev, A.; Mattera, F.; Lemaire, E.; Dong, K. Studies of the pulse charge of lead-acid batteries for photovoltaic applications: Part IV. Pulse charge of the negative plate. J. Power Source 2009, 191, 82–90. [Google Scholar] [CrossRef]
  38. D’Alkaine, C.; Mengarda, P.; Impinnisi, P. Discharge mechanisms and electrochemical impedance spectroscopy measurements of single negative and positive lead-acid battery plates. J. Power Source 2009, 191, 28–35. [Google Scholar] [CrossRef]
  39. Alao, O.; Barendse, P. Characterization of Lithium NCM and Sealed Lead Acid Batteries using Electrochemical Impedance Spectroscopy. In Proceedings of the IEEE PES/IAS PowerAfrica, Cape Town, South Africa, 28–29 June 2018; pp. 166–171. [Google Scholar]
  40. Kowal, J.; Budde-Meiwes, H.; Sauer, D.U. Interpretation of processes at positive and negative electrode by measurement and simulation of impedance spectra. Part I: Inductive semicircles. J. Power Source 2012, 207, 10–18. [Google Scholar] [CrossRef]
  41. Tenno, A.; Tenno, R.; Suntio, T. A method for Battery Impedance Analysis. J. Electrochem. Soc. 2004, 151, 806–824. [Google Scholar] [CrossRef]
  42. Schlesinger, M. Modern Aspects of Electrochemistry; Springer: New York, NY, USA, 2009; Volume 43, ISBN 978-0-387-49580-4. [Google Scholar]
  43. Lindbergh, G. Experimental determination of the effective electrolyte conductivity in porous lead electrodes in the lead-acid battery. Electrochim. Acta 1997, 42, 1239–1246. [Google Scholar] [CrossRef]
  44. Niya, S.M.R.; Hejabi, M.; Gobal, F. Estimation of the kinetic parameters of processes at the negative plate of lead-acid batteries by impedance studies. J. Power Source 2010, 195, 5789–5793. [Google Scholar] [CrossRef]
  45. Nguyen, T.-T.; Doan, V.-T.; Lee, G.-H.; Kim, H.-W.; Choi, W.; Kim, D.-W. Development of an Intelligent Charger with a Battery Diagnosis Function Using Online Impedance Spectroscopy. J. Power Electron. 2016, 16, 1981–1989. [Google Scholar] [CrossRef] [Green Version]
  46. Calborean, A.; Murariu, T.; Morari, C. Determination of current homogeneity on the electrodes of lead-acid batteries through electrochemical impedance spectroscopy. Electrochim. Acta 2019, 320, 134636. [Google Scholar] [CrossRef]
  47. Kwiecien, M.; Huck, M.; Badeda, J.; Zorer, C.; Komut, K.; Yu, Q.; Sauer, D.U. Variation of Impedance in Lead-Acid Batteries in the Presence of Acid Stratification. Appl. Sci. 2018, 8, 1018. [Google Scholar] [CrossRef] [Green Version]
  48. Hampson, N.; Lakeman, J. The oxidation of porous lead electrodes in Sulphuric acid solution. J. Power Source 1979, 4, 21–32. [Google Scholar] [CrossRef]
  49. Hampson, N.A.; Lazarides, C. The anodic oxidation of lead in H2SO4-based solutions to form soluble species. Surf. Technol. 1981, 14, 301–308. [Google Scholar] [CrossRef]
  50. Huck, M. Modelling the Transient Behaviour of Lead-Acid Batteries: Electrochemical Impedance of Adsorbed Species. Ph.D. Thesis, RWTH Aachen University, Aachen, Germany, 2020. [Google Scholar]
Figure 1. Micro cycles for superimposed current during electrochemical impedance spectrum.
Batteries 08 00066 g001
Figure 2. Normalized charge current of laboratory test cells obtained from the DCA test according to EN 50342-6:2015 for (a) complete cell: 8P8N/8P9N, (b) middle size cell: 3P2N and (c) small size cell: 2P1N (adapted from [16]).
Batteries 08 00066 g002
Figure 3. First semicircle of the negative half-cell obtained from EIS at 80% SoC of the laboratory test cells visualized in a Nyquist diagram for (a) complete cell: 8P8N/8P9N, (b) middle size cell: 3P2N and (c) small size cell: 2P1N.
Batteries 08 00066 g003
Figure 4. Negative half-cell EIS at 80% SoC of the laboratory test cells for (a) absolute value Z of the complete cell: 8P8N/8P9N, (b) phase shift of the complete cell: 8P8N/8P9N, (c) absolute value Z of the middle size cell: 3P2N, (d) phase shift of the middle size cell: 3P2N, (e) absolute value Z of the small size cell: 2P1N and (f) phase shift of the small size cell: 2P1N visualized in a Bode plot.
Batteries 08 00066 g004
Figure 5. DRT of the EIS at 80% SoC of the laboratory test cells for (a) complete cell: 8P8N/8P9N, (b) middle size cell: 3P2N and (c) small size cell: 2P1N.
Batteries 08 00066 g005
Figure 6. ECM for the EIS data.
Batteries 08 00066 g006
Figure 7. Negative half-cell EIS at 80% SoC and fit with ECM of the laboratory test cells for (a) complete cell: 8P8N/8P9N, (b) middle size cell: 3P2N and (c) small size cell: 2P1N visualized in a Nyquist diagram.
Batteries 08 00066 g007
Figure 8. Fitting result τ1 of the laboratory test cells for (a) complete cell: 8P8N/8P9N, (b) middle size cell: 3P2N and (c) small size cell: 2P1N.
Batteries 08 00066 g008
Figure 9. Fitting result R1 of the laboratory test cells for (a) complete cell: 8P8N/8P9N, (b) middle size cell: 3P2N and (c) small size cell: 2P1N.
Batteries 08 00066 g009
Figure 10. Fitting result C1 of the laboratory test cells for (a) complete cell: 8P8N/8P9N, (b) middle size cell: 3P2N and (c) small size cell: 2P1N.
Batteries 08 00066 g010
Table 1. Test cell setup and its nominal capacity, where P is the number of positive plates, and N is the number of negative plates (Reprinted from Ref. [16]).
Cell SizePlate Count
Type 1/Type 2
Nominal Capacity Cn
Type 1/Type 2
Complete cell8P8N/8P9N70 Ah
Middle size cells3P2N17.50 Ah/18.70 Ah
Small size cells2P1N8.75 Ah/9.30 Ah
Table 2. EIS test parameters.
ParameterValue
IDCI20/2
IAC,max0.5 A
fmin10 mHz
fmax6.5 kHz
T25 °C
SoC80%
ΔSoC2%
Table 3. Scaling factors according to the number of active plates within a cell (Reprinted from Ref. [16]).
Original Plate CountType 1: 8P8NType 2: 8P9N
Complete cell15/1616/18
Middle size cells4/164/18
Small size cells2/162/18
Table 4. Time constants determined with DRT of the EIS at 80% SoC of the laboratory test cells.
Type 1 EFB − CType 1 EFB + CType 2 EFB + C
Time ConstantComplete CellMiddle Size CellSmall Size CellComplete CellMiddle Size CellSmall Size CellComplete CellMiddle Size CellSmall Size Cell
τ0/sξ0.003--0.002--0.003--
τ1/sξ0.0720.080.100.060.0540.0440.0730.0560.056
τ2/sξ2.3592.321.0941.0942.8160.5682.9841.4360.451
τ3/sξ13.49511.195.8387.41515.93.62919.02519.0252.283
Table 5. Starting parameters, lower and upper limits for the ECM fit.
ParameterLower LimitStarting ValueUpper Limit
R0/ΩR0R0R0 + 0.05
L/μH020010,000
λL00.41
R1/Ω00.31
τ1/sξτ1τ1τ1
ξ10.8490.8490.849
R2/Ω00.41
τ2/sξτ2τ2τ2
ξ20.6640.6640.664
R3/Ω00.52
τ3/sξτ3τ3τ3
ξ30.750.750.75
Table 6. Parameters for the ECM fit and error.
Type 1 EFB − CType 1 EFB + CType 2 EFB + C
Time ConstantComplete CellMiddle Size CellSmall Size CellComplete CellMiddle Size CellSmall Size CellComplete CellMiddle Size CellSmall Size Cell
R0/Ω00.006200000.01190.01210
L/μH42010811.824946.813.12572772500
λL0.940.980.970.940.940.950.9510.18
R1/Ω0.40.420.520.340.3030.20.3090.280.16
τ1/sξ0.0720.080.100.060.0540.0440.0730.0560.056
ξ10.850.850.850.850.850.850.850.850.85
R2/Ω0.5340.5330.30.30.60.30.3840.30.3
τ2/sξ2.3592.321.0941.0942.8160.5682.9841.4360.451
ξ20.6640.6640.6640.6640.6640.6640.6640.6640.664
R3/Ω0.2180.621.160.411.4520.3660.370.1010.1
τ3/sξ13.49511.195.8387.41515.93.629 19.02519.0252.283
ξ30.750.750.750.750.750.750.750.750.75
error0.0420.0290.0660.0510.0470.0340.0360.0230.051
Publisher’s Note: MDPI stays neutral with regard to jurisdictional claims in published maps and institutional affiliations.

