
Novel Approach to Ensure Safe Power Supply for Safety-Relevant Consumers


1
Robert Bosch GmbH, Mittlerer Pfad 9, 70499 Stuttgart, Germany
2
Electrical Energy Storage Systems, Institute for Photovoltaics, University of Stuttgart, Pfaffenwaldring 47, 70569 Stuttgart, Germany
*
Author to whom correspondence should be addressed.
Batteries 2022, 8(5), 47; https://doi.org/10.3390/batteries8050047
Submission received: 5 April 2022
/
Revised: 11 May 2022
/
Accepted: 17 May 2022
/
Published: 19 May 2022
(This article belongs to the Special Issue The Precise Battery—towards Digital Twins for Advanced Batteries)
Abstract
:The 12 V powernet in vehicles must fulfill certain safety requirements due to the safety demand of consumers. A potential risk is undervoltage for a safety-relevant consumer, which leads to its fault. Therefore, a novel approach is presented in this study, which can predict the minimum terminal voltage for consumers. This consists of diagnostics of the wiring harness and of the lead-acid battery as well as predefined consumer currents. Using simulation, first the beginning of a drive cycle is simulated to determine the state of the powernet, and afterwards a critical driving maneuver is simulated to validate the predicted minimum terminal voltage. It demonstrates that the novel approach is able to predict a fault due to undervoltage. In addition to fulfilling safety requirements, the novel approach could be used to achieve additional availability and miniaturization of powernet components compared to the state of the art.
1. Introduction
Trends in the automotive industry toward automated driving, electrification and X-by-wire systems are leading to new opportunities to further improve the driving experience and comfort. However, this is also linked to new requirements for the 12 V powernet, also known as the power supply system. In addition to the requirement for voltage stability and load balance, the safe supply of safety-relevant consumers is another requirement. Therefore, new functions and electrical/electronic systems are required.
1.1. Powernet Requirements
Compliance with ISO 26262 is intended to ensure that the powernet fulfills the safety requirements (SR) of the consumers. To comply with this standard, new functions and electrical/electronic systems are required [1]. The SR for the powernet derived by electric power steering (EPS) are discussed in Figure 1.
To achieve the safety goal “Prevent sudden loss of steering assist”, it must be ensured that the EPS does not have an internal fault and that it is supplied with sufficient power. Safety requirement 2 must be ensured by the powernet and is divided into three subcategories.
- Safety requirement 2.1 Power feed: The power sources and storage can provide sufficient power for the EPS.
- Safety requirement 2.2 Power distribution: The provided power is safely transmitted from the power feed to the EPS.
- Safety requirement 2.3 Freedom from interference: Failure in the powernet may not lead to a fault of the EPS.
All three subcategories must be fulfilled simultaneously. Therefore, in the event of a failure in the powernet, a safe supply for the safety-relevant consumers must still be ensured. To provide a safe supply, the requirements of the safety-relevant consumers on the powernet are crucial. The decisive factor here is how long an ECU may have a minimum terminal voltage. These are defined, for example, in the LV124-1 or ISO16750-2 standards or are specified individually by the vehicle manufacturer [3]. When designing the powernet, limit values must be defined at which the system must not fail and at which voltage is necessary for the execution of a driving maneuver. An example is given in Kilian, which defines the minimum terminal voltage on the EPS as follows [2].
1.2. Powernet Architecture
Due to different requirements for the powernet, there are a wide variety of topologies in the automotive industry. Criteria such as voltage stability, reliability, costs, installation space or weight have an influence on the topology. Thus, the optimal topology is only possible by weighting the criteria [4,5].
In order to be able to operate the vehicle safely, the powernet architecture in Figure 2 must ensure safe supply in accordance with its consumers [6]. This architecture consists of a DCDC converter for power supply, a wiring harness for power transmission, and a battery as an energy storage. The difference in most of the present powernets is the power distribution module (PDM). This is similar to a fuse box to protect the cables against overcurrent and thus thermal incident. However, due to SR2.3, a quick disconnect is necessary. Therefore, a fuse box with a melting fuse cannot be used, and a fast and intelligent safety switch must be integrated [2].
The PDM is equipped with measurement technology and a bus interface for communication with other components in the vehicle. In this topology, the safety relevant consumers, such as EPS, a brake system, and other safety relevant consumers are connected individually to the PDM. In normal operation, the consumers are supplied by the DCDC converter via the wiring harness. If a failure in the powernet occurs, such as a fault of the DCDC converter or a non-safety-relevant consumer has a short circuit, then the safety switch in the PDM must separate the safety- and non-safety-relevant consumers from each other. This allows the SR2.3 to be fulfilled, but means that the safety-relevant consumer is only supplied via a single path connection, consisting of a safe power feed (SR2.1) and distribution (SR2.2). As consequence, this single path must then ensure safe supply against the fault of safety-relevant consumers due to undervoltage [1].
1.3. State of the Art
Even in the case when the safety-related consumers are supplied from only one source, two measures from the state of the art are presented in order to comply with the voltage limit out of Equation (1).
1.3.1. Dimensioning
In Ruf [7], the larger dimensioning of the cable cross section and battery size are discussed as measures. This means that a smaller voltage drop across the wiring harness and at the battery will result in higher voltage at the consumers. A powernet must be dimensioned in such a manner that it can sufficiently supply the consumers throughout the life cycle.
For example, a typical worst case assumption is to allow a voltage drop across the entire wiring harness between the source and consumer. The cable cross-section is dimensioned according to the current flow and expected aging. Connector systems in the wiring harnesses can potentially experience a significant increase in resistance [8]. This can be attributed to temperature, humidity and the friction of contact surfaces on each other [9]. It should be noted that the lead-acid battery also ages over its lifetime.
1.3.2. Insufficient Power Supply
Since the aging of powernet components can lead to the fault of safety-relevant consumers, these must be diagnosed accordingly. This is particularly relevant for the lead-acid battery since there are several failure modes [10]. One or more failures in combination can lead to an insufficient power feed. Therefore, it is crucial to diagnose the state of the battery for a safe power supply. With the help of diagnostics, it is possible to determine a critical undervoltage in advance and to replace the battery accordingly. In the state of the art, the ohmic resistance of the battery is used as an indicator of the battery performance.
2. Methods
To explain the relevant supply of the safety-relevant consumers, a novel approach for determining the wiring harness and the battery is described, as well as the combination of both. Subsequently, a stimulation is presented with which a validation of the approach is possible and how the approach must be adapted to the simulation.
2.1. Novel Approach
The purpose is to develop a diagnostic approach that ensures the safe supply of the safety-relevant consumers. A function is developed called “state of function powernet” (SOFPN), which diagnoses the minimum terminal voltage for the safety-relevant consumers in critical situations to prevent a fault due to undervoltage.
2.1.1. Safety-Relevant Section of Powernet
To demonstrate how the SOFPN works, the supply of the EPS in a critical situation is considered. Figure 3 shows the 12 V lead-acid battery with an electronic battery sensor. This battery must provide sufficient power and is therefore essential for a safe power feed. The wiring harness is represented via the resistors , , and . Each of these resistors contains the resistance of the connector systems and the cable. Since a higher resistance in the wiring harness leads to a lower voltage at the EPS, safe transfer must be ensured. The resistance across the grounds and between the battery sensor and the battery are negligible, as these have very low resistance. To implement the SOFPN, two individual diagnostics are required.
2.1.2. Wiring Harness Diagnostics
The first part of the SOFPN is the state detection of the wiring harness. To do this, the resistance of the wiring harness is determined. The required measuring points and relevant resistances are shown in Figure 4. The resistor contains the resistances of the connector systems as well as the cable resistance itself. The resistor consists of the resistances of the connector systems and cable between the EPS and ground connection [11]. Due to the power demand of the EPS, current flows along the path through resistors and . The current is measured by the PDM and leads to a voltage drop across the resistors. This voltage drop can be calculated by the voltage at the PDM and the voltage at the EPS . The voltage is determined by the EPS itself and transmitted to the PDM via a communication bus.
This allows the resistance of the EPS path to be diagnosed during a current excitation. The diagnostics can determine the state of the EPS wiring harness path during steering maneuvers.
The same method is used for the path between PDM and battery with resistors and according to the Figure 3. The required voltage information in this case is provided by the electronic battery sensor via a communication bus.
By means of determining the resistances between battery and PDM as well as PDM and EPS, the safe transmission from the power source to consumer is ensured. Thus, the fulfillment of safety requirement 2.2 can be ensured.
2.1.3. Battery Diagnostics
The second part of the SOFPN is the state detection of the battery with the electronic battery sensor. The battery must provide sufficient power for the safety-relevant consumers. For this purpose, the minimum terminal voltage of the battery is predicted based on the battery condition and a predefined current profile.
Figure 5 shows an example of a predefined current profile which describes the power demand of the relevant consumers in a critical situation. This consists of a base load and covers the supply of active consumers. After a base duration of to cover the time between a failure in the powernet and the start of a critical driving maneuver, the current demand of the driving dynamic consumers adds up with the base load to the peak current . The driving maneuver to be covered is an evasive maneuver with intervention of the electronic stability control, and the peak duration lasts until safe state is reached. When the battery has to provide this current profile, as a result, the terminal voltage of the battery drops. This can be predetermined by the battery diagnostics, which predicts the minimum terminal voltage at the battery using the following equation.
The quiescent voltage is determined by a longer-term observation of the terminal voltage. The ohmic resistance is diagnosed during a current excitation. This excitation is generated by the current demand of consumers in the powernet, such as the rear window heating or interior fan. In combination with the maximum current demand , the voltage drop over the ohmic resistance is determined. The influence of the polarization voltage must not be neglected. The polarization voltage takes into account the dynamic characteristics of the battery and can be traced back to electrode reactions and acid diffusion processes. This voltage drop can be derived by an evaluation of the ohmic resistance as well as the predefined current profile. These result in the minimum voltage prediction shown in Figure 5 [12]. This voltage prediction is determined at the beginning of the drive cycle and is adjusted when the state of the battery changes, for example, due to charging. In any case, the predicted voltage must be lower than the minimum actual voltage when the current profile occurs to avoid incorrectly indicating that the actual voltage is predicted to be higher. For this purpose, measurement inaccuracies and a safety margin are included, which leads to a large error between the actual and predicted voltage. The described battery diagnostics using a predefined current profile predict the minimum terminal voltage before a critical situation occurs. Thus, the safe supply can be ensured, and the safety requirement 2.1 is fulfilled.
2.1.4. State of Function Powernet
By combining the wiring harness diagnostics, Section 2.1.2, with a predefined maximum current demand and the battery diagnostics, Section 2.1.3, the minimum voltage at the EPS is predicted. This allows to check a defined voltage limit by the following equation.
The minimum predicted voltage at the EPS is determined by the minimum voltage of the battery and the maximum voltage drop across the wiring harness path. This also requires the maximum current of the EPS as well as the maximum current output of the battery. The maximum current output of the battery is assumed to be that according to the current profile in Figure 5. The maximum current demand of the EPS can be derived either by the specification of the EPS, which can be up to [13], or by measurements or simulations of driving maneuvers. This means that a potential fault of the EPS due to undervoltage can be detected by using the SOFPN.
2.2. Validation of SOFPN
A simulation environment consists of several individual models and is used to validate the SOFPN. In addition to the advantages of a simulation, such as reproducibility and controllability of influencing factors, critical driving situations can be investigated without any risk.
2.2.1. Simulation Models
In order to be able to validate the SOFPN, the simulation environment consists of a vehicle model with driver, driving dynamic consumers and the powernet with connected SOFPN.
Figure 6 shows the components and interfaces of the simulation environment. It also illustrates the interaction between powernet and vehicle dynamics. The power supply interface provides a voltage value for each of the driving dynamic consumers. The power demand interface reflects the current consumption of each of these consumers into the powernet model. Thus, there is an interaction between the powernet model and driving dynamic consumers. For example, a lower voltage has the effect of reducing the current demand by derating the driving dynamic of the consumers [14].
The feedback by the driving dynamic consumers on the vehicle model mainly consists of the torque acting on the wheels due to the braking system and the steering angle of the EPS. The driver model controls the driving dynamic consumers by actuating the brake pedal or applying torque on the steering wheel.
Figure 6 helps to develop an understanding of powernet failures and how they are propagated through the whole vehicle level. If a failure occurs in the powernet, this has no direct influence on the driver or the vehicle model. In this case, the failure would only be noticed through a change in the characteristics or loss of a driving dynamic consumer. This poses the risk of an undetected failure in the powernet. Once a corresponding driving dynamic consumer is required, as in the case of emergency braking, the fault would be noticed by a significantly longer braking distance. In this case, there is only a short time left for the driver to react accordingly, which can be safety critical. The SOFPN should detect such failures in the powernet and can warn the driver in advance of a critical situation.
In order to produce viable results, validated models are required. Corporate simulation models of EPS and braking system are used. Furthermore, the powernet and SOFPN are modeled. These individual models are executed in MATLAB® Simulink® of The MathWorks®. The vehicle dynamics along with the driver are modeled using CarMaker® of IPG Automotive. The models are connected using Model.CONNECTTM of AVL List located in Graz, Austria.
2.2.2. Configuration of SOFPN
The SOFPN is intended to detect an undervoltage for safety-relevant consumers in advance so that the vehicle can be taken into a safe state in time. For this purpose, the most critical driving maneuver must be defined when configuring the SOFPN. In this context, the power intensity is not the only determining factor. For example, parking has a high power demand. However, there is very little hazard to the driver due to the low vehicle speed. Therefore, a power-intensive evasive maneuver with emergency braking is considered. To ensure sufficient power by the battery, a current profile, as shown in Figure 5, must be created for this purpose. In this case, it is derived from previous simulation results and is as described in Section 2.1.3.
Figure 7 shows the configuration of the current profile for the battery diagnostics. The base load lasts for a base duration to cover the active loads as well as the time between a failure in the powernet and the start of the critical driving maneuver. Subsequently, the additional power demand of the driving dynamic consumers EPS and braking system during an evasive maneuver with emergency braking is shown. This peak load lasts for a peak duration . If other consumers are active, the current profile may change since all consumers have an influence on the base load. This can change over the course of the drive cycle as different consumers, such as seat heaters, are switched on or off.
Figure 7 also includes the maximum current demand of the EPS and the maximum current output of the battery during the execution of the driving maneuver. These maximum currents are necessary to predict the voltage drop across the wiring harness. The driving dynamic consumers have the most impact on the peak load. If hardware or the software changes, the current profile would have to be adjusted.
3. Results
In the following, the novel approach is evaluated in the simulation model, and the simulation results are presented. Subsequently, advantages of the function compared to the state of the art are considered.
3.1. Simulation Results
By using the simulation environment and configuration, the SOFPN is presented. The start of a drive cycle is simulated to illustrate the SOFPN of the initial condition and to receive a first minimum predicted voltage at the EPS . Afterwards, a critical driving maneuver is simulated to compare the predicted voltage against the actual voltage at the EPS.
3.1.1. Simulation at the Start of Drive Cycle
The first state detection of the powernet takes place at the start of the drive cycle. In the Figure 8, the SOFPN is applied when departing from a driveway. For this purpose, the temporal progress of the minimal voltage prediction and the position of the vehicle are visualized.
Before the motor is started at the point in time 1, the quiescent voltage is determined. In this example, the battery is then excited by the current demand of the rear window heating.
At time point 2, the performance of the battery is defined by determining the ohmic resistance and the polarization voltage .
At time point 3, the excitation provided by the battery current draw, which charges the battery, is sufficient to determine the wiring harness path between the PDM and the battery. Thus, the resistance of the battery wiring harness path is known.
At time point 4, steering causes an excitation to determine the resistance of the EPS wiring harness path . This allows a prediction to be made about the performance of the relevant wiring harness path in Figure 3 at the start of the driving cycle. From then on, safety requirements 2.1 and 2.2 can be fulfilled.
The minimum predicted voltage at the EPS is determined. Therefore, a fault of the EPS due to undervoltage is excluded. In this example, the predicted voltage can be determined at the start of the drive cycle. If the state of the powernet components changes, it is detected by the diagnostics, and the predicted voltage is adjusted during the drive cycle.
The result of the SOFPN is only valid when all individual diagnostics are valid. This means that active excitation may be necessary. In the case of the EPS wiring harness path, this could be implemented by active excitation of the EPS before starting the drive cycle. Excitation of the battery to determine the ohmic resistance and the battery wiring harness path can also be performed by changing the voltage output of the DCDC converter.
3.1.2. Simulation of Critical Driving Maneuver
The operating principle of the SOFPN is demonstrated in Figure 9 using the example of critical driving maneuver. In this example, the DCDC converter as a steady power supply fails. An evasive maneuver with emergency braking is then performed due to an obstacle.
At time point 1, the DCDC converter fails. As a result, only the battery can provide the needed power. The voltage at the EPS already drops from this point on, since the base load of the consumers results in a voltage drop at the battery and across the wiring harness between battery and PDM. The power demand between time points 1 and 2 is covered by the base load in Figure 7.
At time point 2, the evasive maneuver with emergency braking begins. This results in high power demand, since the braking system and the EPS are required for the driving dynamic intervention. The time period between time points 2 and 4 corresponds to the peak load in Figure 7.
At time point 3, the minimum actual voltage at the EPS is reached. The minimum predicted voltage at the EPS from the Figure 8 is below this actual minimum voltage.
At time point 4, the maneuver ends. From this moment on, the vehicle is in a safe state, as it is slowed down.
For comparison, the permissible voltage range is plotted in Figure 10 with the maximum duration in the lowest actual voltage range as well as the predicted voltage. The minimum predicted voltage at EPS is slightly below the minimum actual voltage at EPS . Furthermore, the voltage is not in a critical voltage range, so sufficient power is available for the EPS.
The reason that the voltage prediction is below the minimum actual voltage can be traced back to the following circumstances.
- The individual diagnostics are always conservative. This can prevent influencing variables, such as measurement accuracy, causing the supply of the EPS to be falsely diagnosed as safe.
- The base duration of the predefined current profile in Figure 7 lasts longer than is required in the driving maneuver.
- The voltage at the EPS and brake system is already below the nominal voltage range. This causes the systems to reduce the power demand by itself. This mechanism provides increased voltage stability in critical situations. Such derating results in a lower current demand, concluding in a less demanding peak load and maximum EPS current than in the predefined current profile in Figure 7.
In the example shown, the components of the powernet, such as the state of the wiring harness, were parameterized with realistic values. The voltage drop across the wiring harness is predicted to be . This is significantly lower than the assumed worst case voltage drop in the state of the art. Thus, the voltage at the battery can drop lower, compared to the state of the art, which leads to additional availability. Depending on the parameterization of the powernet components, the minimum actual voltage at the EPS may change when performing this driving maneuver. However, a different state of the powernet leads to an adjusted voltage prediction of the SOFPN. A different scenario would be that an undervoltage at the EPS is predicted at the start of the drive cycle. Then, if there is no measure available, the vehicle would have to be stopped.
The SOFPN is capable of ensuring safe supply for the EPS, despite the DCDC converter fault. This is especially relevant when a separation through the safety switch is necessary, according to the safety requirement 2.3. In such situations, the SOFPN provides information as to whether the supply can be ensured in the safety-relevant part of the powernet.
3.2. Advantages by Using SOFPN
Four advantages arise from using the SOFPN. First, by combining the state of the battery and the wiring harness, the state of the safety-relevant powernet can be determined. As a result, an undervoltage due to a single- or multiple-point fault in the powernet can be excluded, and safety requirements 2.1 and 2.2 can be fulfilled. Second, through the diagnostics, the degraded components can be identified and repaired. Thus, premature or unnecessary repairs can be prevented. Third, the state of the powernet can be diagnosed at the start of the drive cycle so that the operating strategy can be adjusted and/or the driver can be warned. Fourth, compared to the state of the art mentioned in Section 1.3, the availability can be increased and/or powernet components can be miniaturized.
3.2.1. Increased Availability
Additional availability is gained by combining the individual diagnostics of the battery and the wiring harness. If the minimum voltage of the EPS is taken as a reference for the critical undervoltage, the maximum voltage drop across the entire wiring harness and the minimum battery voltage result in the following equation.
The minimum voltage at the EPS is assumed to be . In the state of the art, a critical condition of the powernet is only diagnosed based on the battery, and a voltage drop across the entire wiring harness is assumed. This results in a minimum voltage at the battery . Under this consideration, the SOFPN is compared with the state of the art.
Depending on the state of the battery and wiring harness, there are different warning thresholds between the state of the art and the SOFPN. If either output a result below the corresponding line, a warning is triggered. These were classified into the areas in Figure 11.
- The wiring harness and battery are in good condition. Neither approaches give a warning, and it is safe to perform the critical driving maneuver.
- The wiring harness is in bad state. The SOFPN issues a warning. The driving maneuver cannot be performed safely because the voltage at the EPS could drop below 8 V. However, there is no warning according to the state of the art. Thus, there is a risk of fault of the EPS during a critical driving maneuver.
- Due to a bad state of the battery, a severe voltage drop at the battery is to be expected. According to the state of the art, a warning would be issued. However, due to the low voltage drop across the wiring harness, no fault of the EPS is to be expected during a critical driving maneuver. This means that a warning would be issued according to the state of the art and no warning would be reported by the SOFPN. As a result, availability can be increased by using the SOFPN in these powernet conditions.
- Both approaches correctly issue a warning.
3.2.2. Miniaturization
Rather than using the SOFPN to provide additional availability, there is also the possibility of miniaturizing powernet components. In order to compare the potential for miniaturization, it is analyzed which nominal battery capacity can ensure the voltage stability for the EPS. For this purpose, the current profile in Figure 7 is used as the reference current profile. The state of the art approach and SOFPN must predict when undervoltage at the EPS could occur. The battery and wiring harness should be expected to age over their lifetime. In this case, a state of health is considered the beginning of life.
In the case of the wiring harness for the EPS path as well as the battery path , age according to wiring harness state of health results in a linear double resistance increase. This increase in resistance can be attributed to the degradation of the connector systems [9].
The battery is assumed to have a state of charge and a temperature . There are several aging mechanisms in a battery, which have different effects on the behavior of the battery. In order to be able to simulate aging in the battery model, the battery state of health assumes increased ohmic resistance and reduction of nominal battery capacity with the help of the parameter .
As described in Section 1.3, a maximum voltage drop across the entire wiring harness is assumed, and the ohmic resistance is monitored to ensure safe power feed.
Figure 12 shows the battery capacity required for the state of the art approach and the SOFPN to exclude undervoltage for a safety-relevant consumer. In the state-of-the-art approach on the left side, the nominal battery capacity can be operated up to a battery state of health until a warning occurs due to potential undervoltage at the EPS. All other batteries with a capacity smaller than the nominal battery capacity are shown here to be not capable of providing sufficient voltage stability. The boundaries are vertical because the state of the wiring harness is always assumed to be the worst case voltage drop.
By using the SOFPN, smaller battery capacities can be used until a warning due to potential undervoltage is given, since an advanced battery diagnostic is used and the wiring harness is taken into account. As a result, a nominal battery capacity can be operated up to a battery state of health , depending on the wiring harness state of health . A nominal battery capacity has a higher availability than a nominal battery capacity in the state-of-the-art approach. Even the usage of a nominal battery capacity would be possible. However, this is associated with a loss of availability with the progression of aging. However, the potential for miniaturization is given by the fact that not all wiring harnesses increase their resistance over the lifetime [15].
The possibility of installing a smaller nominal battery capacity is particularly relevant for electric vehicles. These do not require a high cranking current to start the combustion engine. In addition, the high-voltage battery can recharge the 12 V battery when the vehicle is at standstill. As a result, the requirement for a large battery capacity no longer applies, and miniaturization is feasible. Depending on the requirements, such as the current profile, the possibility of miniaturization may vary. The same procedure can also be applied to a reduction in the cable cross-section. The SOFPN has great potential to save costs and weight, thus conserving resources.
4. Discussion
By combining two advanced diagnostics into one to determine the state of function of the powernet, the voltage for safety-relevant consumers can be safeguarded. In this way, the defined safety requirements can be fulfilled. The novel approach was proven successful for safeguarding against undervoltage at the EPS. However, it can also be applied to other components, such as the braking system. By using a simulation, it was proven that the voltage prediction at the EPS works for an evasive maneuver with emergency braking. The applicability to other maneuvers is only related to an adjustment of the current profile and maximum current demand of the driving dynamic consumers. The further advantages of the novel approach are the additional availability and the possibility to miniaturize powernet components. This approach can also be applied to other powernet topologies if the power feed and distribution can be diagnosed suitably.
In the next steps, an interface to the energy management will be developed. This would allow active measures to be taken against a predicted undervoltage or a specific excitation of the powernet to be requested. An investigation regarding which driving maneuvers need to be safeguarded is reasonable in the context of functional safety. This and the adaptation of the novel approach to more complex powernet topologies and driving dynamic consumers is particularly relevant in the context of highly automated and autonomous driving. Finally, the validation of the novel approach will be performed in a test vehicle.
Author Contributions
Conceptualization, L.B., M.L., J.M. and K.P.B.; methodology, L.B., M.L. and J.M.; software, L.B.; validation, L.B.; formal analysis, L.B., M.L. and J.M.; investigation, L.B., M.L. and J.M.; resources, L.B.; data curation, L.B.; writing—original draft preparation, L.B.; writing—review and editing, L.B.; visualization, L.B.; supervision, M.L., J.M. and K.P.B.; project administration, L.B. All authors have read and agreed to the published version of the manuscript.
Funding
This research received no external funding.
Institutional Review Board Statement
Not applicable.
Informed Consent Statement
Not applicable.
Data Availability Statement
Not applicable.
Conflicts of Interest
The authors declare no conflict of interest.
Abbreviations
The following abbreviations are used in this manuscript:
| SR | Safety requirements |
| EPS | Electric power steering |
| PDM | Power distribution module |
| SOFPN | State of function powernet |
| Batt | Battery |
| WH | Wiring harness |
| Pred | Predicted |
| Act | Actual |
| Nom | Nominal |
References
- Koehler, A.; Bertsche, B. An Approach of Fail Operational Power Supply for Next Generation Vehicle Powernet Architectures. In Proceedings of the 30th European Safety and Reliability Conference and 15th Probabilistic Safety Assessment and Management Conference, Venice, Italy, 1–5 November 2020; Baraldi, P., Di Maio, F., Zio, E., Eds.; Research Publishing Service: Singapore, 2020; pp. 60–67. [Google Scholar]
- Kilian, P.; Kohler, A.; van Bergen, P.; Gebauer, C.; Pfeufer, B.; Koller, O.; Bertsche, B. Principle Guidelines for Safe Power Supply Systems Development. IEEE Access 2021, 6, 107751–107766. [Google Scholar] [CrossRef]
- Standard ISO 16750-2; Road Vehicles—Environmental Conditions and Testing for Electrical and Electronic Equipment—Part 2: Electrical Loads. European Standards: Brussels, Belgium, 2012; Volume 11.
- Brabetz, L.; Ayeb, M.; Lehmann, J.; Loewer, B. Evaluation of Future Topologies and Architectures for High-Reliability Electrical Distribution Systems. SAE Int. J. Adv. Curr. Pract. Mobil. 2020, 4, 2347–2355. [Google Scholar]
- Ruf, F.; Schill, M.M.; Barthels, A.; Kohler, T.P.; Michel, H.; Froeschl, J.; Herzog, H. Topology and Design Optimization of a 14 V Automotive Power Net Using a Modified Discrete PSO in a Physical Simulation. In Proceedings of the IEEE Vehicle Power and Propulsion Conference (VPPC), Beijing, China, 15–18 October 2013; pp. 1–7. [Google Scholar]
- Standard ISO 26262-3:2018; Road Vehicles—Functional Safety—Part 3: Concept Phase. European Standards: Brussels, Belgium, 2018; Volume 12.
- Ruf, F. Auslegung und Topologieoptimierung von Spannungsstabilen Energiebordnetzen. Ph.D. Thesis, Technical University, Munich, Germany, 17 December 2015. [Google Scholar]
- Bayern Innovativ. Failure Rates for Automotive Wiring System Components—Expected Values and Conditions. Available online: https://www.bayern-innovativ.de/en/page/working-group-and-guide-asil-metrics-in-the-on-board-network (accessed on 10 May 2022).
- Bierwirth, F.; Froeschl, J.; Gebert, J.; Herzog, H. Determining Vehicle Energy Paths’ Remaining Useful Life using Design of Experiments. In Proceedings of the Fifteenth International Conference on Ecological Vehicles and Renewable Energies (EVER), Monte-Carlo, Monaco, 10–12 September 2020; pp. 1–7. [Google Scholar]
- Conradt, R.; Heidinger, F.; Birke, K.P. Methodology for Determining Time-Dependent Lead Battery Failure Rates from Field Data. Batteries 2021, 7, 39. [Google Scholar] [CrossRef]
- Gehring, R. Beitrag zur Untersuchung und Erhöhung der Spannungsstabilität des Elektrischen Energiebordnetzes im Kraftfahrzeug. Ph.D. Thesis, Technical University, Munich, Germany, 26 November 2013. [Google Scholar]
- Schoch, E.; Koenigsmann, M.; Kizler, J.; Schmucker, C.; Kronenberg, B.; Bremmer, M.; Schoettle, R.; Ruch, M. Monitoring techniques for 12-V lead-acid batteries in automobiles. In Lead-Acid Batteries for Future Automobiles; Garche, J., Karden, E., Moseley, P.T., Rand, D.A.J., Eds.; Elsevier: Amsterdam, The Netherlands, 2017; pp. 415–442. [Google Scholar]
- Pfeffer, P.; Harrer, M. Lenkungshandbuch, 2nd ed.; Springer Fachmedien: Wiesbaden, Germany, 2013; pp. 347–409. [Google Scholar]
- Hohmann, M. Ein Synthetischer Ansatz zur Auslegung von Kfz-Bordnetzen unter Berücksichtigung Dynamischer Belastungsvorgänge. Ph.D. Thesis, Technical University, Ilmenau, Germany, 9 December 2010. [Google Scholar]
- Bierwirth, F.; Grottenthaler, Y.; Tippe, L.; Taube, J.; Froeschl, J.; Gebert, J.; Herzog, H. Predictive Diagnosis of E-Fuse-Protected Supply Paths in Vehicle Low-Voltage Energy Systems. In Proceedings of the International Conference on Electric and Electronic Systems in Hybrid and Electric Vehicles and Electrical Energy Management (EEHE), Essen, Germany, 8–9 November 2021. [Google Scholar]
Figure 1.
Hierarchical safety requirements derivation for the safety goal [2].
Figure 1.
Hierarchical safety requirements derivation for the safety goal [2].
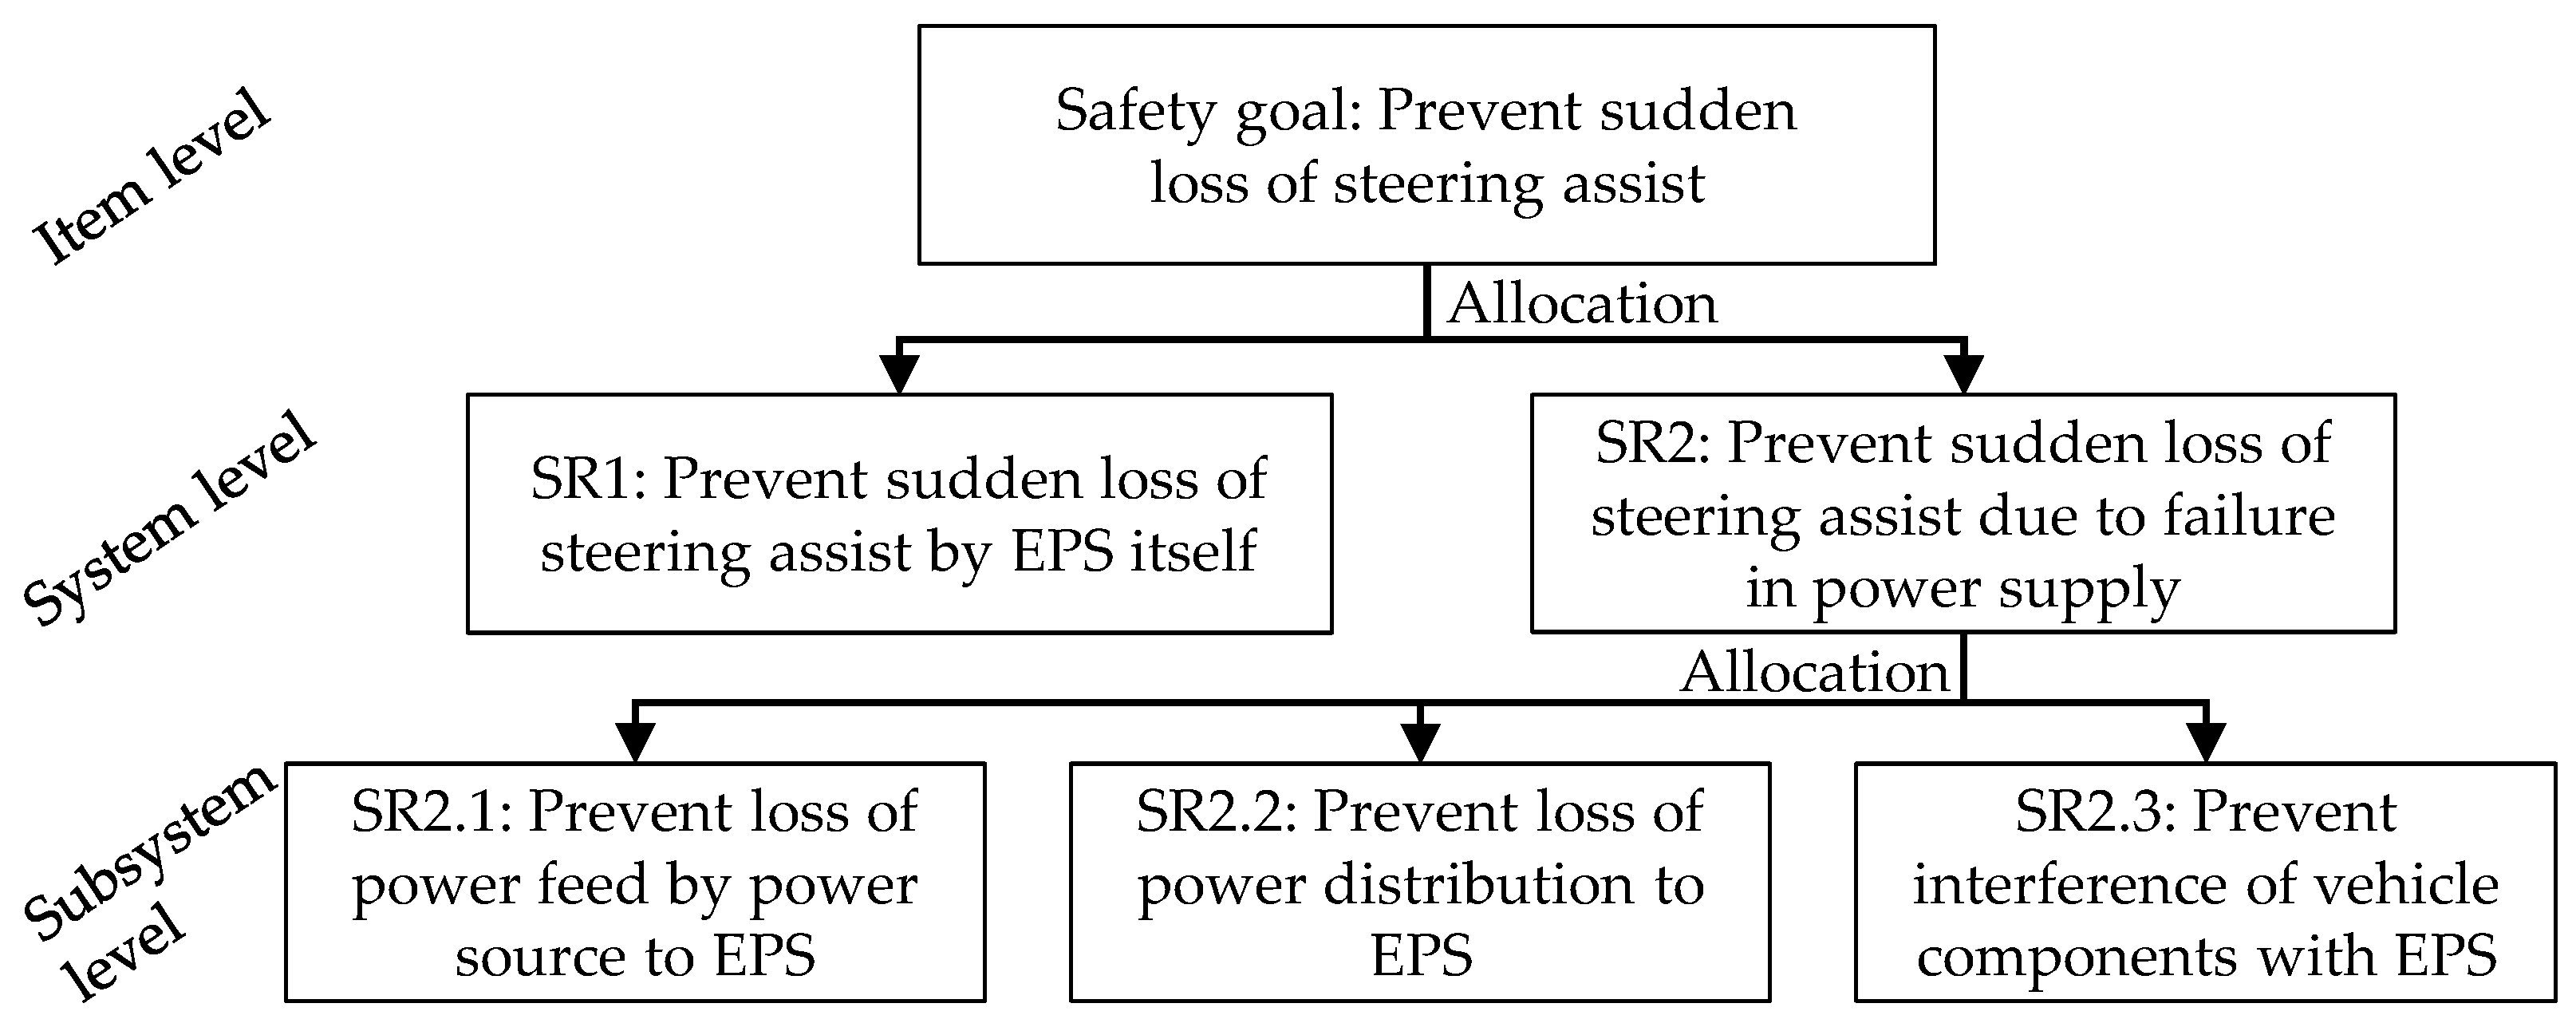
Figure 2.
Powernet topology design to potentially ensure safe supply for safety-relevant consumers [1].
Figure 2.
Powernet topology design to potentially ensure safe supply for safety-relevant consumers [1].

Figure 3.
Safety-relevant powernet topology to supply the electric power steering by lead-acid battery via four wiring harness sections.
Figure 3.
Safety-relevant powernet topology to supply the electric power steering by lead-acid battery via four wiring harness sections.

Figure 4.
Measuring points of wiring harness diagnostics for determining the resistance between power distribution module, electric power steering and ground.
Figure 4.
Measuring points of wiring harness diagnostics for determining the resistance between power distribution module, electric power steering and ground.
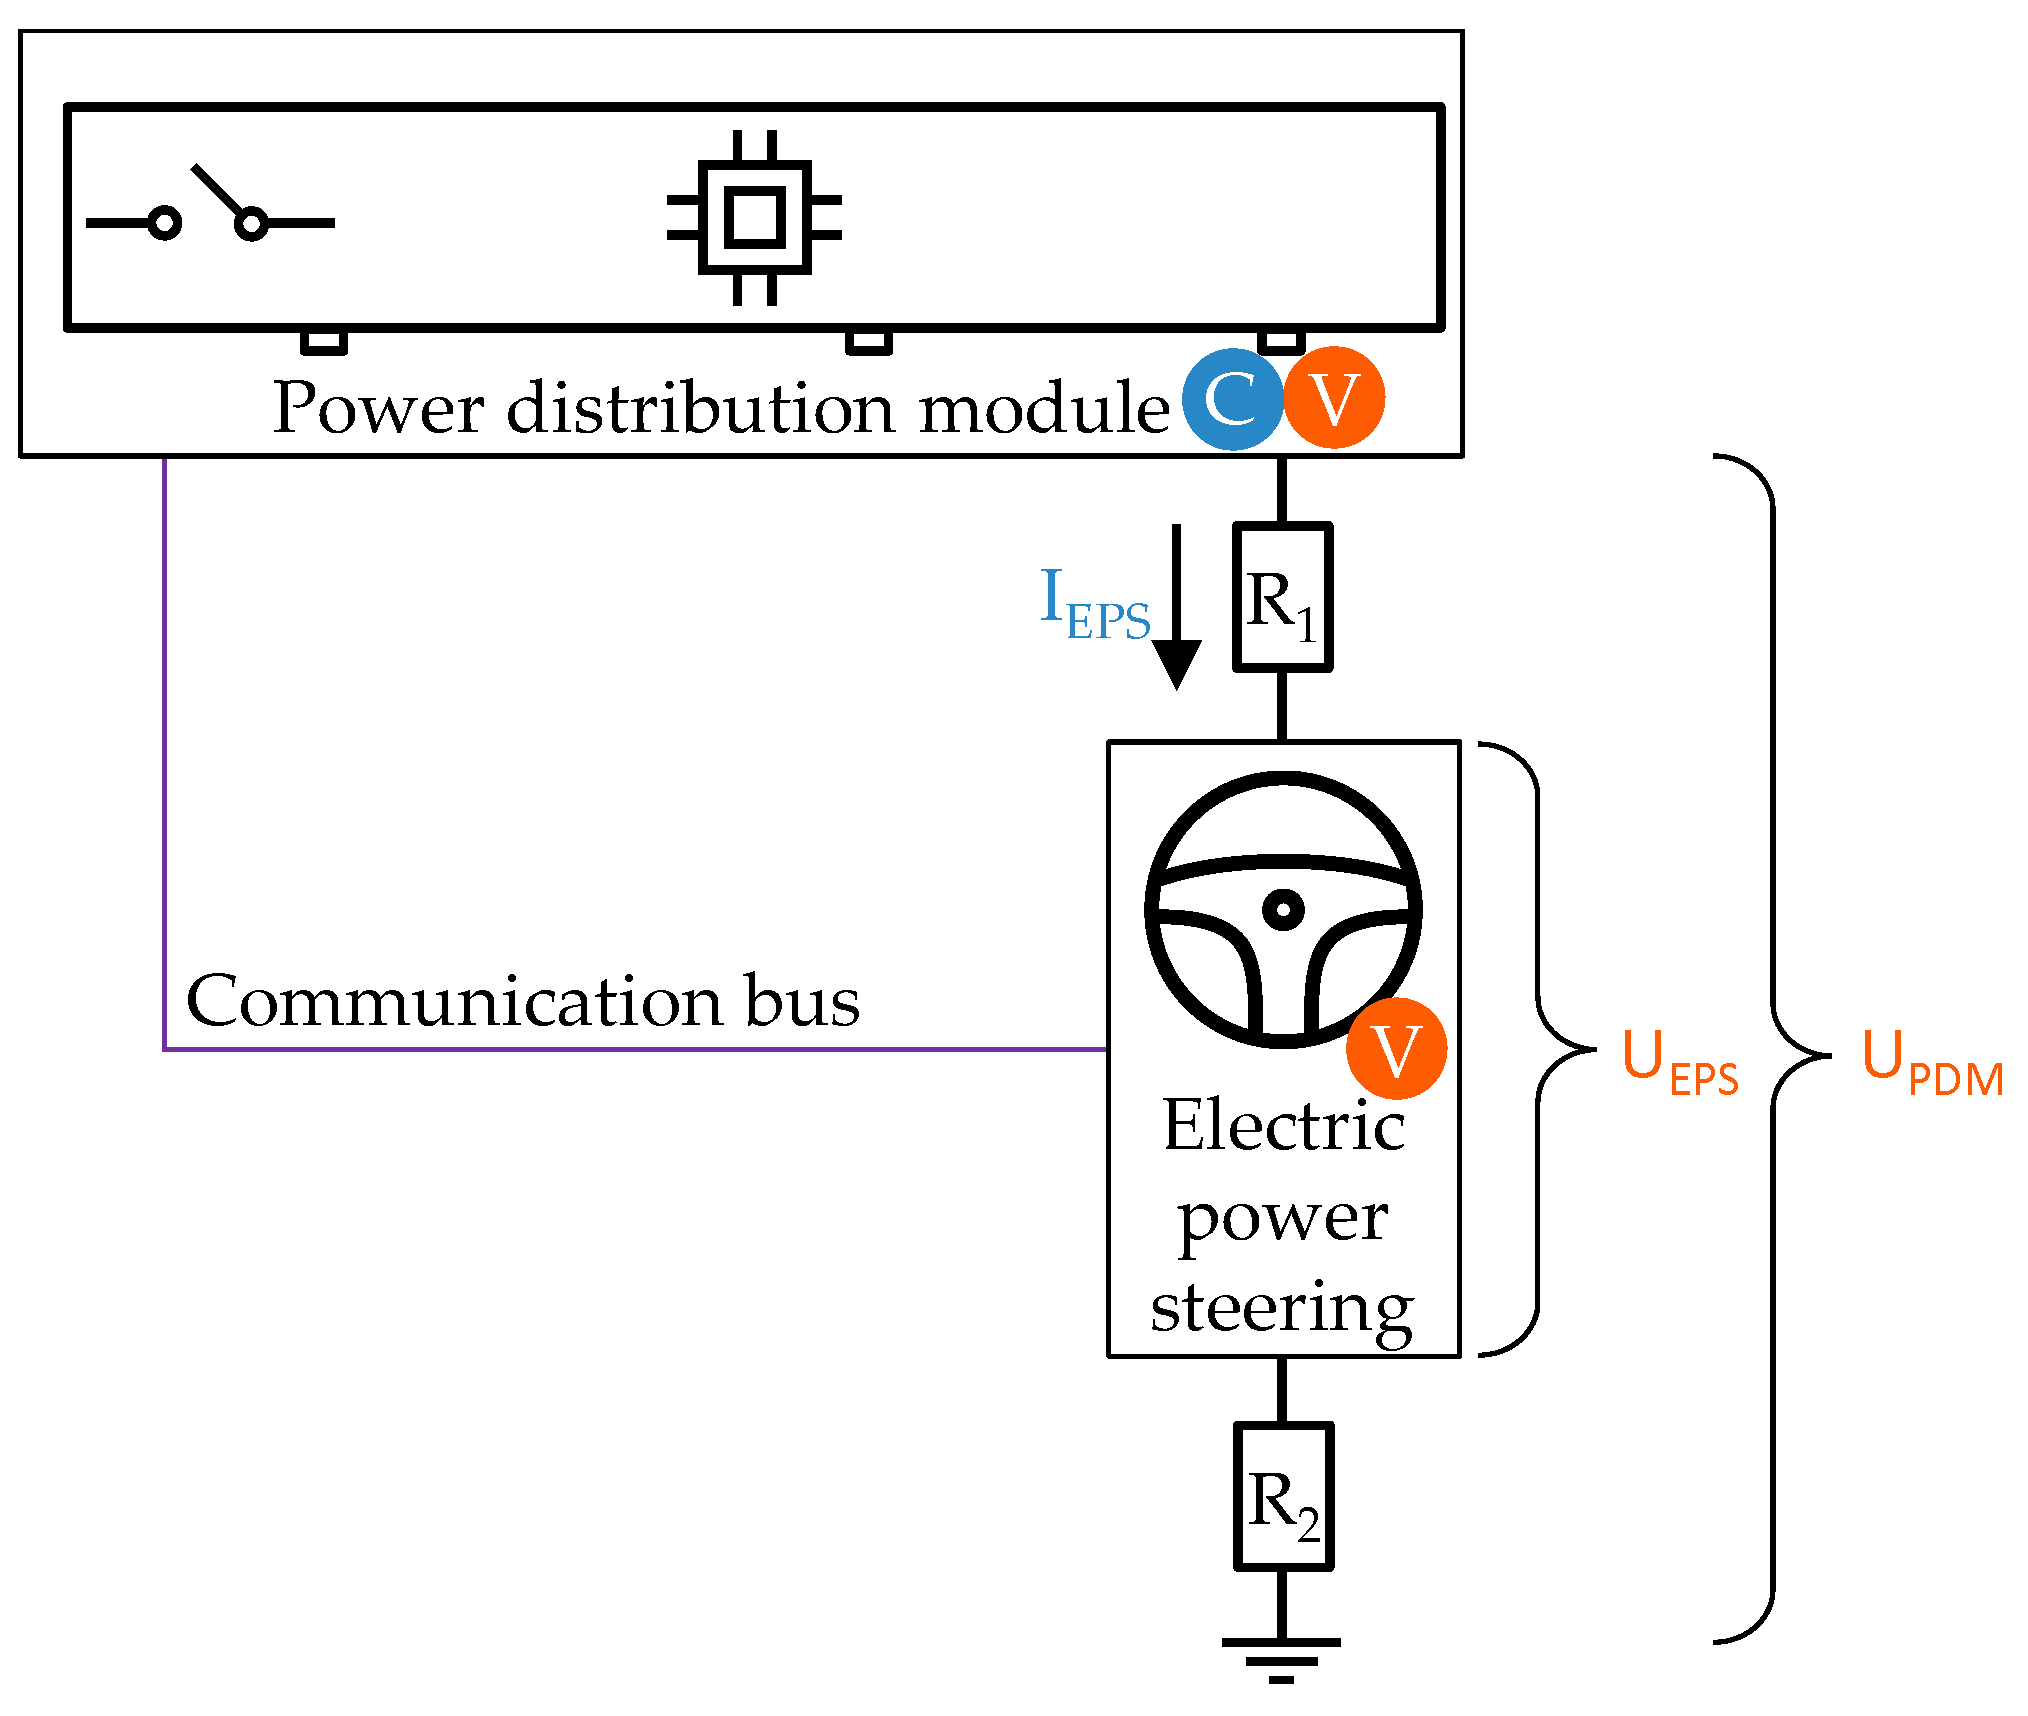
Figure 5.
Comparison of minimum predicted battery voltage calculated by the battery diagnostics using a predefined current profile versus minimum actual battery voltage of a battery model.
Figure 5.
Comparison of minimum predicted battery voltage calculated by the battery diagnostics using a predefined current profile versus minimum actual battery voltage of a battery model.

Figure 6.
Design and interfaces of the simulation environment to validate the SOFPN using three different simulation tools.
Figure 6.
Design and interfaces of the simulation environment to validate the SOFPN using three different simulation tools.

Figure 7.
Derivation of the current profile to safeguard the critical driving maneuver based on the current demand from previous simulation. Total current demand results from addition of , and .
Figure 7.
Derivation of the current profile to safeguard the critical driving maneuver based on the current demand from previous simulation. Total current demand results from addition of , and .

Figure 8.
Determination of the state of powernet by using the SOFPN at the start of the drive cycle. Visualization of chronological progression and status of the diagnostics with the respective vehicle position.
Figure 8.
Determination of the state of powernet by using the SOFPN at the start of the drive cycle. Visualization of chronological progression and status of the diagnostics with the respective vehicle position.
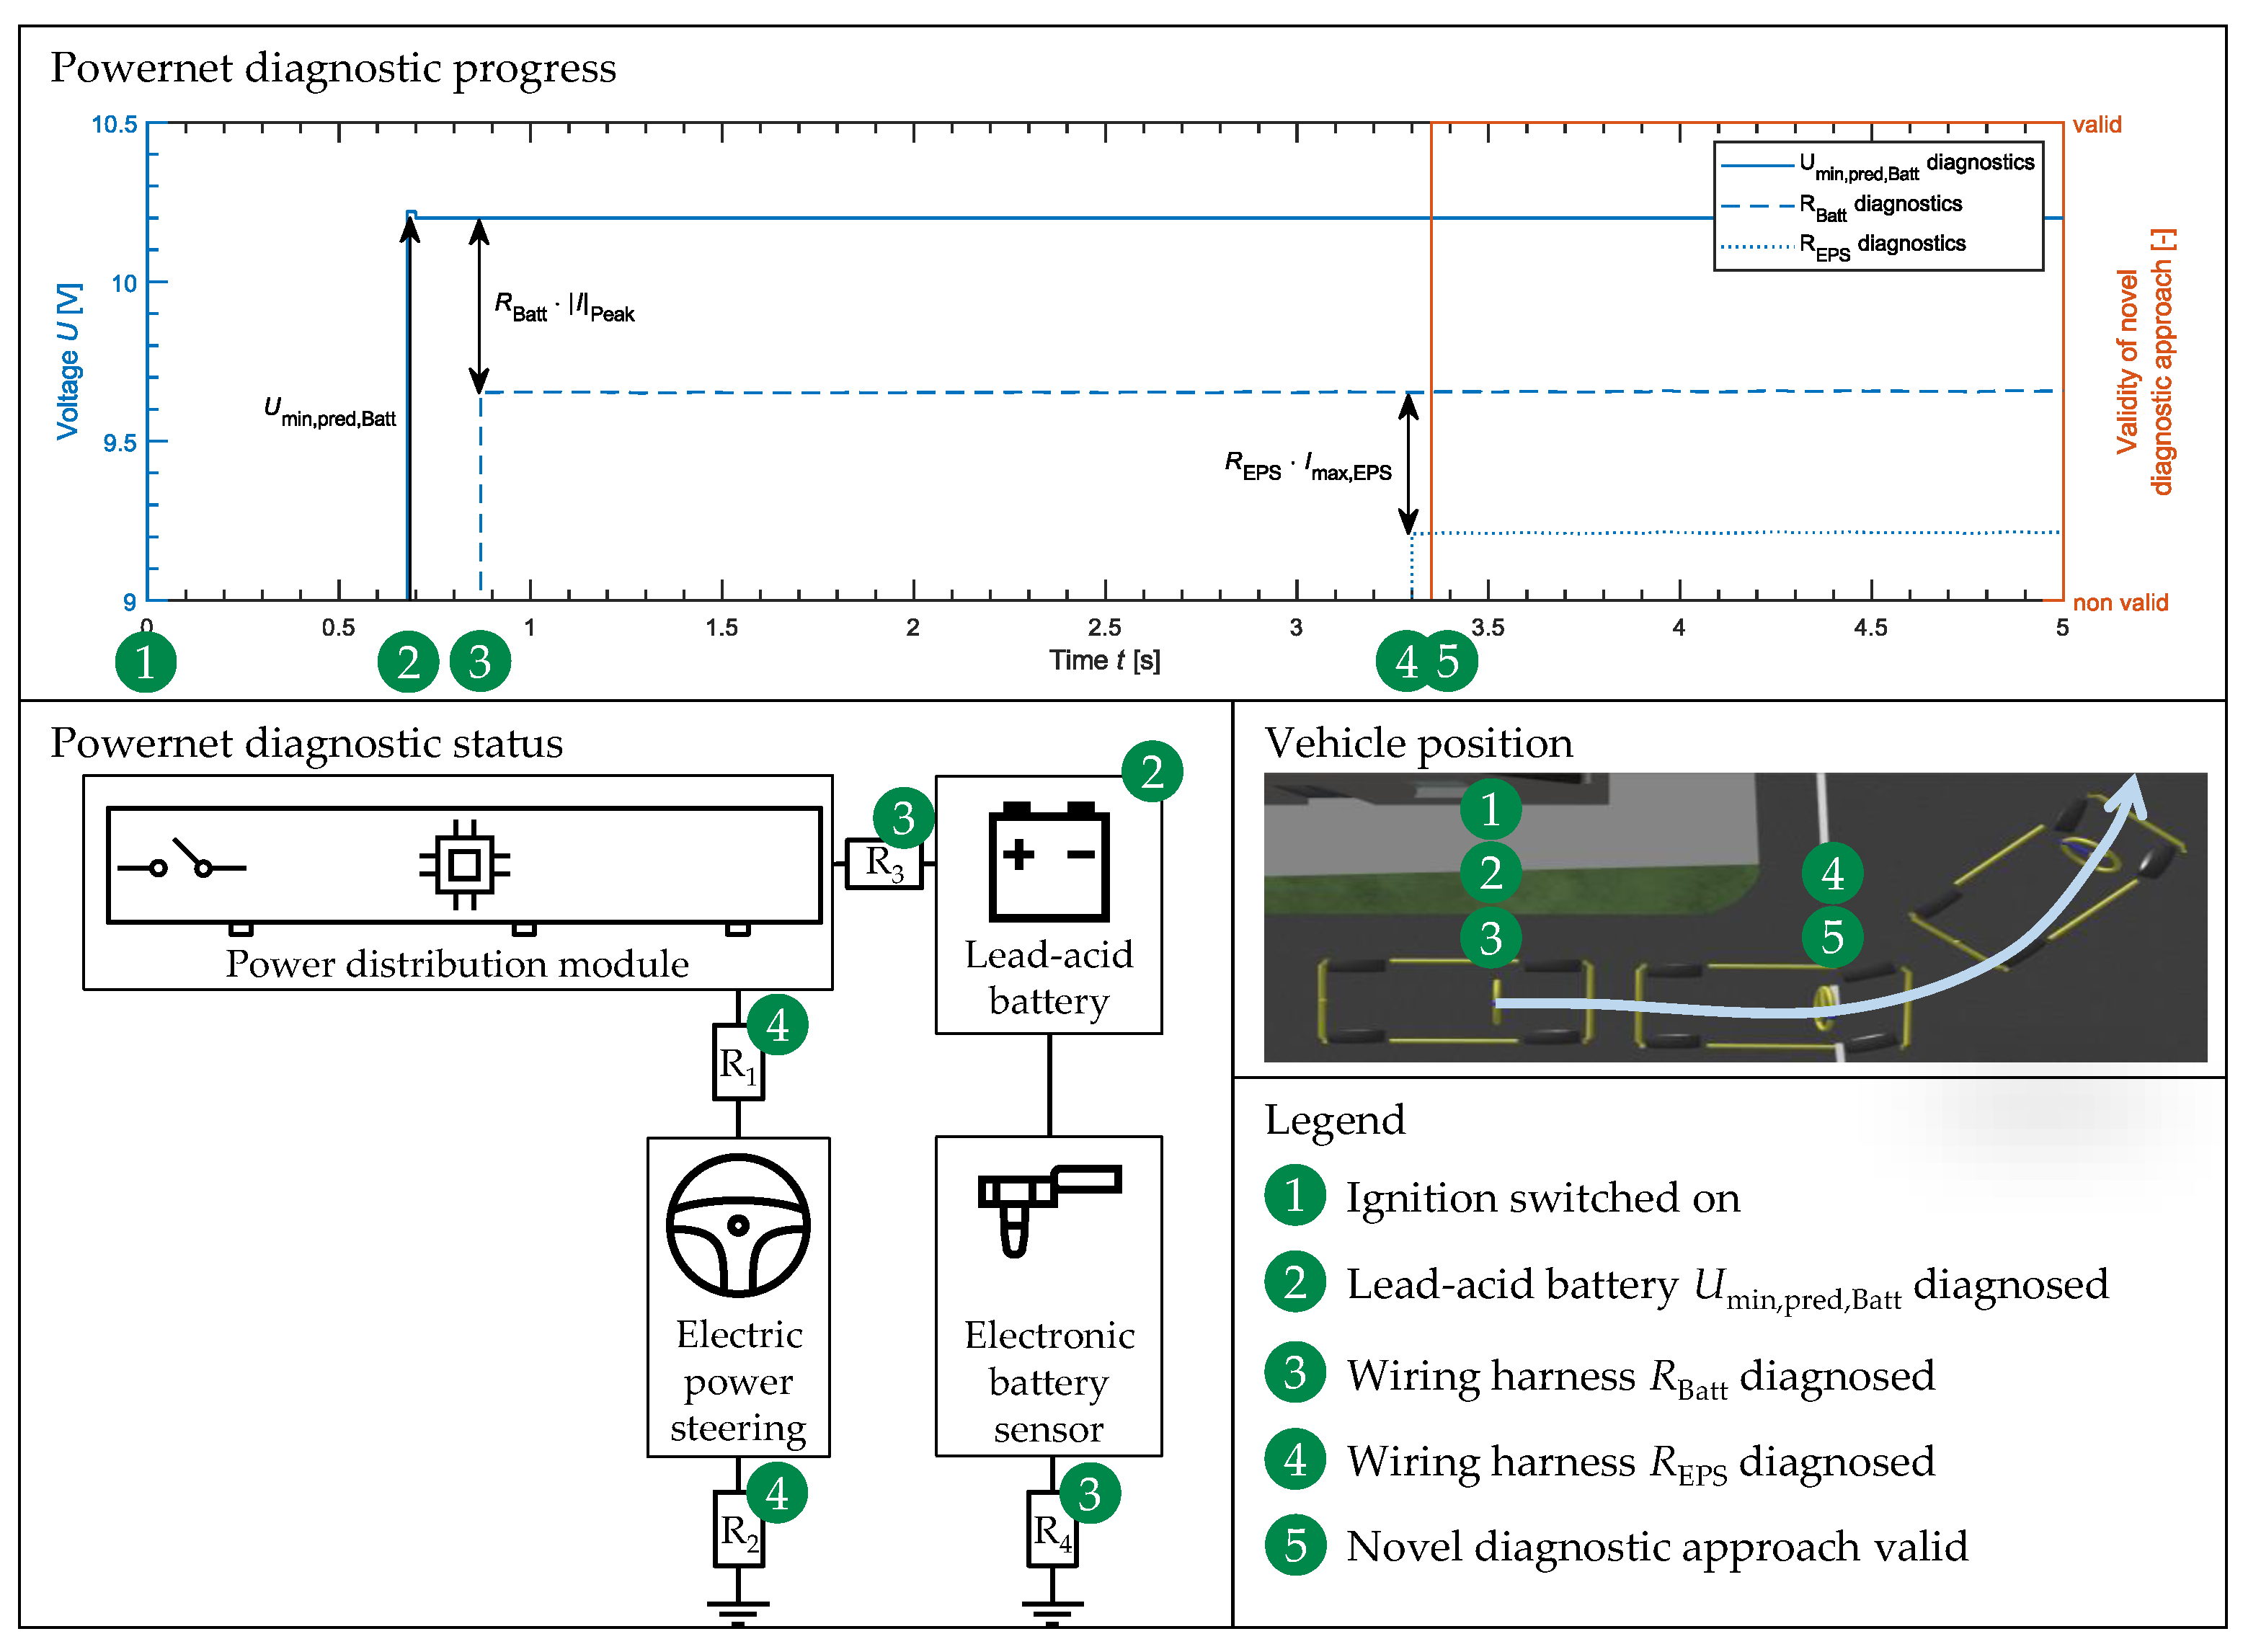
Figure 9.
Comparison of the predicted voltage by the SOFPN with the actual voltage at the EPS in the event of a DCDC converter fault and subsequently evasive maneuver including emergency braking.
Figure 9.
Comparison of the predicted voltage by the SOFPN with the actual voltage at the EPS in the event of a DCDC converter fault and subsequently evasive maneuver including emergency braking.
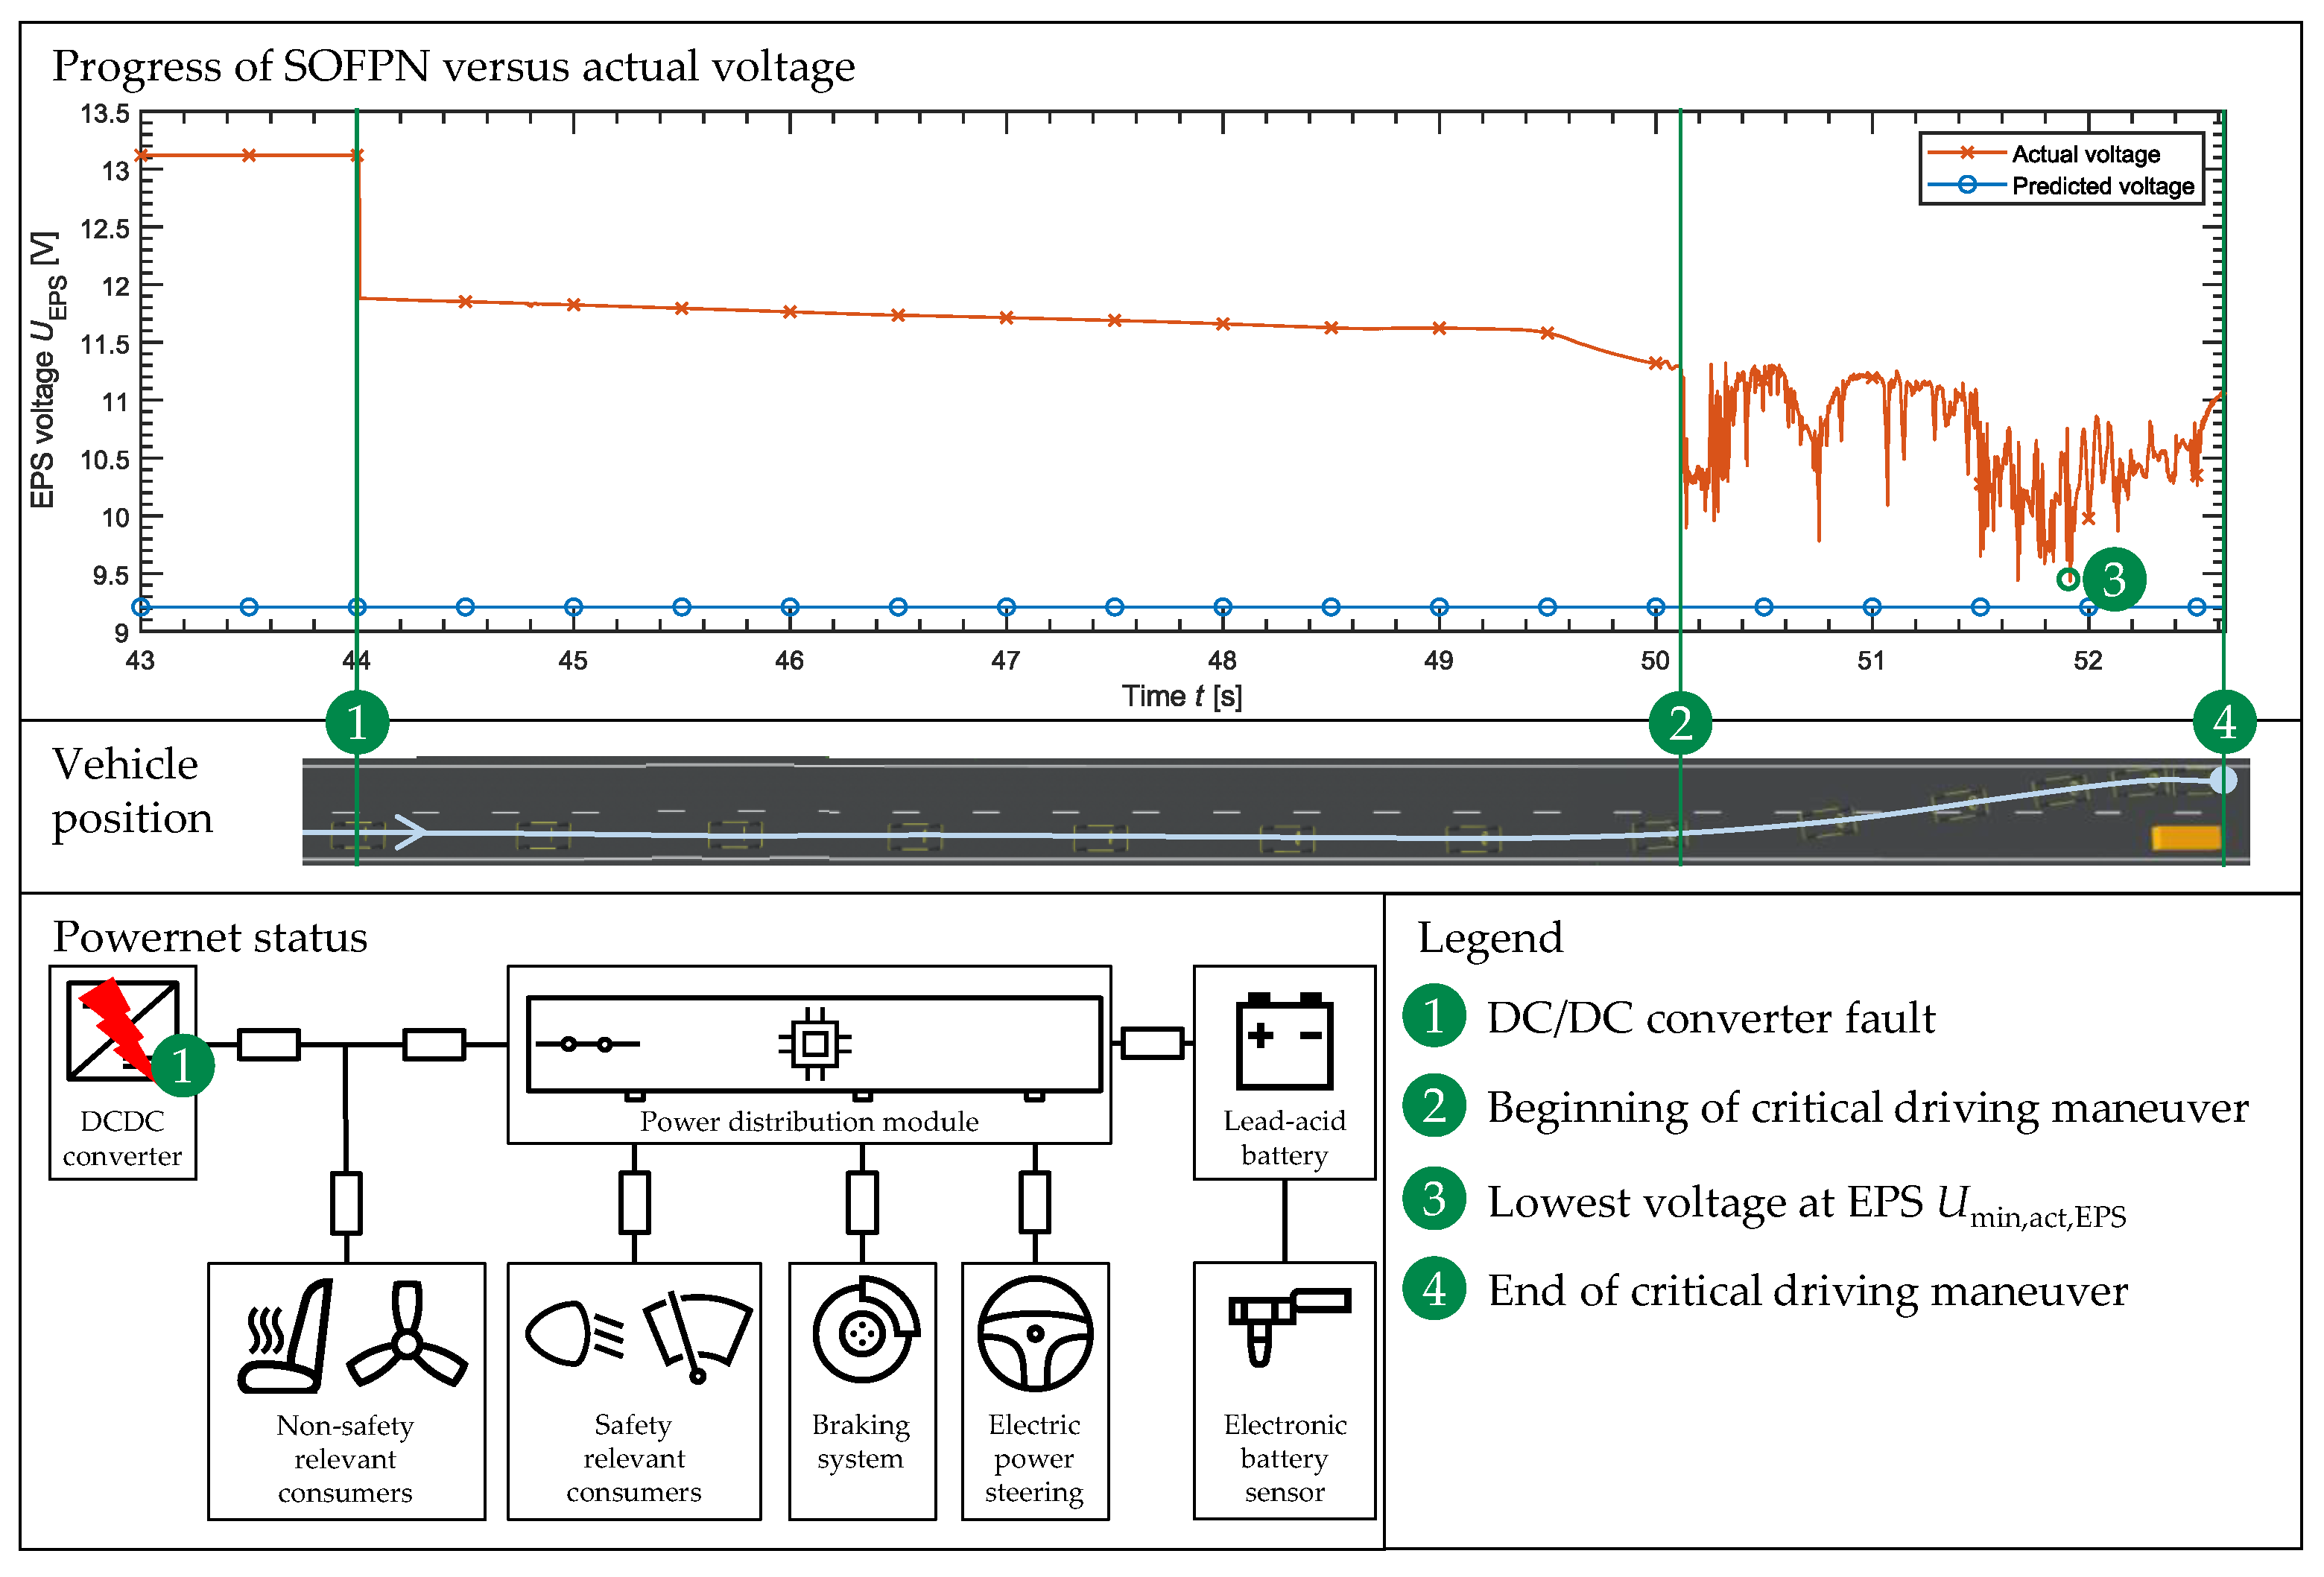
Figure 10.
Comparison of minimum actual voltage versus minimum predicted voltage at the EPS during execution of critical driving maneuver with evaluation of maximum duration in permissible voltage range as described by Kilian [2].
Figure 10.
Comparison of minimum actual voltage versus minimum predicted voltage at the EPS during execution of critical driving maneuver with evaluation of maximum duration in permissible voltage range as described by Kilian [2].

Figure 11.
Comparison of the warning threshold for different powernet states between the state of the art and SOFPN for the evaluation of availability.
Figure 11.
Comparison of the warning threshold for different powernet states between the state of the art and SOFPN for the evaluation of availability.

Figure 12.
Comparison of different nominal battery capacities between state of the art and the SOFPN, considering battery and wiring harness aging.
Figure 12.
Comparison of different nominal battery capacities between state of the art and the SOFPN, considering battery and wiring harness aging.

Publisher’s Note: MDPI stays neutral with regard to jurisdictional claims in published maps and institutional affiliations. |
© 2022 by the authors. Licensee MDPI, Basel, Switzerland. This article is an open access article distributed under the terms and conditions of the Creative Commons Attribution (CC BY) license (https://creativecommons.org/licenses/by/4.0/).
Share and Cite
MDPI and ACS Style
Braun, L.; Le, M.; Motz, J.; Birke, K.P. Novel Approach to Ensure Safe Power Supply for Safety-Relevant Consumers. Batteries 2022, 8, 47. https://doi.org/10.3390/batteries8050047
AMA Style
Braun L, Le M, Motz J, Birke KP. Novel Approach to Ensure Safe Power Supply for Safety-Relevant Consumers. Batteries. 2022; 8(5):47. https://doi.org/10.3390/batteries8050047
Chicago/Turabian StyleBraun, Lars, Minh Le, Jürgen Motz, and Kai Peter Birke. 2022. "Novel Approach to Ensure Safe Power Supply for Safety-Relevant Consumers" Batteries 8, no. 5: 47. https://doi.org/10.3390/batteries8050047
Note that from the first issue of 2016, this journal uses article numbers instead of page numbers. See further details here.