
Online State-of-Health Estimation of Lithium-Ion Battery Based on Incremental Capacity Curve and BP Neural Network


1
School of Electric Power, South China University of Technology, Guangzhou 510641, China
2
Guangdong HYNN Technologies Co., Ltd., Dongguan 523001, China
3
College of Artificial Intelligence and Electrical Engineering, Guizhou Institute of Technology, Guiyang 550003, China
*
Author to whom correspondence should be addressed.
Batteries 2022, 8(4), 29; https://doi.org/10.3390/batteries8040029
Submission received: 22 February 2022
/
Revised: 11 March 2022
/
Accepted: 15 March 2022
/
Published: 23 March 2022
(This article belongs to the Special Issue Batteries and Supercapacitors Aging Ⅱ)
Abstract
:Lithium-ion batteries (LIBs) have been widely used in various fields. In order to ensure the safety of LIBs, it is necessary to accurately estimate of the state of health (SOH) of the LIBs. This paper proposes a SOH hybrid estimation method based on incremental capacity (IC) curve and back-propagation neural network (BPNN). The voltage and current data of the LIB during the constant current (CC) charging process are used to convert into IC curves. Taking into account the incompleteness of the actual charging process, this paper divides the IC curve into multiple voltage segments for SOH prediction. Corresponding BP neural network is established in multiple voltage segments. The experiment divides the LIBs into five groups to carry out the aging experiment under different discharge conditions. Aging experiment data are used to establish the non-linear relationship between the decline of SOH and the change of IC curve by BP neural network. Experimental results show that in all voltage segments, the maximum mean absolute error does not exceed 2%. The SOH estimation method proposed in this research makes it possible to embed the SOH estimation function in battery management system (BMS), and can realize high-precision SOH online estimation.
1. Introduction
Due to its small size, being light weight, high energy density, low self-discharge rate, long cycle life, and no memory effect [1], lithium-ion batteries (LIBs) are widely used in electric vehicles (EVs), hybrid electric vehicles (HEVs), and battery energy storage stations (BESS). Whether they are used in EV, HEV, or BESS, LIBs need to be managed by battery management system (BMS). BMS includes the functions of three modules: battery monitoring, battery state estimation, and battery charge and discharge management. In addition, BMS also includes LIB heating technology [2] and consistency evaluation of series-connected battery systems [3]. Among them, the main function of the battery state estimation module is to estimate the state of charge (SOC), state of health (SOH), state of power (SOP), and state of energy (SOE) of LIB [4]. As an indicator of battery health, SOH is used to guide battery users to use the battery. The active material of lithium will be irreversibly consumed as the battery charge–discharge cycle progresses, which will lead to a decline in the health of LIB, which is manifested in the decline in capacity, power, thermal stability, etc. [5,6,7]. When the SOH of LIB is reduced to a certain level, the battery needs to be decommissioned and replaced with a new battery to ensure the safety of the battery. Therefore, accurately estimating the SOH of LIB is of great significance to improving the safety of the battery. However, due to differences in battery working mode, working environment, aging history, etc., achieving high-precision SOH online estimation is still a thorny challenge [8,9].
There are three types of indicators for measuring SOH: SOHc based on capacity [10], SOHr based on internal resistance [11], and SOHp based on peak power [4]. Among them, just as the fuel tank capacity of a traditional fuel vehicle reflects the volume of gasoline that a fuel vehicle can store, SOHc can reflect the battery’s ability to store energy [12,13,14]. It is pointed out in IEEE standard 1188.1996 that when the battery capacity is reduced to 80%, that is, when the SOHc < 80%, the battery needs to be decommissioned. Therefore, SOHc is widely used to measure battery health. Unless otherwise specified, SOH in the following refers to SOHc based on capacity.
Plenty of methods have been proposed to estimate SOH of LIB. Hu et al. introduces the degradation mechanism of battery SOH, and makes a timely and comprehensive review of battery lifetime prognostic technologies [15]. The literature [15] also divides battery lifetime prediction technology into model-based, data-driven, and hybrid methods, and introduces the latest progress of various methods. According to the principle of action, the SOH estimation methods can be divided into experimental measurement method, equivalent model method, data-driven method, and hybrid method. The experimental measurement method performs full charge and discharge measurement of LIB under specific conditions to measure the LIB capacity, and an accurate true value of SOH can be obtained. Scipioni et al. disassembled the LIB, and performed necessary tests on the positive electrode, negative electrode, separator, electrolyte, or gas production to obtain the aging condition or SOH of the LIB [16]. Liu et al. proposed a SOH measurement method of LIB that does not damage LIB [17]. They performed full charge and discharge tests on the battery under specific conditions, analyzed the attenuation of the LIB, and performed SOH diagnosis. The experimental measurement method can obtain high-precision SOH estimation value, but it requires measurement under specific conditions and is not suitable for SOH online estimation. Therefore, the experimental measurement method is usually used to obtain the true value of SOH. The equivalent model method attempts to determine SOH by calculating parameters that are sensitive to battery capacity degradation, mainly including electrochemical mechanism models [18], equivalent circuit models [11,19,20,21], and empirical models [22,23]. The equivalent model method is convenient to embed BMS to realize online estimation, but the accuracy of its SOH estimation still depends on the accuracy of the battery model parameters. The data-driven method treats the LIB as a black box, and only uses the data that can be directly measured in the actual operation of the battery, such as terminal voltage, terminal current, and battery temperature, combined with particle filter, Bayesian estimation, genetic algorithm, support vector machine, or artificial neural network [24,25,26,27,28,29] for SOH estimation. Sbarufatti et al. [29,30,31,32,33] used the historical charge–discharge voltage, charge–discharge current, charge–discharge time and temperature of LIBs as health factors, and trained neural networks to find the nonlinear relationship between SOH and health factors, and obtained good SOH estimates accuracy. The literature [34] developed two hybrid data-driven models, which combined the traditional linear support vector regression (LSVR) and Gaussian process regression (GPR) to estimate the life of lithium-ion battery. When only the data of the first 100 cycles are used, the error value of the method proposed in document 2 in training and testing is very low. In addition, many scholars have proposed hybrid estimation methods based on equivalent model method and data-driven method. Chen et al. [13,35] used the Kalman filter for the adaptive correction of the LIB equivalent circuit model, and proposed a SOH hybrid estimation method based on the Kalman filter and the LIB resistor-capacitor (RC) equivalent circuit.
The above studies used low-dimensional health factors to estimate SOH, such as the charge–discharge voltage, charge–discharge current, charge–discharge time, or temperature of LIBs. Although the low-dimensional health factors are easy to obtain in the actual battery system, it is difficult to establish a relationship between the low-dimensional health factors and the decline of SOH, and is easily affected by measurement errors. For example, when using the charging voltage curve of a LIB as health factor, although the deterioration of the SOH will cause the charging voltage curve to change in the time dimension, the trend of the curve will still not change. This requires the SOH estimation algorithm to have higher feature extraction capabilities. In addition, low-dimensional health factors, such as the constant current charging time of LIB, require a complete charging process, which means that the battery needs to be charged from 0% SOC through a constant current and constant voltage (CC-CV) process to 100% SOC, and the constant current (CC) charging duration is calculated. However, due to the “power anxiety” phenomenon of EV owners, the actual charging process will neither start from 0% SOC nor stop at 100% SOC [13]. Therefore, the method of using low-dimensional health factors for SOH estimation cannot be applied to online SOH estimation. It is urgently needed to develop a high-dimensional health factor for online SOH estimation.
In recent years, the method of estimating the SOH of LIB based on the incremental capacity analysis (ICA) method has attracted the attention of researchers. ICA converts the low-dimensional voltage-capacity curve (i.e., VQ curve) of LIB at the CC charging process into a high-dimensional incremental capacity (IC) curve (i.e., dQ/dU-V curve) by difference, and then estimate SOH according to the feature points [36]. The IC curve can present the voltage plateau stage of the CC charging process in the form of clearly visible peaks, and the stage of rapid voltage rise in the form of troughs. Tang, Li, and others [13,37] proved that the peak position and intensity of the IC curve in the constant current charging process are closely related to the decline of the SOH of LIB. However, using the peak position and intensity of the IC curve as health factors to estimate SOH is susceptible to interference from the depth of discharge (DOD). At least one peak must exist in the voltage range of the IC curve used to estimate SOH. This also limits the application of ICA in SOH online estimation. In addition, ICA needs to be combined with data-driven method to realize SOH estimation. BP neural network has strong self-learning ability, and its core is signal forward propagation and error back propagation. BP neural network obtains the expected output value through multiple learning and calculation of the input. BP neural network can solve the practical problems of nonlinear continuous function, so it has attracted extensive attention. Many scholars like to use BP neural network and its variation.
In order to improve the shortcomings of a data-driven method, which is hard to embed BMS and requires large computational cost, and improve the shortcomings of ICA, which is susceptible to DOD and the accuracy depends on the selection of health characteristics and at least one health factors must exist in IC curve, an online SOH hybrid estimation method of LIB based on the IC curve and back-propagation (BP) neural network is proposed. Our research is based on the battery life cycle aging experiment data set under different discharge conditions. In particular, considering the uncertainty of the battery discharge behavior during the actual driving of the EVs, this study uses the voltage and current data of the batteries during the CC charging process to estimate the SOH. Firstly, convert the voltage and current data of the CC charging process into an IC curve. Secondly, Gaussian smoothing (GS) is used to filter the IC curve. Finally, the IC curve is segmented according to the voltage segments, and the IC curve of a different voltage segment is used as the health factor, combined with the BP neural network to realize the SOH estimation.
The rationality of the proposed SOH estimation method is that it does not require prior knowledge of the LIB. In addition, this method avoids the requirement for complete charging process data, which can flexibly select the voltage range used for SOH estimation according to the charging and discharging conditions during the actual use of the EVs. Compared with other SOH estimation methods based on ICA, the method proposed in this paper does not need to identify the peaks of the IC curve, which improves the tolerance for data measurement errors. In addition, the neural network only needs to propagate forward quickly in the SOH estimation stage, which is more conducive to embedding the SOH estimation method proposed in this paper into BMS. The results show that the proposed method can obtain high-precision SOH estimates and is suitable for online estimation. The comparison between the proposed method and the present estimation is shown in the Table 1.
The rest of this paper is organized as follows: Section 2 introduces the experimental platform and experimental design. Section 3 shows how to obtain the IC curve, and introduces Gaussian filtering to eliminate noise and smooth the curve. The structure of BP neural network is introduced in Section 4. The results of the proposed method for SOH estimation are presented in Section 5, which also presents comparison with other data-driven methods and discussion. The conclusions are presented in Section 6. All abbreviations are explained in Table A1 of the Appendix A.
2. Aging Experimental Design
This section describes the experimental platform and experimental design.
2.1. Experiment Platform
The experiment was carried out on five sets of NCR18650GA (LiNi0.8Co0.15Al0.05O2) LIBs, which are currently the commercial LIBs with the highest energy density, for which the energy density is as high as 274 mAh/g theoretically, while the energy density of lithium iron phosphate battery is only 120~150 mAh/g [38]. NCR18650GA is produced by Panasonic Corporation, and its positive electrode is composed of high-density nickel base, which is LiNi0.8Co0.15Al0.05O2. Its negative electrode is composed of carbon base. NCR18650GA has the characteristics of high energy density, no memory effect, and flat discharge voltage. The typical capacity of the NCR18650 is 3450 mAh, while the nominal voltage, discharging end voltage and charging end voltage are 3.6, 2.5, and 4.2 V, respectively [39]. The maximum continuous discharge current is 10 A. The battery aging experiment platform is the Neware battery test system, which can charge and discharge batteries in the voltage range of 0–5 V with a current range of 0.01–10 A. The maximum voltage and current sampling frequency are 10 Hz, and the sampling accuracy is ±0.05%.
2.2. Battery Aging Test Profiles
In the actual driving process of an EV, the discharge of the batteries is closely related to the start, acceleration, deceleration, and smooth driving of the EV. When an EV is just starting or accelerating, the batteries need to provide more power and current to drive the motor and output more driving force. When an EV slows down, the batteries will recover part of its energy. When an EV is running smoothly, the batteries only need to provide a small amount of current to maintain the operation of the EV. The frequency of these behaviors largely depends on the driver’s driving habits and road conditions, which is full of uncertainty. However, the charging behavior of EV batteries is usually stable, that is, they are charged in a CC-CV mode or a constant power mode. Therefore, compared to the discharge process, the charging process data is more suitable for SOH estimation. However, since the user’s charging habits will affect the start-stop SOC or start-stop voltage of charging, even in a relatively stable charging process, there are still differences in the SOC segment or voltage segment of the charging process. This is a problem that needs to be solved in estimating SOH by charging process.
The whole aging experiment were carried out at 25 °C. Different discharge modes of LIBs will have different effects on the aging process of the batteries. In order to study the impact of different discharge modes on the accuracy of the SOH estimation method proposed in this paper, this study divides ten LIB cells into five groups, and sets different discharge conditions for each group, which is shown in Table 2. Each set of a group contains two LIB cells. The data of one of the cells of each group will be used as part of the training set, and the data of the other cell will be used as the verification set. All batteries used the charging mode recommended by the battery manufacturer, that is, CC charged with 1.675 A (0.5 C) current to the upper limit of the charging voltage, which is 4.2 V, and then switched to constant voltage (CV) charging. When the current in the CV charging process was gradually decreased from 0.5 to 0.01 C, the charging process stopped. For the discharge process, the first to fourth groups of LIBs were discharged from 4.2 to 2.5 V with 1.675 A (0.5 C), 3.35 A (1 C), 6.7 A (2 C), and 10 A currents, respectively. The fifth group of LIBs were discharged in Worldwide harmonized Light Vehicles Test Cycle (WLTC) operating conditions. The WLTC operating condition is a cyclic operating condition that changes periodically to simulate the discharge behavior of an EV in the actual process. The battery current under WLTC operating condition is shown in Figure 1. The WLTC operating condition simulates the starting, accelerating, smooth driving, decelerating, and sudden braking of electric vehicles, which corresponds to battery high current and low current discharge and battery low current and high current charging. Estimating SOH with battery data discharged in WLTC operating condition is more in line with the actual situation. The five groups of LIBs were subjected to aging experiments according to the charging and discharging conditions in Table 2. After every nine cycles of discharging and charging, the batteries were discharged from 4.2 to 2.5 V with a current of 0.2 C, and the discharge capacities were recorded. This capacity will be regarded as the true value of the battery capacity in the past ten charge and discharge cycles. Every time charging or discharging process is completed, the battery is allowed to stand for 1 h before discharging or charging. When the battery capacity drops to 80% of the rated capacity, it stopped the aging test on the battery. Table 2 shows the number of cycles in which the capacity of each group of batteries drops to 80% of the rated capacity under different charge and discharge conditions.
The number of cycles of the batteries in Table 2 shows that LIBs, which have been discharged with large currents for a long time, such as battery group 3 and 4, have their capacity dropped rapidly. In the aging experiment, battery group 3 and 4 have only 196 and 94 cycles, respectively, and the capacity is reduced to 80%. The WLTC operating condition simulating the actual discharge behavior of the battery, such as battery group 5, even if it contains a short-time high current discharge process, the short-time high current discharge has little effect on the SOH of LIB. The number of cycles of battery group 5 is similar to that of battery group 1 and 2, nearly 500 cycles. This is a strong guiding significance for improving the SOH of the battery in practical use, that is, we should avoid long-time high current discharge in the process of practical use of the battery.
After the battery aging experiment is over, we clean the dirty data. The main problem of the data collected by the experimental platform Neware battery test system used in the aging experiment of this study is the lack of individual data points. For the missing data points, this study uses linear interpolation to fill in the missing sampling points.
3. Acquisition of IC Curve
This section introduces the method of obtaining the IC curve firstly. Then compare the IC curves under different SOH to obtain battery aging information. Finally, Gaussian smoothing is performed on the IC curve.
3.1. Calculation of the Initial IC Curve
The IC curve is obtained by calculating the difference between the change of battery capacity and the change of battery terminal voltage. The calculation formula of the IC curve is as follows:
where Qk, Vk, and tk, respectively, represent the amount of charge stored in the battery, battery terminal voltage, and time at the kth sampling point. N represents the difference window. i represents the charging current. When the CC charging process is used to calculate the IC curve and the sampling frequency is fixed, Formula (1) can be simplified to the following formula:
where I represents the current of constant current charging process. Δt represents the sampling interval. I and Δt are both a fixed value. It can be seen from Formula (2) that the shape of the IC curve in the CC charging process is only related to the reciprocal of the slope of the charging voltage curve. When the voltage changes slowly, it is reflected on the IC curve as a peak. When the voltage rises rapidly, it is reflected on the IC curve as a valley. The characteristics of voltage changes are closely related to changes in SOH. Therefore, the IC curve reflects the characteristics of voltage changes better than the voltage curve.
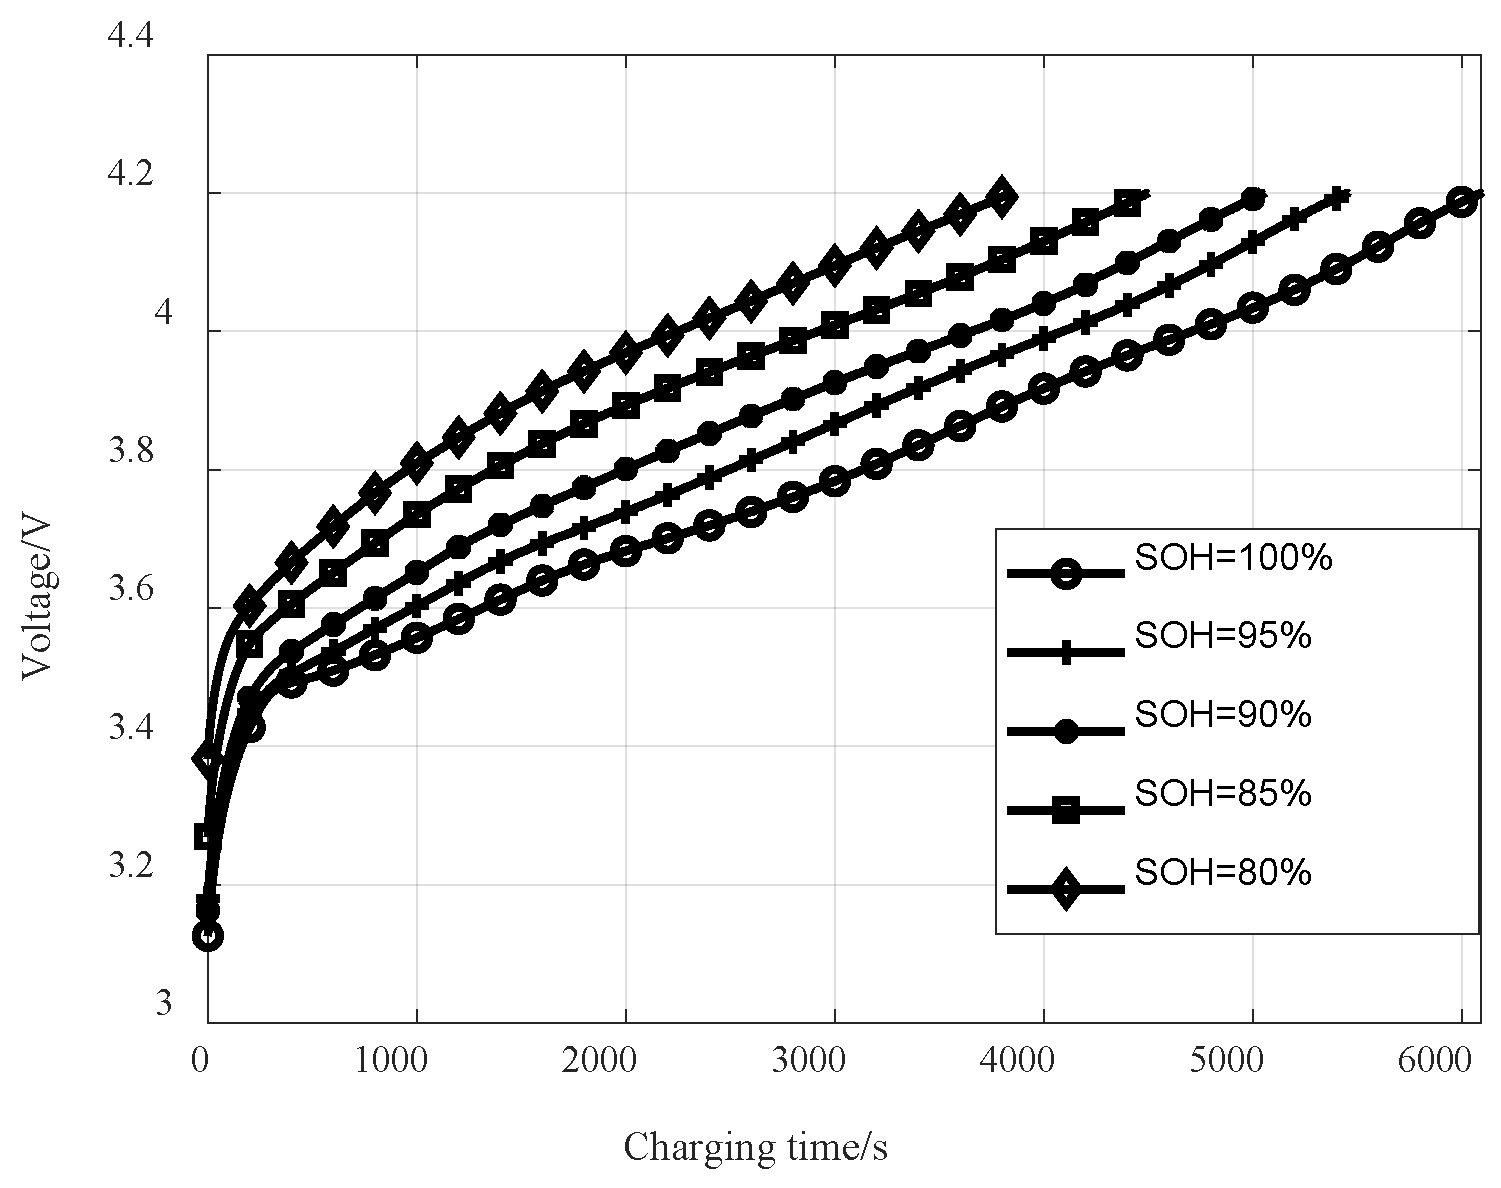
When the SOH of a LIB is 100, 95, 90, 85, and 80%, respectively, the CC charging voltage curves are shown in Figure 2, which shows that when the SOH of a LIB declines, the turning point at which the voltage rise rate decreases during the CC charging process corresponds to a higher voltage, and the CC charging process ends earlier. It means that during CC charging process, if the same amount of power is charged, the worse the SOH of the LIB, the faster the voltage will rise. In other words, a LIB with a worse SOH can store less energy. This conclusion is consistent with our definition of SOH. The IC curve corresponding to the voltage curve in Figure 2 is shown in Figure 3. The larger the dQ/dU value, the slower the voltage rise. The voltages of the LIB with SOH of 100, 95, 90, 85, and 80% entering the voltage platform are about 3.480, 3.504, 3.535, 3.600, and 3.700 V, respectively. It shows that the better the SOH of the LIB, the lower the starting voltage of the voltage plateau where the voltage rises slowly. In addition, in the 3.4–4.2 V voltage range, the worse the SOH of the battery, the smaller the area enclosed by the IC curve and the abscissa. Therefore, the IC curve contains SOH aging information, and the IC curve can be used to estimate the SOH.
3.2. Gaussian Filter
The value of the difference window N will affect the acquisition of the IC curve. When N is very small, the voltage difference between the kth sampling point and the (k − N)th sampling point will be very small. A voltage difference that is too small will cause a large change in the IC curve and cause a lot of noise. When N is large, although the IC curve is smoother, the characteristics of the IC curve are lost. In order to keep features and eliminate noise, this research first takes a suitably small N value to calculate the IC curve, then uses Gaussian filter to smooth the IC curve to eliminate noise.
The Gaussian filter has the shape of a Gaussian function. The weight of each data point is determined by the Gaussian function [13], as shown below:
where μ is the average value, and σ is the standard deviation, which controls the size of the filter window. Since the point closer to the center contributes more, the Gaussian filter can filter out noise while keeping the overall trend of the curve unchanged. Figure 3 show the unfiltered IC curves and the filtered IC curves. The IC curves on the right of Figure 3 are smoother than the IC curves on the left of Figure 3, and the peak and valley characteristics of the IC curves are effectively retained. This is of great significance for the subsequent use of BP neural network to link the change of IC curve with the decline of SOH.
4. BP Neural Network Architecture
The BP neural network is divided into three layers: input layer, hidden layer, and output layer, as shown in Figure 4. In Figure 4, represents the output of the ith node of the mth layer.
and
respectively represent the weight coefficient and bias of the ith node in the (m − 1)th layer to the jth node in the mth layer. The BP neural network advances layer by layer according to the weight coefficients during training, and dynamically adjusts the weights and biases of each layer according to the error back propagation algorithm. The forward propagation formula of BP neural network is as follows:
where am represents the output matrix of the mth layer. Wm represents the weight matrix of the mth layer to the (m – 1)th layer, which composed of . bm represents the bias matrix of the mth layer, which composed of . σ(·) represents the activation function. The activation function can be selected from Sigmoid function, tanh function, relu function, etc. In order to facilitate the calculation of the gradient of the loss function later and comprehensively consider the characteristics of the data, the tanh function is selected as the activation function in this study.
In the error back propagation process of BP neural network, the loss function is as follows:
where aL represents the output of the Lth layer, which is the last layer. y is the sample label. ‖S‖2 is the L2 norm of S.
The formula for solving the gradient of the loss function to the W and b of the Lth layer is as follows:
Then, the gradient of the loss function to the (L − 1)th layer and the (L − 2)th layer is solved in reverse order. For any mth layer, there is the following recurrence formula:
With the recurrence formula represented by Formulas (8) and (9), and then by Formulas (6) and (7) to find the gradient of the Lth layer, the gradient of each layer can be solved in reverse. Update bm and Wm through the gradient descent method for the mth layer, that is, complete a training process. By iteratively updating the weight matrix W and the deviation matrix b of each layer, the prediction accuracy of the BP neural network is continuously improved. When the number of training times reaches the set threshold, or the prediction accuracy reaches the set threshold, the training process is stopped. This means that the BP neural network has been trained and can be used for SOH prediction.
The number of nodes in the input layer and output layer of the BP neural network is determined by the dimensions of the input data and output results, and usually cannot be changed. The number of nodes in the hidden layer has a great influence on the estimation result of SOH. Excessive number of nodes in the hidden layer not only increases the computational complexity, but also may cause overfitting of the BP neural network. However, the number of nodes in the hidden layer is too small, which makes the BP neural network unable to grasp the relationship between the change of IC curve and the decline of SOH. Therefore, determining the appropriate number of nodes in the hidden layer is of great significance for improving the accuracy of SOH estimation. At present, there is no universal method for determining the number of nodes in the hidden layer of the BP neural network, but it is usually determined by the following three formulas:
Among them, nh represents the number of nodes in the hidden layer. ni represents the number of nodes in the input layer. no represents the number of nodes in the output layer. α is a constant between one to ten. In order to ensure fair comparison and adjust the structure of the BP neural network to the best state, the number of nodes in the hidden layer of the BP neural network in the subsequent part of this research is determined by Formula (10).
5. Results and Analysis for SOH Estimation
5.1. SOH Estimation of the Proposed Method
In Section 3, it is concluded that the IC curve of the CC charging process contains the aging information of the LIB. Therefore, in this study, the IC curve is used as the input of the BP neural network, and the SOH estimate value is used as the output. The accuracy and reliability of the proposed SOH estimation method will be verified in this section.
Considering that in actual charging scenarios, most of the charging process is not complete. In order to improve the applicability of the method proposed in this paper, this study divides the IC curve into multiple voltage segments. The following will explore the influence of the IC curve of different voltage segments on the accuracy of the proposed SOH estimation method.
Figure 5 shows the process of the SOH estimation method proposed in this article, which is divided into two parts: BP neural network training and SOH estimation.
As mentioned in Section 2 of the LIBs aging experiment, the training set consists of five LIBs with a total of 1750 charge–discharge cycles data. The validation set consists of the data of the remaining five batteries. In the training phase, the data of 1750 charge–discharge cycles are randomly divided into 35 batches, and each batch contains 50 charge–discharge cycles of data. One batch is drawn for each training. A total of 50 charge–discharge cycles are respectively subjected to SOH estimation, and the SOH estimated value output by the BP neural network is compared with the true SOH value. Then, the error is propagated back to modify the parameters of each layer of the BP neural network. After that, the next batch is extracted for model training. After each batch is drawn 100 times for training the model, the BP neural network has been trained a total of 3500 times, and the training process of the BP neural network is ended.
In this study, the IC curve in the interval of 3.5–4.2 V is segmented with segment lengths of 0.2, 0.3, 0.4, 0.5, 0.6, and 0.7 V respectively. Table 3 shows the segmentation information of the IC curve. Sampling is performed at sampling intervals of 0.01, 0.02, and 0.05 V, respectively. IC curves with different segment lengths, different starting voltages, and different sampling intervals will be used for the training of the BP neural network separately.
The mean absolute error (MAE) is used as the error evaluation function. The formula for the MAE is as follows:
where n represents the number of samples. represents the estimated value of SOH. yi represents the true value of SOH.
Figure 6 shows the MAE of predicting SOH using IC curves with different voltage segment lengths, different starting voltages, and different sampling intervals. It can be seen that at the same starting voltage and the same IC curve sampling interval, the longer the voltage segment of the IC curve, the smaller the MAE of SOH prediction. When the sampling intervals are 0.01, 0.02, and 0.05 V, the minimum MAE all occur at 0.7 V voltage segment, which are 0.60, 0.65, and 0.72%, respectively. This also shows that the longer the voltage segment of the IC curve used to predict SOH, the more complete LIB aging information contained, and therefore the more accurate the prediction of SOH. In addition, at the same length of the voltage segment and the same IC curve sampling interval, the IC curve with a starting voltage of 3.6 V predicts the minimum overall MAE of SOH. Therefore, the IC curve with a starting voltage of 3.6 V is more suitable for SOH prediction.
Comparing Figure 6a–c, we can see that the larger the sampling interval of the IC curve, the larger the MAE of the SOH estimation. Although the sampling interval of the IC curve is smaller, it is more conducive to accurately estimate the SOH, but it also leads to an increase in the sampling points of the IC curve, which will greatly increase the amount of calculation. For example, when the sampling interval is 0.05 V and the IC curve voltage segment length is 0.4 V, there are only eight sampling points of the IC curve, and only eight nodes are required for the input layer of the BP neural network. When the sampling interval is 0.01 V and the IC curve voltage segment length is 0.4 V, the number of samplings points of the IC curve and the number of input layer nodes of the BP neural network are both increased to 40. This greatly increases the training difficulty and training time of the BP neural network. Therefore, the selection of sampling interval needs to comprehensively consider the accuracy of SOH estimation and the amount of calculation.
The worst case of the SOH estimation method proposed in this article occurs when the voltage range of the IC curve is 3.8–4.0 V and the sampling interval is 0.05 V. In this case, the MAE is 1.85%. In short, the MAE of the method proposed in this article does not exceed 2% under any circumstances. This accuracy is sufficient for online SOH estimation.
Figure 7, Figure 8, Figure 9, Figure 10 and Figure 11 shows the SOH estimation results of the full life cycle under different voltage segment lengths and different battery discharge conditions when the sampling interval is 0.02 V and the starting voltage of the IC curve is 3.6 V. It can be seen that, as shown in Figure 7 and Figure 8, after the battery is discharged at 0.5 and 1 C, the IC curve in the CC charging process is used to estimate the SOH and obtain good estimation accuracy in the full life cycle. For the battery after high-rate discharge, as shown in Figure 9 and Figure 10, although the BP neural network can track the trend of SOH changes, in some cycles, the prediction error is relatively large. For the WLTC operating condition that simulates the actual discharge conditions of EVs, the method proposed in this article can more accurately estimate the SOH, as shown in Figure 11. In addition, Figure 7, Figure 8, Figure 9, Figure 10 and Figure 11 also compares the SOH estimation results when the sampling interval is 0.02 V and the IC curve starting voltage is 3.6 V, the same battery discharge conditions, and different voltage segment lengths. The overall trend is that the longer the length of the voltage segment of the IC curve, the more accurate the SOH estimation.
In summary, the method proposed in this paper can track the SOH changes of the LIBs after low-rate discharge and WLTC discharge, and realize high-precision SOH estimation. For LIBs discharged at a high rate, the method proposed in this paper can also track SOH changes well. Since a complete charging curve is not required, the method proposed in this paper can select the appropriate voltage segment or SOC segment according to the actual charging situation, and use the IC curve of the corresponding segment to estimate the SOH. Therefore, the method proposed in this paper can be more easily applied to online SOH estimation in actual situations.
5.2. Comparison with Gaussian Process Regression
The literature [40] proposes a SOH estimation method based on Gaussian process regression (GPR). This method also uses the IC curve as the basis for estimating SOH. When only the first 30 cycles of the full life cycle of the LIB are used as training set, the mean absolute error of this method is less than 2%. This section compares the proposed SOH estimation method based on BP neural network with the method based on GPR.
In order to make the comparison result fairer, both methods use the same training set and validation set, which is introduced in the previous section. Both methods sample the IC curve from 3.5 to 4.2 V at a sampling interval of 0.01 V voltage and use them as input data.
Figure 12 shows the SOH estimation errors of the two methods for LIBs under different discharge conditions. It can be seen that both methods can track the SOH decline of LIBs well. However, when the battery discharge current is 10 A, the SOH estimation results of the two methods under some cycles have a large error, reaching 4%. When discharging at 0.5 C, 1.0 C, 2.0 C, and WLTC, the estimation errors of the two methods are very small. Figure 13 shows the estimation results of Figure 12 and compares the SOH estimation results of the two methods.
It can be seen from Figure 13 that no matter what the discharge conditions, the MAE performance of the two methods is not much different. The SOH estimation method based on GPR has only a minimal advantage in accuracy. In addition, even in the case of high current (10A) discharge, the MAE of the two methods is less than 0.98%. In terms of the standard deviation of the estimation error, the SOH estimation method proposed in this paper has small advantages, and the SOH estimation result is more stable.
In general, the SOH estimation method proposed in this paper and the SOH estimation method based on GPR proposed in literature [40] have similar performance in accuracy. However, the complexity of the two methods is different in the model training stage and the SOH estimation stage. Literature [41] pointed out that neural networks need to pay more in the training phase than GPR. However, in the SOH estimation phase, the neural network only needs to propagate forward quickly, so the neural network is dominant in terms of computational complexity. When the input data is n1-dimensional and the output is n2-dimensional, the computational complexity of GPR in the SOH estimation phase is . In contrast, if the number of nodes in the hidden layer of the neural network is determined by Formula (10), the computational complexity of the neural network in the evaluation phase is [41], which is smaller than the computational complexity of GPR. In fact, an interesting thing is that when the number of nodes in the hidden layer of the neural network is infinite, the neural network and GPR are mathematically very similar [41]. Therefore, the SOH estimation method based on BP neural network proposed in this paper greatly reduces the complexity of SOH estimation, and is extremely advantageous for the need to embed BMS to realize the online estimation of LIB SOH.
6. Conclusions
This paper proposes a fast and accurate online SOH estimation method suitable for the actual operation of EVs. Firstly, differentiate the voltage curve of the LIB at the CC charging process to obtain the IC curve. A Gaussian filter is used to eliminate the noise of IC curve. Then, according to the voltage segment of the CC charging process, the corresponding BP neural network is selected for SOH estimation. Divide ten LIBs into five groups and conduct aging experiments under different discharge conditions. Finally, the LIBs data of the aging experiment is used to verify the accuracy of the method proposed in this article. The experimental results show that the MAE of the SOH estimation method proposed in this paper is less than 2% under any circumstances, which show that the method proposed in this paper can track the SOH change of the LIBs well.
This research also found that when the input IC curve voltage segment is longer and the sampling interval is smaller, the SOH estimation accuracy is higher. When the voltage range of the IC curve is 3.5–4.2 V and the sampling interval is 0.01 V, the MAE is the smallest, which is 0.60%. Even for the worst-case IC curve, that is, the voltage range is 3.8–4.0 V and the sampling interval is 0.05 V, the MAE is 1.85%.
The unique contribution and novelty of this paper lies in the following points:
- (1)
- This paper creatively combines IC curve with BPNN to realize the high-precision estimation of SOH.
- (2)
- Compared with the method of SOH estimation using battery charging and discharging data, the method in this paper can achieve high-precision SOH estimation only using the data of constant current charging stage, which reduces the amount of data to be processed.
- (3)
- Compared with the method of SOH estimation by identifying the characteristic points of battery charge and discharge voltage curve, this paper uses part of IC curves in constant current charging stage to estimate SOH. The proposed method does not need additional process of curve feature point recognition, and reduces the risk of SOH estimation error caused by feature point recognition error.
- (4)
- This study explores the influence of IC curves with different voltage segments and different sampling steps on the accuracy of the proposed SOH estimation method.
Although the method proposed in this article has achieved good SOH estimation accuracy in the experimental verification of this article, there are still the following areas that need improvement:
- (1)
- The training phase of the neural network uses the training data of the whole life cycle of the LIBs, which causes the training phase of the neural network to take up a lot of resources.
- (2)
- There is no battery aging experiment comparison group at different temperatures, which leads to the inability to discuss the influence of temperature on the SOH estimation method proposed in this paper.
- (3)
- When the LIBs are discharged with a larger current, the SOH estimation error is larger in some cycles.
In the future, we intend to apply this method to more complex discharge conditions, such as adding temperature as an input feature for SOH estimation. In addition, it is necessary to explore methods to improve the accuracy of SOH estimation after high-current discharge of the LIB, so that the SOH estimation method based on incremental capacity curve and BP neural network proposed in this paper is more suitable for practical applications.
Author Contributions
Methodology, H.L.; software, J.L. (Jie Li); validation, H.L.; investigation, H.L.; writing—original draft preparation, H.L.; writing—review and editing, D.X., J.L. (Jinqing Linghu) and J.L. (Jie Li); supervision, L.K.; funding acquisition, L.K. All authors have read and agreed to the published version of the manuscript.
Funding
This research was funded by [Zhuhai Zhongli New Energy Technology Co., Ltd] grant number [ZH22017001200003PWC].
Institutional Review Board Statement
Not applicable.
Informed Consent Statement
Not applicable.
Data Availability Statement
This study did not report any data.
Conflicts of Interest
The authors declare no conflict of interest.
Appendix A

Table A1.
Abbreviation comparison table.
| Abbreviation | Explanation |
|---|---|
| LIB | Lithium-ion battery |
| IC | Incremental capacity |
| BPNN | Back-propagation neural network |
| CC | Constant current |
| BMS | Battery management system |
| EV | Electric vehicle |
| HEV | Hybrid electric vehicle |
| BESS | Batteries energy storage station |
| SOC | state of charge |
| SOH | state of health |
| SOP | state of power |
| SOE | state of energy |
| RC | resistor-capacitor |
| CC-CV | constant current and constant voltage |
| ICA | incremental capacity analysis |
| DOD | depth of discharge |
| GS | Gaussian smoothing |
| CV | constant voltage |
| WLTC | Worldwide harmonized Light Vehicles Test Cycle |
| MAE | mean absolute error |
| GPR | Gaussian process regression |
References
- Jaguemont, J.; Boulon, L. A comprehensive review of lithium-ion batteries used in hybrid and electric vehicles at cold temperatures. Appl. Energy 2016, 164, 99–114. [Google Scholar] [CrossRef]
- Zhang, L.; Fan, W. Battery heating for lithium-ion batteries based on multi-stage alternative currents. J. Energy Storage 2020, 32, 101885. [Google Scholar] [CrossRef]
- Wang, Q.; Wang, Z. A Novel Consistency Evaluation Method for Series-Connected Battery Systems Based on Real-World Operation Data. IEEE Trans. Transp. Electrif. 2021, 7, 437–451. [Google Scholar] [CrossRef]
- Rahimi-Eichi, H.; Ojha, U. Battery Management System: An Overview of Its Application in the Smart Grid and Electric Vehicles. IEEE Ind. Electron. Mag. 2013, 7, 4–16. [Google Scholar] [CrossRef]
- Vetter, J.; Novák, P. Ageing mechanisms in lithium-ion batteries. J. Power Sources 2005, 147, 269–281. [Google Scholar] [CrossRef]
- Han, X.; Ouyang, M. A comparative study of commercial lithium-ion battery cycle life in electrical vehicle: Aging mechanism identification. J. Power Sources 2014, 251, 38–54. [Google Scholar] [CrossRef]
- Zheng, Y.; Ouyang, M. Investigating the error sources of the online state of charge estimation methods for lithium-ion batteries in electric vehicles. J. Power Sources 2018, 377, 161–188. [Google Scholar] [CrossRef]
- Dubarry, M.; Berecibar, M. State of health battery estimator enabling degradation diagnosis: Model and algorithm description. J. Power Sources 2017, 360, 59–69. [Google Scholar] [CrossRef]
- Wang, L.; Pan, C. On-board state of health estimation of LiFePO4 battery pack through differential voltage analysis. Appl. Energy 2016, 168, 465–472. [Google Scholar] [CrossRef]
- Ng, K.; Moo, C. Enhanced coulomb counting method for estimating state-of-charge and state-of-health of lithium-ion batteries. Appl. Energy 2009, 86, 1506–1511. [Google Scholar] [CrossRef]
- Remmlinger, J.; Buchholz, M. State-of-health monitoring of lithium-ion batteries in electric vehicles by on-board internal resistance estimation. J. Power Sources 2011, 196, 5357–5363. [Google Scholar] [CrossRef]
- Berecibar, M.; Gandiaga, I. Critical review of state of health estimation methods of Li-ion batteries for real applications. Renew. Sustain. Energ. Rev. 2016, 56, 572–587. [Google Scholar] [CrossRef]
- Li, Y.; Abdel-Monem, M. A quick on-line state of health estimation method for Li-ion battery with incremental capacity curves processed by Gaussian filter. J. Power Sources 2018, 373, 40–53. [Google Scholar] [CrossRef]
- Cai, Y.; Yang, L. Online identification of lithium-ion battery state-of-health based on fast wavelet transform and cross D-Markov machine. Energy 2018, 147, 621–635. [Google Scholar] [CrossRef]
- Hu, X.; Xu, L. Battery Lifetime Prognostics. Joule 2020, 4, 310–346. [Google Scholar] [CrossRef]
- Scipioni, R.; Jørgensen, P. Complementary analyses of aging in a commercial LiFePO4/graphite 26650 cell. Electrochim. Acta 2018, 284, 454–468. [Google Scholar] [CrossRef]
- Liu, D.; Pang, J. Prognostics for state of health estimation of lithium-ion batteries based on combination Gaussian process functional regression. Microelectron. Reliab. 2013, 53, 832–839. [Google Scholar] [CrossRef]
- Lüders, C.; Keil, J. Modeling of lithium plating and lithium stripping in lithium-ion batteries. J. Power Sources 2019, 414, 41–47. [Google Scholar] [CrossRef]
- Lai, X.; Gao, W. A comparative study of global optimization methods for parameter identification of different equivalent circuit models for Li-ion batteries. Electrochim. Acta 2019, 295, 1057–1066. [Google Scholar] [CrossRef]
- Yang, J.; Xia, B. Online state-of-health estimation for lithium-ion batteries using constant-voltage charging current analysis. Appl. Energy 2018, 212, 1589–1600. [Google Scholar] [CrossRef]
- Eddahech, A.; Briat, O. Behavior and state-of-health monitoring of Li-ion batteries using impedance spectroscopy and recurrent neural networks. Int. J. Electr. Power Energy Syst. 2012, 45, 487–494. [Google Scholar] [CrossRef]
- Rechkemmer, S.; Zang, X. Empirical Li-ion aging model derived from single particle model. J. Energy Storage 2019, 21, 773–786. [Google Scholar] [CrossRef]
- Guo, Z.; Qiu, X. State of health estimation for lithium ion batteries based on charging curves. J. Power Sources 2014, 249, 457–462. [Google Scholar] [CrossRef]
- Micea, M.; Ungurean, L. Online State-of-Health Assessment for Battery Management Systems. IEEE Trans. Instrum. Meas. 2011, 60, 1997–2006. [Google Scholar] [CrossRef]
- Weng, C.; Cui, Y. On-board state of health monitoring of lithium-ion batteries using incremental capacity analysis with support vector regression. J. Power Sources 2013, 235, 36–44. [Google Scholar] [CrossRef]
- Dong, H.; Jin, X. Lithium-ion battery state of health monitoring and remaining useful life prediction based on support vector regression-particle filter. J. Power Sources 2014, 271, 114–123. [Google Scholar]
- Marano, V.; Onori, S.; Guezennec, Y. Lithium-ion batteries life estimation for plug-in hybrid electric vehicles. In Proceedings of the 2009 IEEE Vehicle Power and Propulsion Conference, Dearborn, MI, USA, 7–10 September 2009. [Google Scholar]
- Berecibar, M.; Devriendt, F. Online state of health estimation on NMC cells based on predictive analytics. J. Power Sources 2016, 320, 239–250. [Google Scholar] [CrossRef]
- Sbarufatti, C.; Corbetta, M. Adaptive prognosis of lithium-ion batteries based on the combination of particle filters and radial basis function neural networks. J. Power Sources 2017, 344, 128–140. [Google Scholar] [CrossRef]
- Dai, H.; Zhao, G. A Novel Estimation Method for the State of Health of Lithium-Ion Battery Using Prior Knowledge-Based Neural Network and Markov Chain. IEEE Trans. Ind. Electron. 2019, 66, 7706–7716. [Google Scholar] [CrossRef]
- Lin, H.; Liang, T. Estimation of Battery State of Health Using Probabilistic Neural Network. IEEE Trans. Ind. Inform. 2013, 9, 679–685. [Google Scholar] [CrossRef]
- Chen, Z.; Xue, Q. State of Health Estimation for Lithium-ion Batteries Based on Fusion of Autoregressive Moving Average Model and Elman Neural Network. IEEE Access 2019, 7, 102662–102678. [Google Scholar] [CrossRef]
- Kim, J.; Cho, B. State-of-charge estimation and state-of-health prediction of a Li-ion degraded battery based on an EKF combined with a per-unit system. IEEE Trans. Veh. Technol. 2011, 60, 4249–4260. [Google Scholar] [CrossRef]
- Alipour, M.; Tavallaey, S. Improved Battery Cycle Life Prediction Using a Hybrid Data-Driven Model Incorporating Linear Support Vector Regression and Gaussian. ChemPhysChem 2022, 23, e202100829. [Google Scholar] [CrossRef]
- Kim, J.; Lee, S. Complementary cooperation algorithm based on DEKF combined with pattern recognition for SOC/Capacity estimation and SOH prediction. IEEE Trans. Power Electron. 2012, 27, 436–451. [Google Scholar] [CrossRef]
- Bian, X.; Liu, L. A model for state-of-health estimation of lithium ion batteries based on charging profiles. Energy 2019, 177, 57–65. [Google Scholar] [CrossRef]
- Tang, X.; Zou, C. A fast estimation algorithm for lithium-ion battery state of health. J. Power Sources 2018, 396, 453–458. [Google Scholar] [CrossRef]
- Chen, H.; Dawson, J. Effects of cationic substitution on structural defects in layered cathode materials LiNiO2. J. Mater. Chem. A 2014, 2, 7988–7996. [Google Scholar] [CrossRef] [Green Version]
- Linghu, J.; Kang, L. A Flexible Online State of Health Estimation Approach for Lithium-ion Battery. In Proceedings of the 2020 IEEE 9th International Power Electronics and Motion Control Conference, Nanjing, China, 29 November–2 December 2020. [Google Scholar]
- Li, X.; Wang, Z. Prognostic health condition for lithium battery using the partial incremental capacity and Gaussian process regression. J. Power Sources 2019, 421, 56–67. [Google Scholar] [CrossRef]
- Garnelo, M.; Rosenbaum, D.; Maddison, C. Conditional Neural Processes. In Proceedings of the 35th International Conference on Machine Learning, Stockholm, Sweden, 10–15 July 2018. [Google Scholar]
Figure 1.
WLTC operating condition current.

Figure 2.
CC charging voltage curve under different SOH.

Figure 3.
IC curve under different SOH: (a) SOH = 100%, (b) SOH = 95%, (c) SOH = 90%, (d) SOH = 85%, (e) SOH = 80%.
Figure 3.
IC curve under different SOH: (a) SOH = 100%, (b) SOH = 95%, (c) SOH = 90%, (d) SOH = 85%, (e) SOH = 80%.

Figure 4.
The structure of BP neural network.

Figure 5.
The process of the proposed SOH estimation method.

Figure 6.
MAE of SOH estimation: (a) sampling interval of 0.01 V, (b) sampling interval of 0.02 V, (c) sampling interval of 0.05 V.
Figure 6.
MAE of SOH estimation: (a) sampling interval of 0.01 V, (b) sampling interval of 0.02 V, (c) sampling interval of 0.05 V.

Figure 7.
SOH estimation results under 0.5 C discharge.

Figure 8.
SOH estimation results under 1.0 C discharge.

Figure 9.
SOH estimation results under 2.0 C discharge.

Figure 10.
SOH estimation results under 10 A discharge.

Figure 11.
SOH estimation results under WLTC discharge.

Figure 12.
SOH estimation error comparison of BP neural network and GPR under different discharge conditions.
Figure 12.
SOH estimation error comparison of BP neural network and GPR under different discharge conditions.

Figure 13.
Comparison of MAE and standard deviation between BPNN and GPR.

Table 1.
Comparison of SOH estimation methods.
| SOH Estimation Methods | Advantage | Disadvantage |
|---|---|---|
| Experimental measurement method [16,17] | (1) High-precision SOH estimation value. | (1) Requires measurement under specific conditions; (2) Not suitable for SOH online estimation. |
| Equivalent model method [11,18,19,20,21,22,23] | (1) Convenient to embed BMS. | (1) Accuracy depends on the accuracy of the battery model parameters; (2) Requires prior knowledge. |
| Data-driven method [24,25,26,27,28,29,30,31,32,33,34,35] | (1) No need to analyze the aging mechanism inside the battery; (2) Easy to implement; (3) Good accuracy. | (1) Large amount of training data is required; (2) Hard to embed BMS; (3) Large computational cost. |
| Incremental capacity analysis method [13,36,37] | (1) Obvious health characteristics; (2) Less computational cost; (3) Good accuracy. | (1) Susceptible to DOD; (2) At least one health factors must exist; (3) Accuracy depends on the selection of health characteristics; (4) Needs to be combined with data-driven method |
| The proposed method | (1) Obvious health characteristics; (2) Less computational cost; (3) Good accuracy; (4) Not require prior knowledge; (5) Not require health factors; (6) Not susceptible to DOD | (1) Large amount of training data is required; (2) The training data should cover the whole life cycle of LIBs. |
Table 2.
The key parameters of the experimental battery.
| Group | Battery Group 1 | Battery Group 2 | Battery Group 3 | Battery Group 4 | Battery Group 5 |
|---|---|---|---|---|---|
| Charging conditions | CC charged with 0.5 C to 4.2 V, switch to CV charging (the current is decreased from 0.5 C to 0.01 C). | ||||
| Capacity test method | Charge and discharge nine times per cycle, discharge once at 0.2 C (discharge from 4.2 to 2.5 V, record the discharge capacity). | ||||
| Discharge current | 0.5 C | 1 C | 2 C | 10 A | WLTC |
| Number of cycles | 498 | 466 | 196 | 94 | 496 |
Table 3.
Segmentation information of IC curve.
| Segment Length | Segment Starting Voltage | |||||
|---|---|---|---|---|---|---|
| 3.5 V | 3.6 V | 3.7 V | 3.8 V | 3.9 V | 4.0 V | |
| 0.2 V | 3.5–3.7 V | 3.6–3.8 V | 3.7–3.9 V | 3.8–4.0 V | 3.9–4.1 V | 4.0–4.2 V |
| 0.3 V | 3.5–3.8 V | 3.6–3.9 V | 3.7–4.0 V | 3.8–4.1 V | 3.9–4.2 V | — |
| 0.4 V | 3.5–3.9 V | 3.6–4.0 V | 3.7–4.1 V | 3.8–4.2 V | — | — |
| 0.5 V | 3.5–4.0 V | 3.6–4.1 V | 3.7–4.2 V | — | — | — |
| 0.6 V | 3.5–4.1 V | 3.6–4.2 V | — | — | — | — |
| 0.7 V | 3.5–4.2 V | — | — | — | — | — |
Publisher’s Note: MDPI stays neutral with regard to jurisdictional claims in published maps and institutional affiliations. |
© 2022 by the authors. Licensee MDPI, Basel, Switzerland. This article is an open access article distributed under the terms and conditions of the Creative Commons Attribution (CC BY) license (https://creativecommons.org/licenses/by/4.0/).
Share and Cite
MDPI and ACS Style
Lin, H.; Kang, L.; Xie, D.; Linghu, J.; Li, J. Online State-of-Health Estimation of Lithium-Ion Battery Based on Incremental Capacity Curve and BP Neural Network. Batteries 2022, 8, 29. https://doi.org/10.3390/batteries8040029
AMA Style
Lin H, Kang L, Xie D, Linghu J, Li J. Online State-of-Health Estimation of Lithium-Ion Battery Based on Incremental Capacity Curve and BP Neural Network. Batteries. 2022; 8(4):29. https://doi.org/10.3390/batteries8040029
Chicago/Turabian StyleLin, Hongye, Longyun Kang, Di Xie, Jinqing Linghu, and Jie Li. 2022. "Online State-of-Health Estimation of Lithium-Ion Battery Based on Incremental Capacity Curve and BP Neural Network" Batteries 8, no. 4: 29. https://doi.org/10.3390/batteries8040029
Note that from the first issue of 2016, this journal uses article numbers instead of page numbers. See further details here.