
The Dilemma of C-Rate and Cycle Life for Lithium-Ion Batteries under Low Temperature Fast Charging


1
State Key Laboratory of Automotive Simulation and Control, Jilin University, Changchun 130022, China
2
College of Automotive Engineering, Jilin University, Changchun 130022, China
3
Department of Mechanical Engineering, Imperial College London, London SW7 2AZ, UK
*
Author to whom correspondence should be addressed.
Batteries 2022, 8(11), 234; https://doi.org/10.3390/batteries8110234
Submission received: 29 September 2022
/
Revised: 28 October 2022
/
Accepted: 8 November 2022
/
Published: 11 November 2022
(This article belongs to the Special Issue Electricity and Electronics in Intelligent Battery Management Systems of Electric Vehicles)
Abstract
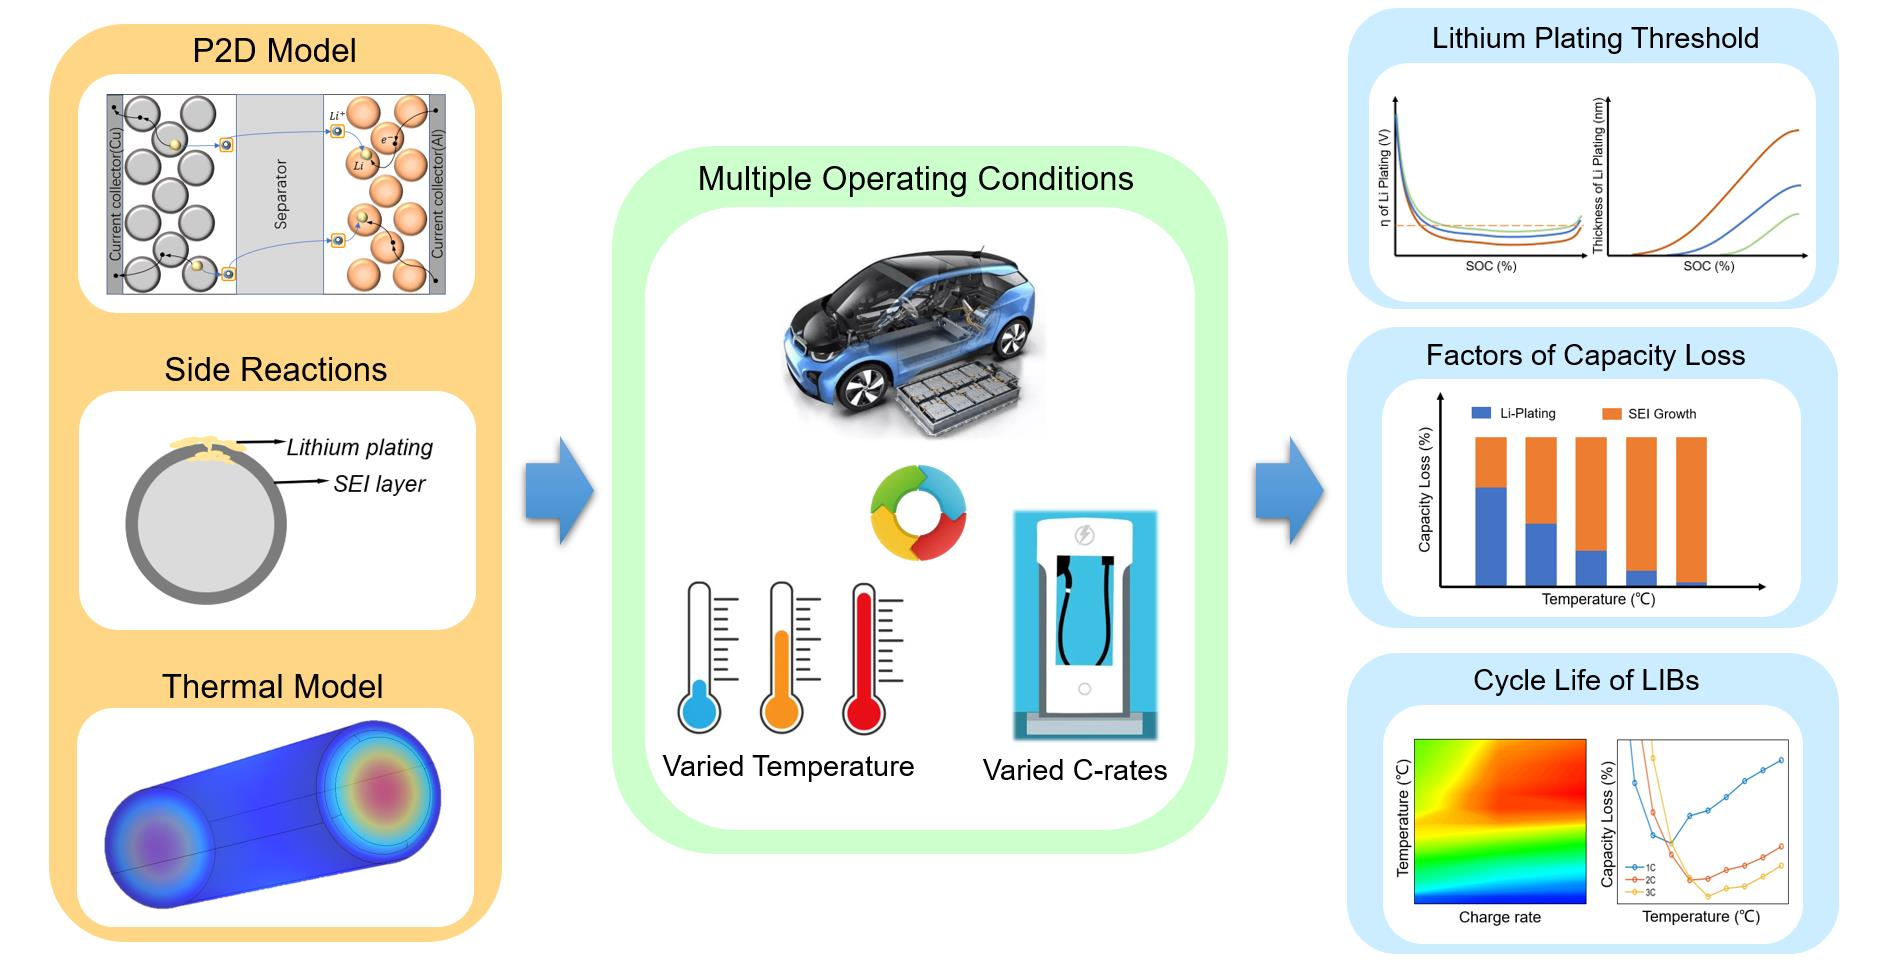
:Electric vehicles (EVs) in severe cold regions face the real demand for fast charging under low temperatures, but low-temperature environments with high C-rate fast charging can lead to severe lithium plating of the anode material, resulting in rapid degradation of the lithium-ion battery (LIB). In this paper, by constructing an electrode–thermal model coupling solid electrolyte interphase (SEI) growth and lithium plating, the competition among different factors of capacity degradation under various ambient temperatures and C-rates are systematically analyzed. In addition, the most important cause of rapid degradation of LIBs under low temperatures are investigated, which reveal the change pattern of lithium plating with temperature and C-rate. The threshold value and kinetic law of lithium plating are determined, and a method of lithium-free control under high C-rate is proposed. Finally, by studying the average aging rate of LIBs, the reasons for the abnormal attenuation of cycle life at lower C-rates are ascertained. Through the chromaticity diagram of the expected life of LIBs under various conditions, the optimal fast strategy is explored, and its practical application in EVs is also discussed. This study can provide a useful reference for the development of high-performance and high-safety battery management systems to achieve fine management.

1. Introduction
The popularity of electric vehicles (EVs) in temperate regions is generally higher than that in cold regions compared with traditional petrol vehicles. Mileage anxiety and long charging time are the main problems hindering the development of EVs, and the poor low-temperature performance of the lithium-ion battery (LIB) makes the above problems worse. Therefore, improving the fast-charging capability and developing fast-charging strategies in low-temperature environments are key problems to be addressed [1,2]. Unfortunately, numerous studies have shown that the charging with low temperature and high C-rate can cause accelerated degradation of battery performance in terms of capacity and output power [3,4,5,6]. This makes fast charging of batteries at low temperatures a dilemma, and finding a balance between aging rate and charging efficiency is the key to solving the problem. This makes the fast charging of LIBs under low temperatures become a dilemma, and finding the balance between aging rate and charging efficiency becomes the key to solve the problem.
Previous studies have shown that the occurrence of lithium plating is one of the main obstacles to fast charging [7,8,9]. For most power batteries of EVs, graphite is used as the anode material [10,11]. Lithium plating forms lithium metal deposits on the graphite surface, depleting the battery of recyclable lithium-ions and causing rapid capacity degradation due to loss of lithium inventory (LLI) [12,13,14]. At the same time, as the equilibrium potential of graphite is close to the metallization potential of lithium-ions, when charging the battery using high C-rates, there is a large polarization at the anode, causing lithium plating due to the local overpotential [15,16]. The production of these lithium metals not only accelerates the aging of the battery but also increases the safety risk [17,18,19]. At low temperatures, with the decrease of carrier diffusivity, the probability of lithium plating will be significantly increased. Jiang Fan et al. [20] found that under charging conditions, lithium, which can rapidly enter the anode at room temperature, could not enter the graphite at −20 °C. Minggao Ouyang et al. [21] found that at −10 °C, when the charging current reached 0.25C or the cut-off voltage reached 3.55 V, a signal associated with lithium metal could be observed on the surface of the anode. All the above results indicate that it is not suitable for direct fast charging of LIBs under low temperatures.
However, the problem of fast charging becomes complicated when other aging and kinetic mechanisms are introduced to investigate battery life with respect to temperature dependence. In the early literature, researchers usually assumed that batteries age faster under higher temperatures [22], the reason being that the internal reaction rate of LIBs follows the Arrhenius equation with respect to reaction temperature, with higher temperatures promoting the production of the solid electrolyte interphase (SEI) film. However, it has also been shown that the influence of temperature for the battery is not limited to the internal reaction rate. As the temperature decreases, the viscosity of the electrolyte increases, which reduces the ionic conductivity and subsequently increases the resistance to directional migration of ions, leading to the increasement of the internal resistance [23,24,25]. At the same time, the ionic conductivities of the electrode and electrolyte are also affected by temperature [4,12]. Gao F et al. [26] discovered that the charge transfer resistance of the LiFePO4-based cathode at −20 °C is three times higher than that at room temperature. These factors change the electrode kinetic characteristics of LIBs significantly, complicating the response to high C-rate charging conditions under different temperatures. Shimpe et al. [27] tested a set of commercial 26650-format lithium iron phosphate batteries with 3 Ah, which were found to have the best cycle life at 25 °C and 1C charging. In addition, it is worth noting that the cycle life at 10 °C is only approximately half that of 25 °C. Ecker et al. [28] investigated the cycle life response pattern of the 53 Ah high power graphite/NMC battery at 0.85C and found that the cycle life of the battery dropped rapidly from 4000 cycles at 20 °C to only 40 cycles at 10 °C. Matadi et al. [29] found the 16 Ah graphite/NMC battery that can last 4000 cycles at 25 °C loses 75% of its capacity after only 50 cycles at 5 °C. These studies indicate that lithium plating and SEI film growth may be a competitive reaction for fast charging and there is likely an inflection point in the degradation rate of battery capacity with respect to temperature. The optimum temperature for fast charging is the temperature corresponding to the inflection point. Accurately describing the temperature dependence of the degradation rate at different C-rates is the key to finding the optimum charging temperature.
In this paper, on the basis of a full-order pseudo-two-dimensional (P2D) model considering the electrode kinetic and thermal diffusion, the response of two aging mechanisms, SEI growth and lithium plating, to temperature under fast charging conditions is studied by using LLI degradation mode. In order to highlight the influence of lithium plating on cycle life, we focus on the aging behavior of batteries at very low temperatures. By quantitatively comparing the contribution of SEI growth and lithium plating to the capacity degradation of LIBs under different C-rates and ambient temperatures, we reveal the competing dynamics of the two aging mechanisms and the change of lithium plating film thickness during single charge, which showed the seriousness of lithium plating under low-temperature fast charging. Through exploring the threshold of lithium plating and its variation with temperature and current, the reason why the temperature dependence of battery cycle life presents nonlinear characteristics under fast charging conditions is revealed. Then, minimum inflection points of capacity degradation rate with the increase of temperature, i.e., the optimal charging temperatures, under different C-rates are found. This study provides a useful exploration for a more comprehensive and accurate reflection of the internal state for LIBs without sacrificing computational efficiency. In addition, the charging strategy is optimized to achieve efficient and healthy charging under low temperatures. Through the characteristic curves of single cycle aging rate with different C-rates, it is found that the optimal charging temperature increases with the increase of C-rate. At the end, the chromaticity diagram of the best C-rate for LIBs under different ambient temperatures is given to provide guidance. This study provides a useful reference for developing high-performance BMS and realizing fine-grained battery management. Meanwhile, the framework of battery digital twin technology is enriched, and the guidance for the construction of digital twin model is provided.
2. Battery Model
In order to better explore the electrochemical behavior inside the LIB in this study, we choose the electrochemical model based on the laws of physics and chemistry to describe the LIB instead of the equivalent circuit model. We use COMSOL and MATLAB for simulation and data processing. In this paper, a modified P2D electrochemical model, first proposed by Doyle et al. [30], is used to simulate the aging process of the battery after considering the calculation and accuracy of the model. The governing equation is briefly reviewed below, and the schematic diagram of the P2D model is shown in Figure 1.
The model considers the transport for charge and species of the active material along the direction of electrode thickness (x) and within the solid particle (r). The equations governing the x and r directions are coupled by electrochemical reactions on the surface of active material particles described by the Butler–Volmer relationship [31,32]. In order to study the relationship between cyclic aging of LIBs and side reactions, the modification terms of lithium plating and SEI growth are introduced into the P2D model, which are the reactions competing with intercalation reactions during charging process. Meanwhile, the description of the thermal behavior of LIBs are also added to the battery model to consider the effect of temperature. The relevant governing equations for the P2D model are as follows, and the parameter descriptions of the model can be seen in Table 1.
2.1. Electrochemical Model
The relationship between the volumetric transfer current density of lithium-ions on the surface of spherical particles and the activation polarization overpotential η for the lithium-ion intercalation/deintercalation reactions of the electrode can be obtained through the Butler–Volmer equation as follows:
where is the lithium-ion’s total flux density, is transfer coefficient, F is the Faraday constant, and is the equilibrium exchange current density at the interface, which is given as follows:
where is reaction rate constant, is lithium concentration in electrolyte phase, is lithium concentration in solid phase, and is maximum lithium concentration in solid phase.
In the radial coordinate, Fick’s law is used to describe lithium-ion diffusion in spherical particles.
where is solid particle diffusivity. In the electrolyte, diffusion and migration are considered as:
where ε is porosity, is the liquid phase effective diffusion coefficient, and is the lithium-ion transference number. The effective diffusion coefficient is calculated from porosity and curvature .
The variation law of electromotive force in the liquid phase of LIBs can be expressed by the modified Ohm’s law:
where is liquid phase effective conductivity, x is the linear coordinate orthogonal to the planar electrode area, is liquid phase potential, and is liquid phase current density. Similarly, the solid phase Ohm’s law can be described as:
where is solid phase effective conductivity, is solid phase potential, is the solid phase current density. In addition to the reaction current density satisfying the Butler–Volmer equation, the solid phase particles and the electrolyte must satisfy the basic rule of charge conservation. The charge conservation formulas for the solid and liquid phases are:
Furthermore, in order to study the effects of lithium plating and SEI growth on the cyclic aging of LIBs, two correction terms are introduced in P2D model (Müller et al., 2019), and the two side reactions compete with the intercalation reactions during charging. The all-reaction current density can be redefined as:
where is the intercalation current density of lithium-ions entering the anode, is the current density of SEI formation, and is the current density of lithium plating.
According to the Butler–Volmer equation of intercalation current, the intercalation current density of lithium-ions entering the anode particles can be obtained as follows:
assuming that SEI is formed by the reaction of electrolyte with lithium-ion and electron. A detailed description of SEI film simulation can be found in reference [33]. In addition, it is also assumed that the SEI film reaction is irreversible, and no secondary SEI film is generated on the lithium plating surface. Considering the Butler–Volmer equation, the equation of SEI film growth is as follows:
Assuming that there is no dissolution of lithium metal and no generation of “dead lithium” in the reaction, the expression of lithium plating in the model is similar to SEI film growth, which is as follows:
2.2. Thermal Model
The P2D model couples a 0-dimensional thermal model to simulate the thermal behavior of LIBs so that the temperature during simulation is closer to the real situation. The equation of ohmic heat is as follows:
The above equation is the heat generation rate per unit length. The former term on the right side of the equation is ohmic heat from the solid-state electrode, and the latter term is ohmic heat from the electrolyte. Effective ionic diffusion conductivity of electrolyte is as follow:
In addition to ohmic heat, there is reaction heat in the reaction process during the battery charging and discharging process, whose equation is as follows:
Meanwhile, in addition to heat generation, there is also heat transfer phenomenon. The transfer equation for thermal convection of the battery surface to the environment is as follows:
where h is convective heat transfer coefficient, T is battery temperature, and Tamb is ambient temperature.
In combination with the ohmic heat, reaction heat, and the heat transfer process of the battery to the environment, the temperature change during battery charging and discharging can be expressed as:
where is the mass of the battery, is specific heat capacity of the battery, and L is the thickness of single layer structure within the battery.
The parameter description of the P2D model will be given in Table 1; the subscripts p, s, and n of the symbols represent the positive electrode, the separator, and the negative electrode, respectively. And we give a calculation example under a specific temperature and charging rate in the Supplementary Materials.
3. Results and Discussion
3.1. The Change for Contribution of SEI and Lithium Plating to Capacity Degradation under Different Charging Strategies
Figure 2 and Figure 3 show the contribution to battery capacity attenuation and the influence on battery aging rate caused by different aging principles at the end of life (EOL) under different working conditions. In this study, EOL of the battery is set as 80% capacity remaining, and the capacity loss caused by anode aging is divided into SEI growth and lithium plating. Firstly, through the transverse comparison within the same subfigure in Figure 2, it is found that lithium plating plays a dominant role in battery capacity loss under low-temperature charging conditions, especially below −10 °C. With the increase of temperature, the contribution of lithium plating to battery aging decreases. When the temperature is above 25 °C, lithium plating no longer occurs, and all capacity loss comes from the growth of SEI film. Then, through the longitudinal comparison among the three subfigures in Figure 2, it can be found that the increase of charging C-rate can increase the contribution of lithium plating to capacity attenuation at the same temperature. The above phenomenon has also been found in relevant experimental studies of LIBs [34,35].
Figure 3b,d,f shows the change rule of capacity loss caused by lithium plating with the number of cycles. It can be found that under the condition of serious lithium plating, the cycle life of LIBs is significantly reduced and the aging rate is significantly accelerated compared with that without lithium plating. Under the very low temperature environments (from −20 to −10 °C), serious lithium plating occurs in the initial cycle of the battery, which leads to the consumption of recyclable lithium-ions at a very fast speed and causes the battery to quickly reach EOL. This objectively inhibits the growth of SEI film, as shown in the local subfigure in Figure 3a,c,e. However, the increase of charging C-rate accelerates the above process, making the contribution of lithium plating to capacity degradation close to 100% under high C-rates, as shown in Figure 2b,c. Then, by observing the curves of −5 °C and 0 °C, it can be found that the rate of capacity loss caused by lithium plating is significantly slower than that under extremely low temperature environments at the same C-rate. Similarly, the cycle life of the battery at the same temperature can be significantly reduced with the increase of charging C-rate. Furthermore, by observing the curves of temperature of 5 °C and above, it can be found that as lithium plating is no longer the leading factor of capacity degradation, lithium plating reaction gradually stops due to chemical equilibrium, so that its contribution to capacity degradation eventually reaches a fixed value. However, the promoting effect of C-rate on lithium plating still exists. The above results show that the decrease of carrier diffusion coefficient caused by low temperature and the increase of carrier flux caused by high C-rate are the kinetic causes of lithium plating, and the fast-charging strategy at low temperature can significantly reduce the cycle life of the battery due to the increase of anode lithium plating under high C-rates. For example, lithium plating causes 17% capacity loss after 50 cycles under the fast-charging condition at −5 °C and 3C, while at the same ambient temperature, lithium plating causes only 6% capacity loss after 50 cycles at 1C.
Figure 3a,c,e show the change rule of capacity loss caused by the SEI growth with the number of cycles. It can be found that the SEI film grows rapidly at the beginning of the cycle, and then the growth rate gradually slows and becomes stable after 150 cycles. However, compared with lithium plating, the SEI growth rate has no significant response to temperature and rate conditions. We believe that SEI growth is related to the diffusion rate of ethylene carbonate (EC). Due to the thin SEI film at the initial cycles, the diffusion rate of EC is large, leading to the rapid thickening of SEI film [22,36]. The diffusivity of EC increases with the increase of temperature, and at the same time, the capacity loss caused by SEI growth also increases. Under the same number of cycles, for the battery with higher working temperature, the SEI film becomes thicker and more recyclable lithium-ions are consumed. Therefore, the number of cycles reaching EOL at 45 °C is less than that at 25 °C.
On the basis of Figure 2 and Figure 3, it can be found that for the battery working in the high-temperature environment, the battery should be properly cooled before charging to control the battery temperature to the optimal value corresponding to the charging C-rate, which can reduce the battery aging rate by controlling the growth rate of the SEI film. For the battery working in the low-temperature environment, the fast charging with high C-rates should be avoided as far as possible. The battery temperature should be raised by charging at a low C-rate or by pre-heating the battery so that the temperature of the battery is within the range of no lithium plating, which avoids rapid battery capacity degradation.
3.2. The Cause for Large Amounts of Capacity Degradation Caused by Lithium Plating under Low Temperatures
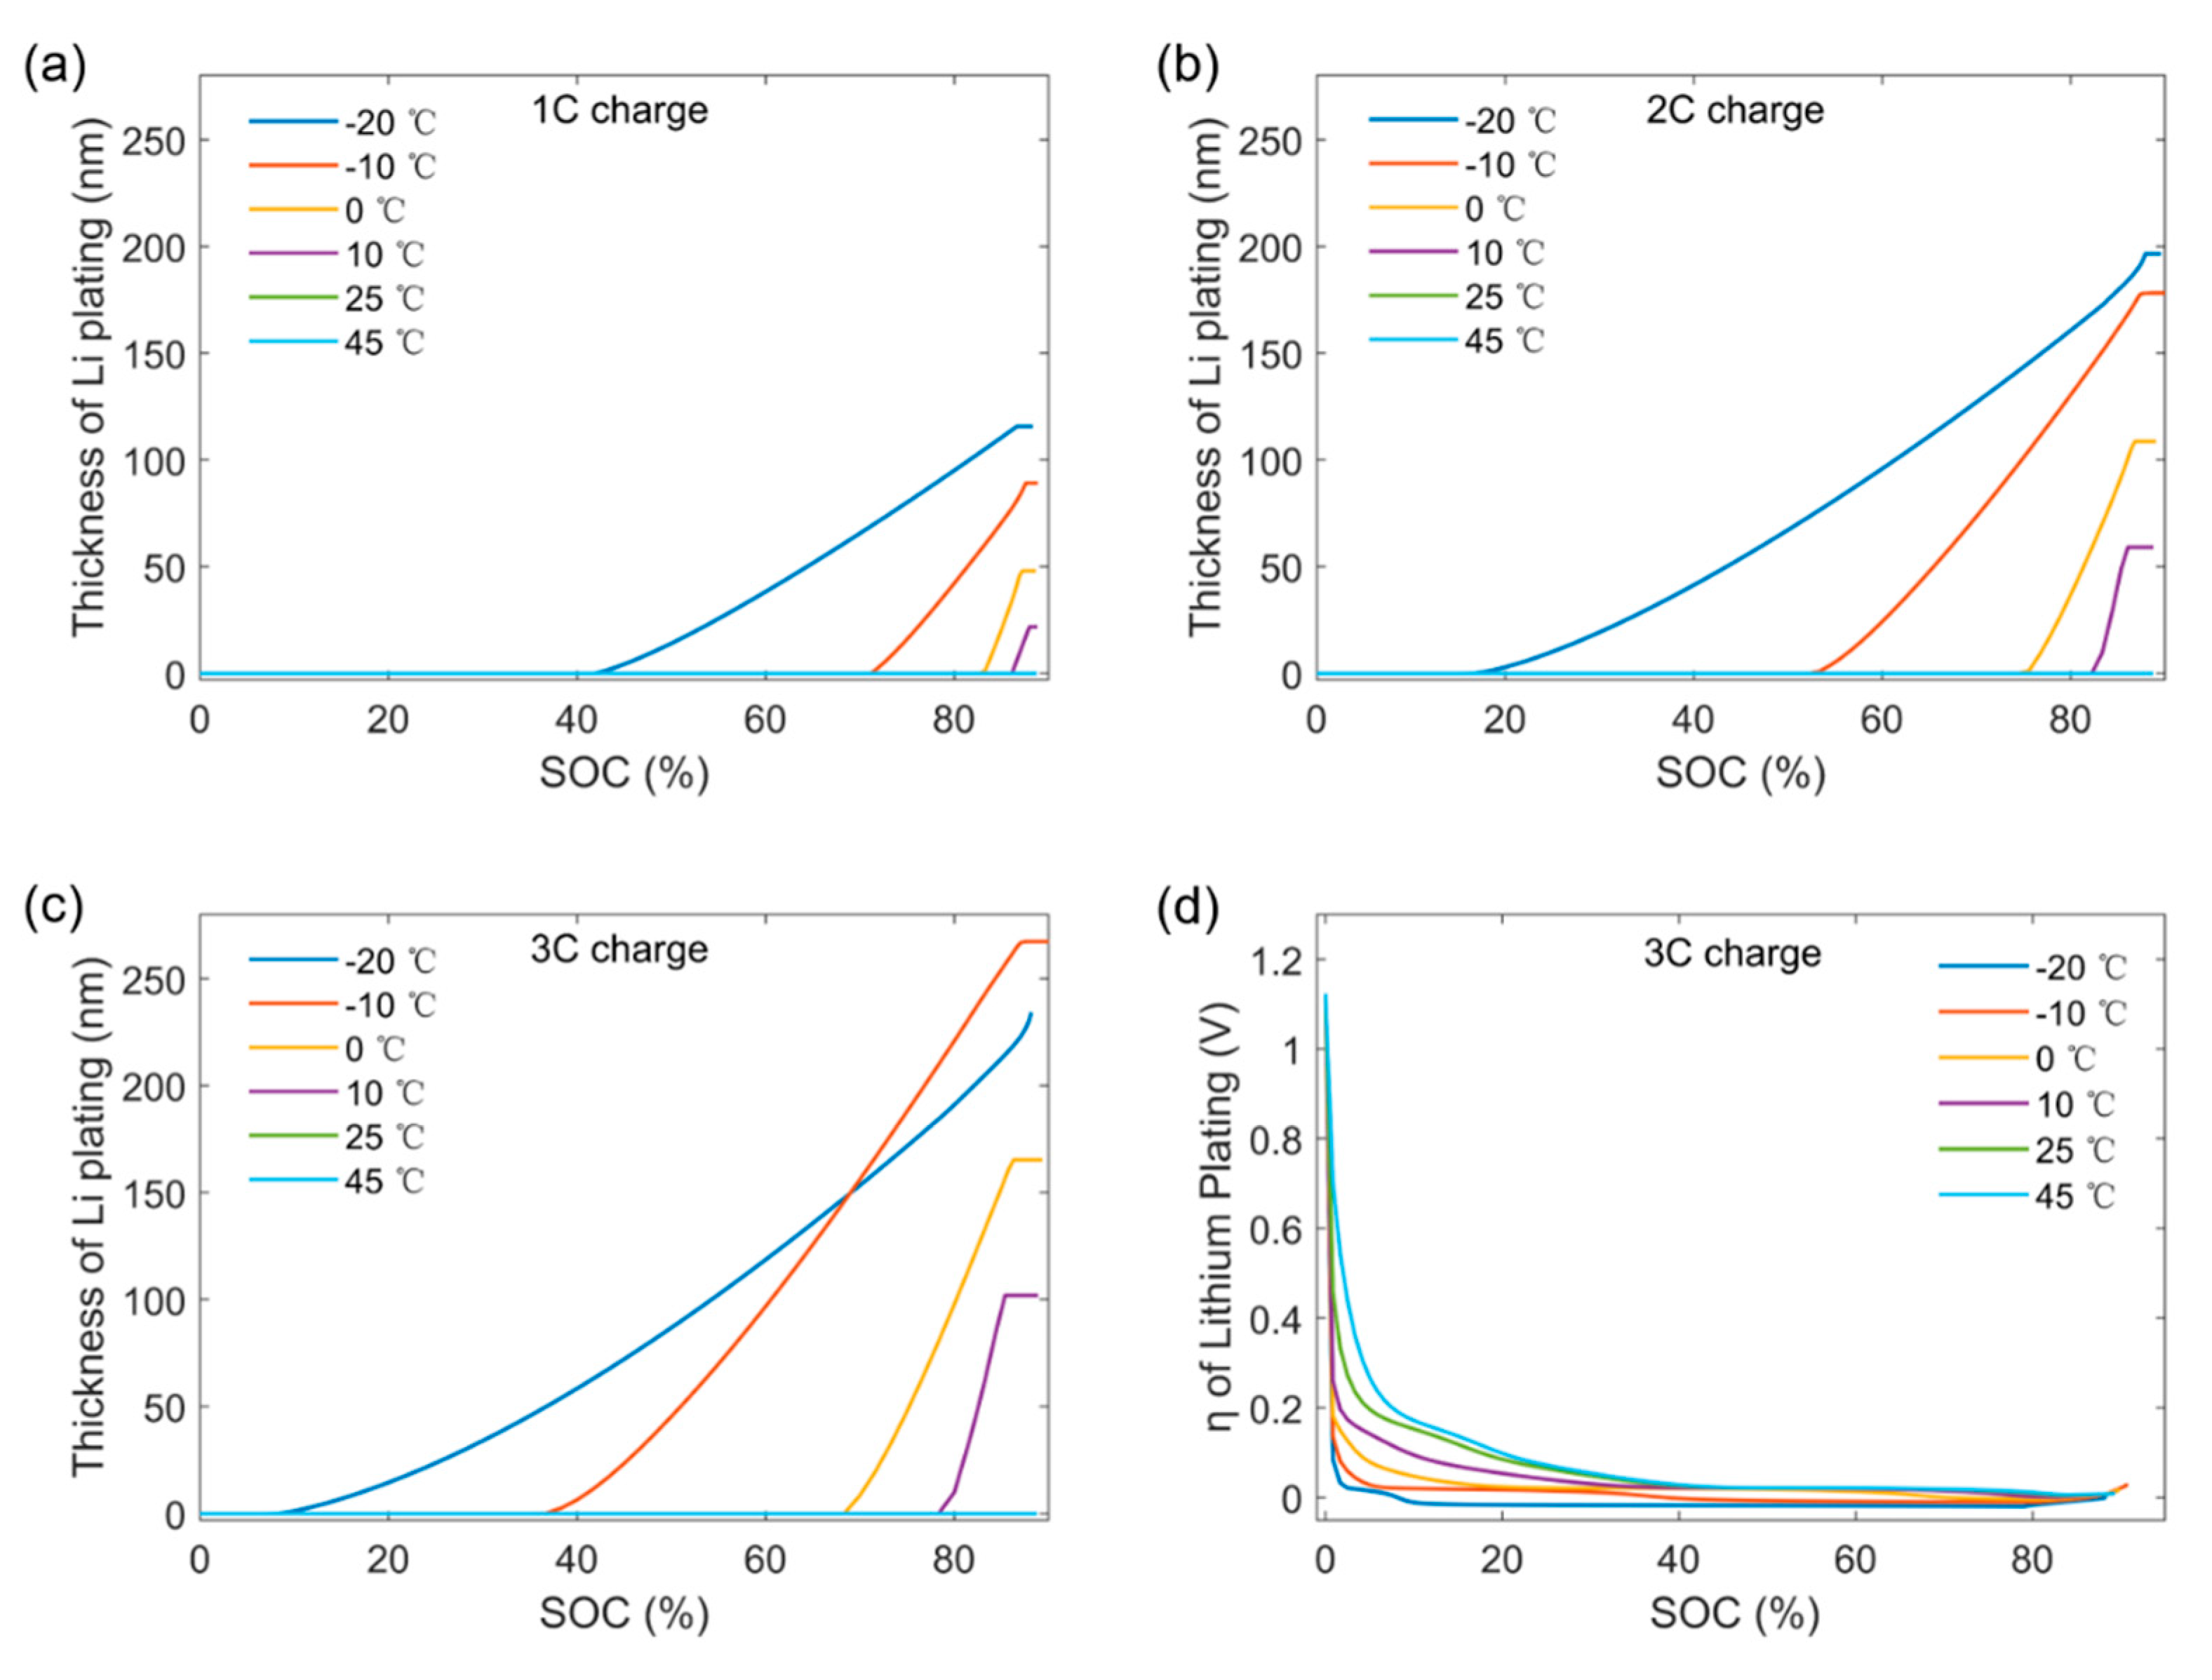
In order to further explore the threshold of lithium plating reaction under the condition of fast charging, the kinetic process of lithium plating is studied. Figure 4a–c show the change rule of the thickness of the anode lithium plating film in the initial cycle at different charging C-rates. By comparing the curves in the subfigures, it can be found that at the same C-rate, with the decrease of ambient temperature, lithium plating becomes more serious and the equilibrium thickness of lithium metal layer increases. Meanwhile, it should also be noticed that at the same temperature, with the increase of charging C-rate, the initial state of charge (SOC) of lithium plating gradually moves lower, and the SOC range of continuous lithium plating reaction gradually widens. For example, as shown in Figure 4b, when the battery is charged at 1C and 10 °C, lithium plating occurs at 80% SOC and reaches equilibrium at 85% SOC. To be clear, the cut-off voltage of constant-current charging is 4.2 V. However, when the battery is charged at −10 °C, lithium plating occurs at 52% SOC, and the thickness of the lithium plating film does not stop until 85% SOC when the battery is converted to constant-voltage charging. Similar results have been observed many times in the experimental studies of other research groups [20,21,37].
We believe that the reason for this phenomenon is the change of lithium plating reaction overpotential. It is well-known that as an electrode parasitic reaction, the lithium plating reaction intensity is determined by the exchange current at the reaction interface based on electrode reaction kinetics, and the rate of reaction can be described by the Arrhenius equation. The reaction occurs only when the reaction potential generated by the exchange current drops beyond the critical potential at which the reaction occurs, i.e., η < 0 V. Additionally, the larger the downward shift of overpotential is, the stronger the lithium plating reaction is. Since the Arrhenius coefficient is sensitive to temperature, the reaction overpotential of lithium plating changes with temperature and current density. Therefore, according to the following equation, we study the evolution law of overpotential under the above working conditions:
where is current density of lithium plating reaction, is specific surface area, is the number of charges an ion carries (herein ), is transfer coefficient, is overpotential of lithium plating, is reaction rate constant of lithium plating, and is lithium concentration in solid phase. Equation (20) shows the effect of temperature on the reaction rate, where is reference temperature (25 °C), is reaction temperature, is reaction rate constant at reference temperature, and is reaction activation energy.
Figure 4d and Figure 5 show the change rule of lithium plating reaction overpotential under different charging C-rates and different ambient temperatures. Figure 4d shows the change curve of the overpotential with SOC at 3C. It is found that at the early stage of charging, the overpotential is much higher than 0 V, resulting in no lithium plating, and then rapidly decreased. In order to better observe the change of overpotential when lithium plating reaction occurs, the part of the curve with SOC < 5% is truncated, and the charging currents of 0.5C, 1C, and 2C are studied, which obtain Figure 5a–d, respectively.
By comparing Figure 5a–d, it can be firstly found that at the same charging C-rate, the overpotential of lithium plating reaction decreases significantly with the decrease of temperature. Secondly, it is found that at the same temperature, the overpotential curves of different C-rates obviously move down overall. This results in two obvious consequences: the position of the reaction potential crossing 0 V at high C-rate shifts towards a lower SOC than that at low C-rate; and the reaction potential crosses 0 V more readily at low temperature than that at high temperature. Correspondingly, in the case of high C-rate, the temperature range in which the overpotential curve can cross the critical potential is relaxed, and the SOC range in which the potential curve crossing the critical potential stays below the critical line is relaxed. Considering Figure 5b,d as an example, in the case of 1C charging, the cases where the overpotential curves cross the critical potential are only at −20 °C and −10 °C. However, for 3C charging, the four overpotential curves from −20 °C to 10 °C all cross the critical potential, and the maximum SOC range of the reaction occurrence is expanded by 45%. This is consistent with the lithium plating reaction observed in Figure 2 and Figure 4, thus proving the correctness of our hypothesis above and revealing the kinetic cause of the phenomenon in Figure 4. In addition, this result shows that by monitoring the change of overpotential, the occurrence of lithium plating reaction can be accurately determined in a non-invasive state, and the occurrence degree can be predicted. Accordingly, we can take the discussion to the next level: how to achieve lithium-free control with maximum charging efficiency and minimize battery aging?
3.3. Determination of Optimal Charging Strategy
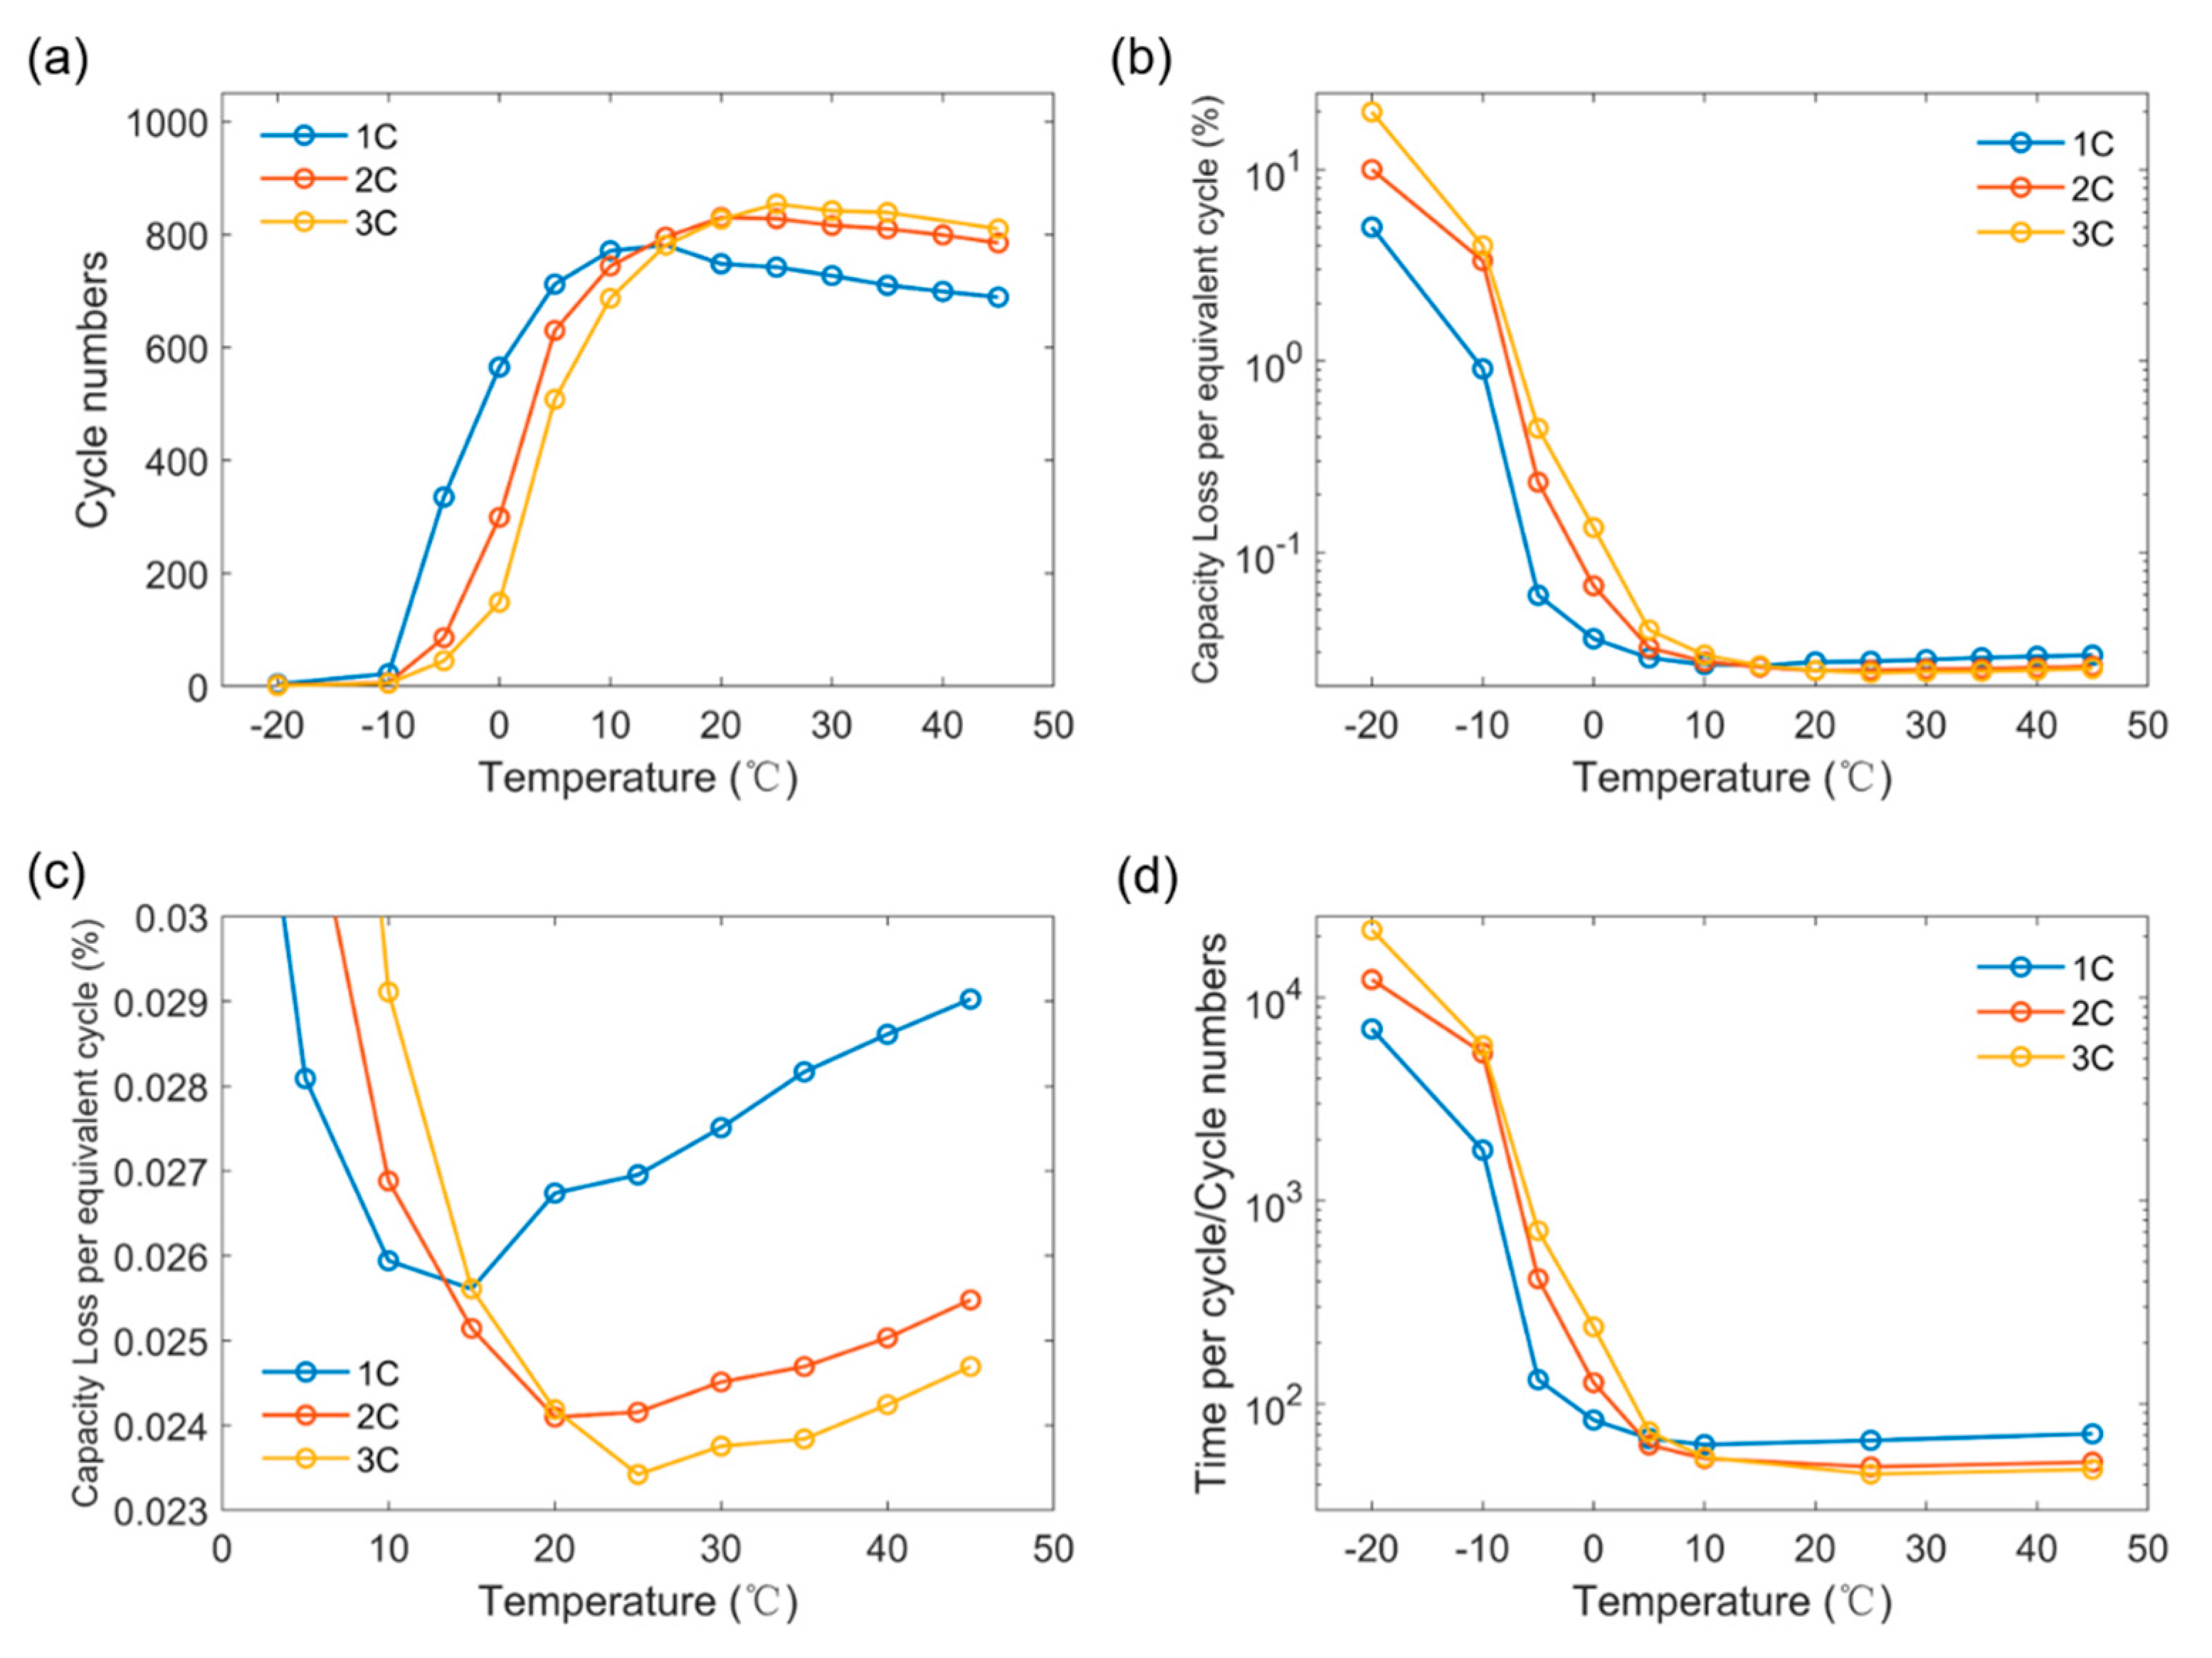
In order to explore the equilibrium point between battery charging efficiency and aging rate, the change rules of cycle times and average aging rate with ambient temperature and charging C-rate were investigated. Table 2 shows the cycle numbers of LIBs needed to reach EOL at various temperature and C-rates. Figure 6a,b, respectively, show the change curves of the number of available cycles and the average aging rate with the ambient temperature at different C-rates. Figure 6c can be obtained by enlarging the range between 0 °C and 45 °C in Figure 6b. It can be seen from Figure 6a that battery cycle life declines rapidly at low temperatures (below 5 °C); the number of available cycles begins to increase significantly after the temperature is above 5 °C; when the temperature exceeds 15 °C, the cycle life begins to decline slowly again with the further increase of temperature. Combined with Figure 3 and Figure 4, we believe that the reason for the above phenomenon is the transformation of the aging mechanism which plays a leading role. At low temperatures (below 5 °C), lithium plating is the dominant mechanism of battery aging, and the rapid consumption of recyclable lithium-ions leads to the rapid end of battery cycle life. Moreover, as the temperature rises (above 5 °C), the lithium plating phenomenon weakens, and the leading role gradually tilts to the SEI growth. As the rate of recyclable lithium-ions consumption slows, the battery cycle life increases rapidly and reaches an extreme value when the reaction rates of lithium plating and SEI growth are balanced. With the further increase of the temperature, SEI growth becomes the dominant mechanism of battery aging, and the battery cycle life begins to gradually decrease again due to the loss of the competitive response constraint. It should be noticed that the temperature at which the battery cycle life reaches the maximum value gradually moves to the high temperature region with the increase of C-rate. This indicates that for the optimal charging strategy of batteries, a reduced quantity which can reflect both aging rate and charging efficiency needs to be categorized.
By comparing the curves of different charging C-rates in Figure 6c, it can be clearly seen that there is an inflection point in the average cycle aging rate of the battery at different charging C-rates, and the temperature value corresponding to the lowest aging rate is the same as the temperature value corresponding to the highest cycle life in Figure 6a. This indicates that the average cycle aging rate can be used as a calibration, reflecting the aging rate and charging efficiency of batteries. However, the movement of the inflection point of the average cyclic aging rate indicates that room temperature is not necessarily the optimal charging temperature for different C-rates, and larger C-rates tend to require relatively higher ambient temperatures. For example, as the increase of C-rate, the optimal charging temperature increases from 1C for 15 °C to 3C for 25 °C. This also reflects that lithium plating itself has an inhibitory effect on SEI film, and the two side reactions are competitive reactions. The dynamic balance of the two competing with each other for the electrode main reaction determines the optimum battery-charging condition.
Furthermore, an interesting phenomenon is found in Figure 6a: after crossing the inflection point, the available cycle life of 1C is lower than those of 2C and 3C at the same temperature, and the average cycle aging rate in Figure 6c gives a consistent result. A similar phenomenon has been observed in studies by other groups [38], but this has not been explained in depth, unfortunately. Based on the information already known, we believe that this should be a macroscopic mapping of some microscopic kinetic mechanism. To verify the above conjecture, the change trend of average available cycle time under different charging conditions is studied. The result shows that after passing the inflection point, the degradation amount of available circulating lithium is linearly related to the average time of a single cycle. For this reason, the variation rule of single cycle time with ambient temperature at different C-rates is studied, as shown in Figure 7b. From the figure, it can be found that the time required of a single cycle for 1C charging is much higher than those for 2C and 3C charging. We also find that even for charge at 20 °C with 1C, there is still a trace of lithium plating, which is easy to ignore because it causes only less than 0.02% capacity loss. However, this tiny lithium plating process may promote the growth of SEI, resulting in a decrease in the cycle number at low C-rates, which has also been found in other study [39]. By comparing Figure 2 with Figure 3, it can be seen that SEI film growth is the dominant factor of battery capacity degradation above 15 °C, while the growth rate of SEI film is almost constant after stabilization, and it is not sensitive to the change of C-rate. Combined with the existing studies on SEI film growth [40,41], we believe that the available cycle life of 1C is less than those of 2C and 3C at the same temperature after the average cycle decay rate crosses the inflection point, and the reasons are as follows: in the case where SEI film growth is the only aging mechanism, 1C charging takes much longer than 2C and 3C charging in a single cycle, resulting in the significantly greater lithium loss due to SEI film growth at low C-rates than at high C-rates, which reduces the number of available cycles of 1C charging and leads to a relative reduction in cycle life. This is essentially a competition result between the single cycle time and the number of available cycles.
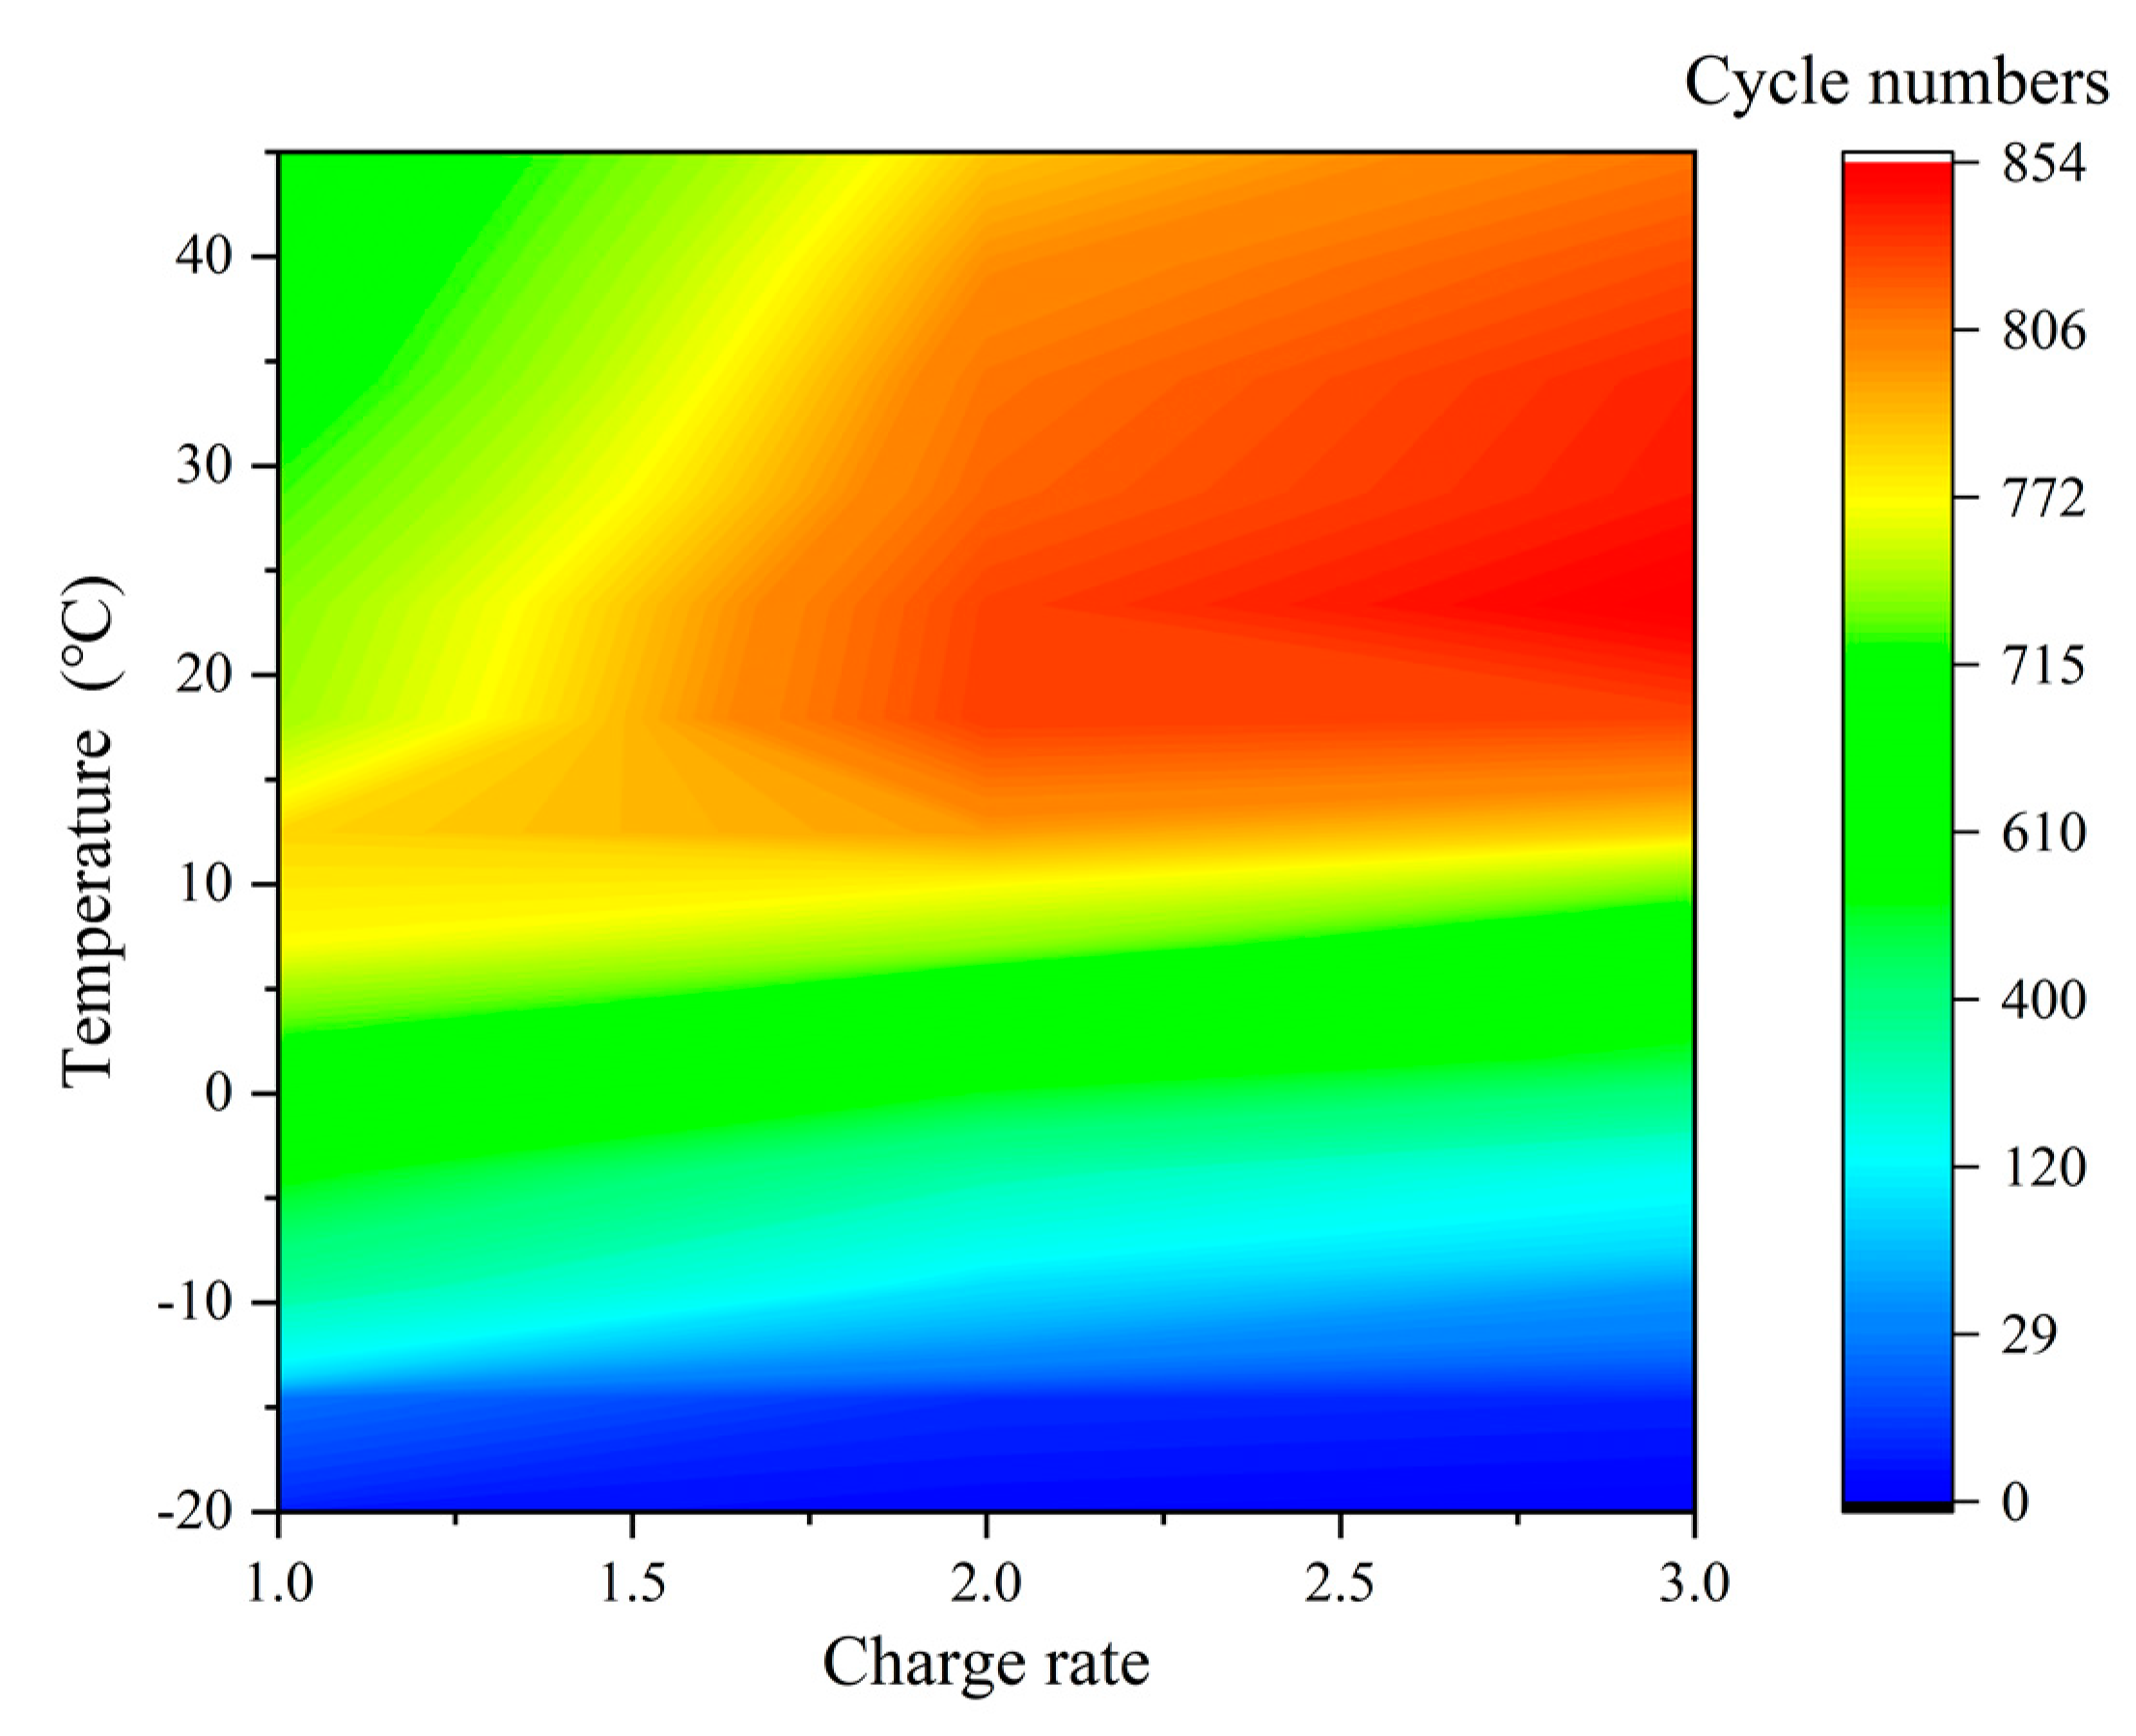
After all the above preparations, direct research to optimal charging strategies for batteries can finally be performed. Figure 8 shows the chromaticity diagram of the expected cycle life of the battery at different charging C-rates and temperatures. Darker red indicates a higher cycle life of the battery, and darker blue indicates a shorter cycle life. It can be found that for different charging C-rates, the optimal charging temperature of the battery is in the range of 15–35 °C and increases as the C-rate increases. For example, the optimum charging temperature is 15 °C for 1C charging, rising to 25 °C for 2C charging, and further rising to 30 °C for 3C charging. This indicates that for batteries with low energy density or low capacity, such as lithium–iron phosphate batteries, they are better adapted to fast charging without preheating at low temperatures. For higher capacity batteries, they should be properly preheated when charging them fast at high C-rates. Due to the potential for lithium plating, it is important to achieve lithium-free control of the battery during high C-rate charging. When charging at low temperatures, it is recommended that the battery is first preheated to at least 15 °C. The self-generated heat of the battery alone is not sufficient to counteract the negative effects of low temperatures on fast charging. If possible, the battery temperature should always be controlled at the optimum charging temperature according to the charging C-rate. This undoubtedly puts forward higher demands on the thermal management and BMS for electric vehicles. Furthermore, our research can provide a useful reference for the development of high-performance and safe BMSs to achieve fine-grained management of batteries.
4. Conclusions
In this paper, a porous pole–thermal coupling model combining SEI film growth and lithium plating is established to systematically analyze the leading factors and competition relation among different factors of capacity degradation for LIBs at different ambient temperatures and charging C-rates. Additionally, a method of lithium-free control based on reaction overpotential under high charging C-rates is proposed. In addition, through studying the aging rate of average cycle for LIBs under different charging conditions, an evaluation index balancing the aging rate and charging efficiency is obtained, and the optimal fast-charging strategy of LIBs under different ambient temperatures is discussed, in which it is pointed out that it is an effective strategy to adjust the preheating temperature according to the battery capacity and charging C-rate in a low-temperature environment. Therefore, a high-performance BMS is needed to achieve fine-grained management of batteries. Our research can enrich the fast-charging strategy without lithium plating and provide the guidance for the next generation battery management system.
Supplementary Materials
The following supporting information can be downloaded at: https://www.mdpi.com/article/10.3390/batteries8110234/s1, We have submitted a calculation example of charging with 3C at 10 °C (Calculation example.mph), and its brief description (Description.pdf).
Author Contributions
Conceptualization, S.C.; methodology, S.C.; software, H.X. and S.L.; formal analysis, H.X.; writing—original draft preparation, Z.G.; writing—review and editing, H.X. and S.C.; visualization, X.Y. and W.N. All authors have read and agreed to the published version of the manuscript.
Funding
This research was funded by Science and Technology Development Project of Jilin province (20200501012GX).
Data Availability Statement
Not applicable.
Conflicts of Interest
The authors declare no conflict of interest.
References
- Lin, C.; Kong, W.; Tian, Y.; Wang, W.; Zhao, M. Heating Lithium-Ion Batteries at Low Temperatures for Onboard Applications: Recent Progress, Challenges and Prospects. Automot. Innov. 2022, 5, 3–17. [Google Scholar] [CrossRef]
- Chandrasekaran, R. Quantification of Bottlenecks to Fast Charging of Lithium-Ion-Insertion Cells for Electric Vehicles. J. Power Sources 2014, 271, 622–632. [Google Scholar] [CrossRef]
- Somerville, L.; Bareño, J.; Trask, S.; Jennings, P.; McGordon, A.; Lyness, C.; Bloom, I. The Effect of Charging Rate on the Graphite Electrode of Commercial Lithium-Ion Cells: A Post-Mortem Study. J. Power Sources 2016, 335, 189–196. [Google Scholar] [CrossRef] [Green Version]
- Tomaszewska, A.; Chu, Z.; Feng, X.; O’Kane, S.; Liu, X.; Chen, J.; Ji, C.; Endler, E.; Li, R.; Liu, L.; et al. Lithium-Ion Battery Fast Charging: A Review. eTransportation 2019, 1, 100011. [Google Scholar] [CrossRef]
- Chen, K.; Li, G.; Wang, Y.; Chen, W.; Mi, L. High Loading FeS2 Nanoparticles Anchored on Biomass-Derived Carbon Tube as Low Cost and Long Cycle Anode for Sodium-Ion Batteries. Green Energy Environ. 2020, 5, 50–58. [Google Scholar] [CrossRef]
- Cao, R.; Cheng, H.; Jia, X.; Gao, X.; Zhang, Z.; Wang, M.; Li, S.; Zhang, C.; Ma, B.; Liu, X.; et al. Non-Invasive Characteristic Curve Analysis of Lithium-Ion Batteries Enabling Degradation Analysis and Data-Driven Model Construction: A Review. Automot. Innov. 2022, 5, 146–163. [Google Scholar] [CrossRef]
- Petzl, M.; Kasper, M.; Danzer, M.A. Lithium Plating in a Commercial Lithium-Ion Battery—A Low-Temperature Aging Study. J. Power Sources 2015, 275, 799–807. [Google Scholar] [CrossRef]
- Liu, Q.; Du, C.; Shen, B.; Zuo, P.; Cheng, X.; Ma, Y.; Yin, G.; Gao, Y. Understanding Undesirable Anode Lithium Plating Issues in Lithium-Ion Batteries. RSC Adv. 2016, 6, 88683–88700. [Google Scholar] [CrossRef]
- Han, X.; Feng, X.; Ouyang, M.; Lu, L.; Li, J.; Zheng, Y.; Li, Z. A Comparative Study of Charging Voltage Curve Analysis and State of Health Estimation of Lithium-Ion Batteries in Electric Vehicle. Automot. Innov. 2019, 2, 263–275. [Google Scholar] [CrossRef] [Green Version]
- Lu, Q.; Jie, Y.; Meng, X.; Omar, A.; Mikhailova, D.; Cao, R.; Jiao, S.; Lu, Y.; Xu, Y. Carbon Materials for Stable Li Metal Anodes: Challenges, Solutions, and Outlook. Carbon Energy 2021, 3, 957–975. [Google Scholar] [CrossRef]
- Meng, X.; Xu, Y.; Cao, H.; Lin, X.; Ning, P.; Zhang, Y.; Garcia, Y.G.; Sun, Z. Internal Failure of Anode Materials for Lithium Batteries—A Critical Review. Green Energy Environ. 2020, 5, 22–36. [Google Scholar] [CrossRef]
- Legrand, N.; Knosp, B.; Desprez, P.; Lapicque, F.; Raël, S. Physical Characterization of the Charging Process of a Li-Ion Battery and Prediction of Li Plating by Electrochemical Modelling. J. Power Sources 2014, 245, 208–216. [Google Scholar] [CrossRef]
- Waldmann, T.; Hogg, B.-I.; Wohlfahrt-Mehrens, M. Li Plating as Unwanted Side Reaction in Commercial Li-Ion Cells—A Review. J. Power Sources 2018, 384, 107–135. [Google Scholar] [CrossRef]
- Gao, X.; Liu, X.; Xie, W.; Zhang, L.; Yang, S. Multiscale Observation of Li Plating for Lithium-Ion Batteries. Rare Met. 2021, 40, 3038–3048. [Google Scholar] [CrossRef]
- Hein, S.; Latz, A. Influence of Local Lithium Metal Deposition in 3D Microstructures on Local and Global Behavior of Lithium-Ion Batteries. Electrochim. Acta 2016, 201, 354–365. [Google Scholar] [CrossRef] [Green Version]
- Bugga, R.V.; Smart, M.C. Lithium Plating Behavior in Lithium-Ion Cells. ECS Trans. 2010, 25, 241–252. [Google Scholar] [CrossRef]
- Li, Y.; Feng, X.; Ren, D.; Ouyang, M.; Lu, L.; Han, X. Thermal Runaway Triggered by Plated Lithium on the Anode after Fast Charging. ACS Appl. Mater. Interfaces 2019, 11, 46839–46850. [Google Scholar] [CrossRef]
- Tan, X.; Qiu, J.; Li, J.; Fan, Y.; Liu, J. Lithium Plating as Limiting Phenomena for Estimating Safety during Lithium-Ion Battery Charging. Int. J. Electrochem. Sci. 2020, 15, 9233–9244. [Google Scholar] [CrossRef]
- Cai, W.; Yan, C.; Yao, Y.X.; Xu, L.; Chen, X.R.; Huang, J.Q.; Zhang, Q. The Boundary of Lithium Plating in Graphite Electrode for Safe Lithium-Ion Batteries. Angew. Chem. Int. Ed. 2021, 60, 13007–13012. [Google Scholar] [CrossRef]
- Fan, J.; Tan, S. Studies on Charging Lithium-Ion Cells at Low Temperatures. J. Electrochem. Soc. 2006, 153, A1081. [Google Scholar] [CrossRef]
- Ouyang, M.; Chu, Z.; Lu, L.; Li, J.; Han, X.; Feng, X.; Liu, G. Low Temperature Aging Mechanism Identification and Lithium Deposition in a Large Format Lithium Iron Phosphate Battery for Different Charge Profiles. J. Power Sources 2015, 286, 309–320. [Google Scholar] [CrossRef]
- An, S.J.; Li, J.; Daniel, C.; Mohanty, D.; Nagpure, S.; Wood, D.L. The State of Understanding of the Lithium-Ion-Battery Graphite Solid Electrolyte Interphase (SEI) and Its Relationship to Formation Cycling. Carbon 2016, 105, 52–76. [Google Scholar] [CrossRef] [Green Version]
- Zhang, S.; Xu, K.; Jow, T. Low-Temperature Performance of Li-Ion Cells with a LiBF4-Based Electrolyte. J. Solid State Electrochem. 2003, 7, 147–151. [Google Scholar] [CrossRef]
- Zhang, S.S.; Xu, K.; Jow, T.R. The Low Temperature Performance of Li-Ion Batteries. J. Power Sources 2003, 115, 137–140. [Google Scholar] [CrossRef]
- Tao, H.; Lian, C.; Liu, H. Multiscale Modeling of Electrolytes in Porous Electrode: From Equilibrium Structure to Non-Equilibrium Transport. Green Energy Environ. 2020, 5, 303–321. [Google Scholar] [CrossRef]
- Gao, F.; Tang, Z. Kinetic Behavior of LiFePO4/C Cathode Material for Lithium-Ion Batteries. Electrochim. Acta 2008, 53, 5071–5075. [Google Scholar] [CrossRef]
- Schimpe, M.; von Kuepach, M.E.; Naumann, M.; Hesse, H.C.; Smith, K.; Jossen, A. Comprehensive Modeling of Temperature-Dependent Degradation Mechanisms in Lithium Iron Phosphate Batteries. J. Electrochem. Soc. 2018, 165, A181–A193. [Google Scholar] [CrossRef] [Green Version]
- Ecker, M.; Shafiei Sabet, P.; Sauer, D.U. Influence of Operational Condition on Lithium Plating for Commercial Lithium-Ion Batteries—Electrochemical Experiments and Post-Mortem-Analysis. Appl. Energy 2017, 206, 934–946. [Google Scholar] [CrossRef]
- Matadi, B.P.; Geniès, S.; Delaille, A.; Chabrol, C.; de Vito, E.; Bardet, M.; Martin, J.-F.; Daniel, L.; Bultel, Y. Irreversible Capacity Loss of Li-Ion Batteries Cycled at Low Temperature Due to an Untypical Layer Hindering Li Diffusion into Graphite Electrode. J. Electrochem. Soc. 2017, 164, A2374–A2389. [Google Scholar] [CrossRef]
- Doyle, M.; Newman, J. The Use of Mathematical Modeling in the Design of Lithium/Polymer Battery Systems. Electrochim. Acta 1995, 40, 2191–2196. [Google Scholar] [CrossRef]
- Momeni Boroujeni, S.; Birke, K.P. Study of a Li-Ion Cell Kinetics in Five Regions to Predict Li Plating Using a Pseudo Two-Dimensional Model. Sustainability 2019, 11, 6392. [Google Scholar] [CrossRef] [Green Version]
- Sturm, J.; Rheinfeld, A.; Zilberman, I.; Spingler, F.B.; Kosch, S.; Frie, F.; Jossen, A. Modeling and Simulation of Inhomogeneities in a 18650 Nickel-Rich, Silicon-Graphite Lithium-Ion Cell during Fast Charging. J. Power Sources 2019, 412, 204–223. [Google Scholar] [CrossRef] [Green Version]
- Müller, D.; Dufaux, T.; Birke, K.P. Model-Based Investigation of Porosity Profiles in Graphite Anodes Regarding Sudden-Death and Second-Life of Lithium Ion Cells. Batteries 2019, 5, 49. [Google Scholar] [CrossRef] [Green Version]
- Burns, J.C.; Stevens, D.A.; Dahn, J.R. In-Situ Detection of Lithium Plating Using High Precision Coulometry. J. Electrochem. Soc. 2015, 162, A959–A964. [Google Scholar] [CrossRef]
- Sieg, J.; Schmid, A.U.; Rau, L.; Gesterkamp, A.; Storch, M.; Spier, B.; Birke, K.P.; Sauer, D.U. Fast-Charging Capability of Lithium-Ion Cells: Influence of Electrode Aging and Electrolyte Consumption. Appl. Energy 2022, 305, 117747. [Google Scholar] [CrossRef]
- Kim, S.-P.; van Duin, A.C.T.; Shenoy, V.B. Effect of Electrolytes on the Structure and Evolution of the Solid Electrolyte Interphase (SEI) in Li-Ion Batteries: A Molecular Dynamics Study. J. Power Sources 2011, 196, 8590–8597. [Google Scholar] [CrossRef]
- Tippmann, S.; Walper, D.; Balboa, L.; Spier, B.; Bessler, W.G. Low-Temperature Charging of Lithium-Ion Cells Part I: Electrochemical Modeling and Experimental Investigation of Degradation Behavior. J. Power Sources 2014, 252, 305–316. [Google Scholar] [CrossRef]
- Yang, X.-G.; Wang, C.-Y. Understanding the Trilemma of Fast Charging, Energy Density and Cycle Life of Lithium-Ion Batteries. J. Power Sources 2018, 402, 489–498. [Google Scholar] [CrossRef]
- Rangarajan, S.P.; Barsukov, Y.; Mukherjee, P.P. In Operando Signature and Quantification of Lithium Plating. J. Mater. Chem. A Mater. 2019, 7, 20683–20695. [Google Scholar] [CrossRef]
- Peled, E.; Menkin, S. Review-SEI: Past, Present and Future. J. Electrochem. Soc. 2017, 164, A1703–A1719. [Google Scholar] [CrossRef]
- Wang, A.; Kadam, S.; Li, H.; Shi, S.; Qi, Y. Review on Modeling of the Anode Solid Electrolyte Interphase (SEI) for Lithium-Ion Batteries. NPJ Comput. Mater. 2018, 4, 15. [Google Scholar] [CrossRef]
Figure 1.
Schematic diagram of the modified P2D model of lithium-ion batteries.
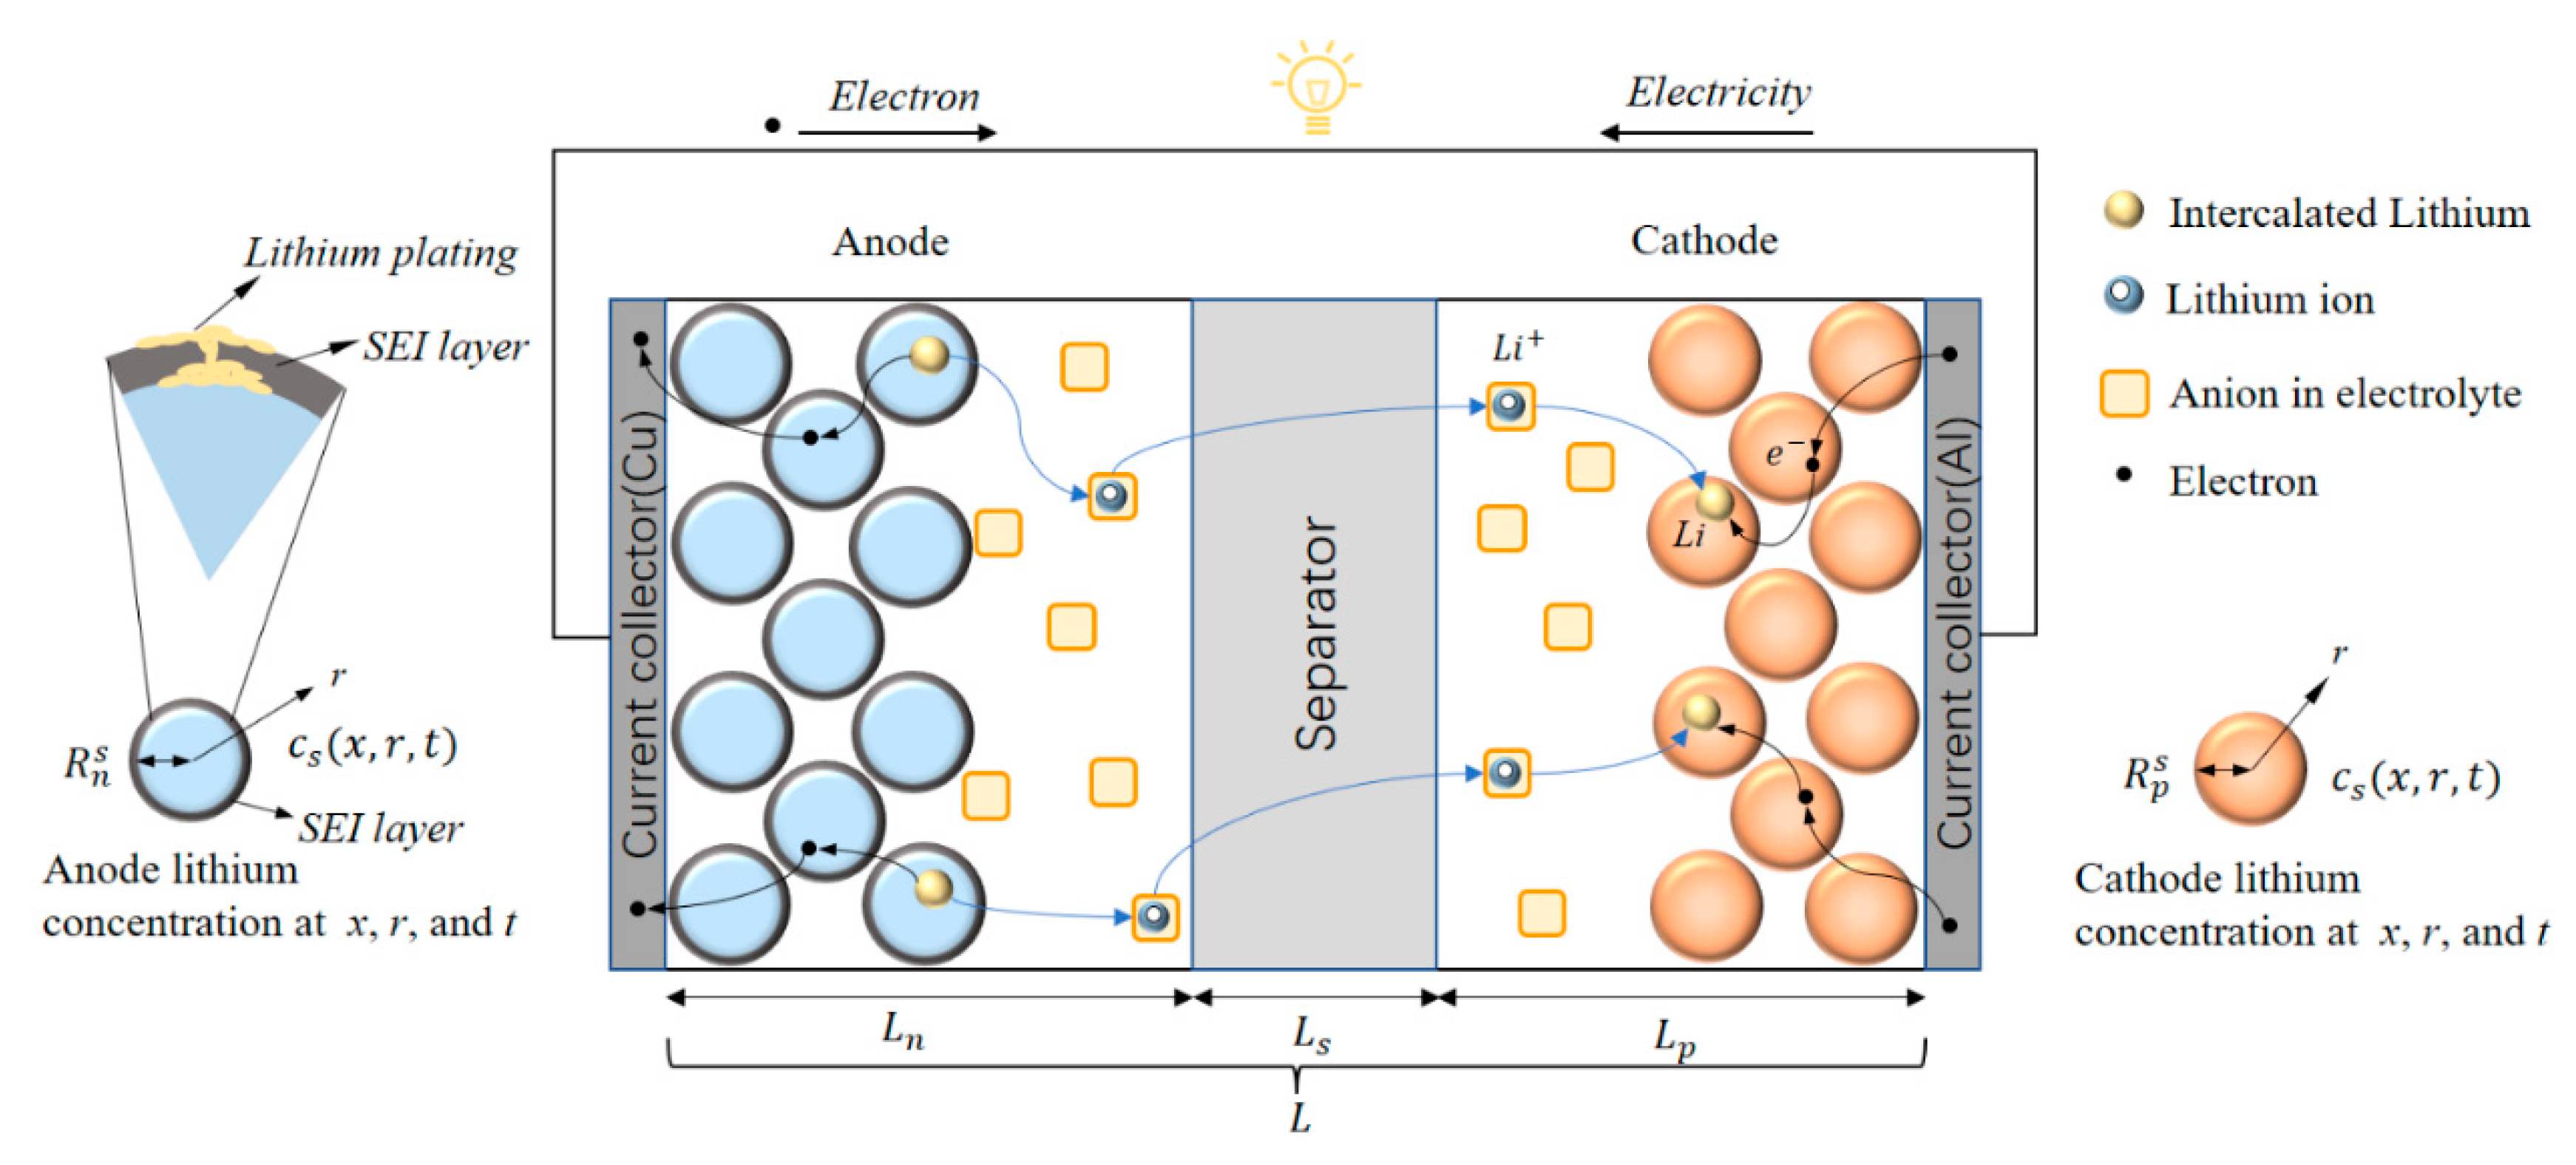
Figure 2.
Competition between lithium plating and SEI growth in cycle life simulation. (a) Charging at 1C. (b) Charging at 2C. (c) Charging at 3C. All batteries are discharged at 1C.
Figure 2.
Competition between lithium plating and SEI growth in cycle life simulation. (a) Charging at 1C. (b) Charging at 2C. (c) Charging at 3C. All batteries are discharged at 1C.
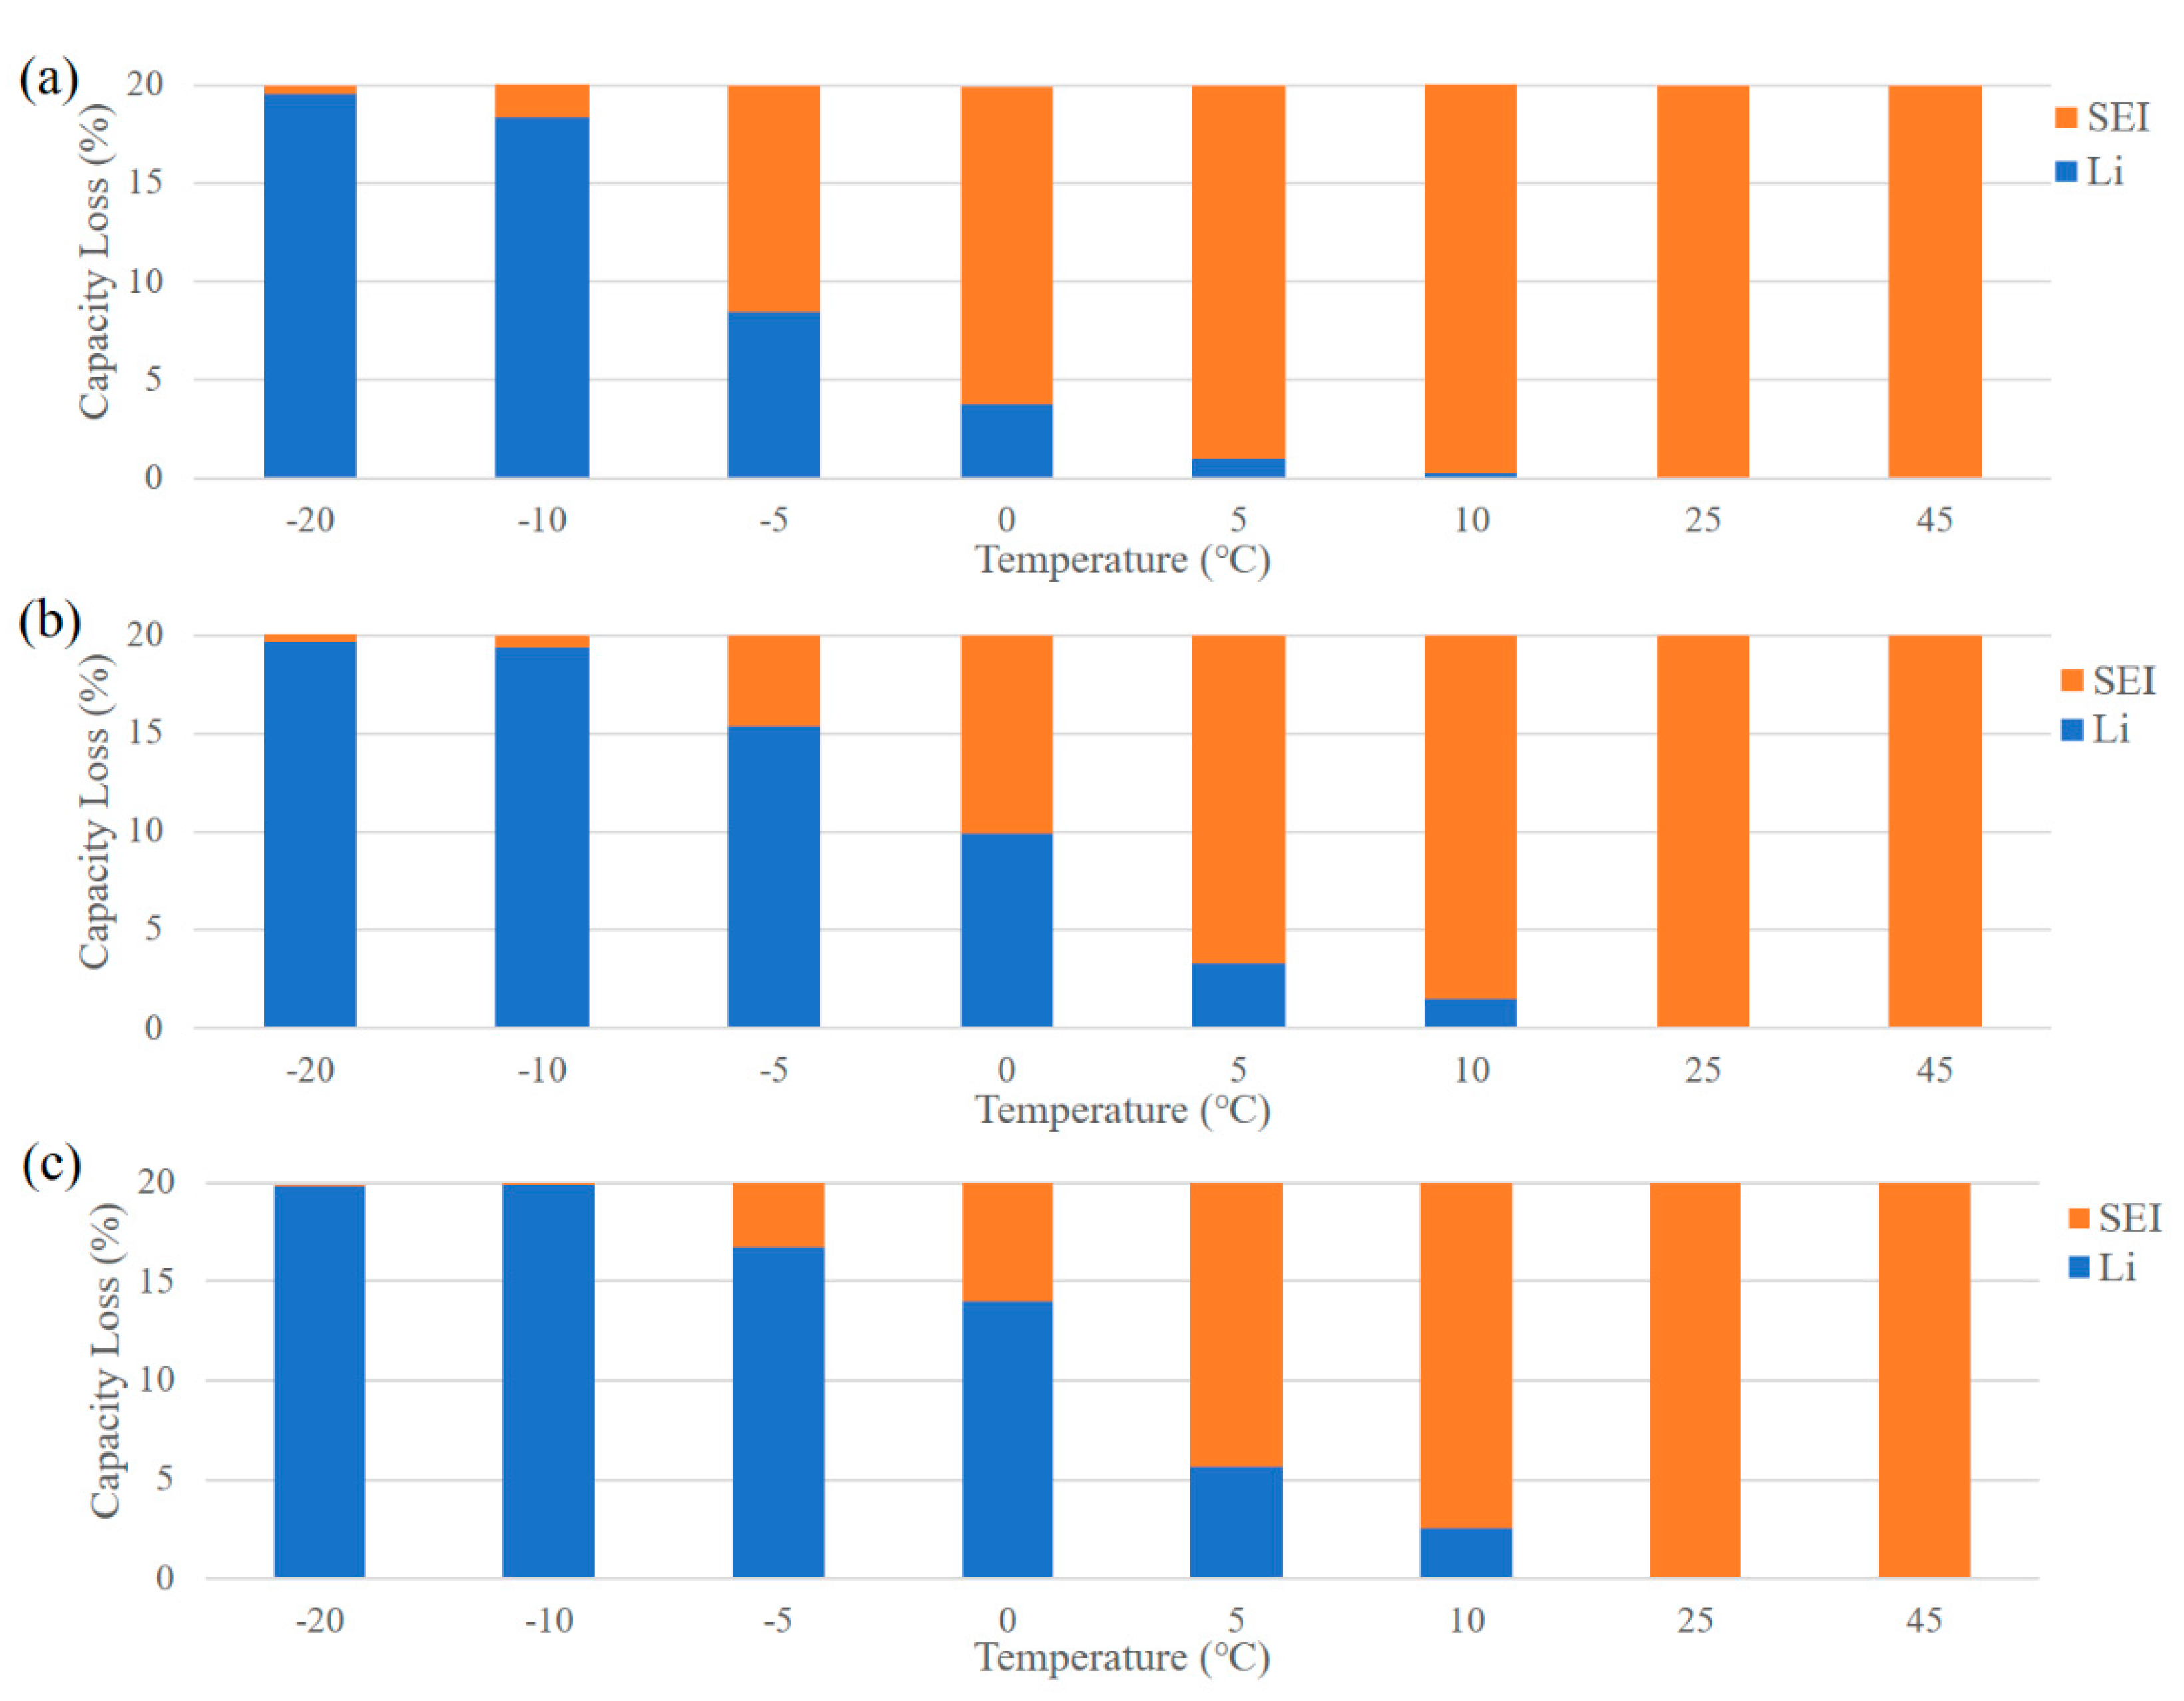
Figure 3.
SEI growth and lithium plating in the cycling process. (a,c,e) are capacity loss caused by SEI film growth with 1C, 2C, and 3C charge, respectively. (b,d,f) are capacity loss caused by lithium plating with 1C, 2C, and 3C charge, respectively.
Figure 3.
SEI growth and lithium plating in the cycling process. (a,c,e) are capacity loss caused by SEI film growth with 1C, 2C, and 3C charge, respectively. (b,d,f) are capacity loss caused by lithium plating with 1C, 2C, and 3C charge, respectively.
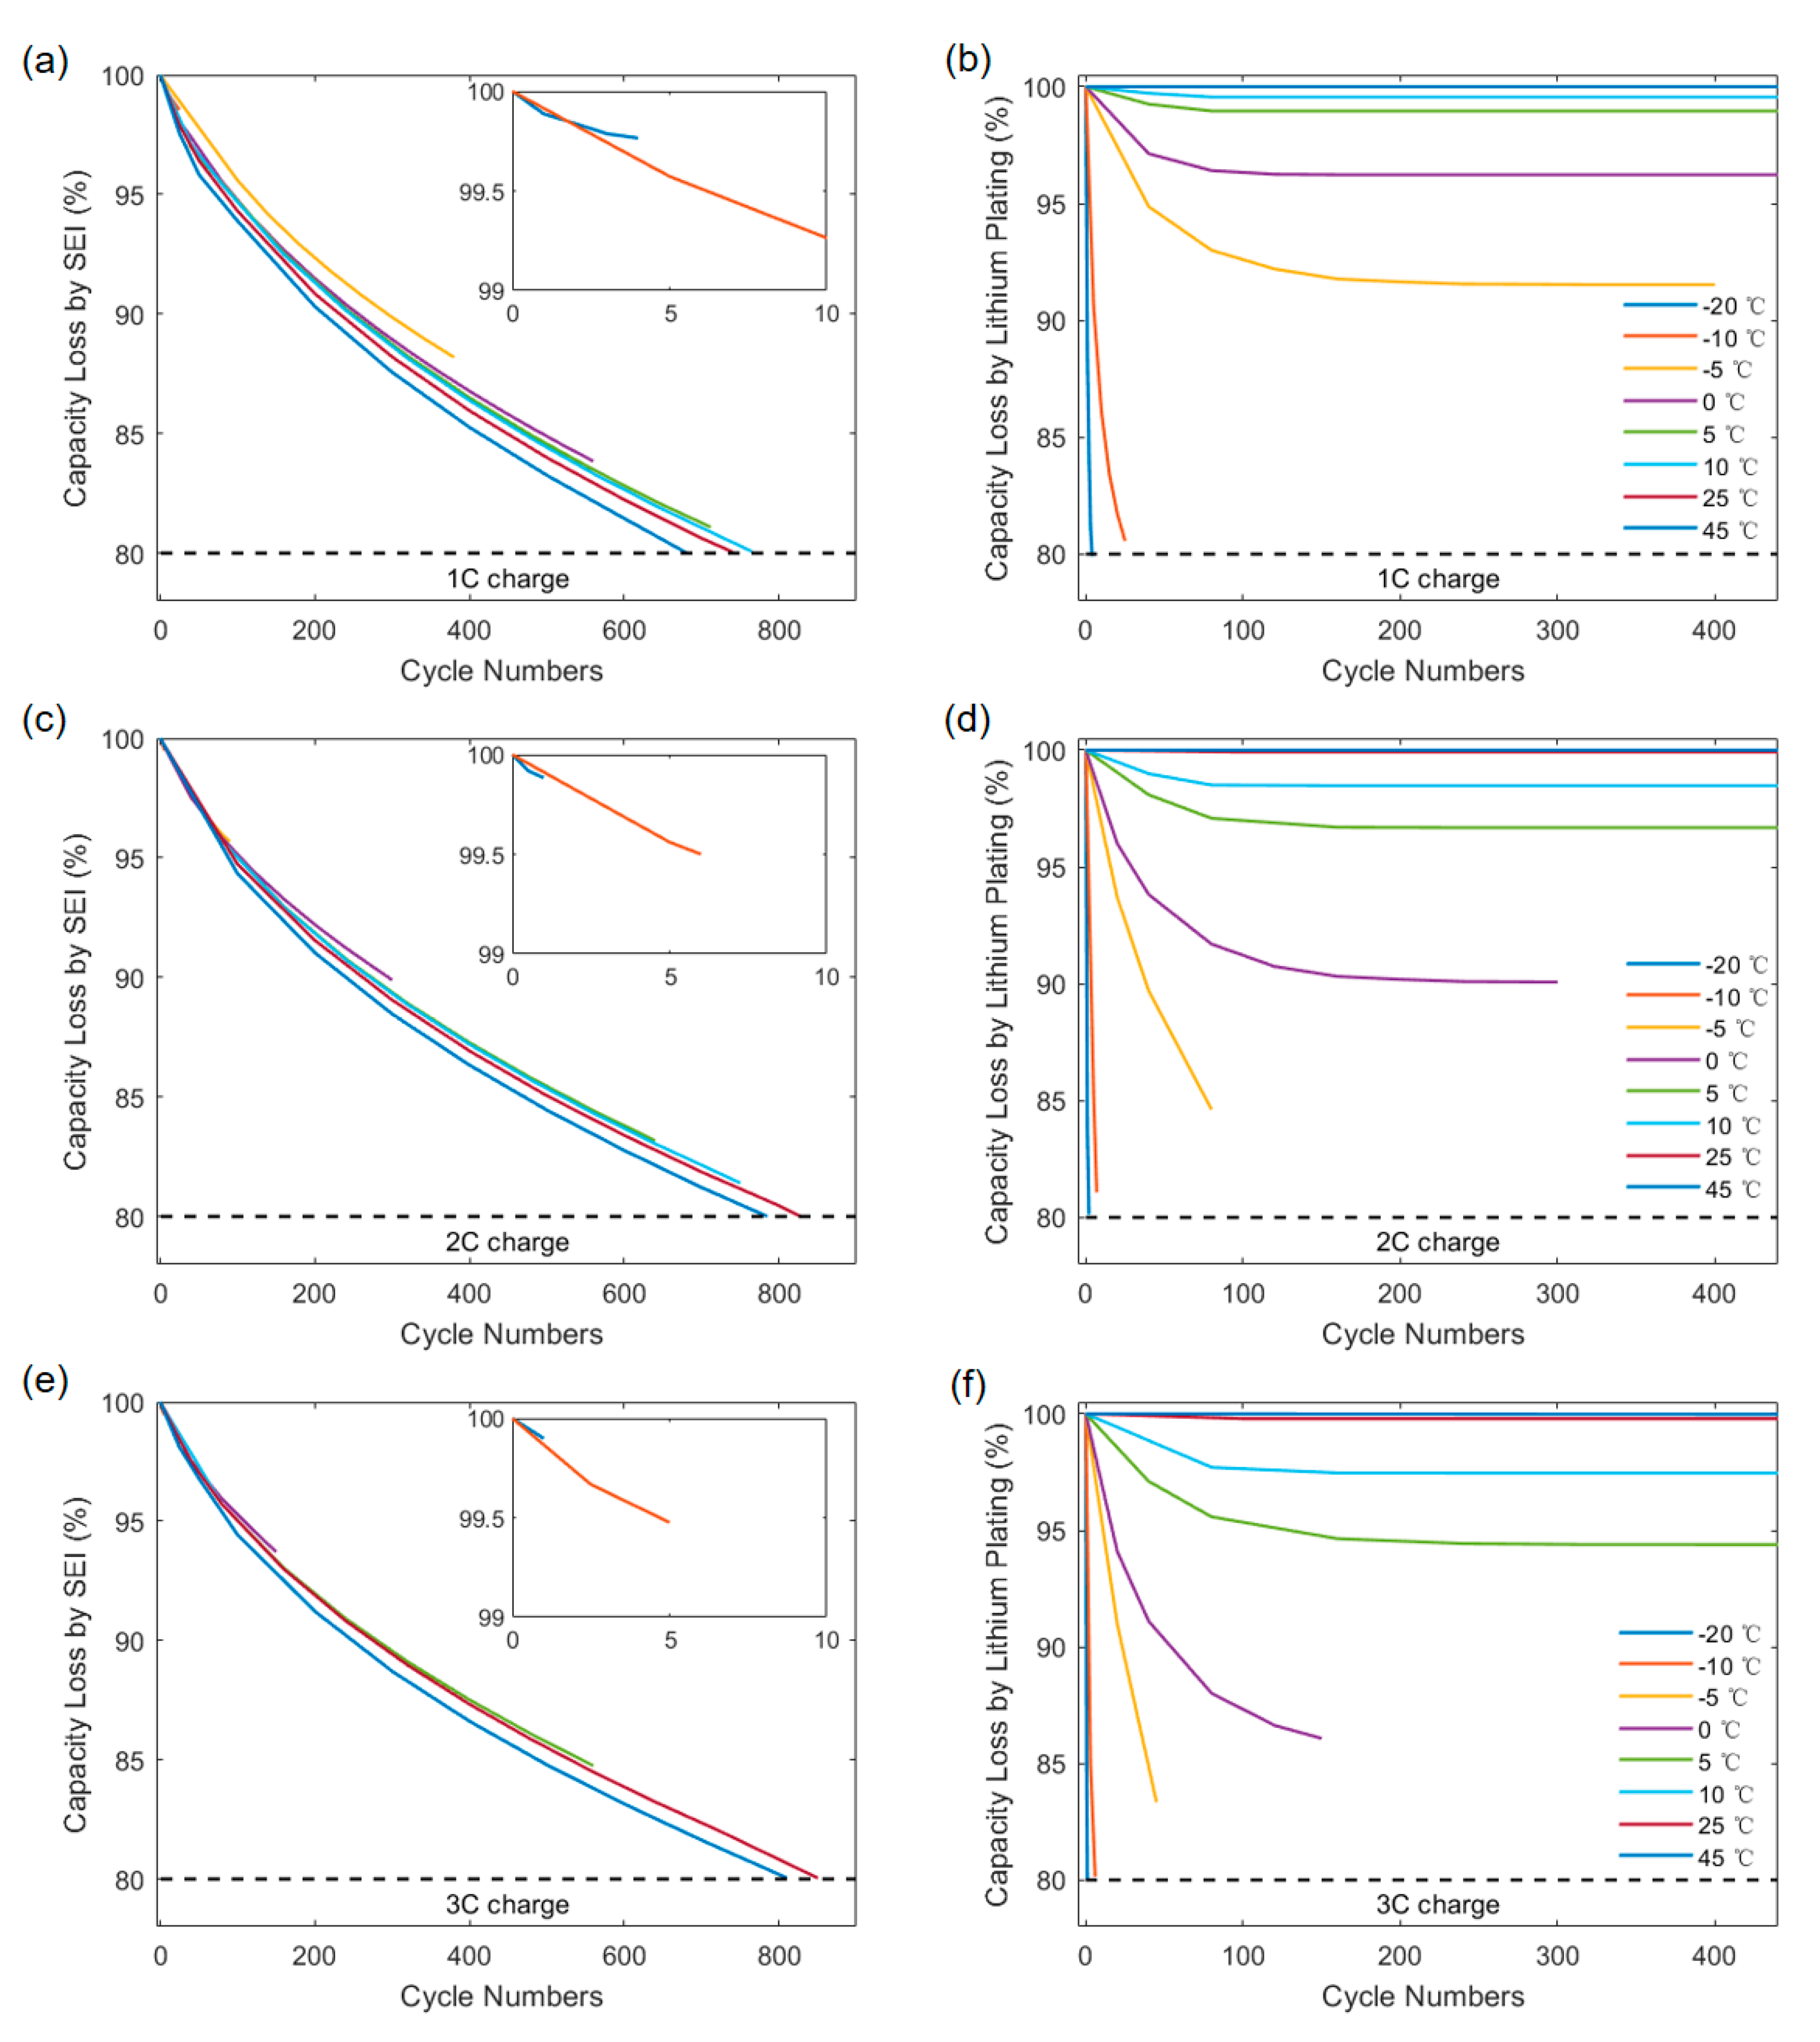
Figure 4.
Thickness of lithium plating and the lithium plating potential. (a–c) show the thickening of lithium plating with a single charge at 1C, 2C, and 3C, respectively. (d) shows the overpotential of lithium plating during 3C charge.
Figure 4.
Thickness of lithium plating and the lithium plating potential. (a–c) show the thickening of lithium plating with a single charge at 1C, 2C, and 3C, respectively. (d) shows the overpotential of lithium plating during 3C charge.
Figure 5.
η of lithium plating with the increase of charge rate. (a) Charging at 0.5C. (b) Charging at 1C. (c) Charging at 2C. (d) Charging at 3C.
Figure 5.
η of lithium plating with the increase of charge rate. (a) Charging at 0.5C. (b) Charging at 1C. (c) Charging at 2C. (d) Charging at 3C.
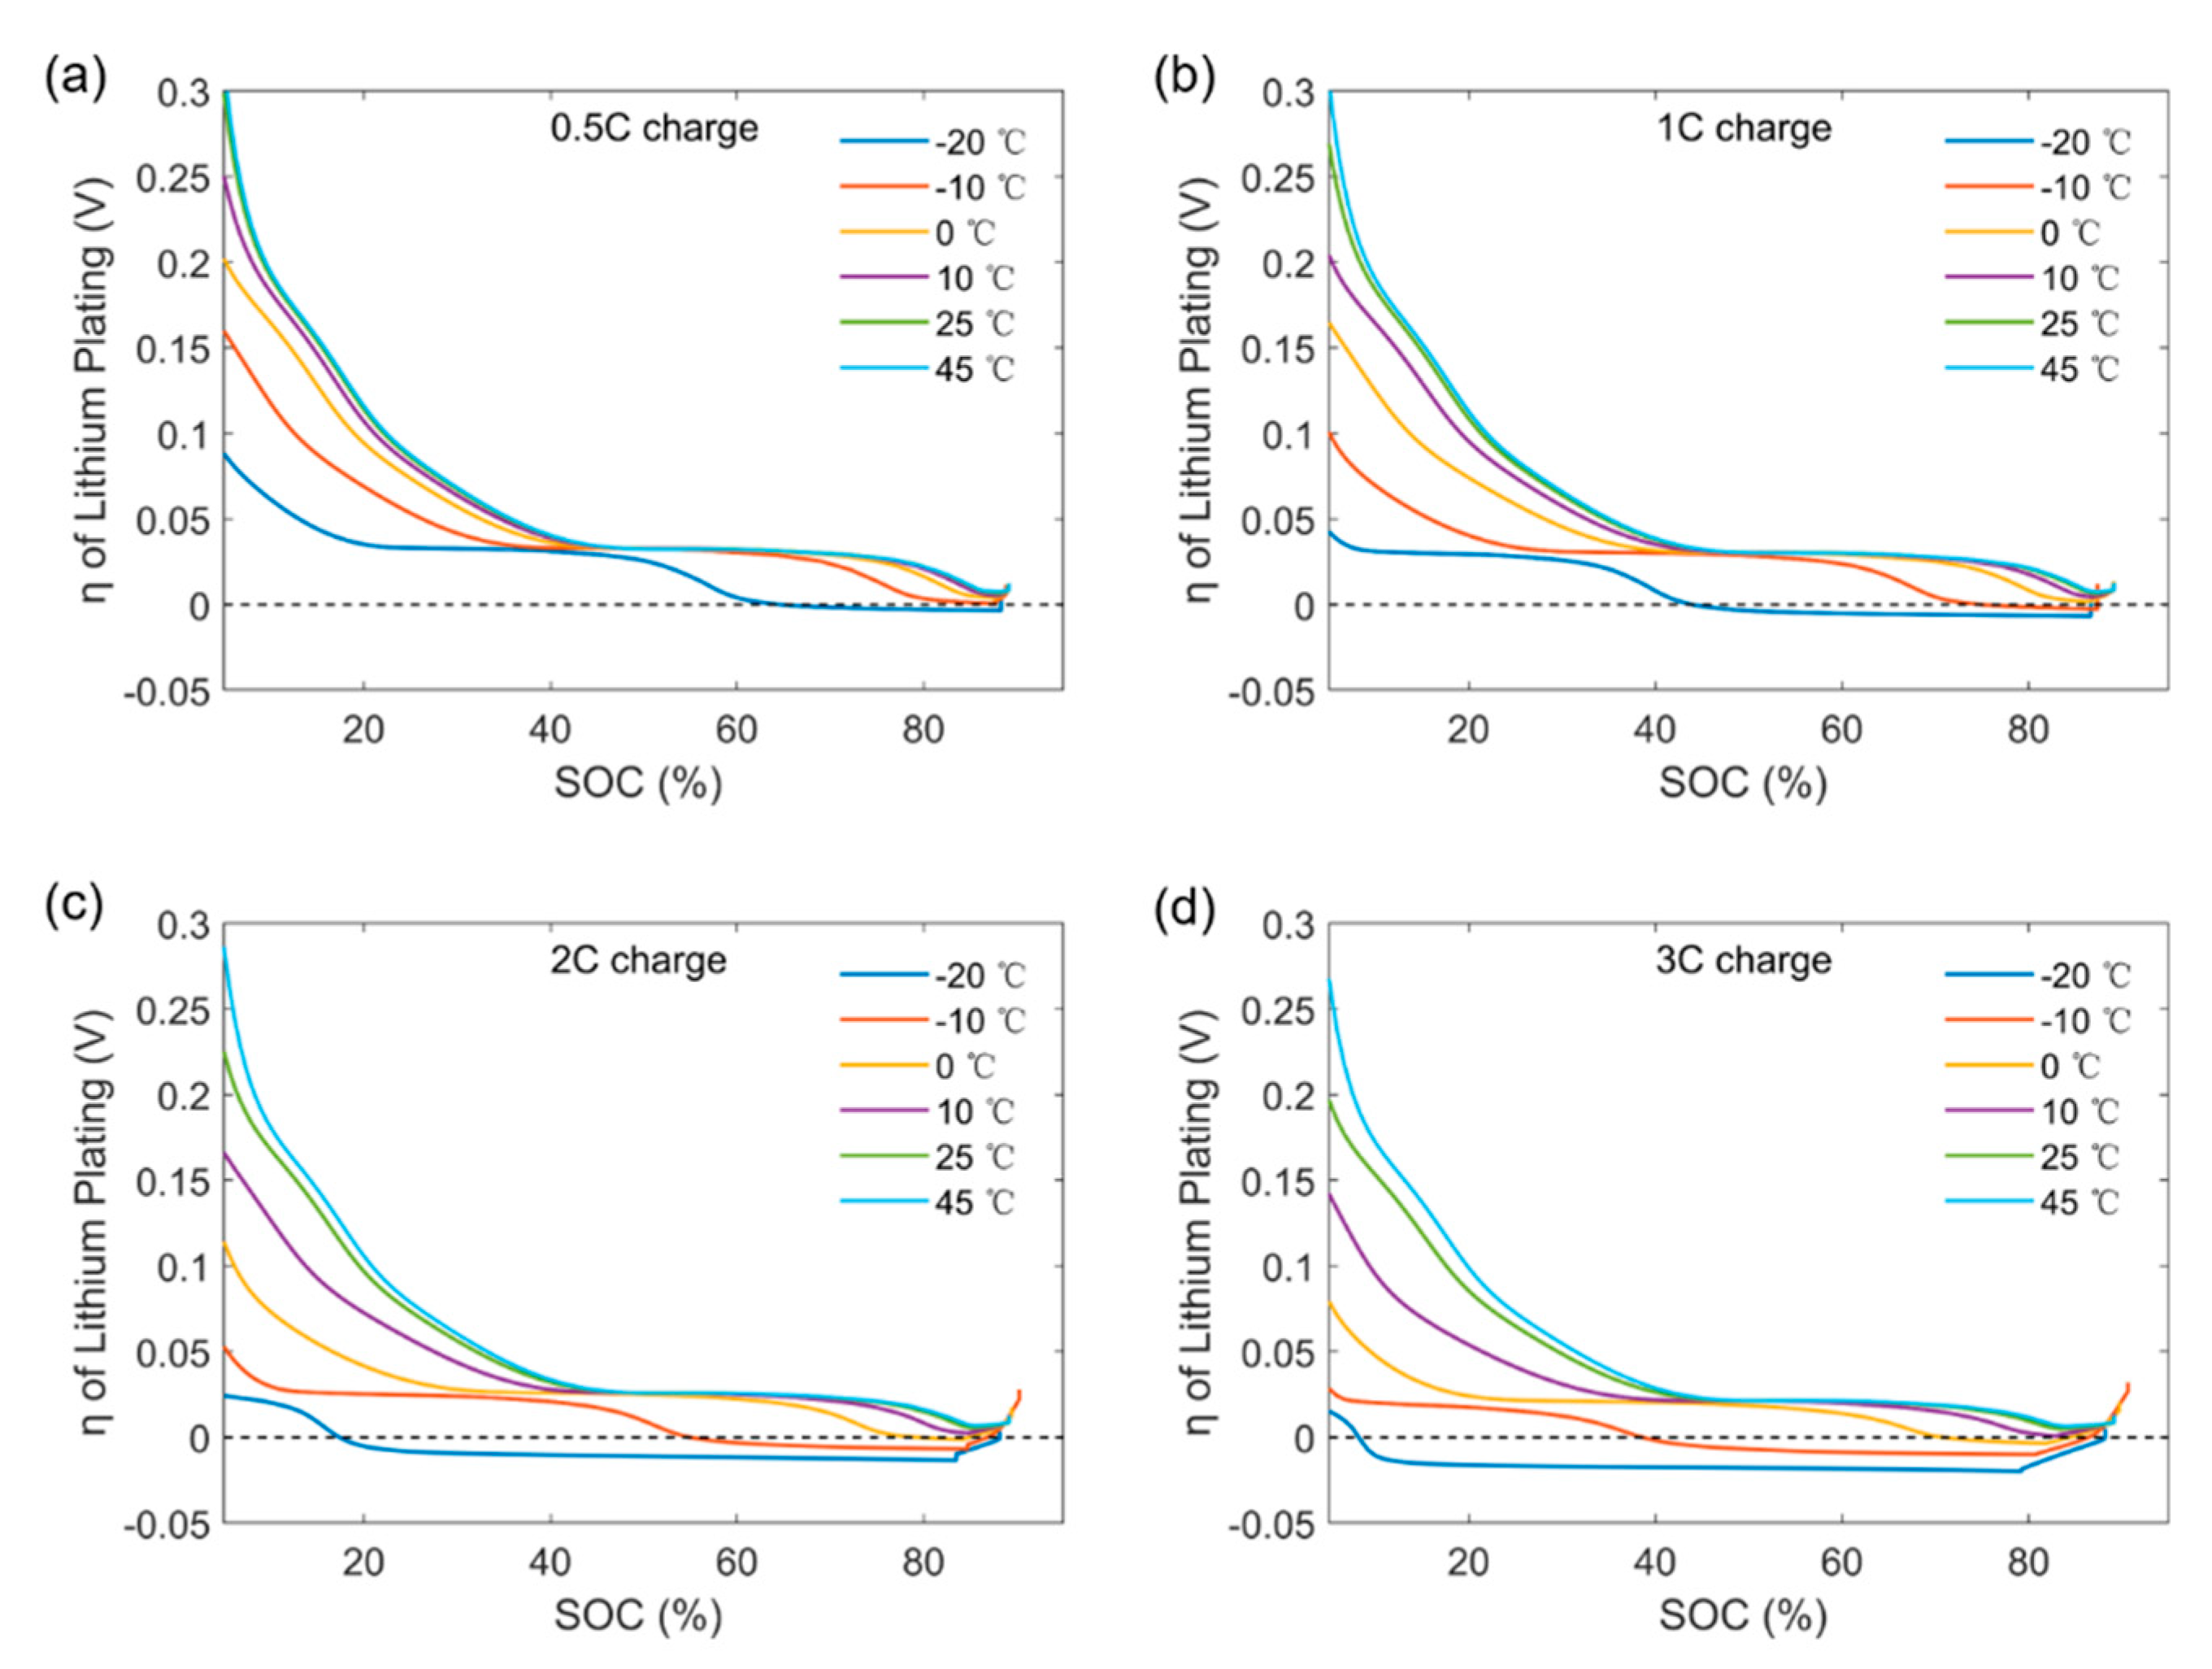
Figure 6.
Cycle life and aging rate with the increase of temperature. (a) Cycle numbers at the EOL. (b) LIBs capacity loss per equivalent cycle. (c) Detailed view of (b). (d) Ratio of cycle time to cycle numbers.
Figure 6.
Cycle life and aging rate with the increase of temperature. (a) Cycle numbers at the EOL. (b) LIBs capacity loss per equivalent cycle. (c) Detailed view of (b). (d) Ratio of cycle time to cycle numbers.
Figure 7.
(a) The ratio of time per cycle to cycle numbers. (b) Time of single cycle under various operating modes.
Figure 7.
(a) The ratio of time per cycle to cycle numbers. (b) Time of single cycle under various operating modes.
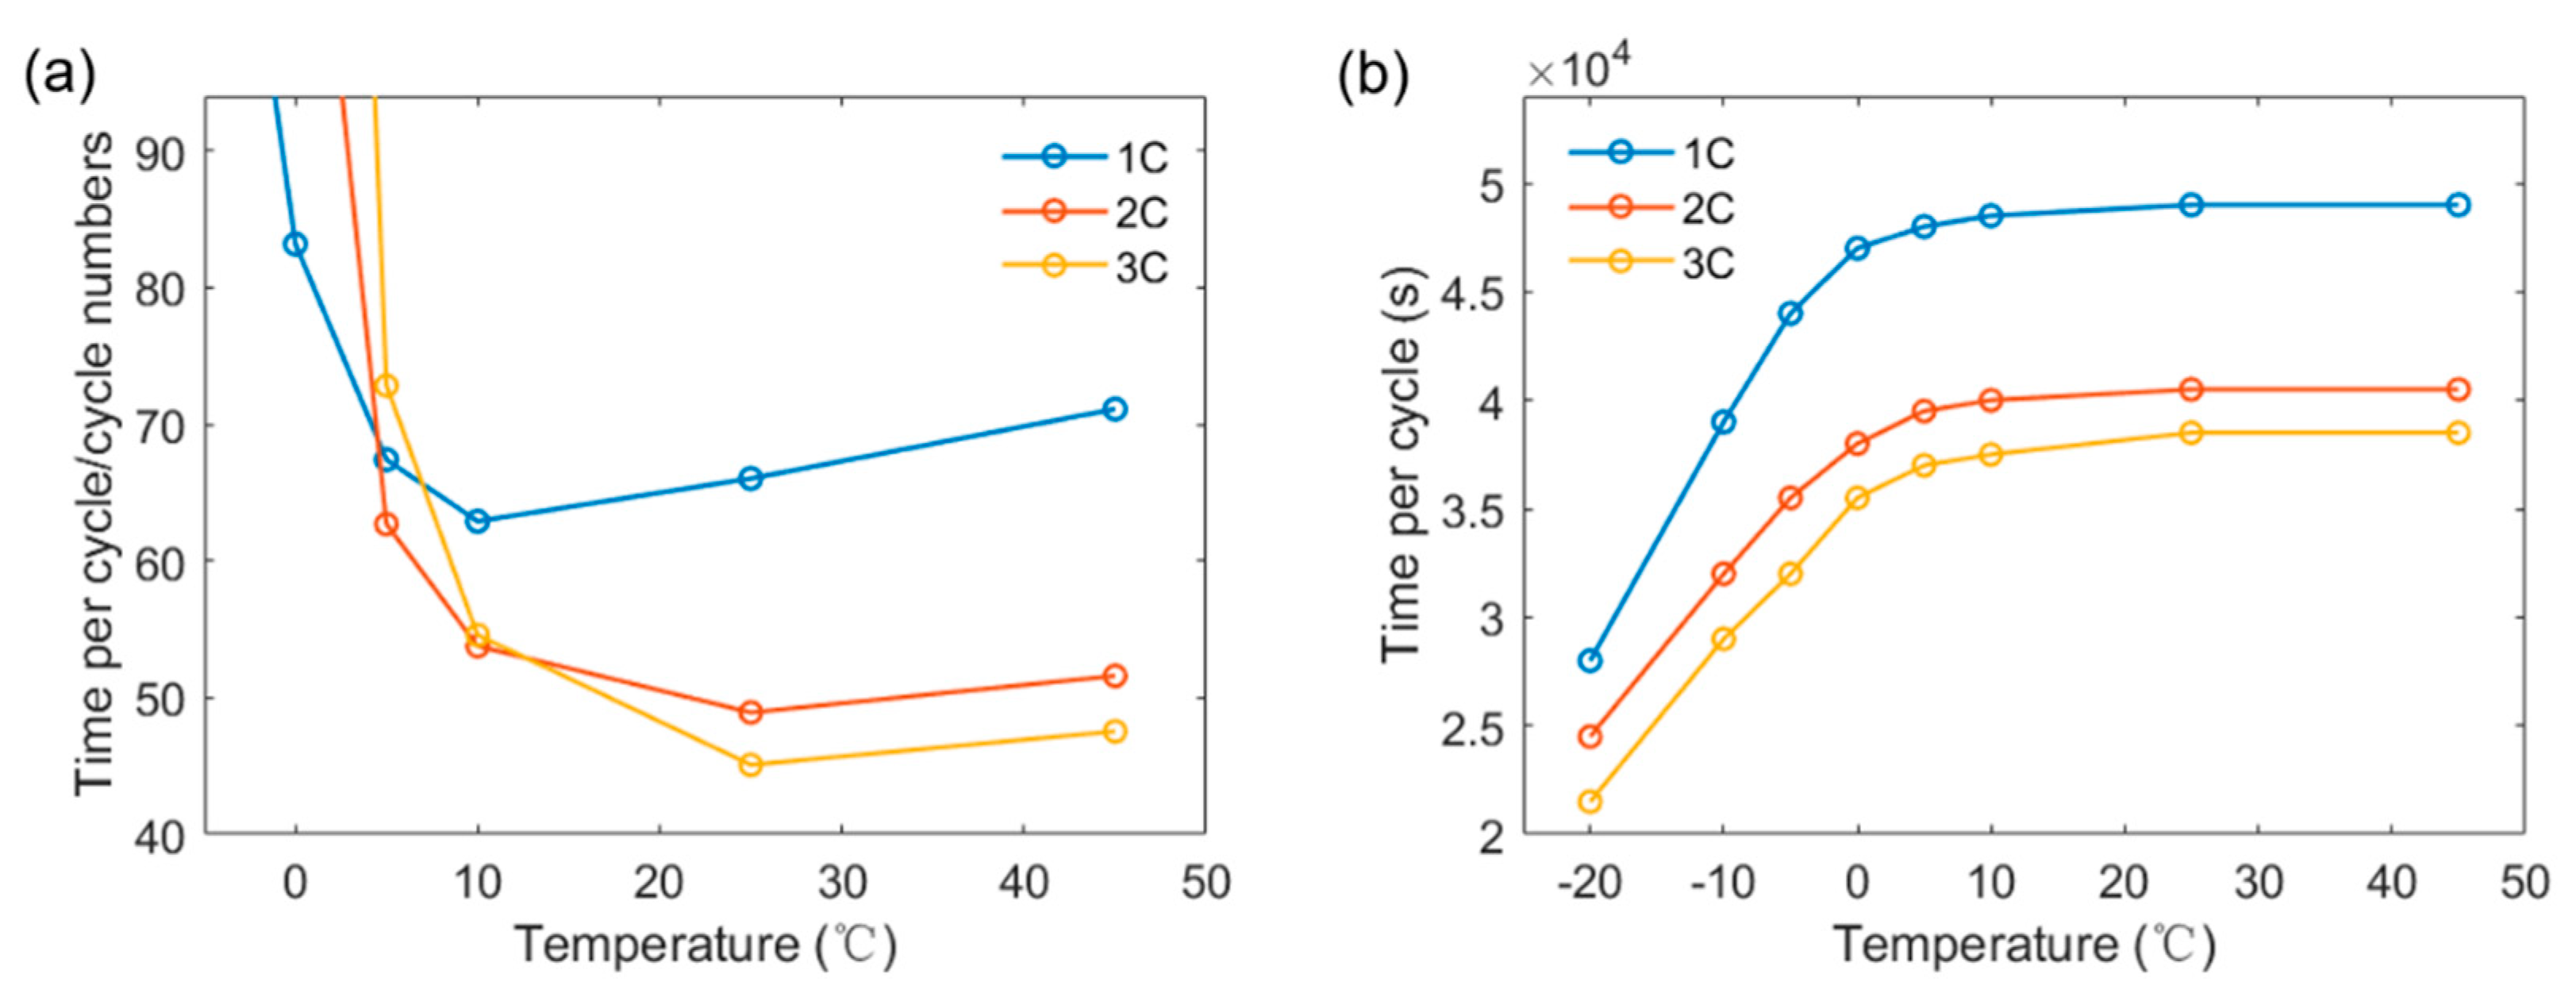
Figure 8.
Optimal temperature with charge rate.

Table 1.
Symbols and descriptions of the P2D model parameters.
| Symbol | Description |
|---|---|
| Solid particle potential [] | |
| Electrolyte potential [] | |
| Open-circuit potential [] | |
| Lithium concentration in solid phase [] | |
| Lithium concentration in electrolyte phase [] | |
| Maximum lithium concentration in solid phase [] | |
| Lithium concentration at surface in solid phase [] | |
| Effective solid particle conductivity [] | |
| Effective electrolyte conductivity [] | |
| Effective electrolyte diffusional conductivity [] | |
| Effective solid particle diffusivity [] | |
| Effective electrolyte diffusivity [] | |
| Porosity [%] | |
| Reaction rate constant of intercalating, plating, and SEI [] | |
| Specific surface area [1/m] | |
| Transference number [-] | |
| Ionic flux of intercalating, plating, and SEI [] | |
| Local current density [] | |
| Transfer coefficient [-] | |
| Faraday constant [] | |
| Universal gas constant [] | |
| Overpotential of intercalating, plating, and SEI [] | |
| Battery temperature [] | |
| Ambient temperature [] | |
| Cell surface area [] | |
| Mass of the battery [] | |
| Specific heat capacity of the battery [] | |
| Thickness [] | |
| Convective heat transfer coefficient [] | |
| Activity coefficient |
Table 2.
The cycle numbers that LIBs reach EOL.
| Temperature (°C) | |||||||||||||||
|---|---|---|---|---|---|---|---|---|---|---|---|---|---|---|---|
| −20 | −10 | −5 | 0 | 5 | 10 | 15 | 20 | 25 | 30 | 35 | 40 | 45 | 50 | ||
| C-rate | 1C | 4 | 22 | 335 | 565 | 712 | 771 | 781 | 748 | 742 | 727 | 710 | 699 | 689 | 680 |
| 2C | 2 | 6 | 86 | 299 | 630 | 744 | 796 | 830 | 828 | 816 | 810 | 799 | 785 | 776 | |
| 3C | 1 | 5 | 45 | 149 | 508 | 687 | 781 | 827 | 854 | 842 | 839 | 825 | 810 | 804 | |
Publisher’s Note: MDPI stays neutral with regard to jurisdictional claims in published maps and institutional affiliations. |
© 2022 by the authors. Licensee MDPI, Basel, Switzerland. This article is an open access article distributed under the terms and conditions of the Creative Commons Attribution (CC BY) license (https://creativecommons.org/licenses/by/4.0/).
Share and Cite
MDPI and ACS Style
Gao, Z.; Xie, H.; Yang, X.; Niu, W.; Li, S.; Chen, S. The Dilemma of C-Rate and Cycle Life for Lithium-Ion Batteries under Low Temperature Fast Charging. Batteries 2022, 8, 234. https://doi.org/10.3390/batteries8110234
AMA Style
Gao Z, Xie H, Yang X, Niu W, Li S, Chen S. The Dilemma of C-Rate and Cycle Life for Lithium-Ion Batteries under Low Temperature Fast Charging. Batteries. 2022; 8(11):234. https://doi.org/10.3390/batteries8110234
Chicago/Turabian StyleGao, Zhenhai, Haicheng Xie, Xianbin Yang, Wanfa Niu, Shen Li, and Siyan Chen. 2022. "The Dilemma of C-Rate and Cycle Life for Lithium-Ion Batteries under Low Temperature Fast Charging" Batteries 8, no. 11: 234. https://doi.org/10.3390/batteries8110234
Note that from the first issue of 2016, this journal uses article numbers instead of page numbers. See further details here.