Article

What Differentiates Dielectric Oxides and Solid Electrolytes on the Pathway toward More Efficient Energy Storage?

by
Antonio Nuno Guerreiro
1,
Beatriz Arouca Maia
1,2,
Hesham Khalifa
1,3,
Manuela Carvalho Baptista
1 and
Maria Helena Braga
1,2,*
1
Engineering Physics Department, Engineering Faculty, University of Porto, 4200-465 Porto, Portugal
2
LAETA—INEGI, Institute of Science and Innovation in Mechanical and Industrial Engineering, 4200-465 Porto, Portugal
3
Department of Physics, Faculty of Science, Damanhur University, Damanhur 22511, Egypt
*
Author to whom correspondence should be addressed.
Batteries 2022, 8(11), 232; https://doi.org/10.3390/batteries8110232
Submission received: 3 October 2022 / Revised: 1 November 2022 / Accepted: 4 November 2022 / Published: 10 November 2022

Abstract

:
Taking advantage of electrode thicknesses well beyond conventional dimensions allowed us to follow the surface plasmonic THz frequency phenomenon with vacuum wavelengths of 100 μm to 1 mm, only to scrutinize them within millimeters-thicknesses insulators. Here, we analyze an Al/insulator/Cu cell in which the metal electrodes-collectors were separated by a gap that was alternatively filled by SiO2, MgO, Li2O, Na3Zr2Si2PO12–NASICON, Li1.5Al0.5Ge1.5(PO4)3–LAGP, and Li2.99Ba0.005ClO–Li+ glass. A comparison was drawn using experimental surface chemical potentials, cyclic voltammetry (I-V plots), impedance spectroscopy, and theoretical approaches such as structure optimization, simulation of the electronic band structures, and work functions. The analysis reveals an unexpected common emergency from the cell’s materials to align their surface chemical potential, even in operando when set to discharge under an external resistor of 1842 Ω.cminsulator. A very high capability of the metal electrodes to vary their surface chemical potentials and specific behavior among dielectric oxides and solid electrolytes was identified. Whereas LAGP and Li2O behaved as p-type semiconductors below 40 °C at OCV and while set to discharge with a resistor in agreement with the Li+ diffusion direction, NASICON behaved as a quasi n-type semiconductor at OCV, as MgO, and as a quasi p-type semiconductor while set to discharge. The capacity to behave as a p-type semiconductor may be related to the ionic conductivity of the mobile ion. The ferroelectric behavior of Li2.99Ba0.005ClO has shown surface plasmon polariton (SPP) waves in the form of surface propagating solitons, as in complex phenomena, as well as electrodes’ surface chemical potentials inversion capabilities (i.e., χ (Al) − χ (Cu) > 0 to χ (Al) − χ (Cu) < 0 vs. Evacuum = 0 eV) and self-charge (ΔVcell ≥ +0.04 V under a 1842 Ω.cminsulator resistor). The multivalent 5.5 mm thick layer cell filled with Li2.99Ba0.005ClO was the only one to display a potential bulk difference of 1.1 V. The lessons learned in this work may pave the way to understanding and designing more efficient energy harvesting and storage devices.

1. Introduction

As global energy utilization is anticipated to be doubled by the mid-century due to population and economic development, energy supplies are becoming more and more critical [1]. Hence, harvesting and storing renewable energy, such as solar energy, will be one of the most significant global development challenges over the incoming years [2].
Li-ion batteries have been pioneers and protagonists in electrification as they can store when harvested energy is abundant and deliver when it is scarce [3,4].
The significant advantages of Li-ion batteries are their energy/power densities; they may also complement fuel cells for higher energy density or capacitors for a higher power. Capacitors can also charge batteries and recover energy harvested in vehicles, flying wheels, tribological devices, tides, and waves [5].
Li-ion batteries, however, raise safety problems [6]; they use materials that are not inexpensive and widely available such as cobalt [7], do not have an enlarged temperature range of utilization [8], and reach their theoretical capacity limit.
Alternatively, the implementation of materials with extraordinary capabilities in out-of-the-box devices that can address harvesting and storage tandemly (Figure 1), such as ferroelectrics [9], van der Waals quantum materials [10], axion insulators [11], and topologic photonic metamaterials [12], in well-established architectures, opens horizons toward a new revolution where devices have more than one role and are advanced on lessons learned from the shared behaviors.
The advent of solid-state batteries demands knowledge of the interplay phenomena between electrodes, interphases, interfaces, and the solid electrolyte at different pressures, temperatures, and cycle numbers [13,14,15]. The entangled behavior is even more critical in operando (Figure 2a). The conjunction of experimental techniques with theoretical simulation is therefore paramount, especially for understanding the driving forces within the battery cell that mostly result from the differences in chemical potentials (analyzed with impedance spectroscopy EIS and cyclic voltammetry CV) and surface chemical potentials (analyzed with scanning Kelvin probe SKP) within the cell. The flow of charges is dependent on the bulk and surface potentials, as shown herein.
A few questions then stand up: what differentiates the materials that possess specific electrical properties while working in the same solid-state device? What is the most efficient solid electrolyte relative to its chemical potential? How can the propagation of the electric field throughout the cell due to plasmon polariton affect the behavior of all-solid-state batteries?
Dielectric materials are electrical insulators that become polarized when submitted to an electric field and have applications in almost all electronic devices, such as heterojunctions, transistors, memories, photovoltaics, capacitors, and batteries [16,17,18]. Dielectrics include all the other classes of materials that were studied in detail: (1) n- and (2) p-type intrinsic semiconductors, (3) solid electrolytes, and (4) ferroelectric solid electrolytes.
Here, the study of SiO2, MgO, and Li2O dielectric oxides, Na3Zr2Si2PO12, Li1.5Al0.5Ge1.5(PO4)3 and Li2.99Ba0.005ClO solid electrolytes, and a detailed examination of the surface chemical potentials in an Al/insulator/Cu cell was carried out at OCV and in operando. Ab initio simulations were also performed to understand the surface electrical properties of the dielectrics and their role in the cell. The crystal structure of the materials is well known to influence their electronic and electrochemical performance, and so are the properties described in Table 1. In Figure 1, these materials’ crystal structures and space groups are also shown. In the Supplementary Information (SI), the detailed properties of these materials that help identify similarities and differences in their performances in all-solid-state devices, and their actual applications, are discussed.

2. Materials

2.1. Oxides

The oxides in this study used as dielectrics were powders of (1) Silicone oxide (IV) 99.5%, powders’ diameter <44 µm from Thermo Fisher; (2) Magnesium oxide (MgO) 99.95%, powders’ diameter <44 µm from Alfa Aesar; and (3) Lithium oxide (Li2O) 99.5 %, powders’ diameter <149 µm, from Alfa Aesar. All oxides were kept and manipulated to fill the cell’s gap in a glovebox with an argon atmosphere.

2.2. Solid Electrolytes

The solid electrolytes used were powders of (1) Na3Zr2Si2PO12 with diameters < 44 µm from MSE supplies; (2) Li1.5Al0.5Ge1.5(PO4)3, with diameters varying from 0.30 to 0.50 µm from Ampcera; and (3) Li2.99Ba0.005ClO was prepared in the laboratory environment, synthesized by water solvation, similarly as presented by Braga et al. [16,28]. After obtaining a solid-state material, the electrolyte was closed hermetically and dried at 250 °C. After the drying process finished, the Li+-glass was kept in a glovebox with an argon atmosphere and grounded with an Agate ball milling equipment in a hermetic sample holder for 40 min (300 rpm) using a ball milling machine with an Agate container and five balls with a diameter of 20 mm. All solid electrolytes were manipulated inside the Ar-filled glovebox (O2 and H2O < 1 ppm) while filling the cell’s gap.

2.3. Cells

The cells were fabricated with two different metal electrode pairs (aluminium//copper) or (zinc//copper) with a designed parallelepiped gap between them that was filled with oxides or solid electrolytes. The electrodes were fixed on the epoxy support. The average dimensions of the Al/insulator powder sample/Cu cell’s materials used in the experiments were Al with (11 × 20 × 4.7) mm3; powder sample oxide or solid electrolyte with (5.5 × 22 × 4.7) mm3; and Cu with (11 × 20 × 4.7) mm3 (Figure 2).

3. Methods

3.1. Cell Preparation

Before beginning the calibration procedures on SKP, it was necessary to prepare the cell according to the following process: (1) sand and polish the electrodes; (2) thoroughly clean the particles’ residues; and (3) fully dry the cell. Afterward, the cell’s gap between the electrodes was ready to be filled with oxide or electrolyte powder, tightly compressed with a spatula-like tool, and leveled by the electrodes. The oxide or the electrolyte was also thoroughly dried before this latter procedure.

3.2. Scanning Kelvin Probe (SKP)

SKP is a non-invasive and non-contact technique based on the contact potential difference (CPD) between two electrically connected metals [29]. A vibrating capacitor tip measures the local work function difference between the sample and the tip, which is related to the surface chemical potential [30] (Figure 2d). Therefore, the SKP technique allows an electrochemical study of the materials’ surface. SKP technique was also used to map the topography of the surface’s materials performing the Capacitive Tracking Measurement (CTM). This technique is appropriate for non-flat surfaces and irregularities; it maintains a constant distance between the probe tip and the sample, scanning the surface without losing information about the cell’s surface. These techniques are under the atomic force microscopy (AFM) set of methods. All SKP measurements were performed with a Biologic SKP-M470 with an SKP tip U-SKP-370/1 made of tungsten wire with 500 µm diameter and an SKP tip U-SKP-150, made of tungsten wire with 150 µm diameter. The distance between the CTM or SKP probe tip and the sample was 100 µm (oxides and solid electrolytes) to 200 µm (ferroelectric solid electrolyte), and the analysis was monitored through a micro camera. All experiments were performed in a dry box. It is worth highlighting that each set of experiments, for each insulator, was served with fresh materials after cleaning and drying the cell. We give knowledge of the most representative experiments that illustrate the materials’ behaviors.
The chemical potential μ is equal to the surface chemical potential χ = E v a c u u m W F = μ   +   z i F ϕ , when the surface potential ϕ is null, where E v a c u u m = 0   e V , W F is the work function, z i is the valency of the interfacial ion, and F the Faraday constant (more detail in [31]). Therefore, the experimental W F of each material, herein, was obtained for the inner surface away from the interfaces.
Upon equalization due to electrical contact between two materials, the electrochemical potentials μ ¯ , or Fermi levels E F , Δ μ ¯ = 0 =   Δ μ     z i F Δ V , and the chemical potentials should correspond to Δ μ =   z i F Δ V via the formation of double layer capacitors (EDLC) with a potential difference, Δ V = Δ ϕ where Δ ϕ is the difference of surface potentials of the interfacial materials. Consequently, E F is obtained where there is an equalization of χ at the interfaces of the dielectric or solid electrolyte with the electrodes. When the equalization is not possible at the two interfaces electrode1/insulator/electrode2 due to a potential well translated in an interfacial resistance, the equalization point for one of the electrodes is obtained away from the interface. The equalization of χ is achieved through the surface plasmons or electric field propagation across the electrodes.

3.3. Electrochemical Impedance Spectroscopy (EIS) and Cyclic Voltammetry (CV)

In EIS, a GAMRY (GAMRY1000) impedance meter imposes a small amplitude AC signal to the cell’s terminals. The AC voltage and current response of the sample cell allow for determining the impedance (resistive, capacitive, and inductive characteristics) of the cells and equivalent circuits related to their components at controlled frequencies. The EIS studies complemented the study of the surface phenomenon in the cells. EIS was performed in the frequency range of 1 MHz to 0.1 Hz with an amplitude signal of 10 mV.
Cyclic Voltammetry (CV) is an electrochemical technique used for providing information about the dynamic behavior of the cells while performing cycles under an imposed voltage rate. CV measurements with the present cells were performed within the potential window of −0.35 V to +1.0 V and scan rates of 25 mV·s−1 and 2 mV·s−1.

3.4. Ab Initio Simulations

The study of the material’s surface properties is critical. Ab initio simulations were accomplished using Density Functional Theory (DFT) and the Generalized Gradient Approximation (GGA) pseudopotential method to determine the lattice constant, lattice stability, band structure, surfaces, and work functions at different temperatures. These simulations used crystal representations without introducing defects such as vacancies, and impurities, as our previous work on ZnO did [31].
DFT and hybrid functional HSE06 packages, as implemented by VASP6 (Vienna Ab initio Simulation Package) [32], were performed with a plane-wave cutoff of >400 eV, reciprocal space projection, and spacing of k points of 0.3 Å−1. Electron localization functions (ELF) were obtained for each oxide (001) surface.
Ab initio molecular dynamics (AMD) was employed to simulate a closed system thermostatted in a heat bath at a constant temperature and pressure NP’T. The system was the crystalline Li79BaCl27O27 optimized structure (from Pm-3m) after performing microcanonical simulation NV’E to set the temperature of 300 K (27 °C).
Macroscopic average potentials were calculated for 10 Å, and work functions were determined by calculating the difference between the maximum potential where electrons are at rest on the surface and the average potential between the minimum and maximum potentials (immediately before and after the line that marks the surface), corresponding to the Fermi level.

4. Results and Discussion

The AFM and SKP analyses in this study have shown emergent phenomena. The work functions or surface chemical potentials align in spite of any texture or mechanical stress introduced by the preparation of the surfaces or asymmetric oxidation. The cell rules the equalization of the surface potentials, even at an open circuit voltage (OCV), whereas one of the electrodes connects the cell through the insulator powder that disjoints both electrodes and fills the gap. Herein, we have used both the SHE and the Physical scales in Figure 2b to compare the surface chemical potentials. Figure 2c shows the potential energy Ep versus the polarization of the dielectric or ferroelectric; the most energetic configuration corresponds to both ends or opposite surfaces polarized with the same sign. The capacitance C is also shown for the different regions. This configuration for the potential energy is approximated to a quantum square barrier. As demonstrated herein, the dielectric with higher work functions than both the metallic electrodes will polarize, as shown in Figure 2c. With Fermi levels equalizing at interfaces metal1/dielectric/metal2, the dielectric material charges positively to compensate for the higher chemical potentials of the metal electrodes. A more negatively charged maximum in the inner surface of the dielectric balances the same sign polarizations at the interfaces with the metals. Nonetheless, if not enough time is given for the cell to relax with the dielectric, the polarization is straight and more negative on the interface with the Al or Zn (negative electrode), as commonly represented in the literature [33].
When the cell’s surface is scanned along 1.2 cm (Table 2), the equalization of the three surface chemical potentials is not always clear, but the tendency is observed. When the cell is scanned for >2.0 cm, the alignment is almost always demonstrated (schematics of Figure 2d and Table 2), especially when the cell is at OCV. Depending on the dielectric’s work function and resistance at the interfaces, the equalization of the surface potentials is obtained in different ways. The aluminum bends sharply for dielectrics ZnO [31], Li2O, Na3Zr2Si2PO12, or Li1.5Al0.5Ge1.5(PO4)3 or curves from the interface, with the surface chemical potentials passing through the point where the alignment between the three materials, electrodes, and dielectric is obtained. It is likely that the distance between the interface and the point at which the electrodes assume the same surface chemical potential as that of the interface is dependent on the quantum barrier/well or internal resistance at the interface (Figure 2d). The work function, including the surface potential, accounts for the surface chemical potential, which reflects the shape of the vacuum surface. For the insulators, the latter surface reflects the bending of conduction and valence bands (Figure 2d).
For other dielectrics such as MgO, which have demonstrated a slightly lower work function than electrically insulated aluminum, a sharp decrease in the surface chemical potential toward the equalization point happens at the Cu/MgO interface, mirroring the process for ZnO [31] at the ZnO/Al heterojunction. This result remits to the surface plasmons polaritons (SPP) and the electrostatic interactions throughout the surface of the cell characteristics of the insulator/metal interfaces [34]. Additionally, the present findings may be related to Rogue waves [35] observed in Al surface chemical potential when the insulator is MgO. The Rogue waves are solitons that allow for the equalization of the surface chemical potential at 0.60 V (Table 2), as shown hereafter.
Dielectrics. SiO2 is a well-known dielectric used in the gate of field-effect transistors (FET) since the 1950s, after the discovery of the suppression of the Si’s surface states by its presence. Silicon dioxide (Figure 1a, Table 1) is a very stable dielectric and is not hygroscopic in the present powder sizes. Although a non-polar dielectric with a low dielectric constant (εr  4), SiO2 polarizes to compensate for the difference in chemical potentials between the Cu and Al electrodes and itself, as shown in Figure 3, it is observed that at room temperature (~20 °C), the first SKP runs of the Al/SiO2/Cu cell, at OCV, and shows the SiO2 surface chemical potential to bend linearly and compensate for the difference in chemical potentials at the SiO2/Al more than at the SiO2/Cu (Figure 3a,b). The difference in chemical potentials between the Al and the dielectric is higher than the difference with the Cu. The latter preconizes the usual description of the role of an insulator in a solid-state device such as a FET. However, as observed in Figure 3c–f, as the SKP scans follow, the dielectric starts to polarize, and in SiO2, a positive–negative–positive polarization is then visible, as evident in Figure 3f for an experiment made with the Zn/SiO2/Cu cell. The dielectric changes from a behavior typically related to its band structure, reflected in band bending, to dielectric polarization with the formation of positive–negative–positive charged regions, which may be associated with the larger dielectric polarization relaxation time and eventually to the temperature of 36 °C (Table 2). More energy is available to overcome the E a , or the energy necessary for assuming a configuration that is not fully energetically favorable (Figure 2c and Figure 3d).
A sharp potential step is shown on both Cu/SiO2 and SiO2/Al heterojunctions, corresponding to internal resistances at the interfaces. These internal resistances are likely to justify the lack of a continuous equalization of surface chemical potentials Cu/SiO2/Al. For example, a heterojunction SiO2/Al equalizes its surface chemical potential with Cu, as shown in Figure 3c–f and represented in Table 2 by Cu…SiO2/Al and Zn/SiO2…Cu1…Cu2. The alignment seems to be more likely to occur at the absolute potential of the Cu, which is expected, as Cu is the electrode more often connected to the SKP.
The surface chemical potentials of each metal and the SiO2 are a little smaller (Physical scale, Figure 2b) when compared with the potentials obtained when the materials were analyzed and electrically insulated, as reported in [31].
The incapacity of making the metals’ surface chemical potentials vary toward equalizing their chemical potential at the interface, and in its immediate vicinity, is likely due to the internal resistance at the interfaces and within the oxide. However, the alignment is made through the action of the electric field away from one of the interfaces (Figure 3d,e).
Dielectrics. MgO possesses the smallest work function studied, smaller than Al (Table 2). It aligns almost continuously its surface chemical potential with Al, mirroring the alignment of ZnO with Cu in [31]. There is a slightly positively charged MgO/Al interface region (Figure 4a,b). The more negatively charged side of the MgO points towards the Cu when the connection to the SKP is made through the Cu (Figure 4a,b), which is the behavior of an n-type semiconductor such as ZnO. In the experiment corresponding to Figure 4c,d, the opposite happens even when the Cu is connected to the SKP, showing the expected insulator band bending with no n-type semiconductor features. The MgO does not seem to show negative-positive-negative polarized regions either. In other words, the dielectric polarization does not seem to have an influence, although it might be possible that it accounts for the behavior in Figure 4a,b. A stiff step Cu/MgO in Figure 4a,b indicates high interfacial resistance, which poses difficulties in equalizing the surface chemical potentials at the interfaces. The positively charged spike in Figure 4a,b on the surface chemical potential of Al allows for the Cu/MgO…Al surface potentials equalization (~0.60 V) and likely demonstrates the Peregrine Rogue solitons described in [36,37].
Dielectrics. Li2O has a work function with values in the interval between the Cu and the Al work functions. Therefore, it brings the surface chemical potential of the Al down when the Cu connects to the SKP, and it brings the Cu up when the Al is connected to the SKP, being able to exchange electrons with the instrument and keeping its chemical potential close to the one it shows when electrically insulated [31]. In both the latter configurations (Figure 5a–c), the Li2O shows a p-type semiconductor behavior. As underlined previously, Li2O is one of the most common SEI layer constituents that form in Li-ion batteries due to the equalization of the lithiated graphite with the liquid electrolyte electrochemical potential through electron tunneling from the graphite (LiC6) to the LUMO (lowest unoccupied molecular orbital) of the electrolyte with lower energy (Physical scale, Figure 2b). The Li2O then acts as a solid electrolyte, with the diffusion of Li+-ions happening through it. This latter behavior is in agreement with the p-type semiconductor behavior of the NASICON when connected to a resistor and of the LAGP at OCV and connected to a resistor, as observed herein.
Although not showing as stiff interfacial resistances as previously demonstrated by SiO2 and MgO, in the Cu/Li2O/Al of Figure 5d, there is a step in potential energy at the Li2O/Al heterojunction.
The electron localization function in Figure 5e, which was obtained for a (001) surface after optimization of the crystalline structure, shows delocalized electrons at the surface of the Li2O. Whereas Li2O is an insulator with an indirect gap of 5.286 eV, the surface states of the (001) surface show a metallic surface. It is noteworthy that Li2O (Fm-3m) was analyzed and shown to be a trivial topologic insulator [39]. This property may be related to the solid electrolyte interphase (SEI) layer role of the Li2O and allow battery cell interphase and interface tailoring (Figure 2a).
Solid Electrolyte. Na3Zr2Si2PO12–NASICON is a solid-state electrolyte.
The solid electrolyte, Na1+xZr2SixP3-xO12 known as NASICON, as reported previously, shows a rhombohedral phase (R-3c) between 0 ≤ x ≤ 3, except 1.8 ≤ x ≤ 2.2 [40] (SI, Introduction), where the monoclinic phase (C2/c) is stable at room temperature. The monoclinic C2/c phase, Na3Zr2Si2PO12, transforms into the rhombohedral R-3c phase in a gradual process as temperature increases and completes at ~150 °C [41].
In Figure 6a,b, the surface chemical potential of Na3Zr2Si2PO12 reflects a slight n-type band bending at OCV with an almost non-noticeable accumulation of electrons at the Cu/Na3Zr2Si2PO12 heterojunction and electron holes at the interface Na3Zr2Si2PO12/Al. When the circuit is closed by a resistor of 980 Ω, the Al surface opposed to the heterojunction with the NASICON increases its surface chemical potential with the electrons flowing from the negative electrode (Al) to the positive electrode (Cu) through the resistor. In a closed circuit, the band bending in Na3Zr2Si2PO12 configures a p-type semiconductor behavior, although it is much less pronounced, as observed in LAGP. It is noteworthy that NASICON shows an ionic conductivity of 10−4 S.cm−1 whereas LAGP shows > 10−3 S.cm−1 at room temperature. The latter property, the p-type semiconductor behavior, is likely related to the fast band bending promoted by the diffusion of the Li+ ions towards the Cu while the cell is set to discharge. Another common property observed in the solid electrolytes studied in this work, and Li2.99Ba0.005ClO shown in the supplement of [31], is the equalization of the surface chemical potentials of the two heterojunctions at the same potential; and, whereas for Li2.99Ba0.005ClO, the surface potential of the electrodes equalizes with that of the heterojunctions towards the inner electrode, in NASICON and LAGP, there is a quantum barrier/well corresponding to an internal resistance at the interfaces, especially at the interface solid electrolyte/Al reflected in the cell by a very low OCV (10 to 34 mV) for a Cu//Al cell with expected Δ V O C = μ A l μ C u e ( P h y s i c a l   s c a l e ) 1.1 V, having into account the SKP measured chemical potentials for electrically insulated materials. As with the other cells of the type metal1/insulator/metal2 studied so far, there is an emergency manifested in the equalization of the surface chemical potential of the electrodes and heterojunctions more frequently observed for the electrode connected to the SKP. The emergency also manifests as an extreme bending of the surface chemical potentials of the electrodes, especially if the electrode is Al.
Solid Electrolyte. Li1.5Al0.5Ge1.5(PO4)3, NASICON type structure, hereafter LAGP, is a solid state electrolyte. According to [42,43], LAGP demonstrates a relatively high ionic conductivity of 4.2 mS.cm–1 at room temperature. Furthermore, LAGP has an advantageous electrochemical stability window (1.8–7 V vs. Li+/Li) [44,45,46,47]. Figure 7 shows SKP’s surface chemical potentials for an Al/insulator/Cu cell with the insulator gap replaced by LAGP. A dielectric polarization with positive–negative–positive polarization regions was expected to be allowed by ion hopping; nevertheless, this was not what was observed. At OCV, the bending of the vacuum surface, a reflex of the bending of the E C and E V bands of LAGP, shows a p-type semiconductor behavior. The surface chemical potential of LAGP at the interface with Cu is lower than at the Al side, indicating a positive polarization near Cu, possibly by an accumulation of Li+-ions. This is the same effect as observed at Li2O/Cu as shown in Figure 5a–c. From the best of our knowledge, this is a new result and, as with the Li2O, it indicates that the solid electrolyte shows an accumulation of Li+-ions at the interface of the positive electrode, at OCV, and with which the electrons and cathode’s active material react while discharging with a resistor load (Figure 7c,d).
If the electrolyte shows other dielectric capabilities, then they likely happen at T > 36 °C, where the activation energy of more ions is overcome, and more Li+-ions hop faster.
A very clear bending of the Al surface chemical potentials, as well as the Cu’s at OCV, makes it possible to observe an equilibrium Cu1…Cu2/LAGP/Al1…Al2 within the extended cell (Table 2, Figure 7a,b). This latter value of the potential energy for all the materials of the cell may correspond to the Fermi level (Figure 2d and Figure 7). A significant interfacial resistance at the LAGP/Al interface, or potential barrier/well as discussed in [31], is characterized by a sharp step down of the surface chemical potential and may justify the difference between the expected OCV for a Cu//Al cell 1.1 V and the OCV obtained for Cu/LAGP/Al of 0.09 V (Table 2) [31].
When the Cu/LAGP/Al cell is connected to a 980 Ω resistor, the surface chemical potentials of the electrodes closer to the cell’s edges bend up upon electron circulation through the external circuit. The surface chemical potential of the Al grows at the border (Physical scale, Figure 2b) to a value that is much closer to the insulated Al SKP value; in other words, the work function decreases. Other features that seem rather consistent are the solitons or the surface plasma polaritons (SPP) wave-like behavior on the Cu electrode due to the Cu/LAGP contact.
The internal resistance, corresponding to potential barriers or wells, expressed in a step down of the surface chemical potentials at the interfaces metal/dielectric and metal/LAGP solid electrolyte, is responsible for very low OCVs and very high impedance. A high dielectric or solid electrolyte impedance favors straight band bending and n-type or p-type semiconductor-like behavior at room temperature instead of alternate dielectric polarization, which is achieved through higher mobility of the ions.
It is highlighted that LAGP’s granulometry is much smaller than NASICON’s, which may reflect on the internal impedance and not as much on the surface transport phenomena.
Solid electrolyte and ferroelectric. Li2.99Ba0.005ClO, herein Li+-glass, is a ferroelectric. Figure 8a–e shows the beginning of a flipping process that occurs between the Cu and Al’s surface chemical potential mediated by the Li+-glass. In Figure 8a,b, at the Cu/Li+-glass heterojunction, negatively charged plasmons alternate with positively charged, initiating their transport through the surface of the Li+-glass. Figure 8c–e show tunneling to the Al mediated through a positively charged plasmon soliton. It is noteworthy that at the end of the second cycle, self-charge had already occurred (ΔV = 0.14 V), and the Al surface chemical potential had visibly decreased whereas the Cu’s had increased (Physical scale, Figure 2b). Figure 8f–h show what the subsequent process is, where the Al surface chemical potential drops, equalizing the Cu’s and negatively charged plasmon solitons parallel to the interfaces (y-axis), traveling along the x-axis from the Cu to the Al electrode, and closing the feedback circuit through the inner cell (through the surface of the ferroelectric) [48]. Coherent plasmons tunnel from the Li+-glass to the Al electrode after tunneling from the Cu to the ferroelectric and propagating through its surface.
By performing cyclic voltammetry I-V (Figure 9a), it is possible to determine that after the SKP experiment, the cell remains polarized, presenting a current of 0.08 to 0.100 mA, at OCV, and after SKP analyses (0.77 ≤   V O C (V) ≤ 1.04). The internal resistance, R2 = 2.2 × 10⁶ Ω (Figure 9b), corresponds to a conductivity through the surface of Li+-glass of 2.4 × 10⁻⁷ S·cm−1. It is noteworthy to highlight that semiconductors have conductivities between 10−8 and 102 S·cm−1, and the powders corresponding to a 5.5 mm thick layer of Li2.99Ba0.005ClO had diameters with µm-sizes and were relatively loose in the space between metals; the pressure exerted to contain the powders was manual and made with a spatula-like tool and, therefore, the real conductivity of the Li+-glass surface is much high than measured.
The Al/Li2.99Ba0.005ClO (Li+-glass)/Cu cell was the only one to show a potential difference that approximates the theoretical of 1.1 V; although due to the thick layer of ferroelectric electrolyte powder (5.5 mm) within the cell, with μm diameters manually pressed together, a much higher resistance was expected in the face of what was observed with the oxides and other solid electrolytes.
The self-charge happening even when the cell is connected to a resistor load is likely due to the inversion in surface chemical potentials of the electrodes while not manifesting an inversion of the bulk chemical potentials. This inversion enables drift-like plasmonic conduction in feedback through the surface of the electrolyte, enabling, therefore, self-charge. Previous results with ferroelectric electrolytes of the family A3−2xMxClO (A = Li, Na, K) show that the conduction of electrons through the surface is observed in hermetically closed pouch cells [26] and coaxial cells [49,50], leading to self-cycling and self-charging.
Ab initio simulations. Finally, Figure 10 and Figure 11 show the ab initio simulations of the surfaces with subsequent calculations of the work functions of the electrode metals, dielectric oxides, and solid electrolytes. All the results are in good agreement with the experiments (Table 2) except the Al (Figure 10b), which is able to vary its surface chemical potential through a wide range of values from −1.5 V, SHE (Figure 4c) to 0.60 V, SHE (Figure 4b). In [31], we show Al’s chemical surface potential to vary to +5 V (SHE).
It is noteworthy that we have simulated the electronic band structure for NASICON and LAGP (Figure 11a,c) because the materials are disordered, and therefore, they assume different possible structures. That is perhaps a reason contributing to LAGP electronic band structure not being widely accessible in the literature. For comparison, the structure of NASICON was also simulated.

5. Conclusions

This work aimed to show the differences between dielectric oxides and solid electrolytes, and among solid electrolytes, a ferroelectric electrolyte. It was not expected that a cell with hyperbolic dimensions could highlight these many differences.
Surface chemical potentials: the most impressive feature is that no matter what dielectric/solid electrolyte disjoints the two electrode metals, the surface chemical potential equalizes throughout a ~2.5 cm thickness cell due to the propagation of the electric field throughout the cell.
Surface chemical potentials of the metal electrodes: the metals have an unexpectedly high capacity to bend their surface chemical potentials and to propagate SPP solitons.
Surface chemical potentials of the insulators: the surface chemical potentials seem to be much more affected by the insulator that disjoints the two metal electrodes than the surface preparation or texture; they do not appear to depend too much on the particle size either. However, the particle size should influence the cell’s impedance.
Dielectric materials: SiO2, MgO, and Li2O may bend their surface chemical potential straight with the more negatively charged part closer to the negative electrode (Al), which is at a higher chemical potential than the positive (Cu). However, they can assume other configurations, such as those of an n-type (MgO) or p-type (Li2O) semiconductor.
Solid electrolytes: NASICON tends to polarize as an n-type semiconductor at OCV and as a p-type in a closed circuit, whereas LAGP polarizes as a p-type both at OCV and in a closed circuit with a resistive load.
Differences in dielectrics vs. solid-electrolytes: the difference between the LAGP and the previous dielectrics is that positive charge accumulates close to the interface with Cu creating a difference of 0.15 V over 630 μm; there is no considerable polarization of the LAGP surface potential on the Al side. It is likely that Li+-ions are just accumulated at the Cu side and not on the Al side, as the relative work functions would determine. The discharge reaction (spontaneous) happens at the positive electrode, with Li+ being delivered from the electrolyte and the electrons from the external circuit, which is in agreement with the surface chemical potentials observed with LAPG. This might be a common feature of solid electrolytes that do not accumulate being ferroelectric, which superimposes the condition of being a solid electrolyte.
The equalization of the surface chemical potentials of all the solid electrolytes, including the ferroelectrics, is made at both interfaces at the same energy, immediately or after the transient state, which to the best of our knowledge, is yet another novel result.
Ferroelectric solid electrolyte: The ferroelectric electrolyte, Li+-glass, is the only one capable of achieving electrical potentials that are close to the theoretical potentials (1.1 V) in a 5.5 mm gap cell, showing surface plasmon phenomena with micro to millimeter wavelengths correspondent to THz frequencies attributed to electronic phenomena, and capable of closing the positive feedback discharge/self-charge. The ferroelectric electrolyte is the only one that is able to invert the surface chemical potentials of negative and positive electrodes and yet store electrical energy without reverting the polarization of the cell.
Finally, ionic conductivity seems to have an important role as the efficiency of the cells with solid electrolytes increases with ionic conductivity. However, the dielectric constant follows the same trends as ionic conductivity, indicating that it is related to ionic conductivity in solid electrolytes and, generally, the most accurate indicator also present for dielectrics.
The present findings may have applications in batteries, capacitors, photovoltaics, thermo-electrics, transistors, metamaterials, and topologic insulators but also in novel device architectures that may harvest energy through topologic plasmonic feedback while storing it.

Supplementary Materials

The following supporting information can be downloaded at: www.mdpi.com/xxx/s1, Review on the dielectrics and solid electrolytes studied herein. References [51,52,53,54,55,56,57,58,59,60,61,62,63,64,65,66,67,68,69,70,71,72,73,74,75,76,77,78,79,80,81,82,83,84,85,86,87,88,89,90,91,92,93,94,95,96,97,98,99,100,101,102,103,104,105,106,107,108,109,110,111,112,113,114,115,116,117,118,119,120,121,122,123,124,125,126,127,128,129,130,131,132,133,134,135,136,137,138,139,140,141,142,143,144,145,146,147,148,149,150] are cited in the Supplementary Materials.

Author Contributions

Cell fabrication and experiments: A.N.G.; review of state of the art: A.N.G., B.A.M., H.K. and M.C.B.; original ideas and draft, formal analysis, simulations, and supervision: M.H.B.; review and editing: All. All authors have read and agreed to the published version of the manuscript.

Funding

This research was funded by the CAVALI project, reference POCI-01-0247-FEDER-047728, co-funded by the ERDF, through the COMPETE 2020, under the PORTUGAL 2020 Partnership Agreement; the Portuguese Foundation for Science and Technology FCT UIDP/50022/2020 Emerging Technologies–LAETA, and PTDC/QUI-ELT/2593/2021 “Redox-active Metal-Organic Frameworks as Electrode Materials for Lithium-Ion Batteries” projects. B.A.M. thanks the “FLY.PT—Mobilize the Portuguese aviation industry to disrupt the future urban air transport” project, co-financed by the European Regional Development Fund (ERDF) through Portugal 2020. H.K. thanks the project ALBATTS ERASMUS+ 612675-EPP-1-2019-1-SE-EPPKA2-SSA-B co-funded by the Erasmus Program of the European Union.

Data Availability Statement

The data that support the findings of this study are available from the corresponding author upon reasonable request.

Acknowledgments

M.H.B. acknowledges John B. Goodenough’s endowment to the MatER–Materials for Energy Research lab, FEUP.

Conflicts of Interest

The authors declare no conflict of interest.

References

  1. Lewis, N.S.; Nocera, D.G. Powering the planet: Chemical challenges in solar energy utilization. Proc. Natl. Acad. Sci. USA 2006, 103, 15729–15735. [Google Scholar] [CrossRef] [Green Version]
  2. Liu, Y.; Li, Y.; Wu, Y.; Yang, G.; Mazzarella, L.; Procel-Moya, P.; Tamboli, A.C.; Weber, K.; Boccard, M.; Isabella, O.; et al. High-Efficiency Silicon Heterojunction Solar Cells: Materials, Devices and Applications. Mater. Sci. Eng. R Rep. 2020, 142, 100579. [Google Scholar] [CrossRef]
  3. Eshetu, G.G.; Zhang, H.; Judez, X.; Adenusi, H.; Armand, M.; Passerini, S.; Figgemeier, E. Production of high-energy Li-ion batteries comprising silicon-containing anodes and insertion-type cathodes. Nat. Commun. 2021, 12, 5459. [Google Scholar] [CrossRef]
  4. Saini, P.; Gidwani, L. An investigation for battery energy storage system installation with renewable energy resources in distribution system by considering residential, commercial and industrial load models. J. Energy Storage 2022, 45, 103493. [Google Scholar] [CrossRef]
  5. Chen, Y.; Kang, Y.; Zhao, Y.; Wang, L.; Liu, J.; Li, Y.; Liang, Z.; He, X.; Li, X.; Tavajohi, N.; et al. A review of lithium-ion battery safety concerns: The issues, strategies, and testing standards. J. Energy Chem. 2021, 59, 83–99. [Google Scholar] [CrossRef]
  6. Wen, J.; Yu, Y.; Chen, C. A Review on Lithium-Ion Batteries Safety Issues: Existing Problems and Possible Solutions. Mater. Express 2012, 2, 197–212. [Google Scholar] [CrossRef]
  7. Lee, S.; Manthiram, A. Can Cobalt Be Eliminated from Lithium-Ion Batteries? ACS Energy Lett. 2022, 7, 3058–3063. [Google Scholar] [CrossRef]
  8. Ma, S.; Jiang, M.; Tao, P.; Song, C.; Wu, J.; Wang, J.; Deng, T.; Shang, W. Temperature effect and thermal impact in lithium-ion batteries: A review. Prog. Nat. Sci. Mater. Int. 2018, 28, 653–666. [Google Scholar] [CrossRef]
  9. Hoffmann, M.; Salahuddin, S. Ferroelectric gate oxides for negative capacitance transistors. MRS Bull. 2021, 46, 930–937. [Google Scholar] [CrossRef]
  10. Balandin, A.A.; Kargar, F.; Salguero, T.T.; Lake, R.K. One-dimensional van der Waals quantum materials. Mater. Today 2022, 55, 74–91. [Google Scholar] [CrossRef]
  11. Sekine, A.; Nomura, K. Axion electrodynamics in topological materials. J. Appl. Phys. 2021, 129, 141101. [Google Scholar] [CrossRef]
  12. Smirnova, D.; Leykam, D.; Chong, Y.; Kivshar, Y. Nonlinear topological photonics. Appl. Phys. Rev. 2020, 7, 021306. [Google Scholar] [CrossRef]
  13. Guo, Y.; Qu, X.; Hu, Z.; Zhu, J.; Niu, W.; Liu, X. Highly elastic and mechanically robust polymer electrolytes with high ionic conductivity and adhesiveness for high-performance lithium metal batteries. J. Mater. Chem. A 2021, 9, 13597–13607. [Google Scholar] [CrossRef]
  14. Kurzina, E.A.; Stenina, I.A.; Dalvi, A.; Yaroslavtsev, A.B. Synthesis and Ionic Conductivity of Lithium Titanium Phosphate-Based Solid Electrolytes. Inorg. Mater. 2021, 57, 1035–1042. [Google Scholar] [CrossRef]
  15. Gupta, M.K.; Mittal, R.; Kumar, S.; Singh, B.; Jalarvo, N.H.; Delaire, O.; Shukla, R.; Achary, S.N.; Kolesnikov, A.I.; Tyagi, A.K.; et al. Stoichiometric tuning of lattice flexibility and Na diffusion in NaAlSiO4: Quasielastic neutron scattering experiment andab initiomolecular dynamics simulations. J. Mater. Chem. A 2021, 9, 16129–16136. [Google Scholar] [CrossRef]
  16. Braga, M.H.; Oliveira, J.E.; Kai, T.; Murchison, A.J.; Bard, A.J.; Goodenough, J.B. Extraordinary Dielectric Properties at Heterojunctions of Amorphous Ferroelectrics. J. Am. Chem. Soc. 2018, 140, 17968–17976. [Google Scholar] [CrossRef] [PubMed]
  17. Iqbal, S.; Bahadur, A.; Saeed, A.; Zhou, K.; Shoaib, M.; Waqas, M. Electrochemical performance of 2D polyaniline anchored CuS/Graphene nano-active composite as anode material for lithium-ion battery. J. Colloid Interface Sci. 2017, 502, 16–23. [Google Scholar] [CrossRef] [PubMed]
  18. Bahadur, A.; Iqbal, S.; Shoaib, M.; Saeed, A. Electrochemical study of specially designed graphene-Fe3O4-polyaniline nanocomposite as a high-performance anode for lithium-ion battery. Dalt. Trans. 2018, 47, 15031–15037. [Google Scholar] [CrossRef]
  19. Yang, L.; Wang, H.; Zhang, X.; Li, Y.; Chen, X.; Xu, X.; Zhao, X.; Song, A. Thermally Evaporated SiO Serving as Gate Dielectric in Graphene Field-Effect Transistors. IEEE Trans. Electron Devices 2017, 64, 1846–1850. [Google Scholar] [CrossRef] [Green Version]
  20. Posadas, A.; Walker, F.J.; Ahn, C.H.; Goodrich, T.L.; Cai, Z.; Ziemer, K.S. Epitaxial MgO as an alternative gate dielectric for SiC transistor applications. Appl. Phys. Lett. 2008, 92, 233511. [Google Scholar] [CrossRef]
  21. Smith, J.G.; Naruse, J.; Hiramatsu, H.; Siegel, D.J. Intrinsic Conductivity in Magnesium–Oxygen Battery Discharge Products: MgO and MgO2. Chem. Mater. 2017, 29, 3152–3163. [Google Scholar] [CrossRef] [Green Version]
  22. Lorger, S.; Usiskin, R.; Maier, J. Transport and Charge Carrier Chemistry in Lithium Oxide. J. Electrochem. Soc. 2019, 166, A2215. [Google Scholar] [CrossRef]
  23. Tiliakos, A.; Iordache, M.; Marinoiu, A. Ionic Conductivity and Dielectric Relaxation of NASICON Superionic Conductors at the Near-Cryogenic Regime. Appl. Sci. 2021, 11, 8432. [Google Scholar] [CrossRef]
  24. Wang, H.; Zhao, G.; Wang, S.; Liu, D.; Mei, Z.; An, Q.; Jiang, J.; Guo, H. Enhanced ionic conductivity of a Na3Zr2Si2PO12 solid electrolyte with Na2SiO3 obtained by liquid phase sintering for solid-state Na+ batteries. Nanoscale 2022, 14, 823–832. [Google Scholar] [CrossRef] [PubMed]
  25. Campanella, D.; Belanger, D.; Paolella, A. Beyond garnets, phosphates and phosphosulfides solid electrolytes: New ceramic perspectives for all solid lithium metal batteries. J. Power Sources 2021, 482, 228949. [Google Scholar] [CrossRef]
  26. Braga, M.H.; Oliveira, J.E.; Murchison, A.J.; Goodenough, J.B. Performance of a ferroelectric glass electrolyte in a self-charging electrochemical cell with negative capacitance and resistance. Appl. Phys. Rev. 2020, 7, 011406. [Google Scholar] [CrossRef]
  27. Braga, M.H.; Ferreira, J.A.; Murchison, A.J.; Goodenough, J.B. Electric Dipoles and Ionic Conductivity in a Na+ Glass Electrolyte. J. Electrochem. Soc. 2017, 164, A207. [Google Scholar] [CrossRef]
  28. Braga, M.H.; Ferreira, J.A.; Stockhausen, V.; Oliveira, J.E.; El-Azab, A. Novel Li3ClO based glasses with superionic properties for lithium batteries. J. Mater. Chem. A 2014, 2, 5470–5480. [Google Scholar] [CrossRef] [Green Version]
  29. Zisman, W.A. A new method of measuring contact potential differences in metals. Rev. Sci. Instrum. 1932, 3, 367–370. [Google Scholar] [CrossRef]
  30. Reiss, H. The Fermi level and the redox potential. J. Phys. Chem. 1985, 89, 3783–3791. [Google Scholar] [CrossRef]
  31. Guerreiro, A.N.; Baptista, M.; Maia, B.; Braga, M.H. Interfacial chemistry with ZnO: In operando work functions in hetero cells. ACS Appl. Energy Mater. 2022, 5, 9811–9822. [Google Scholar] [CrossRef]
  32. Kresse, G.; Furthmüller, J. Efficient iterative schemes for ab initio total-energy calculations using a plane-wave basis set. Phys. Rev. B 1996, 54, 11169–11186. [Google Scholar] [CrossRef] [PubMed]
  33. Han, J.; He, M.; Yang, M.; Han, Q.; Wang, F.; Zhong, F.; Xu, M.; Li, Q.; Zhu, H.; Shan, C.; et al. Light-modulated vertical heterojunction phototransistors with distinct logical photocurrents. Light Sci. Appl. 2020, 9, 167. [Google Scholar] [CrossRef]
  34. Maier, S.A. Electromagnetics of Metals; Plasmonics: Fundamentals and Applications; Springer: New York, NY, USA, 2007. [Google Scholar]
  35. Zhang, H.Q.; Chen, F. Rogue waves for the fourth-order nonlinear Schrödinger equation on the periodic background. Chaos An Interdiscip. J. Nonlinear Sci. 2021, 31, 023129. [Google Scholar] [CrossRef] [PubMed]
  36. Ye, Y.; Bu, L.; Wang, W.; Chen, S.; Baronio, F.; Mihalache, D. Peregrine Solitons on a Periodic Background in the Vector Cubic-Quintic Nonlinear Schrödinger Equation. Front. Phys. 2020, 8, 510. [Google Scholar] [CrossRef]
  37. Shnir, Y.M. Chains of Interacting Solitons. Symmetry 2021, 13, 284. [Google Scholar] [CrossRef]
  38. Trasa’tti, S. The absolute electrode potential: An explanatory note (Recommendations 1986). Pure Appl. Chem. 1986, 58, 955–966. [Google Scholar] [CrossRef]
  39. Vergniory, M.G.; Wieder, B.J.; Elcoro, L.; Parkin, S.S.P.; Felser, C.; Bernevig, B.A.; Regnault, N. All topological bands of all nonmagnetic stoichiometric materials. Science 2022, 376, eabg9094. [Google Scholar] [CrossRef]
  40. An, J.; Oh, S.; He, L.; Plewa, A.; Morita, M.; Zhao, Y.; Sakamoto, T.; Song, X.; Zhai, W.; Zeng, K.; et al. Composite NASICON (Na3Zr2Si2PO12) Solid-State Electrolyte with Enhanced Na + Ionic Conductivity: Effect of Liquid Phase Sintering. ACS Appl. Mater. Interfaces 2019, 11, 40125–40133. [Google Scholar] [CrossRef]
  41. Lalère, F.; Leriche, J.B.; Courty, M.; Boulineau, S.; Viallet, V.; Masquelier, C.; Seznec, V. An all-solid state NASICON sodium battery operating at 200 °C. J. Power Sources 2014, 247, 975–980. [Google Scholar] [CrossRef]
  42. Thokchom, J.S.; Kumar, B. Composite effect in superionically conducting lithium aluminium germanium phosphate based glass-ceramic. J. Power Sources 2008, 185, 480–485. [Google Scholar] [CrossRef]
  43. Thokchom, J.S.; Gupta, N.; Kumar, B. Superionic Conductivity in a Lithium Aluminum Germanium Phosphate Glass–Ceramic. J. Electrochem. Soc. 2008, 155, A915. [Google Scholar] [CrossRef]
  44. Leo, C.J.; Chowdari, B.V.R.; Rao, G.V.S.; Souquet, J.L. Lithium conducting glass ceramic with Nasicon structure. Mater. Res. Bull. 2002, 37, 1419–1430. [Google Scholar] [CrossRef]
  45. Feng, J.K.; Yan, B.G.; Liu, J.C.; Lai, M.O.; Li, L. All solid state lithium ion rechargeable batteries using NASICON structured electrolyte. Mater. Technol. 2013, 8, 276–279. [Google Scholar] [CrossRef]
  46. Meesala, Y.; Chen, C.Y.; Jena, A.; Liao, Y.K.; Hu, S.F.; Chang, H.; Liu, R.S. All-Solid-State Li-Ion Battery Using Li1.5Al0.5Ge1.5(PO4)3 As Electrolyte Without Polymer Interfacial Adhesion. J. Phys. Chem. C 2018, 122, 14383–14389. [Google Scholar] [CrossRef]
  47. Xu, X.; Wen, Z.; Wu, X.; Yang, X.; Gu, Z. Lithium Ion-Conducting Glass–Ceramics of Li1.5Al0.5Ge1.5(PO4)3–xLi2O (x = 0.0–0.20) with Good Electrical and Electrochemical Properties. J. Am. Ceram. Soc. 2007, 90, 2802–2806. [Google Scholar] [CrossRef]
  48. Braga, M.H. Coherence in the Ferroelectric A3ClO (A = Li, Na) Family of Electrolytes. Materials 2021, 14, 2398. [Google Scholar] [CrossRef]
  49. Danzi, F.; Valente, M.; Terlicka, S.; Braga, M.H. Sodium and potassium ion rich ferroelectric solid electrolytes for traditional and electrode-less structural batteries. APL Mater. 2022, 10, 031111. [Google Scholar] [CrossRef]
  50. Danzi, F.; Camanho, P.P.; Braga, M.H. An All-Solid-State Coaxial Structural Battery Using Sodium-Based Electrolyte. Molecules 2021, 26, 5226. [Google Scholar] [CrossRef]
  51. Eränen, S.; Törmä, P.; Gonzalez, P.; Rottenberg, X.; Puurunen, R.L.; Putkonen, M.; Vogl, A.; Tyholdt, F.; Tofteberg, H.; Muralt, P.; et al. Thin Films on Silicon. In Handbook of Silicon Based MEMS Materials and Technologies, 2nd ed.; Elsevier Inc.: Amsterdam, The Netherlands, 2015; pp. 124–205. [Google Scholar] [CrossRef]
  52. Dionisio, K.L.; Phillips, K.; Price, P.S.; Grulke, C.M.; Williams, A.; Biryol, D.; Hong, T.; Isaacs, K.K. The Chemical and Products Database, a resource for exposure-relevant data on chemicals in consumer products. Sci. Data 2018, 5, 180125. [Google Scholar] [CrossRef] [PubMed] [Green Version]
  53. Munteanu, D.; Autran, J. Modeling of energy bands in ultra-thin layer quantum nanostructures for solar cell applications. J. Non-Cryst. Solids 2011, 357, 1884–1887. [Google Scholar] [CrossRef]
  54. Güler, E.; Uğur, G.; Uğur, Ş.; Güler, M. A theoretical study for the band gap energies of the most common silica polymorphs. Chin. J. Phys. 2020, 65, 472–480. [Google Scholar] [CrossRef]
  55. Tea, E.; Huang, J.; Hin, C. First principles study of band line up at defective metal-oxide interface: Oxygen point defects at Al/SiO2interface. J. Phys. D Appl. Phys. 2016, 49, 095304. [Google Scholar] [CrossRef] [Green Version]
  56. Uzum, A.; Kanmaz, I. Passivation properties of HfO2-SiO2 mixed metal oxide thin films with low reflectivity on silicon substrates for semiconductor devices. Thin Solid Films 2021, 738, 138965. [Google Scholar] [CrossRef]
  57. Okoshi, M.; Iyono, M.; Inoue, N.; Yamashita, T. Photochemical welding of silica microspheres to silicone rubber by ArF excimer laser. Appl. Surf. Sci. 2009, 255, 9796–9799. [Google Scholar] [CrossRef]
  58. Jaehnike, F.; Pham, D.V.; Anselmann, R.; Bock, C.; Kunze, U. High-Quality Solution-Processed Silicon Oxide Gate Dielectric Applied on Indium Oxide Based Thin-Film Transistors. ACS Appl. Mater. Interfaces 2015, 7, 14011–14017. [Google Scholar] [CrossRef]
  59. Bhatt, V.; Chandra, S. Silicon dioxide films by RF sputtering for microelectronic and MEMS applications. J. Micromechanics Microengineering 2007, 17, 1066–1077. [Google Scholar] [CrossRef]
  60. Cross, R.B.M.; De Souza, M.M.; Deane, S.C.; Young, N.D. A Comparison of the Performance and Stability of ZnO-TFTs With Silicon Dioxide and Nitride as Gate Insulators. IEEE Trans. Electron Devices 2008, 55, 1109–1115. [Google Scholar] [CrossRef] [Green Version]
  61. Ho, W.-J.; Lin, J.-C.; Liu, J.-J.; Bai, W.-B.; Shiao, H.-P. Electrical and Optical Characterization of Sputtered Silicon Dioxide, Indium Tin Oxide, and Silicon Dioxide/Indium Tin Oxide Antireflection Coating on Single-Junction GaAs Solar Cells. Materials 2017, 10, 700. [Google Scholar] [CrossRef]
  62. Ashok, A.; Pal, P. Investigation of anodic silicon dioxide thin films for microelectromechanical systems applications. Micro Nano Lett. 2014, 9, 830–834. [Google Scholar] [CrossRef]
  63. Ihlemann, J. Laser Based Rapid Fabrication of SiO2-phase Masks for Efficient UV-laser Micromachining. J. Laser Micro/Nanoengineering 2009, 4, 100–103. [Google Scholar] [CrossRef]
  64. Bailey, R.A.; Nevin, J.H. Thin-Film Multilayer Capacitors Using Pyrolytically Deposited Silicon Dioxide. IEEE Trans. Parts Hybrids Packag. 1976, 12, 361–364. [Google Scholar] [CrossRef]
  65. Salawu, S.; Obalalu, A.; Fatunmbi, E.; Oderinu, R. Thermal Prandtl-Eyring hybridized MoS2-SiO2/C3H8O2 and SiO2-C3H8O2 nanofluids for effective solar energy absorber and entropy optimization: A solar water pump implementation. J. Mol. Liq. 2022, 361, 119608. [Google Scholar] [CrossRef]
  66. Talib, S.; Azmi, W.; Zakaria, I.; Mohamed, W.; Mamat, A.; Ismail, H.; Daud, W. Thermophysical Properties of Silicon Dioxide (SiO2) in Ethylene Glycol/Water Mixture for Proton Exchange Membrane Fuel Cell Cooling Application. Energy Procedia 2015, 79, 366–371. [Google Scholar] [CrossRef] [Green Version]
  67. Yao, Y.; Zhang, J.; Xue, L.; Huang, T.; Yu, A. Carbon-coated SiO2 nanoparticles as anode material for lithium ion batteries. J. Power Sources 2011, 196, 10240–10243. [Google Scholar] [CrossRef]
  68. Dong, X.; Zheng, X.; Deng, Y.; Wang, L.; Hong, H.; Ju, Z. SiO2/N-doped graphene aerogel composite anode for lithium-ion batteries. J. Mater. Sci. 2020, 55, 13023–13035. [Google Scholar] [CrossRef]
  69. Zhang, M.; Li, L.; Jian, X.; Zhang, S.; Shang, Y.; Xu, T.; Dai, S.; Xu, J.; Kong, D.; Wang, Y.; et al. Free-standing and flexible CNT/(Fe@Si@SiO2) composite anodes with kernel-pulp-skin nanostructure for high-performance lithium-ion batteries. J. Alloys Compd. 2021, 878, 160396. [Google Scholar] [CrossRef]
  70. Si, L.; Yan, K.; Li, C.; Huang, Y.; Pang, X.; Yang, X.; Sui, D.; Zhang, Y.; Wang, J.; Xu, C.C. Binder-free SiO2 nanotubes/carbon nanofibers mat as superior anode for lithium-ion batteries. Electrochimica Acta 2022, 404, 139747. [Google Scholar] [CrossRef]
  71. Afanas’Ev, V.V.; Stesmans, A.; Cherkaoui, K.; Hurley, P.K. Electron energy band alignment at the (100)Si/MgO interface. Appl. Phys. Lett. 2010, 96, 052103. [Google Scholar] [CrossRef]
  72. Selvi, K.T.; Mangai, K.A.; Priya, M.; Sagadevan, S. Investigation of the dielectric and impedance properties of ZnO/MgO nanocomposite. Phys. B Condens. Matter 2020, 594, 412355. [Google Scholar] [CrossRef]
  73. Huang, S.; Kang, B.; Duan, L.; Zhang, D. Highly efficient inverted polymer solar cells by using solution processed MgO/ZnO composite interfacial layers. J. Colloid Interface Sci. 2020, 583, 178–187. [Google Scholar] [CrossRef]
  74. Farag, A.; Ashery, A.; Salem, M. Electrical, dielectric characterizations and optoelectronic applications of epitaxially grown Co/n-CuO/p-Si heterojunctions. Superlattices Microstruct. 2019, 135, 106277. [Google Scholar] [CrossRef]
  75. Jiang, G.; Liu, A.; Liu, G.; Zhu, C.; Meng, Y.; Shin, B.; Fortunato, E.; Martins, R.; Shan, F. Solution-processed high-k magnesium oxide dielectrics for low-voltage oxide thin-film transistors. Appl. Phys. Lett. 2016, 109, 183508. [Google Scholar] [CrossRef]
  76. Hornak, J.; Trnka, P.; Kadlec, P.; Michal, O.; Mentlík, V.; Šutta, P.; Csányi, G.M.; Tamus, Z. Magnesium Oxide Nanoparticles: Dielectric Properties, Surface Functionalization and Improvement of Epoxy-Based Composites Insulating Properties. Nanomaterials 2018, 8, 381. [Google Scholar] [CrossRef] [Green Version]
  77. Subramanian, M.A.; Shannon, R.D.; Chai, B.H.T.; Abraham, M.M.; Wintersgill, M.C. Dielectric constants of BeO, MgO, and CaO using the two-terminal method. Phys. Chem. Miner. 1989, 16, 741–746. [Google Scholar] [CrossRef]
  78. Lim, J.Y.; Oh, J.S.; Ko, B.; Cho, J.W.; Kang, S.O.; Cho, G.; Uhm, H.S.; Choi, E.H. Work function of MgO single crystals from ion-induced secondary electron emission coefficient. J. Appl. Phys. 2003, 94, 764–769. [Google Scholar] [CrossRef]
  79. Lee, J.H.; Kim, H.S.; Kim, S.H.; Jang, N.W.; Yun, Y. Characterization of magnesium oxide gate insulators grown using RF sputtering for ZnO thin-film transistors. Curr. Appl. Phys. 2014, 14, 794–797. [Google Scholar] [CrossRef]
  80. Arora, S. ZnO/MgO/ITO structured thin film transistor for ultraviolet photo detector application. Mater. Today Proc. 2020, 30, 150–152. [Google Scholar] [CrossRef]
  81. Massarotti, D.; Bauch, T.; Lombardi, F.; Tafuri, F. Josephson and charging effect in mesoscopic superconducting devices. In Superconductors at the Nanoscale; De Gruyter: Berlin, Germany, 2017; pp. 309–338. [Google Scholar] [CrossRef]
  82. Yeung, G.; Reich, C.; Onno, A.; Bothwell, A.; Danielson, A.; Holman, Z.; Sampath, W.S.; Wolden, C.A. Robust passivation of CdSeTe based solar cells using reactively sputtered magnesium zinc oxide. Sol. Energy Mater. Sol. Cells 2021, 233, 111388. [Google Scholar] [CrossRef]
  83. Merachtsaki, D.; Tsardaka, E.-C.; Anastasiou, E.; Zouboulis, A. Anti-corrosion properties of magnesium oxide/magnesium hydroxide coatings for application on concrete surfaces (sewerage network pipes). Constr. Build. Mater. 2021, 312, 125441. [Google Scholar] [CrossRef]
  84. Xu, K.; Lin, F.; Dou, X.; Zheng, M.; Tan, W.; Wang, C. Recovery of ammonium and phosphate from urine as value-added fertilizer using wood waste biochar loaded with magnesium oxides. J. Clean. Prod. 2018, 187, 205–214. [Google Scholar] [CrossRef]
  85. Materials Data on Li2O (SG:225) by Materials Project. 2014. Available online: https://materialsproject.org/materials/mp-1960 (accessed on 1 November 2022).
  86. Ha, Y.; Schulze, M.C.; Frisco, S.; Trask, S.E.; Teeter, G.; Neale, N.R.; Veith, G.M.; Johnson, C.S. Li2O-Based Cathode Additives Enabling Prelithiation of Si Anodes. Appl. Sci. 2021, 11, 12027. [Google Scholar] [CrossRef]
  87. Dyer, C.; Moseley, P.; Ogumi, Z.; Rand, D.; Scrosati, B. Encyclopedia of Electrochemical Power Sources; Elsevier Science & Technology: Amsterdam, The Netherlands, 2009. [Google Scholar]
  88. Donato, A. A critical review of Li2O ceramic breeder material properties correlations and data. Fusion Eng. Des. 1998, 38, 369–392. [Google Scholar] [CrossRef]
  89. Mosqueda, H.A.; Vazquez, C.; Bosch, P.; Pfeiffer, H. Chemical sorption of carbon dioxide (CO2) on lithium oxide (Li2O). Chem. Mater. 2006, 18, 2307–2310. [Google Scholar] [CrossRef]
  90. Sun, Y.; Lee, H.-W.; Seh, Z.W.; Liu, N.; Sun, J.; Li, Y.; Cui, Y. High-capacity battery cathode prelithiation to offset initial lithium loss. Nat. Energy 2016, 1, 15008. [Google Scholar] [CrossRef]
  91. Qiao, Y.; Yang, H.; Chang, Z.; Deng, H.; Li, X.; Zhou, H. A high-energy-density and long-life initial-anode-free lithium battery enabled by a Li2O sacrificial agent. Nat. Energy 2021, 6, 653–662. [Google Scholar] [CrossRef]
  92. Guo, R.; Gallant, B.M. Li2O Solid Electrolyte Interphase: Probing Transport Properties at the Chemical Potential of Lithium. Chem. Mater. 2020, 32, 5525–5533. [Google Scholar] [CrossRef]
  93. Lowe, J.S.; Siegel, D.J. Modeling the Interface between Lithium Metal and Its Native Oxide. ACS Appl. Mater. Interfaces 2020, 12, 46015–46026. [Google Scholar] [CrossRef]
  94. Zheng, H.; Liu, Y.; Mao, S.X.; Wang, J.; Huang, J. Beam-assisted large elongation of in situ formed Li2O nanowires. Sci. Rep. 2012, 2, 542. [Google Scholar] [CrossRef]
  95. Attaa, T.S.; Abd, A.N.; Zoory, M.J. Fabrication of Al/Li2O/PSi/ Si/Al heterojunction for photodetector and solar cell applications. Mater. Today Proc. 2021, 49, 3607–3614. [Google Scholar] [CrossRef]
  96. Vijayalakshmi, L.; Kumar, K.N.; Kumar, G.B.; Hwang, P. Structural, dielectric and photoluminescence properties of Nd3+ doped Li2O-LiF-B2O3-ZnO multifunctional optical glasses for solid state laser applications. J. Non-Crystalline Solids 2017, 475, 28–37. [Google Scholar] [CrossRef]
  97. Al Hussan, S.M.A.; Bakr, N.A.; Abd, A.N. Improve the Performance of Porous Silicon for solar application by the embedding of Lithium Oxide nanoparticle. IOP Conf. Ser. Mater. Sci. Eng. 2020, 928. [Google Scholar] [CrossRef]
  98. Yang, W.; Kim, D.Y.; Yang, L.; Li, N.; Tang, L.; Amine, K.; Mao, H. Oxygen-Rich Lithium Oxide Phases Formed at High Pressure for Potential Lithium–Air Battery Electrode. Adv. Sci. 2017, 4, 1600453. [Google Scholar] [CrossRef] [Green Version]
  99. Al-Ubaidi, M.R.; Anno, J.N. The Production of Lithium Oxide Microspheres from the Disintegration of a Liquid Jet. Fusion Technol. 1989, 16, 464–468. [Google Scholar] [CrossRef]
  100. Abo-Mosallam, H.; Ibrahim, S.; Mahdy, E.A. New high nickel-containing glass-ceramics based on Li2O–CaO–SiO2 eutectic (954 °C) system for magnetic applications. J. Non-Crystalline Solids 2022, 580, 121385. [Google Scholar] [CrossRef]
  101. Jamil, S.M.; Othman, M.H.D.; Rahman, M.A.; Jaafar, J.; Ismail, A.F.; Mohamed, M.A. Role of lithium oxide as a sintering aid for a CGO electrolyte fabricated via a phase inversion technique. RSC Adv. 2015, 5, 58154–58162. [Google Scholar] [CrossRef]
  102. Edström, K.; Herstedt, M.; Abraham, D.P. A new look at the solid electrolyte interphase on graphite anodes in Li-ion batteries. J. Power Sources 2006, 153, 380–384. [Google Scholar] [CrossRef]
  103. Aurbach, D.; Dekker, M. Nonaqueous Electrochemistry; CRC Press: Boca Raton, FL, USA, 1999. [Google Scholar]
  104. Peled, E.; Menkin, S. Review—SEI: Past, Present and Future. J. Electrochem. Soc. 2017, 164, A1703–A1719. [Google Scholar] [CrossRef]
  105. Peled, E.; Golodnitsky, D.; Penciner, J. The Anode/Electrolyte Interface. In Handbook of Battery Materials; Wiley-VCH: Weinheim, Germany, 1998; pp. 419–456. [Google Scholar] [CrossRef]
  106. Goodenough, J.B.; Hong, H.Y.-P.; Kafalas, J.A. Fast Na+-ion transport in skeleton structures. Mater. Res. Bull. 1976, 11, 203–220. [Google Scholar] [CrossRef]
  107. Roy, S.; Kumar, P.P. Influence of Cationic ordering on ion transport in NASICONs: Molecular dynamics study. Solid State Ionics 2013, 253, 217–222. [Google Scholar] [CrossRef]
  108. Guin, M.; Tietz, F. Survey of the transport properties of sodium superionic conductor materials for use in sodium batteries. J. Power Sources 2015, 273, 1056–1064. [Google Scholar] [CrossRef]
  109. Susman, S.; Delbecq, C.; Brun, T.; Prince, E. Fast ion transport in the NASICON analog Na3Sc2(PO4)3: Structure and conductivity. Solid State Ionics 1983, 9–10, 839–844. [Google Scholar] [CrossRef]
  110. Hong, H.Y.-P. Crystal structures and crystal chemistry in the system Na1+xZr2SixP3−xO12. Mater. Res. Bull. 1976, 11, 173–182. [Google Scholar] [CrossRef]
  111. Jiang, T.; Wei, Y.; Pan, W.; Li, Z.; Ming, X.; Chen, G.; Wang, C. Preparation and electrochemical studies of Li3V2(PO4)3/Cu composite cathode material for lithium ion batteries. J. Alloys Compd. 2009, 488, L26–L29. [Google Scholar] [CrossRef]
  112. Feng, J.; Lu, L.; Lai, M. Lithium storage capability of lithium ion conductor Li1.5Al0.5Ge1.5(PO4)3. J. Alloys Compd. 2010, 501, 255–258. [Google Scholar] [CrossRef]
  113. Yang, K.-Y.; Wang, J.-W.; Fung, K.-Z. Roles of lithium ions and La/Li-site vacancies in sinterability and total ionic conduction properties of polycrystalline Li3xLa2/3−xTiO3 solid electrolytes (0.21 ≤ 3x ≤ 0.50). J. Alloys Compd. 2008, 458, 415–424. [Google Scholar] [CrossRef]
  114. Feng, J.; Xia, H.; Lai, M.O.; Lu, L. NASICON-structured LiGe2(PO4)3 with improved cyclability for high-performance lithium batteries. J. Phys. Chem. C 2009, 113, 20514–22052. [Google Scholar] [CrossRef]
  115. Govindaraj, G. Synthesis, characterization and ion dynamic studies of NASICON type glasses. Solid State Ionics 2002, 147, 49–59. [Google Scholar] [CrossRef]
  116. Zhang, Q.; Wen, Z.; Liu, Y.; Song, S.; Wu, X. Na+ ion conductors of glass–ceramics in the system Na1+xAlxGe2−xP3O12(0.3 ≤ x ≤ 1.0). J. Alloys Compd. 2009, 479, 494–499. [Google Scholar] [CrossRef]
  117. Anantharamulu, N.; Rao, K.K.; Vithal, M.; Prasad, G. Preparation, characterization, impedance and thermal expansion studies of Mn0.5MSb(PO4)3 (M = Al, Fe and Cr). J. Alloys Compd. 2009, 479, 684–691. [Google Scholar] [CrossRef]
  118. Fu, J. Superionic conductivity of glass-ceramics in the system Li2O-Al2O3-TiO2-P2O5. Solid State Ionics 1997, 96, 195–200. [Google Scholar] [CrossRef]
  119. Li, X.; Qu, M.; Yu, Z. Structural and electrochemical performances of Li4Ti5−xZrxO12 as anode material for lithium-ion batteries. J. Alloys Compd. 2009, 487, L12–L17. [Google Scholar] [CrossRef]
  120. Liu, S.-Q.; Li, S.-C.; Huang, K.-L.; Gong, B.-L.; Zhang, G. Kinetic study on Li2.8(V0.9Ge0.1)2(PO4)3 by EIS measurement. J. Alloys Compd. 2008, 450, 499–504. [Google Scholar] [CrossRef]
  121. Yao, X.; Xie, S.; Nian, H.; Chen, C. Spinel Li4Ti5O12 as a reversible anode material down to 0 V. J. Alloys Compd. 2008, 465, 375–379. [Google Scholar] [CrossRef]
  122. Zhang, C.; Tu, J.; Huang, X.; Yuan, Y.; Wang, S.; Mao, F. Preparation and electrochemical performances of nanoscale FeSn2 as anode material for lithium ion batteries. J. Alloys Compd. 2008, 457, 81–85. [Google Scholar] [CrossRef]
  123. Arbi, K.; Rojo, J.M.; Sanz, J. Lithium mobility in titanium based Nasicon Li1+xTi2−xAlx(PO4)3 and LiTi2−x Zrx(PO4)3 materials followed by NMR and impedance spectroscopy. J. Eur. Ceram. Soc. 2007, 27, 4215–4218. [Google Scholar] [CrossRef]
  124. Peña, J.S.; Sandu, I.; Joubert, O.; Pascual, F.S.; Areán, C.O.; Brousse, T. Electrochemical reaction between lithium and β-quartz GeO2. Electrochem. Solid-State Lett. 2004, 7, A278. [Google Scholar] [CrossRef]
  125. Lee, H.; Kim, M.G.; Choi, C.H.; Sun, Y.K.; Yoon, C.S.; Cho, J. Surface-stabilized amorphous germanium nanoparticles for lithium-storage material. J. Phys. Chem. B 2005, 109, 20719–20723. [Google Scholar] [CrossRef]
  126. DeWees, R.; Wang, H. Synthesis and Properties of NaSICON-type LATP and LAGP Solid Electrolytes. ChemSusChem 2019, 12, 3713–3725. [Google Scholar] [CrossRef]
  127. Kazakevičius, E.; Šalkus, T.; Dindune, A.; Kanepe, Z.; Ronis, J.; Kežionis, A.; Kazlauskienė, V.; Miškinis, J.; Selskienė, A.; Selskis, A. La-doped LiTi2(PO4)3 ceramics. Solid State Ionics 2008, 179, 51–56. [Google Scholar] [CrossRef]
  128. Rohde, M.; Cui, Y.; Ziebert, C.; Seifert, H.J. Thermophysical Properties of Lithium Aluminum Germanium Phosphate with Different Compositions. Int. J. Thermophys. 2020, 41, 31. [Google Scholar] [CrossRef] [Green Version]
  129. Schroeder, M.; Glatthaar, S.; Binder, J.R. Influence of spray granulation on the properties of wet chemically synthesized Li1.3Ti1.7Al0.3(PO4)3 (LATP) powders. Solid State Ionics 2011, 201, 49–53. [Google Scholar] [CrossRef]
  130. Fergus, J.W. Ceramic and polymeric solid electrolytes for lithium-ion batteries. J. Power Sources 2010, 195, 4554–4569. [Google Scholar] [CrossRef]
  131. Francisco, B.E.; Stoldt, C.R.; M’Peko, J.-C. Lithium-Ion Trapping from Local Structural Distortions in Sodium Super Ionic Conductor (NASICON) Electrolytes. Chem. Mater. 2014, 26, 4741–4749. [Google Scholar] [CrossRef]
  132. Cretin, M.; Fabry, P. Comparative study of lithium ion conductors in the system Li1+xAlxA2−xIV (PO4)3 with AIV = Ti or Ge and 0 ≤ x ≤ 0·7 for use as Li+ sensitive membranes. J. Eur. Ceram. Soc. 1999, 19, 2931–2940. [Google Scholar] [CrossRef]
  133. Dumon, A.; Huang, M.; Shen, Y.; Nan, C.W. High Li ion conductivity in strontium doped Li7La3Zr2O12 garnet. Solid State Ionics 2013, 243, 36–41. [Google Scholar] [CrossRef]
  134. He, K.; Zu, C.; Wang, Y.; Han, B.; Yin, X.; Zhao, H.; Liu, Y.; Chen, J. Stability of lithium ion conductor NASICON structure glass ceramic in acid and alkaline aqueous solution. Solid State Ionics 2013, 254, 78–81. [Google Scholar] [CrossRef]
  135. Chowdari, B. XPS and ionic conductivity studies on Li2O–Al2O3–(TiO2 or GeO2)–P2O5 glass–ceramics. Solid State Ionics 2000, 136–137, 1067–1075. [Google Scholar] [CrossRef]
  136. Aboulaich, A.; Bouchet, R.; Delaizir, G.; Seznec, V.; Tortet, L.; Morcrette, M.; Rozier, P.; Tarascon, J.-M.; Viallet, V.; Dollé, M. A New Approach to Develop Safe All-Inorganic Monolithic Li-Ion Batteries. Adv. Energy Mater. 2011, 1, 179–183. [Google Scholar] [CrossRef]
  137. Arbi, K.; Bucheli, W.; Jiménez, R.; Sanz, J. High lithium ion conducting solid electrolytes based on NASICON Li1+xAlxM2−x(PO4)3 materials (M = Ti, Ge and 0 ≤ x ≤ 0.5). J. Eur. Ceram. Soc. 2015, 35, 1477–1484. [Google Scholar] [CrossRef]
  138. Shi, J.; Xia, Y.; Han, S.; Fang, L.; Pan, M.; Xu, X.; Liu, Z. Lithium ion conductive Li1.5Al0.5Ge1.5(PO4)3 based inorganic–organic composite separator with enhanced thermal stability and excellent electrochemical performances in 5 V lithium ion batteries. J. Power Sources 2015, 273, 389–395. [Google Scholar] [CrossRef]
  139. Liu, Y.; Li, C.; Li, B.; Song, H.; Cheng, Z.; Chen, M.; He, P.; Zhou, H. Germanium Thin Film Protected Lithium Aluminum Germanium Phosphate for Solid-State Li Batteries. Adv. Energy Mater. 2018, 8, 1702374. [Google Scholar] [CrossRef]
  140. Vernoux, P.; Gaillard, F.; Lopez, C.; Siebert, E. Coupling catalysis to electrochemistry: A solution to selective reduction of nitrogen oxides in lean-burn engine exhausts? J. Catal. 2003, 217, 203–208. [Google Scholar] [CrossRef]
  141. Roy, R.; Vance, E.; Alamo, J. [NZP], a new radiophase for ceramic nuclear waste forms. Mater. Res. Bull. 1982, 17, 585–589. [Google Scholar] [CrossRef]
  142. Nakayama, S.; Itoh, K. Immobilization Technique of Cesium to HZr2(PO4)3Using an Autoclave. J. Nucl. Sci. Technol. 2003, 40, 631–633. [Google Scholar] [CrossRef]
  143. Scheetz, B.; Agrawal, D.; Breval, E.; Roy, R. Sodium zirconium phosphate (NZP) as a host structure for nuclear waste immobilization: A review. Waste Manag. 1994, 14, 489–505. [Google Scholar] [CrossRef]
  144. Li, B.; Qing, Z.; Li, Y.; Li, H.; Zhang, S. Effect of CaO content on structure and properties of low temperature co-fired glass–ceramic in the Li2O–Al2O3–SiO2 system. J. Mater. Sci. Mater. Electron. 2016, 27, 2455–2459. [Google Scholar] [CrossRef]
  145. Li, B.; Duan, D.; Long, Q. Effects of TiO2 on microstructures and properties of Li2O–Al2O3–SiO2 glass–ceramics for LTCC substrates. J. Mater. Sci. Mater. Electron. 2016, 27, 7240–7245. [Google Scholar] [CrossRef]
  146. Soares, V.O.; Peitl, O.; Zanotto, E.D. New Sintered Li2 O-Al2 O3 -SiO2 Ultra-Low Expansion Glass-Ceramic. J. Am. Ceram. Soc. 2013, 96, 1143–1149. [Google Scholar] [CrossRef]
  147. Chen, M.; He, F.; Shi, J.; Xie, J.; Yang, H.; Wan, P. Low Li2O content study in Li2O-Al2O3-SiO2 glass-ceramics. J. Eur. Ceram. Soc. 2019, 39, 4988–4995. [Google Scholar] [CrossRef]
  148. Braga, M.H.; Grundish, N.S.; Murchison, A.J.; Goodenough, J.B. Alternative strategy for a safe rechargeable battery. Energy Environ. Sci. 2016, 10, 331–336. [Google Scholar] [CrossRef]
  149. Danzi, F.; Salgado, R.; Oliveira, J.; Arteiro, A.; Camanho, P.; Braga, M. Structural Batteries: A Review. Molecules 2021, 26, 2203. [Google Scholar] [CrossRef] [PubMed]
  150. Xia, W.; Zhao, Y.; Zhao, F.; Adair, K.; Zhao, R.; Li, S.; Zou, R.; Zhao, Y.; Sun, X. Antiperovskite Electrolytes for Solid-State Batteries. Chem. Rev. 2022, 122, 3763–3819. [Google Scholar] [CrossRef] [PubMed]
Figure 1. Crystal structures for the studied insulators. Dielectric oxides: (a) SiO2 trapezohedral, P3221 (sg# 154); red spheres: O; (b) MgO cubic, Fm-3m, (sg# 225); wine-red spheres: O; (c) Li2O cubic, Fm-3m, (sg# 225); wine-red spheres: O; dielectric solid electrolyte: (d) room temperature Na3Zr2Si2PO12–NASICON, monoclinic, C2/c (sg#15); octahedral: ZrO6; tetrahedral: PO4/SiO4 sharing common corners; (e) Li1.5Al0.5Ge1.5(PO4)3–LAGP, rhombohedral, R-3c (sg#167); octahedral: AlO6/GeO6; tetrahedral: PO4; orange spheres: Li; yellow spheres: O. (f) Li2.99Ba0.005ClO–Li+-glass optimized structure using ab initio molecular dynamics at 300 K from the initial cubic structure Pm-3m (sg# 221). octahedral: OLi6; green-blue (small) sphere: Ba; green spheres: Cl. Note: the dielectrics were chosen due to their applications and relative work functions: WF(SiO2) > WF(Cu) > WF(Al), WF(Cu) > WF(Al) > WF(MgO), and WF(Cu) > WF(Li2O) > WF(Al).
Batteries 08 00232 g001
Figure 2. (a) Schematic interplay of the constituents of a battery cell in operando; (b) absolute chemical potentials having as reference the standard hydrogen electrode (SHE) and the vacuum at 0 eV in the physical scale that relates more directly with the work functions of the materials; (c) potential energy E p showing positive polarization at both interfaces of a cell containing a dielectric. The maximum corresponding to the activation energy, E a , is a metastable configuration where both ends have equal polarization signs; (d) extended electrode highly resistive cells, where the contact is made difficult by quantum wells/barriers, and each electrode aligns the surface chemical potentials with the dielectric, independently; but, along the cell, there is at least one point for which all the chemical potentials equalize. The latter energy may correspond to the Fermi level or electrochemical potential. The internal contact happens through the electric field, made possible by SPP; (e) photo of a Zn/SiO2/Cu cell used to perform the SKP analysis when connected to a resistor. Note: the Al/insulator/Cu used had Al and Cu tapes connected to the resistor and SKP instrument to avoid additional heterojunctions.
Batteries 08 00232 g002
Figure 3. Topography and surface chemical potentials for an Al/SiO2/Cu cell show different energies for the equalization of the surface chemical potentials of the heterojunctions Cu/SiO2, SiO2/Al, Al/SiO2, and Zn/SiO2: (a) straight band bending denoted by the SiO2 surface chemical potential when Cu was connected to the SKP; (b) straight band bending denoted by the SiO2 surface chemical potential when Al is connected to the SKP mirroring (a); (ce) extended SKP analysis showing dielectric behavior of surface chemical potential of SiO2 and a positive–negative–positive polarization distribution on the Cu that transitions almost seemingly to the SiO2 polarized positive–negative–positive, and, finally, the Al positive-negative; (f) Zn/SiO2/Cu with positive–negative–positive polarization of the dielectric (SiO2).
Batteries 08 00232 g003
Figure 4. Topography and surface chemical potentials for an Al/MgO/Cu cell show different energies for the equalization of the surface chemical potentials of the heterojunctions Cu/MgO, MgO/Al, and Al/MgO: (a,b) extended SKP analyses showing n-type semiconductor band bending denoted by the surface chemical potential of MgO when Cu was connected to the SKP; equalization of Cu/MgO surface chemical potentials with the Al’s is made through a positively polarized spike at the surface of the Al; (c) straight band bending denoted by the surface chemical potential of MgO when Al is connected to the SKP mirroring (a); (d) SKP analyses showing the differences for when the Al or the Cu are connected to the instrument. The electrode that is connected to the SKP is able to achieve similar surface chemical potentials to the absolute chemical potentials widely available in the literature represented by [38]; for example, Al reaches −1.45 V (SHE) in (c) for a tabulated value of −1.66 V (SHE) [38].
Batteries 08 00232 g004
Figure 5. Topography and surface chemical potentials for an Al/Li2O/Cu cell show slightly different energies for the equalization of the surface chemical potentials of the heterojunctions Cu/Li2O and Li2O/Al. (a,b) SKP analysis showing p-type semiconductor band bending of Li2O when Cu was connected to the SKP; (c) p-type band bending observed in the surface potential of Li2O when Al is connected to the SKP showing small interfacial resistance at both interfaces; (d) SKP extended analysis not showing a pronounced p-type semiconductor band bending but rather a flat surface chemical potential of Cu/Li2O with a step toward the Al, reflecting internal interfacial resistance; (e) electron localization function (ELF): isosurface (3D) (ELF = 0.28) and slice (2D) showing delocalized electrons (ELF = 0.50) at the (001) surface of Li2O.
Batteries 08 00232 g005
Figure 6. Topography and surface chemical potentials for an Al/Na3Zr2Si2PO12–NASICON/Cu cell show just one energy for the equalization of the surface chemical potentials for both heterojunctions; (a,b) SKP analysis showing a slight tendency from Na3Zr2Si2PO12 to perform as an n-type semiconductor with smooth band bending when Cu was connected to the SKP at OCV; the cell also shows the extreme bending of the Al surface chemical potential towards equalization of the surface chemical potentials not achieved up to 2.4 cm; (c,d) Na3Zr2Si2PO12 p-type band bending while the cell is set to discharge when a 980 Ω resistor was connected closing the circuit. A potential difference of 0.03 V was then obtained between Cu//Al. The difference in surface chemical potentials between OCV and the closed circuit relates to the electrodes bending surface chemical potential, which is much more extreme at OCV; Na3Zr2Si2PO12 behaves as an n-type semiconductor with small band bending towards the Al at OCV and as p-type while set to discharge with the resistor manifested by slight band bending towards the Cu; SKP extended analysis displaying a pronounced interfacial internal resistance at NASICON/Al. We highlight that these experiments were executed at <40 °C, and therefore, the configuration of the cell’s surface chemical potentials at 50 °C—an optimal temperature for the performance of all-solid-state electrolytes in batteries—might differ.
Batteries 08 00232 g006
Figure 7. Topography and surface chemical potentials for an Al/Li1.5Al0.5Ge1.5(PO4)3–LAGP/Cu cell show just one energy for the equalization of the surface chemical potentials for both heterojunctions, as observed with Na3Zr2Si2PO12; (a,b) SKP analysis showing clear p-type semiconductor band bending when Cu was connected to the SKP at OCV; they also show the extreme bending of the Al surface chemical potential towards equalization of the surface chemical potentials; (c,d) p-type band bending while almost showing no difference to the OCV configuration when a 980 Ω resistor was connected closing the circuit. A potential difference of 0.1 V was obtained between Cu//Al. The difference between OCV and the closed circuit relates to the electrodes bending. SKP extended analysis displaying a pronounced interfacial internal resistance at LAGP/Al. We highlight that these experiments were executed at <40 °C, and therefore, the configuration of the cell’s surface chemical potentials at 50 °C—an optimal temperature for the performance of all-solid-state electrolytes in batteries—might differ.
Batteries 08 00232 g007
Figure 8. Topography and surface chemical potentials for an Al/Li2.99Ba0.005ClO (Li+-glass)/Cu cell; (ae) SKP analysis showing evident propagation of the SPP parallel strips (solitons) from the Cu to the Al through the Li+-glass surface; (fh) show different perspectives of the propagation of a plasmon solitons from the Cu electrode at higher potential (Physical scale) to the Al electrode at lower potential through tunneling, diffusion, and drift, when the circuit is closed by a resistor load; the Al is the electrode in contact with the SKP; there is not a considerable variation of the surface chemical potential of the Cu, but the Al dropped down to +0.93 V (SHE).
Batteries 08 00232 g008
Figure 9. Cyclic voltammetry (CV) and impedance spectroscopy (EIS) for an Al/Li2.99Ba0.005ClO (Li+-glass)/Cu cell. (a) I-V plots (2 mV·s−1) showing initial polarization of 0.08 to 0.100 mA, at 25 °C, after SKP analyses ( 0.77 V O C ( V )   1.04 ) ; (b) EIS plot showing the impedance of the cell at 25 °C; R2 = 2.2 × 10⁶ Ω corresponding to a conductivity through the surface of Li+-glass of 2.4×10⁻⁷ S·cm−1.
Batteries 08 00232 g009
Figure 10. Ab initio: average potentials for metal electrodes and dielectrics were obtained after the simulation of the corresponding surfaces after optimization of the corresponding crystal structures. The macro potentials correspond to integration over 10 Å; (a) for (001) simulated surface of Cu, and (b) for (010) simulated surface of Al; for (001) simulated surfaces of (c) SiO2; (d) MgO; (e) Li2O. Note: The (001) surface average potential for Al was obtained in [31].
Batteries 08 00232 g010
Figure 11. Ab initio: average potentials for solid electrolytes. The macro potentials correspond to integration over 10 Å; average potentials for (001) simulated surfaces and (a) electronic band structure of Na3Zr2Si2PO12 showing a band gap of 4.60 eV, obtained for the bulk superstructure (P1) using DFT; (b) average potentials for the (001) and (010) simulated surfaces of Na3Zr2Si2PO12; (c) electronic band structure of Li1.5Al0.5Ge1.5(PO4)3 showing a band gap of 4.04 eV, obtained for the bulk superstructure (P1) using DFT; average potentials for (001) simulated surface of (d) Na3Zr2Si2PO12; (e) Li1.5Al0.5Ge1.5(PO4)3; (f) Li2.99Ba0.005ClO (Li79BaCl27O27) Note: The (001) surface average potential for Al was obtained in [31]; the electronic band structures for Na3Zr2Si2PO12 and Li1.5Al0.5Ge1.5(PO4)3 were calculated for triclinic (P1) as these phases are disordered, and therefore have to be simulated in a superstructure although respecting atom positions, cell volume and shape.
Batteries 08 00232 g011
Table 1. Physical properties of the studied dielectrics and solid electrolytes.
MaterialTypeDielectric Constant at RT and 0.1 Hz (εr)Ionic Conductivity at RT (S·cm−1)Refs.
SiO2Dielectric3.9-[19]
MgODielectric1010−36[20,21]
Li2ODielectric8–1110−12[22]
Na3Zr2Si2PO12 (NASICON)Solid Electrolyte103–10410−4[23,24]
Li1.5Al0.5Ge1.5(PO4)3 (LAGP)Solid Electrolyte-10–4–10–3[25]
Li2.99Ba0.005ClO (Li+ glass)Ferroelectric Solid-electrolyte107–10910−2[26,27]
Table 2. Physical information is extracted from AFM, SKP, electrochemical analysis, and ab initio simulations for the cell when the insulator is a dielectric oxide or a solid electrolyte. Note: calculated: μ C u = +0.14 V, SHE [31]; experimental: μ C u = +0.12 V, SHE; calculated: μ A l = +0.25 [31] to +0.63 V, SHE; experimental: μ A l = −1.01 V, SHE; calculated μ Z n = −0.95 V, SHE [31]; experimental: μ Z n = −0.42 V, SHE.
Cell
Insulator:
d = 5.5 mm
S = 22 × 4.7 mm2
Circuit
Open OCV or close with an external resistance R
Heterojunction equilibrium
and correspondent
surface chemical potential
(it may include parts of the electrode away from the surface that equalize as well)
Heterojunctions surface chemical potential difference
(V)
Maximum surface potential difference for the
electrodes at the interface with the insulator
(V)
- Bulk potential difference for the cell
- Temperature
- Dew point, DP
Dielectric: SiO2 [ΔVSiO2(Cu) − ΔVSiO2(Al) = 0.60-(0.77) = 0.17 V Figure 3a; ΔVSiO2(Al) − ΔVSiO2(Cu) = 0.44–0.59 = −0.15 V] Figure 3b
Calculated surface chemical potential (ab initio), µ = +0.99 V, SHE; experimental: µ = +0.73 V, SHE
Cu/SiO2/AlOCVCu1…Cu2/SiO2
0.22 V
0.360.65--
Al/SiO2/CuOCVAl1…Al2/SiO2
−0.15 V
0.360.73--
Al/SiO2/CuOCVSiO2/Cu1…Cu2
0.21 V
Cu/SiO2/AlOCVCu1…Cu2/SiO2
0.44 V
0.530.59Vi: 12 mV
Vf: 13 mV
38 °C
DP: <10 °C
Cu/SiO2/AlOCVCu…SiO2/Al
0.09 V
Zn/SiO2/CuOCVZn/SiO2…Cu1…Cu2
−0.059 V
0.330.30--
Zn/SiO2/CuOCVSiO2/Cu
0.29 V
Dielectric: MgO [ΔVMgO(Al) − ΔVMgO(Cu) = −1.56-(−1.03) = −0.53 V; ΔVMgO(Cu) − ΔVMgO(Al) = −0.27-(−0.61) = 0.34 V] Figure 4d
Calculated surface chemical potential (ab initio), µ = −1.18 V, SHE; experimental: µ = −1.12 V, SHE
Cu/MgO/AlOCVCu1…Cu2/MgO…Al
0.60 V
0.430.50Vi: 9.5 mV
25 °C
Vf: 15 mV
36 °C
DP: <10 °C
Cu/MgO/AlOCVMgO/Al1…Al2
0.17 V
Al/MgO/CuOCVAl1…Al2/MgO
−1.24 V
0.430.92
Al/MgO/CuOCVAl1…MgO/Cu
−0.81 V
Cu/MgO/AlOCVCu1…Cu2/MgO…Al
0.01 V
0.360.46
Cu/MgO/AlOCVMgO/Al
−0.35 V
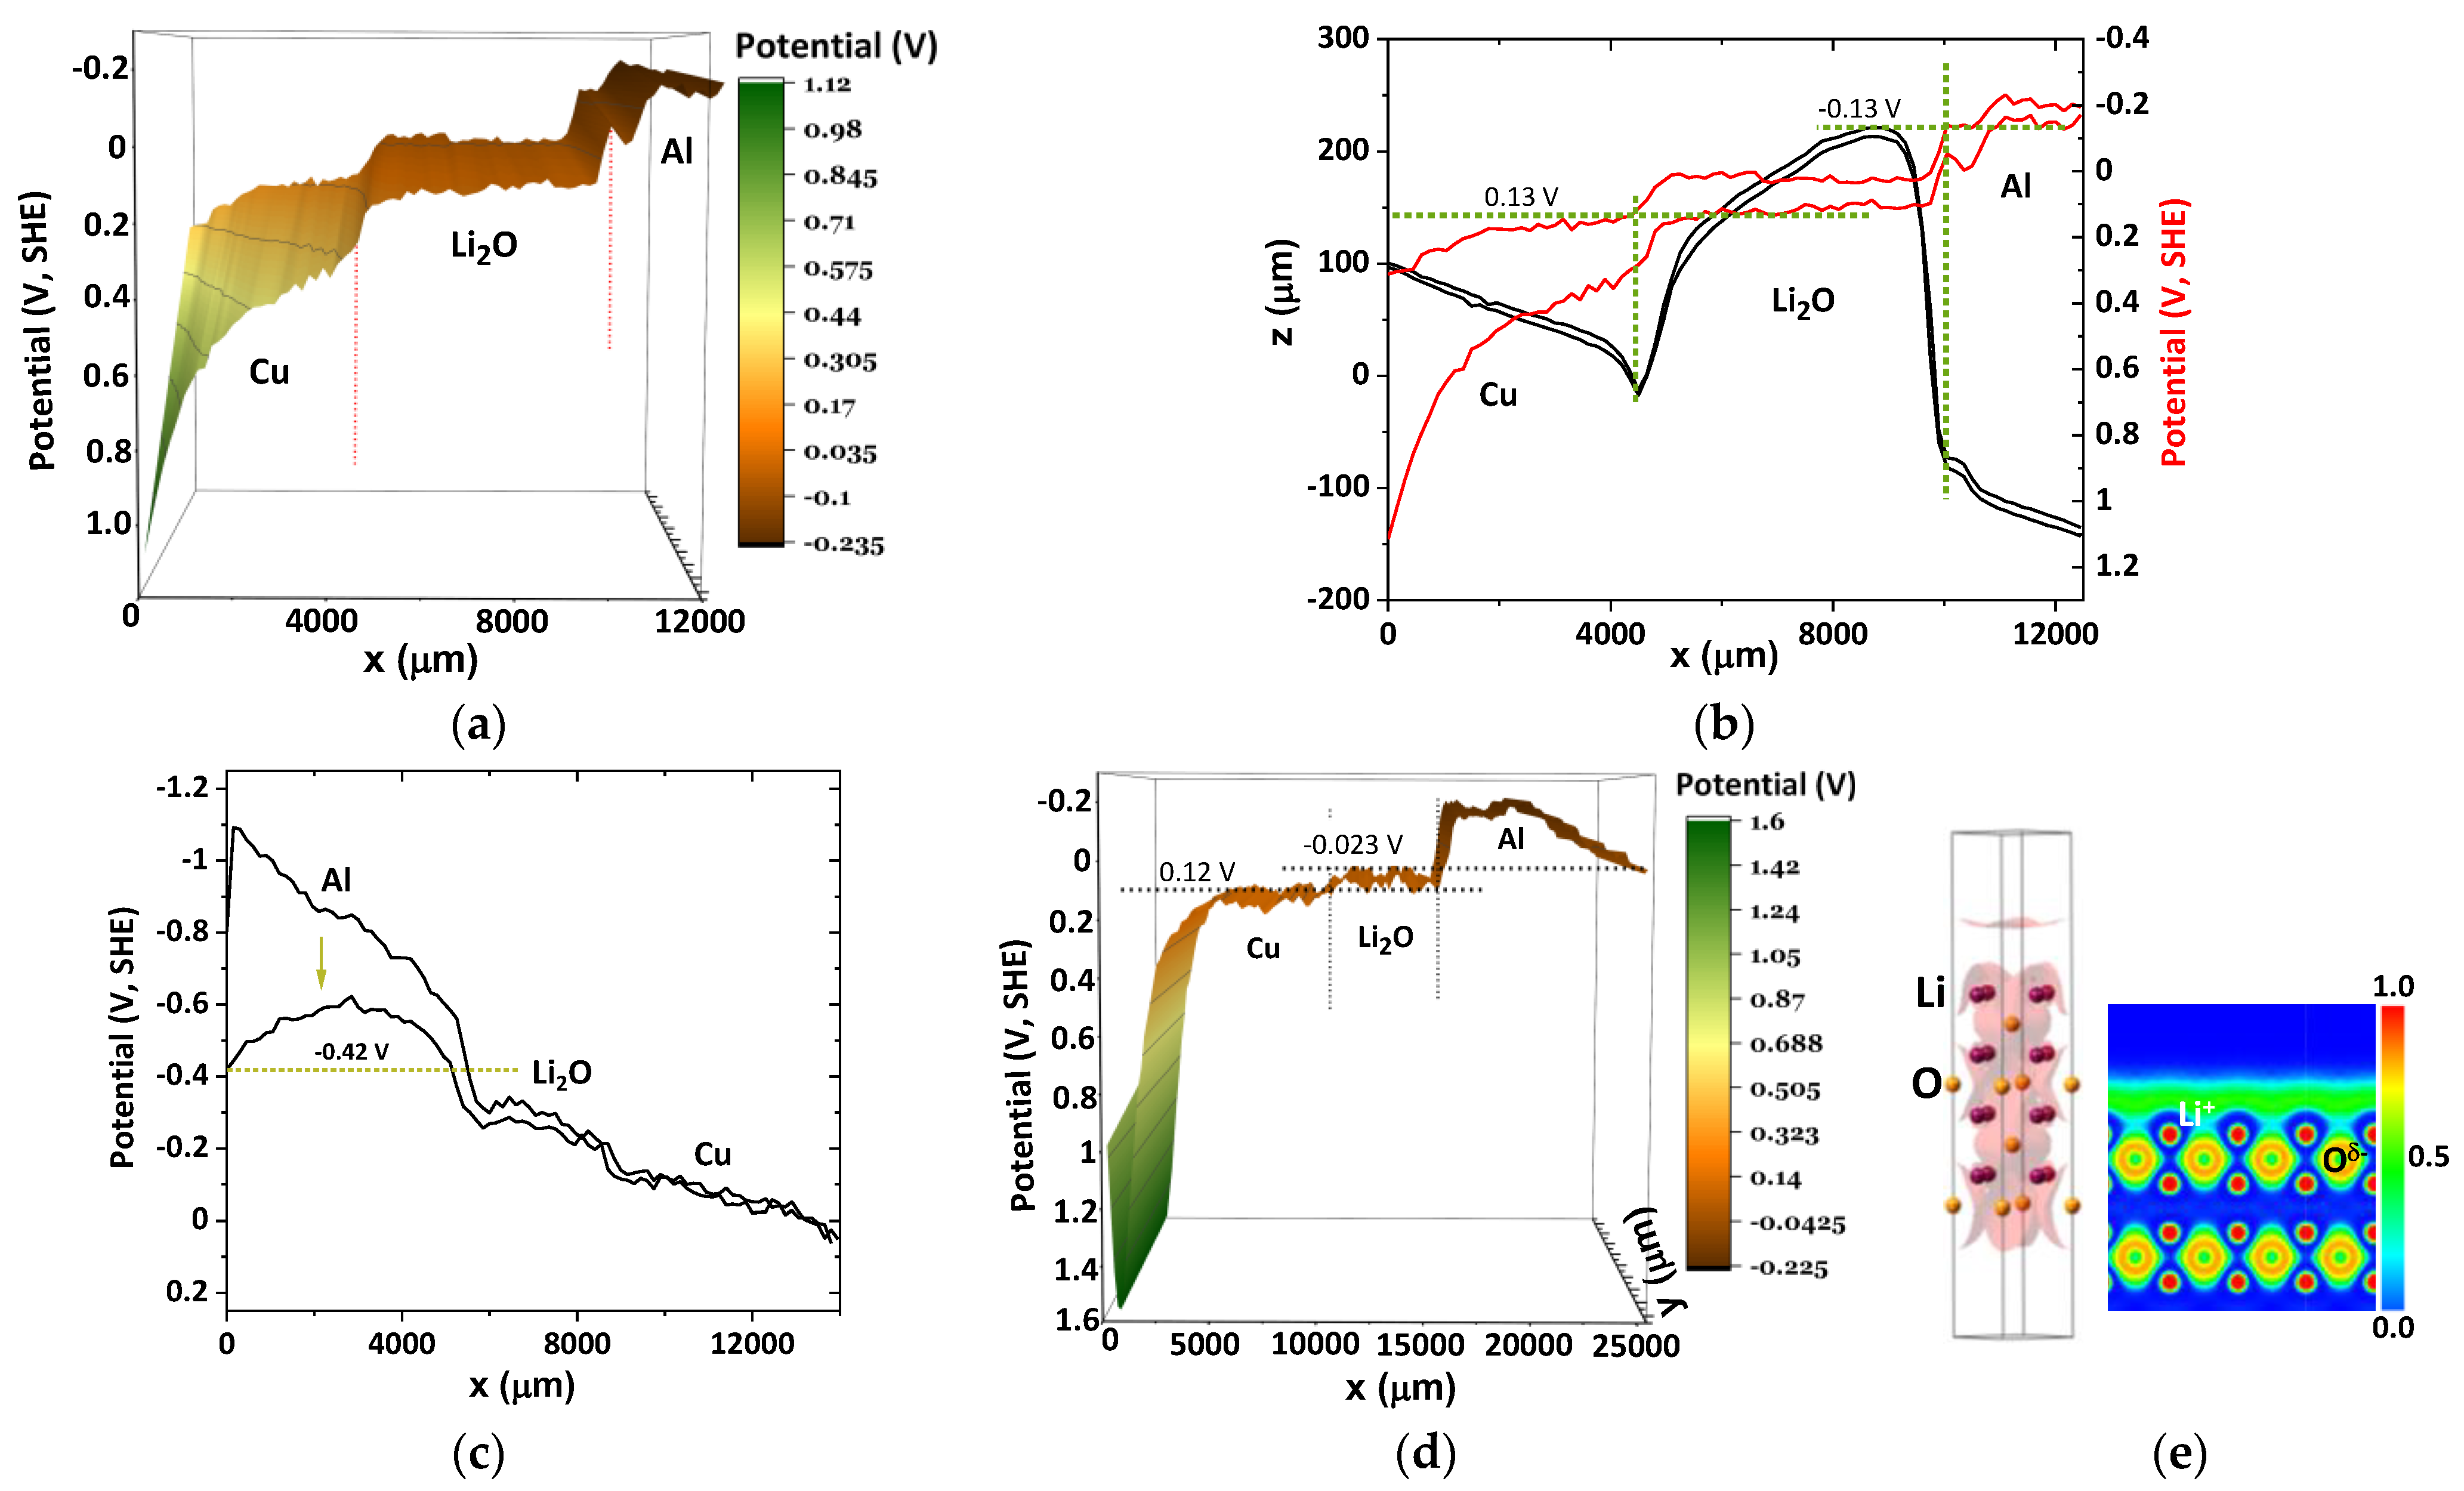
Dielectric: Li2O [ΔVLi2O(Cu) − ΔVLi2O(Al) ≈ 0 V] Figure 5b,d
Calculated surface chemical potential (ab initio), µ = +0.058 V, SHE; experimental: µ = +0.074 V, SHE
Cu/Li2O/AlOCVCu/Li2O…
0.13 V
0.260.37Vi: 11 mV
Vf: 10 mV
25 °C
DP: <10 °C
Cu/Li2O/AlOCVLi2O/Al1…Al2
−0.13 V
Al/Li2O/CuOCVAl1…Al2/Li2O
−0.36 V
0.230.42--
Al/Li2O/CuOCVLi2O/Cu
−0.13 V
Cu/Li2O/AlOCVCu1…Cu2/Li2O
0.12 V
0.140.38--
Cu/Li2O/AlOCVLi2O/Al1…Al2
−0.023 V
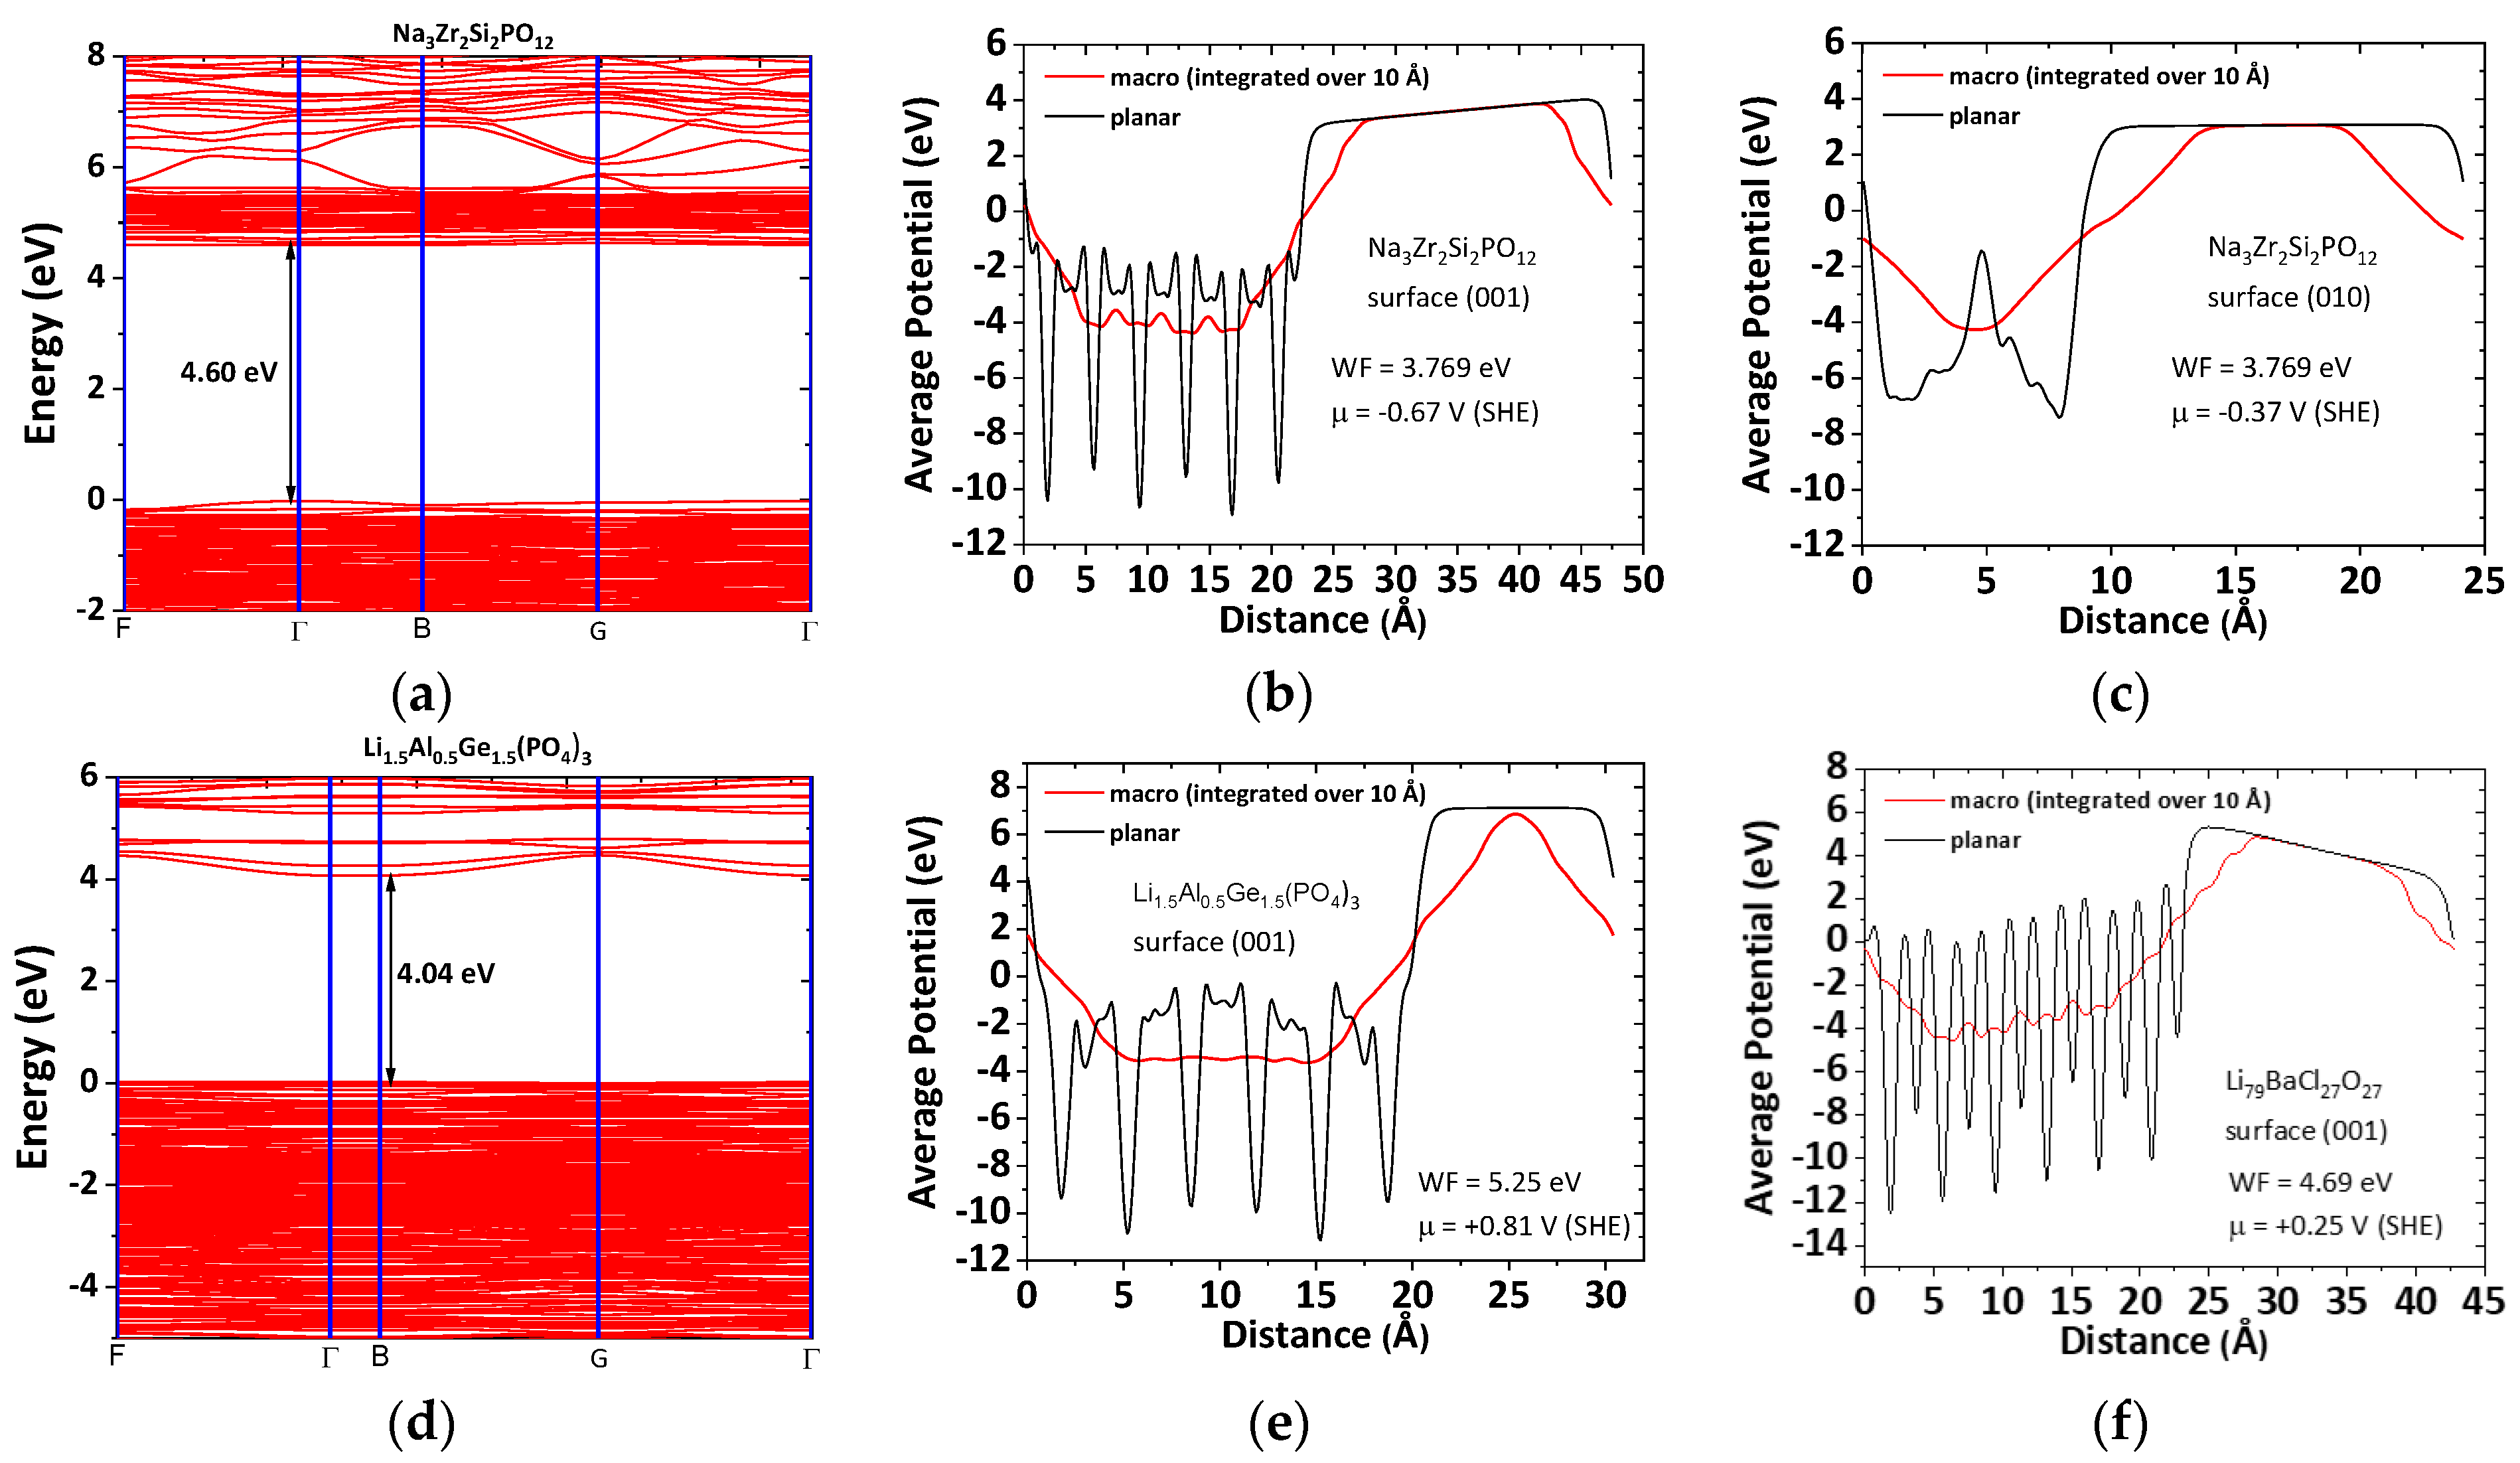
Solid electrolyte: Na3Zr2Si2PO12–NASICON [band bending as an n-type semiconductor, OCV] Figure 6a,b; solid electrolyte: [band bending as p-type semiconductor, R = 980 Ω] Figure 6c,d
Calculated surface chemical potential (ab initio), µ = −0.67 V (001) and −0.37 V (010), SHE; experimental: µ = +0.26 V, SHE
Cu/NASICON/AlOCVCu1…Cu2/NASICON/Al
0.21 V
~00.64Vi: 34 mV
Vf: 10 mV
34 °C
DP: <10 °C
Cu/NASICON/Al980 ΩCu1…Cu2/NASICON/Al
0.004 V
~00.58Vi: 29 mV
Vf: 30 mV
36 °C
DP: <10 °C
Solid electrolyte: Li1.5Al0.5Ge1.5(PO4)3–LAGP [band bending as a p-type semiconductor, OCV and R = 980 Ω] Figure 7
Calculated surface chemical potential (ab initio), µ = +0.81 V, SHE; experimental: µ = +0.52 V, SHE
Cu/LAGP/AlOCVCu1…Cu2/LAGP/Al
0.25 V
~00.67Vi: 13.47 mV
25 °C
Vf: 92.03 mV
35 °C
DP: <10 °C
Cu/LAGP/Al980 ΩCu1…Cu2/LAGP/Al
0.23 V
~00.67Vi: 92.73 mV
Vf: 0.100 V
36 °C
DP: <10 °C
Solid electrolyte and ferroelectric: Li2.99Ba0.005ClO–Li+ glass, Figure 8 (insulator thickness 5.5 mm)
Calculated surface chemical potential (ab initio), µ = +0.25 V, SHE; experimental: µ = +0.23 V, SHE
Cu/Li+glass/AlOCVCu1…Cu2/Li+glass1…2
0.21 V
+0.25+0.29Vi = 1.14 V
Vf = 0.89 V
36 °C
DP: <10 °C
Cu/Li+glass/AlOCVLi+glass/Al1…Al2
−0.04 V
Cu/Li+glass/AlOCVCu1…Cu2/Li+glass1…2
0.25 V
+0.13+0.087Vi = 0.89 V
Vf = 0.93 V
36 °C
DP: <10 °C
Cu/Li+glass/AlOCVLi+glass/Al1…Al2
0.12 V
Al/Li+glass/Cu980 ΩAl/Li+glass/Cu1…Cu2
0.25 V
−0.15−0.68Vi = 0.91 V
Vf = 0.94 V
36 °C
DP: <10 °C
Publisher’s Note: MDPI stays neutral with regard to jurisdictional claims in published maps and institutional affiliations.

