Article

Importance of Continuous and Simultaneous Monitoring of Both Electrode Voltages during Discharge/Charge Battery Tests: Application to Zn-Based Batteries

by
Sebastián Lorca
1,
Florencio Santos
1,
Javier Padilla
1,
J. J. López Cascales
2 and
Antonio J. Fernández Romero
1,*
1
Grupo de Materiales Avanzados para la Producción y Almacenamiento de Energía, Universidad Politécnica de Cartagena, Aulario II, Campus de Alfonso XIII, 30203 Cartagena, Spain
2
Departamento Ingeniería Quimica y Ambiental, Campus Alfonso XIII, Universidad Politécnica de Cartagena, Aulario C, Cartagena, 30203 Murcia, Spain
*
Author to whom correspondence should be addressed.
Batteries 2022, 8(11), 221; https://doi.org/10.3390/batteries8110221
Submission received: 22 September 2022 / Revised: 24 October 2022 / Accepted: 31 October 2022 / Published: 7 November 2022

Abstract

:
Two different Zn-based batteries are tested, simultaneously recording the voltage of the negative and positive electrodes during the discharge/charge processes to evidence the advantages of using a three-electrode cell, including a pseudo-reference electrode, with respect to the normally applied two electrodes system. The three-electrode cell allows us to identify in each moment which electrode reveals unexpected events during a battery test and thus to act on it accordingly. In this work, alkaline Zn/Bi2O3 and Zn/air batteries, including a pseudo-reference electrode, are subjected to different galvanostatic discharge/charge tests, highlighting several unforeseen changes and failures in both negative and positive electrodes. Thus, the usefulness of using a three-electrodes system in Zn-based batteries is revealed because it allows us to explain what the cause of the battery failure was and, if necessary, to act immediately. Finally, Spectroscopic Impedance measurements are also applied to a specific case of the Zn/Bi2O3 battery using the same three-electrode cell.

Graphical Abstract

1. Introduction

The normal procedure to test a battery and find out the values of capacity, energy, and efficiency that it can develop is carried out with a two-electrode cell. In this case, the voltage values are obtained referencing the working electrode voltage (named here, Ew) versus the counter one (named Ec). This way of working allows us to know how the battery progresses during the charge/discharge cycles until the battery fails. However, these tests do not give us information about the reasons why the battery failed, and therefore, it could only be inferred that the battery has stopped because the negative or positive electrode has been passivated or exhausted or because an important amount of electrolyte has been consumed.
To determine what has happened to cause the battery to fail, we need to perform a series of additional experimental measurements, such as characterizing the electrodes’ behavior separately in a half cell using the same electrolyte solution [1]. Thus, each electrode is examined separately in a three-electrode cell, which is composed of the battery electrode to explore as working, a reference electrode, and a non-polarizable counter (like a Pt foil). However, the information achieved by half-cell measurements about the behavior of the battery electrodes is obtained out of the battery operating conditions, which could change with respect to the real processes taking place in the battery, and hence, the conclusions drawn with this procedure could not be fully translatable to the real battery.
Alternatively, structure modifications of the surface electrodes could be followed during the battery test, coupling other techniques, such as XRD, XPS, AFM, RAMAN, etc. This way of proceeding has been named “in situ” or “in operando” technologies, as these measurements provide realistic information on the structural changes occurring in one electrode during the charge or/and discharge processes [2,3,4,5]. However, once again, we can only monitor one electrode at a time, i.e., we cannot know what is happening in both electrodes simultaneously.
In addition, a large number of ex situ techniques can also be used, with which the final structure of both electrodes can be examined after the battery has finished its useful life. In this case, in addition to the structural changes occurring on the surfaces when the electrodes are taken out from the solution and exposed to air if a slight washing of the electrode is carried out in order to minimally modify the surface, traces of the electrolyte solution may remain attached on the electrode surface, masking the results or causing interpretation errors. However, a deep washing may significantly modify the electrode surface, preventing an exact knowledge of how the electrode surface was left when the battery failed.
A three-electrode system, including a reference or pseudo-reference electrode, and using an appropriate electrochemical workstation allow us to know in real time what is happening on both electrode surfaces simultaneously while the charge or discharge of the battery is being carried out. Pseudo-reference electrodes, normally Ag or Pt wires, are frequently used when there is not enough room to fit a conventional reference electrode or the electrolyte is a non-aqueous solution [6,7]. Furthermore, the use of pseudo-reference electrodes has some advantages, such as their simplicity, low ohmic resistance effect, prevention of the liquid junction potential, and no contamination of electrolytes by solvent molecules or ions from the typical reference electrodes. Instead, the thermodynamic equilibrium is not reached in the pseudo-reference electrodes, although an amazing constant potential can be maintained during the tests [6].
Note that when a usual three-electrode cell measurement is carried out, only the working electrode potential is controlled, and direct information on what is happening in the counter cannot be extracted. The counter electrode behavior may be easily obtained by subtracting the Ew–Ec curve minus Ew one, but this information is not often found, and if so, it is usually carried out after the battery test is finished, losing the opportunity to respond immediately to an unexpected result or simply wasting time performing tests that can take an excessive time. This method has been used by Ocón et al. in Al/air batteries to confirm the useful life of the Al electrode [8]. Additionally, the same procedure has been adopted for other electrochemical systems. Lewis et al. studied the potential limits of polypyrrole actuators [9], while several aspects of electrochromic devices, including optimal working potential or degradation mechanisms, have been studied [10,11,12]. Moreover, the potentiostat can be outfitted to an external module that measures the voltage difference between the counter and the reference electrode. For instance, this method was used to analyze the electrogenerated chemiluminescence (ECL) at the counter electrode [13].
Despite the easiness of obtaining simultaneous information from both electrodes during a battery test, it is very surprising that the use of this tool in Zn-based batteries is so rare in the literature [8,14,15,16,17,18,19,20]. Recently, the use of the reference electrodes in LIBs was discussed [16], which allows designing specific protocols to avoid the Li plating onto the graphite electrodes, normally used as positive ones in LIBs [16]. Furthermore, Electrochemical Impedance Spectroscopic (EIS) measurements have been carried out using a three-electrode for LIBs [14,15,16] and a pouch sodium-ion battery [17]. However, only a few articles can be found where the three-electrode system is used during the testing of alkaline batteries [8,18]. B. Hwang et al. observed an increase in the Ew–Ec voltage after various 1.4% depth of discharge cycles of a Zn/air battery [18]. The separation of negative and positive electrode curves allowed them to observe an increase in the Zn electrode potential, which was interpreted as a rising in the amount of ZnO accumulated on it.
The aim of this work is to evidence the importance of monitoring both electrodes during the charge/discharge tests for Zn-based batteries, although this methodology may be applied to any type of battery. Two different alkaline Zn-based batteries were chosen: Zn/air and Zn/Bi2O3. For this purpose, the way to proceed during the galvanostatic charge/discharge cycles includes a pseudo-reference electrode, together with the positive electrode, as working, and the negative one, as counter, similar to a three-electrode cell. It should be noted that now, working and counter electrodes are those of the battery itself, and thus, an additional Pt foil is not included as a counter, as normally used in a half cell. Here, the Zn electrode has the function of counter, while the positive one, air or Bi2O3 electrodes, is the working electrode. Proceeding this way and using the adequate potentiostat/galvanostat equipment, we can follow the battery progress by three different curves while the experiment is progressing (see Figure 1 and Figure S1):
  • The normally obtained discharge/charge curve, i.e., Ew–Ec vs. capacity or time.
  • The working electrode voltage, Ew, in this case, the positive electrode of the battery, is referenced to the reference electrode vs. capacity or time.
  • The counter electrode voltage, Ec, here the negative electrode of the battery, is referenced to the reference electrode vs. capacity or time.
Figure 1. Voltage of the working (Ew), counter (Ec), and battery (Ew–Ec) curves versus time at different current density values for a Zn/air liquid battery. The working electrode was a commercial air electrode, and a Zn plate was the counter. Numbers included are the current density values. The pseudo-reference electrode was an Ag wire. Electrolyte: ~1 mL of 6 M KOH solution.
Batteries 08 00221 g001

2. Experimental Section

Bi2O3 was obtained from Alfa Aesar, KOH (85%) was purchased from Sigma-Aldrich (Merck Life Science S.L.U., Madrid, Spain) and Ethanol absolute from Panreac Química S.L.U. (Barcelona, Spain). Millipore water with a resistivity of >18 MΩcm was always used.
An Ag-coiled wire was always used as a pseudo-reference electrode to perform the three-electrode tests. The working electrode was always the positive one (Air or Bi2O3), and the counter was the negative electrode. Zn plates with a purity of 99.9% were supplied by Española del Zinc S.A was used as a negative electrode in both Zn/Bi2O3 and Zn/Air batteries. The zinc plate was polished before use with different grain sizes of AlO3.
Bi2O3 electrode was fabricated as reported elsewhere [21]. Two sizes of Zn/Bi2O3 batteries were used. One with 1 ± 0.02 mL and the other with 50 mL of 8 M KOH solution. Scheme 1 shows the ~1 mL Zn/Bi2O3 battery used in this work, which is similar to the Zn/Air battery, but the Bi2O3 electrode is substituted by a commercial Air one.
The air electrode was a MnO2-based commercial purchased from Gaskatel, and the volume used in Zn/Air batteries was 1 ± 0.02 mL of 6 M KOH solution.
A 5-channel Biologic VSP potentiostat/galvanostat was used to carry out all battery tests, controlled by Ec-Lab® software (version 11.43, 2021), which allowed us to follow the voltage value of Ew, Ec, and Ew–Ec independently, during the progress of the battery test, as observed in Figure S1.
Galvanostatic discharges/Charges for Zn/Bi2O3 batteries were carried out at −20 mAcm−2. EIS measurements of the Bi2O3 electrodes were performed during the charging process of a Zn/Bi2O3. An initial discharge and then charged until reaching a capacity of 10 mAh of a Zn/Bi2O3 was carried out prior to registering the EIS measurements. The same Biologic VSP equipment was used to register the EIS measurements. The frequency range was 10 MHz−10 mHz, with a potential step of 5 mV.
SEM images were obtained using a field emission scanning electron microscope (FESEM) Zeiss Crossbeam 350 (Carl Zeiss Microscopy GmbH, Jena, Germany). The image was generated with the secondary electron signal (SE Secondary Electron), with a 10 kV voltage and 7.4 mm working distance. Zeiss SmartSEM software (version 6.07, 2020) was used for image acquisition.

3. Results

3.1. Zn/Air Battery Test

Figures S2–S4 show the evolution of the Ew–Ec, Ec, and Ew curves obtained at different current density values during the discharge process of the Zn/air battery. In a conventional two terminals battery test, we would only observe the curve displayed in Figure S2, identifying the end of the battery discharge when the curve drops abruptly (highlighted area). Consequently, if we were testing a new catalyst material to be used in metal/air batteries, we would point to 60 mAcm−2 as the maximum current density value that our air electrode can work at. However, it should be noted that the counter electrode, in this case, a Zn plate, is the one that is damaged because a sudden increase in the voltage value is observed, synchronized with the drop of the Ew–Ec curve (Figure S3). Instead, the air electrode continues to function properly, as it is observed in Figure S4 and Figure 1.
However, as is observed in Figure 1, we did not stop the experiment after detecting the Ew–Ec curve drop: contrarily, current density values of 20, 10, 5, 2, and 1 mAcm−2 were applied after reaching 60 mAcm−2. Figure 1 shows the three curves obtained together during the complete measure. This figure demonstrates that the Air electrode maintained its good behavior throughout the entire experiment: EW showed a steady value and did not fall at any time; even more, when lower current density values were applied, EW went back to the initial voltage levels. Surprisingly, after the failure, the Zn electrode changed its behavior with the successive current densities applied, decreasing the voltage value until recovering the initial potential at 1 mAcm−2. This fact makes it possible that the Ew–Ec curve recovers the initial voltage value, as confirmed by the dashed line included in Figure 1.
The Zn electrode behavior at −60 mAcm−2 can be explained by the formation of a passivation film of ZnO, which is normally observed in alkaline Zn-based battery discharges and identified as the cause of the battery failure [18,21,22,23,24,25,26,27,28]. Two ZnO film types (I and II) have been associated with the passivation layer. Type I is a porous external layer formed when saturation of Zn(OH4)2− concentration is reached in the proximity of the Zn electrode [22,25,26]. Contrary, Type II is an inner and denser layer generated by direct oxidation of Zn, which prevents the access of OH anions to the electrode surface, and consequently, the oxidation reaction cannot progress.
M. Bockelmann et al. [22] have reported a very interesting study of the passivation film formation by in situ microscopy and impedance spectroscopy. After 40 min applying a constant current density of 70 mAcm−2, they observed the beginning of the Layer I formation. After 100 min, a rupture of this layer is shown, and at 130 min, the experiment was stopped because bubbles of O2 gas were detected. In the end, two different ZnO passivation layers could be identified on the Zn surface.
Our results have confirmed that after the formation of the passivation layer at 60 mAcm−2, the initial potential of discharge was surprisingly recovered after diminishing the applied current density. To our knowledge, this potential recovery had not been previously observed, and it may contribute to extending the duration of the Zn electrode used in alkaline batteries. To find out what happens to the passive layer, we obtained SEM images of the surface of a passivated Zn electrode (after reaching 60 mAcm−2 in Figure 1) and other Zn electrodes after recovering the initial behavior (Figure 2).
As can be seen, both electrodes present ZnO films, but comparing Figure 2A,B, a rupture of the passivation layer is observed for the recovered electrode, and two different ZnO layers can be found (Figure 2D). This rupture favors the peel off part of the passivation layer, as observed in Figure 2C–F, allowing once again the access of OH anions, favoring that the oxidation reaction continues. Access of OH anions to the electrode surface was prior prevented by the dense Type II passivation layer, and thus, the Zn oxidation process was stopped. However, the progress of the Zn oxidation reaction is now allowed, depositing more ZnO onto part of the film formed before.
Additionally, high-magnification images show very different morphologies between the passivated and recovered electrode surfaces. Morphological modifications of the Zn electrode surface have been previously associated with facilitating the transport of ions from the electrolyte and the discharged products from the electrode, thus improving the utilization of Zn as a battery electrode [28].
A similar experiment to that of Figure 1 but carrying out several decreasing and increasing current intensity values during the same discharge is shown in Figure 3. Current density values applied followed the next sequence:
−1 → −35 → −1 → −70 → −1 → −70 → −1 (mAcm−2)
During the first cycle, reaching −35 mAcm−2, both electrodes worked adequately and recovered the potential values when the current was diminished up to −1 mA cm−2. In the second cycle, the Zn electrode was passivated when −70 mAcm−2 was achieved, and the cell potential fell down. However, once the current density was diminished, the morphology of the ZnO layer on the electrode was modified, as shown in Figure 2, and the Zn electrode returned to the previous potential values, making that the battery works correctly up to −70 mAcm−2 was applied again. At this potential, the Zn electrode was passivated once more, but now after the second passivation, the initial potentials were not obtained (Figure S5). Once again, it should be noted that the air electrode was working correctly throughout the entire experiment.

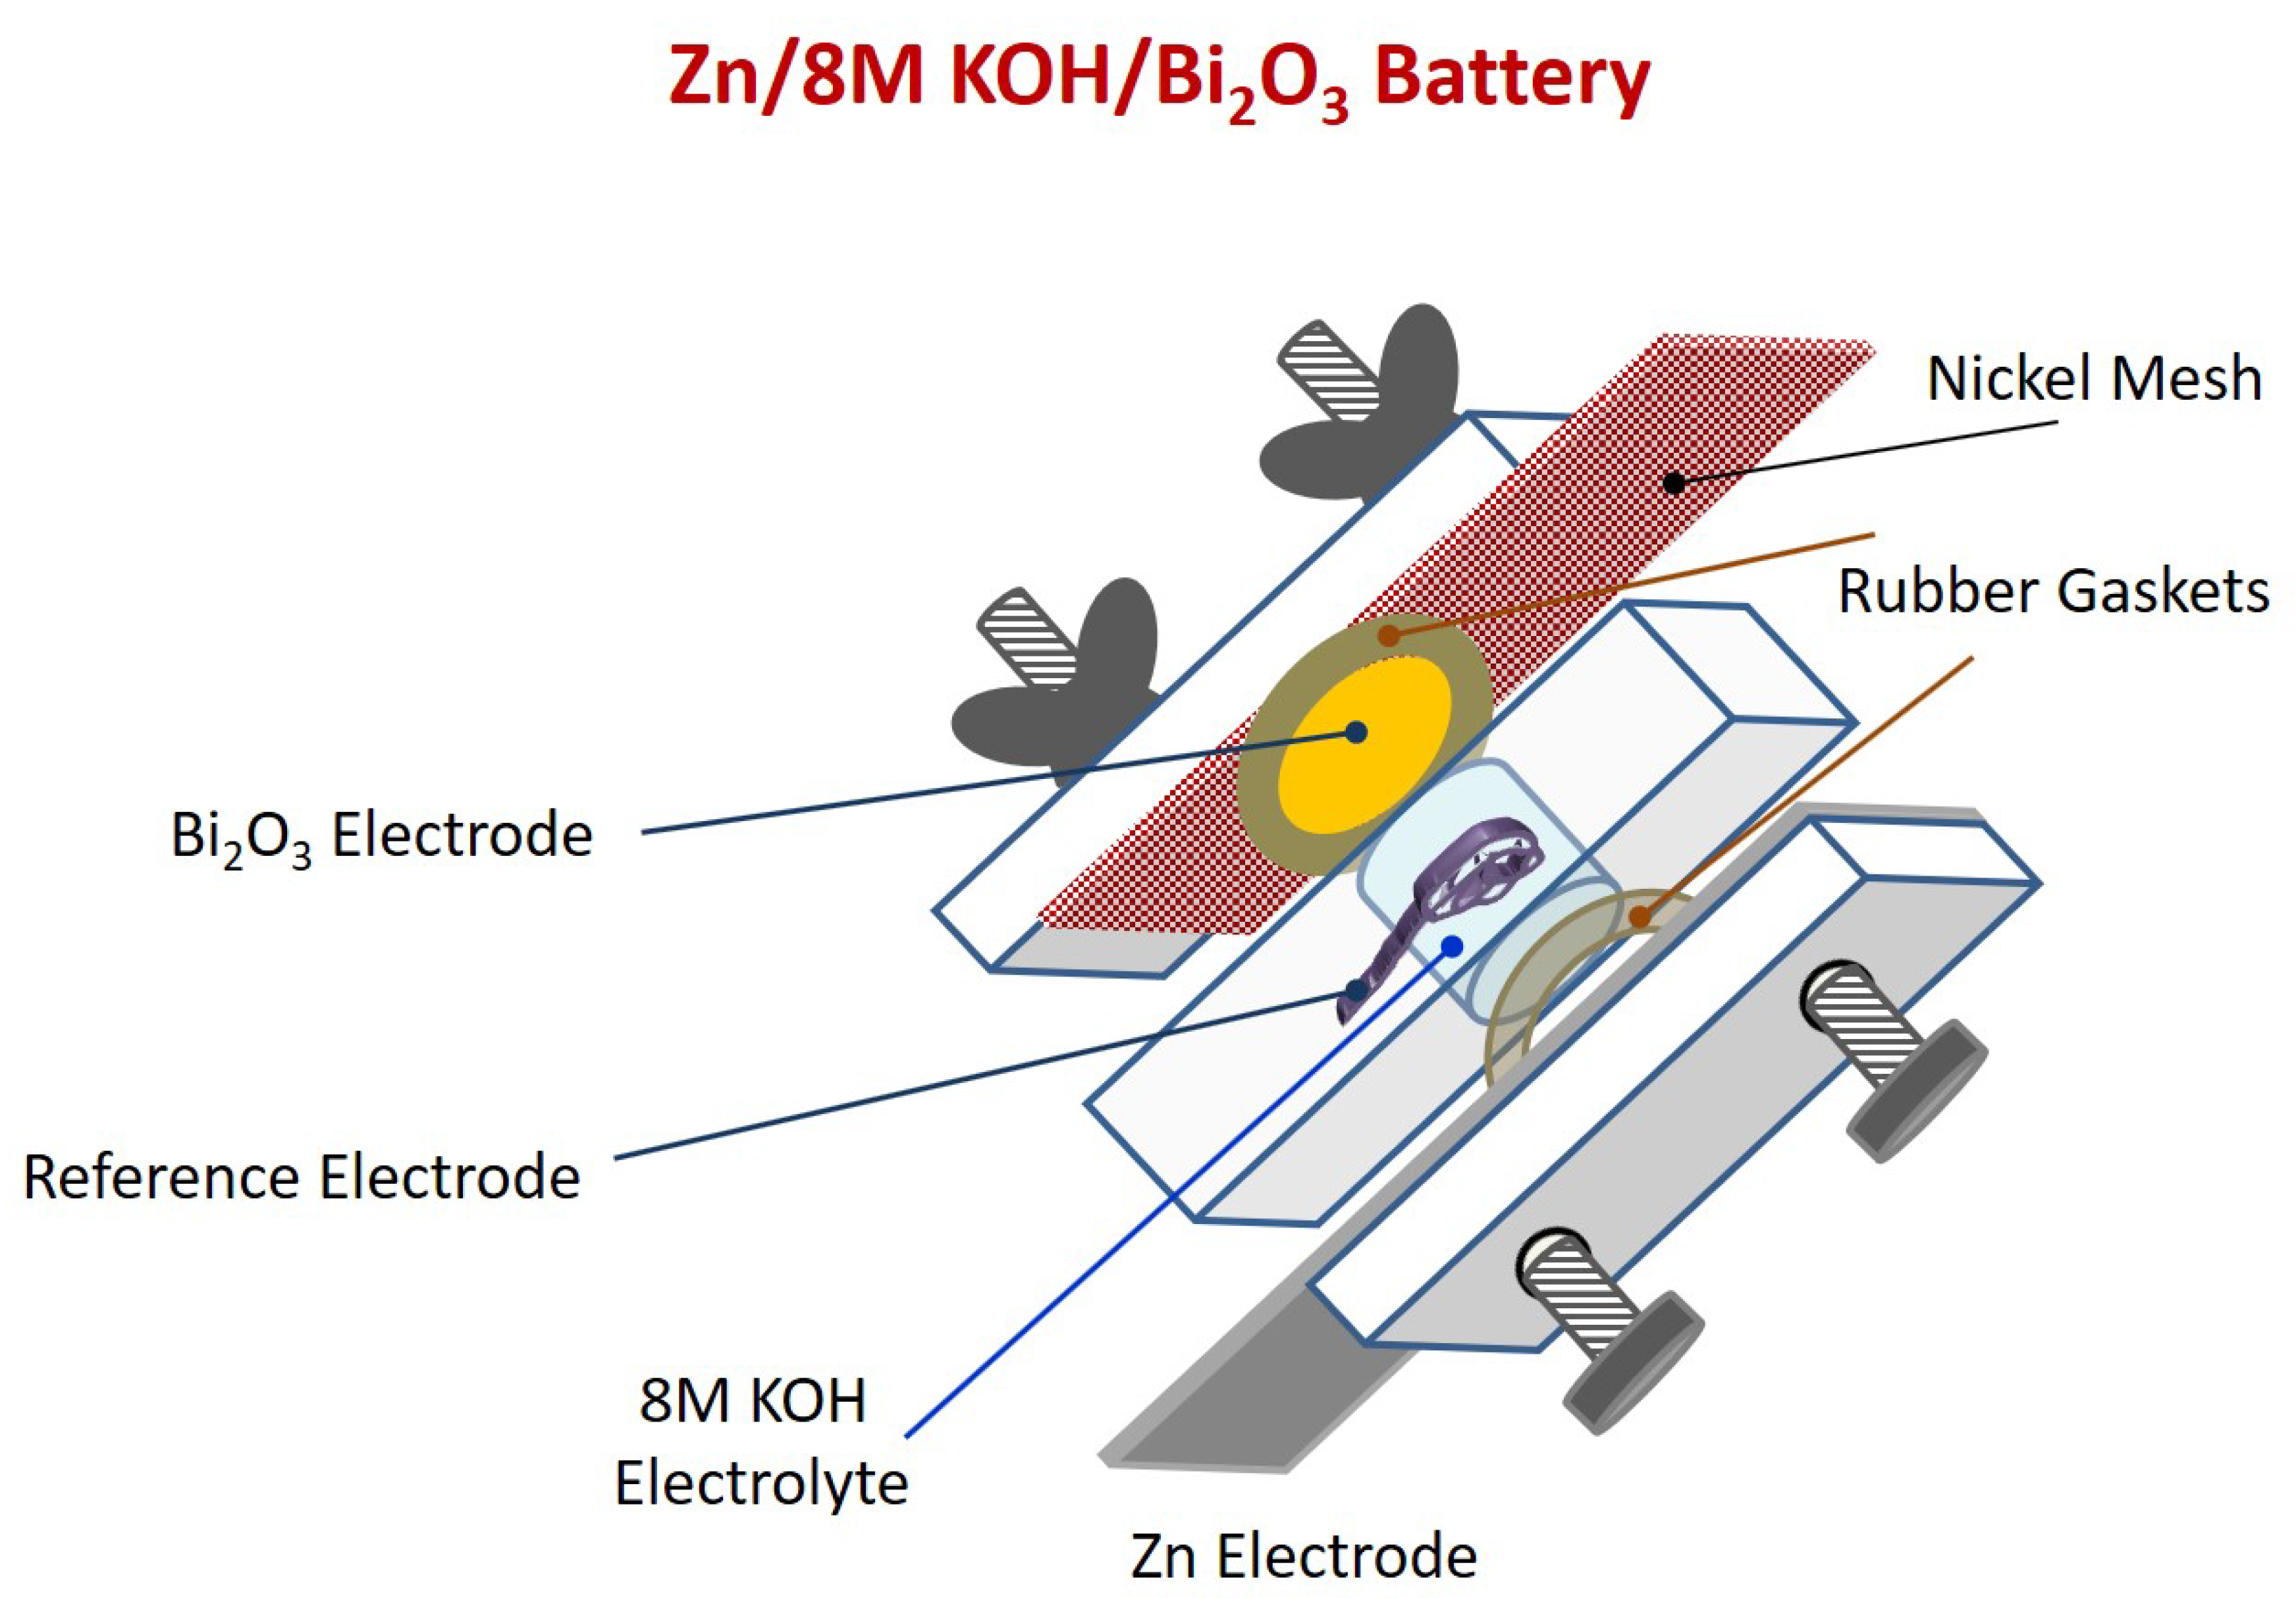
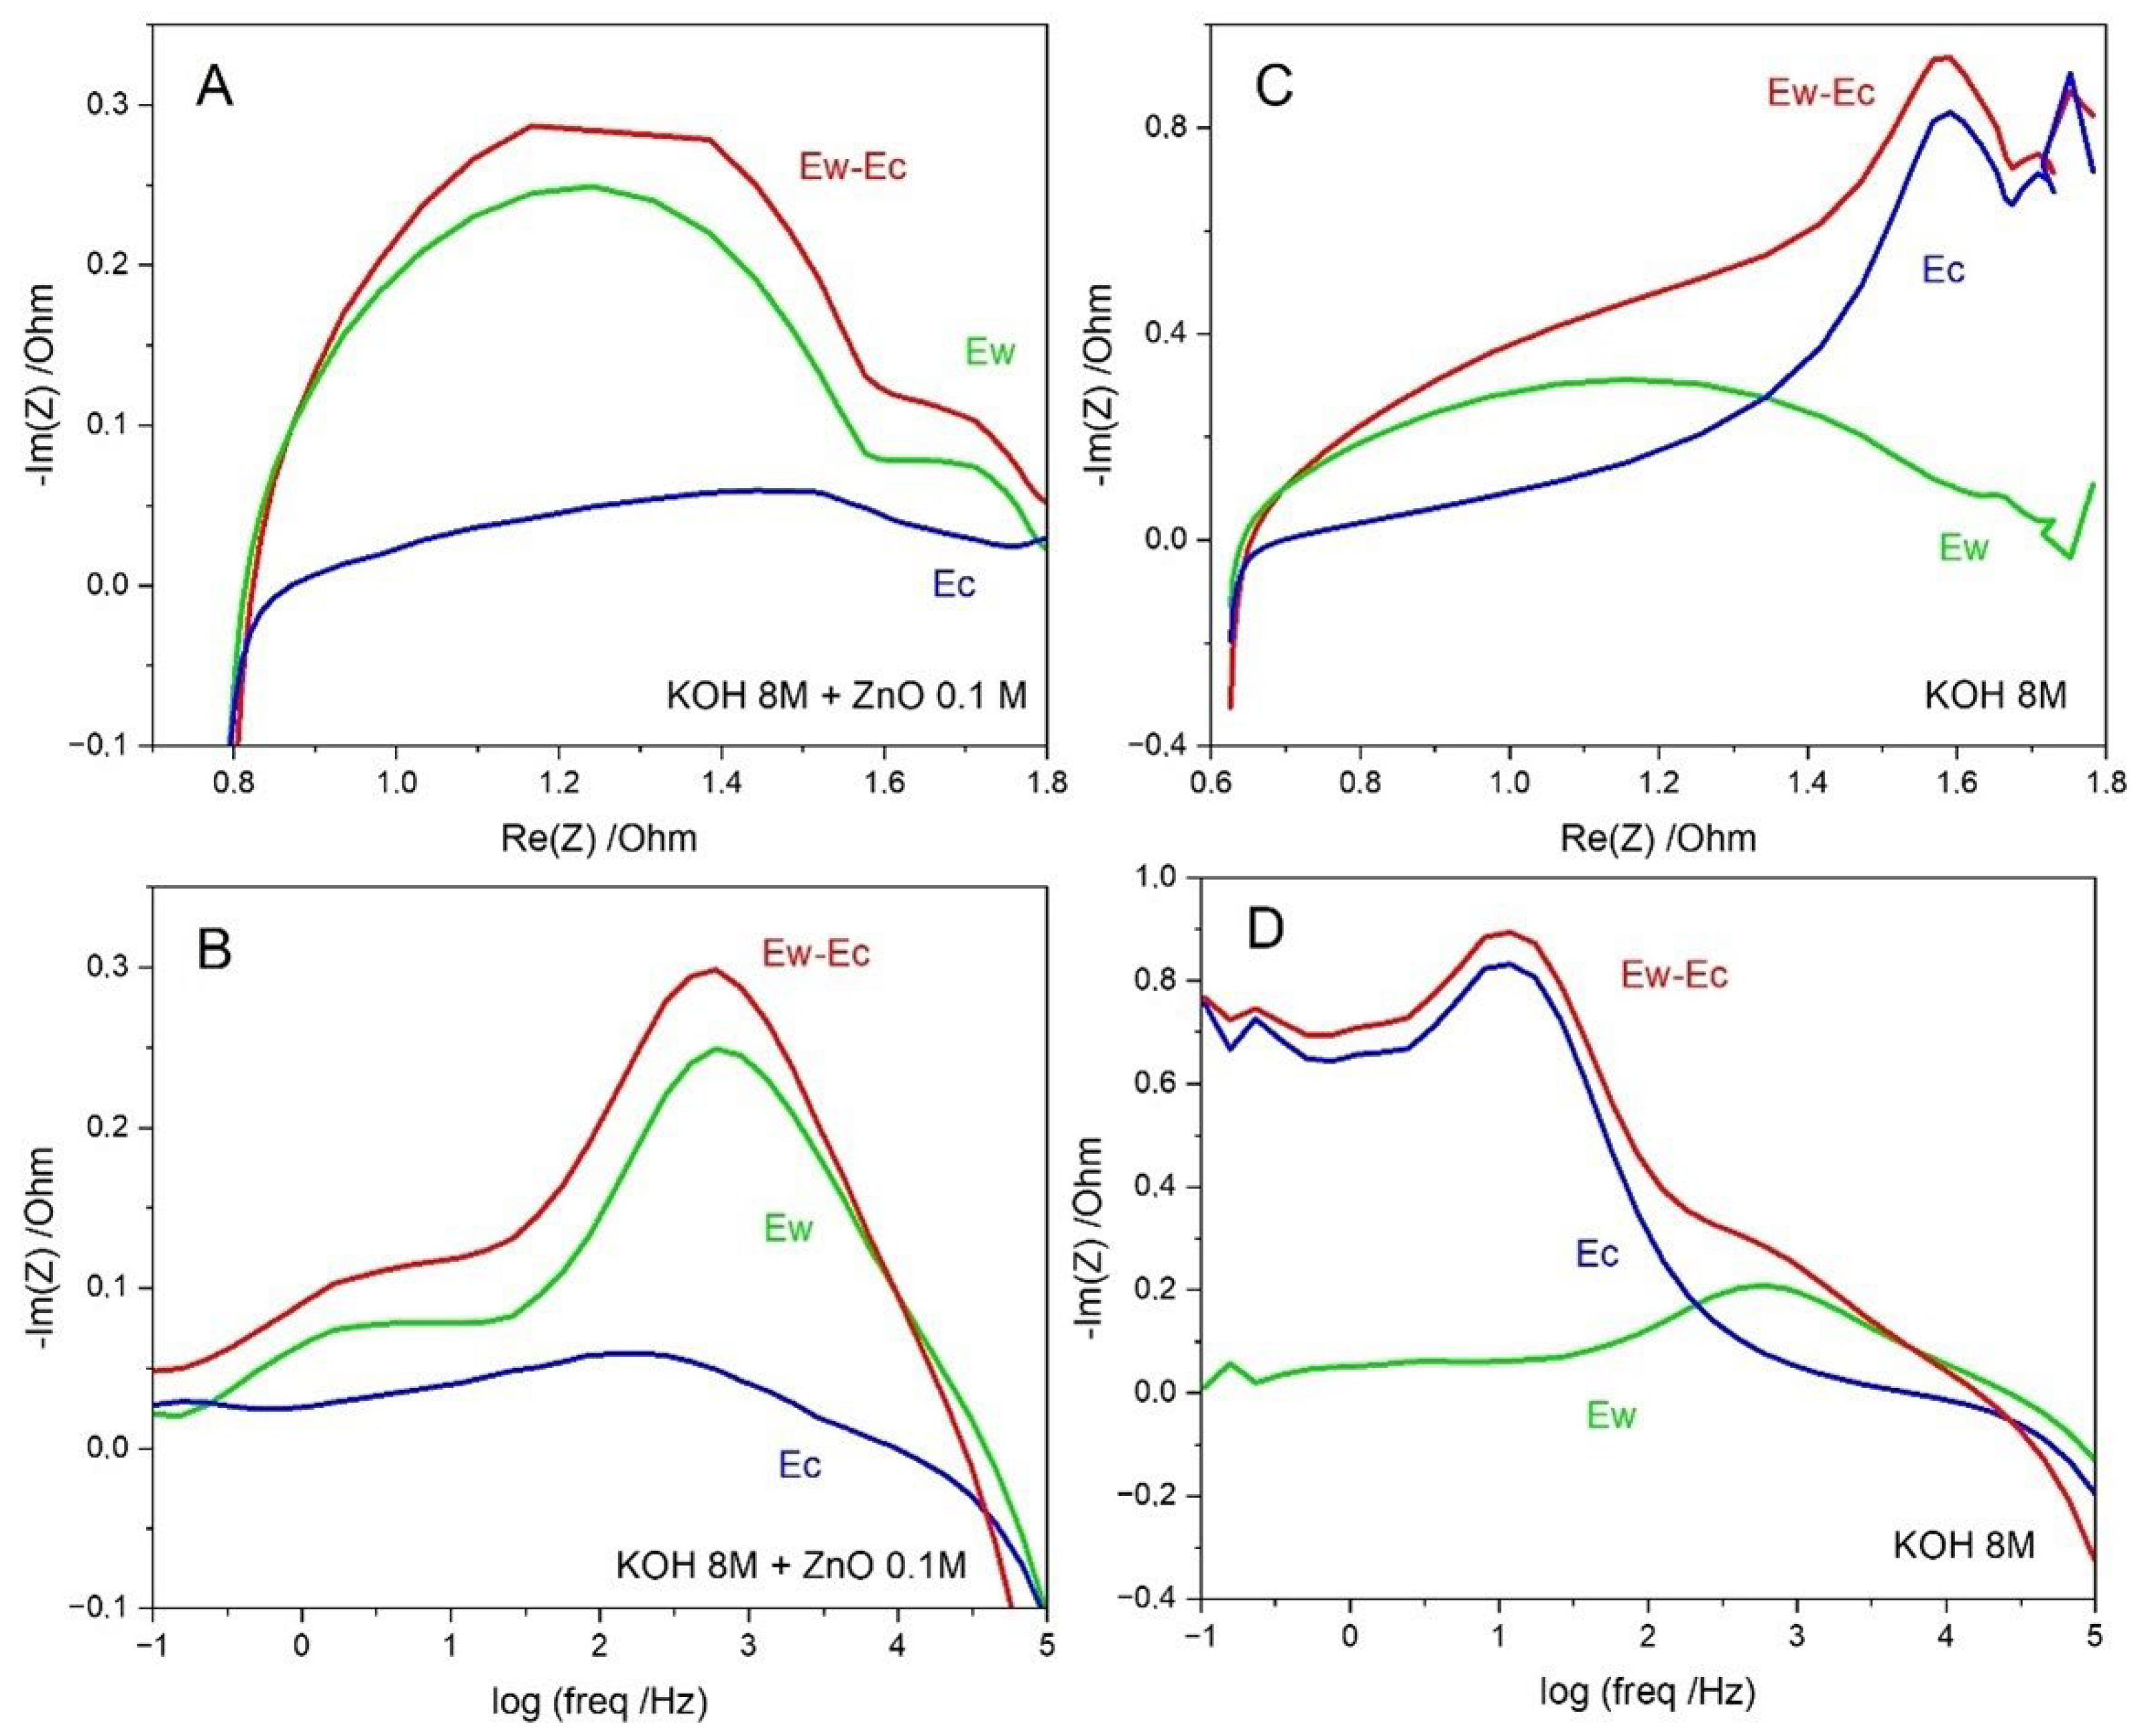
3.2. Zn/Bi2O3 Battery Test in a ~1 mL 8 M KOH Solution Cell

Recently, a safe rechargeable Zn/Bi2O3 battery utilizing a PVA-KOH membrane as an electrolyte was reported, demonstrating its high coulombic and energy efficiencies and excellent cyclability [29]. In this section, we use a similar Zn/Bi2O3 battery but change the membrane electrolyte by ~1 mL of 6 M KOH solution. The three charge/discharge curves obtained for this battery, until 20 mAh and using an Ag wire as a pseudo-reference electrode, are displayed in Figure 4. As can be seen, during the charging process, a ~1 V potential step occurred at ~13 mAh in the Ew–Ec curve (red). Note that this curve corresponds to the normally obtained one in a two terminals configuration battery test.
A similar potential step already appeared in the Zn/PVA-KOH/Bi2O3 battery (see Figure 1B in reference [29]), and as the three-electrode system was not used in that case, it was unclear if it was due to the Zn or Bi2O3 electrode. However, using the pseudo-reference electrode, we can now safely assign that this potential rise is due to a process taking place at the working electrode, i.e., the Bi2O3 one, because a similar rising is observed in the Ew curve (green line in Figure 4), therefore demonstrating the utility of using three electrodes during the battery test.
Contrarily, this potential step is not observed when a higher volume of KOH solution is used, as it is treated in the next section. Hence, this behavior must be associated with the low amount of OH anions present in the solution, which is necessary to carry out the charging process, in agreement with the following reaction [4,29]:
2 Bi° + 6 OH ↔ 3 H2O + Bi2O3 + 6e
From here, the potential jump will be produced as a consequence of the lack of OH anions in the solution, which are necessary for the reaction [1] to take place.
The use of the third electrode allows us also to identify which electrode is causing the teeth saw signal observed in the Ew–Ec curve during the charging process. The inset in Figure 4 demonstrates clearly that the Zn2+ deposition on the Zn electrode is producing this noise.
In the second and successive cycles, at the beginning of the discharge in both Ew–Ec and Ew curves, other potential steps occurred, as observed in Figure 4, but in the opposite potential direction (Figure 5). This step must be related to the restructuration occurring in the Bi2O3 electrode during the expulsion of OH anions at the beginning of the discharge process.
The three curves can be followed along the battery life, as seen in Figure 5, where five complete cycles are shown (failure occurred at the sixth discharge). At the end of the sixth discharge, the Ec curve increases abruptly, synchronized with the entire cell curve drop, and while the Bi2O3 one continues working adequately, as shown by the steady value of the Ew curve. Once again, the use of the third electrode makes it clear that the Zn electrode is the one that is failing now because the Zn electrode was exhausted, as it was confirmed when the battery was disassembled (Figure S6).

3.3. Zn/Bi2O3 Battery Test in a ~50 mL 8 M KOH Solution Cell

With the aim of avoiding the potential rise observed in Figure 4 and the exhaust of the Zn electrode found in Figure 5, additional measurements were carried out using a larger cell with ~50 mL 8 M KOH solution and a higher Zn electrode, increasing the Zn surface in contact with the electrolyte. These conditions allow us to reach a high number of discharge/charge cycles, as shown in Figure 6A–C, where the 3rd, 20th, and 40th cycles obtained for a Zn/8 M KOH/Bi2O3 battery, using the same parameters described before, are displayed.
In this cell, the voltage step associated with the Bi2O3 electrode during the charging process did not appear due to the high quantity of OH anions present in this cell, which are enough to carry out the reaction [1] during all cycles. Instead, another peak at lower capacity values emerged during the charging process in the Ew–Ec curve, but now, this potential rise cannot be associated with the Bi2O3 electrode as it would be logical thinking if using a two-terminal cell. In this case, the three-electrode test allowed us to observe that no peak appeared in the Ew curve, while a clear peak was found in the Ec-charge one, indicating that this process is happening in the Zn electrode. This assignment is obvious because this peak was shifted along cycling in both Ew–Ec and Ec curves at the same capacity values. This fact led us to accomplish an additional measurement with the same battery but using an electrolyte solution of 8 M KOH + 0.1 M ZnO. As it is depicted in Figure 6 D–F, the previously observed peak during the charging process disappeared with ZnO in the electrolyte. It has to be remarked that the addition of a low concentration of ZnO, or other Zn2+-based salts, to alkaline solutions in a Zn-based battery is a frequently used procedure to favor a more homogeneous Zn2+ deposition during the charging process [21,22,24]. Hence, this fact is confirmed in the present experiment.
Additional electrochemical techniques can be applied using a three-electrode configuration cell, such as spectroscopic impedance measurements. Representative results obtained for Zn/Bi2O3 batteries are shown in Figure 7, where Ew–Ec, Ew, and Ec curves are shown independently in Nyquist and -Im vs. log (freq) plots. Here, EIS was applied to the charging process of the same Zn/Bi2O3 battery using 8 M KOH and 8 M KOH + 0.1 M ZnO electrolytes to evidence the different behavior of the Zn electrode in each electrolyte, as it was already revealed by galvanostatic charge in Figure 6.
Figure 7A,B displays the Nyquist and the -Im(Z) vs. log (freq) after recharging 10 mAh in a Zn/Bi2O3 battery, using 8 M KOH + 0.1 M ZnO electrolyte. The separation of the three curves reflects that the two Ew–Ec curves are very close to the Ew ones, revealing that the imaginary impedance resulting for the battery is mainly due to the Bi2O3 electrode along all frequency values examined. However, a very different Nyquist and -Im(Z) vs. log (freq) resulted when 8 M KOH, without ZnO, the electrolyte was used. In this case, the Ew–Ec curves of both plots show an abrupt rise of -Im(Z) at low frequencies. The curve of Ec evidence that this unexpected behavior is due to something occurring in the Zn electrode, probably the inhomogeneous deposition of Zn2+ on the Zn plate when no ZnO was added to the electrolyte. Contrary, a more homogeneous deposition of Zn2+ must occur in the presence of ZnO in the electrolyte, as it was commented before since the anomalous behavior was not obtained when KOH 8 M + ZnO 0.1 M electrolyte was utilized (compare Figure A and B with C and D).
Regarding the Bi2O3 electrode response, a very close behavior was obtained for Ew curves in both 8 M KOH and 8 M KOH + 0.1 M ZnO electrolytes, as it is confirmed in Figure S6, where -Im(Z) vs. log (freq) plots are included to compare both Ew curves. As can be seen, very similar curves are obtained despite the great difference between the Ew–Ec curves, thus highlighting the importance of controlling both electrodes in the battery tests to know immediately what is happening in each electrode, thus avoiding interpretation errors and unnecessary waste of time.

4. Conclusions

This work demonstrates by a series of illustrative examples the usefulness of including a reference or pseudo-reference electrode to carry out battery tests in a three-electrode configuration. In this case, two different Zn-based liquid batteries, Zn/air and Zn/Bi2O3, were studied in order to highlight the importance of monitoring both negative and positive electrode voltages simultaneously. Unexpected results in the battery evolution that may be unresolved in a two-electrode conventional configuration can now be undoubtedly attributed to one of the electrodes, facilitating knowing the cause of the battery failure.
Additionally, this methodology can be easily adapted to other types of batteries with both liquid or gel polymeric electrolytes, such as LIBs, ZIBs, or other metal/air batteries, increasing the information obtained from a two-electrode battery test. Special mention must be made for redox flow batteries, where live monitoring of both electrodes while the battery is working could allow instant response to unpredicted results and troubleshoot problems that may occur due to the electrolyte movement. Polarization, galvanostatic charge/discharge cycles, and electrochemical impedance spectroscopic measurements can be carried out by controlling both negative and positive electrode surfaces just as easily and in the same amount of time as usual two-terminal battery tests.

Supplementary Materials

The following supporting information can be downloaded at: https://www.mdpi.com/article/10.3390/batteries8110221/s1, Figure S1: Screen Snapshot of the Ec-Lab software used in a Biologic VSP portentiostat/galvanostat taken during a galvanostaic discharge of a Zn/air battery showing the independent recording of Ew, Ec and the Ew-Ec curves; Figure S2: Ew-Ec curve obtained at different current density values during the discharge process of the Zn/air battery; Figure S3: Ec curve obtained at different current density values during the discharge of the Zn/air battery; Figure S4: Ew curve obtained at different current density values during the discharge of the Zn/air battery; Figure S5: Galvanostatic discharge at several current density values; Figure S6: Pristine Zn plate and Exhaust Zn electrodes used in the Zn/8M KOH (~1 mL)/Bi2O3 battery until battery failure; Figure S7: -Im(Z) vs. log (freq) for Zn/Bi2O3 battery in both 8M KOH + 0.1 M ZnO and 8M KOH electrolytes.

Author Contributions

Conceptualization, J.P. and A.J.F.R.; methodology, J.P. and A.J.F.R.; validation, S.L., F.S. and J.J.L.C.; formal analysis, S.L. and A.J.F.R.; investigation, S.L. and F.S.; resources, J.J.L.C. and J.P.; data curation, S.L., F.S. and A.J.F.R.; writing—original draft preparation, A.J.F.R.; writing—review and editing, S.L., F.S., J.J.L.C., J.P. and A.J.F.R.; visualization, S.L., F.S. and A.J.F.R.; supervision, J.J.L.C., J.P. and A.J.F.R.; funding acquisition, A.J.F.R. All authors have read and agreed to the published version of the manuscript.

Funding

This research was funded by Spanish Agencia Estatal de Investigación grant number PID2019-104272RB-C55/AEI/10.13039/501100011033 and Fundación Séneca-Región de Murcia, Spain grant number 20985/PI/18.

Informed Consent Statement

Not applicable.

Acknowledgments

We thank the financial support from Spanish Agencia Estatal de Investigación (PID2019-104272RB-C55/AEI/10.13039/501100011033) and Fundación Séneca-Región de Murcia, Spain (Refs: 20985/PI/18).

Conflicts of Interest

The authors declare no conflict of interest.

References

  1. Aremu, E.O.; Park, D.-J.; Ryu, K.-S. The effects of anode additives towards suppressing dendrite growth and hydrogen gas evolution reaction in Zn-air secondary batteries. Ionics 2019, 25, 4197–4207. [Google Scholar] [CrossRef]
  2. Lv, S.; Verhallen, T.; Vasileiadis, A.; Ooms, F.; Xu, Y.; Li, Z.; Li, Z.; Wagemaker, M. Operando monitoring the lithium spatial distribution of lithium metal anodes. Nat. Commun. 2018, 9, 2152. [Google Scholar] [CrossRef] [Green Version]
  3. Wood, K.N.; Steirer, K.X.; Hafner, S.E.; Ban, C.; Santhanagopalan, S.; Lee, S.-H.; Teeter, G. Operando X-ray photoelectron spectroscopy of solid electrolyte interphase formation and evolution in Li2S-P2S5 solid-state electrolytes. Nat. Commun. 2018, 9, 2490. [Google Scholar] [CrossRef] [Green Version]
  4. Santos, F.; Abad, J.; Vila, M.; Castro, G.R.; Urbina, A.; Romero, A.J.F. In situ synchrotron x-ray diffraction study of Zn/Bi2O3 electrodes prior to and during discharge of Zn-air batteries: Influence on ZnO deposition. Electrochim. Acta 2018, 281, 133–141. [Google Scholar] [CrossRef]
  5. Park, S.K.; Dose, W.M.; Boruah, B.D.; De Volder, M. In Situ and Operando Analyses of Reaction Mechanisms in Vanadium Oxides for Li-, Na-, Zn-, and Mg-Ions Batteries. Adv. Mater. Technol. 2021, 7, 2100799. [Google Scholar] [CrossRef]
  6. Inzelt, G. Handbook of Reference Electrodes; Inzelt, G., Lewenstam, A., Scholz, F., Eds.; Springer: Berlin/Heidelberg, Germany, 2013. [Google Scholar] [CrossRef]
  7. Bard, A.J.; Faulkner, L.R. Electrochemical Methods: Fundamentals and Applications, 2nd ed.; John Wiley & Sons, Inc.: Hoboken, NJ, USA, 2020. [Google Scholar]
  8. Pino, M.; Cuadrado, C.; Chacón, J.; Rodríguez, P.; Fatás, E.; Ocón, P. The electrochemical characteristics of commercial aluminium alloy electrodes for Al/air batteries. J. Appl. Electrochem. 2014, 44, 1371–1380. [Google Scholar] [CrossRef]
  9. Lewis, T.; Spinks, G.M.; Wallace, G.; Mazzoldi, A.; De Rossi, D. Investigation of the applied potential limits for polypyrrole when employed as the active components of a two-electrode device. Synth. Met. 2001, 122, 379–385. [Google Scholar] [CrossRef]
  10. Padilla, J.; Seshadri, V.; Otero, T.; Sotzing, G. Electrochemical study of dual conjugated polymer electrochromic devices. J. Electroanal. Chem. 2007, 609, 75–84. [Google Scholar] [CrossRef]
  11. Hassab, S.; Shen, D.E.; Österholm, A.M.; Reynolds, J.R.; Padilla, J. Exploring unbalanced electrode configurations for electrochromic devices. J. Mater. Chem. C 2017, 6, 393–400. [Google Scholar] [CrossRef]
  12. Hassab, S.; Padilla, J. Using WO 3 as a transparent, optically-passive counter electrode in an unbalanced electrochromic configuration. Electrochem. Commun. 2016, 72, 87–90. [Google Scholar] [CrossRef]
  13. Soulsby, L.C.; Hayne, D.J.; Doeven, E.H.; Chen, L.; Hogan, C.F.; Kerr, E.; Adcock, J.L.; Francis, P.S. Electrochemically, Spectrally, and Spatially Resolved Annihilation-Electrogenerated Chemiluminescence of Mixed-Metal Complexes at Working and Counter Electrodes. ChemElectroChem 2018, 5, 1543–1547. [Google Scholar] [CrossRef]
  14. Costard, J.; Ender, M.; Weiss, M.; Ivers-Tiffée, E. Three-Electrode Setups for Lithium-Ion Batteries II. Experimental Study of Different Reference Electrode Designs and Their Implications for Half-Cell Impedance Spectra. J. Electrochem. Soc. 2017, 164, A80–A87. [Google Scholar] [CrossRef]
  15. Ender, M.; Illig, J.; Ivers-Tiffée, E. Three-Electrode Setups for Lithium-Ion Batteries I. Fem-Simulation of Different Reference Electrode Designs and Their Implications for Half-Cell Impedance Spectra. J. Electrochem. Soc. 2017, 164, A71–A79. [Google Scholar] [CrossRef]
  16. Raccichini, R.; Amores, M.; Hinds, G. Critical Review of the Use of Reference Electrodes in Li-Ion Batteries: A Diagnostic Perspective. Batteries 2019, 5, 12. [Google Scholar] [CrossRef] [Green Version]
  17. Middlemiss, L.A.; Rennie, A.J.; Sayers, R.; West, A.R. Characterisation of batteries by electrochemical impedance spectroscopy. Energy Rep. 2020, 6, 232–241. [Google Scholar] [CrossRef]
  18. Hwang, B.; Oh, E.-S.; Kim, K. Observation of electrochemical reactions at Zn electrodes in Zn-air secondary batteries. Electrochim. Acta 2016, 216, 484–489. [Google Scholar] [CrossRef]
  19. Liu, X.; Elia, G.A.; Passerini, S. Evaluation of counter and reference electrodes for the investigation of Ca battery materials. J. Power Sources Adv. 2020, 2, 100008. [Google Scholar] [CrossRef]
  20. Chu, Z.; Feng, X.; Liaw, B.; Li, Y.; Lu, L.; Li, J.; Han, X.; Ouyang, M. Testing Lithium-Ion Battery with the Internal Reference Electrode: An Insight into the Blocking Effect. J. Electrochem. Soc. 2018, 165, A3240–A3248. [Google Scholar] [CrossRef]
  21. Lim, M.B.; Lambert, T.N.; Ruiz, E.I. Effect of ZnO-Saturated Electrolyte on Rechargeable Alkaline Zinc Batteries at Increased Depth-of-Discharge. J. Electrochem. Soc. 2020, 167, 060508. [Google Scholar] [CrossRef]
  22. Bockelmann, M.; Becker, M.; Reining, L.; Kunz, U.; Turek, T. Passivation of Zinc Anodes in Alkaline Electrolyte: Part I. Determination of the Starting Point of Passive Film Formation. J. Electrochem. Soc. 2018, 165, A3048–A3055. [Google Scholar] [CrossRef]
  23. Wang, N.; Wan, H.; Duan, J.; Wang, X.; Tao, L.; Zhang, J. A review of zinc-based battery from alkaline to acid. Mater. Today Adv. 2021, 11, 100149. [Google Scholar] [CrossRef]
  24. Shin, J.; Lee, J.; Park, Y.; Choi, J.W. Aqueous zinc ion batteries: Focus on zinc metal anodes. Chem. Sci. 2020, 11, 2028–2044. [Google Scholar] [CrossRef] [Green Version]
  25. Mainar, A.R.; Leonet, O.; Bengoechea, M.; Boyano, I.; de Meatza, I.; Kvasha, A.; Guerfi, A.; Blázquez, J.A. Alkaline aqueous electrolytes for secondary zinc-air batteries: An overview. Int. J. Energy Res. 2016, 40, 1032–1049. [Google Scholar] [CrossRef]
  26. Liu, M.; Cook, G.M.; Yao, N.P. Passivation of Zinc Anodes in KOH Electrolytes. J. Electrochem. Soc. 1981, 128, 1663–1668. [Google Scholar] [CrossRef]
  27. Santos, F.; Romero, A.J.F. Hydration as a solution to zinc batteries. Nat. Sustain. 2022, 5, 179–180. [Google Scholar] [CrossRef]
  28. Yang, H. Improved discharge capacity and suppressed surface passivation of zinc anode in dilute alkaline solution using surfactant additives. J. Power Sources 2004, 128, 97–101. [Google Scholar] [CrossRef]
  29. Lorca, S.; Santos, F.; Abad, J.; Huttel, Y.; Urbina, A.; Romero, A.J.F. Characterization of a new rechargeable Zn/PVA-KOH/Bi2O3 battery: Structural changes of the Bi2O3 electrode. Sustain. Energy Fuels 2020, 4, 4497–4505. [Google Scholar] [CrossRef]
Scheme 1. Scheme of the Zn/Bi2O3 battery with the RE electrode containing 1 ± 0.02 mL of 8 M KOH solution.
Batteries 08 00221 sch001
Figure 2. SEM images of the passivated Zn electrode (A,E) and after recovering the initial behavior (BF). Arrows indicate the separation between the two different ZnO layers. Magnifications: 60× (A,B), 1.0 KX (C,D), and 5 KX (E,F).
Batteries 08 00221 g002
Figure 3. Voltage curves of the entire cell (Ew–Ec), counter (Ec), and working electrodes (Ew) versus time at different current density values for a Zn/air liquid battery. The working electrode was a commercial air electrode, and a Zn plate was the counter. Inset: Current density applied with time. The pseudo-reference electrode was an Ag wire. Electrolyte: ~1 mL of 6 M KOH solution.
Batteries 08 00221 g003
Figure 4. Galvanostatic Discharge/Charge plot for a Zn/Bi2O3 battery showing separately the working electrode (Ew), counter electrode (Ec), and the entire battery (Ew–Ec) curves vs. capacity. The working electrode was Bi2O3 and the counter was Zn electrode. Ag wire was used as pseudo-reference electrode. Electrolyte: ~1 mL of 8 M KOH solution. In this figure, only the first cycle is shown. Inset: Details of the three curves until capacity of 10 mAh (curves were shifted to better comparison).
Batteries 08 00221 g004
Figure 5. (A) Galvanostatic Discharge/Charge vs. time of a Zn/8 M KOH (~1 mL)/Bi2O3 battery, displaying Ew–Ec, Ew, and Ec curves. (B) 6th Discharge of this battery vs. capacity, including the three potential curves.
Batteries 08 00221 g005
Figure 6. (AC) despite the 3rd, 20th, and 40th Discharge/Charge cycles, respectively, of a Zn/8 M KOH (~50 mL)/Bi2O3 battery. DF) show the 3rd, 20th, and 40th Discharge/Charge cycles of a Zn/8 M KOH + 0.1 M ZnO (~50 mL)/Bi2O3 battery. Ew–Ec (red), Ew (green), and Ec (blue) curves are included in all figures.
Batteries 08 00221 g006
Figure 7. Nyquist (A) and the -Im(Z) vs. log (freq) (B) obtained during the charging process of a Zn/Bi2O3 battery using 8 M KOH + 0.1 M ZnO electrolyte. Nyquist (C) and the -Im(Z) vs. log (freq) (D) obtained during the charging process of a Zn/Bi2O3 battery using 8 M KOH electrolyte. EIS measurements were carried out after recharging the battery 10 mAh. Ew–Ec (red), Ew (green), and Ec (blue) curves are included in all figures.
Batteries 08 00221 g007
Publisher’s Note: MDPI stays neutral with regard to jurisdictional claims in published maps and institutional affiliations.

