
Fabrication of TiFe-Based Electrodes Using High-Energy Ball Mill with Mn Additive for NiMH Batteries


1
School of Metallurgy and Materials Engineering, College of Engineering, University of Tehran, Tehran 11155-4563, Iran
2
Department of Applied Physics, KTH Royal Institute of Technology, SE-106 91 Stockholm, Sweden
*
Authors to whom correspondence should be addressed.
Batteries 2022, 8(10), 182; https://doi.org/10.3390/batteries8100182
Submission received: 8 August 2022
/
Revised: 7 October 2022
/
Accepted: 11 October 2022
/
Published: 14 October 2022
Abstract
:Binary and ternary (with the addition of Mn) TiFe-based intermetallic compound powders were fabricated by high energy ball milling, and their electrochemical behavior as negative electrodes was investigated in 6M-KOH. X-ray diffraction exhibited the single phase of nanostructured binary and ternary TiFe-based crystallites after 20 h of milling followed the amorphous phase formation. Addition of Mn increased peak broadening and in turn decreased the nanocrystallite size of TiFe. Electrode properties of 20, 40, 60, and 70 h binary milled products showed that the discharge capacity of the 60 h one offered a maximum discharge capacity of ~169 mAhg−1. Although substitution of Mn for Ti (Ti1−xFeMnx, x = 0.1, 0.2) caused a decrease in initial discharge capacity, the periodic stability increased compared to the binary TiFe and ternary TiFe1-xMnx (x = 0.1, 0.2). The ternary Ti0.9FeMn0.1 electrode maintained ~53% of its initial discharge capacity after five cycles of charge–discharge; this was just 28% in the case of binary TiFe electrode.
1. Introduction
Hydrogen as a source of clean energy is considered as an alternative to the fossil fuels-based economy and can be used in the production of electrical power, employing internal combustion engines, fuel cells, or batteries [1]. In the case of batteries, hydrogen can form interstitial solid solution with electrode material. In fact, hydrogen diffuses into the interstitial sites of the host metal during charging cycle and forms a metal hydride (MH) [2]. One of the main applications of these hydride alloys is the negative electrode (anode) of nickel–metal hydride (NiMH) rechargeable batteries [3]. It was shown that the demand for NiMH batteries increased steadily to about USD 900 million in 2012 [4]. Nickel–metal hydride batteries are rechargeable like the conventional Ni–Cd batteries but have a higher discharge capacity. Due to the absence of toxic elements such as Cd, they are well compatible with the environment and a suitable alternative to Ni–Cd batteries [3]. Hydrogen storage alloys as negative electrodes must have special characteristics such as high electrochemical capacity, high catalytic activity, and resistance to oxidation.
The intermetallic compound TiFe of cubic CsCl-type structure is one of the most attractive hydrogen storage materials due to its low cost, non-toxicity, and reversible hydrogen-absorbing/releasing capacity (up to 1.9 wt.%) [5,6]. It is lighter and cheaper than LaNi5 alloys (anode material for commercial NiMH batteries). However, the application of TiFe intermetallic alloy in batteries is limited mainly because of the need of a quite tough activation treatment and also slow hydrogen charge/discharge kinetics [7]. The activation treatment arises from the fact that TiFe does not readily absorb hydrogen since TiFe is sensitive to air moisture and might react with it, forming oxides and hydroxides and then hindering the first absorption reaction with hydrogen; this was effectively overcome by using high-energy ball milling (HEBM) for the production of TiFe powder due to the reduction of particle size and creation of new clean surfaces [8,9]. HEBM is a solid state synthesis technique for fabricating nanostructured powder materials; an alloy or compound is formed without the melting state by intense deformation of initial various powders. The ball/powder/cup collisions cause powder fracturing and cold welding, producing clean interfaces at the atomic scale. HEBM represents one of the most efficient and low-cost processes to fabricate metallic powders with fine microstructures and dimensions. The associated violent deformation pushes atoms into the positions of newly formed powder material with a fine nanostructure known to improve greatly the kinetics and activation [10].
In order to further improve the charge/discharge kinetics of the TiFe intermetallic compound, its elements can be partially substituted with transition metals [11,12,13,14]. By partial substitution of other atoms, the density of crystal defects increases, and in addition, lattice distortion occurs. Moreover, there is a tendency to form oxide film (titanium oxide) changes, and these can facilitate the increase in the permeability of hydrogen into TiFe structure. So far, a few researchers have reported for hydrogen absorption/desorption or charge/discharge in the solid state (hydride) in TiFe nanostructures with different microstructures and different additives. Various alloying elements such as Ni [11], Co [12], Pd [13], Al, and Cr [14] have been used as additives in the TiFe-based alloys.
The aim of the current research is to produce TiFe-based nanocrystalline alloy with different amounts of Mn. Ti and Fe were partially replaced by Mn. Mn is a well-known catalyst for hydrogenation of various metal hydrides [15]. Mainly, the effect of Mn addition was investigated on the kinetics of hydrogen absorption/desorption of TiFe–based hydrogen storage materials; partial substitution of Fe by Mn is also reported to reduce the need of alloy activation and moreover promotes lower equilibrium pressures at room temperature for hydrogen [16,17,18], Thus, substituted Ti(Fe1−xMnx)0.9 alloys combine easy activation and low plateau pressures at room temperature, being good candidates for hydrogen storage applications near normal conditions of pressure and temperature [16].
In the present investigation, we aimed to find Mn role on the properties of TiFe-based electrodes. In order to prepare nanostructured powder products, the HEBM method was used. The effect of milling variables and the composition of the initial powder mixture on the chemical composition, crystal structure, and morphology of the milled products were investigated. Additionally, the effect of pellet composition, milling time, and Mn addition on electrochemical properties was investigated. The main goal is to determine the appropriate amount of Mn additive in order to achieve the best electrochemical properties.
2. Experimental Procedure
2.1. Materials and Instrumentation
Fe powder (purity of 99.9% and particle size less than 20 µm from Merck Inc., Darmstadt, Germany), Ti powder (purity of 99.9% and particle size of about 20 µm, Merck Inc., Darmstadt, Germany), and Mn powder (purity of 99.9% and particle size of about 5 µm, Merck Inc., Darmstadt, Germany) were purchased.
X-ray diffraction method (XRD, Rigaku – Dmax2500, Tokyo, Japan) under Cu-Kα single-wave radiation at a current of 40 mA and a voltage of 40 kV and a step size of 0.02 degrees and a step time of 0.25 s in the angular range of (20–100°) was used to study the phase and structural changes of the products. Microstructural studies were performed using scanning electron microscopy (SEM, Cam scan MV2300, 20 kV, Ontario, Canada). The differential calorimetry test was also performed by a differential scanning calorimeter (DSC, PerkinElmer STA 6000, Waltham, MA, USA) under argon gas and with a heating rate of 10 °C min−1. Electrochemical tests were performed using a potentiostat/galvanostat instrument (model WPG100e, WonATech co., Seoul, South Korea).
2.2. High-Energy Ball Milling
The HEBM process was carried out by a planetary mill in electroplated steel chambers under argon gas atmosphere (99.9995%). Table 1 lists the specifications of the milling machine and the milling variables.
The mill has two chambers. Due to the oxidation of Ti in the air, chambers were filled by argon gas to prevent the reaction of air gases with the powders. The milling time varied up to 90 h (h). The binary powder composition of Ti and Fe is 50:50 atomic ratio and ternary alloys were produced according to Table 2.
2.3. Investigation of Crystal Size and Lattice Strain
The Williamson–Hall equation was used to calculate the crystallite size and lattice strain [19]:
where β is the full width at half maximum (FWHM) of peak in radians, λ is the wavelength of the X-ray, t is the average diameter of the crystallites, θ is the Bragg angle, and ε is the lattice strain.
where βreal is the actual broadening of the diffraction line caused by the reduction of grain size and lattice strain, βobs is the broadening observed from the pattern (measured value), and βinst is the broadening related to the instrument (diffractometer).
According to the straight line of βcos θ vs. 4sin θ, the lattice strain value (the line gradient) and the average size of the grains (line intercept) were calculated.
2.4. Electrochemical Experiments
In order to make the MH negative electrode for electrochemical tests, 125 mg of the powder of milled alloys was mixed with pure spherical shape Ni powder (99.5%, ≤1 μm, Merck Inc.) as an electrical conductor in a ratio of 1:4. Each obtained mixture was pressed to a pellet of 10 mm diameter and 3 mm height using a manual press under a pressure of 30 MPa. Each electrode was named with its milled product code.
A tri-electrode half-cell was used for electrochemical measurements; the fabricated MH electrode as a working electrode, a high surface area nickel wire as the counter electrode, and an Hg/HgO electrode as a reference electrode were used. KOH (6 mol/L) solution was used as electrolyte. Electrochemical experiments were conducted using a WonATech WPG100e potentiostat/galvanostat. In order to study the discharge capacity and cyclic stability, the electrodes were charged at a current density of 800 mA/g for 40 min (enough for full hydrogen evolution), and they were discharged relative to the reference electrode after the 5 min rest (open circuit) with a current density of 80 mA/g until the stopping (cut-off) potential of −0.6 V versus the reference electrode. This process was also repeated for several cycles of charging and discharging. Charge transfer reaction in Ni–MH batteries is based on reversible shuttling of hydrogen proton between positive and negative electrodes. The reactions at charge (left to right) and reversible discharge are as follows [20]:
Positive electrode (cathode): Ni (OH)2(s) + OH−(aqueous) ↔ NiO (OH)(s) + H2O(l) + e−
Negative electrode (anode): M(s) + H2O(l) + e ↔ MH(s) + OH−(aqueous)
The overall cell reaction is as follows:
where s, l, and M represent solid, liquid, and a metal hydride alloys, respectively, that are capable of reversibly absorbing and desorbing hydrogen atoms.
Ni (OH)2(s) + M (s) ↔ NiO(OH)(s) + MH (s)
3. Results and Discussion
3.1. Structural Characterization of the HEBM Products
In order to achieve the TiFe intermetallic phase, HEBM was performed using 20 mm balls at a speed of 450 rpm. Figure 1 shows the XRD patterns of TiFe milled products after different milling times.
According to Figure 1, the solubility of Ti and Fe increases gradually during the HEBM process. The formation of solid solution is a manifestation of mechanical alloying phenomena due to severe plastic deformation of cold welded powders. Severe plastic deformation makes the particle size smaller and reduces the crystallite sizes of Ti and Fe powder particles. Therefore, the surface area of grain boundaries increases, which reduces the distance between the particles and accelerates the diffusion of the two elements.
Nanocrystalline materials are two-component systems consisting of nanocrystals and grain boundaries/interfaces. The distribution of grain boundaries in a material is expressed as 3δ/d, where δ is the grain boundary thickness and d is the crystallite size [21]. Usually, the interface width is about 1.2 nm [22]. As a result, the 30 h milled product showed a TiFe-based crystallite size of ~9.9 nm, and contains ~36.36% areas of grain boundaries. In addition, during mechanical alloying, severe deformation causes the formation of defects in the particles and creates local stresses across the grain boundaries and develops a high energy level for nanocrystals. Moreover, substantial increase in temperature occurs during mechanical alloying that accelerates the diffusion process. On the other hand, it provides equilibrium conditions in the powder mixture and reduces the solid-state solubility. Therefore, it balances the alloyed system and provides a stable condition, which ultimately leads to the formation of a homogeneous solid solution during mechanical alloying.
According to the XRD results, broadened peaks of Fe and Ti were found after 5 h of milling. As the milling time extended to 10 h, the peaks are broadened in the 2θ degrees of 40–45, which indicated the formation of partially amorphous phase in the milled product. Fe peaks can be distinguished, but Ti peaks can hardly be detected. After 10 h of milling, the TiFe intermetallic compound gradually appears. This nanocrystalline phase becomes dominant in the 15 h milled product. In addition, there is also a substantial amorphous phase that broadened the main peak in an asymmetrical fashion. The single phase of nanocrystalline TiFe was found after 20 h of milling. TiFe peaks intensities increased with the increase of milling time (Figure 1). Jurczyk et al. (9) conducted mechanical alloying of Ti–Fe powder mixture (53.85 wt.% Ti 146.15 wt.% Fe) subjected to milling for increasing time using SPEX 8000 Mixer Mill and found that the powder mixture milled for more than 25 h transformed completely to the amorphous phase without formation of another phase. However, formation of the nanocrystalline TiFe was achieved by annealing the amorphous material in a high purity argon atmosphere at 750 C for 0.5 h; this reflects that the milling parameters of the present investigation provided the required energy for the formation of TiFe nanocrystal, and thus, there was no need for the subsequent annealing treatment. In another investigation on mechanical alloying of TiFe using elemental powder mixture, milling times of 2.5, 5, 10, and 20 h were employed [23]. It was found that TiFe single-phase alloy with CsCl-type structure was synthesized after 20 h of ball milling followed the amorphous phase formation, which is in agreement with the present work. However, here it was shown the formation of TiFe intermetallic compound occurred after 15 h of milling.
In the case of milled products of powder mixtures with Mn substituted for Fe, single-phase TiFe-based crystallites were achieved after 20 h of milling; however, the XRD pattern of the Fe10 milled product exhibited more peak broadening and in turn smaller mean crystallite size. The XRD patterns of the Fe10 milled product after different milling times are presented in Figure 2.
After 10 h of milling, peaks related to Ti and Mn can hardly be detected. Broadened Fe peaks were found that shifted slightly to lower angles. Calculations showed that the Fe lattice constant increased (Figure 3); this reflects of the diffusion of Ti and Mn in Fe lattice. As can be seen in Figure 2, after 15 h of milling, the XRD pattern is consistent with the dominance of a ternary amorphous phase.
Nanocrystalline TiFe intermetallic compound formed from ternary solid solution of Mn substituted for Fe after 20 h of milling. The intensities of its diffraction peaks gradually increased by increasing the milling time.
In the case of the milled products with Mn substituted for Ti, Fe and Ti diffraction lines showed broadening and their intensities exhibited decreasing after 5 h of milling (e.g., Figure 4 for Ti20); however, no reflection was found related to Mn. The initial formation of nanocrystalline TiFe occurred after 10 h of milling. It is clear that addition of Mn for Ti not only kinetically speeds up the formation of TiFe-based crystallites but also decreased its mean size due to the associated peak broadening. Peaks of Ti can hardly be detected, while peaks related to Fe were found even up to 15 h of milling. Dominant TiFe-based nanocrystallites were achieved after 20 h of milling. In general, the XRD patterns of Ti20 milled product exhibited more peak broadening than those of the binary TiFe and ternary compositions with Mn substituted for Fe; this means that smaller size of TiFe-based nanocrystallites were produced.
In order to show structural changes of the powder mixtures by HEBM, it is better to study the milled products after 10 h of milling where initial crystal structure are observed together with the formation of TiFe-based crystallites. Regarding this, and for comparison, the XRD patterns of TiFe, Ti20, and Fe20 milled products after 10 h of milling are presented in Figure 5.
As can be seen, in all milled products, the intensities of the diffraction peaks of Ti and Fe gradually decreased and the width of peaks increased as the milling time increased. The broadening of peaks shows that the crystallite size decreases rapidly with the start of milling. In addition, the shift of Fe and Ti main peaks is observed. According to Bragg’s law and atomic radiuses of Fe (0.124 nm) and Ti (0.147 nm), the diffusion of Ti atoms in Fe increases the lattice constant and thus shifts the XRD peaks of Fe to lower angles. Moreover, since the diffusion coefficient of Ti in Fe is larger than the diffusion coefficient in Ti itself, Ti substitutes in the Fe lattice. As the milling time increases, the defects and dislocations increase so that the diffusion rate of Ti increases and in turn the lattice constant of Fe gradually increases.
Figure 6 shows the lattice constants of TiFe intermetallic compound formed at different milling times. With increasing milling time, TiFe lattice constant decreases and its XRD peaks shift to higher angles. According to Figure 6, it can be observed that in the milled products of Mn substituted for Ti and Fe, the lattice constant of TiFe-based crystal is lower and higher than that of the TiFe milled products, respectively.
Figure 7 shows the crystallite size of TiFe-based structure formed in the milled products as a function of milling times.
During the process of mechanical alloying, due to the gradual increase of the crystal defects density and also increase of the powder temperature, the diffusion and recovery of dislocations may occur. The minimum grain size can be determined as a result of the balance between the rate of dislocations formation and the rate of recovery and recrystallization of the material [21,24].
According to Figure 7, Mn substituting for Ti increases the lattice strain and reduces the crystallite size. In contrast, Mn substituting for Fe reduces the strain and increases the crystallite size; these can be explained by Equation (3), as proposed by Asaro et al. [25]:
where τp equals the shear stress in slip plane that applied to the material, G is the shear modulus, b is the Burgers vector, d is the crystallite size, and γSF is the stable stacking fault energy. Using this equation, it is possible to calculate the modified Schmid stress for nanocrystalline materials.
The shear modulus values of Mn, Fe, and Ti are 74, 82, and 44.16, respectively, hence substituting Mn for Fe reduces the Schmid stress, and therefore the strain created during the HEBM process decreases and the crystallite size increases. Contrary to this, substituting Mn for Ti has an inverse effect. The shear modulus of Mn is higher than that of Ti, so it creates a higher Schmid stress and more lattice strain, and therefore the crystallite size decreases.
3.2. Morphology and Chemical Composition of the Milled Products
SEM images of raw powder materials used in high-energy ball milling are presented in Figure S1 (in the Supplementary Materials). Figure 8 shows SEM images of TiFe-based milled products after different milling times.
As can be seen in Figure 8, the particles size gradually decreases with the increase of milling time. In the early times of milling, the powders of the raw materials easily deformed by the compressive forces and turn into very thin layers, while relatively brittle particles tend to resist compressive forces. Therefore, brittle particles are less deformed and ductile particles cause connection between brittle particles. This difference in the ductility of particles is believed to be responsible for the wide particle-size distribution of the milled products after relatively lower milling times. With the increase of milling times, more uniformity in particle-size distribution achieved, and noticeable changes in the morphology of particles took place. By increasing the time of HEBM, a homogeneous compound formed with the same chemical composition of the powder mixture. Figure 9 presents the effect of Mn addition on the microstructure of TiFe, Fe20, and Ti20 milled products after 40 h of milling.
According to Figure 9, it can be seen that by adding Mn substituting for Fe in the TiFe composition, the particle size of the milled products is slightly larger than the milled products obtained from the stoichiometric composition in the absence of Mn. However, in the Ti20 milled product, the particle size decreased. Figure S2 (Supplementary Materials) shows the EDS analysis of TiFe powder mixture after 60 h of milling. The absence of the oxygen peak indicates that the milled product was not contaminated since the process was conducted under a high quality argon (99.9995% purity) environment. In order to check the amount of Fe and Cr pollution that entered from the pellets and chamber to the milled products, the atomic percentage of the existing elements is given in Table S1 (Supplementary Materials). As can be seen, the Fe amount is slightly more than the initial stoichiometric values (TiFe), but no Cr was detected.
3.3. Phase Transformation of the Milled Product
In order to study the crystallization temperature of amorphous TiFe-based powder, DSC analysis was performed. Figure 10 shows the DSC curve of the TiFe milled product after 10 h of milling.
As can be seen in Figure 10, there are two exothermic transformation peaks at 410 and 690 °C and one endothermic transformation peak at 600 °C. The first exothermic peak is related to the release of the strain stored in the alloy during 15 h of milling, and the second exothermic peak is related to the crystallization of TiFe milled product. Endothermic transformation is related to the rearrangement of atoms before crystallization. In amorphous materials, due to the lack of order in the structure, before the crystallization and rearrangement of the atoms, some atomic bonds of the amorphous alloy are broken, which is an endothermic transformation [26].
Figure S3 (Supplementary Materials) shows the XRD pattern of the heat-treated 15 h milled product. As can be seen in Figure S3, after crystallization, the peaks of TiFe crystals are visible, which indicates that single phase TiFe intermetallic compound can be achieved by heat treating a milled product after relatively lower milling time.
3.4. Electrochemical Properties of Electrodes Made from the Milled Products
3.4.1. Milling Time Effect
Figure 11 shows the graph of the discharge capacity vs. the number of cycles for five sequential cycles of the electrode made from the TiFe milled product at different times of milling and obtaining plateaus after the third cycles.
As can be seen in Figure 11, as the milling time increases to 60 h, the maximum discharge capacity in the first cycle increases, but in the 70 h-milled product, the discharge capacity decreases in the first period. The TiFe intermetallic compound formed after 20 h of milling, and with the increase of the milling time, its amount increases in the milled product, and its mean crystallite size decreases. The latter provides better diffusion pass for charge and discharge of hydrogen which increases the discharge capacity as well, but in the 70 h milled product, the discharge capacity decreases; this could be due to the increase in strain and excessive distortion in TiFe-based lattice that limits the placement of hydrogen atoms in the lattice. Hence, less hydrogen is absorbed, and, in turn, the discharge capacity decreased.
Another reason can be the agglomeration of particles as a result of the long milling time, which causes the reduction of active surfaces for hydrogen absorption and hence a lower amount of discharge capacity.
According to Figure 11, the discharge capacity suddenly decreases after one period and drops from the maximum value of 169 mAh/g for the 60 h milled product to 51.5 mAh/g in the second period. Additionally, in the fifth charge–discharge cycle, it reaches 28.6 mAh/g. This is believed to be attributed to the irreversible oxidation of the electrode in 6 M-KOH solution since the greater the cycle number the thicker the oxide layer and in turn the narrower the path of hydrogen penetration and the lower discharge value. In other words, the formation of iron and titanium oxide layers on the surface of the powders during the charge–discharge process prevents the absorption of hydrogen into TiFe-based structure and reduces the discharge capacity. As the charge–discharge process continues, the discharge capacity decreases rapidly due to the thickening of the oxide layer.
The electrochemical capacity of hydrogen strongly depends on the microstructure and phases present in the electrode material. The product obtained from HEBM is generally a material consisting of a nanocrystalline/amorphous structure or their mixtures; therefore, the high capacity obtained from the TiFe milled product compared to that produced by melting methods [8] reflects the higher hydrogen absorbing efficiency of the milled product.
In addition, according to Figure 11, by using the high-energy ball milling method, there is no need to perform complex activation operations for hydrogen absorption and desorption, and after a charge–discharge period, the maximum discharge capacity is achieved. In addition, HEBM dramatically increases the kinetics of hydrogen absorption and desorption by creating very fine clean surfaces on the nanometer scale [27].
As it can be seen in Figure 11, with the increase of milling time to 70 h, the discharge capacity in the fabricated electrode decreases. This reduction in capacity may be due to the formation of a larger portion of TiFe intermetallic compound in amorphous form.
3.4.2. The Additive Effect of Mn
Since the maximum discharge capacity was obtained in the TiFe electrode made from 60 h milled product, in order to investigate the effect of Mn on electrochemical behavior, the discharge capacity of TiFe, Fe10, Fe20, Ti10, and Ti20 electrodes made from 60 h milled products was measured as a function of cycle numbers and in general obtained plateaus after the third cycles (Figure 12).
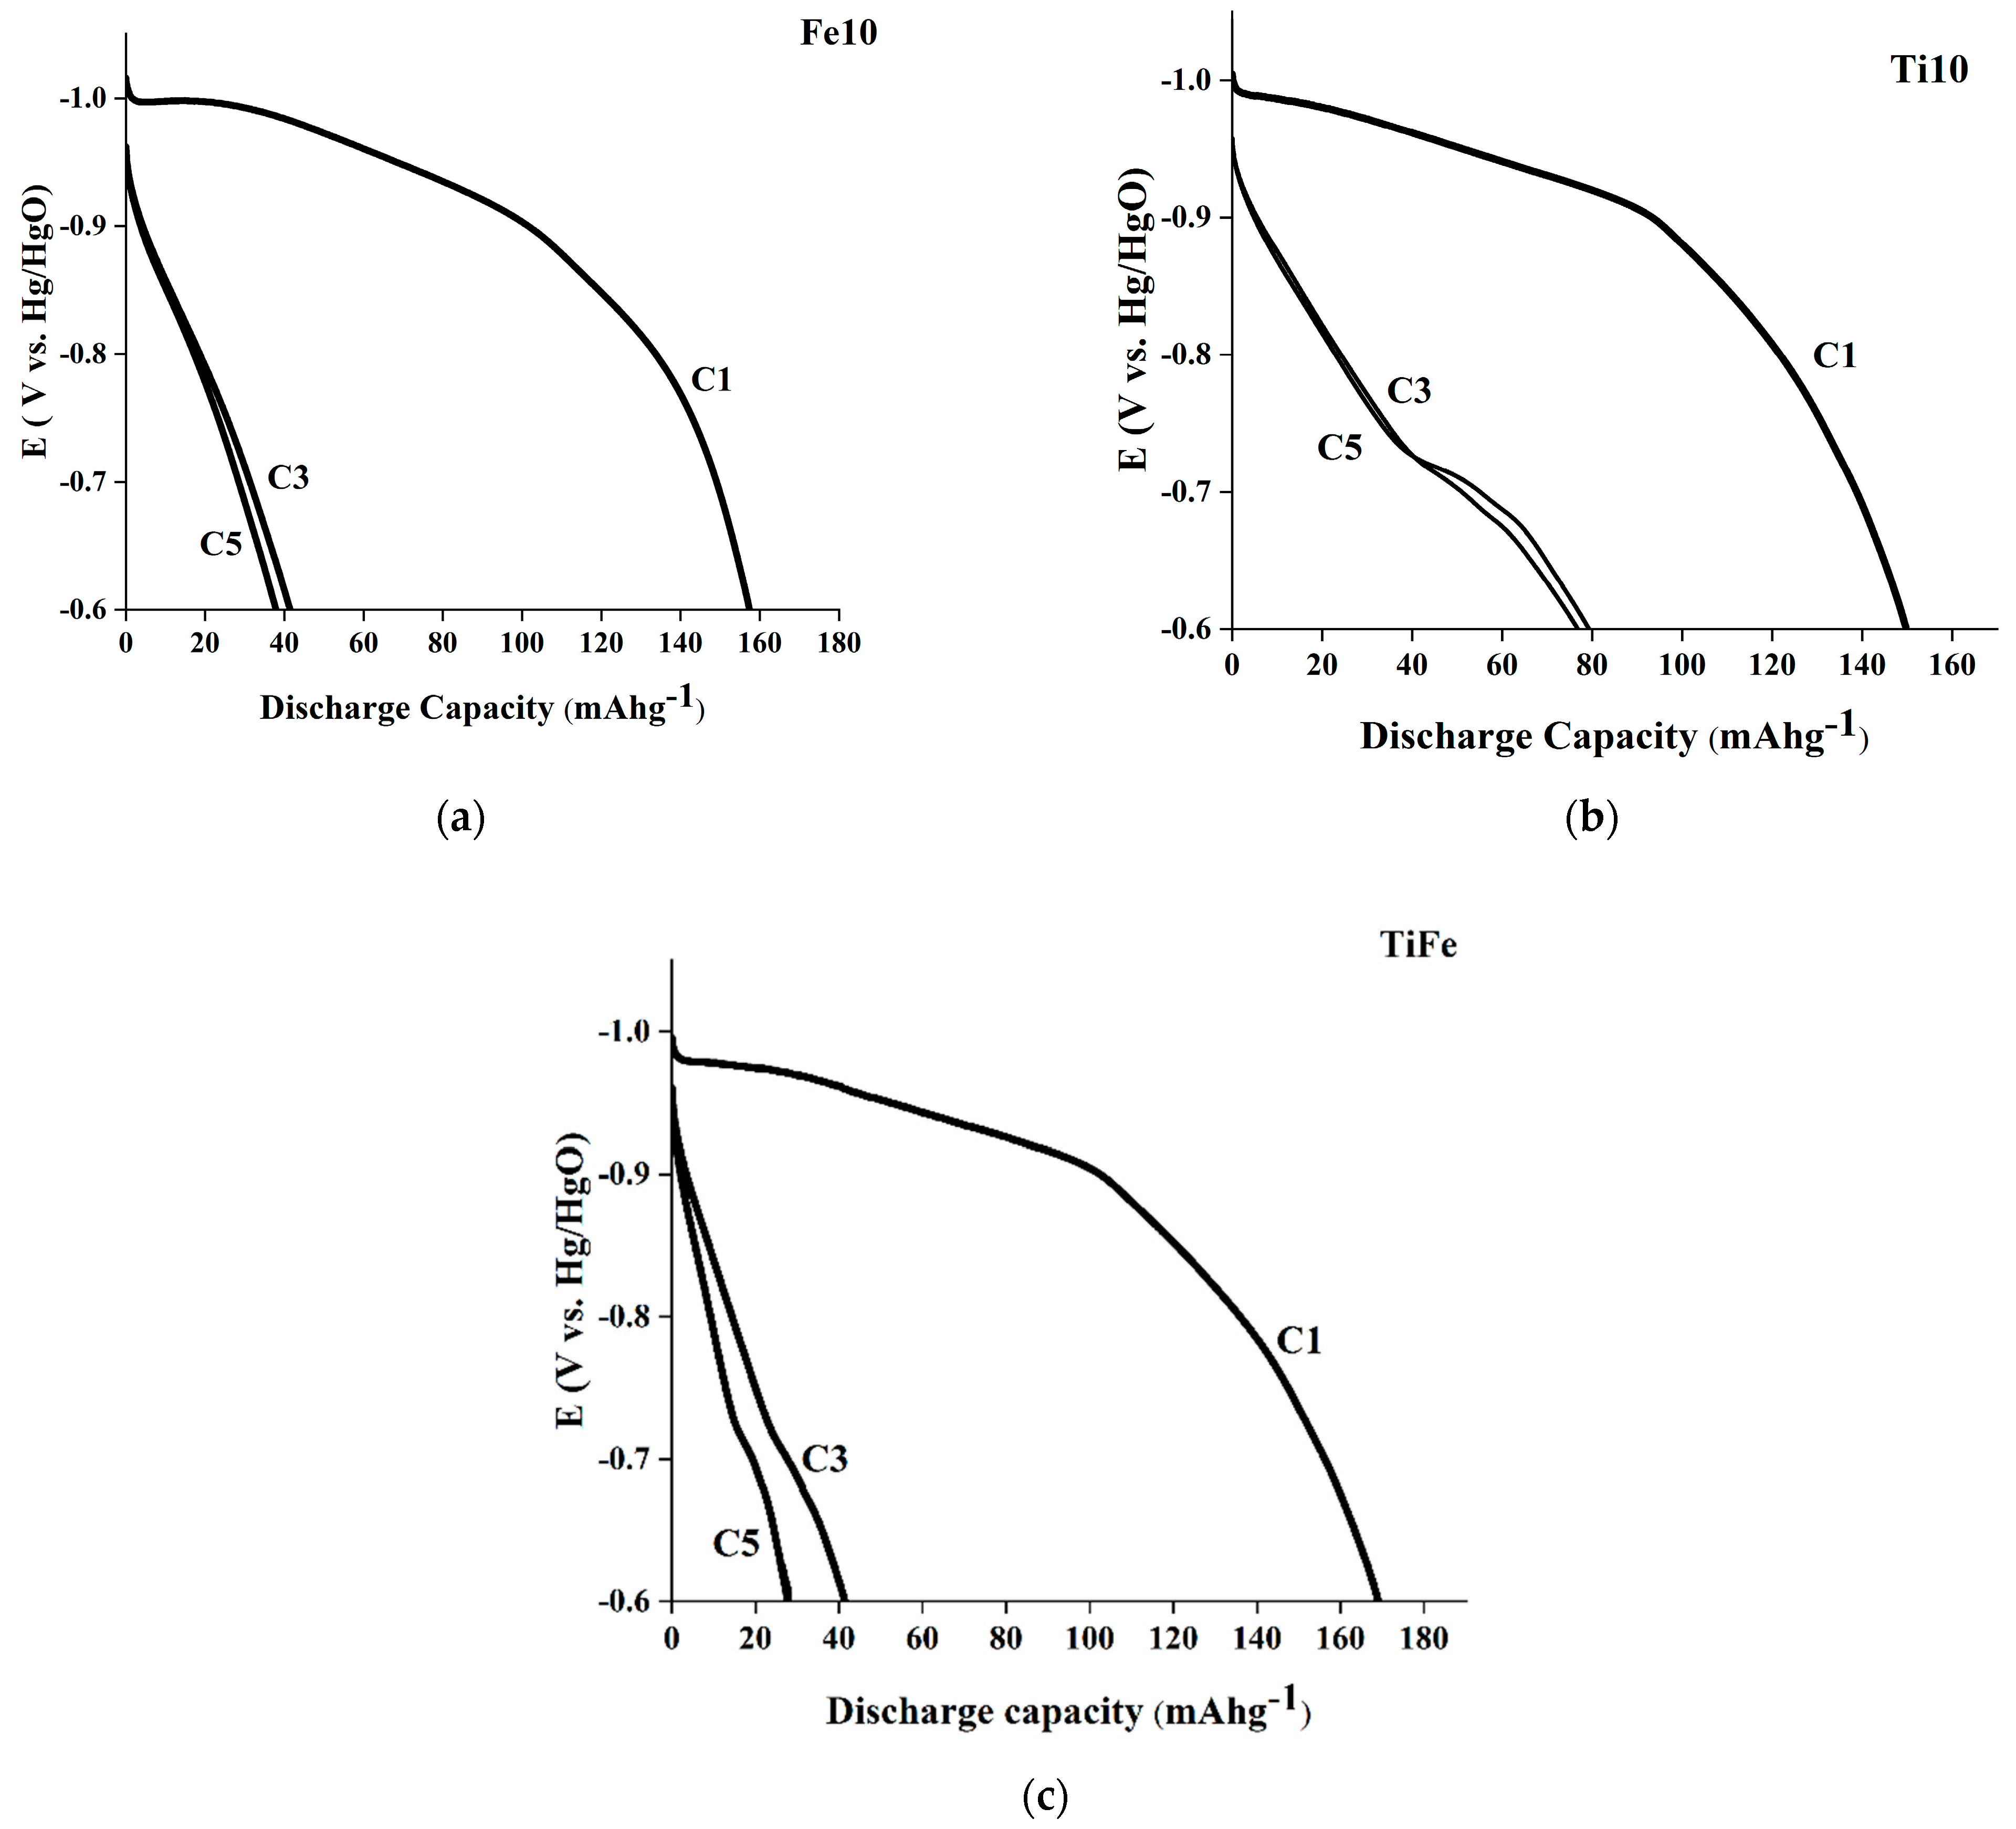
According to Figure 12, generally the addition of Mn increases the cyclic stability for the electrodes made from ternary milled product that Mn substitute for Ti (i.e., Ti10 and Ti20), but the initial discharge capacity decreases compared to binary TiFe electrode. By substituting Mn for Ti, the concentration of Ti in the milled product is reduced; this delayed the formation of TiO layer on the electrode as a reaction of Ti with KOH electrolyte. Incidentally, the addition of Mn increases the resistance to corrosion during the absorption (charge) and desorption (discharge) of hydrogen [28]. Thus, Ti0.9FeMn0.1 electrode (named Ti10) maintain ~53% of its initial discharge capacity after five cycles of charge–discharge; this is just 28% in the case of binary TiFe electrode. Figure 13 shows potential changes during discharge in the first, third, and fifth periods for the TiFe, Ti10, and Fe10 electrodes. Figure 13 shows the increase of the electrode potential from −1.2 to −0.6 V compared to the reference electrode, which is related to the release of hydrogen. In these experiments, the electrodes were charged with a current density of 800 mA/g for 1 h and discharged with a current density of 80 mA/g to a potential of −0.6 compared to the Hg/HgO reference electrode. According to Figure 13, the discharge curve changes in different cycles. In the first cycle, a smooth potential region is observed for all electrodes, which is related to the hydrogen removal process. By increasing the number of cycles, the hydrogen release potential (hydrogen discharge plateau) increases and the discharge duration decreases. Brittleness caused by the absorption and desorption of hydrogen during charge–discharge causes the cracking and breaking of particles that provides the formation of new surfaces. This intensifies the irreversible oxidation phenomena, so the discharge capacity decreases [29].
4. Conclusions
The formation of TiFe intermetallic compound from binary (Ti, Fe) and ternary (Ti, Fe, and Mn) elemental powder mixtures using HEBM was investigated. In addition, the hydrogen storage properties of the electrodes made from the milled products were measured. The binary mixtures of Ti and Fe powders and ternary mixtures of Ti, Fe and Mn powders inside the steel chamber of a planetary ball mill using steel balls under a neutral gas (argon) environment were employed to form TiFe-based intermetallic compound powders. The results showed that an amorphous phase formed in the binary and ternary mill products after 10 h of milling. By increasing the milling time to 20 h, single-phase nanocrystalline TiFe-based intermetallic compounds formed. Addition of Mn was found to decrease the nanocrystallite size of TiFe. By further increasing the milling time up to 60 h, the discharge capacity of the fabricated electrodes from the milled products increased, but the discharge capacity decreased again in the electrodes made from 70 h milled products. Substitution of Mn for Ti reduced the initial discharge capacity but improved the cyclic stability of the fabricated electrodes. However, substitution of Mn for Fe reduced the discharge capacity and also caused a drop in cyclic stability. The electrode with no Mn content that was made from 60 h milled product showed the maximum discharge capacity. However, the results showed that substitution of Mn for Fe yields a discharge capacity close to that of the binary TiFe electrode. The electrode with stoichiometric composition of TiFe0.9Mn0.1 showed the highest discharge capacity among the fabricated ternary Ti-Fe-Mn ones.
Supplementary Materials
The following supporting information can be downloaded at: https://www.mdpi.com/article/10.3390/batteries8100182/s1, Figure S1: SEM images of raw materials before HEBM: a) Ti, b) Fe, and c) Mn; Figure S2: EDS analysis of TiFe intermetallic compound after 60 h of milling; Figure S3: XRD pattern of the heat treated milled product exhibiting sharp peaks of TiFe intermetallic compound crystals; Table S1: Atomic and weight percentages of the elements in TiFe milled product after 60 h of milling.
Author Contributions
Investigation, A.Z.; Methodology, A.Z.; Project administration, S.F.K.-B.; Resources, S.F.K.-B.; Supervision, S.F.K.-B.; Validation, A.Z.; Visualization, A.Z.; Writing – original draft, Z.L.; Writing – review & editing, S.F.K.-B. and B.H. All authors have read and agreed to the published version of the manuscript.
Funding
This research received no external funding.
Institutional Review Board Statement
Not applicable.
Informed Consent Statement
Not applicable.
Data Availability Statement
Data sharing not applicable to this article as no datasets were generated or analyzed during the current study.
Conflicts of Interest
The authors declare no conflict of interest.
References
- Varin, R.A.; Czujko, T.; Wronski, Z.S. Nanomaterials for Solid State Hydrogen Storage; Springer Science & Business Media: Berlin, Germany, 2009. [Google Scholar]
- Hirscher, D.M.; Dornheim, M. Tailoring Reaction Enthalpies of Hydrides. In Handbook of Hydrogen Storage; Wiely: Hoboken, NJ, USA, 2010. [Google Scholar]
- Omar, N.; Firouz, Y.; Monem, M.A.; Samba, A.; Gualous, H.; Coosemans, T.C.; Van Mierlo, J. Analysis of nickel-based battery technologies for hybrid and electric vehicles. In Reference Module in Chemistry, Molecular Sciences and Chemical Engineering; Elsevier: Amsterdam, The Netherlands, 2014. [Google Scholar]
- Parvez, M.A.; Nazmul Huda, M.; Hisan Farjana, S.; Lang, C. Comparative Life Cycle Environmental Impact Analysis of Lithium-Ion (LiIo) and Nickel-Metal Hydride (NiMH) Batteries. Batteries 2019, 5, 22. [Google Scholar]
- Sujan, G.K.; Pan, Z.; Li, H.; Liang, D.; Alam, N. An overview on TiFe intermetallic for solid-state hydrogen storage: Microstructure, hydrogenation and fabrication processes. Crit. Rev. Solid State Sci. 2020, 45, 410–427. [Google Scholar] [CrossRef]
- Kobayashi, Y.; Teah, H.Y.; Hanada, N. Chemical synthesis of unique intermetallic TiFe nanostructures originating from the morphology of oxide precursors. Nanoscale Adv. 2021, 3, 5284–5291. [Google Scholar] [CrossRef]
- Zhao, X.; Ma, L. Recent progress in hydrogen storage alloys for nickel/metal hydride secondary batteries. Int. J. Hydrogen Energy 2009, 34, 4788–4796. [Google Scholar] [CrossRef]
- Ignacio, E.; Gómez, L.; Edalati, K.; Antiqueira, F.J.; Coimbrão, D.D.; Zepon, G.; Leiva, D.R.; Ishikawa, T.T.; Cubero-Sesin, J.M.; Botta, W.J. Synthesis of Nanostructured TiFe Hydrogen Storage Material by Mechanical Alloying via High-Pressure Torsion. Adv. Eng. Mater. 2020, 22, 2000011. [Google Scholar]
- Jankowska, E.; Jurczyk, M. Electrochemical behaviour of high-energy ball-milled TiFe alloy. J. Alloy. Compd. 2002, 346, L1–L3. [Google Scholar] [CrossRef]
- Jurczyk, M.; Jankowsk, E.; Makowieck, M.; Wieczorek, I. Electrode characteristics of nanocrystalline TiFe-type alloys. J. Alloy. Compd. 2003, 354, L1–L4. [Google Scholar] [CrossRef]
- Ćirić, K.D.; Kocjan, A.; Gradišek, A.; Koteski, V.J.; Kalijadis, A.M.; Ivanovski, V.N.; Laušević, Z.V.; Stojić, D. A study on crystal structure, bonding and hydriding properties of Ti–Fe–Ni intermetallics—Behind substitution of iron by nickel. Int. J. Hydrogen Energy 2012, 37, 8408–8417. [Google Scholar] [CrossRef]
- Jankowska, E.; Makowiecka, M.; Jurczyk, M. Electrochemical performance of sealed NiMH batteries using nanocrystalline TiNi-type hydride electrodes. Renew. Energy 2008, 33, 211–215. [Google Scholar] [CrossRef]
- Miyamura, H.; Takada, M.; Kikuchi, S. Characteristics of hydride electrodes using Ti–Fe–Pd–X alloys. J. Alloy. Compd. 2005, 404, 675–678. [Google Scholar] [CrossRef]
- Zadorozhnyy, V.Y.; Klyamkin, S.N.; Zadorozhnyy, M.Y.; Bermesheva, O.V.; Kaloshkin, S.D. Mechanical alloying of nanocrystalline intermetallic compound TiFe doped by aluminum and chromium. J. Alloy. Compd. 2014, 586, S56–S60. [Google Scholar] [CrossRef]
- Patel, A.K.; Duguay, A.; Tougas, B.; Schade, C.; Sharma, P.; Huot, J. Microstructure and first hydrogenation properties of TiFe alloy with Zr and Mn as additives. Int. J. Hydrogen Energy 2020, 45, 787–797. [Google Scholar] [CrossRef]
- Challet, S.; Latroche, M.; Heurtaux, F. Hydrogen Storage in TiFe(0.70 + x)Mn(0.20 − x) (0 < x < 0.15) and TiFe(0.70)Mn(0.20 − y)Ni(y) (0 < y < 0.08) Metallic Alloys. Mater. Sci. Technol. 2005, 3, 13–21. [Google Scholar]
- Yang, T.; Wang, P.; Xia, C.; Liu, N.; Liang, C.; Yin, F.; Li, Q. Effect of chromium, manganese and yttrium on microstructure and hydrogen storage properties of TiFe-based alloy. Int. J. Hydrogen Energy 2020, 45, 12071–12081. [Google Scholar] [CrossRef]
- Shang, H.; Zhang, Y.; Li, Y.; Qi, Y.; Guo, S.; Zhao, D. Effects of adding over-stoichiometrical Ti and substituting Fe with Mn partly on structure and hydrogen storage performances of TiFe alloy. Renew. Energy 2019, 135, 1481–1498. [Google Scholar] [CrossRef]
- Williamson, G.K.; Hall, W.H. X-ray line broadening from filed aluminium and wolfram. Acta Metall. 1953, 1, 22–31. [Google Scholar] [CrossRef]
- Pollet, B.G.; Staffel l Shang, J.L.; Molkov, V. Fuel-Cell (Hydrogen) Electric Hybrid Vehicles in Alternative Fuels and Advanced Vehicle Technologies for Improved Environmental Performance, Edited by Richard Folkson; Woodhead Publishing: Sawston, UK, 2014. [Google Scholar]
- Gleiter, H. Nanocrystalline materials. Prog. Mater. Sci. 1989, 33, 223–315. [Google Scholar] [CrossRef] [Green Version]
- Suryanarayana, C.; Froes, F.H. The structure and mechanical properties of metallic nanocrystals. Metall. Trans. A 1992, 23, 1071–1081. [Google Scholar] [CrossRef]
- Hotta, H.; Abe, M.; Kuji, T.; Uchida, H. Synthesis of Ti–Fe alloys by mechanical alloying. J. Alloy. Compd. 2007, 439, 221–226. [Google Scholar] [CrossRef]
- Koch, C.C. The synthesis and structure of nanocrystalline materials produced by mechanical attrition: A review. Nanostructured Mater. 1993, 2, 109–129. [Google Scholar] [CrossRef]
- Asaro, R.J.; Krysl, P.; Kad, B. Deformation mechanism transitions in nanoscale fcc metals. Philos. Mag. Lett. 2003, 83, 733–743. [Google Scholar] [CrossRef]
- Suryanarayana, C.; Inoue, A. Bulk Metallic Glasses, 2nd ed.; CRC Press: Boca Raton, FL, USA, 2017. [Google Scholar]
- Balcerzak, M.; Nowak, M.; Jakubowicz, J.; Jurczyk, M. Electrochemical behavior of nanocrystalline TiNi doped by MWCNTs and Pd. Renew. Energy 2014, 62, 432–438. [Google Scholar] [CrossRef]
- Rousselot, S.; Bichat, M.P.; Guay, D.; Roué, L. Structural and electrochemical hydriding characteristics of Mg–Ti-based alloys prepared by high energy ballmilling. J. Electrochem. Soc. 2009, 156, A967. [Google Scholar] [CrossRef]
- Etiemble, A.; Rousselot, S.; Guo, W.; Idrissi, H.; Roué, L. Influence of Pd addition on the electrochemical performance of Mg–Ni–Ti–Al-based metal hydride for Ni–MH batteries. Int. J. Hydrogen Energy 2013, 38, 7169–7177. [Google Scholar] [CrossRef]
Figure 1.
XRD patterns of TiFe milled products after different milling times in accordance with the formation of TiFe-based crystal structure.
Figure 1.
XRD patterns of TiFe milled products after different milling times in accordance with the formation of TiFe-based crystal structure.
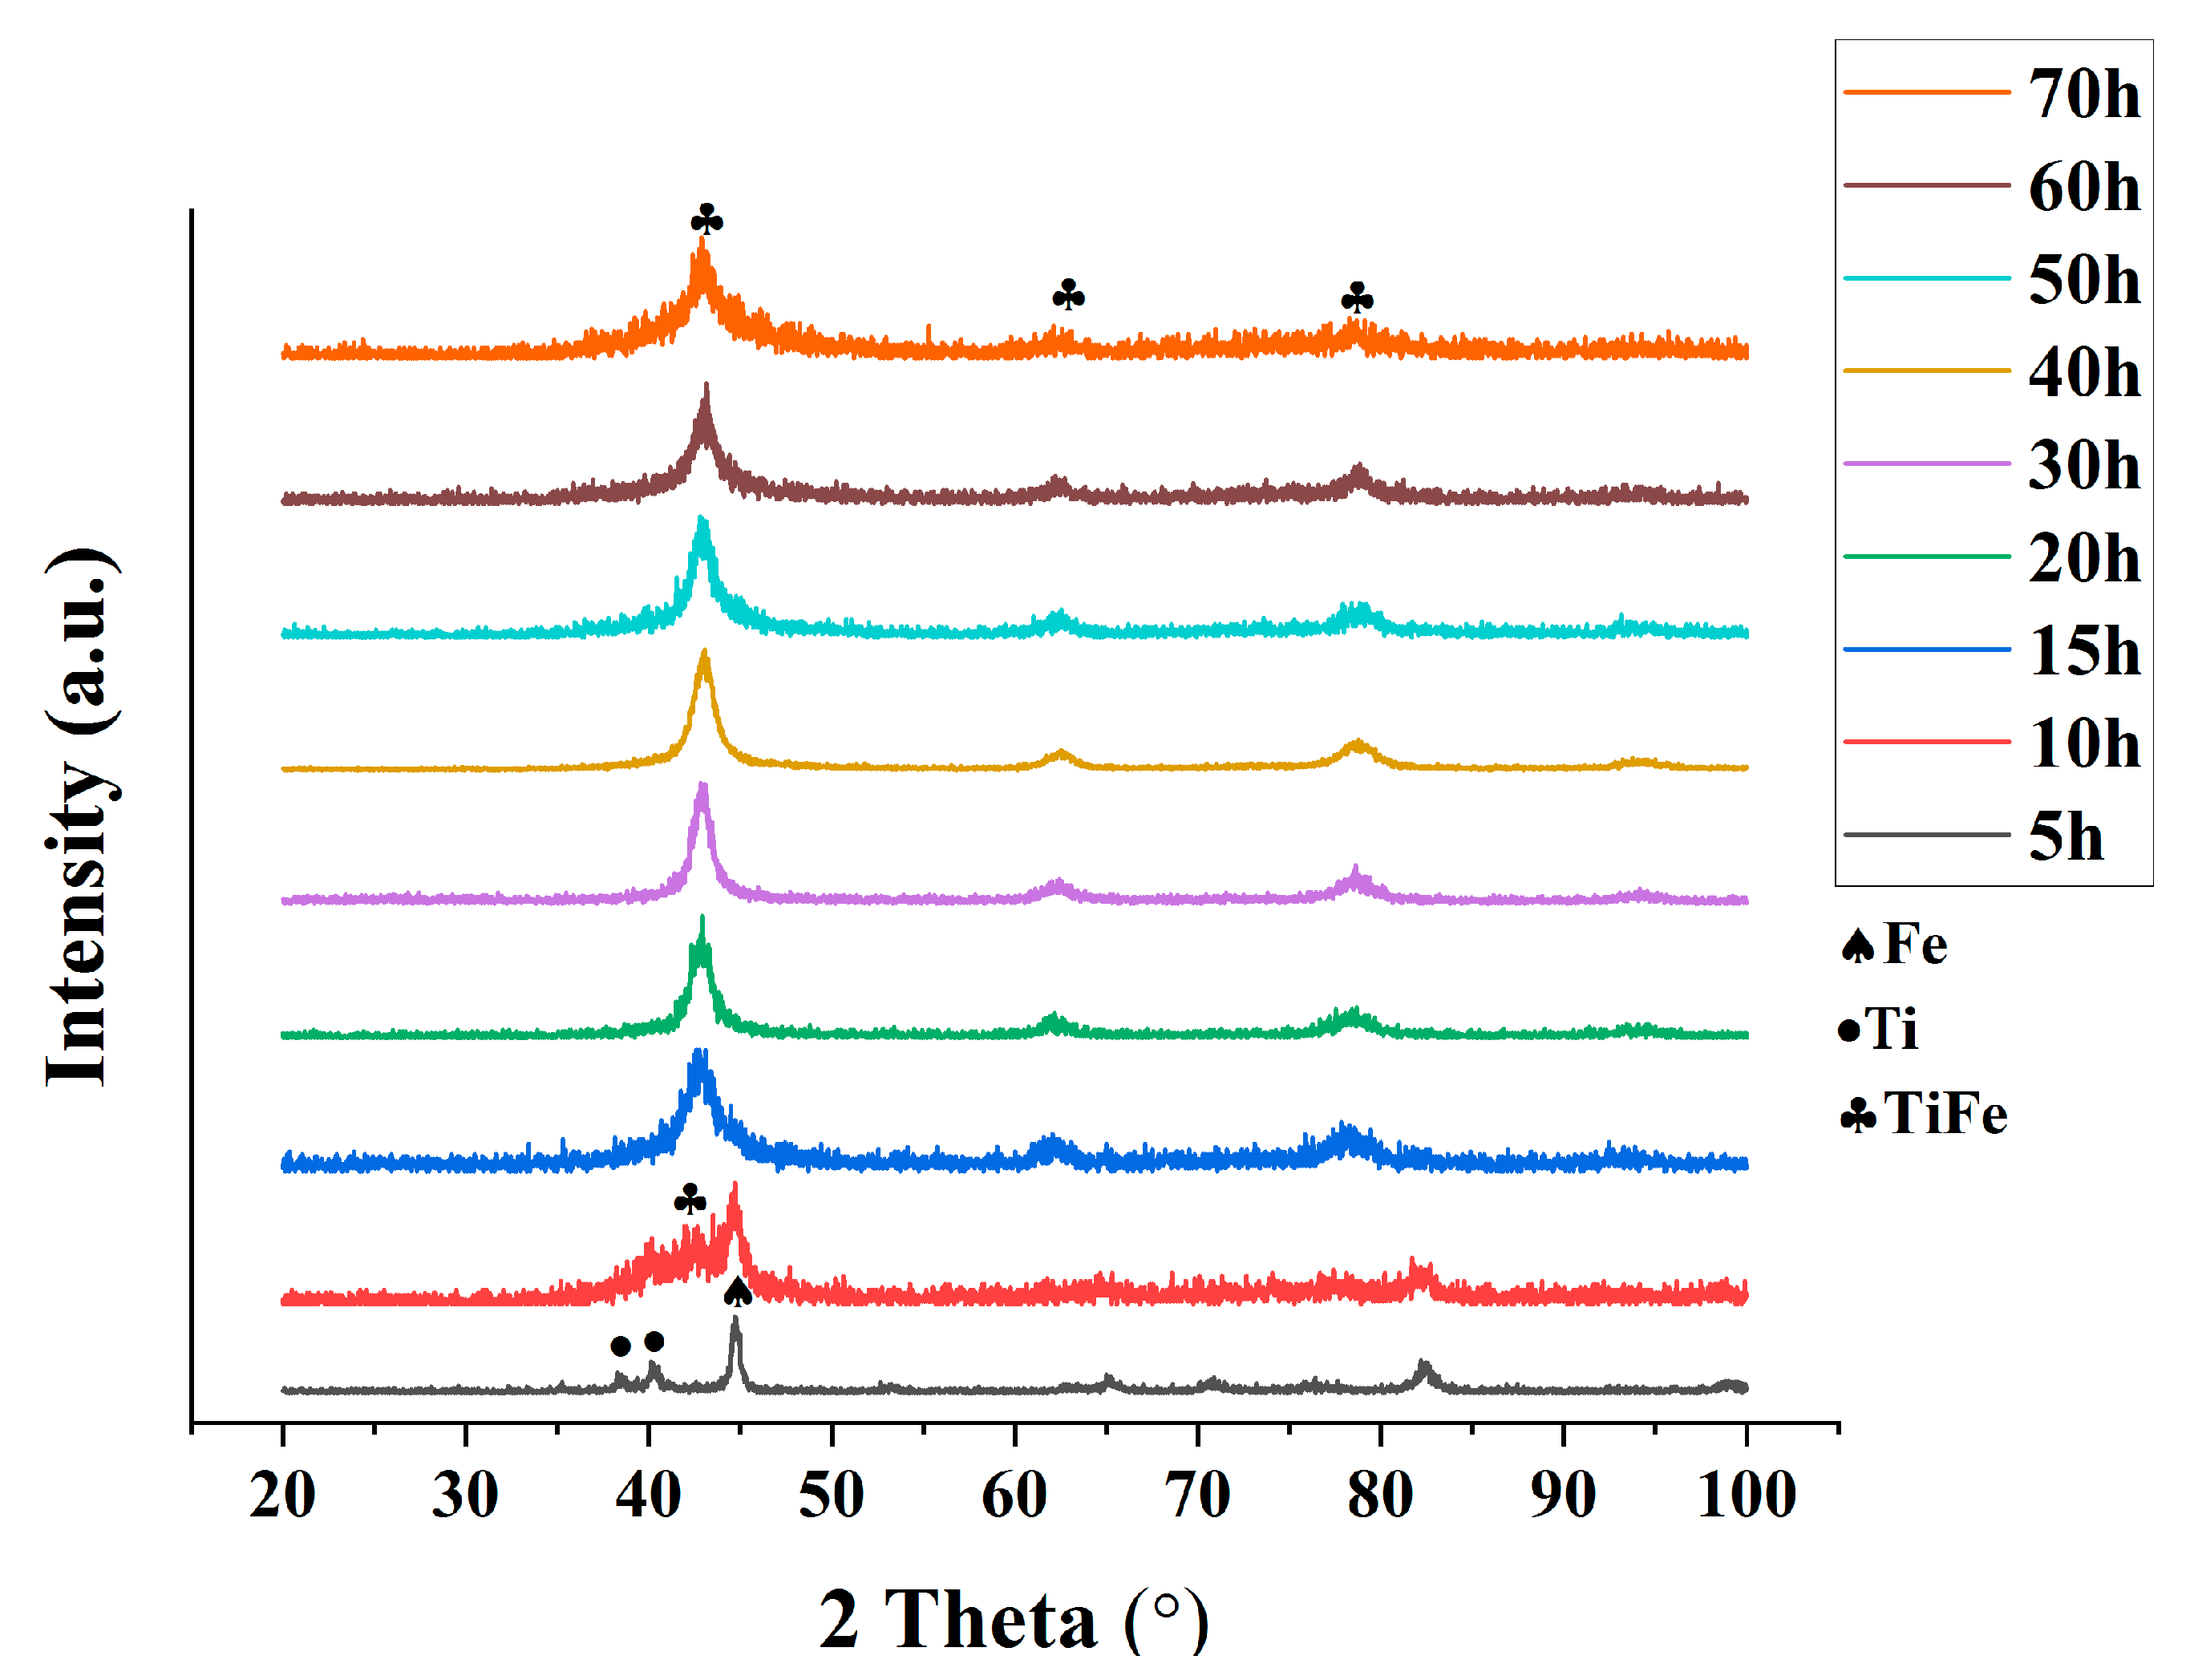
Figure 2.
XRD patterns of Fe10 milled product after different milling times.

Figure 3.
Fe lattice constant after different milling times.

Figure 4.
XRD patterns of Ti20 alloy after different milling times.

Figure 5.
XRD patterns of Ti20, TiFe, and Fe20 alloys after 10 h of milling.
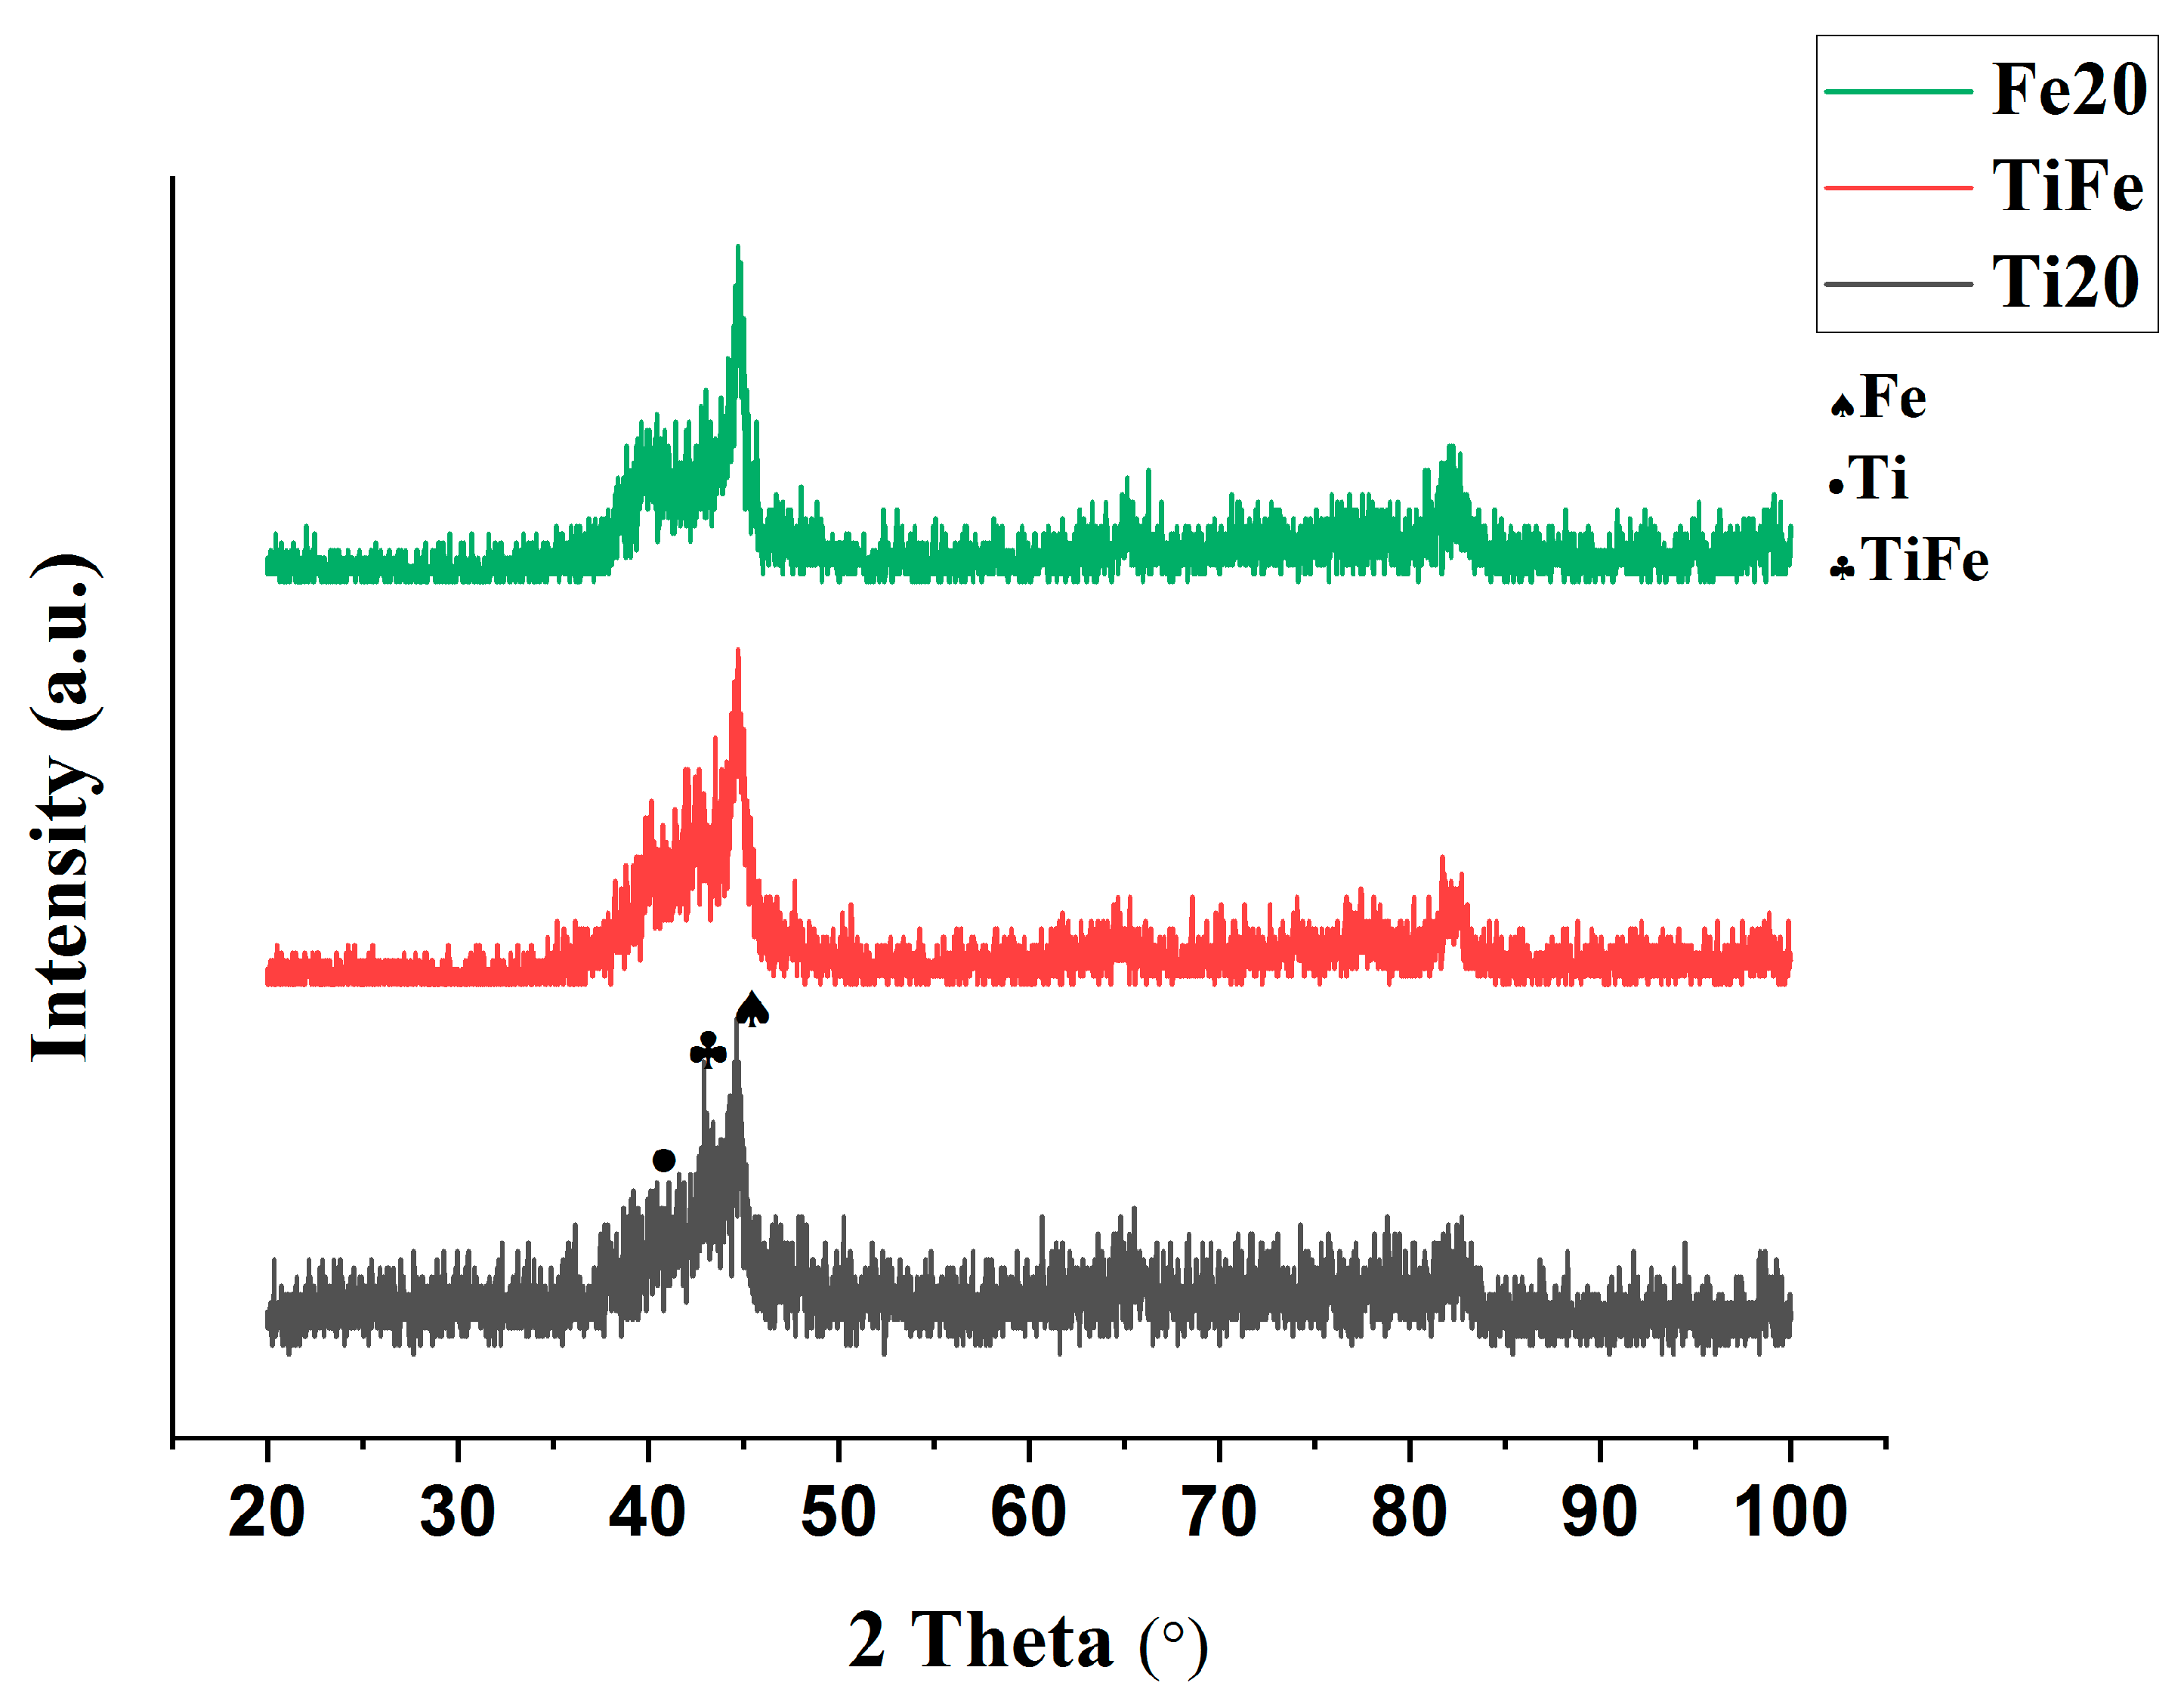
Figure 6.
Lattice constant of TiFe-based crystal structure after different milling times for TiFe, Ti10, Ti20, Fe10, and Fe20 milled products.
Figure 6.
Lattice constant of TiFe-based crystal structure after different milling times for TiFe, Ti10, Ti20, Fe10, and Fe20 milled products.
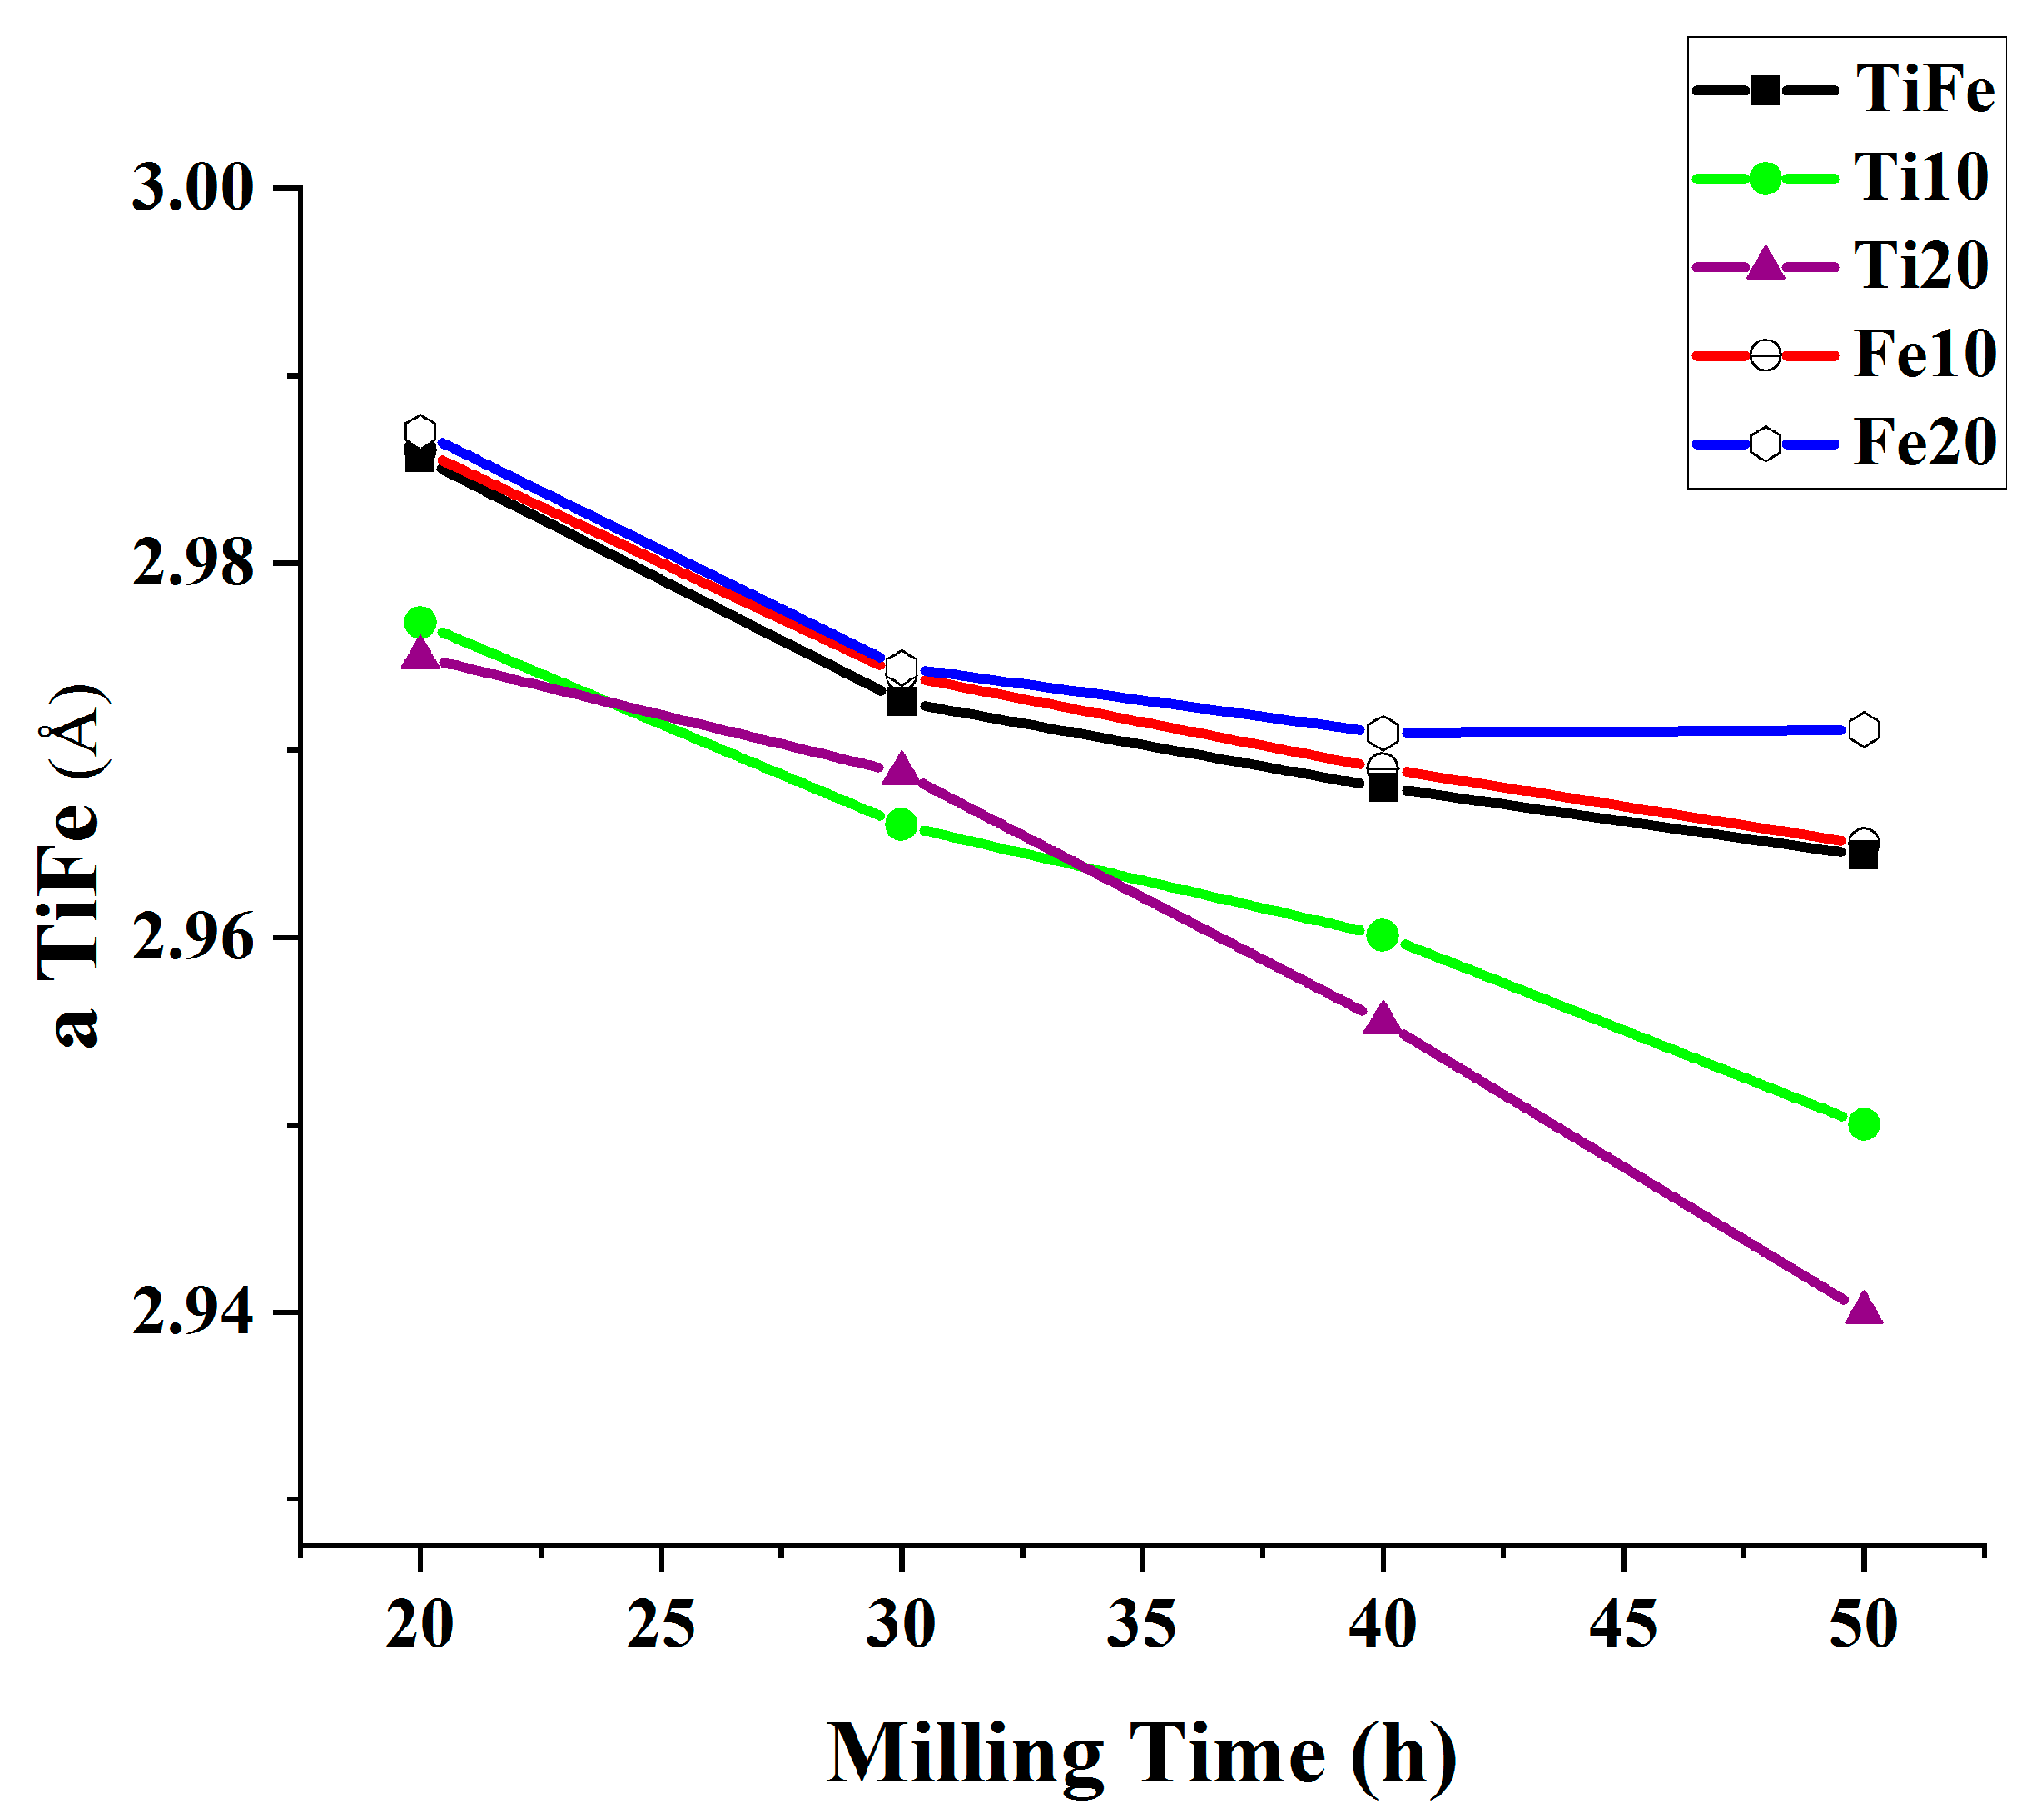
Figure 7.
Crystallite size of TiFe-based crystal structure in TiFe, Ti10, Ti20, Fe10, and Fe20 milled products as a function of milling times.
Figure 7.
Crystallite size of TiFe-based crystal structure in TiFe, Ti10, Ti20, Fe10, and Fe20 milled products as a function of milling times.
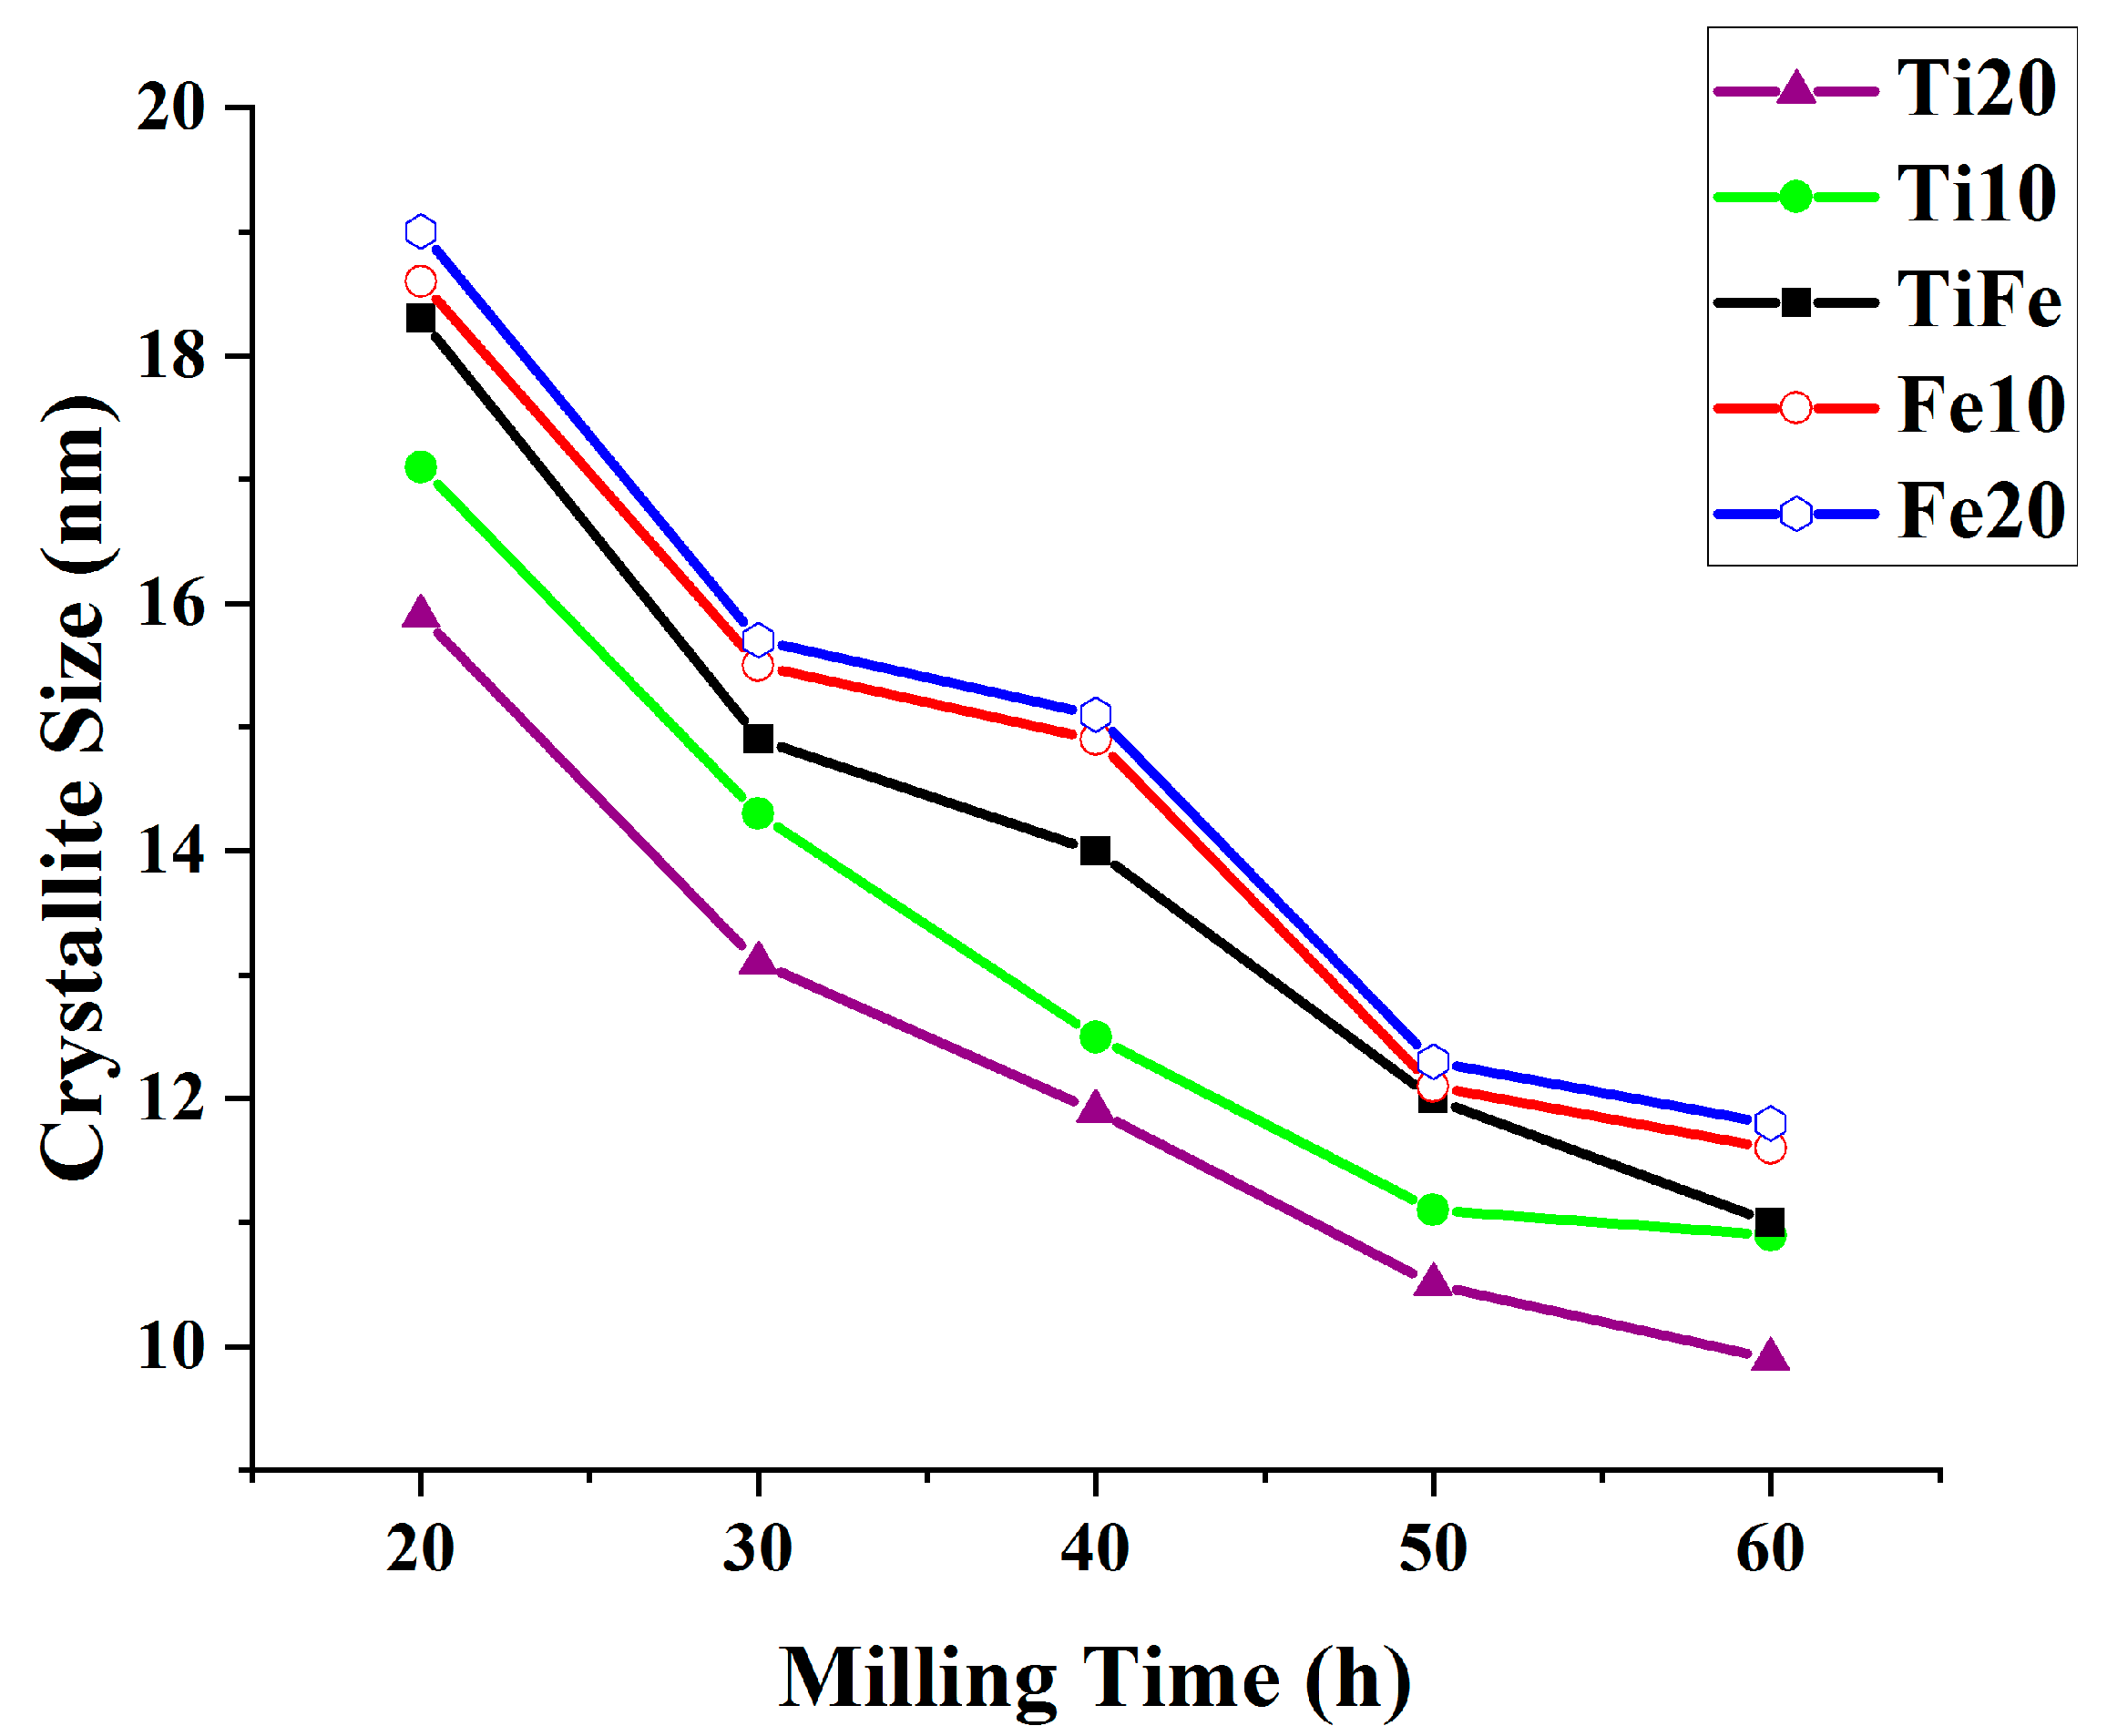
Figure 8.
SEM images of TiFe-based milled products after different milling times: (a) without milling, (b) 20 h, (c) 30 h, (d) 40 h, (e) 60 h, and (f) 90 h.
Figure 8.
SEM images of TiFe-based milled products after different milling times: (a) without milling, (b) 20 h, (c) 30 h, (d) 40 h, (e) 60 h, and (f) 90 h.

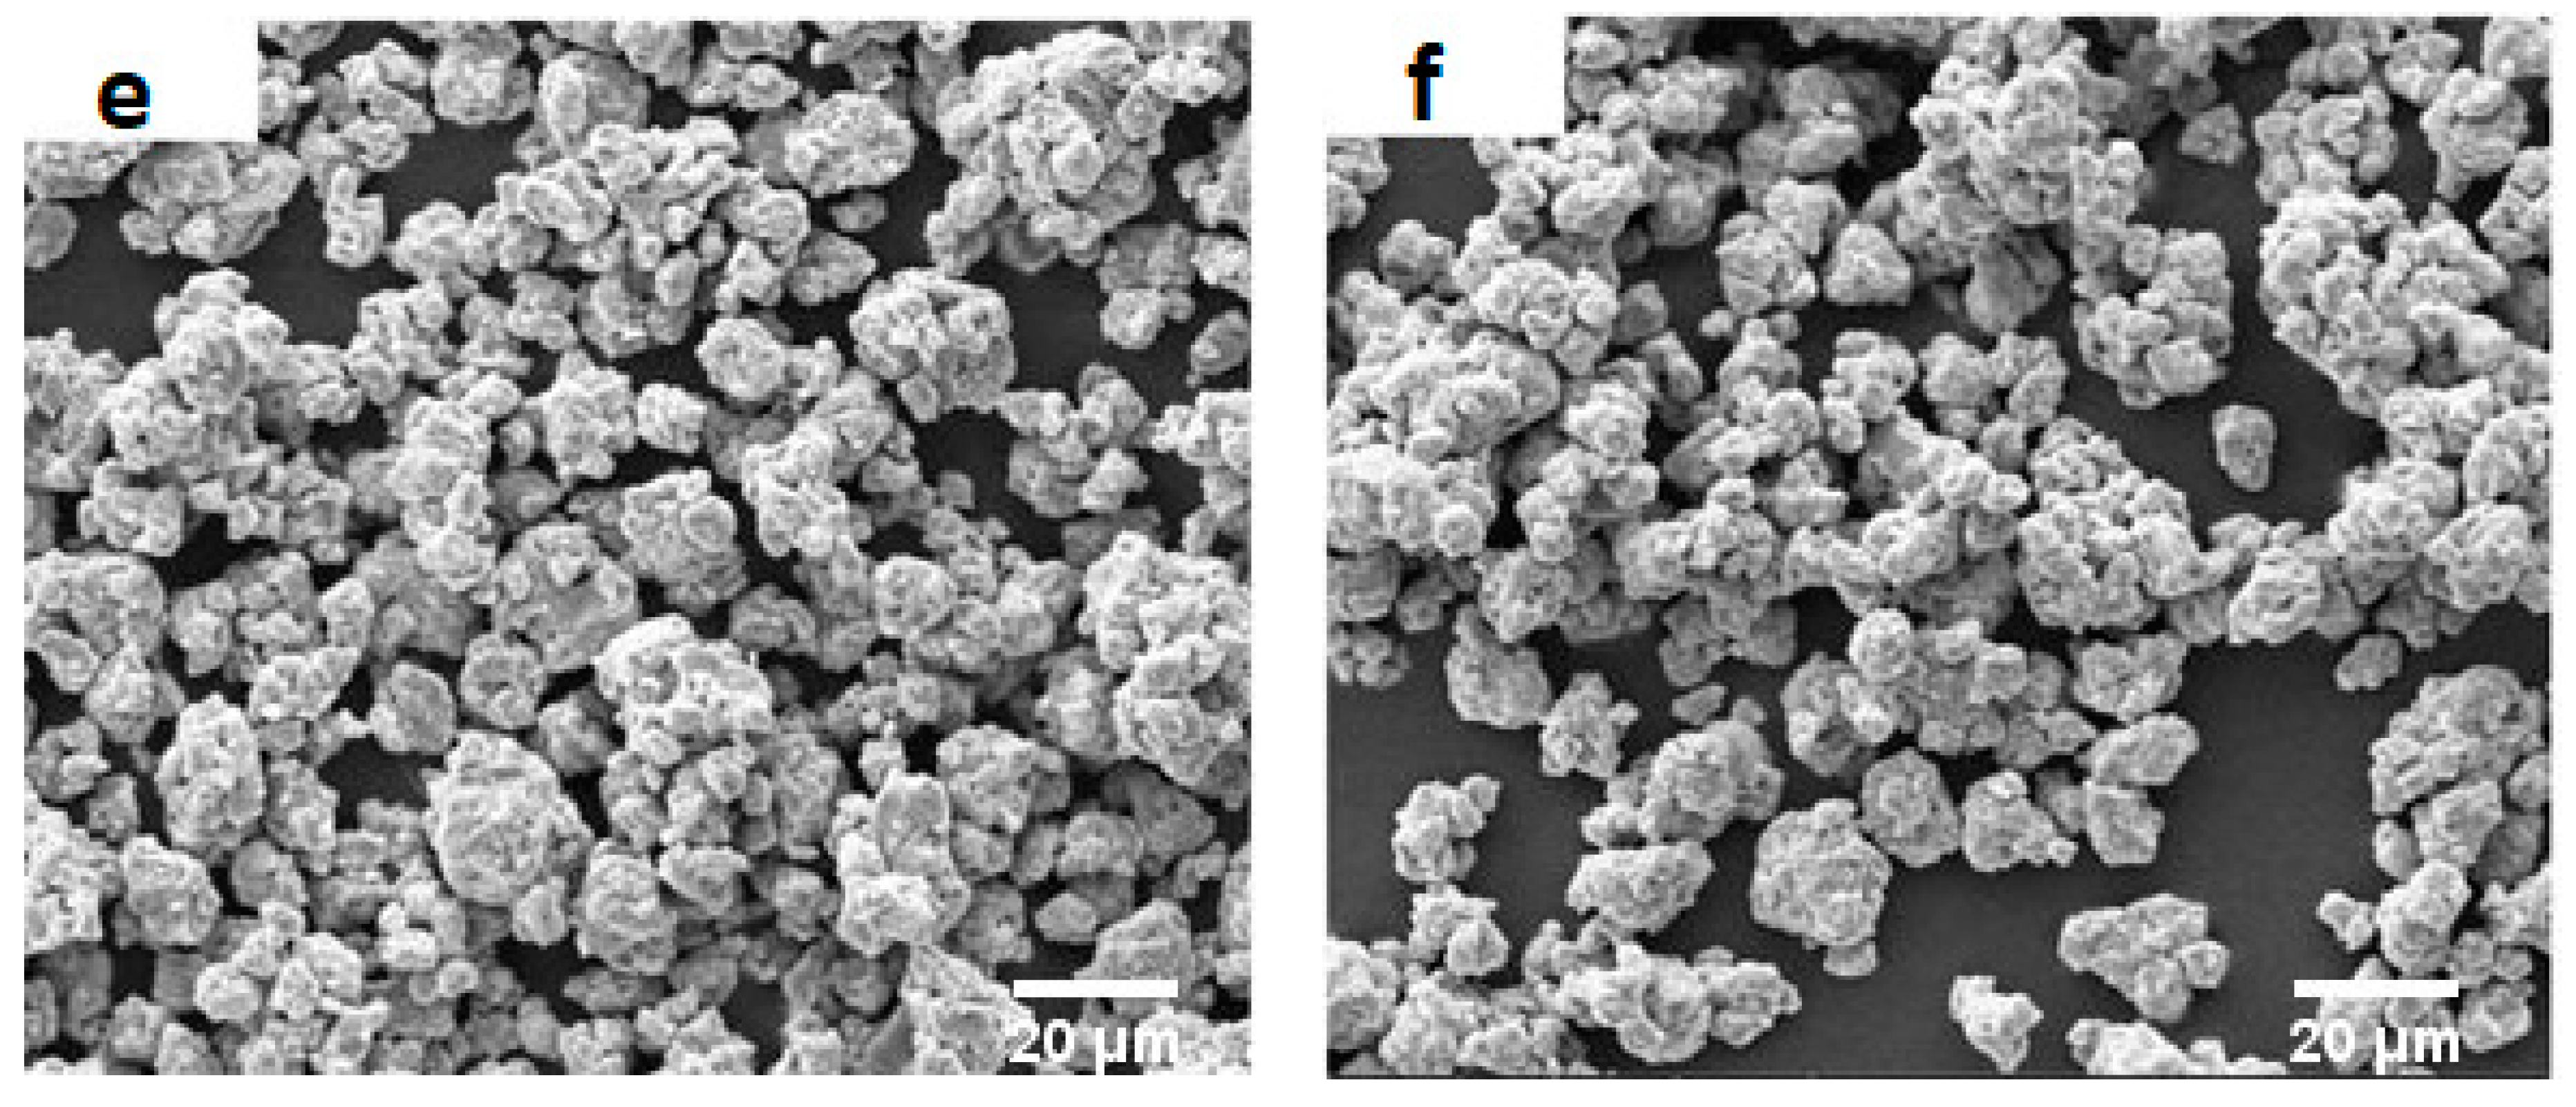
Figure 9.
SEM images of the (a) TiFe, (b) Fe20 (c) Ti20, and (d) Ti20 (using a higher magnification) milled products after 40 h of milling.
Figure 9.
SEM images of the (a) TiFe, (b) Fe20 (c) Ti20, and (d) Ti20 (using a higher magnification) milled products after 40 h of milling.

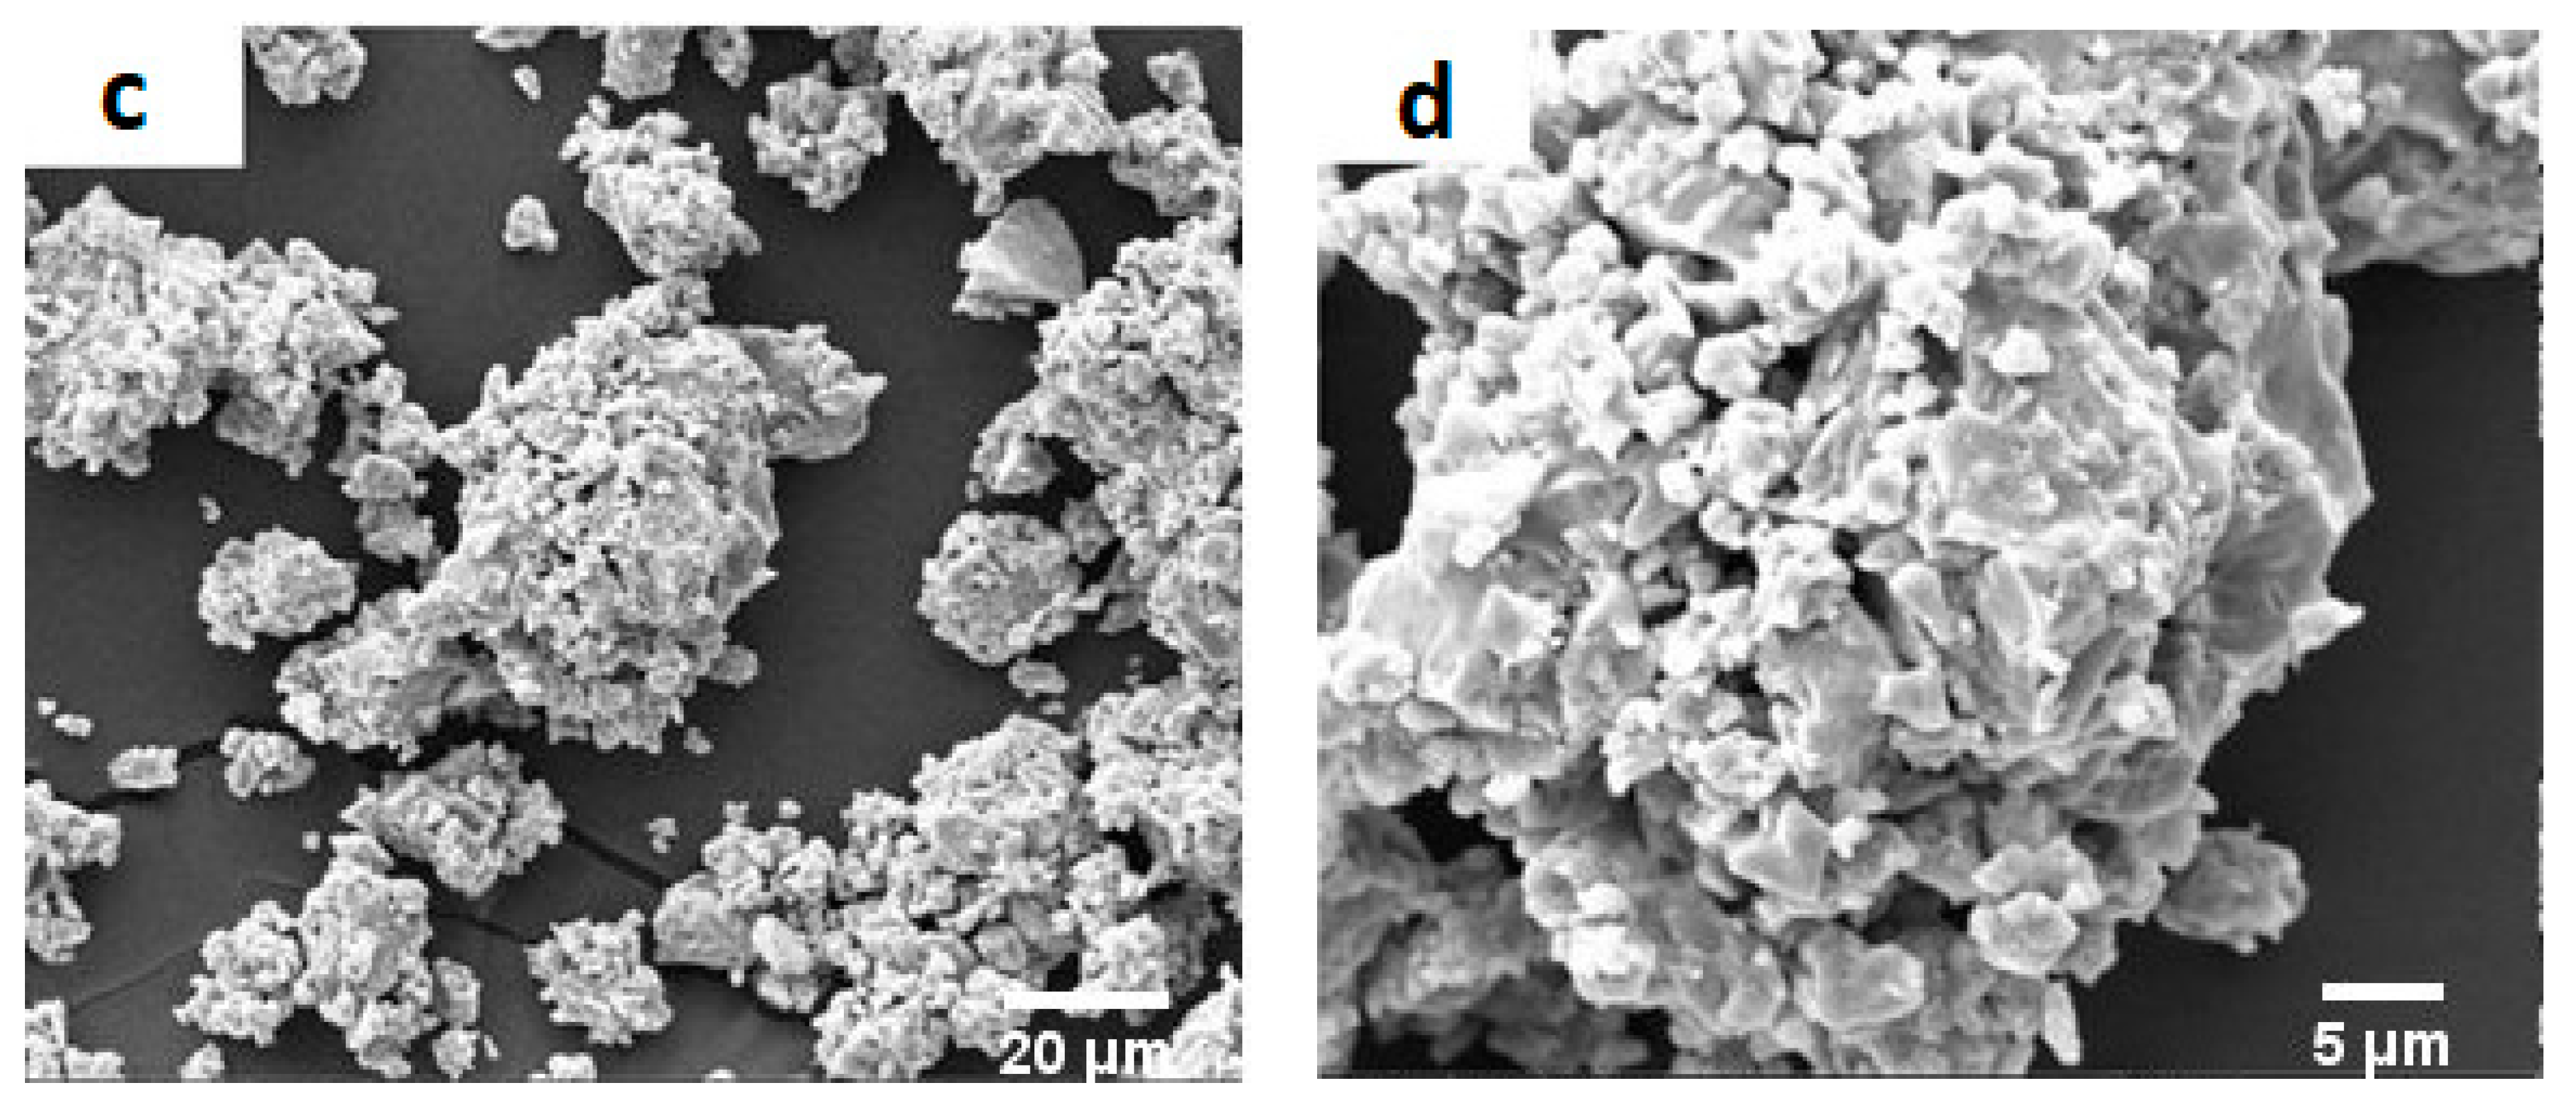
Figure 10.
DSC curve of TiFe milled product after 15 h of milling (Tr is the first exothermic transformation temperature regarding the release of strain stored in the composition during 20 h of milling. Tg is the endothermic transformation regarding the rearrangement of atoms before crystallization. Tx is the second exothermic transformation temperature regarding the crystallization of TiFe compound).
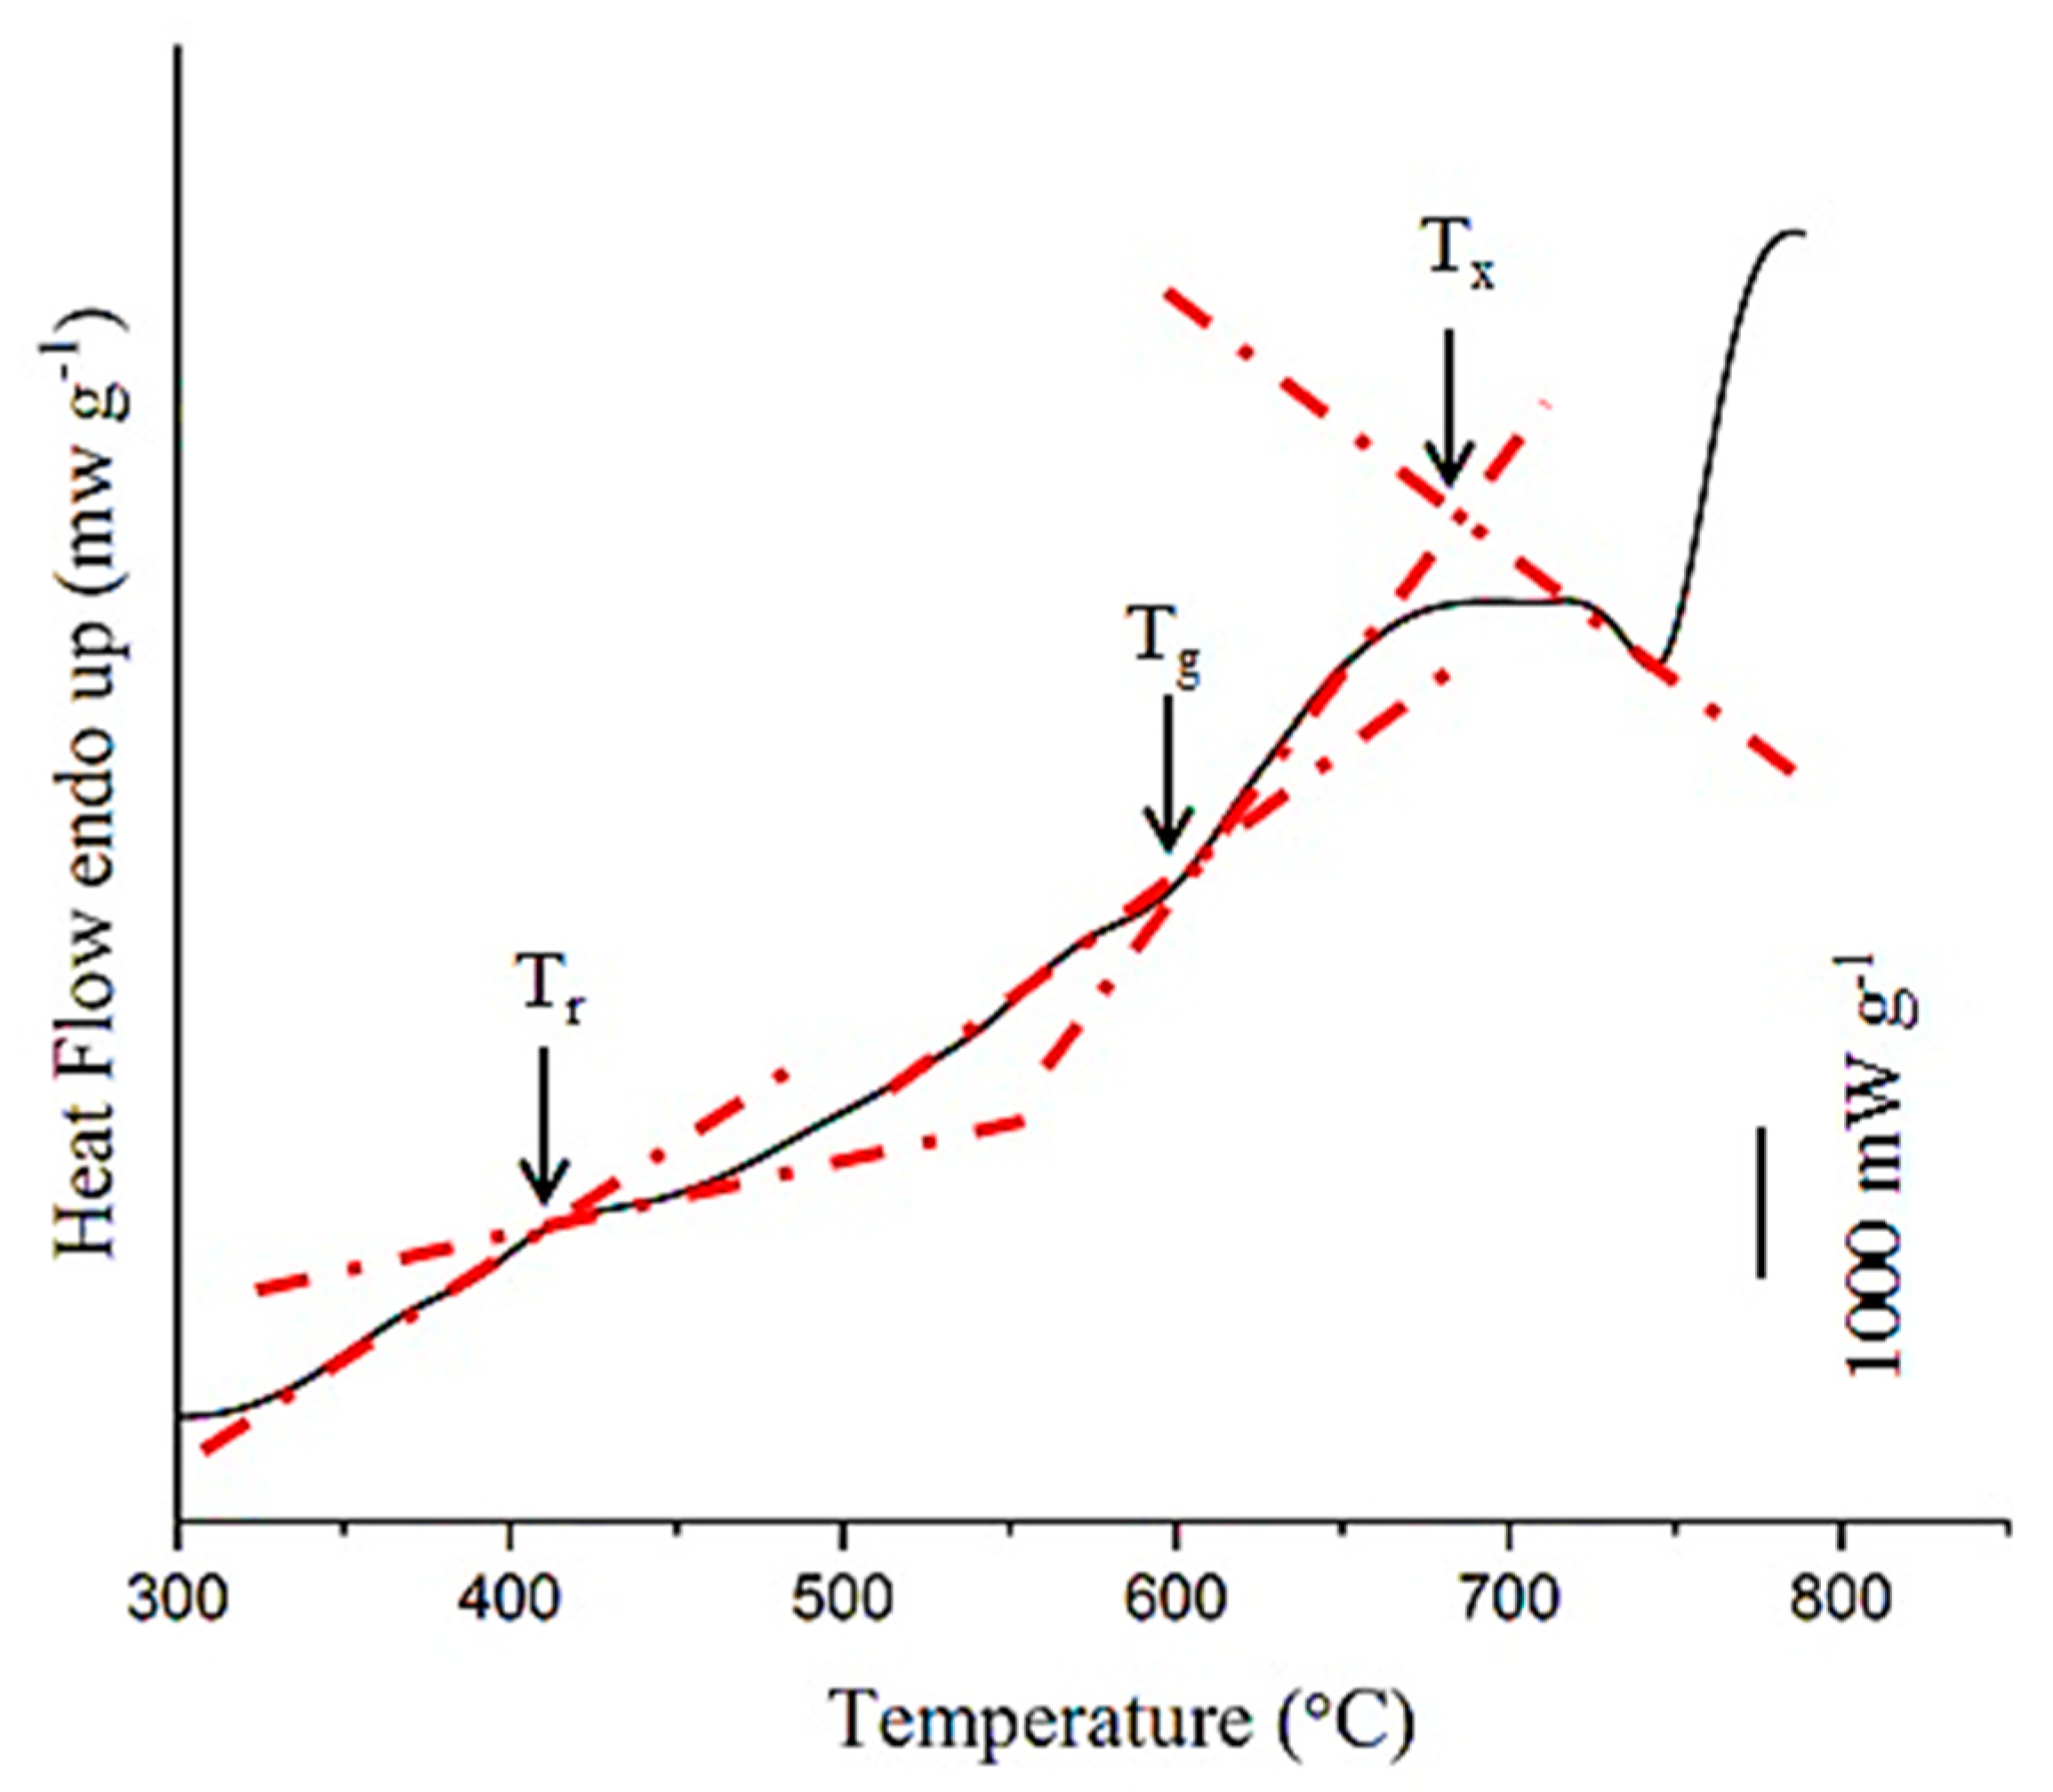
Figure 11.
Discharge capacity of the electrodes made from stoichiometric TiFe milled products after 20, 40, 60, and 70 h of milling as a function of cycle number.
Figure 11.
Discharge capacity of the electrodes made from stoichiometric TiFe milled products after 20, 40, 60, and 70 h of milling as a function of cycle number.
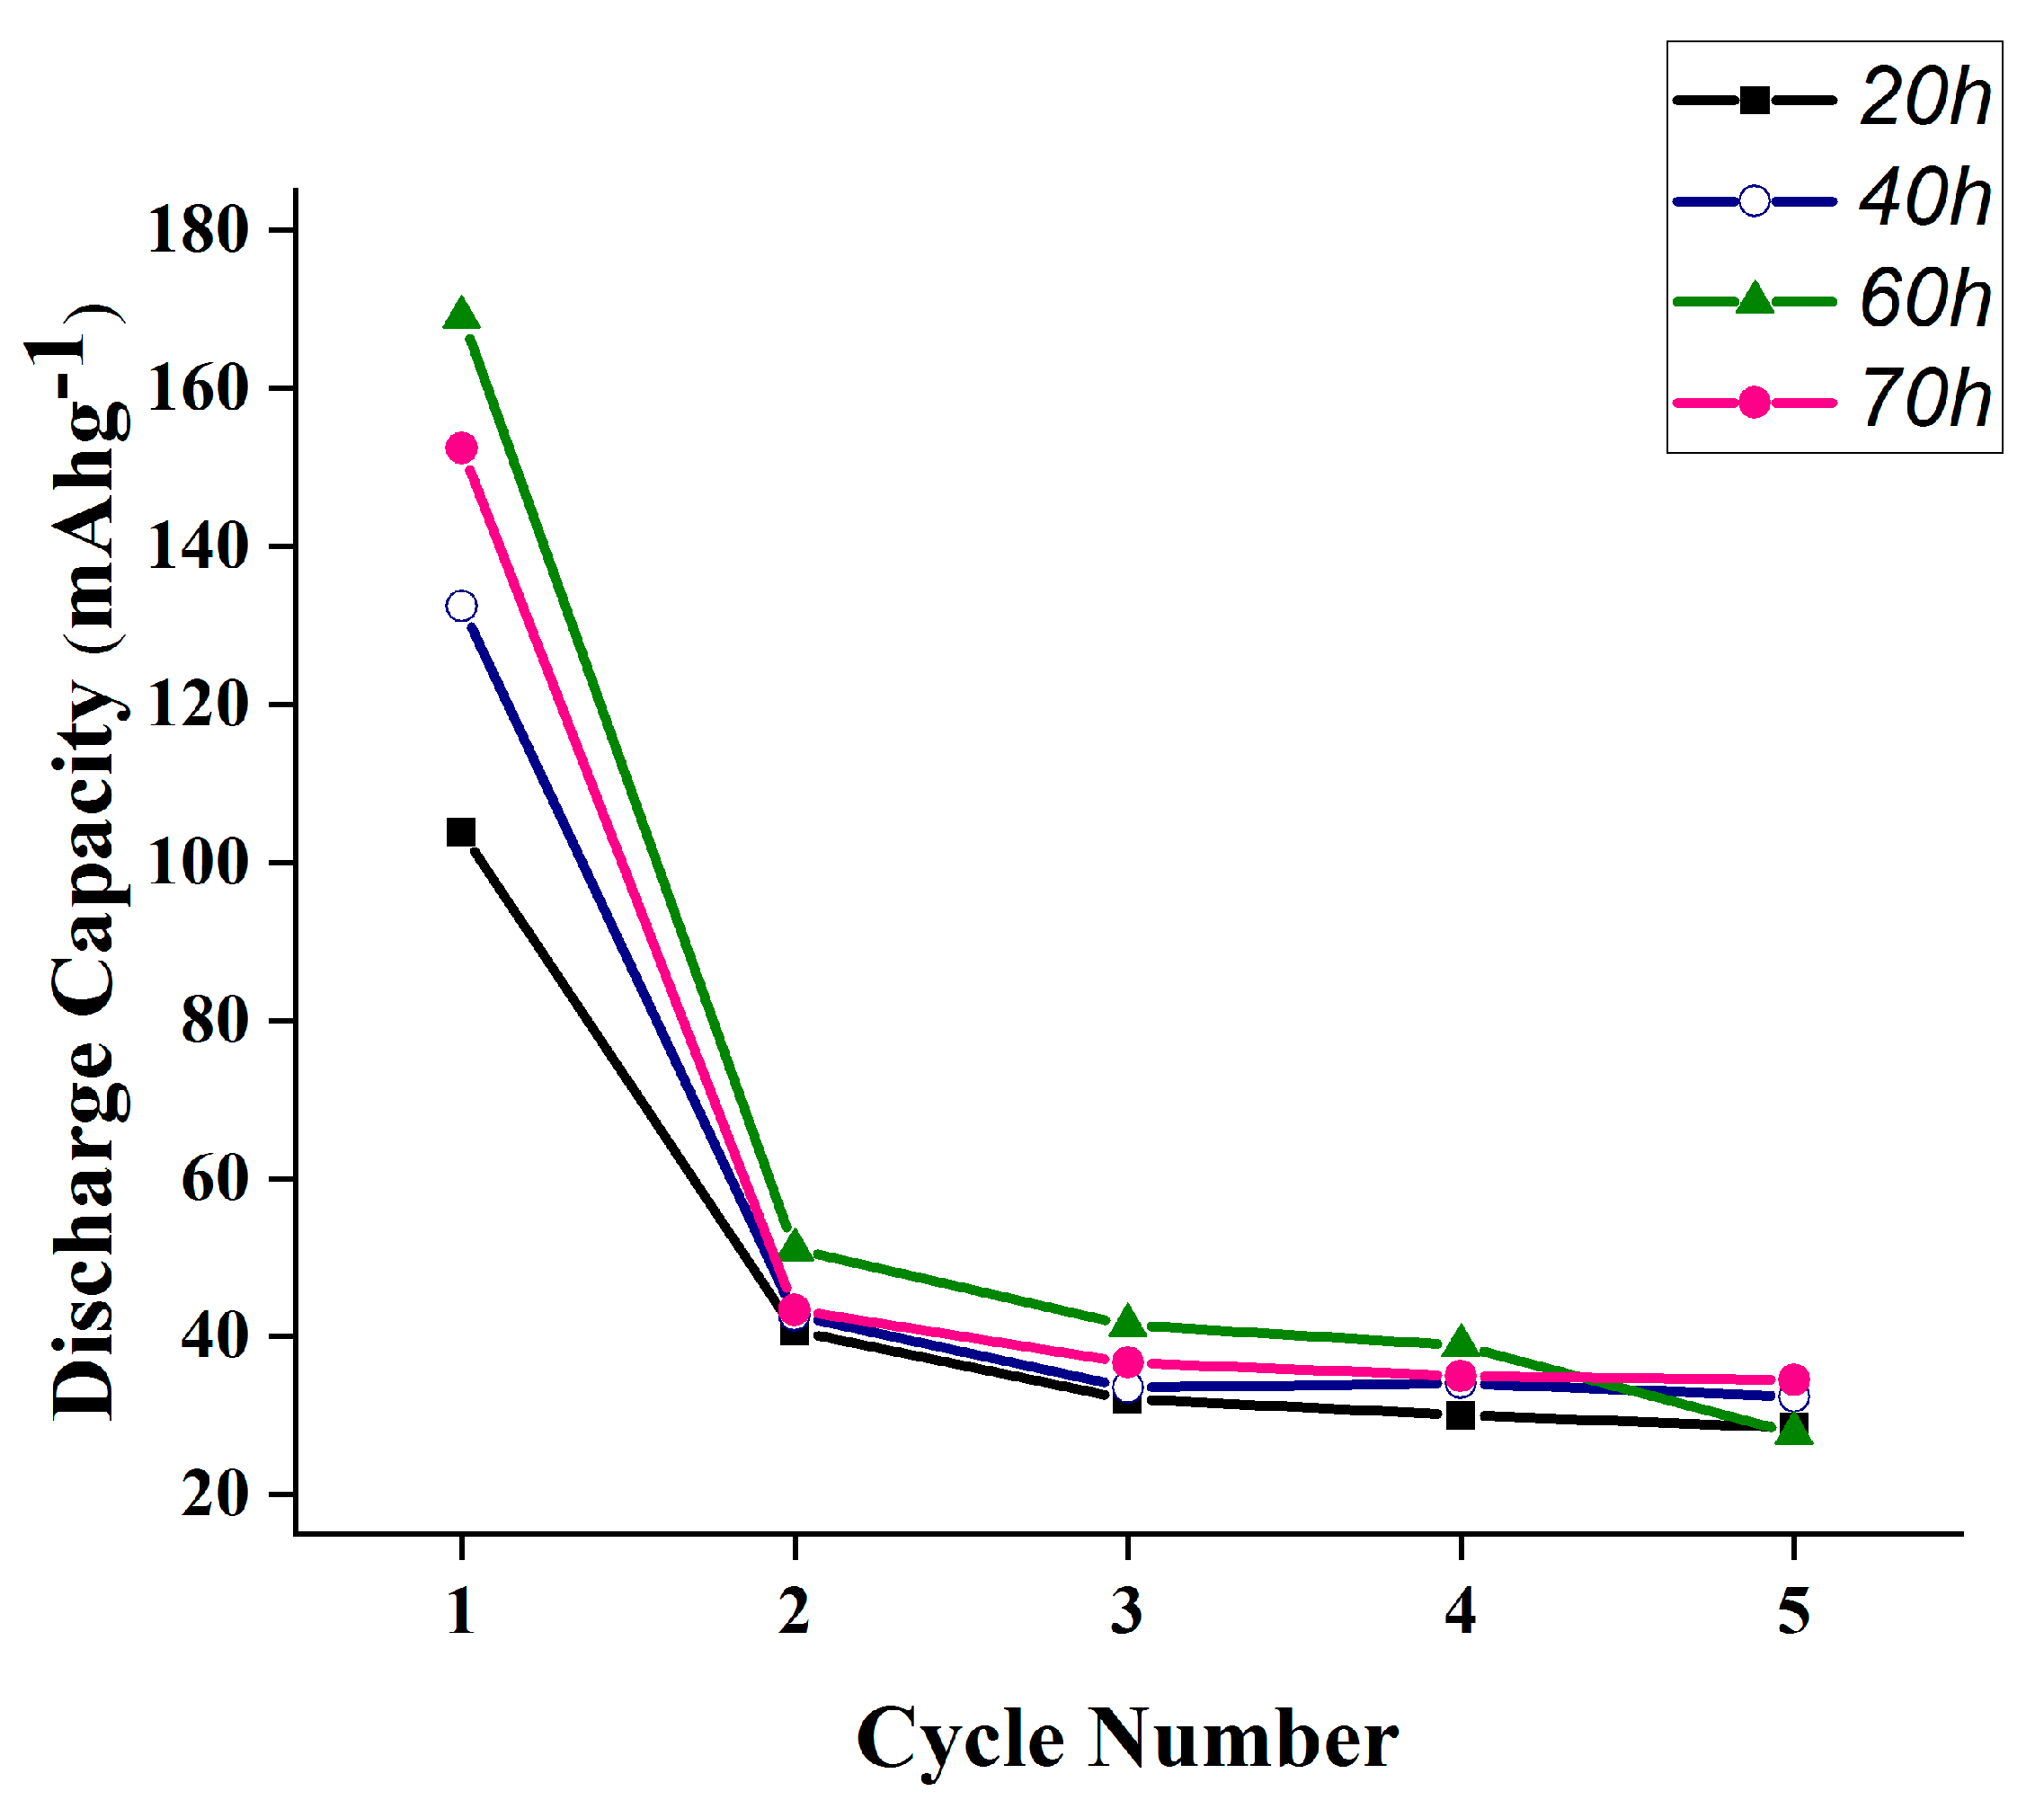
Figure 12.
Discharge capacity of TiFe, Fe10, Fe20, Ti10, and Ti20 milled products after 60 h of milling as a function of cycle numbers.
Figure 12.
Discharge capacity of TiFe, Fe10, Fe20, Ti10, and Ti20 milled products after 60 h of milling as a function of cycle numbers.

Figure 13.
Discharge curves in the first, third, and fifth periods of the 60 h milled products of (a) Fe10 (b) Ti10 (c) TiFe.
Figure 13.
Discharge curves in the first, third, and fifth periods of the 60 h milled products of (a) Fe10 (b) Ti10 (c) TiFe.

Table 1.
Specifications of the milling machine and the milling variables.
| Disk rotation speed | 225 rpm |
| Chamber rotation speed | 450 rpm |
| Disc diameter | 350 mm |
| Chamber capacity | 140 mL |
| Ball diameter | 10 and 20 mm |
| Ball type | Chromium steel (X210CrW12) |
| Ball-to-powder weight ratio | 20:1 |
Table 2.
Compositions of the binary and ternary milled products produced and their related codes.
| Alloy | Composition | Milled Product Code |
|---|---|---|
| TiFe | TiFe | TiFe |
| Ti(1-x)FeMnx | Ti0.8FeMn0.2 | Ti20 |
| Ti0.9FeMn0.1 | Ti10 | |
| TiFe(1-y)Mny | TiFe0.8Mn0.2 | Fe20 |
| TiFe0.9Mn0.1 | Fe10 |
Publisher’s Note: MDPI stays neutral with regard to jurisdictional claims in published maps and institutional affiliations. |
© 2022 by the authors. Licensee MDPI, Basel, Switzerland. This article is an open access article distributed under the terms and conditions of the Creative Commons Attribution (CC BY) license (https://creativecommons.org/licenses/by/4.0/).
Share and Cite
MDPI and ACS Style
Zali, A.; Kashani-Bozorg, S.F.; Lalegani, Z.; Hamawandi, B. Fabrication of TiFe-Based Electrodes Using High-Energy Ball Mill with Mn Additive for NiMH Batteries. Batteries 2022, 8, 182. https://doi.org/10.3390/batteries8100182
AMA Style
Zali A, Kashani-Bozorg SF, Lalegani Z, Hamawandi B. Fabrication of TiFe-Based Electrodes Using High-Energy Ball Mill with Mn Additive for NiMH Batteries. Batteries. 2022; 8(10):182. https://doi.org/10.3390/batteries8100182
Chicago/Turabian StyleZali, Amir, Seyed Farshid Kashani-Bozorg, Zahra Lalegani, and Bejan Hamawandi. 2022. "Fabrication of TiFe-Based Electrodes Using High-Energy Ball Mill with Mn Additive for NiMH Batteries" Batteries 8, no. 10: 182. https://doi.org/10.3390/batteries8100182
Note that from the first issue of 2016, this journal uses article numbers instead of page numbers. See further details here.