Vanadium Oxygen Fuel Cell Utilising High Concentration Electrolyte

1
School of Mechanical and Manufacturing Engineering, University of New South Wales, Sydney 2052, Australia
2
School of Chemical Engineering, University of New South Wales, Sydney 2052, Australia
3
Fraunhofer-Institute for Chemical Technology, Joseph-von-Fraunhofer-Str. 7, 76327 Pfinztal, Germany
4
CENELEST, German-Australian Alliance for Electrochemical Technologies for Storage of Renewable Energy, School of Mechanical and Manufacturing Engineering, UNSW, Sydney 2052, NSW, Australia
*
Author to whom correspondence should be addressed.
Batteries 2019, 5(1), 24; https://doi.org/10.3390/batteries5010024
Submission received: 20 December 2018
/
Revised: 8 February 2019
/
Accepted: 12 February 2019
/
Published: 19 February 2019
(This article belongs to the Special Issue Vanadium Redox Flow Battery and Its Applications)
Abstract
:A vanadium oxygen fuel cell is a modified form of a conventional vanadium redox flow battery (VRFB) where the positive electrolyte (VO2+/VO2+ couple) is replaced by the oxygen reduction (ORR) process. This potentially allows for a significant improvement in energy density and has the added benefit of overcoming the solubility limits of V (V) at elevated temperatures, while also allowing the vanadium negative electrolyte concentration to increase above 3 M. In this paper, a vanadium oxygen fuel cell with vanadium electrolytes with a concentration of up to 3.6 M is reported with preliminary results presented for different electrodes over a range of current densities. Using precipitation inhibitors, the concentration of vanadium can be increased considerably above the commonly used 2 M limit, leading to improved energy density.
1. Introduction
In recent years, redox flow batteries (RFBs) have emerged as an attractive option for grid connected, as well as off-grid, energy storage systems due to their low cost, safety and reliability. Redox flow batteries (RFB) represent energy storage devices consisting of an electrochemical reaction cell attached to two electrolyte reservoirs with redox couples having a significant electrochemical potential difference. One of the crucial advantages of redox flow batteries over other electrochemical energy storage devices is the independent scaling of power rating and energy storage capacity. Electrolyte volume, the concentration of active species and the cell voltage govern the energy density, while the power rating is determined by the kinetic behaviour of the redox species, the size of the electrodes and the number of cells in the stack. Redox flow batteries also exhibit good safety, long service life, fast response, high energy efficiency, flexible design and a relatively lower environmental impact. Of the various redox flow battery systems studied, the all-vanadium redox flow battery (VRFB) has reached the most significant level of commercialisation. Initially proposed by Skyllas-Kazacos and co-workers at UNSW [1,2] in the 1980s to avert cross-contamination issues experienced by Fe-Cr batteries developed by NASA in the 1970s [3], VRFBs have come a long way in terms of development. In recent years, VRFBs have gained increased interest as potential stationary storage devices to compensate for the fluctuating energy production from renewable resources. The VRFB uses vanadium containing aqueous electrolytes on both sides (positive and negative half cells), thus reducing the cross-contamination issues associated with other redox flow batteries that employ redox couples of different elements. The schematic diagram for the VRFB is shown in Figure 1.
VRFBs offer the following advantages.
- Use of the same electrolyte in both half-cells avoids the issue of cross-contamination. This means that the electrolytes have an indefinite life.
- Electrolyte flow through the stack allows efficient heat exchange, thereby removing the need for a separate thermal management system.
- Capacity can easily be adjusted by varying the solution volume.
- Faster recharging rates compared to conventional batteries.
- Possibility to monitor the battery characteristics (SOC and battery capacity) by observing the open circuit cell potential and monitoring the half-cell potentials.
Despite these advantages, the VRFBs have a comparatively low specific energy. The maximum energy density obtained by VRFBs is 30 Wh L−1, which is due to the solubility limits of the vanadium species involved over the practical operating temperature ranges. Although this is not a major issue in most stationary applications, in installations where there is limited available space such as in office or residential buildings, the low energy density can be a major drawback. Enhanced solubility can be obtained with the use of mixed sulphate-chloride electrolytes consisting of HCl-H2SO4 systems [4]; however, overcharging these solutions can potentially result in the release of chlorine gas, which is an undesirable health and safety hazard, particularly in enclosed spaces.
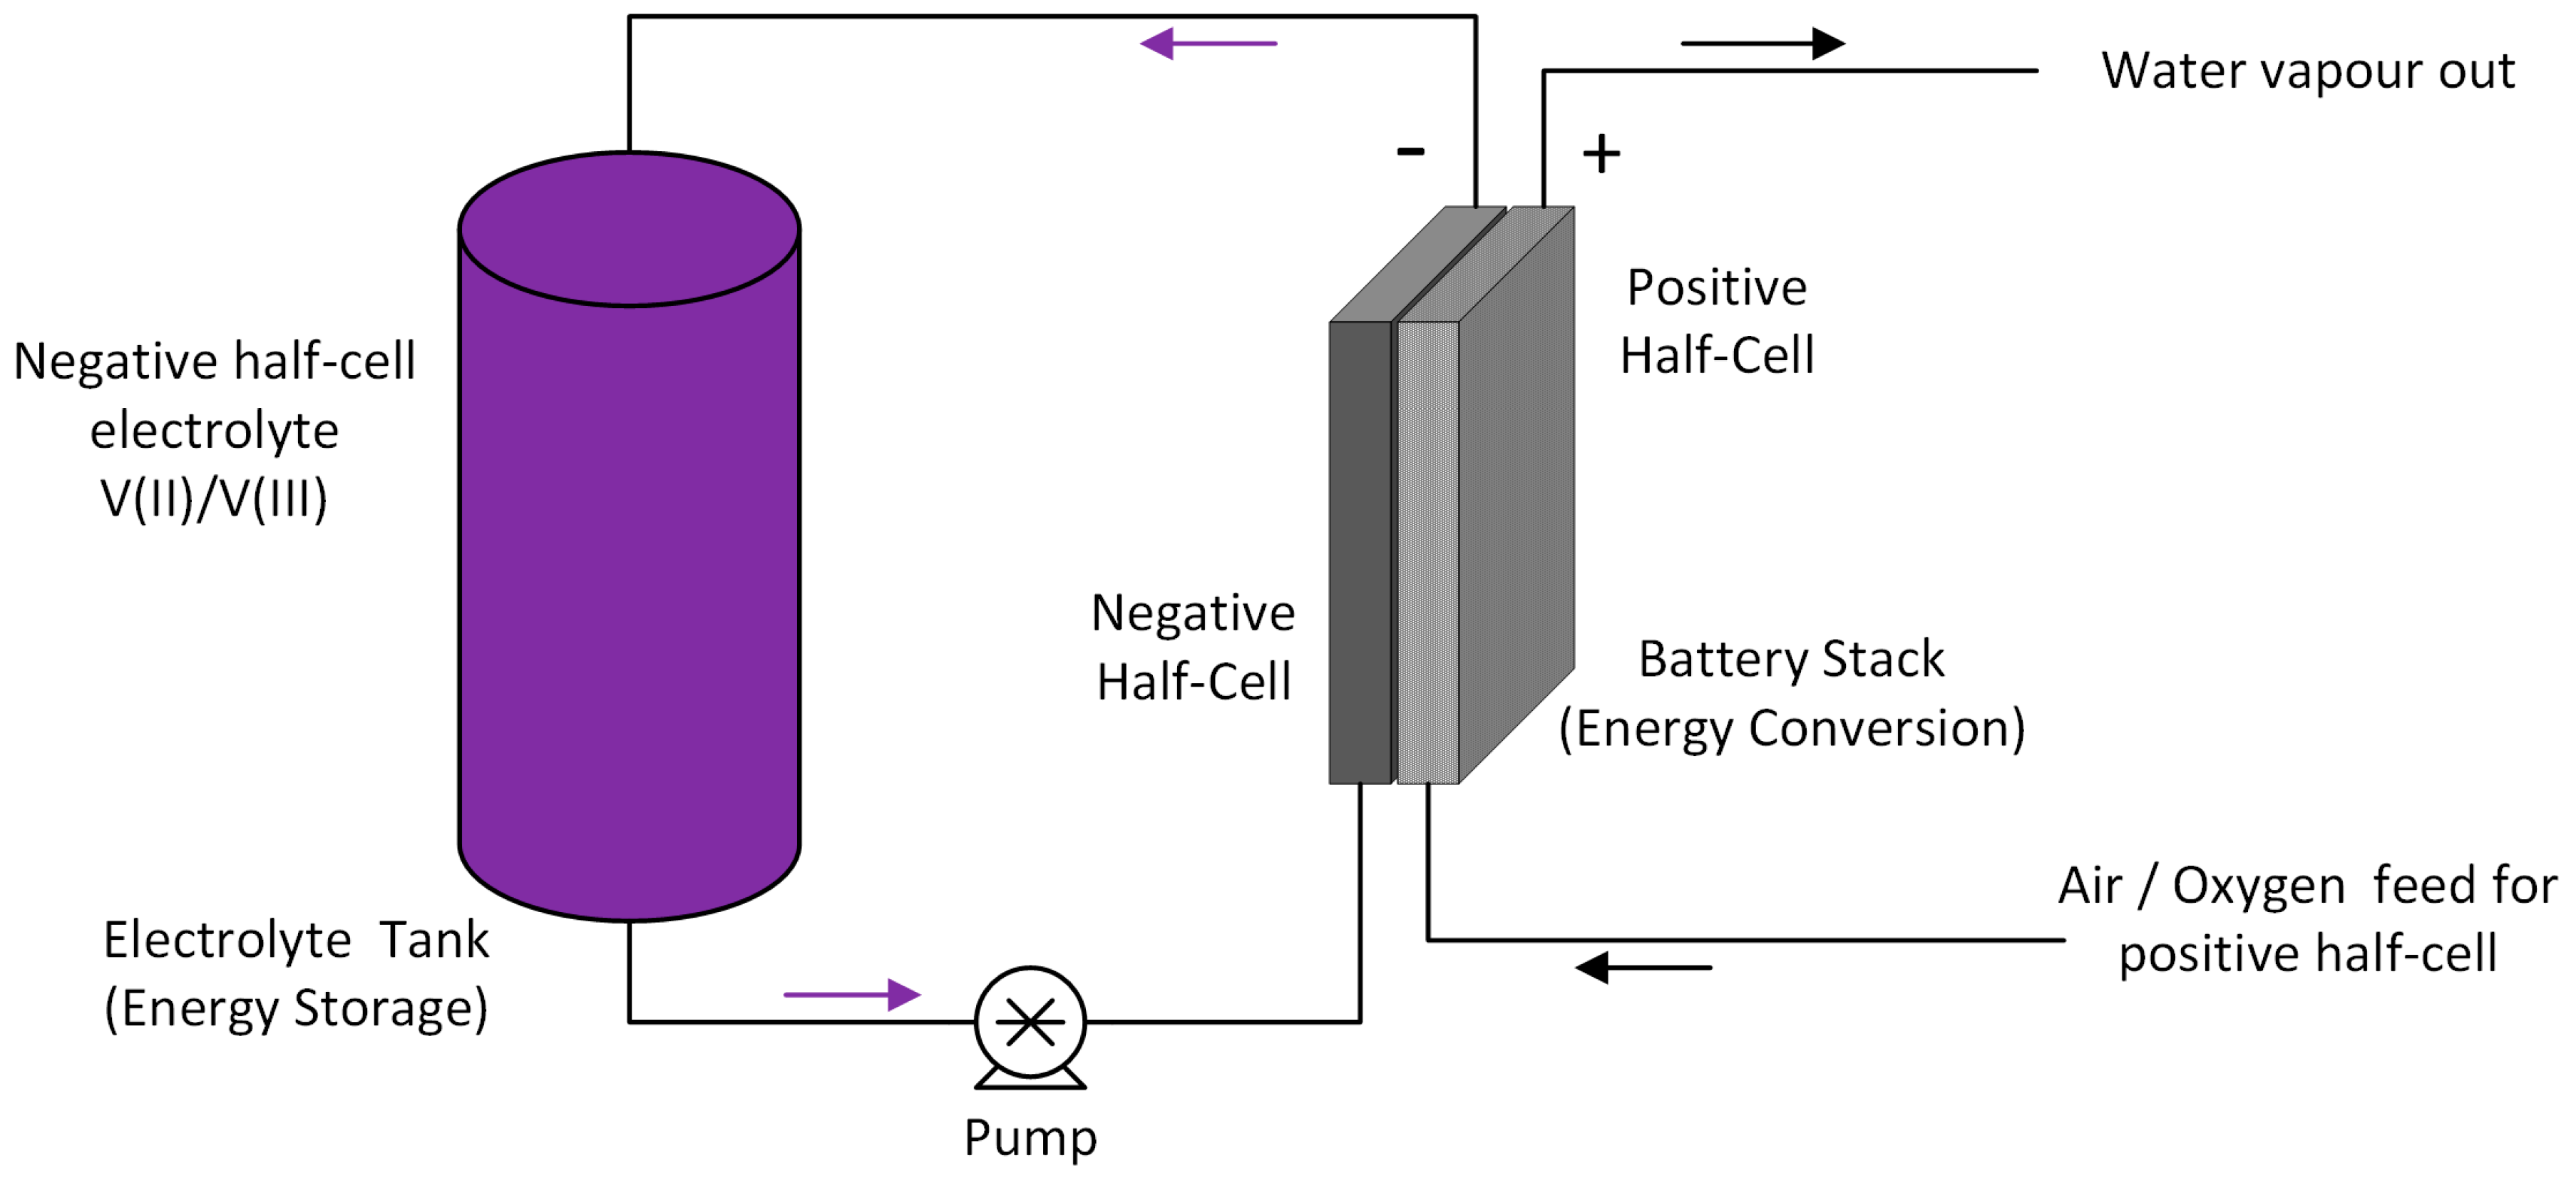
A significant improvement in energy density can also be achieved by replacing the positive reaction of a conventional VRFB with an oxygen reduction reaction (ORR) that operates similarly to fuel cells. Removing the positive half-cell electrolyte also has the added benefit of overcoming the solubility limits of V(V) at elevated temperatures and allowing the vanadium negative electrolyte concentration to be potentially increased up to 4 M [5]. The vanadium-oxygen system also gives a higher standard cell potential (1.49 V compared to 1.26 V for VRFB). The Vanadium-Oxygen fuel cell (VOFC) concept was proposed initially by Kaneko et al. in 1992 [6] and first investigated by Menictas and Skyllas-Kazacos in 1997 [7]. More work has been done on this technology at the Fraunhofer ICT [8] and Twente University in the Netherlands [9] among others, to evaluate VOFC performance over a range of temperatures, using different membranes to establish its feasibility. The schematic diagram representing the VOFC is shown in Figure 2.
One of the significant advantages of the VOFC over the VRFB is avoiding thermal precipitation limitations of V (V), allowing operation at an increased concentration and elevated temperatures. Conventional VRFB electrolytes are usually restricted to vanadium concentrations between 1.5 and 2 M, limiting their energy density and operating temperature range (to 10 to 40 °C).
VOFCs thus offer the following advantages over conventional VRFBs:
- Higher standard cell voltage and higher theoretical energy density (~60 Wh/kg) due to the significantly reduced weight and volume.
- Halving of the required vanadium and associated electrolyte cost.
- Nearly unlimited source of oxygen (ambient air) for the discharging reaction
The electrode reactions involved in the VOFC can be represented as follows.
Negative electrode reaction:
V3+ + e− ↔ V2+ E0 = −0.26 V
Positive electrode reaction:
O2 + 4H+ + 4e− ↔ 2H2O E0 = +1.23 V
Overall cell reaction:
4V2+ + O2 + 4H+ ↔ 4V3+ + 2H2O E0 = 1.49 V
It should be noted that the standard cell potential is the thermodynamically expected value under standard cell conditions, and does not take into account ohmic losses and overpotentials that are encountered in practical systems. While the negative half-cell components of the VOFC are the same as those of the VRFB, the cathode components (i.e., electrode catalysts for the ORR) are different. The cathode requirements also depend on the expected mode of operation that can either involve the use of a separate stack for recharging the spent negative half-cell solution, or may incorporate a bifunctional electrode with a catalyst capable of catalyzing both oxygen reduction and oxygen evolution reactions. While the latter eliminates the need for a separate recharging system, the development of an efficient bifunctional electrode presents a significant challenge.
Hosseiny et al. [10] proposed a modular vanadium oxygen redox battery design involving two different MEAs to overcome the corrosion issues of the carbon support during the charging process. Pt/C (ORR) and IrO2/TiO2 (OER) bifunctional electrocatalysts on Ti mesh support were used for the oxygen evolution and oxygen reduction reactions; however, the voltage efficiency obtained was only 46%. This was potentially due to cross-over of oxygen formed during the oxygen evolution process to the vanadium side. A modified unitised cell design where titanium cloth was used as a substrate (instead of titanium felt) showed a significant improvement to the voltage efficiency, i.e., 81% with Pt/IrO2 modified catalysts [10]. However, the long-term operation has yet to be achieved.
The disadvantages or limitations of current VOFCs, therefore, are the absence of cost-effective and efficient bifunctional electrode materials, low durability of the membrane electrode assemblies used, and current cell designs with high ohmic resistance. The maximum energy efficiency obtained for the advanced rechargeable VOFC (EWE Research Centre, Germany 2015) was 41.7% at 20 mA cm−2 current density which is quite low for grid-scale energy storage application. Furthermore, to date, the maximum vanadium electrolyte concentration employed in VOFCs has been 2 M, limiting the possible energy density enhancement. There has been extensive research carried out for the development of electrodes for redox flow batteries, with work largely focused on the activation and modification of catalyst materials using physical or chemical methods like heat treatment, ion exchange, incorporation of nanomaterials, structural modifications etc. [11,12,13,14,15]. However, only a few of these methods provide increased power density or scalability. Thermal treatment in air at 400 °C and chemical treatment with H2SO4 and HNO3 developed by Skyllas-Kazacos group in the 1990s [16,17] remain the most effective, economical and easiest methods for activation of carbon-based materials. Surface modification of carbon-based electrodes with additives like WO3 [18], W-doped Nb2O5 [19], TiO2 [20], CeO2 [21] and ZrO2 [22], Sb3+ additive [23], Bismuth nanoparticles [24], N- and WO3- [25], graphene [26], TiN nanowires [27] have also been reported, resulting in improved battery performance.
In a recent publication by UNSW researchers a VRFB operating with a 3 M vanadium electrolyte was reported [28,29]. While the use of stabilising agents increases the induction time for the thermal precipitation of V (V) species at elevated temperatures, at 3 M vanadium concentrations, the recommended operating temperature range was quite limited. By eliminating the positive half-cell solution, however, this limitation is removed, so high-temperature operation becomes feasible. The aim of this study was thus to develop a high energy density VOFC that has the potential to be used in a wider range of applications including electric vehicles. In this paper, we report on the investigation of improved membrane electrode assemblies in new cell designs to reduce voltage losses, with the potential for significant energy density increases when using high concentration 3.6 M vanadium electrolyte.
In the mid-1990s, Skyllas-Kazacos and coworkers reported the use of precipitation inhibitors to stabilise highly supersaturated vanadium electrolytes. By using precipitation inhibitors like ammonium sulphate and phosphoric acid, a 3 M vanadium electrolyte could be prepared, and charge-discharge cycled in a VRFB [28,29]. A high concentration vanadium solution in sulphuric acid was thus prepared and tested in the VOFC.
2. Results & Discussion
2.1. VOFC Performance with Commercial MEAs
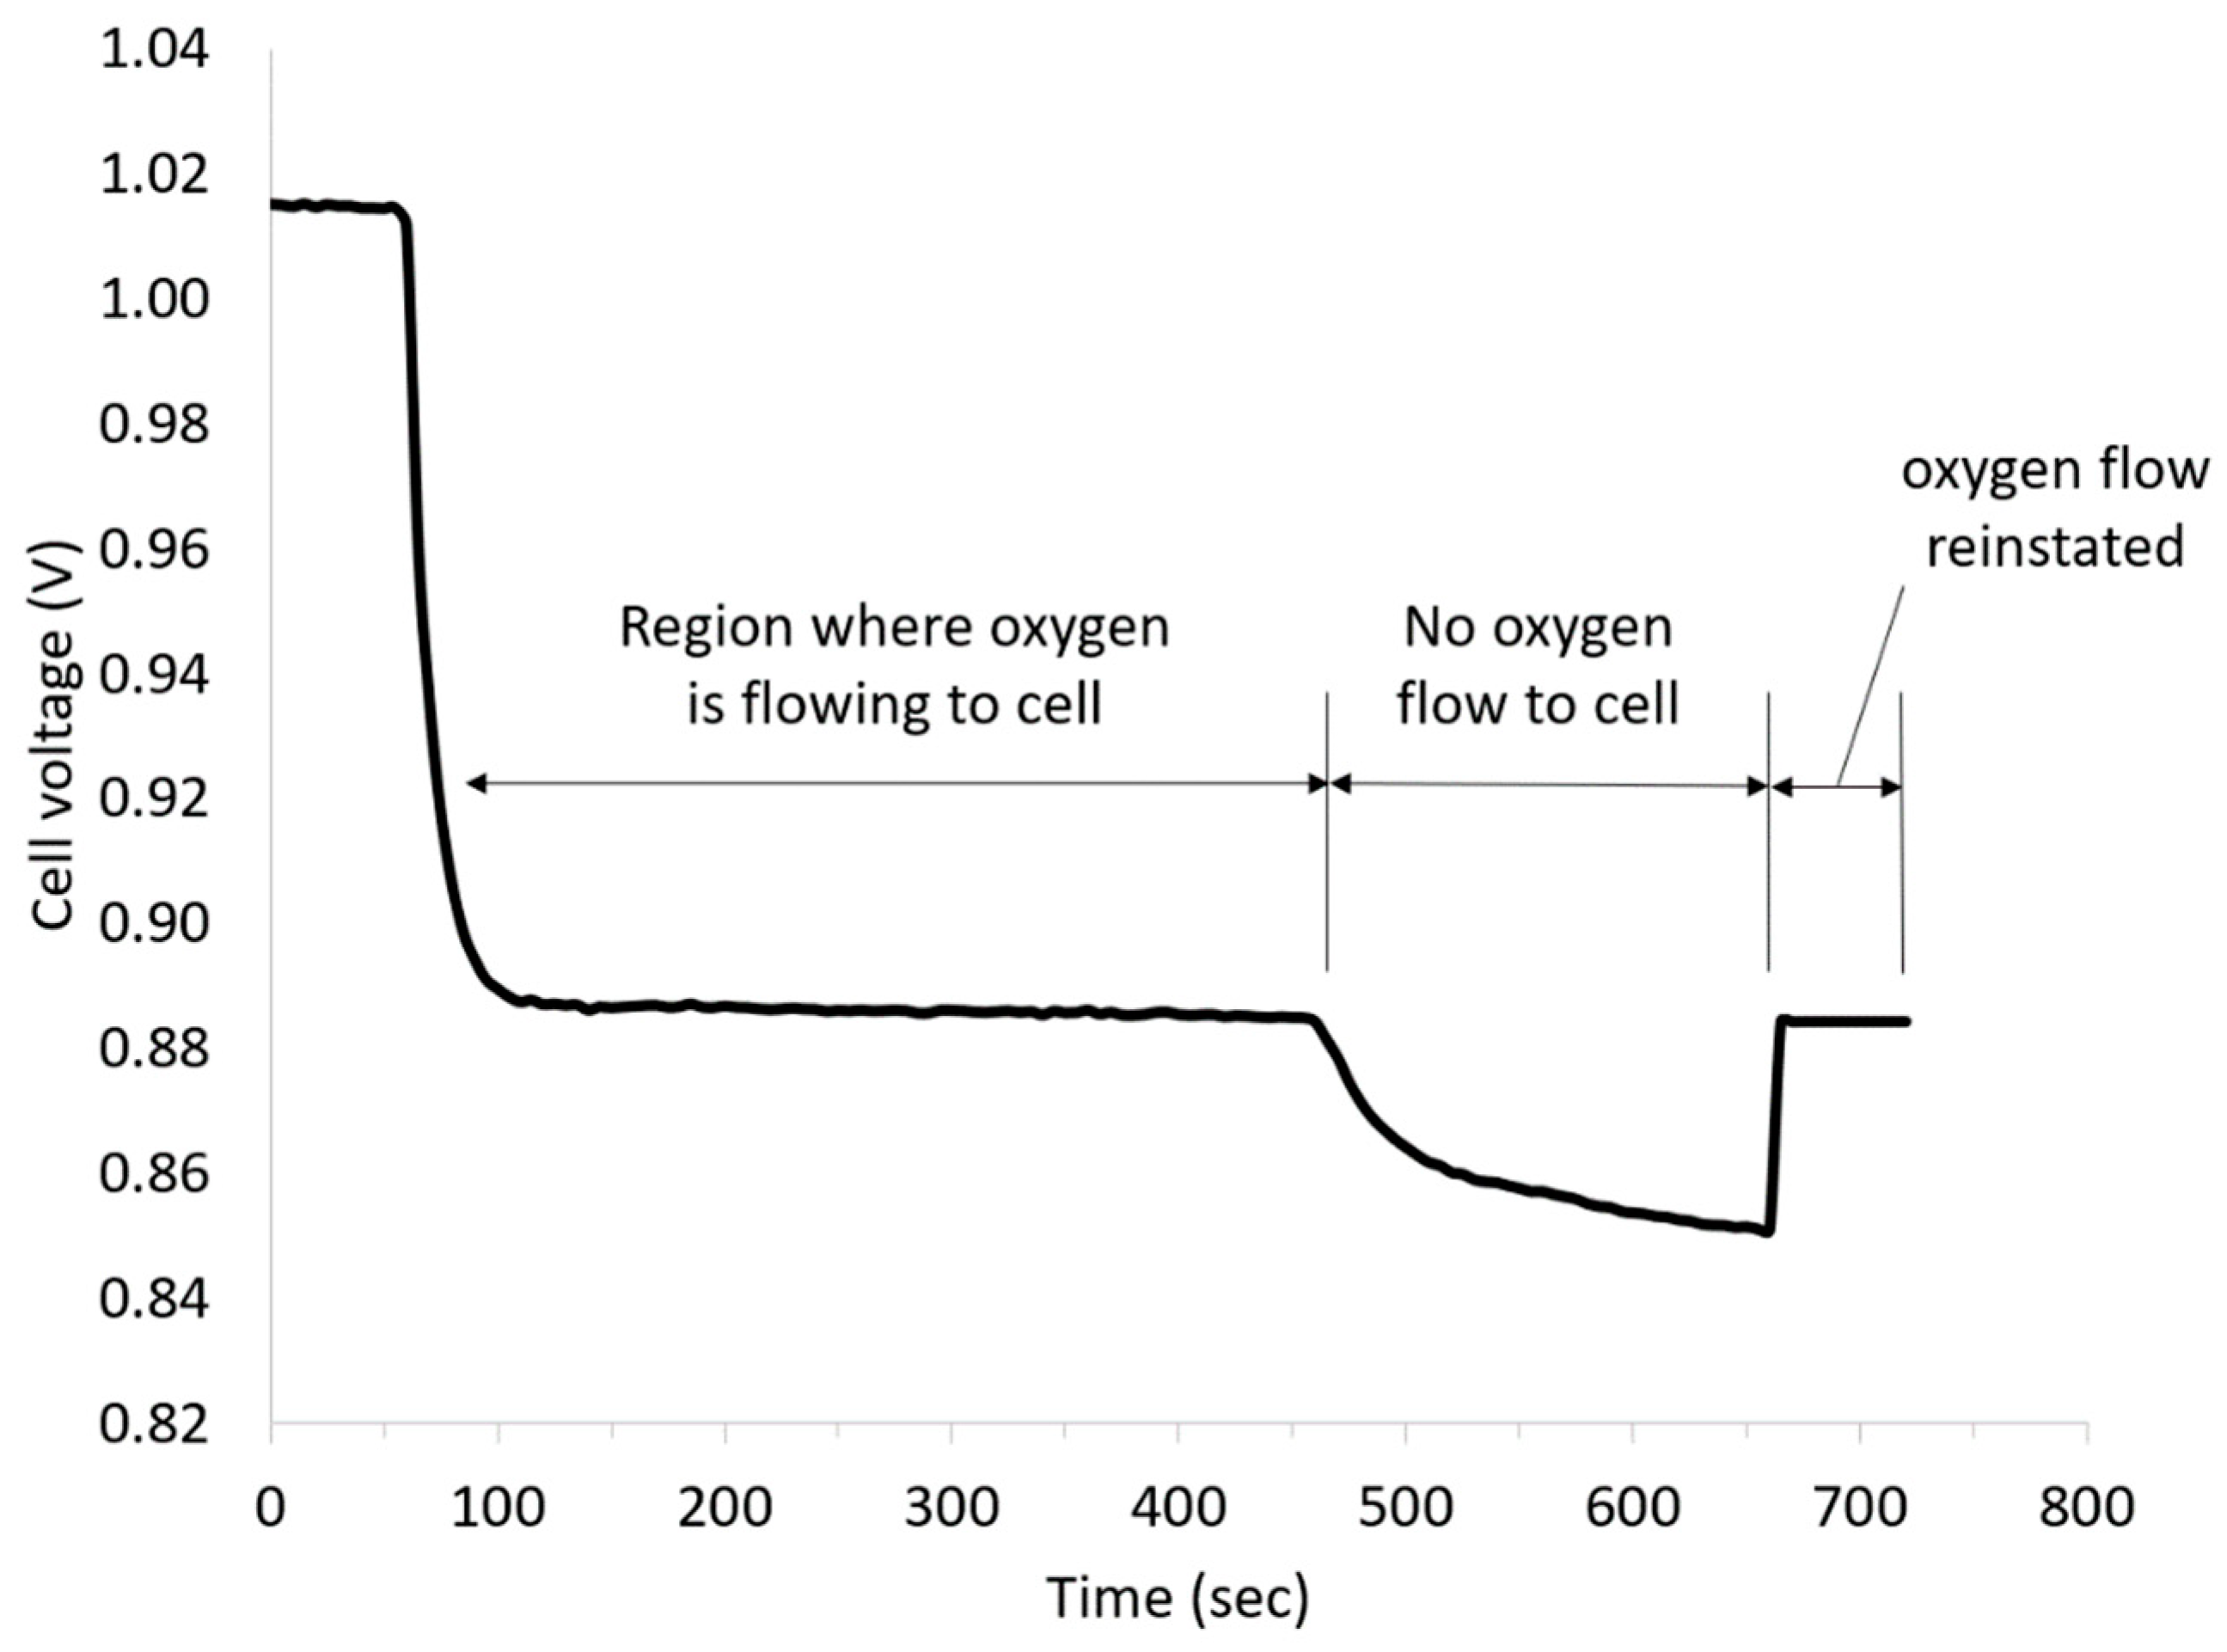
Commercial membrane electrode assemblies comprising Pt/C catalysts with a loading of 4 mg cm−2 Pt and 2 M V(II) solution in 5 M H2SO4 were used to study the performance of the vanadium oxygen fuel cell. Figure 3 presents the cell voltage vs time plot obtained at a current density of 5 mA cm−2 at room temperature after an initial OCV measurement for 60 s. The OCV was approx. 1.015 V, and thus, almost 500 mV lower than the differences of the standard potentials. One possible cause could have been the formation of a mixed potential in the three-phase boundary layer by diffused vanadium solution. After applying a current density of 5 mA cm−2 to the cell, the cell voltage decreased to approx. 0.885 V due to the influence of the kinetics of the reactions and the ohmic resistances, and was almost linear under load over the course of time.
To confirm the contribution of the ORR to the total cell voltage, the oxygen supply was turned off during the measurement. As can be seen from Figure 3, the discharge voltage dropped after stopping the oxygen flow due to ORR mass transport limitations but recovered again on the restoration of oxygen feed.
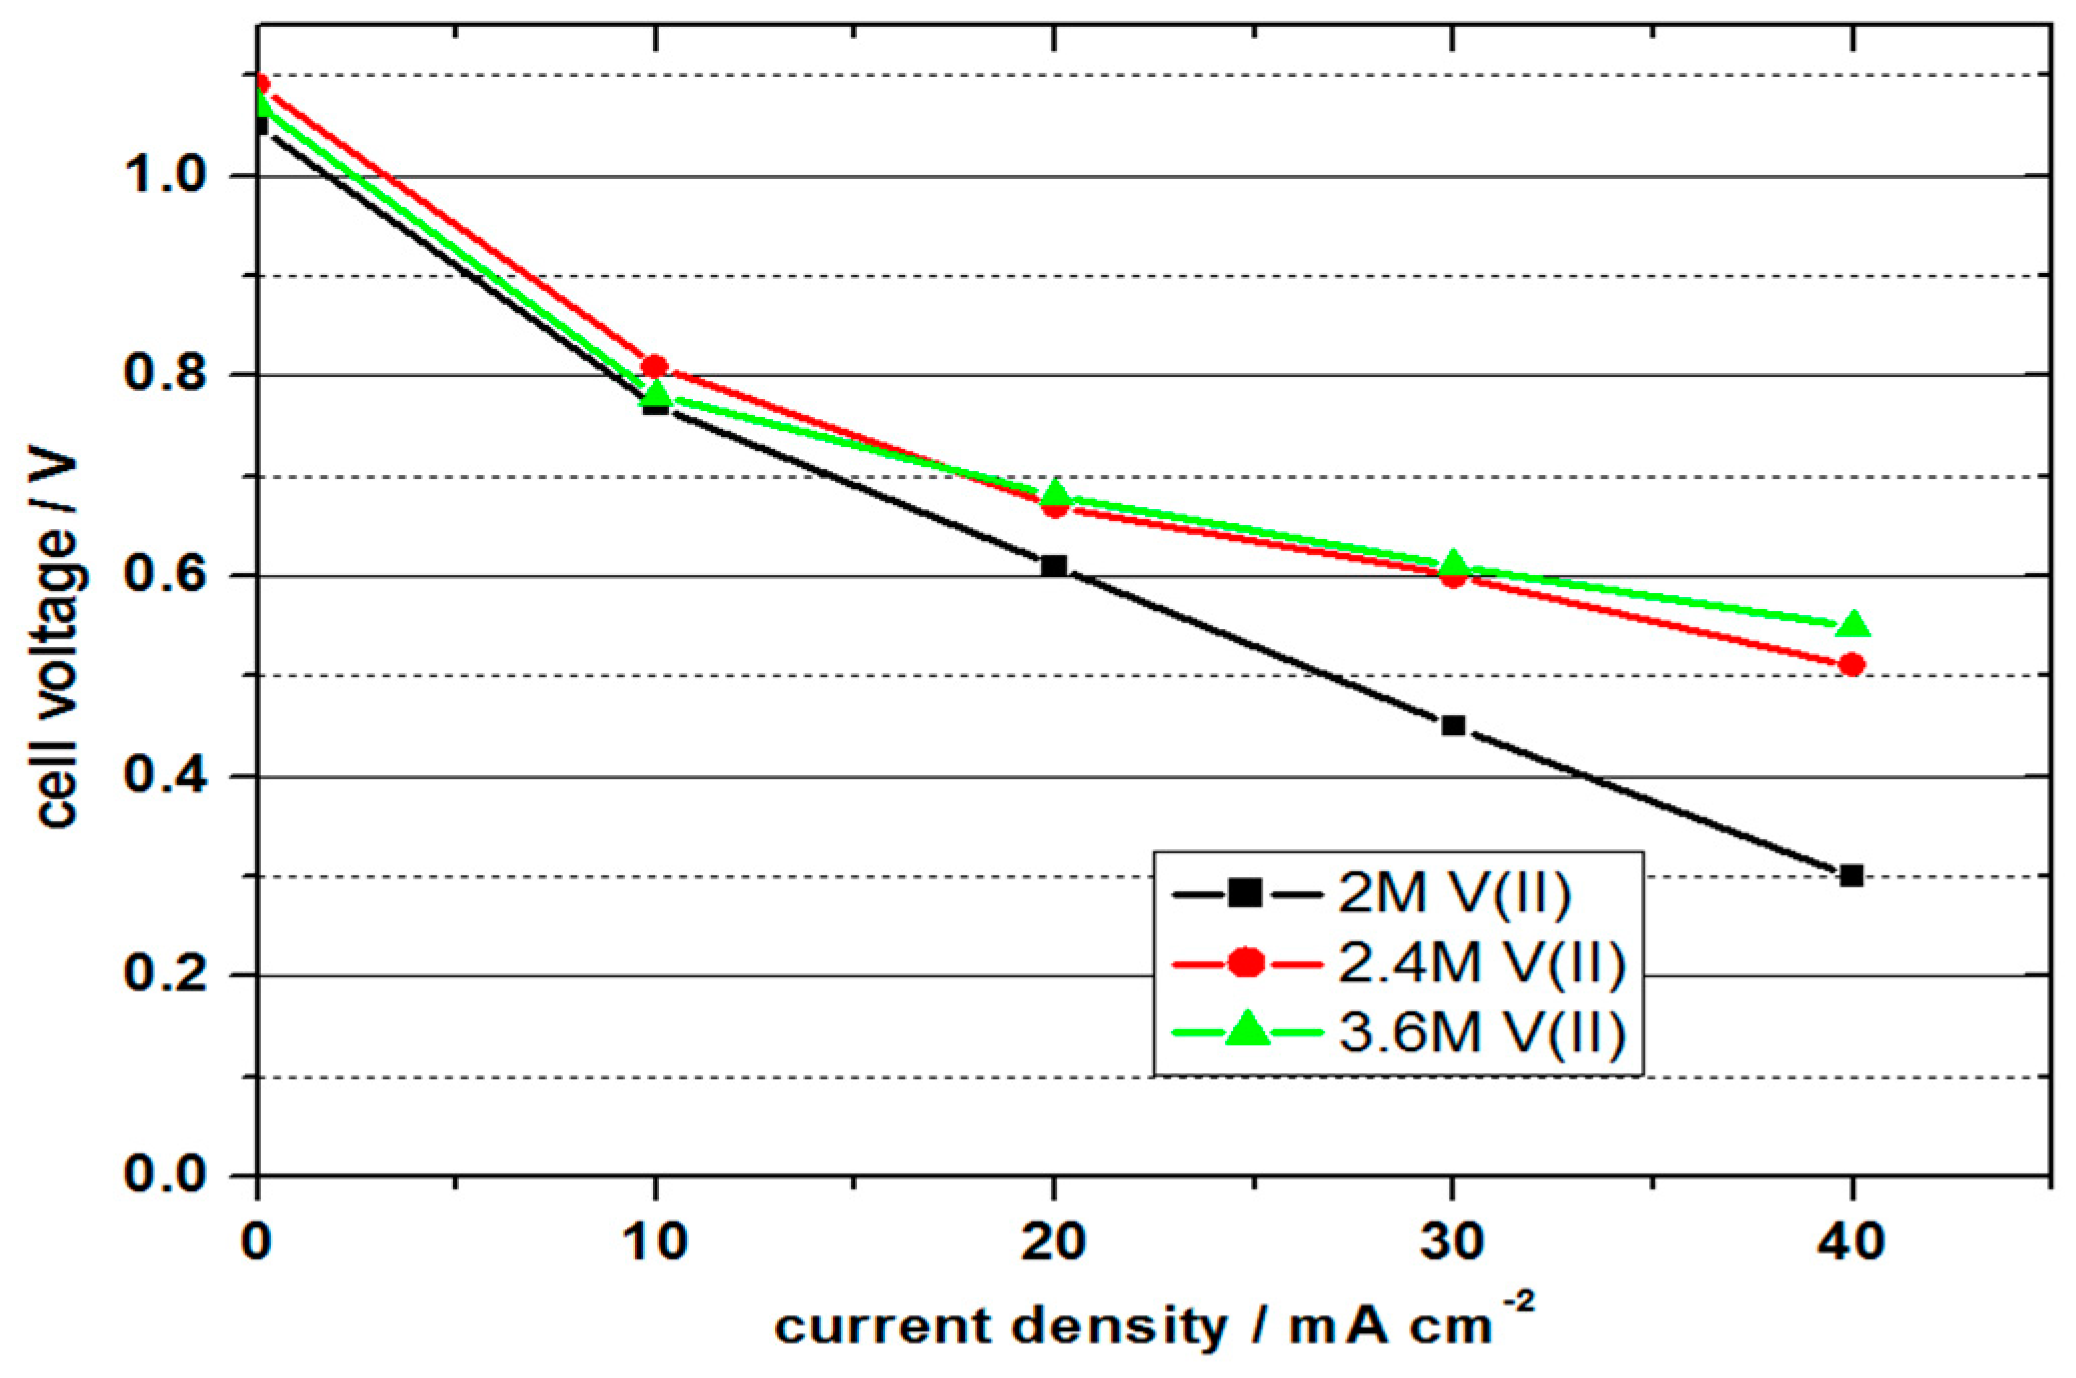
To study the behaviour of VOFCs with commercial MEAs and with different vanadium concentrations, a series of discharge experiments were conducted. Table 1 shows the comparison of the VOFC performance with 2 M V(II), 2.4 M V(II) and 3 M V(II) in 5–6 M sulphuric acid solutions at room temperature and Figure 4 shows the polarisation curves.
With 1.05 to 1.09 V, all cells achieved similar values for the OCV. In contrast to the previous experiment, the values were a few millivolts higher, but still approx. 400 mV below the difference of the standard potential, which indicates a non-optimal formation of the three-phase boundary layer. Due to the influence of the activation energies, the cell voltage decreased disproportionately at current densities of 10 mA cm−2 and was linear, with higher current densities. The cell with a vanadium concentration of 2 M achieved the lowest performance values; the cells with 2.4 and 3.6 molar solutions showed similar and higher values.
With the 2 molar solution, a maximum power density of 13.5 mW cm−2 was achieved with a current density of 30 mA cm−2 and an efficiency of 30%. At the higher concentrations, higher power values were achieved due to the lower cell resistance at higher current densities. The cell with the 3.6 molar solution achieved the highest power density with 22 mW cm−2 at 40 mA cm−2 and energy efficiency of 37%. It is important to note that the cells still have scope for optimisation to produce higher performance; however, the feasibility of using higher concentration electrolytes is clearly evident.
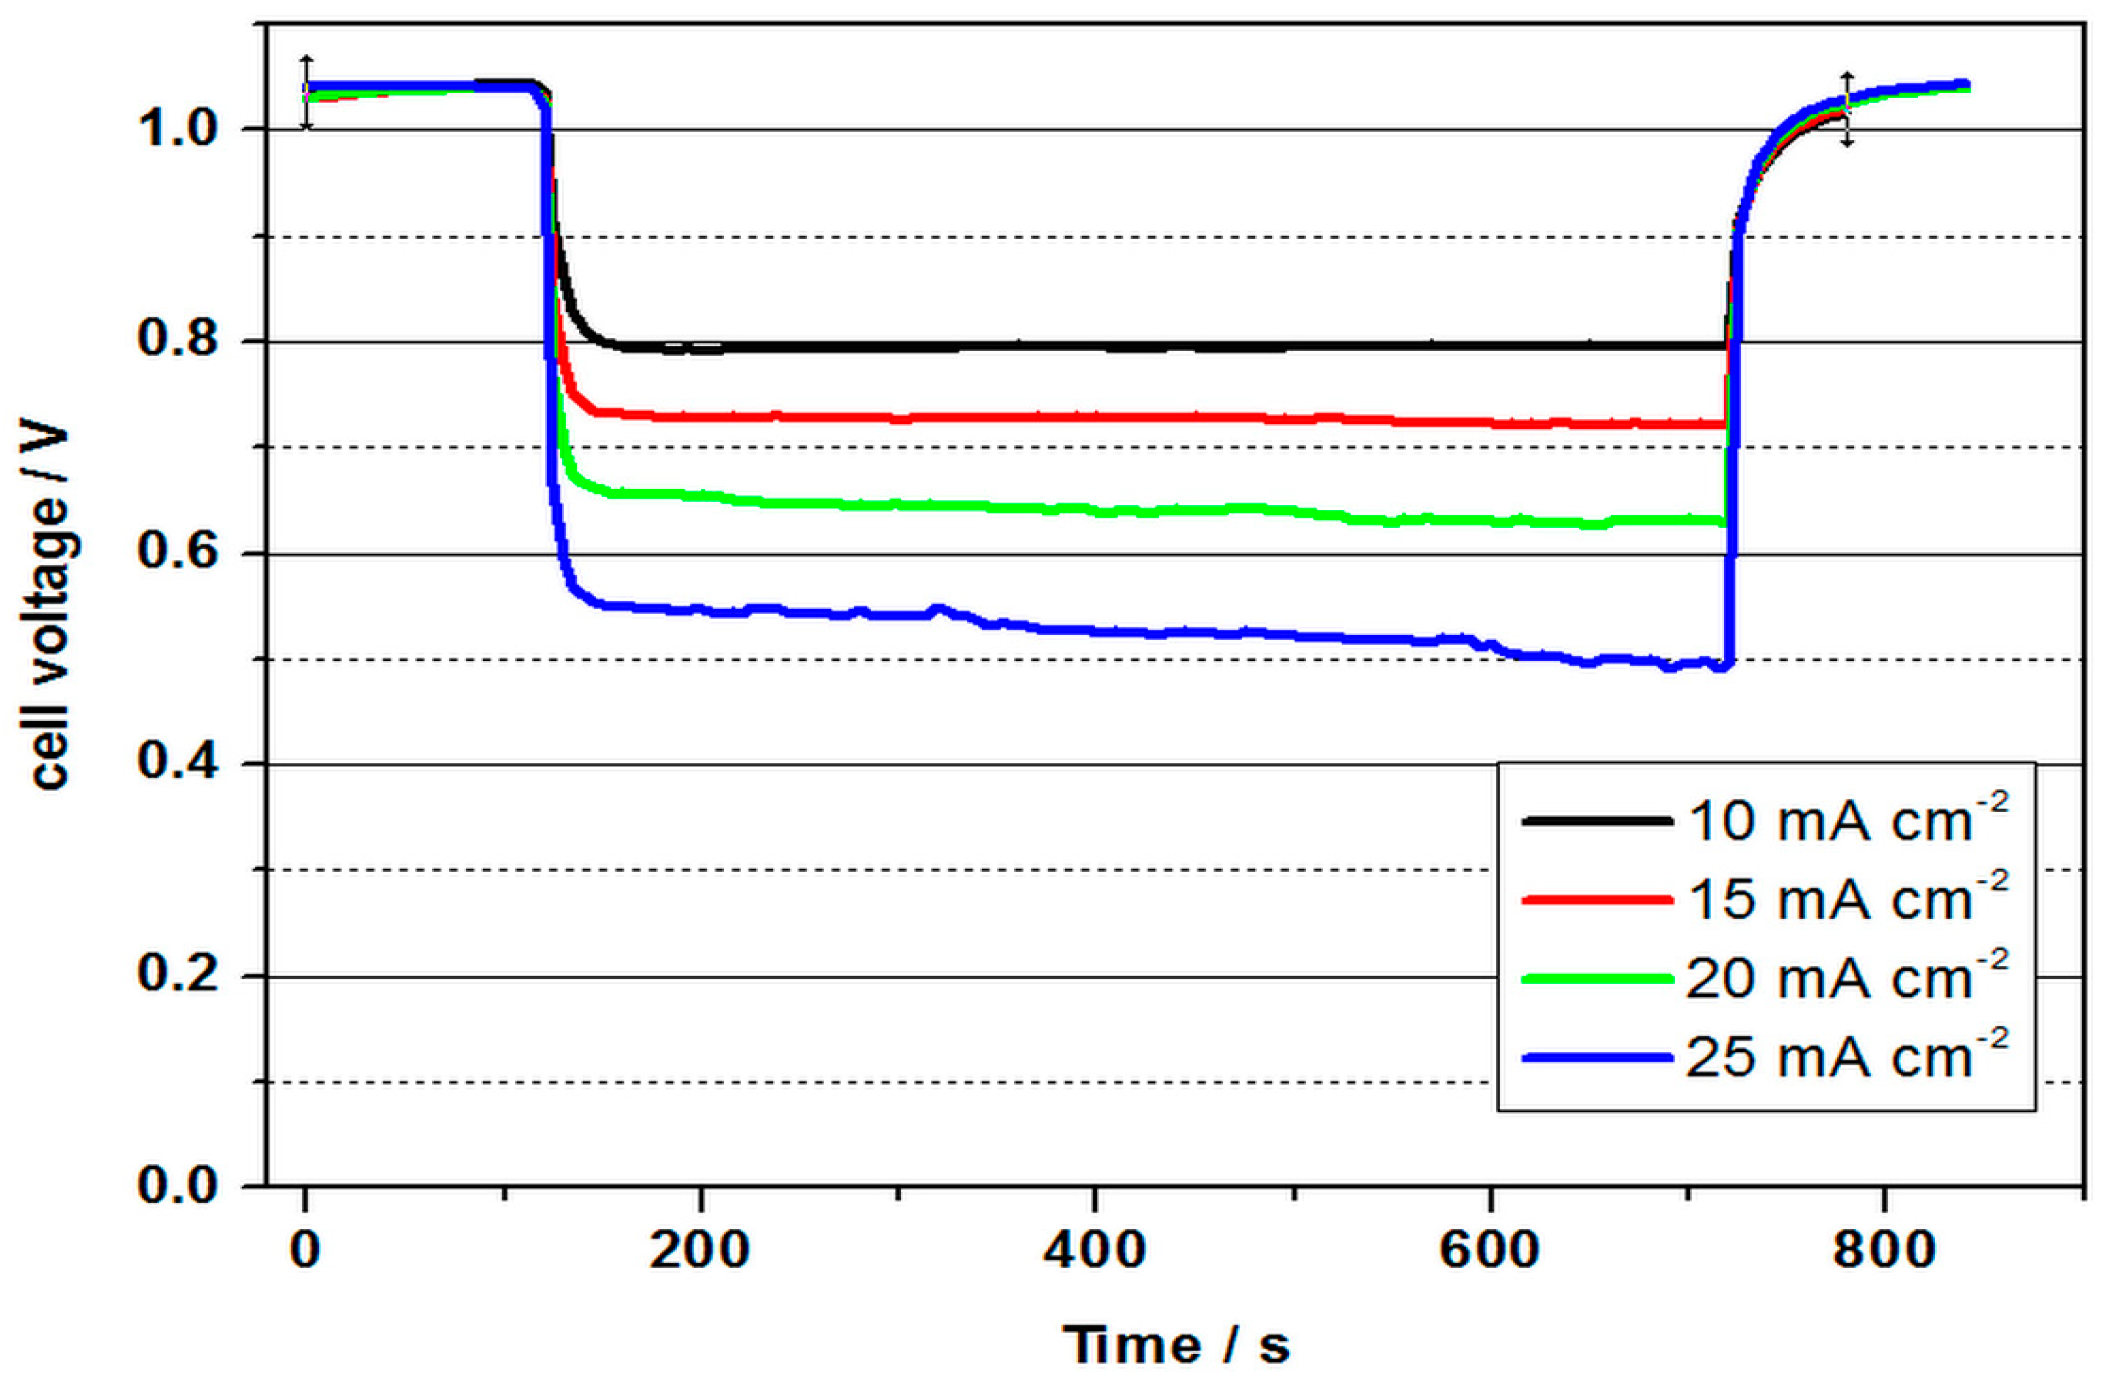
Further experiments were conducted at an elevated temperature to enhance the kinetics of the electrode reactions and increase cell voltage. Figure 5 represents the performance of a VOFC operating with 2 M V(II) solution and commercial Pt/C MEA at various current densities at 60 °C.
As can be seen in Figure 5, the cell with a cell voltage of 1.04 V reached a value about 450 mV lower than the differences of the standard potentials, which can again be attributed to non-optimal conditions of the three-phase boundary layers at the cathode. As can be seen in Table 2, together with Table 1, similar results were obtained for the performance values as for the VOFC at room temperature. The cell voltage was 0.64 V at 60 °C and 20 mA cm−2 and 0.61 V at room temperature. Reasons for the only slight increase could be an interaction of diffusion from the negative half-cell space and oxygen flow and pressure at an elevated temperature, which prevents an optimal reaction at the cathode. The power density was calculated by multiplying the average cell voltage by the corresponding current density.
In order to improve performance, the use of a catalyst/surface modification methods of carbon was considered for the negative half-cell reaction. Non-noble metal catalysts for the oxygen reduction reaction were also explored to investigate the potential to reduce the noble metals like Pt, Pt/Ir etc. The in-house fabrication of MEAs that incorporated different oxygen reduction reaction catalysts with a suitable catalyst for the negative half-cell reaction was therefore undertaken. For this study, the electrocatalyst reported by Cao et al. [13] for the vanadium electrode reactions was selected. For the oxygen reduction electrode, a variety of electrocatalysts were screened for their potential application in VOFCs.
2.2. Membrane Electrode Assembly (MEA) Fabrication
The preparation of MEAs involving non-noble electrocatalysts was initially explored, and several experiments were carried out to study the bonding process. The coating of catalyst directly on the membrane using painting brush or spray coating failed to produce a stable catalyst-coated membrane (CCM) with good adhesion.
It was observed that while a uniform coating of carbon paste by painting brush method can be obtained on carbon paper and cloth using NAFION® binder (Sigma Aldrich, Sydney, Australia) and hot press, the adhesion of these with the membrane was not successful using the hot press. Spray coat methods have been used in the preparation of catalyst coated membranes (CCM) in fuel cells where the catalyst powder is directly sprayed on to the membrane. Based on this method, the catalyst ink (carbon black powder + PTFE solution, 20 wt. %) was spray coated using the 150W Ozito mini air spray gun on the surface of wet proofed carbon paper. This was then hot pressed on to pre-treated VB1 or NAFION® membrane. Using this method, uniform adhesion of the catalyst layer was successfully achieved. Figure 6 summarises the tests results obtained during the investigation of the bonding process of MEA.
Figure 6a shows the carbon black coating obtained using the paintbrush method on a VB1 membrane (properties like NAFION® 115) using 5% NAFION® solution as a binder. There was no uniform adhesion of carbon black to the membrane resulting into dislodgement of carbon black. Tests were carried out by increasing the binder concentration to up to 15% to check the effect on the bonding process. However, a stable coating could not be obtained using this method. Shrinking and wrinkle formation of the membrane was also observed during the drying process in addition to the development of cracks in the coated layer, resulting in the removal of carbon black.
Due to problems in adhesion of the carbon black paste on to the membrane, it was decided to coat the carbon black powder directly onto Toray carbon paper 120 or wet proofed carbon cloth, which can be used as a gas diffusion layer. In this test, carbon black powder was mixed with 5% NAFION® solution in isopropanol as a binder to form a paste and spray coated on the Toray carbon paper 120 using an air spray gun. Figure 6b represents the uniform coating obtained by a spray coat method. The coating was dried at 80 °C. A uniform coating with good adhesion can be seen in Figure 6b.
Catalyst layers coated on the carbon paper (e.g., Pt/C, 0.4 mg cm−2 on carbon paper) were purchased from the Fuel cell store, USA and hot pressed against VB1 membranes at 3 MPa, 140 °C. Membrane shrinking observed was very small with slight folding of the membrane observed. The obtained MEA can be seen in Figure 6c. A similar test was carried out to prepare an MEA using pre-treated NAFION® 115 membrane. A catalyst layer (carbon black and NAFION® binder) was coated on the wet proofed carbon paper using a mini-compressor airbrush kit to form a uniform catalyst layer on the GDL. This was then hot pressed on the NAFION® 115 membrane (catalyst layer on the membrane side) at 3 MPa, 140 °C for 10 min. The obtained membrane electrode assembly (MEA) is shown in Figure 6d.
2.3. VOFC Performance with Various Electrocatalysts
Preliminary tests with UNSW fabricated MEAs were carried out to measure the cell voltage obtained for different electrode combinations and values are reported in Table 3 below. For all these experiments 2 M V(II) solution in 5 M H2SO4 was used as a negative electrolyte.
The OCV values of the measurements at 25 °C were between 0.75 and 0.85 V. At temperatures of 80 °C, the values for all tested combinations were in some cases significantly higher with values between 0.93 V and 1.4 V. The pure carbon-based electrodes achieved the lowest values, which could be expected due to the poor catalytic activity for the ORR. The cells with MoS2 and MoO3 as catalysts for the ORR hardly achieved higher OCV values than the carbon electrodes. The two cells with commercial Pt/C electrodes—one employed a commercial electrode, and the other utilised commercial platinum loaded carbon particles with the electrode manufactured at UNSW—achieved the highest OCV values at 80 °C with 1.40 V and 1.35 V respectively, and were thus only 100–150 mV below the difference of the standard potentials. It was also observed that during discharge tests, except for commercial Pt/C electrodes used for ORR, the cell voltage for other combinations quickly dropped to the cut-off voltage of 0.1 V at current densities of 20 mA cm−2, which was the minimum voltage measurable using the battery tester equipment. The commercial Pt/C electrode was therefore used in all further VOFC experiments.
The MEA incorporating MoO3 treated carbon paper for the negative and a Pt/C oxygen reduction electrode were initially tested at 50 °C in a VOFC that employed a 2 M V(II) negative half-cell solution. The cell was discharged at 20 mA cm−2 and the cell voltage vs time curve is presented in Figure 7. The cell was subsequently tested with a high energy density electrolyte as described below.
For 5 min, the OCV was measured at the beginning, whereby approx. 1.08 V was achieved. The value was therefore similar to the values with commercial MEAs and 10 times higher Pt loads, but significantly lower than with the Pt-based cells at 80 °C. During the subsequent discharge process with a current density of 20 mA cm−2, the cell voltage decreased to values between 0.62 and the cut-off voltage to 0.1 V over a period of approx. 80 min. The initial power density was 12.4 mW cm−2 and was thus in about the same range as the measurements with commercial MEAs with 4 mg cm−2 Pt. The theoretical capacity of 70 mL 2 M V(II) is approx. 1.9 Ah. In this discharge test, 0.8 Ah were converted, and thus, only a low charge carrier efficiency of 42 % was achieved. The most probable causes were: diffusion of V(II) ions into the positive half-cell space, diffusion of O2 through the membrane and oxidation of V(II) by atmospheric oxygen. The experiments were conducted only at a very low overpressure at O2 (water column), so no assessment can be given as to whether V(II) was lost by diffusion or by diffused oxygen. Both paths are probable and require further investigation. Due to the special features of the relatively complex experimental setup especially at higher temperatures, oxidation by atmospheric oxygen could not be ruled out. An optimised setup should have the capability to reduce this influence in future experiments.
2.4. VOFC with High Concentration Vanadium Electrolyte
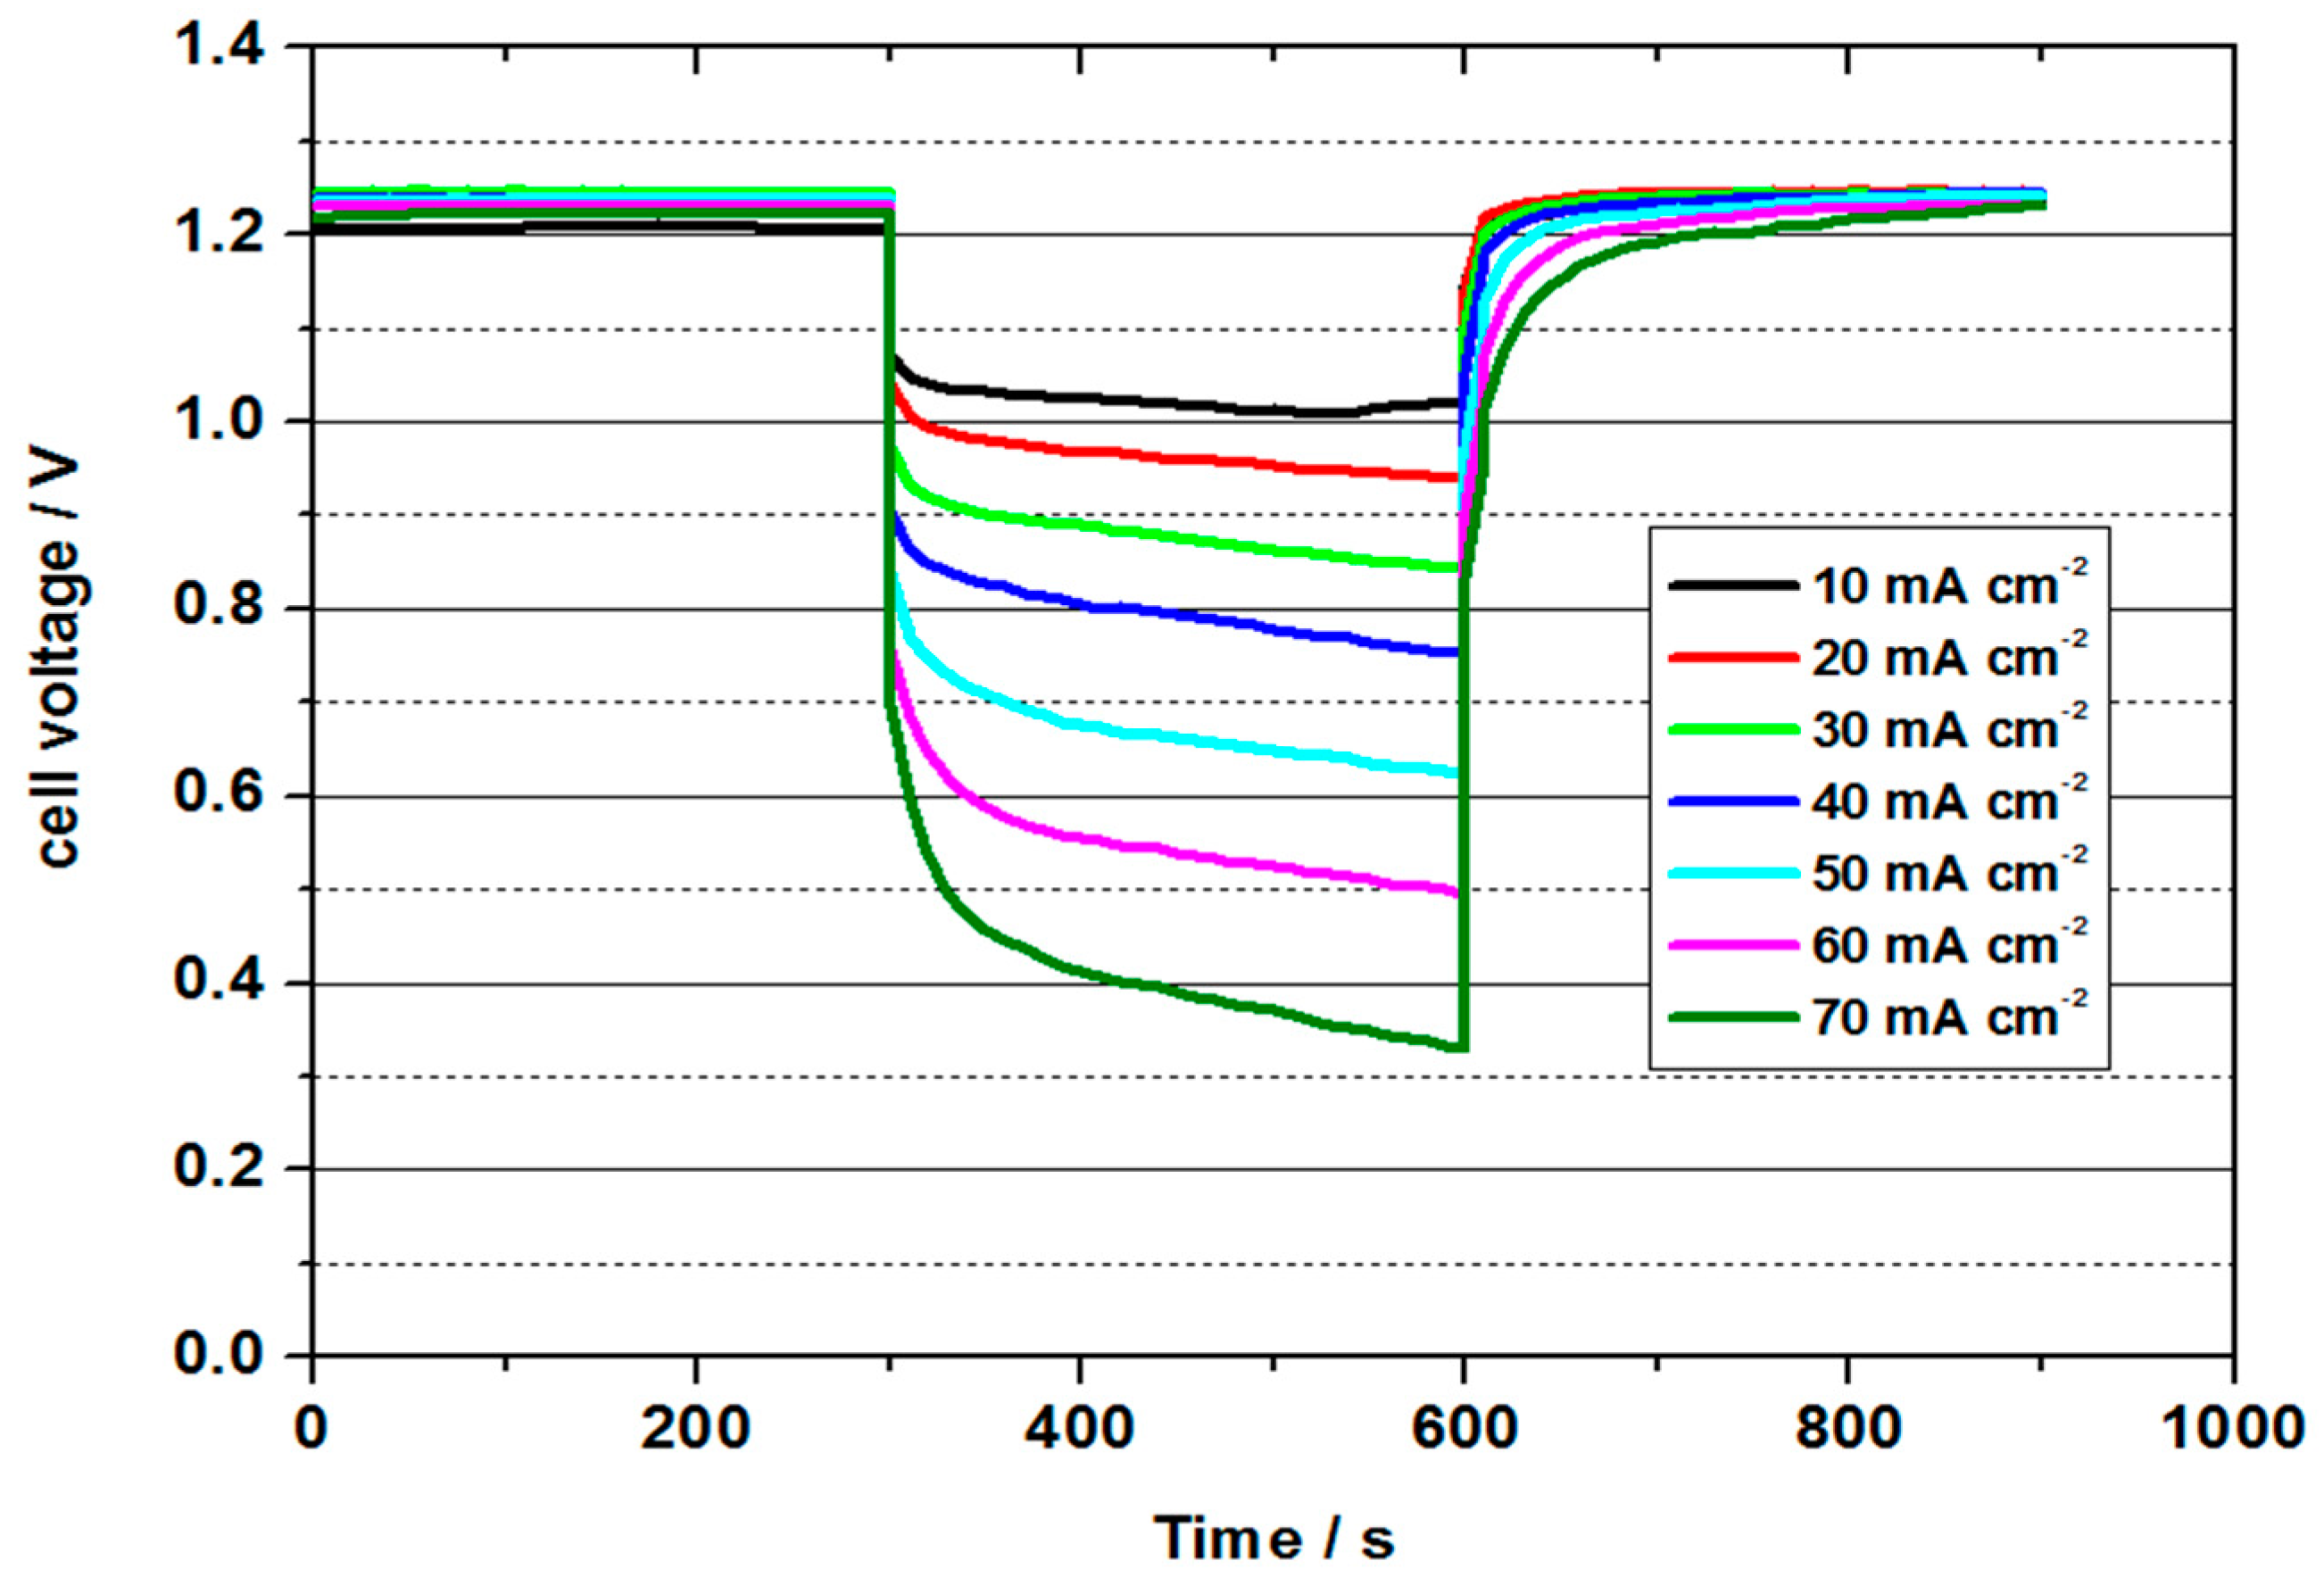
Figure 8 shows the cell voltage and Table 4 shows the performance values obtained in the case of 3.6 M Vanadium electrolyte in 6–8 M H2SO4 during short-term discharge tests at 50 °C. With a value of approx. 1.2–1.25 V, the OCV was significantly higher than in the previous tests and thus had a better three-phase boundary layer.
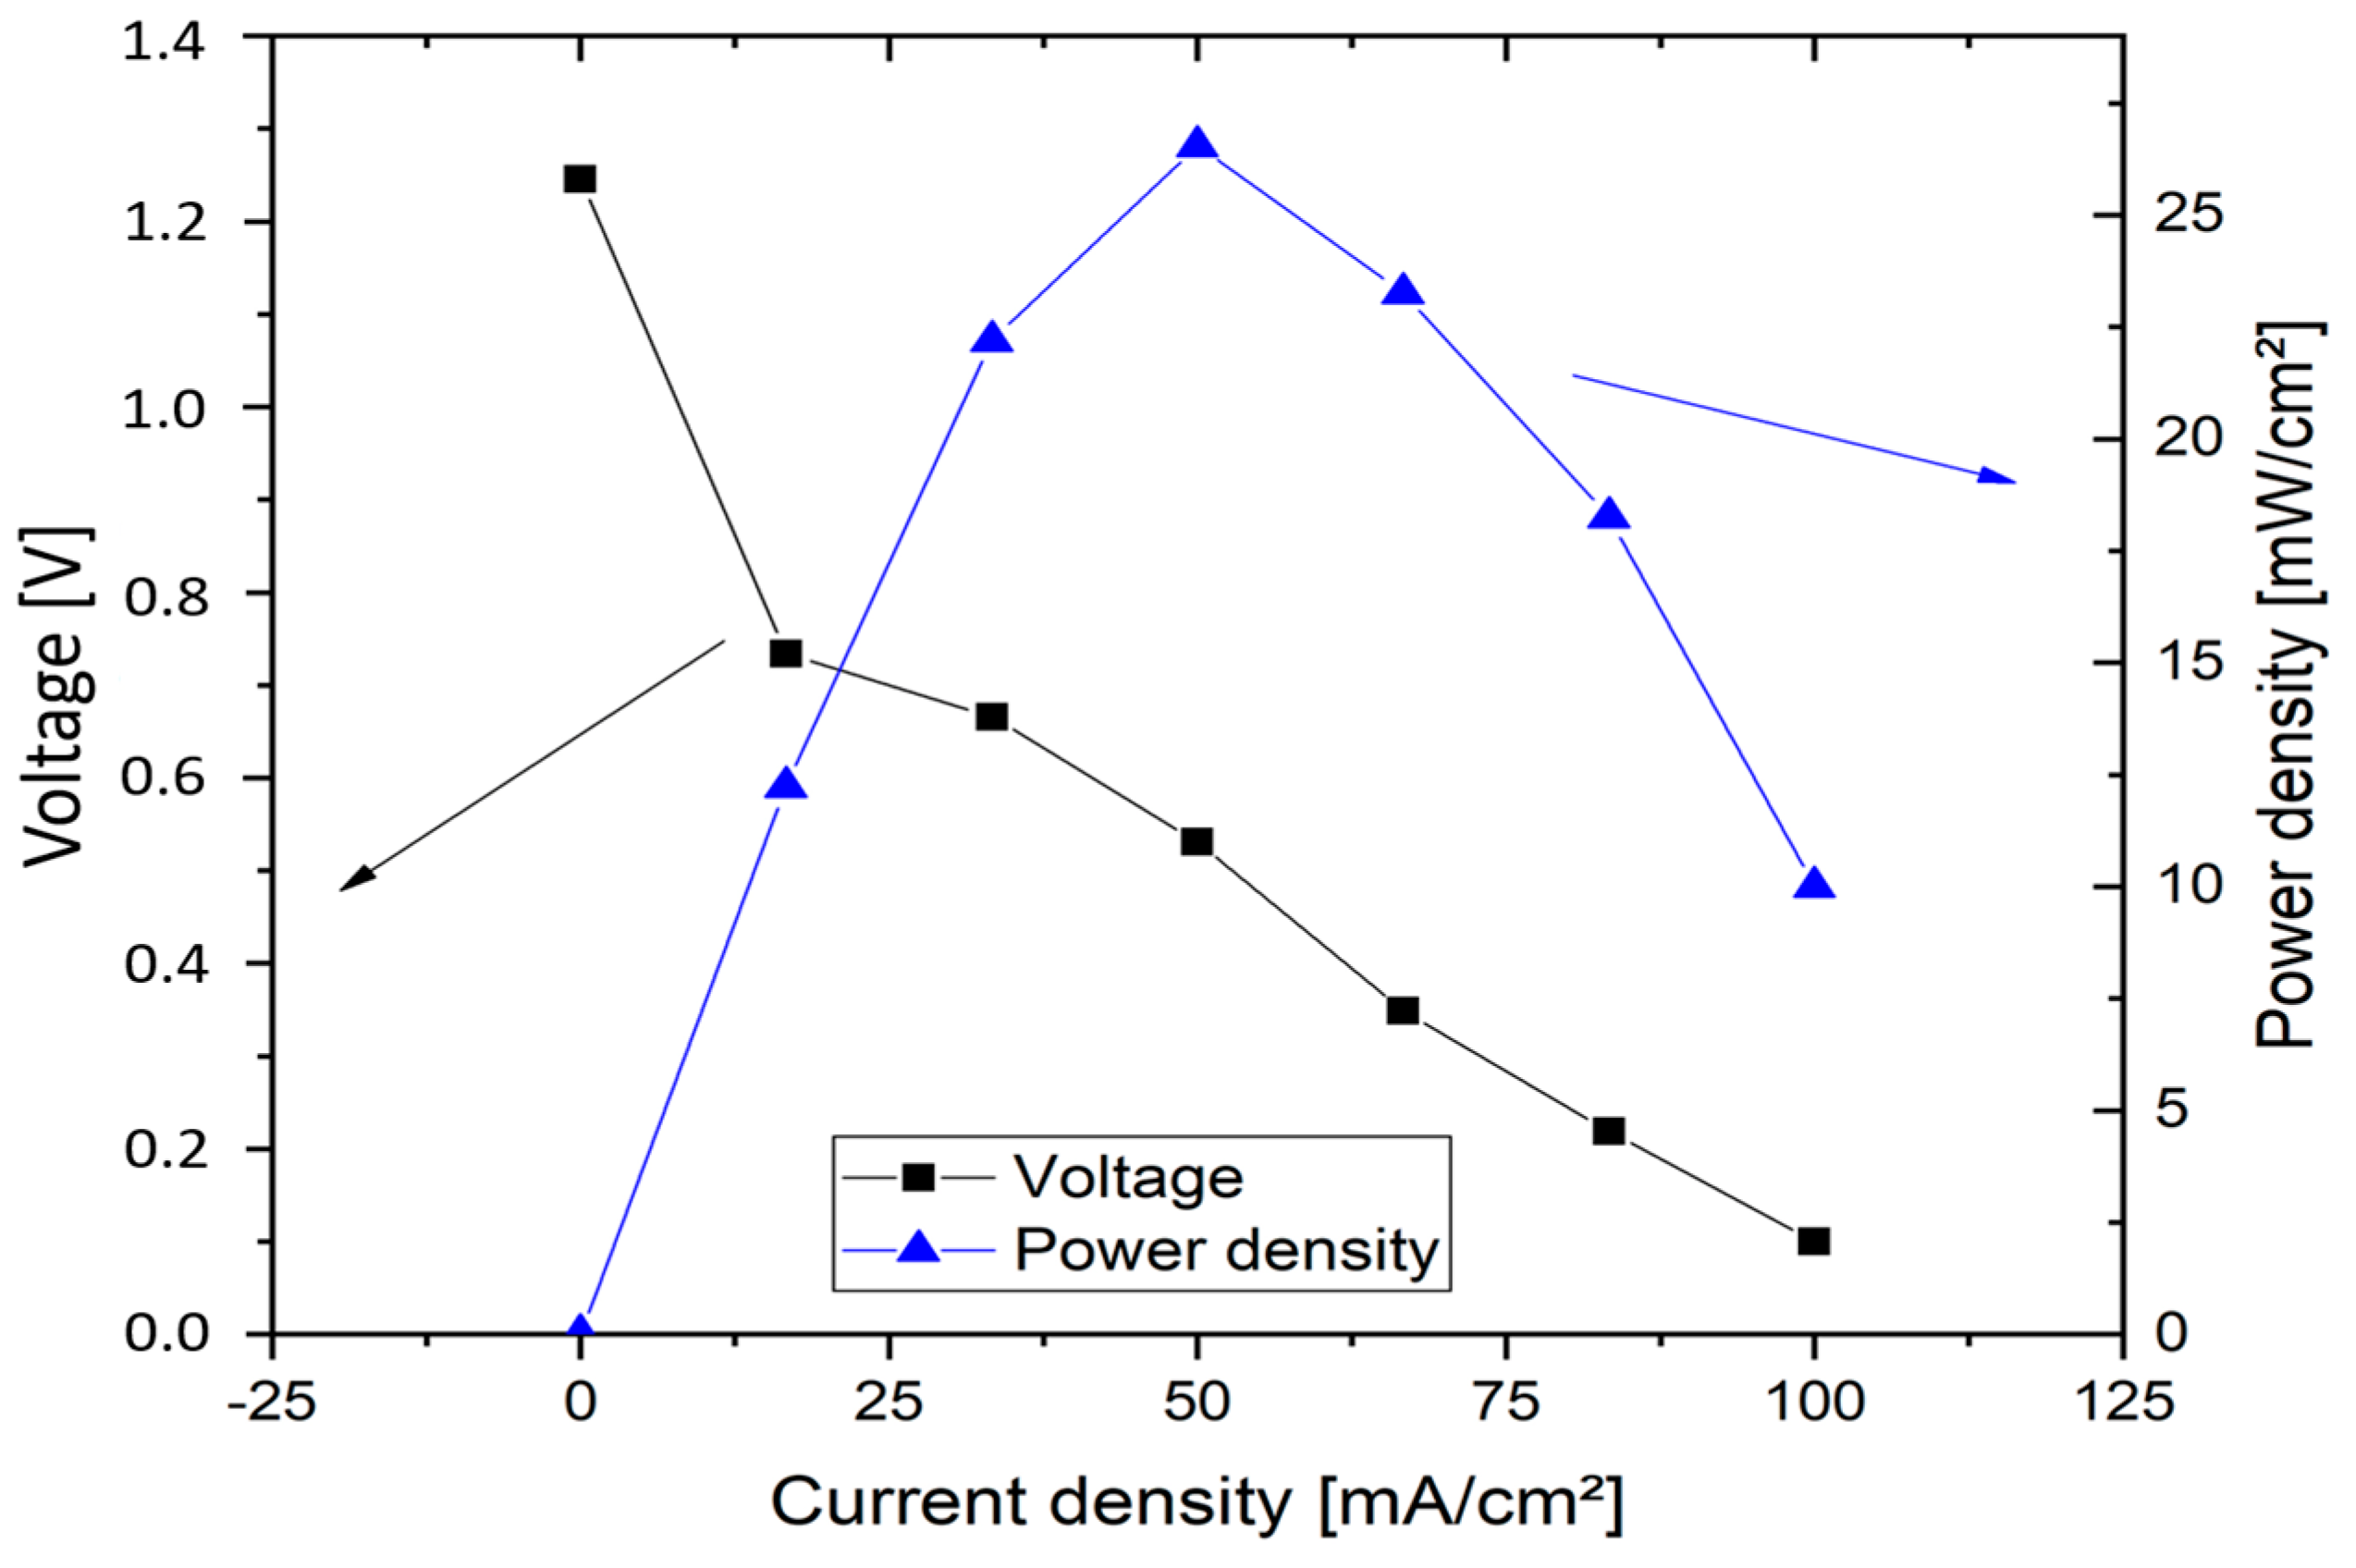
The highest power density was determined to be 34.5 mW cm−2 with a current density of 50 mA cm−2. The power density was thus higher than in all previous tests. The energy efficiency was 46 %. The cell could be discharged up to a current density of 70 mA cm−2, whereby still 30 mW cm−2 and an energy efficiency of 29% could be obtained. The cell with a 3.6 molar V(II) solution thus achieved the best performance values of all measurements and at the same time shows the potential for future developments.
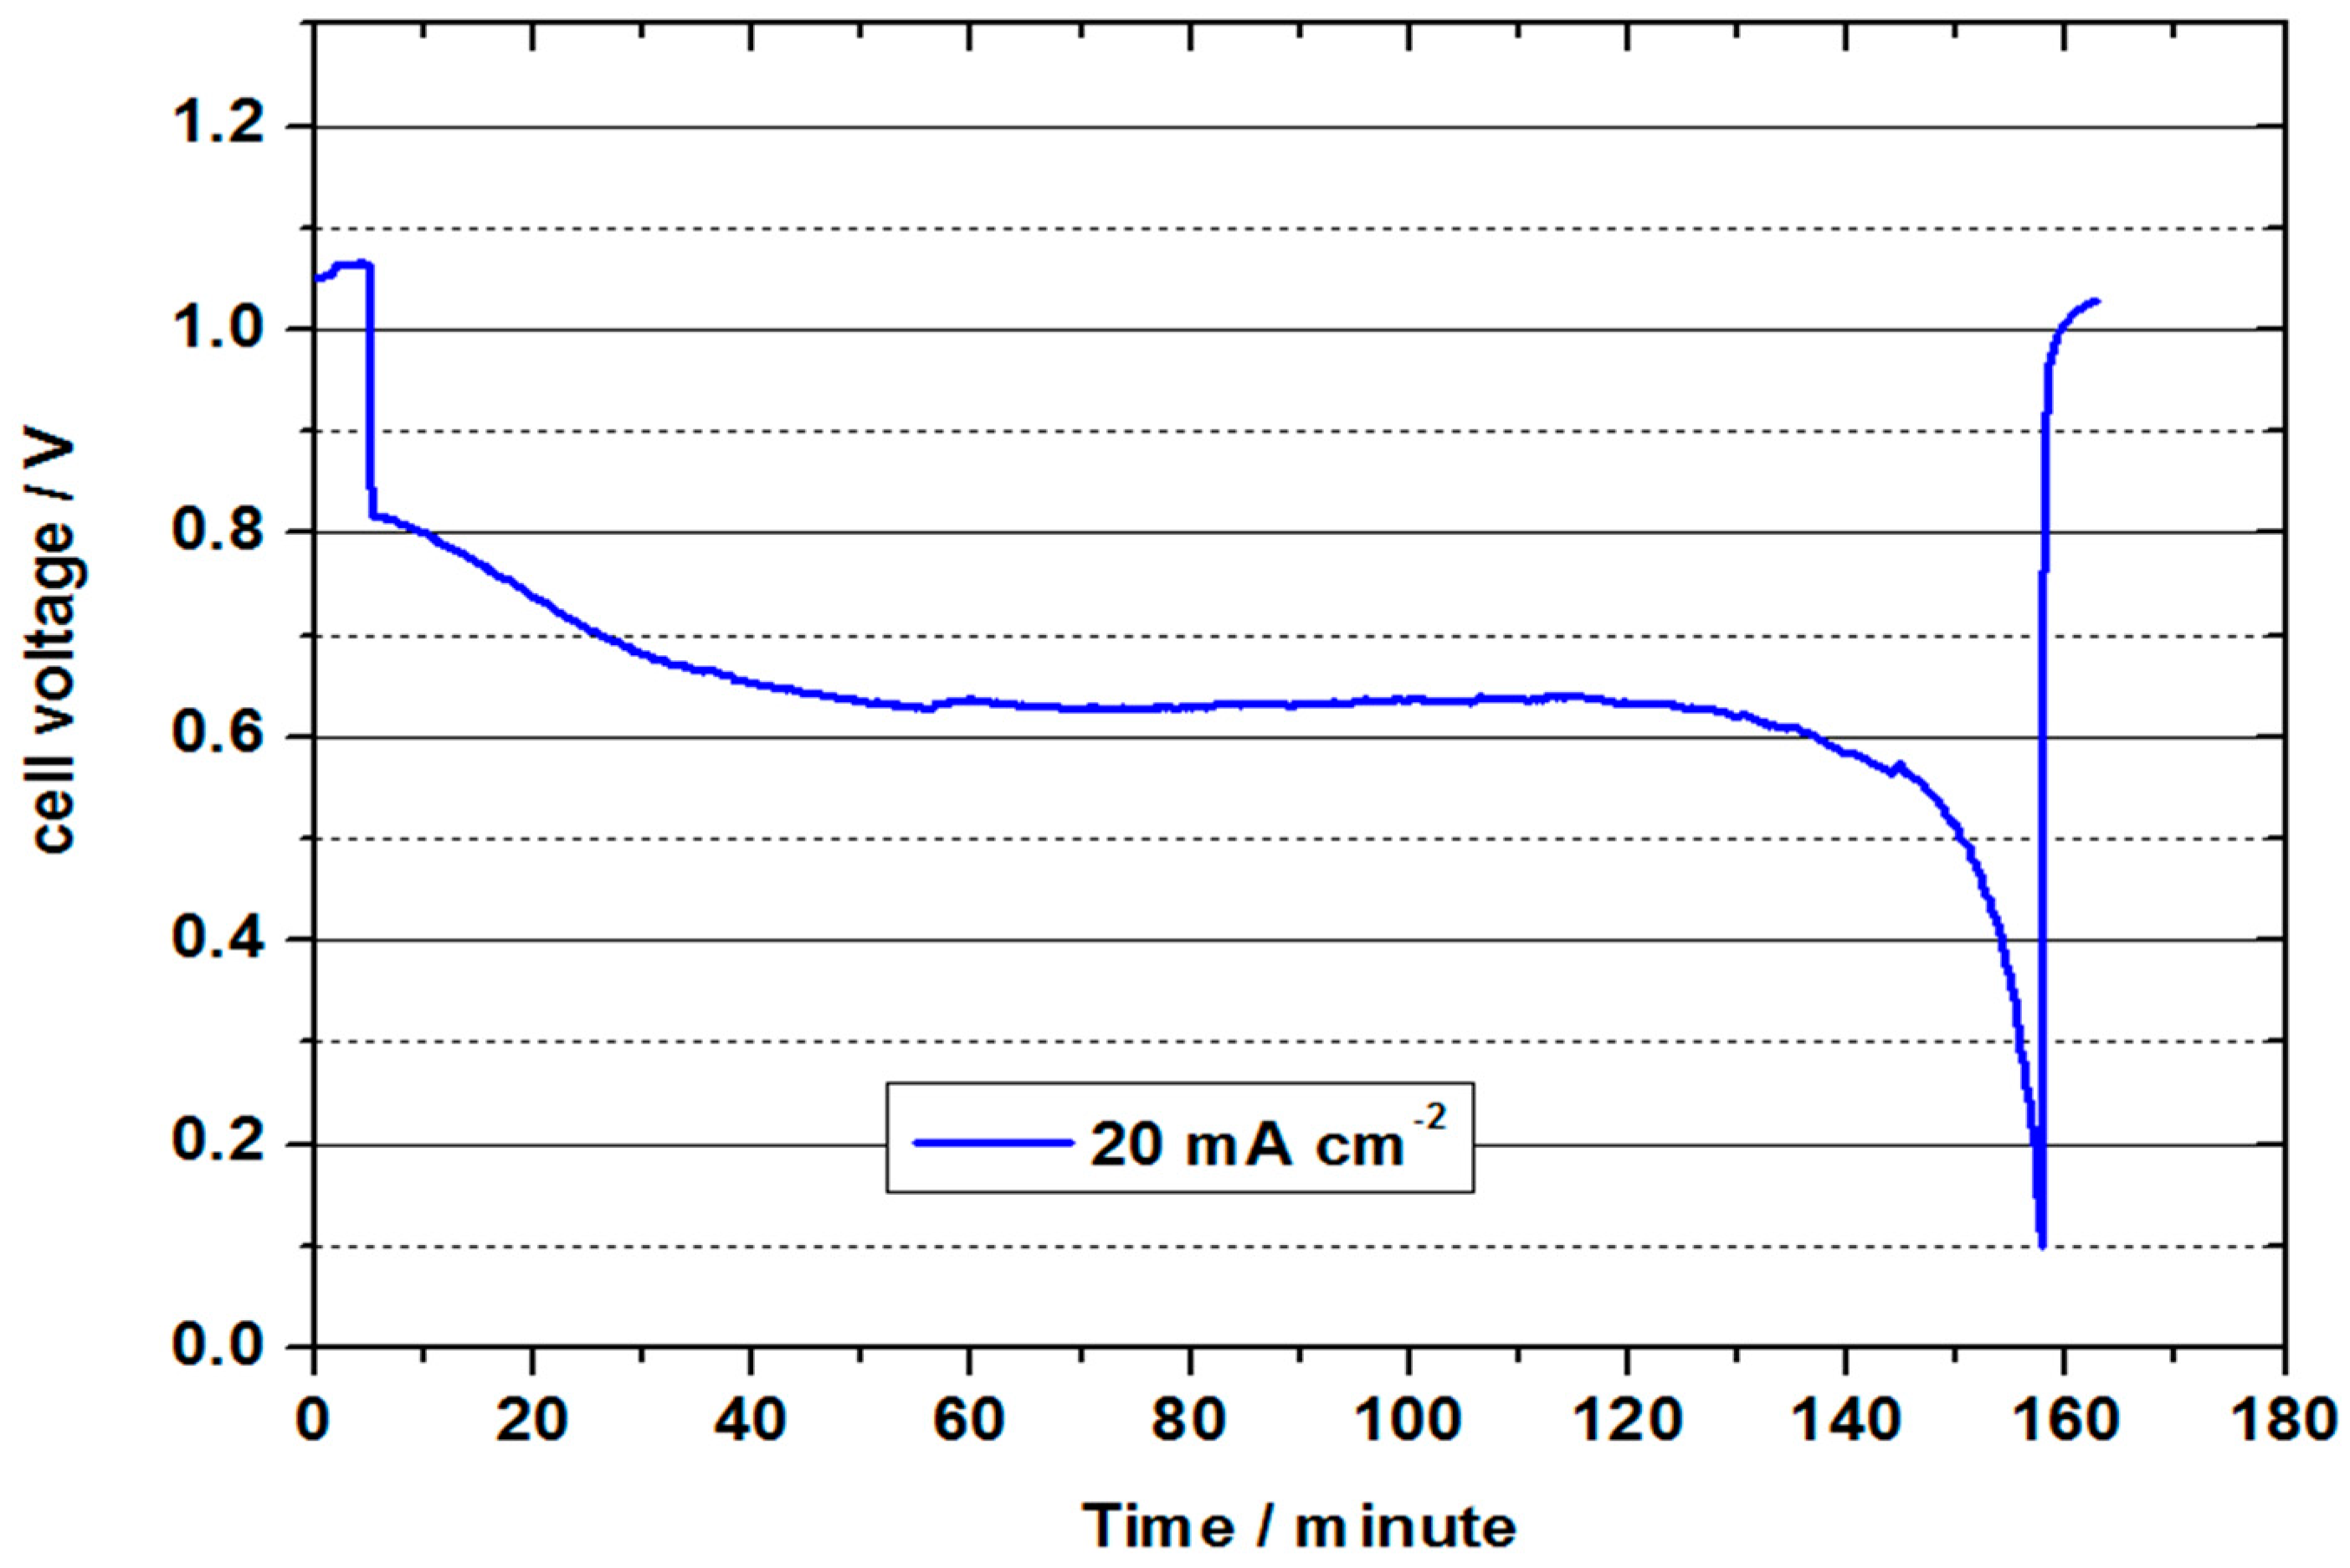
Figure 9 represents the continuous discharge curve at 20 mA cm−2. In this test, the OCV of 1.05 V was again significantly lower than in the previous test, which indicates fragile conditions in the formation of the three-phase boundary layer during the tests. The cell voltage was approx. 0.8 V at the beginning of the discharge test, and was thus slightly below the value of the previous test. It decreased to an average value of 0.64 V in the course of the approx. 153 minute discharge. During this process, 1.53 Ah were converted (21.9 Ah/L). With a value of 23 %, the charge carrier efficiency was thus only half as high as in the test with 2 M V(II) at 50 °C. The converted energy density was only 14 Wh/L, but shows the feasibility of a VOFC with highly concentrated vanadium solutions, especially in connection with the other measurements. Since only one electrolyte tank (half the volume) is used in the VOFC, this is equivalent to using an all-vanadium battery at 7.2 M vanadium concentration, which is around 4.5 times that of VRFB (considering the concentration of 1.5–1.7 M used in commercial VRFBs).
As seen from Table 5, the theoretical energy density values are significantly higher than those obtained for conventional VRFBs. The observed energy density values obtained in the above tests are lower which can be attributed to the non-optimised cell design and factors like vanadium cross over, oxygen diffusion through the membrane, and higher oxygen reduction overpotential. As can be seen from the discharge curve, the mass transport limitation on the oxygen half-cell resulted in a rapid decrease in cell voltage to cut off voltage of 0.1 V. This could be caused by flooding of catalytic sites at the positive half-cell as a result of the formation of water from the oxygen reduction reaction. The recovery of obtained cell voltage close to the OCV value on completion of discharge indicates that the electrolyte is not fully discharged and can explain the low values obtained for capacity and energy density.
The oxygen diffuses through the NAFION® membrane to the negative side of the VOFC resulting in the oxidation of V(II) species affecting the cell performance. Diffusion of vanadium ions through the NAFION® membrane to the positive side was also observed during the discharge tests which would potentially flood the gas diffusion layer on the positive side (ORR) reducing the effective catalytic sites available for oxygen reduction resulting in performance loss. Investigation of parameters like electrolyte and oxygen flow rate, temperature, alternate electrocatalysts for oxygen reduction process is currently underway which may improve the energy density values further. A V(II) regeneration cell is also being designed and fabricated to allow the VOFC to be operated for longer durations in order to investigate the stability of the MEA. To avoid the vanadium cross-over issues, use of alternatives to NAFION® membranes are also under consideration.
2.5. Investigation of Mass Transport Issues
To explain the observed low capacity, experiments were carried out to study the effect of mass transport issues on the VOFC performance. To identify the half-cell with mass transport issues, a reference electrode was added to the negative half-cell to measure the anode potential while overall cell voltage was also measured. The negative half-cell (V2+/V3+) potential value remained nearly constant at ~−0.86 V vs. Hg/Hg2SO4 during a discharge over a period of 10 min, while the cell voltage value reduced over the same time period from 1.03 V to 0.322 V, indicating the mass transport issues were due to ineffective transport of oxygen to the positive electrode [33].
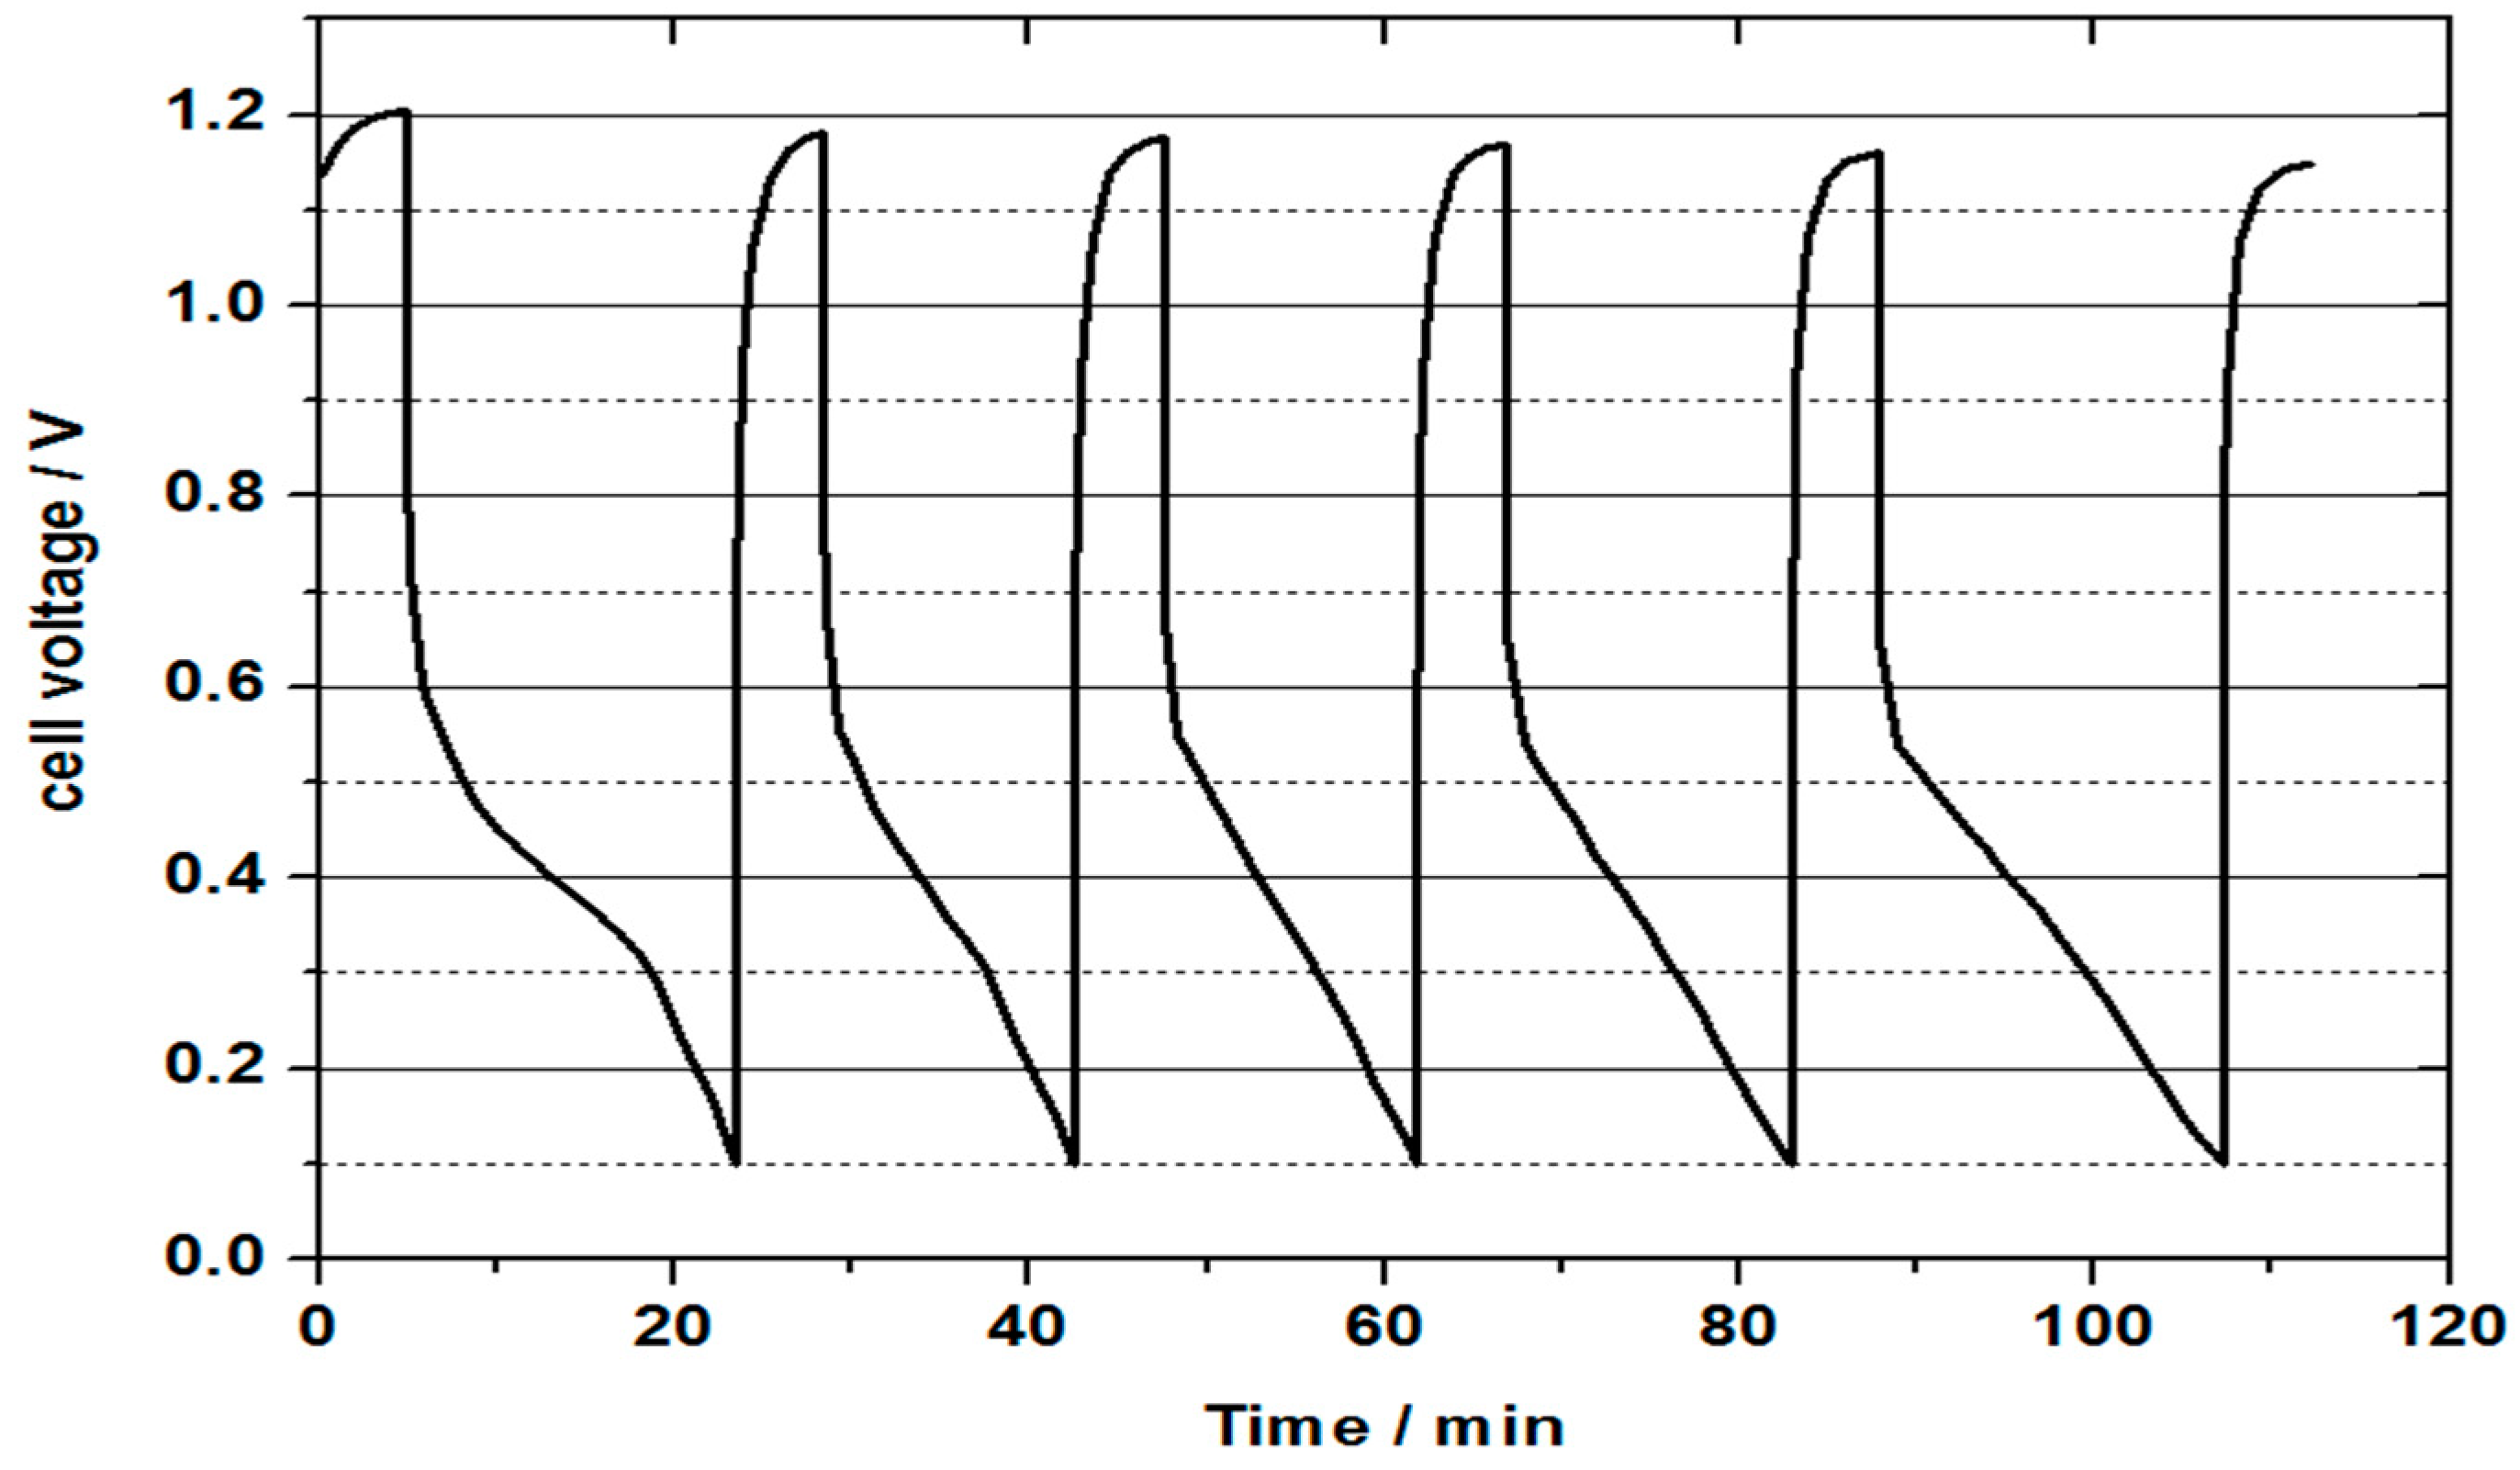
Experimental analysis utilising individual half-cell measurements revealed that the observed low capacity is associated with mass transport problems at the oxygen half-cell of the VOFC. The individual half-cell potential measurements concluded that the mass transport issue is associated with the oxygen reduction reaction. As water is formed at the positive half-cell due to oxygen reduction, it potentially floods the catalyst active sites, preventing the diffusion of oxygen to the catalyst layer. This is confirmed with studies where only 20–25% capacity discharge was observed in single discharge test, and close to full capacity discharge was observed when water was drained from the positive half-cell. To resolve this issue, modifications in the MEA and cell design are necessary for quicker removal of water from the positive half-cell. Cell voltage values after discharge tests were close to the OCV values indicating that the V(II) electrolyte was not fully discharged. To confirm this, successive discharge tests were carried out at a constant current density of 20 mA cm−2 to check the overall discharge time compared to the theoretical value.
Figure 10 represents the continuous discharge curve obtained for a vanadium oxygen fuel cell using 2 M V(II) electrolyte. Heat treated SIGRACELL GFD graphite felt was used as a negative half-cell electrode, while commercial Pt/C (0.4 mg cm−2) coated on wet proofed carbon cloth was used as a positive half-cell catalyst later. The membrane electrode assembly was prepared by hot pressing the commercial catalyst layer on the NAFION® 115 membrane. As can be seen from the discharge curve, the mass transport limitation on oxygen half-cell resulted in a rapid decrease in obtained cell voltage to the cut off voltage of 0.1 V. This could be caused by a loss of reactive oxygen at the cathode, which in turn was caused by too high or too low humidity of the three-phase boundary. Flooding of catalytic sites at the positive half-cell can be a result of the formation of water from the oxygen reduction reaction. This water formation results in a decrease in the diffusion of oxygen through the gas diffusion layer to the positive half-cell catalyst layer. A three-phase boundary layer that is too dry can be created by using dry oxygen, whereby the catalyst dries out and prevents reaction with protons. Both effects are in equilibrium with the diffusion of liquid from the negative half-cell space and a varying formation of water at different current densities together with the used oxygen supply. The mass transport issue can be confirmed by the recovery of the cell voltage to the OCV value after completion of a discharge cycle without intermediate charging of the electrolyte. This recovery of the cell voltage can explain the low capacity value compared to the theoretical capacity. Another potential reason for the observed decreased performance and mass transport issues could be due to the cross-over of vanadium through the membrane to the positive side. The presence of vanadium species was confirmed visually at the positive half-cell. At the end of the first discharge process, the temperature of the water bath of the oxygen humidification was set to 80°C. In the following discharge processes, the water warmed up, providing higher humidification. During the first discharge, a time of 18 min was achieved. The following discharges achieved in 14, 14.3, 16 and 19.1 min. The increase in oxygen humidity occurred during heating of the water bath and led to the better formation of the three-phase boundary layer. This experiment suggests that the catalyst could be too dry rather than too wet, but still more detailed studies are needed to ascertain for certain the cause of the mass transport limitation. According to this finding, cells with a current density lower than 20 mA/cm² could be continuously discharged with high capacities using this cathode.
Figure 11 shows the polarisation plot obtained for vanadium oxygen fuel cell for the calculation of cell resistance. MEA incorporating heat treated SIGRACELL GFD felt was used at negative half-cell while 0.4 mg cm−2 Pt/C coated on wet proofed CeTech carbon cloth was used as positive half-cell catalyst. NAFION® 115 membrane was hot pressed with the positive half-cell catalyst layer. 2 M V(II) solution was used as an electrolyte while pre-heated and pre-saturated oxygen was fed into the positive half-cell. A constant current was applied, and the corresponding voltage was measured. The cell resistance was calculated from the slope value and was found to be 8 Ω cm2. This can be reduced by optimisation of the cell design and gas diffusion pathways.
The cell achieved a maximum current density of 100 mA cm−2 and a maximum power density of 26 mW cm−2 with a current density of 50 mA cm−2.
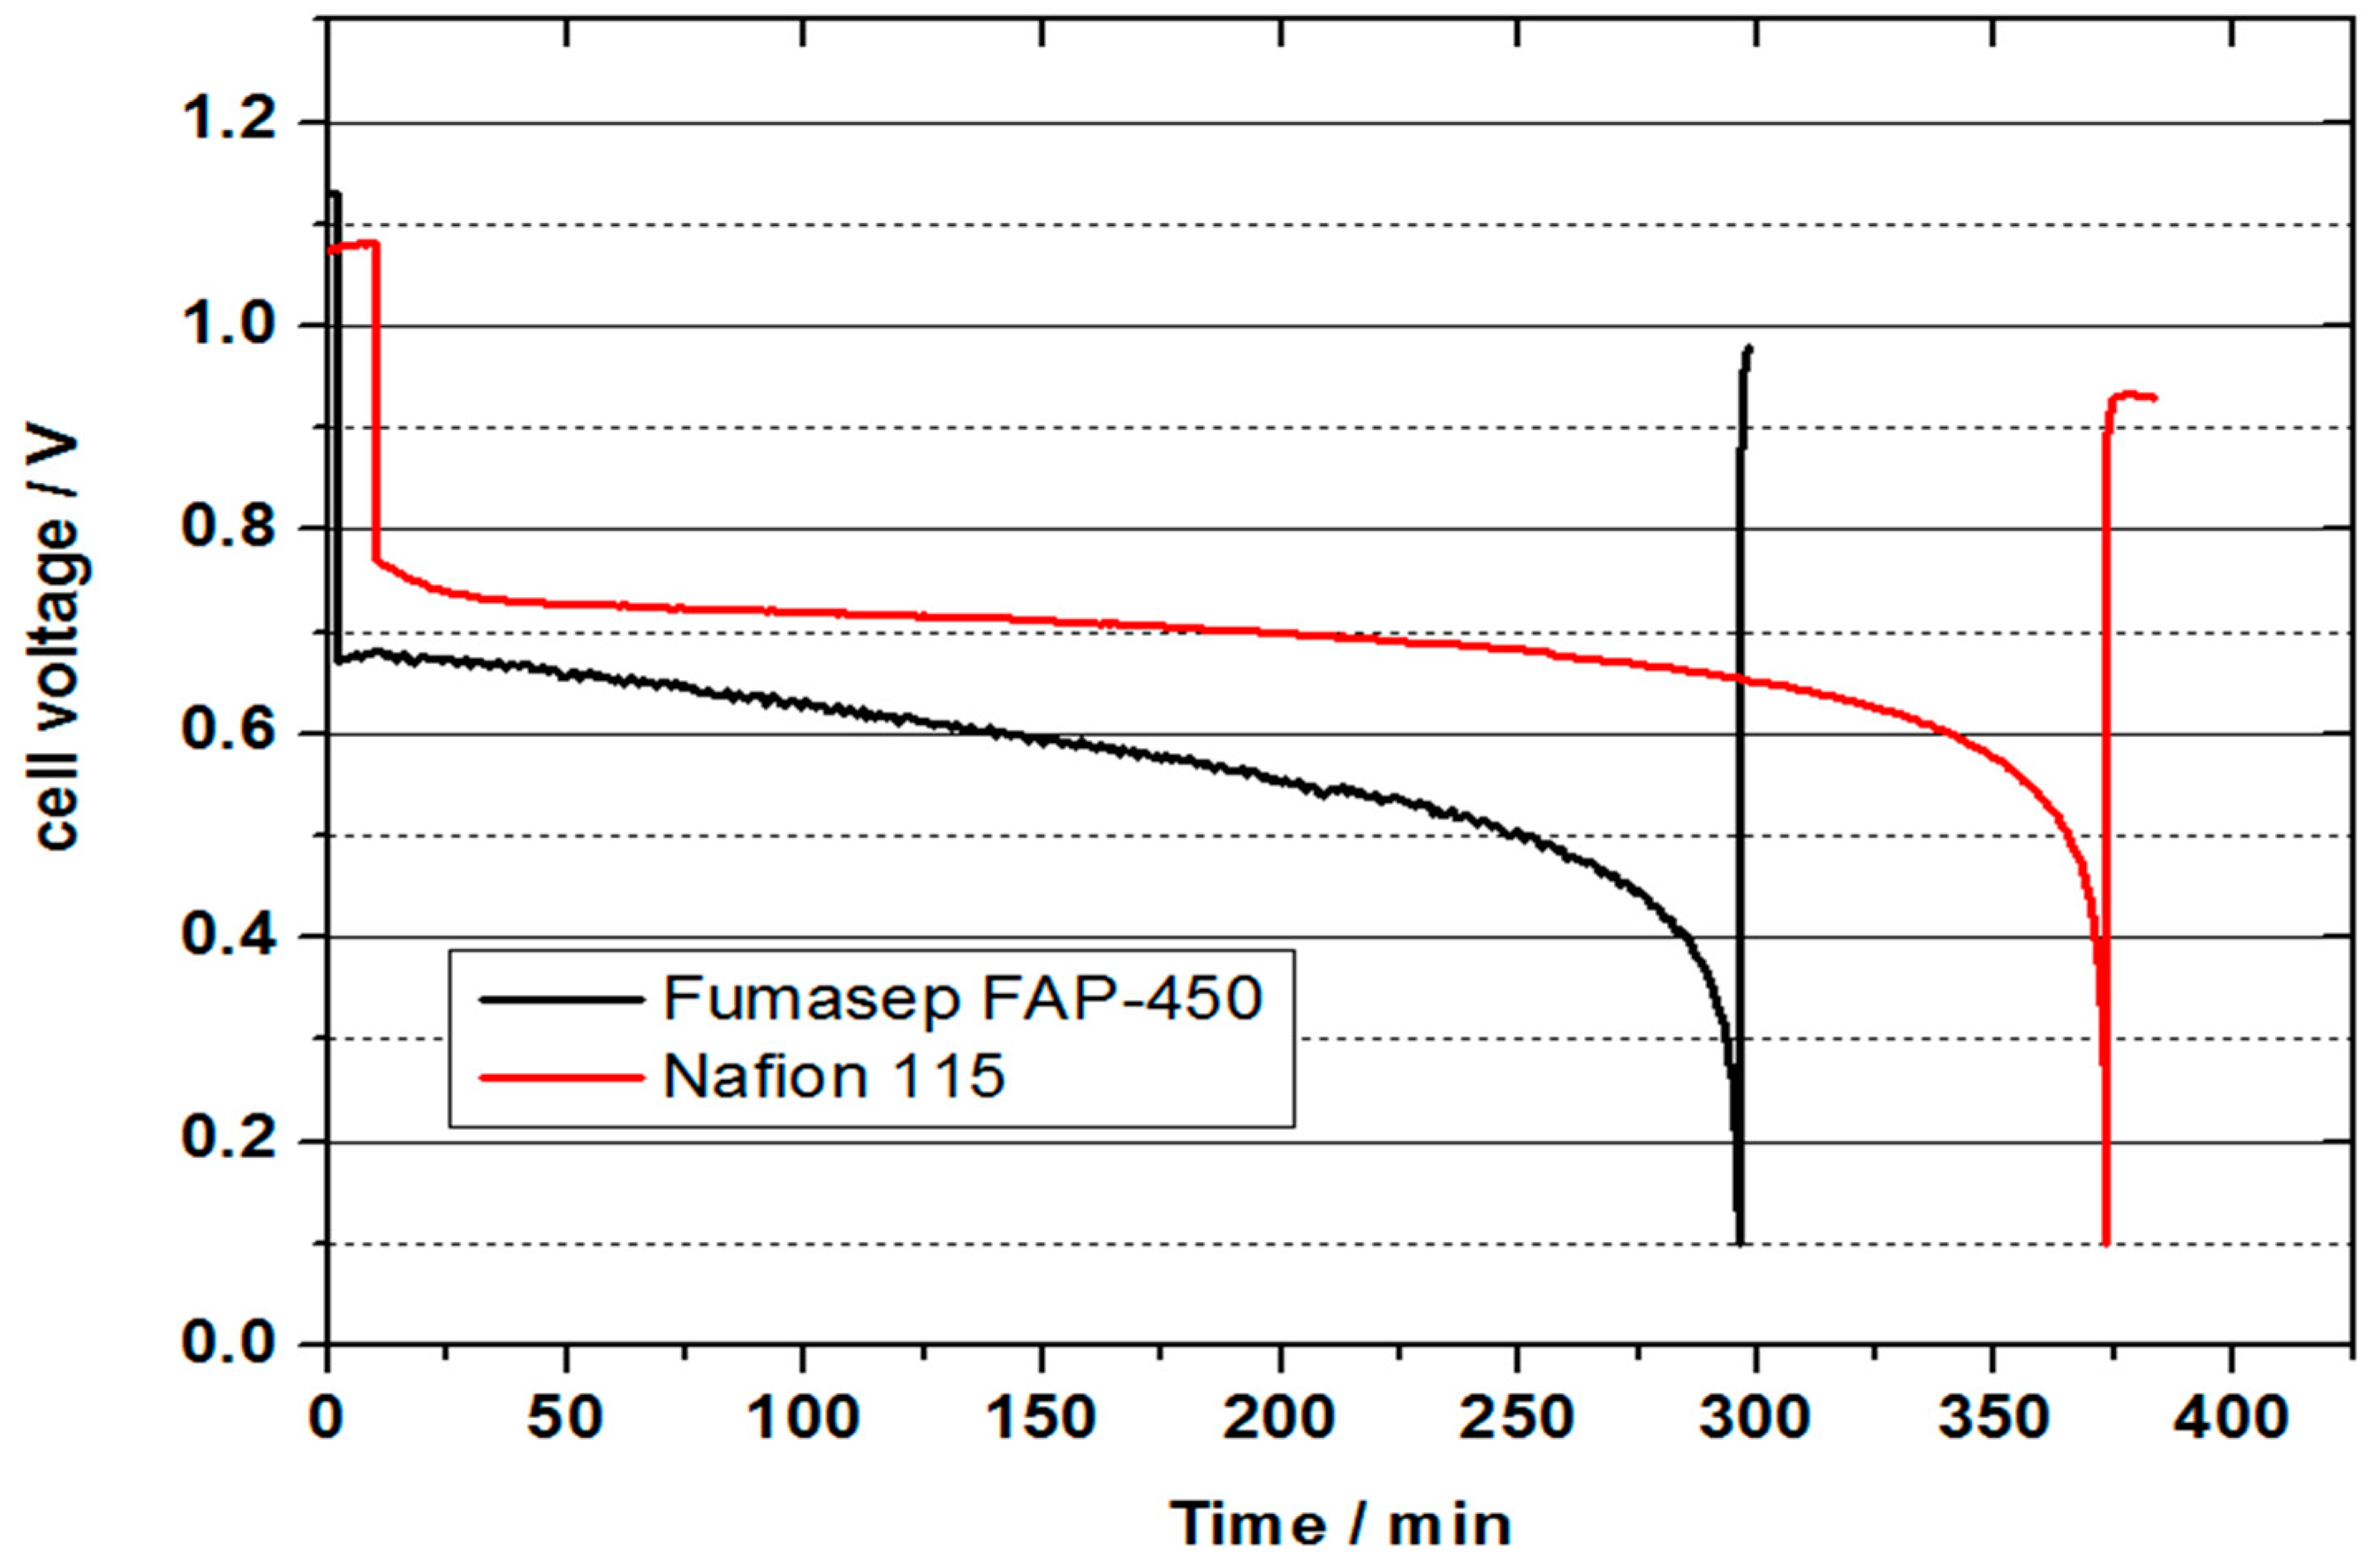
This mass transport issue can potentially be addressed by making the positive half-cell GDL more hydrophobic, thus preventing the flooding of catalytic sites at the positive half-cell. The issue of vanadium cross-over through NAFION® 115 membrane can be potentially addressed by using an anion exchange membrane which will have a characteristically high blocking capacity of vanadium ions, but will still allow protons to pass through the membrane. To check the feasibility of using anion exchange membranes in VOFC, a preliminary VOFC discharge test was carried out using Fumasep FAP-450 anion exchange membrane to study the VOFC performance and relative comparison with NAFION® 115 membrane.
Figure 12 represents the comparison of VOFC performance between NAFION® 115 and Fumasep FAP-450 membrane. While no crossover of vanadium was observed in the preliminary VOFC discharge test with the Fumasep FAP-450 membrane, a future detailed systematic study is needed to address the limiting mass transport aspects. Approximately 80% of the theoretical capacity could be achieved with the NAFION® 115 membrane in this case. By comparison, this is approximately 65% of the theoretical capacity achieved utilising the anion exchange Fumasep FAP-450 membrane. This stresses the need for the increased hydrophobicity of the positive half-cell GDL which can be achieved by PTFE treatment. The obtained cell voltage at a discharge current density of 300 mA is lower for the Fumasep FAP-450 compared to that obtained at NAFION® 115, which can be attributed to higher membrane resistance and potentially a lower proton transfer rate compared to a cation exchange membrane.
3. Materials and Methods
3.1. Electrolyte Preparation
Vanadium trioxide (V2O3) and vanadium pentoxide (V2O5) powders were added to a sulphuric acid solution in equimolar quantities and heated subsequently to generate a required concentration of V(IV) solution by chemical dissolution. On addition of V2O5 powder to a V2O3 suspension, the V(III) ions chemically leach V2O5 by shifting the equilibrium to form more soluble tetravalent V(IV) species [25]. The reaction can be represented as:
V2O3(s) + 6H+ → 2V3+ + 3H2O
V2O5(s) + 2H+ → 2VO2+ +H2O
V3+ + VO2+ → 2VO2+
This resulting V(IV) solution was then electrolyzed to V(II) in a two-compartment electrolysis cell, and the final concentration of V(II) and sulphate was determined using inductively coupled plasma (ICP) analysis. The vanadium electrolyser cell consists of PVC or acrylic based endplates with copper current collector behind graphite frames with serpentine flow channels. Thermally treated (400 °C, 30 h) SIGRACELL® GFD 4.6 EA graphite felts (SGL Carbon GmbH, Meitingen, Germany) were used as electrodes in negative as well as positive half-cells. A pre-treated NAFION® 115 was used as a membrane with SIGRACELL® GFD 4.6 EA graphite felts pressed against the membrane to form a membrane electrode assembly. The pre-treatment of NAFION® was done by heating the membrane in 3% H2O2 solution at 80 °C for 1 hour, followed by heating in DI water at 80 °C for 2 h and finally heating it further in 0.5 M H2SO4 at 80 °C for 1 hour. After pre-treatment, the NAFION® 115 membrane was stored in DI water. To prevent the precipitation of vanadium species at higher concentration, precipitation inhibitors, ammonium sulphate (2 wt.%) and phosphoric acid (1 wt.%) were added to the 3.6 M Vanadium electrolyte solution based on previous work by Roe et al. [25]. To prevent the V(V) formation during the electrolysis process, the volume used in the positive half-cell was twice that of one used in negative half-cell.
3.2. VOFC Cell Assembly
For VOFC testing, a single cell with ~30 cm2 of geometric active area was constructed with serpentine flow channels using a zero-gap design [10]. The VOFC test cell was fabricated using stereo lithographically produced end plates made of acrylic based materials with steel backing plates used for additional mechanical support. Toray carbon paper 120 (fuel cell store, USA) were used in both half-cells to reduce the contact resistance between copper current collectors and serpentine channel machined bipolar plates. On the negative half-cell, a MoO3 modified heat-treated carbon paper (Toray 120, heat-treated at 400 °C, 30 h) was prepared by soaking heat-treated Toray carbon paper 120 in Ammonium molybdate ((NH4)6Mo7O24) solution (3.8 mg mL−1) overnight in an oven at 80 °C for 2 h [13]. The modified carbon paper was then calcined in a bed of carbon black at 650 °C for 2 h. The weight ratio of carbon paper to ammonium molybdate tetrahydrate at 4:1 This MoO3 modified Toray carbon paper used as catalyst layer in negative half-cell, while on the positive side, commercial Pt on Vulcan carbon (0.4 mg cm−2) coated on carbon cloth (Fuel cell store, USA) was used as a combined catalyst layer gas diffusion layer. A pre-treated NAFION® 115 membrane (DuPont, Fuel cell store, Freeport, Texas, USA) (method described in Section 3.1) was utilised to prepare membrane electrode assembly (MEA).
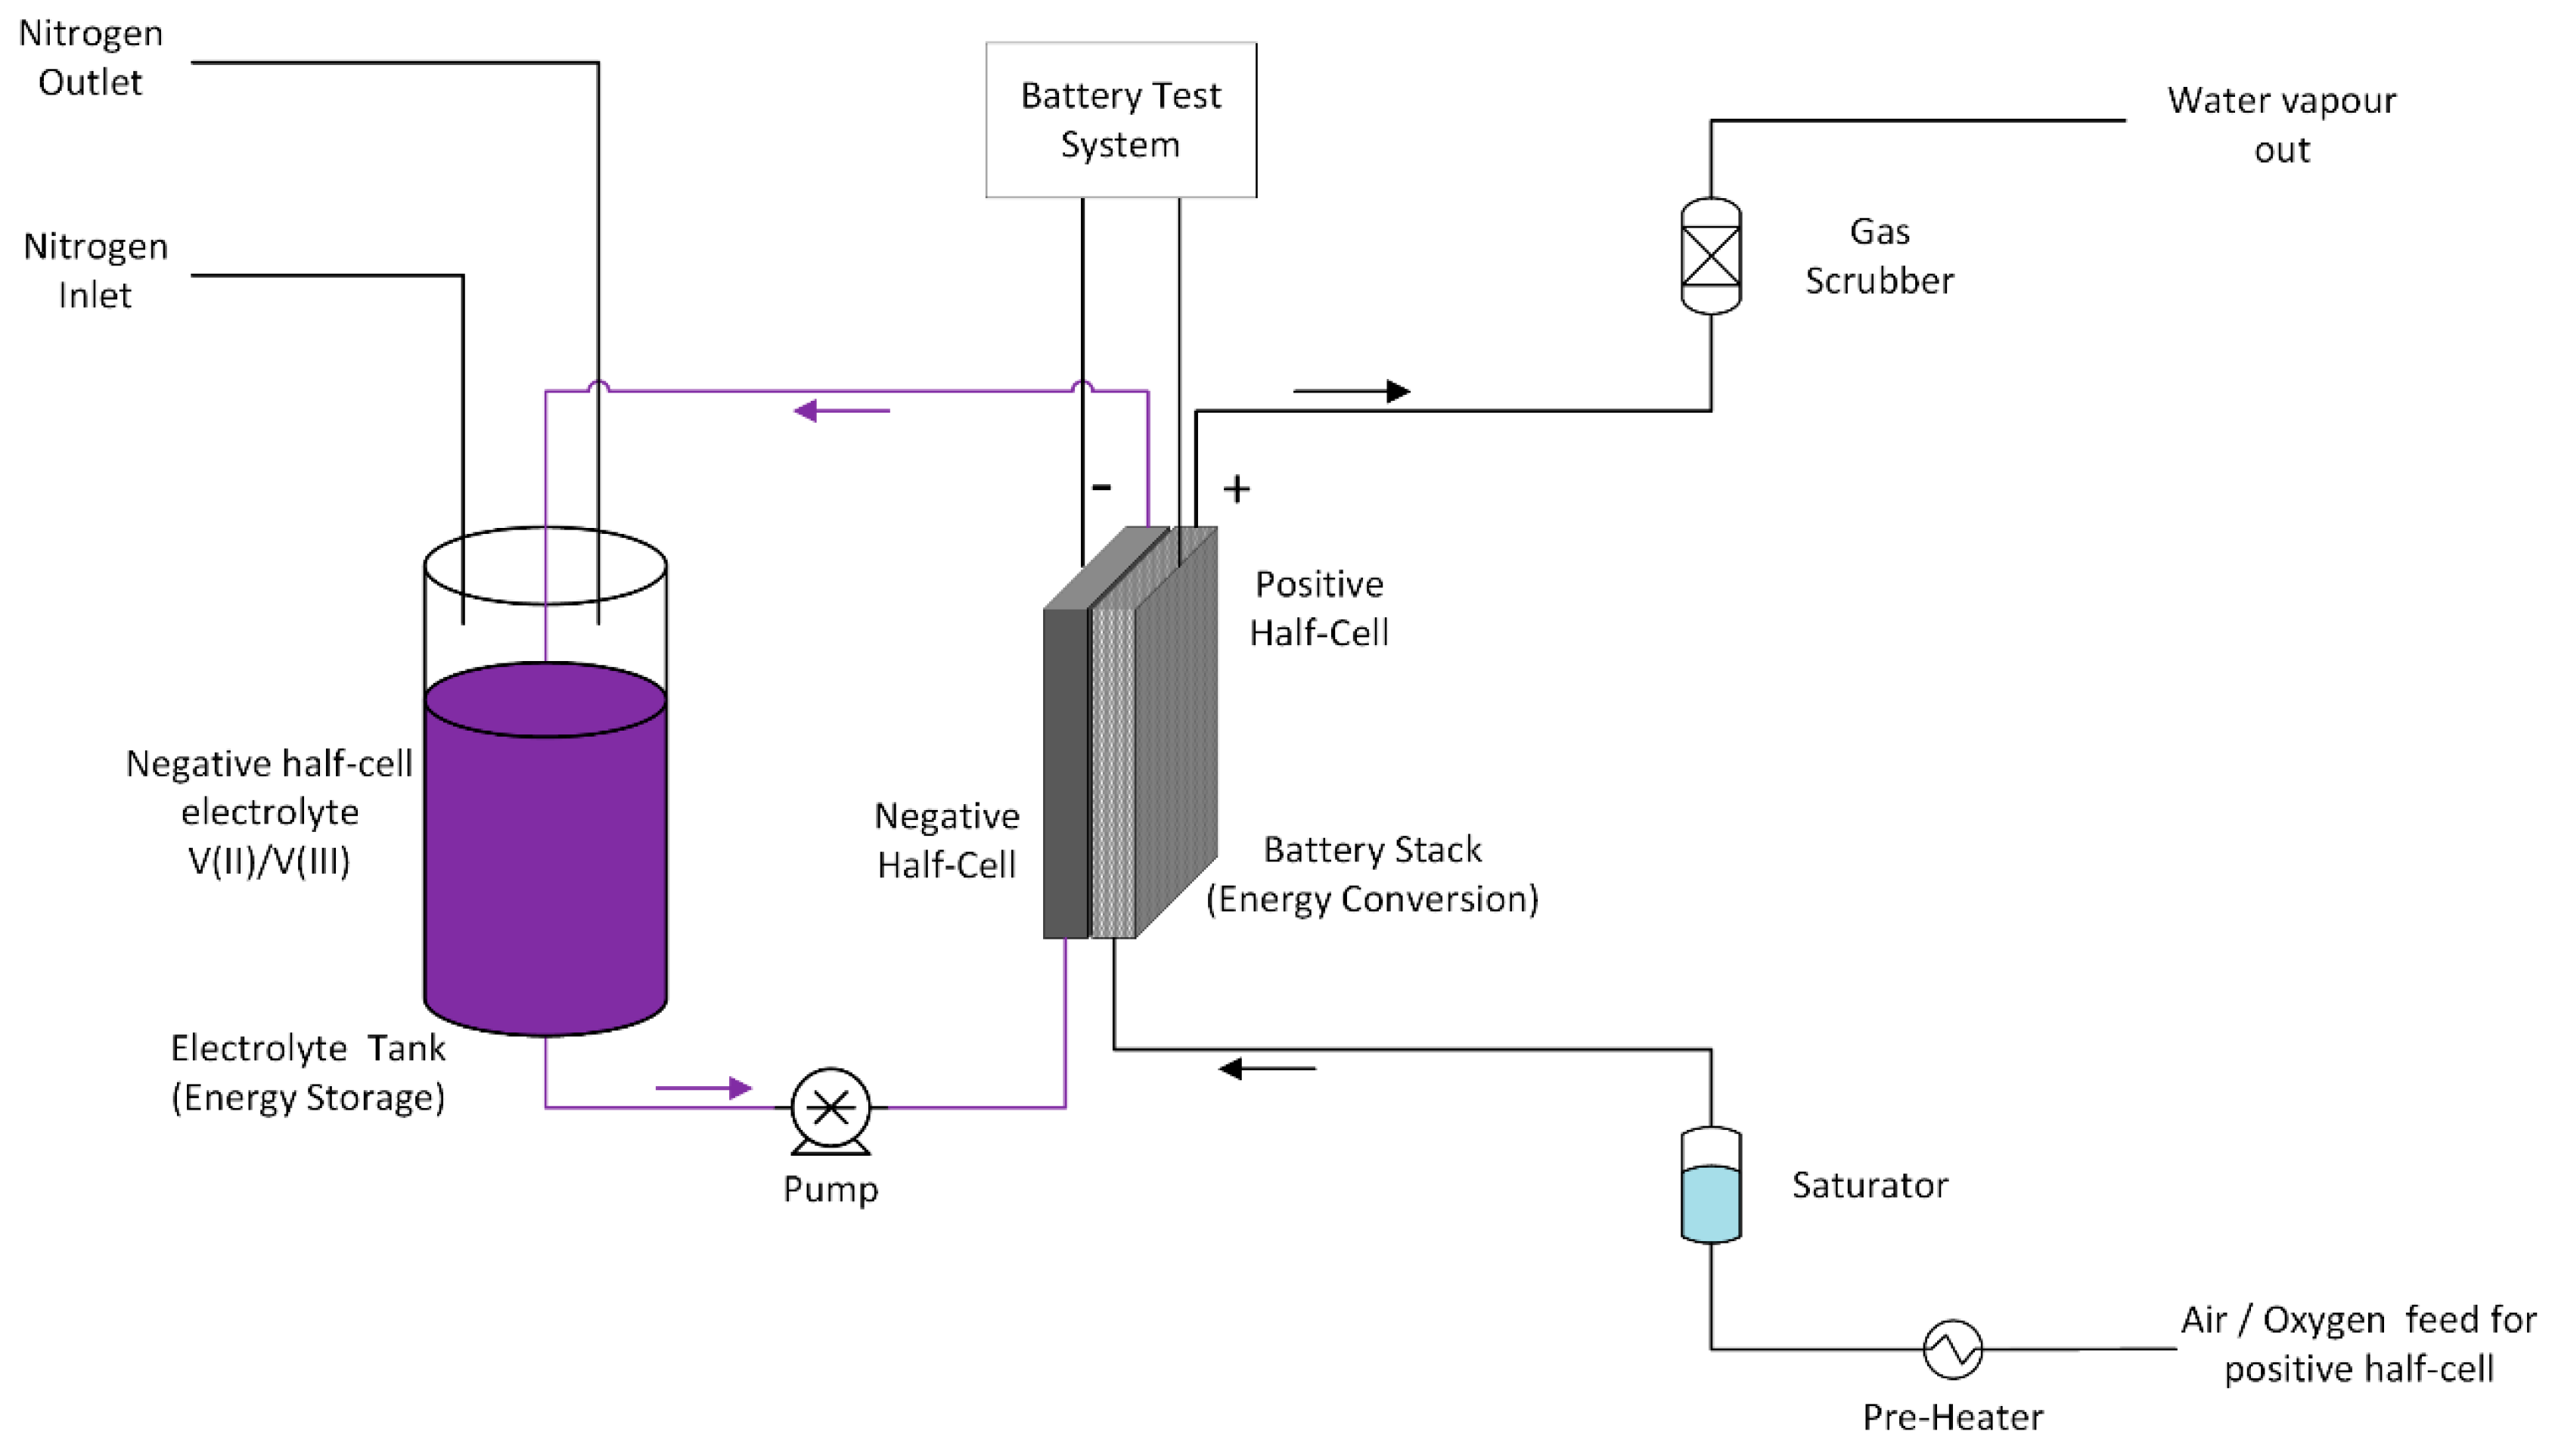
The negative half-cell consisted of a stereo lithographically produced acrylic based flow frame with inlet and outlet channels for the V(II) electrolyte. In addition, various flat gaskets were used for the sealing of the cell. The V(II) electrolyte was pumped into the negative half-cell using a diaphragm pump at a flow rate of 50 mL/min and the gas feed to the positive half-cell was pre-heated and water pre-saturated pure oxygen gas at a flow rate of 100 mL/min. A water column was used to provide oxygen back pressure in the system to improve mass transport of oxygen to the gas diffusion electrode. The VOFC tests were carried out using a battery test system (CDS, Repower, Shenzhen, China). The schematic of proto-type VOFC and its test set up is presented in Figure 13 and Figure 14.
3.3. VOFC Performance Measurement
Different MEAs were used to investigate the behaviour of different cathode materials. Commercial MEAs consisted of a composite of a membrane (NAFION® 115) and a catalyst-coated GDL (Pt/C with different loadings coated on CeTech wet proofed carbon cloth) (Fuel cell store, USA). The GDL was only on one side, and MEAs with 4 mg cm−2 Pt or 0.4 mg cm−2 were used. Furthermore, own MEAs were produced and characterised in the cell. The description of the fabrication can be found in the next section. The performance of different VOFCs was measured at different temperatures by recording the OCV for 2 min following an application of different current densities (polarisation curve) for 5 min and calculating the mean cell voltage, power density and area specific resistance under load for comparison [34]. Full discharge tests were carried out for 2 M and 3.6 M Vanadium solutions and the energy density values calculated. A battery test system (CDS, Repower, Shenzhen, China) was used for these measurements.
3.4. UNSW MEA Preparation
Positive half-cell:
Carbon paper (Toray 120, Fuel cell store, USA), SIGRACELL® GFD 4.6 EA graphite felts (SGL Carbon GmbH, Meitingen, Germany), wet proofed CeTech carbon cloth (Fuel cell store, College Station, Texas, USA), Iron phthalocyanine (Sigma Aldrich, Sydney, Australia), NAFION® 115 (Fuel cell store, USA), Ammonium molybdate tetrahydrate (Sigma Aldrich, Australia), MoS2 (Sigma Aldrich, Sydney, Australia) were purchased and used in these tests without further modification. The heat-treated graphite felt, and carbon paper samples were prepared using the heat treatment in Labec high-temperature furnace at 400 °C for 30 h in air.
The catalyst powders (e.g., Vulcan XC-72 powder) was weighed and dispersed in isopropanol solvent along with 5% NAFION® perfluorinated resin solution as a binder (Sigma Aldrich, Sydney, Australia). The mixture was ultrasonicated to ensure uniform mixing, and then applied to the membrane using a painting brush. The solvent was allowed to evaporate, and the MEA was hot pressed using a Carver bench top standard hot press (Model 4386) under various temperature conditions. The VB1 membranes were photographed before and after the tests as well as their dimensions measured to check any dimension and appearance changes (swelling/shrinkage) during the MEA preparation and bonding.
In order to test the various electrode materials for negative and positive half cells, the catalyst materials were suspended in a mixture of isopropanol and 5% NAFION® solution (used as a binder). The suspension was ultra-sonicated to facilitate uniform mixing and then spray coated repeatedly on the carbon paper or carbon cloth GDLs to obtain a uniform coating.
Negative half-cell:
MoO3 modified carbon paper electrodes developed at UNSW have shown promise for high power density VRFB applications [13]. The modification with MoO3 was attained by soaking pretreated carbon paper in 3.8 mg mL−1 ammonium molybdate solution with the weight ratio of carbon paper to ammonium molybdate tetrahydrate maintained at 4:1. The carbon paper was then initially dried at 80 °C for 2 h followed by calcination in the bed of carbon black at 650 °C for 2 h.
For the VOFC test work, membrane electrode assemblies were prepared using pre-treated NAFION® 115 membranes with MoO3 modified carbon paper electrodes as negative half-cell catalyst, while several other potential ORR catalysts were used for positive half-cell.
3.5. VOFC with High Concentration Vanadium Electrolyte
A high concentration vanadium electrolyte was prepared in a similar manner to that of V(II) solution preparation method described in Section 3.1. Precipitation inhibitors involving 2% ammonium sulphate and 1% phosphoric acid were added during the preparation of vanadium electrolyte to prevent the precipitation of pentavalent vanadium in the supersaturated electrolytes. Also, a higher concentration of sulphuric acid was used (7–8 M) to facilitate the dissolution of vanadium powders. The resulting high concentration vanadium electrolyte was tested in a VOFC cell at 50 °C.
4. Conclusions
A series of single-cell bench top vanadium oxygen fuel cells have been designed and fabricated to test the feasibility of high concentration vanadium electrolytes in the VOFC. The performance of the VOFC was evaluated using 2 M vanadium electrolyte as well as preliminary trials with 3.6 M vanadium electrolyte. Optimisation of the VOFC for use with high concentration vanadium electrolytes can potentially result in significant improvement in energy density compared to VRFBs. The observed low energy density and capacity values can be attributed to mass transport limitations at the oxygen half-cell. Factors like vanadium cross-over through the NAFION® membrane to the positive half-cell, potential flooding of catalytic sites due to water formed from oxygen reduction, and areas of non-uniform hydration resulting in reactive areas that may be too dry, limit the supply of oxygen to the catalytic sites resulting in mass transport issues. The VOFC performance is also affected by the diffusion of oxygen through the membrane resulting in V(II) oxidation at the negative half-cell. The VOFC system will be further developed in future work to optimise of the electrolyte flow rate, oxygen flow rate and operating temperature. Future optimisation of the VOFC to address the issues highlighted in this study will be focused on approaching the theoretical energy density of 144 Wh/L.
Author Contributions
Conceptualisation, C.M. and M.S.-K.; investigation, M.R.; writing—original draft preparation, M.R.; writing—review and editing, C.M., M.S.-K., J.N.; supervision, C.M., M.S.-K., project administration, C.M., M.S.-K.; funding acquisition, C.M., M.S.-K.
Funding
This research was funded by the Office of Naval Research Global through the Naval International Cooperative Opportunities in Science and Technology Program (NICOP).
Conflicts of Interest
The authors would like to declare the professional relationship with guest editor Prof. Maria Skyllas-Kazacos who is also co-author for this manuscript.
References
- Sum, E.; Rychcik, M.; Skyllas-Kazacos, M. Investigation of the V(V)/V(IV) system for use in the positive half-cell of a redox battery. J. Power Sources 1985, 16, 85. [Google Scholar] [CrossRef]
- Sum, E.; Skyllas-Kazacos, M. A study of the V(II)/V(III) redox couple for redox flow cell applications. J. Power Sources 1985, 15, 179. [Google Scholar] [CrossRef]
- Taller, L.H. Redox Battery. U.S. Patent 3996064, 7 December 1976. [Google Scholar]
- Li, L.; Kim, S.; Wang, W.; Vijayakumar, M.; Nie, Z.; Chen, B.; Zhang, J.; Xia, G.; Hu, J.; Graff, G.; et al. A stable vanadium redox-flow battery with high energy density for large-scale energy storage. Adv. Energy Mater. 2011, 1, 394–400. [Google Scholar] [CrossRef]
- Skyllas-Kazacos, M.; Peng, C.; Cheng, M. Evaluation of precipitation inhibitors for supersaturated vanadyl electrolytes for the vanadium redox battery. Electrochem. Solid-State Lett. 1999, 2, 121. [Google Scholar] [CrossRef]
- Kaneko, H.; Negishi, A.; Nozaki, K.; Sato, K.; Nakajima, M. Redox Battery. U.S. Patent 5318865, 7 June 1994. [Google Scholar]
- Menictas, C.; Skyllas-Kazacos, M. Performance of vanadium-oxygen redox fuel cell. J. Appl. Electrochem. 2011, 41, 1223. [Google Scholar] [CrossRef]
- Noack, J.; Cremers, C.; Pinkwart, K.; Tuebke, J. Air-breathing vanadium/oxygen fuel cell. In Proceedings of the 218th ECS Meeting, Las Vegas, NV, USA, 10–15 October 2010. [Google Scholar]
- Hosseiny, S.; Saakes, M.; Wessling, M. A polyelectrolyte membrane-based vanadium/air redox flow battery. Electrochem. Commun. 2010, 13, 751. [Google Scholar] [CrossRef]
- Hosseiny, S.S. Vanadium/Air Redox Flow Battery; Universiteit Twente: Enschede, The Netherlands, 2011. [Google Scholar]
- Parasuraman, A.; Lim, T.M.; Menictas, C.; Skyllas-Kazacos, M. Review of material research and development for vanadium redox flow applications. Electrochim. Acta 2013, 101, 27–40. [Google Scholar] [CrossRef]
- Wang, W.; Luo, Q.; Li, B.; Wei, X.; Li, L.; Yang, Z. Recent Progress in Redox Flow Battery Research and Development. Adv. Funct. Mater. 2013, 23, 970–986. [Google Scholar] [CrossRef]
- Cao, L.; Skyllas-Kazacos, M.; Wang, D.-W. Electrode modification and electrocatalysis for redox flow battery (RFB) applications. Energy Storage Sci. Technol. 2015, 4, 433–457. [Google Scholar]
- Kim, K.J.; Park, M.-S.; Kim, Y.-J.; Kim, J.H.; Dou, S.X.; Skyllas-Kazacos, M. A technology review of electrodes and reaction mechanisms in vanadium redox flow batteries. J. Mater. Chem. A 2015, 3, 16913–16933. [Google Scholar] [CrossRef]
- Park, M.; Ryu, J.; Cho, J. Nanostructured Electrocatalysts for All-Vanadium Redox Flow Batteries. Chem. Asian J. 2015, 10, 2096–2110. [Google Scholar] [CrossRef] [PubMed]
- Sun, B.; Skyllas-Kazacos, M. Modification of graphite electrode materials for vanadium redox flow battery application—I. Thermal treatment. Electrochim. Acta 1991, 37, 1253–1260. [Google Scholar] [CrossRef]
- Sun, B.; Skyllas-Kazacos, M. Chemical modification of graphite electrode materials for vanadium redox flow battery application—Part II. Acid treatments. Electrochim. Acta 1992, 37, 2459–2465. [Google Scholar] [CrossRef]
- Shen, Y.; Xu, H.; Xu, P.; Wu, X.; Dong, Y.; Lu, L. Electrochemical catalytic activity of tungsten trioxide- modified graphite felt toward VO2+/VO2+ redox reaction. Electrochim. Acta 2014, 132, 37–41. [Google Scholar] [CrossRef]
- Li, B.; Gu, M.; Nie, Z.; Wei, X.; Wang, C.; Sprenkle, V.; Wang, W. Nanorod Niobium Oxide as Powerful Catalysts for an All Vanadium Redox Flow Battery. Nano Lett. 2014, 14, 158–165. [Google Scholar] [CrossRef] [PubMed]
- Tseng, T.-M.; Huang, R.-H.; Huang, C.-Y.; Liu, C.-C.; Hsueh, K.-L.; Shieu, F.-S. Carbon Felt Coated with Titanium Dioxide/Carbon Black Composite as Negative Electrode for Vanadium Redox Flow Battery. J. Electrochem. Soc. 2014, 161, A1132–A1138. [Google Scholar] [CrossRef]
- Zhou, H.; Xi, J.; Li, Z.; Zhang, Z.; Yu, L.; Liu, L.; Qiu, X.; Chen, L. CeO2 decorated graphite felt as a high-performance electrode for vanadium redox flow batteries. RSC Adv. 2014, 4, 61912–61918. [Google Scholar] [CrossRef]
- Zhou, H.; Shen, Y.; Xi, J.; Qiu, X.; Chen, L. Insights into the Impact of the Nafion Membrane Pretreatment Process on Vanadium Flow Battery Performance. ACS Appl. Mater. Interfaces 2016, 8, 15369–15378. [Google Scholar] [CrossRef]
- Shen, J.; Liu, S.; He, Z.; Shi, L. Influence of antimony ions in negative electrolyte on the electrochemical performance of vanadium redox flow batteries. Electrochim. Acta 2015, 151, 297–305. [Google Scholar] [CrossRef]
- Suarez, D.J.; Gonzales, Z.; Blanco, C.; Granda, M.; Menendez, R.; Santamaria, R. Graphite felt modified with Bismuth nanoparticles as negative electrode in a vanadium redox flow battery. ChemSusChem 2014, 7, 914–918. [Google Scholar] [CrossRef]
- Hosseini, M.G.; Mousavihashemi, S.; Murcia-Lopez, S.; Flox, C.; Andreu, T.; Morante, J.R. High power positive electrode based on synergistic effect of N- and WO3 -decorated carbon felt for vanadium redox flow batteries. Carbon 2018, 136, 444–453. [Google Scholar] [CrossRef]
- Mousavihashemi, S.; Murcia-Lopez, S.; Hosseini, M.G.; Morante, J.R.; Flox, C. Towards production of a highly catalytic and stable graphene wrapped graphite felt electrode for vanadium redox flow batteries. Batteries 2018, 4, 63. [Google Scholar] [CrossRef]
- Wei, L.; Zhao, T.S.; Zeng, L.; Zeng, Y.K.; Jiang, H.R. Highly catalytic and stabilized titanium nitride nanowire array decorated graphite felt electrodes for all-vanadium redox flow batteries. J. Power Sources 2017, 341, 318–326. [Google Scholar] [CrossRef]
- Skyllas-Kazacos, M. High Energy Density Vanadium Electrolyte Solutions, Methods of Preparation Thereof and All-Vanadium Redox Cells and Batteries Containing High Energy Density Vanadium Electrolyte Solutions. U.S. Patent 7078123, 3 May 1996. [Google Scholar]
- Roe, S.; Menictas, C.; Skyllas-Kazacos, M. A high energy density Vanadium Redox Flow Battery with 3 M vanadium electrolyte. J. Electrochem. Soc. 2016, 163, A5023–A5028. [Google Scholar] [CrossRef]
- Rowley-Neale, S.J.; Fearn, J.M.; Brownson, D.A.C.; Smith, G.C.; Ji, X.; Banks, C.E. 2D molybdenum disulphide (2D-MoS2) modified electrodes explored towards the oxygen reduction reaction. Nanoscale 2016, 8, 14767–14777. [Google Scholar] [CrossRef] [PubMed]
- Baranton, S.; Coutanceau, C.; Roux, C.; Hahn, F.; Leger, J.-M. Oxygen reduction reaction in acid medium at iron phthalocyanine dispersed on high surface area carbon substrate: tolerance to methanol, stability and kinetics. J. Electroanal. Chem. 2005, 577, 223–234. [Google Scholar] [CrossRef]
- Wang, X.L.; Zhang, H.M.; Zhang, J.L.; Xu, H.F.; Tian, Z.Q.; Chen, J.; Zhong, H.X.; Liang, Y.M.; Yi, B.L. Micro-porous layer with composite carbon black for PEM fuel cells. Electrochim. Acta 2006, 51, 4909–4915. [Google Scholar] [CrossRef]
- Vielstich, W.; Lamm, A.; Gasteiger, H. Handbook of Fuel Cells; John Wiley & Sons: Hoboken, NJ, USA, 2010. [Google Scholar]
- Noack, J.; Cognard, G.; Oral, M.; Küttinger, M.; Roznyatovskaya, N.; Pinkwart, K.; Tübke, J. Study of the long-term operation of a vanadium/oxygen fuel cell. J. Power Sources 2016, 326, 137–145. [Google Scholar] [CrossRef]
Figure 1.
Schematic diagram of vanadium redox flow battery (VRFB).

Figure 2.
Schematic diagram of a vanadium oxygen fuel cell (VOFC) system.

Figure 3.
Effect of oxygen flow on vanadium oxygen fuel cell (VOFC) performance using a commercial Pt/C MEA (4 mg cm−2 Pt, 5 mA cm−2, 2 M V(II), 5 M H2SO4, 25 °C).
Figure 3.
Effect of oxygen flow on vanadium oxygen fuel cell (VOFC) performance using a commercial Pt/C MEA (4 mg cm−2 Pt, 5 mA cm−2, 2 M V(II), 5 M H2SO4, 25 °C).

Figure 4.
Polarisation curves obtained for vanadium oxygen fuel cells (VOFC) using 2 M, 2.4 M and 3 M V(II) solutions and commercial MEAs (4 mg cm−2 Pt, 5 M H2SO4, 25 °C).
Figure 4.
Polarisation curves obtained for vanadium oxygen fuel cells (VOFC) using 2 M, 2.4 M and 3 M V(II) solutions and commercial MEAs (4 mg cm−2 Pt, 5 M H2SO4, 25 °C).

Figure 5.
Cell voltage of a vanadium oxygen fuel cell (VOFC) at 60 °C with 2 M V(II) solution using commercial Pt/C MEA at various current densities (4 mg cm−2 Pt, 5 M H2SO4).
Figure 5.
Cell voltage of a vanadium oxygen fuel cell (VOFC) at 60 °C with 2 M V(II) solution using commercial Pt/C MEA at various current densities (4 mg cm−2 Pt, 5 M H2SO4).

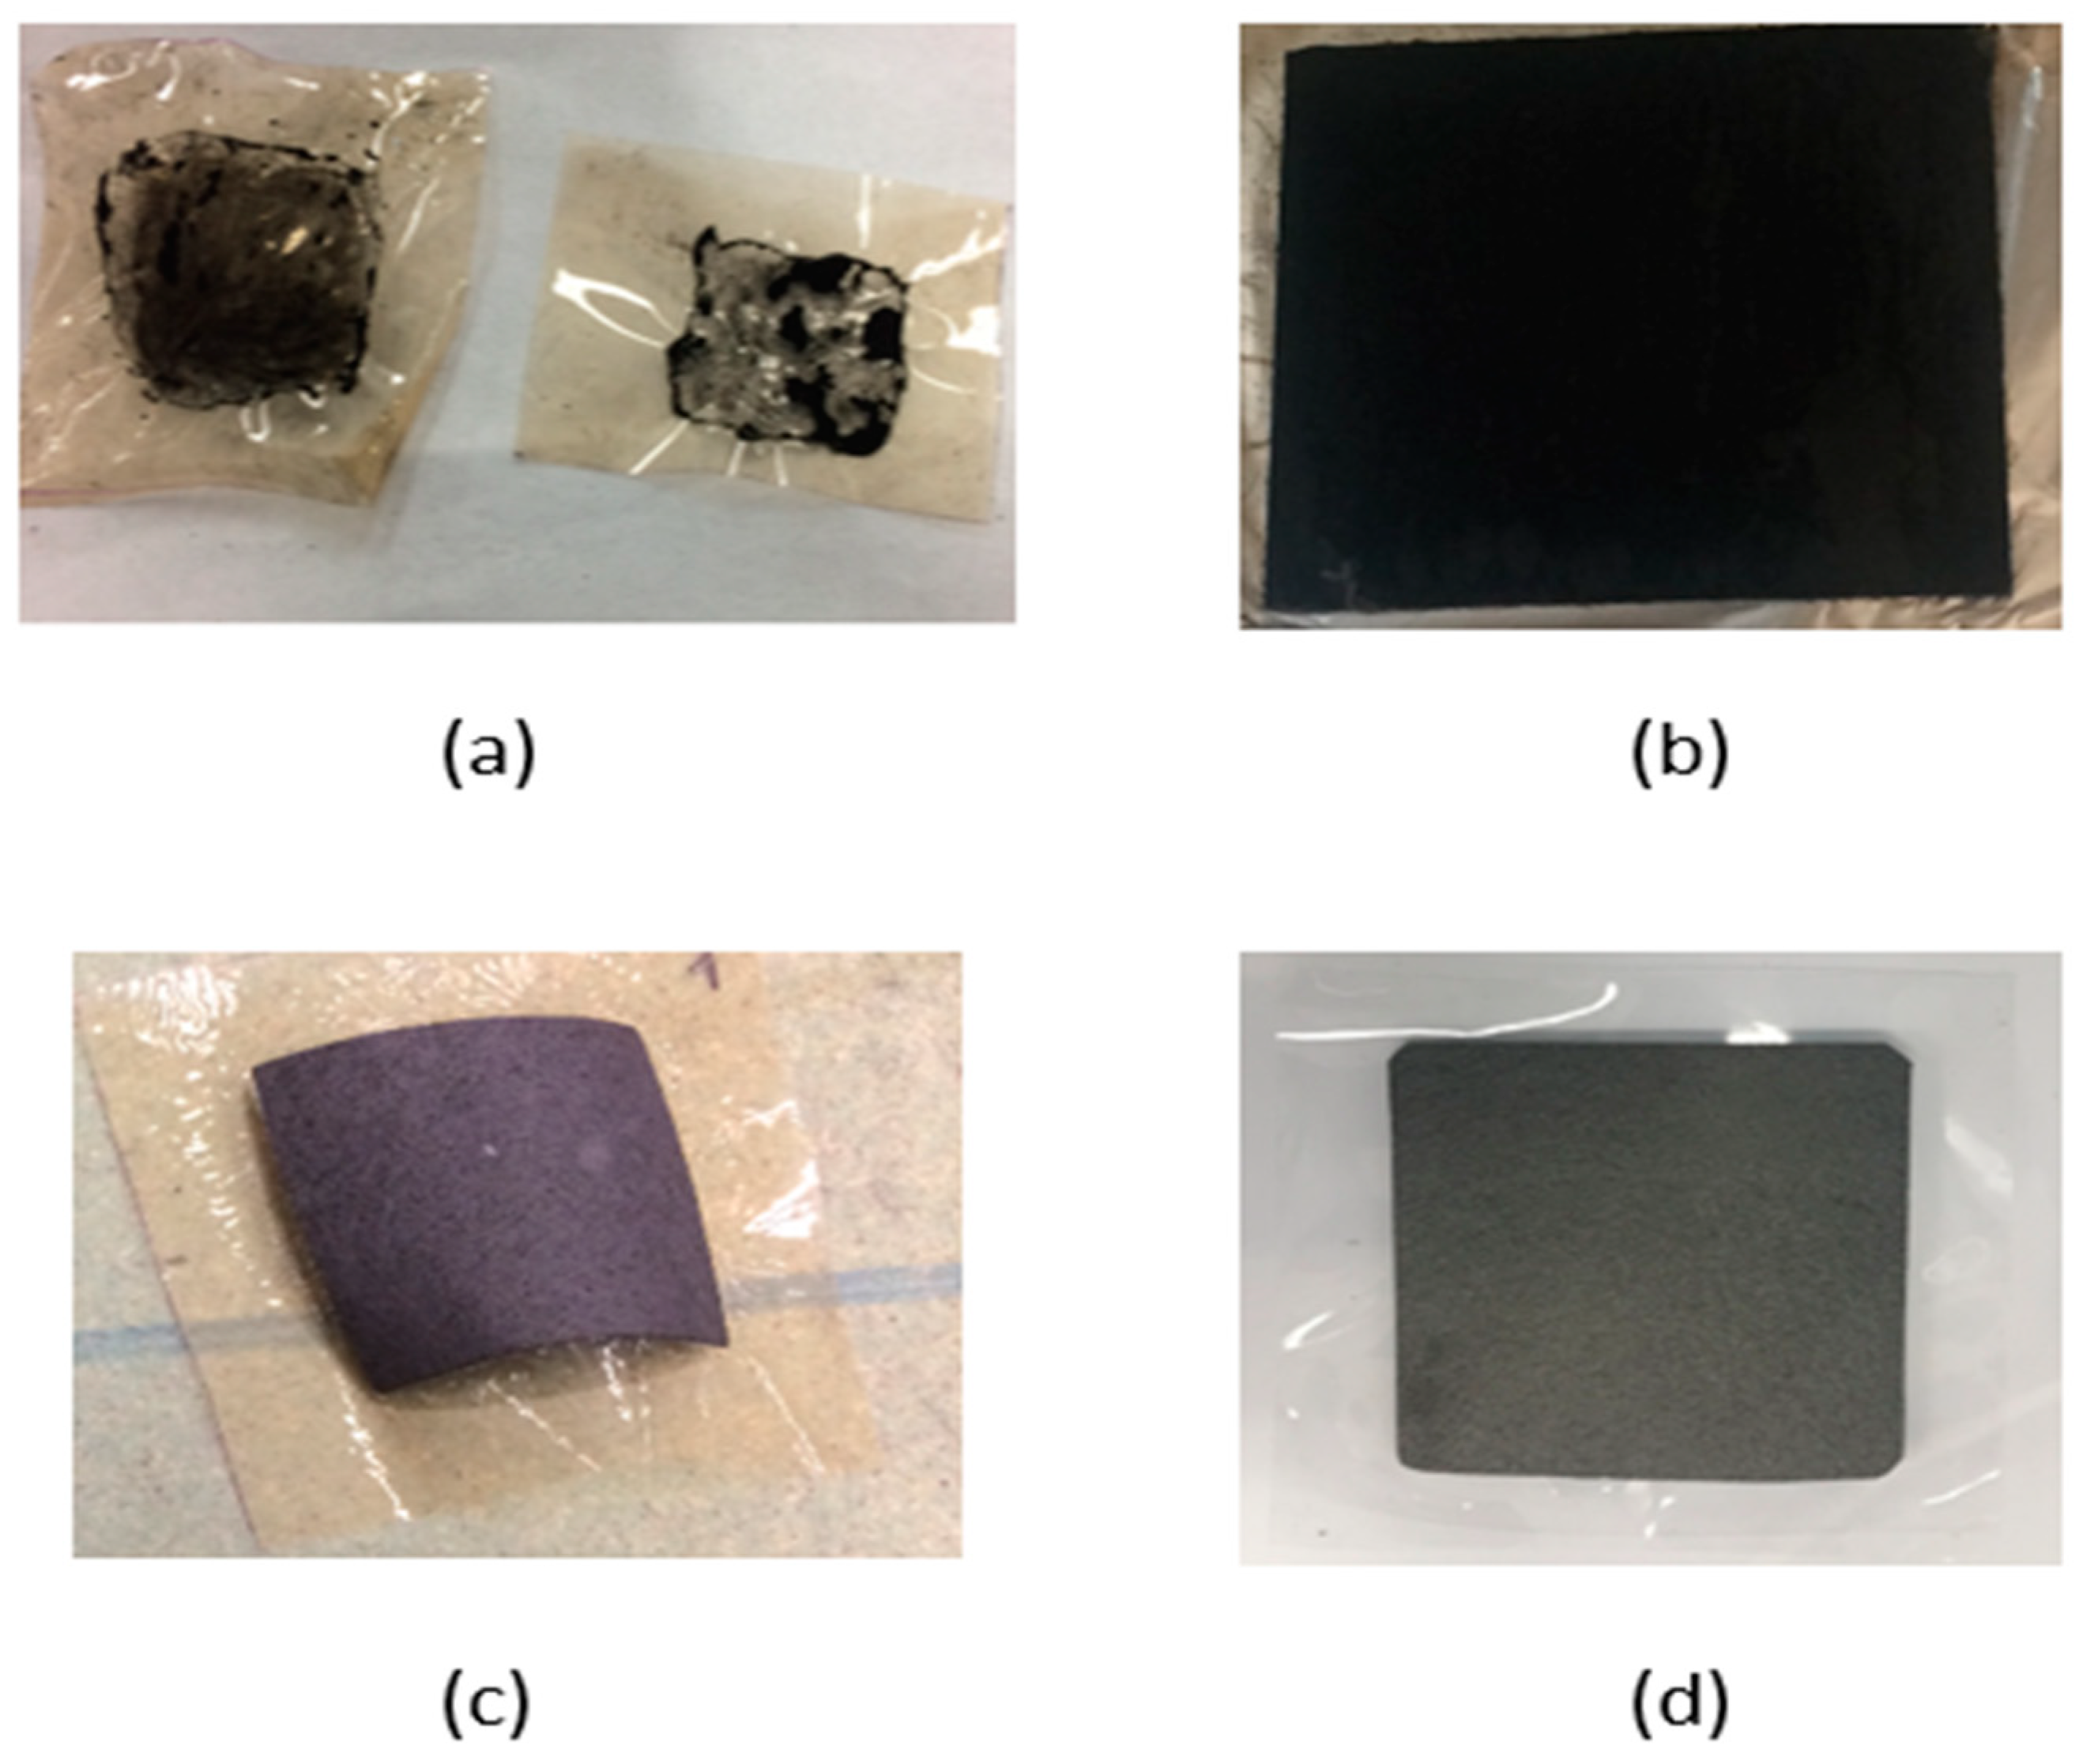
Figure 6.
Membrane electrode assembly fabrication tests (a): catalyst layer coated directly on the membrane using paintbrush method, no uniform adhesion with shrinking of the membrane (b) uniform catalyst layer obtained by spray coating method (c) commercial catalyst layer on carbon paper bonded to the membrane using hot press method. (d) spray coated catalyst layer on the carbon paper prepared at UNSW and bonded on pre-treated NAFION® 115 membrane.

Figure 7.
Cell voltage for a vanadium oxygen fuel cell (VOFC) with 70 mL 2 M V(II) at 20 mA cm−2 with a MoO3 treated carbon paper as negative half-cell electrode and a commercial Pt/C electrode (0.4 mg cm−2 Pt) on Vulcan carbon as positive half-cell electrode at 50 °C.
Figure 7.
Cell voltage for a vanadium oxygen fuel cell (VOFC) with 70 mL 2 M V(II) at 20 mA cm−2 with a MoO3 treated carbon paper as negative half-cell electrode and a commercial Pt/C electrode (0.4 mg cm−2 Pt) on Vulcan carbon as positive half-cell electrode at 50 °C.

Figure 8.
Cell voltage values for 3.6 M VOFC with variation of current density at 50 °C for UNSW MEA (MoO3 treated carbon paper as negative half-cell electrode and commercial Pt/C (0.4 mg cm−2) on Vulcan carbon as positive half-cell electrode).
Figure 8.
Cell voltage values for 3.6 M VOFC with variation of current density at 50 °C for UNSW MEA (MoO3 treated carbon paper as negative half-cell electrode and commercial Pt/C (0.4 mg cm−2) on Vulcan carbon as positive half-cell electrode).

Figure 9.
Continuous discharge curve for VOFC with 70 mL 3.6 M V(II) at 20 mA cm−2 for UNSW MEA (MoO3 treated carbon paper as negative half-cell electrode and commercial Pt/C (0.4 mg cm−2) on Vulcan carbon as positive half-cell electrode) at 50 °C.
Figure 9.
Continuous discharge curve for VOFC with 70 mL 3.6 M V(II) at 20 mA cm−2 for UNSW MEA (MoO3 treated carbon paper as negative half-cell electrode and commercial Pt/C (0.4 mg cm−2) on Vulcan carbon as positive half-cell electrode) at 50 °C.

Figure 10.
Cell voltage (during continuous discharge) for a vanadium oxygen fuel cell (VOFC) with 50 mL 2 M V(II) at 20 mA cm−2 with a heat treated SIGRACELL GFD graphite felt as negative half-cell electrode and a commercial Pt/C electrode (0.4 mg cm−2 Pt) on Vulcan carbon as positive half-cell electrode using pre-treated NAFION® 115 membrane, observed discharge capacity ≈ 80%.

Figure 11.
Polarisation plot obtained for vanadium oxygen fuel cell, 2 M V(II) in 5 M H2SO4 electrolyte.
Figure 11.
Polarisation plot obtained for vanadium oxygen fuel cell, 2 M V(II) in 5 M H2SO4 electrolyte.

Figure 12.
Cell voltage for a vanadium oxygen fuel cell (VOFC) with 50 mL 2 M V(II) at 10 mA cm−2 with a heat treated SIGRACELL GFD graphite felt as negative half-cell electrode and a commercial Pt/C electrode (0.4 mg cm−2 Pt) on Vulcan carbon as positive half-cell electrode. Comparison of NAFION® 115 and Fumasep FAP-450 membrane.

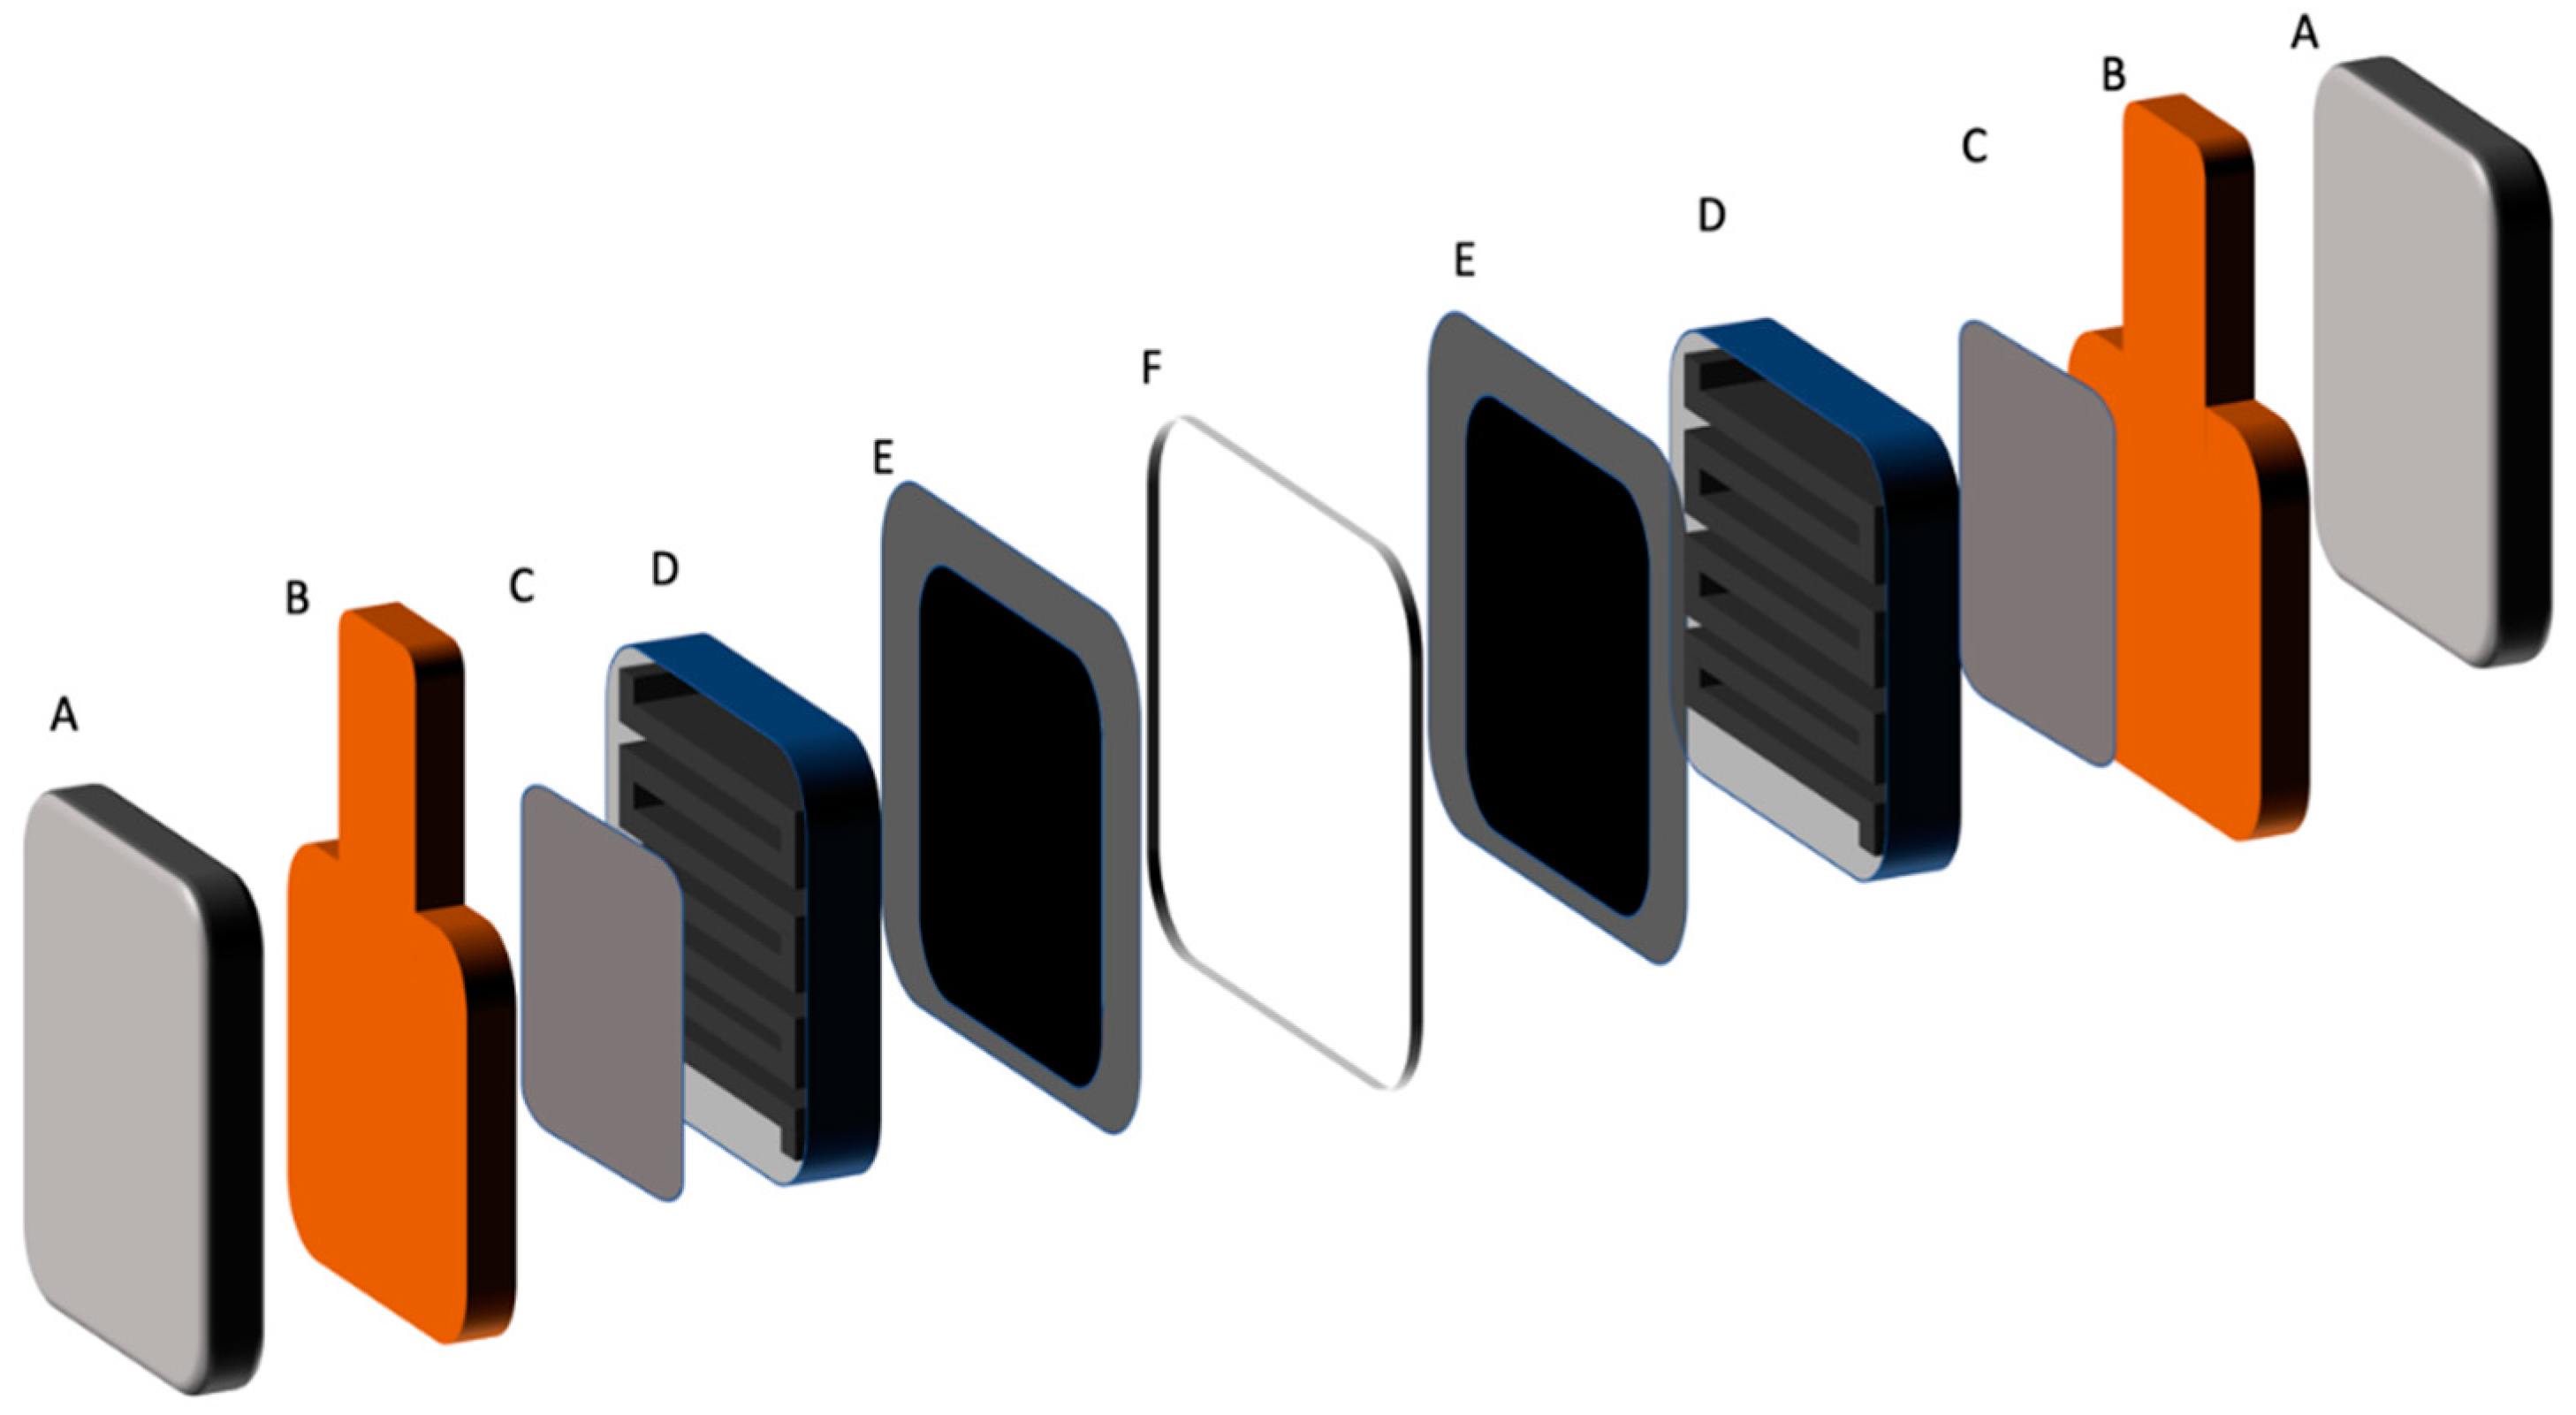
Figure 13.
VOFC test cell components schematic, A: End plate, B: Current collector C: Toray carbon paper, D: flow frame, E: Catalyst coated Toray carbon paper or carbon cloth with gasket, F: NAFION® 115 membrane.
Figure 13.
VOFC test cell components schematic, A: End plate, B: Current collector C: Toray carbon paper, D: flow frame, E: Catalyst coated Toray carbon paper or carbon cloth with gasket, F: NAFION® 115 membrane.

Figure 14.
Vanadium oxygen fuel cell (VOFC) test cell schematic diagram.


Table 1.
Mean cell voltage (UCell) and corresponding area specific resistance (ASR) for VOFCs using 2 M, 2.4 M and 3 M V(II) solution and commercial MEAs (4 mg cm−2 Pt, 25 °C), based on standard potential difference.
Table 1.
Mean cell voltage (UCell) and corresponding area specific resistance (ASR) for VOFCs using 2 M, 2.4 M and 3 M V(II) solution and commercial MEAs (4 mg cm−2 Pt, 25 °C), based on standard potential difference.
| Vanadium Concentration | Cell Characteristics | 0 (OCV) | 10 mA cm−2 | 20 mA cm−2 | 30 mA cm−2 | 40 mA cm−2 |
|---|---|---|---|---|---|---|
| 2 M V(II) | UCell/V | 1.05 | 0.77 | 0.61 | 0.45 | 0.30 |
| ASR/Ohm cm−2 | - | 77.0 | 30.5 | 15.0 | 7.5 | |
| 2.4 M V(II) | UCell/V | 1.09 | 0.81 | 0.67 | 0.60 | 0.51 |
| ASR/Ohm cm−2 | - | 81.0 | 33.5 | 20.0 | 12.8 | |
| 3 M V(II) | UCell/V | 1.07 | 0.78 | 0.68 | 0.61 | 0.55 |
| ASR/Ohm cm−2 | - | 78.0 | 34.0 | 20.3 | 13.8 |
Table 2.
Mean cell voltage (UCell), power densities (p), area specific resistances (ASR) and energy efficiencies (EE) for a VOFC using 2 M V(II) solution and a commercial MEA (4 mg cm−2 Pt) at 60 °C, based on standard potential difference.
Table 2.
Mean cell voltage (UCell), power densities (p), area specific resistances (ASR) and energy efficiencies (EE) for a VOFC using 2 M V(II) solution and a commercial MEA (4 mg cm−2 Pt) at 60 °C, based on standard potential difference.
| Vanadium Concentration | Cell Characteristics | 0 (OCV) | 10 mA cm−2 | 15 mA cm−2 | 20 mA cm−2 | 25 mA cm−2 |
|---|---|---|---|---|---|---|
| 2 M V(II), 60 °C | UCell/V | 1.04 | 0.8 | 0.73 | 0.64 | 0.53 |
| p/mW cm−2 | - | 8 | 11 | 12.8 | 13.25 | |
| ASR/Ohm cm−2 | - | 80.0 | 48.7 | 32.0 | 21.2 | |
| EE/% | 70 | 54 | 49 | 43 | 36 |
Table 3.
Summary of open-circuit voltages (OCV) obtained for vanadium oxygen fuel cell tests (VOFC) using various electrode combinations at 25 °C and 80 °C (2 M V(II), 5 M H2SO4).
Table 3.
Summary of open-circuit voltages (OCV) obtained for vanadium oxygen fuel cell tests (VOFC) using various electrode combinations at 25 °C and 80 °C (2 M V(II), 5 M H2SO4).
| Negative Half-Cell Material | Positive Half-Cell Material | Operating Temperature °C | OCV (V) |
|---|---|---|---|
| Toray carbon paper 120 untreated | Toray carbon paper 120 untreated | 25 | 0.75 |
| Heat treated Toray carbon paper 120 (400 °C, 30 h) | Wet proofed CeTech carbon cloth | 25 | 0.8 |
| Heat treated Toray carbon paper 120 (400 °C, 30 h) | MoS2 coated carbon paper [30] | 25 | 0.75 |
| Heat treated Toray carbon paper 120 (400 °C, 30 h) | Iron phthalocyanine [31] | 25 | 0.83 |
| Heat treated Toray carbon paper 120 (400 °C, 30 h) | MoO3 treated carbon paper | 25 | 0.85 |
| MoO3 treated carbon paper | MoO3 treated carbon paper | 80 | 1.02 |
| Pt/C MEA (commercial) 4 mg cm−2, fuel cell store | Pt/C MEA (Commercial) 4 mg cm−2, fuel cell store | 80 | 1.4 (0.60 at 50 mA/cm2) |
| MoO3 treated Toray carbon paper 120 | Pt/C (0.4 mg cm−2) coated on heat-treated carbon paper | 80 | 1.3 (0.57 at 50 mA/cm2) |
| Toray carbon paper 120 | Spray coated microporous layer [32] | 80 | 1.15 |
| Heat-treated Toray carbon paper 120 (400 °C, 30 h) | Sprayed microporous layer on Toray carbon paper 120 [32] | 80 | 1.08 |
| MoO3 treated carbon paper | Vulcan XC-72 carbon black untreated | 80 | 0.93 |
Table 4.
Mean cell voltage (UCell), power densities (p), area specific resistances (ASR) and energy efficiencies (EE) for a VOFC using 3.6 M V(II) solution and a commercial MEA (4 mg cm−2 Pt) at 50 °C, based on standard potential difference.
Table 4.
Mean cell voltage (UCell), power densities (p), area specific resistances (ASR) and energy efficiencies (EE) for a VOFC using 3.6 M V(II) solution and a commercial MEA (4 mg cm−2 Pt) at 50 °C, based on standard potential difference.
| Vanadium Concentration | Cell Characteristics | 0 (OCV) | 10 mA cm−2 | 20 mA cm−2 | 30 mA cm−2 | 40 mA cm−2 | 50 mA cm−2 | 60 mA cm−2 | 70 mA cm−2 |
|---|---|---|---|---|---|---|---|---|---|
| 3.6 M V(II), 50 °C | UCell/V | 1.25 | 1.03 | 0.97 | 0.89 | 0.81 | 0.69 | 0.57 | 0.43 |
| p/mW cm−2 | - | 10.3 | 19.4 | 26.7 | 32.4 | 34.5 | 34.2 | 30.1 | |
| ASR/Ohm cm−2 | - | 103.0 | 48.5 | 29.7 | 20.3 | 13.8 | 9.5 | 6.1 | |
| EE/% | 84 | 69 | 65 | 59 | 54 | 46 | 38 | 29 |
Table 5.
Energy density values for VOFC.
| Vanadium Concentration | Theoretical Energy Density |
|---|---|
| For 2 M Vanadium solution | 79.9 Wh L−1 |
| For 3.6 M Vanadium solution | 143.8 Wh L−1 |
© 2019 by the authors. Licensee MDPI, Basel, Switzerland. This article is an open access article distributed under the terms and conditions of the Creative Commons Attribution (CC BY) license (http://creativecommons.org/licenses/by/4.0/).
Share and Cite
MDPI and ACS Style
Risbud, M.; Menictas, C.; Skyllas-Kazacos, M.; Noack, J. Vanadium Oxygen Fuel Cell Utilising High Concentration Electrolyte. Batteries 2019, 5, 24. https://doi.org/10.3390/batteries5010024
AMA Style
Risbud M, Menictas C, Skyllas-Kazacos M, Noack J. Vanadium Oxygen Fuel Cell Utilising High Concentration Electrolyte. Batteries. 2019; 5(1):24. https://doi.org/10.3390/batteries5010024
Chicago/Turabian StyleRisbud, Mandar, Chris Menictas, Maria Skyllas-Kazacos, and Jens Noack. 2019. "Vanadium Oxygen Fuel Cell Utilising High Concentration Electrolyte" Batteries 5, no. 1: 24. https://doi.org/10.3390/batteries5010024
Note that from the first issue of 2016, this journal uses article numbers instead of page numbers. See further details here.