Characterisation of a 200 kW/400 kWh Vanadium Redox Flow Battery


1
Department of Pure & Applied Chemistry, University of Strathclyde, Glasgow G1 1XL, UK
2
Ecole Polytechnique Fédérale de Lausanne, EPFL-SB-ISIC-LEPA, Station 6, CH-1015 Lausanne, Switzerland
*
Author to whom correspondence should be addressed.
Batteries 2018, 4(4), 54; https://doi.org/10.3390/batteries4040054
Submission received: 30 September 2018
/
Revised: 20 October 2018
/
Accepted: 22 October 2018
/
Published: 1 November 2018
(This article belongs to the Special Issue Vanadium Redox Flow Battery and Its Applications)
Abstract
:The incessant growth in energy demand has resulted in the deployment of renewable energy generators to reduce the impact of fossil fuel dependence. However, these generators often suffer from intermittency and require energy storage when there is over-generation and the subsequent release of this stored energy at high demand. One such energy storage technology that could provide a solution to improving energy management, as well as offering spinning reserve and grid stability, is the redox flow battery (RFB). One such system is the 200 kW/400 kWh vanadium RFB installed in the energy station at Martigny, Switzerland. This RFB utilises the excess energy from renewable generation to support the energy security of the local community, charge electric vehicle batteries, or to provide the power required to an alkaline electrolyser to produce hydrogen as a fuel for use in fuel cell vehicles. In this article, this vanadium RFB is fully characterised in terms of the system and electrochemical energy efficiency, with the focus being placed on areas of internal energy consumption from the regulatory systems and energy losses from self-discharge/side reactions.

1. Introduction
Redox flow batteries (RFBs) can provide a solution to large scale energy storage, giving a more efficient link between energy production, especially from renewables, and energy demand [1,2,3]. This type of battery system presents the advantage of having a lower cost, rapid response and a low level of self-discharge and is considered to have a much safer operation, as compared to other battery systems such as the sodium sulphur and lithium ion batteries [4,5]. Additionally, as with all battery systems, it has the advantage of being more flexible and mobile in comparison to non-electrochemical technologies, such as pumped hydro and compressed air storage. The latter large scale energy management technologies are restrained by the suitability of the terrain whereas batteries, such as RFBs, can be readily installed anywhere [6] and provide long duration discharge. For rapid response, such as for frequency stabilisation, supercapacitors can be used in combination with electrochemical batteries due to the high-power density capability of these devices [7,8,9].
Aqueous RFBs are among the most developed with numerous flow battery systems having been demonstrated [10,11]. Although they have a high-power density, these batteries have low energy densities and depending on the system, relatively high material costs. Despite a number of developments, such as that of the mixed acid electrolyte employed in the all-vanadium redox flow battery to yield higher densities [12], these systems still struggle to compete with alternative technologies. This has led to the development of a variety of RFB types such as hybrid RFBs and non-aqueous RFBs [13,14,15].
However, the all-vanadium RFB (VRFB) remains the most iconic and commercial of all the RFBs. Developed by M. Skyllas-Kazacos et al. in 1988, the VRFB has seen a lot of development at both the fundamental and industrial level [16]. This original system was set as a superior alternative to the iron-chromium RFB which was used by National Aeronautics and Space Administration [13]. One of its advantages is its resilience to membrane crossover by the electroactive species on the negative and positive side of the battery. Since the same elemental species is used on both sides, should species crossover occur, the electrolytes can simply be regenerated through remixing and electrolysis without harm to any of the materials or requirement for the system to undergo complicated separation treatment. However, due to the poor solubility of the vanadium species in pure water, sulphuric acid is commonly added. This is typically referred to as a Generation I—VRFB [17]. This VRFB gives the following reactions during discharge [18]:
Anode:
Cathode:
Overall:
As indicated above, this gives an overall open circuit voltage of 1.26 V under standard conditions. The energy density is limited by the concentration at which the vanadium ions remain stable within solution. The current operating level is 2 M VOSO4 in 2 M sulphuric acid. Above this concentration the VO2+ ions can precipitate out as V2O5, especially when temperatures are above 40 °C whereas the V2+/V3+ precipitation can also occur at temperatures below 10 °C [1]. This limits the practical operation of the Generation 1 batteries to 10–40 °C with a concentration less than 2 M. Such concentrations gives an open circuit of 1.6 V when fully charged [6].
The VRFB has become the most commercially successful RFB due to the systems’ ability to undergo multiple charge-discharge cycles resulting in better levelised cost of electricity (a measure of economic value over the potential lifetime of the technology), despite the vanadium having a relatively high cost. On top of this, the system also has 70–90% energy efficiency due to fast kinetics and can be over-charged or undergo deep discharge with no lasting damage to the system. However, when the cell is overcharged, possible side reactions, such as hydrogen evolution, can occur at the cathode:
This gas evolution is kept to a minimum as it can affect the flow of the electrolyte, create imbalance in the electrolyte, increase the cell resistance, and alter the pH of the solution (affecting the proton-exchange membrane) as well as creating a safety hazard.
Switzerland introduced the “Energy Strategy 2050” strategy, following the Fukushima incident in Japan and this was ratified, via public vote, in 2017. The strategy aims to reduce the nation’s energy consumption, increase energy efficiency and promote the use of renewable energy sources [19]. It is worth noting that in 2016, Switzerland produced less than 0.2% of their electricity demand from wind energy: producing only 600 GWh per year [20]. The plan is to increase that capacity to 4000 GWh per year by 2050 as well as that of solar energy to 20% of generated electricity by 2020, compared to the 1% attained in 2013 [21]. It is nevertheless acknowledged that energy supplied from renewable sources is intermittent and can fluctuate significantly depending on weather conditions and location within Switzerland [22,23]. To counter this and achieve the strategic goals, significant interest lies in developing a feasible energy storage strategy to improve the nation’s energy efficiency and security. Better energy management from renewables can be achieved through the use of a feasible storage strategy, which will add to the nation’s energy efficiency and security.
One energy storage system, located at the water treatment plant facility in Martigny, is a 200 kW/400 kWh vanadium flow battery, based on the Generation 1 model using the concentrated 2 M sulphuric acid electrolyte and was provided by Gildemeister in 2014 and operated since by École Polytechnique Fédérale de Lausanne—Laboratory of Physical and Analytical Electrochemistry (EPFL—LEPA). This battery forms the centrepiece of the refuelling station which also hosts an electric vehicle fast charger (50 kW) and two electrolysers which produce hydrogen for the refuelling of the centre’s fuel cell vehicles [24,25]. The objective of this demonstration project was to investigate the connections of the battery to the grid and to better understand energy transfer from the grid for transport applications. Additionally, the site can simulate energy productions from intermittent energy sources to determine the battery’s capability to store this excess energy for later use.
The purpose of this work was for the University of Strathclyde, Scotland, to analyse and characterise the 200 kW/400 kWh VRFB and determine its actual capacity, the voltage, coulombic and energy efficiencies, identify and quantify the sources of the energy losses and the self-discharge rate under different scenarios. From this, it should be possible to ascertain the most appropriate application for this energy storage system at the facility in Martigny, Switzerland, viz., intermittent energy storage, power for the 50 kW alkaline electrolyser and/or 50 kW electric vehicle recharging.
2. Methodology
The analysis of the 200 kW/400 kWh vanadium RFB operations required large volumes of data to be recorded in each run. This was achieved through two recording systems: Siemens TIA Portal Program and an APPA 503 multimeter Logger. These recorded the data successfully at specified time allotments during the batteries work sequence. The Siemens TIA Portal Program and the operation of the battery could both be accessed using the TeamViewer (12): software which grants remote access to other computer systems.
The battery work sequences could only be accessed from the battery’s computer directly or through Team Viewer. The programme allowed for work sequences to run and to monitor the battery in real time. From this, recorded values and operational programmes from many cycles were performed at various levels of power to assess this battery. The charge level limits were determined by allowing the battery to charge/discharge at 200 kW until it reached its charge level limitations (0–100%) which were the equivalent to the state of charge (SoC) being 5–85% limits. This data allowed for the stored energy capacity and the charge/discharge profiles to be understood for the individual runs. The cycles from the battery could charge for a theoretical time that would achieve 100% charge level and immediately discharge. This gave the initial evaluation of the system’s coulombic efficiency and, from the multimeter attached to the individual stack, the voltage efficiency.
The battery was then operated using incremental power levels to understand the power requirements for the centrifugal pumps, the AC/DC and DC/DC convertor efficiencies. Finally, the battery was also operated under standby condition with a various numbers of stack groups being kept active. This was measured over a 48-h period to determine the extent of self-discharge in the system.
3. Battery Characteristics
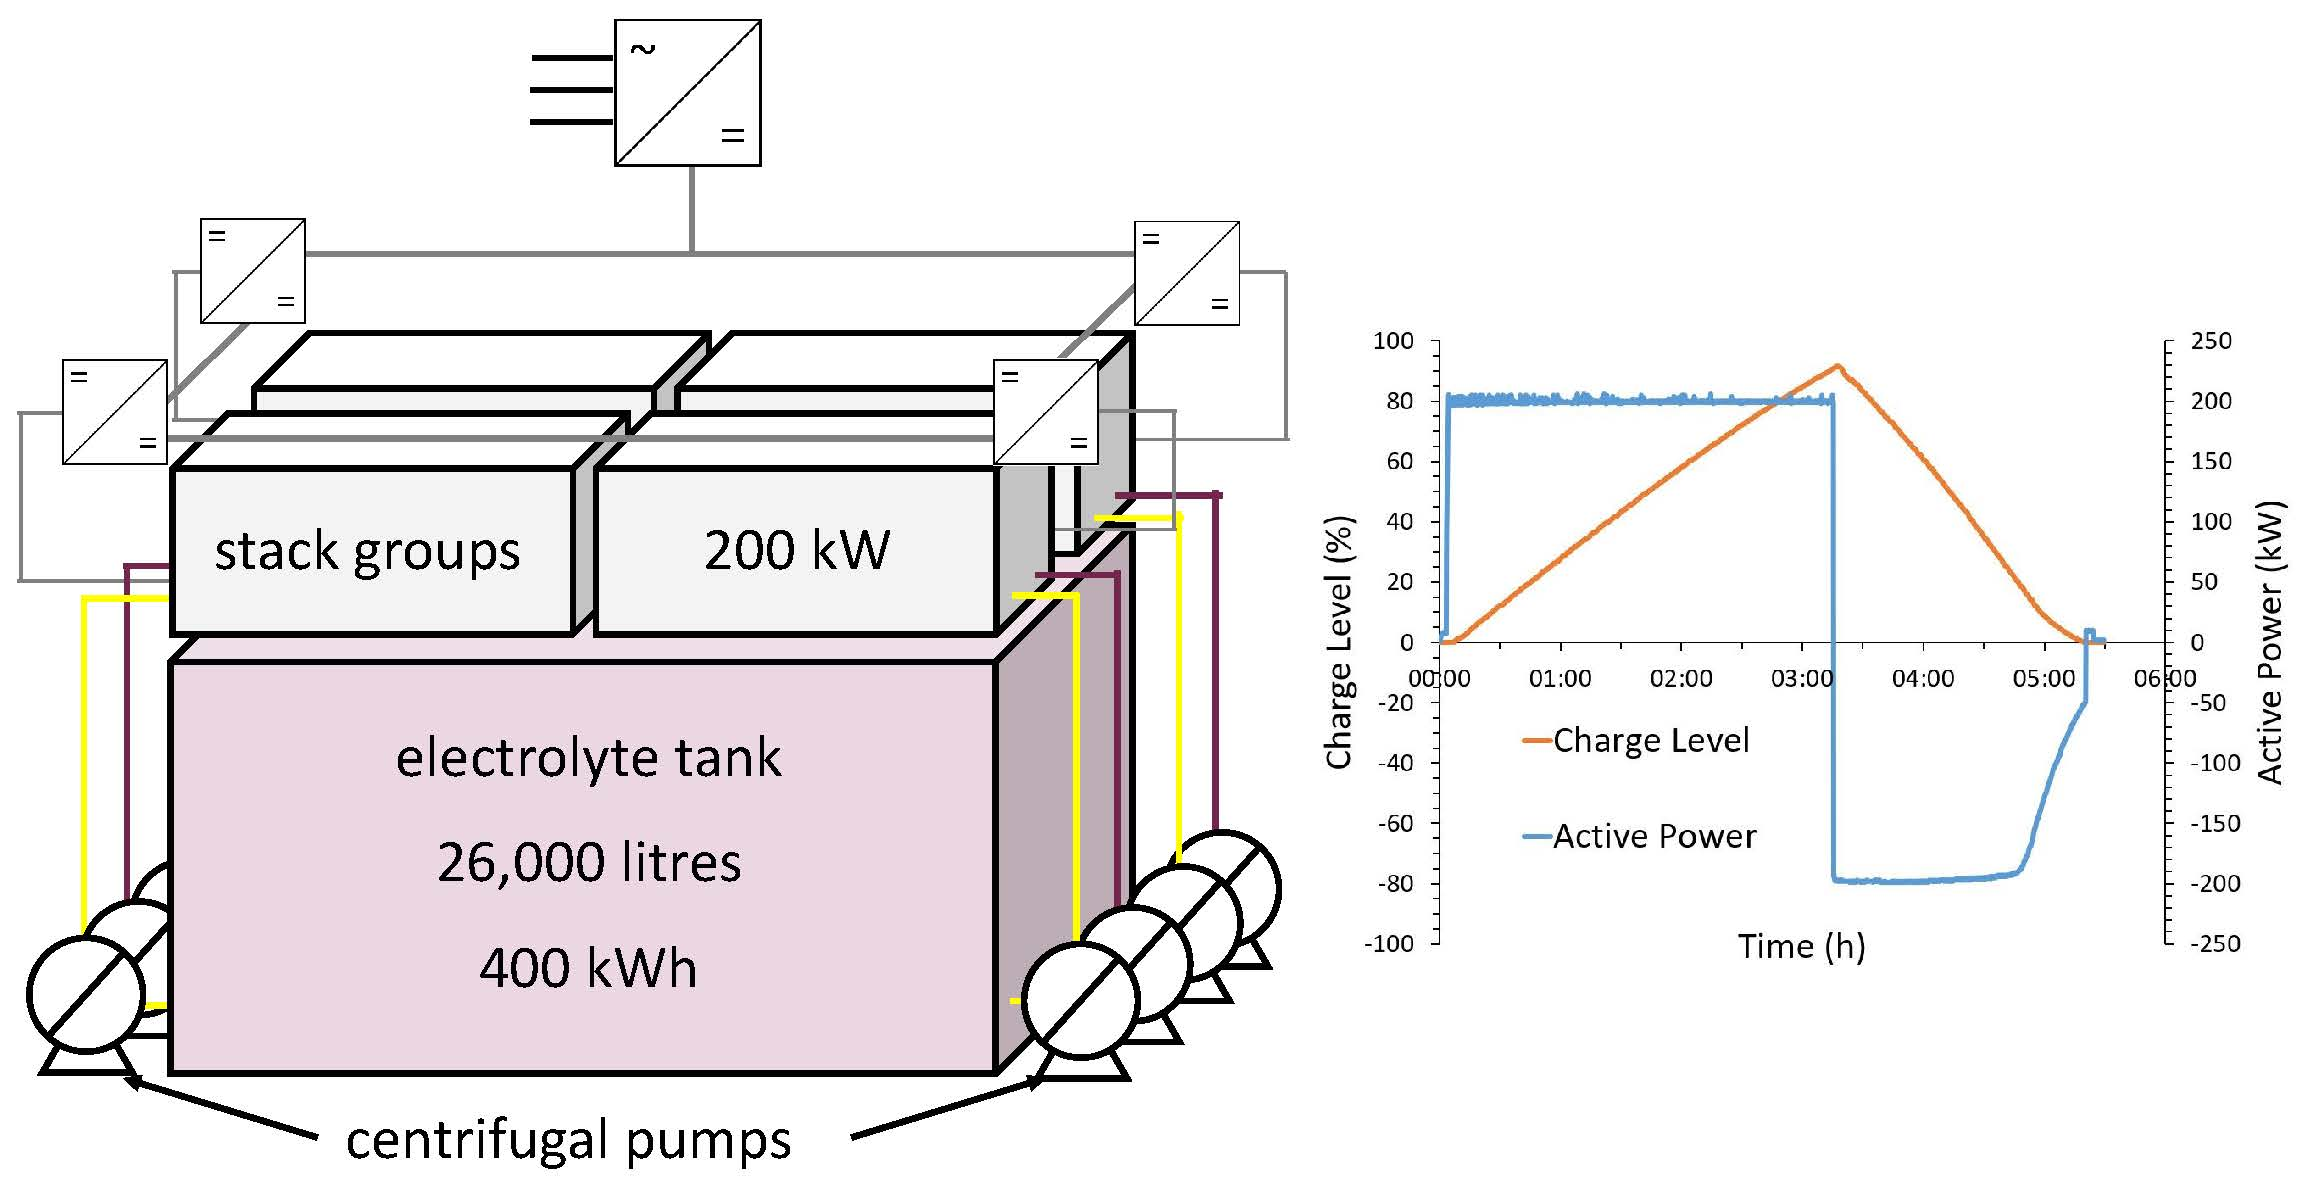
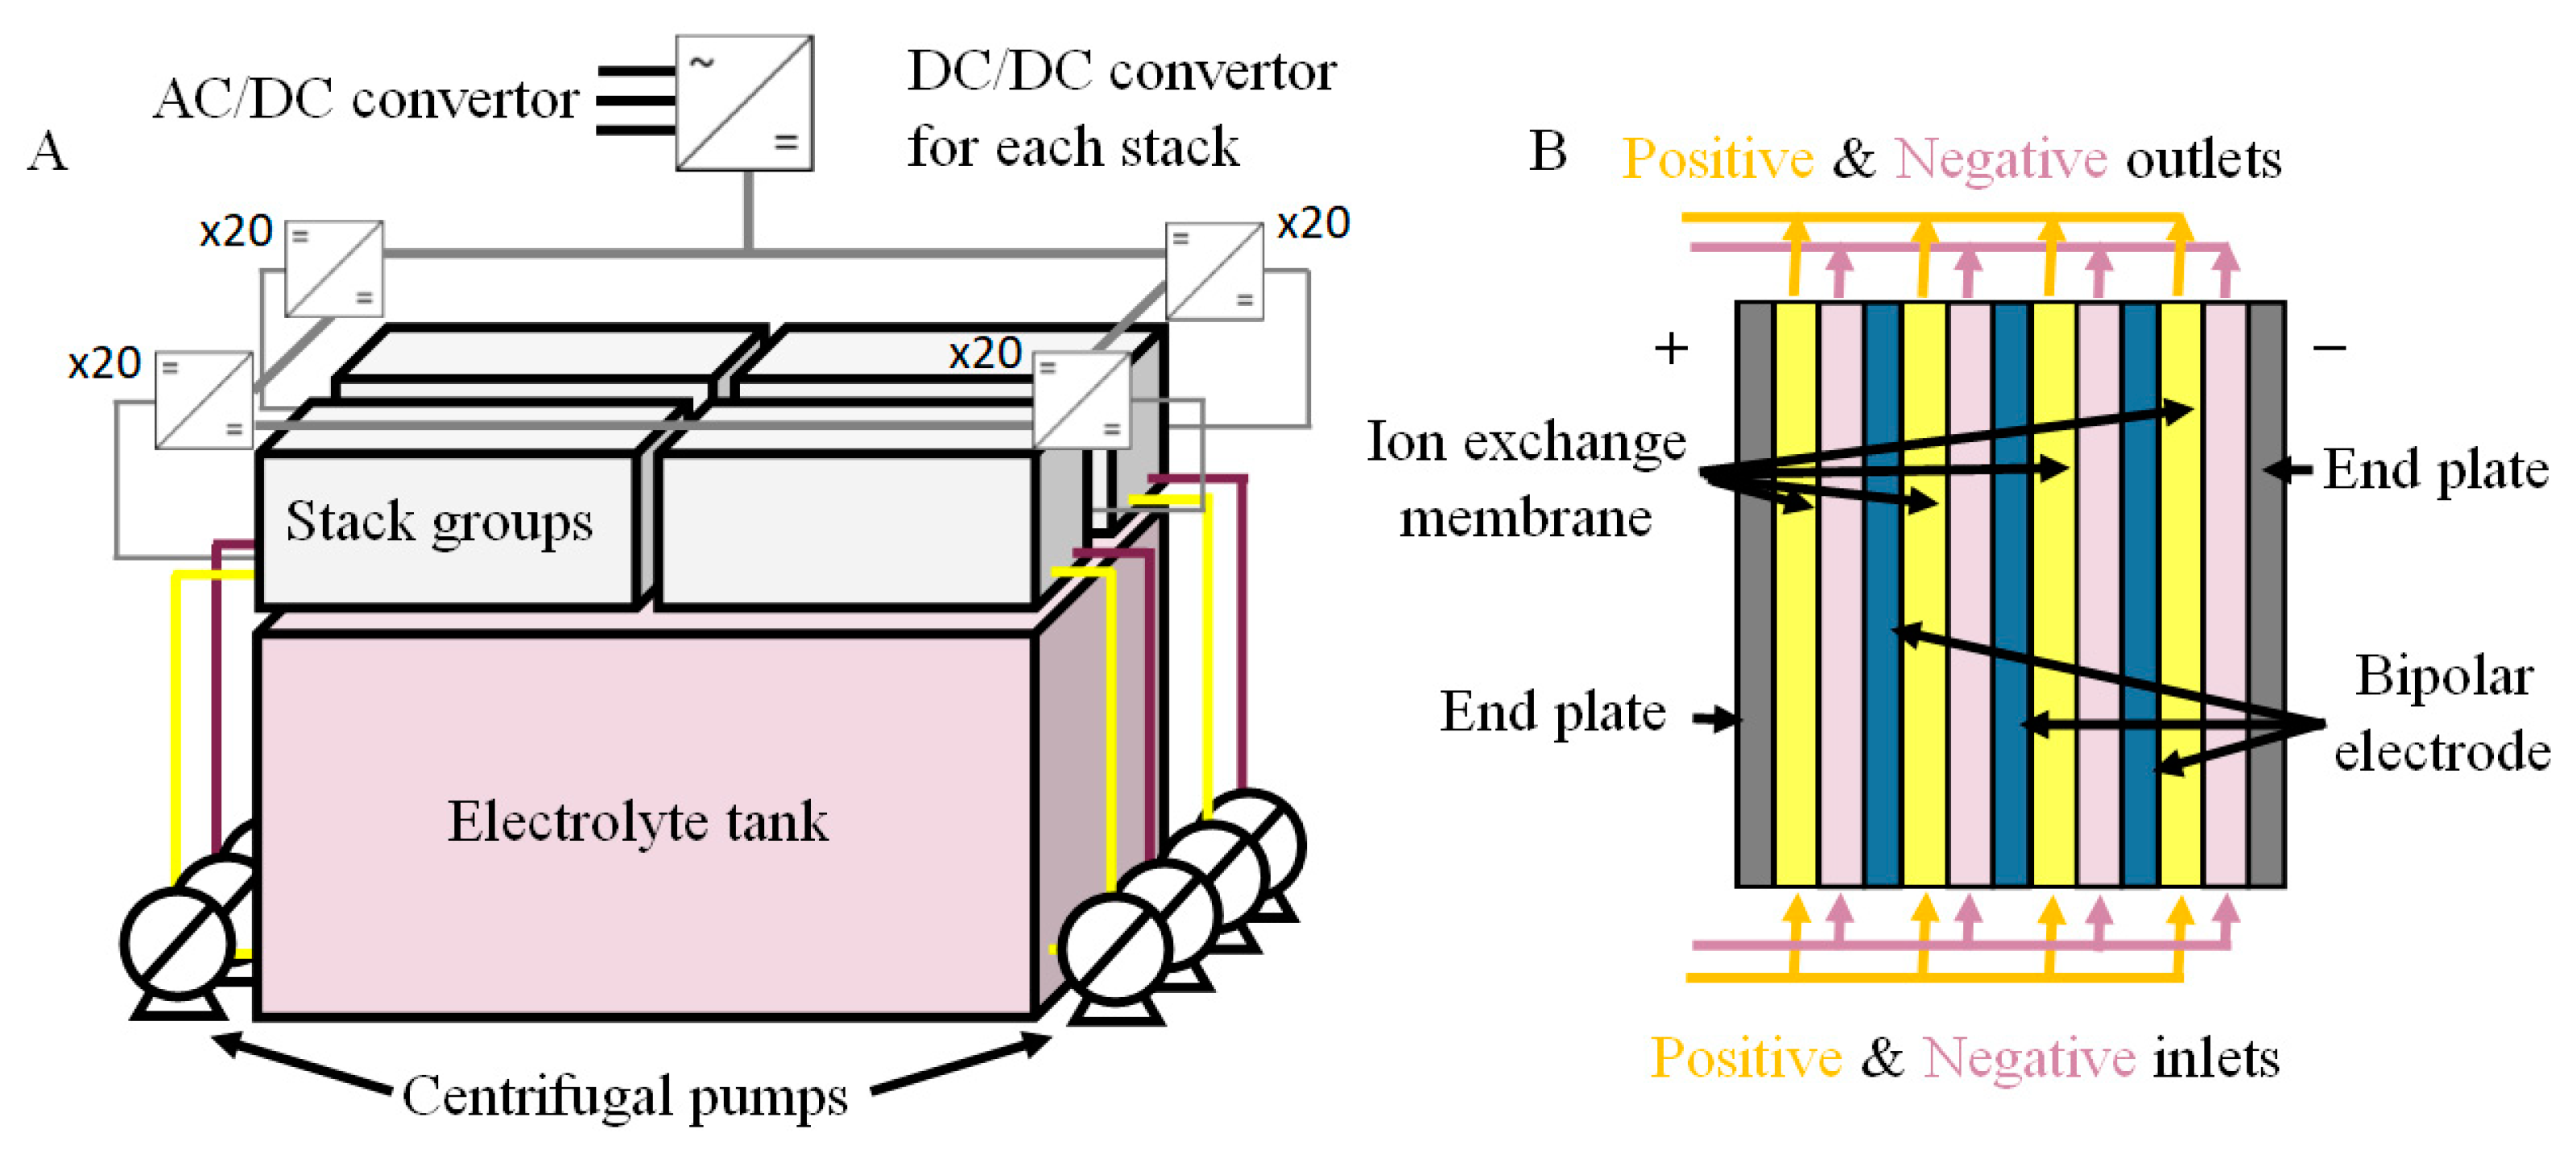
The 200 kW/400 kWh vanadium RFB, shown in Figure 1A, was comprised of four sections containing the stacks and two electrolyte tanks. Each section had twenty stacks individually connected to the main DC line with a DC/DC convertor. The mains voltage was provided to the battery via the AC/DC convertor (three phase AC). A single stack consisted of 27 bipolar cells with a carbon composite as the bipolar plate and end-of-stack current collector. An example of the stack design which is shown in Figure 1B. Attached to these current collectors were GFD 4.6 graphitic felts with a dimension of 28 cm × 19.5 cm × 0.46 cm for each felt electrode with a stated surface area of 0.4 m2·g−1 [26]. Therefore, with a sample piece of GFD 4.6 of 20 cm2 weighing 3.3 g, this would mean that the sample piece had a surface area of roughly 1.32 m2. Scaling this up to the size of a typical electrode would give a surface area of 36.0 m2 and the entire battery an area 15.6 × 10⁴ m2. The membrane was unknown, as the information was not provided in the specifications of this battery unit.
For the operation of the battery, the positive and negative electrolytes were pumped into each group of stacks from two centrifugal pumps. The total electrolyte volume was 26,000 L and was composed of 1.6 M vanadium species in concentrated (2 M) sulphuric acid. The battery module also contained numerous sensors to measure and control the ventilation, in particular with respect to hydrogen, the temperature, the electrolyte levels in the tanks, any electrolyte leakage from the tanks into spill containment bund, etc. These sensors thus allowed for the control of the operational temperatures, the balancing of the electrolytes during operation of the battery and to identify and detect problems within this system. For example, two issues identified in this RFB system were that two of the stacks (Stack A07 and Stack C19) or their corresponding DC/DC convertors, were faulty at the moment of the characterisation.
Typically, this battery was operated between nominal charge levels of 0% to 100% as displayed on the human–machine interface (HMI) but the actual states of charge corresponding to these were SoC 5% and SoC 85%, respectively.
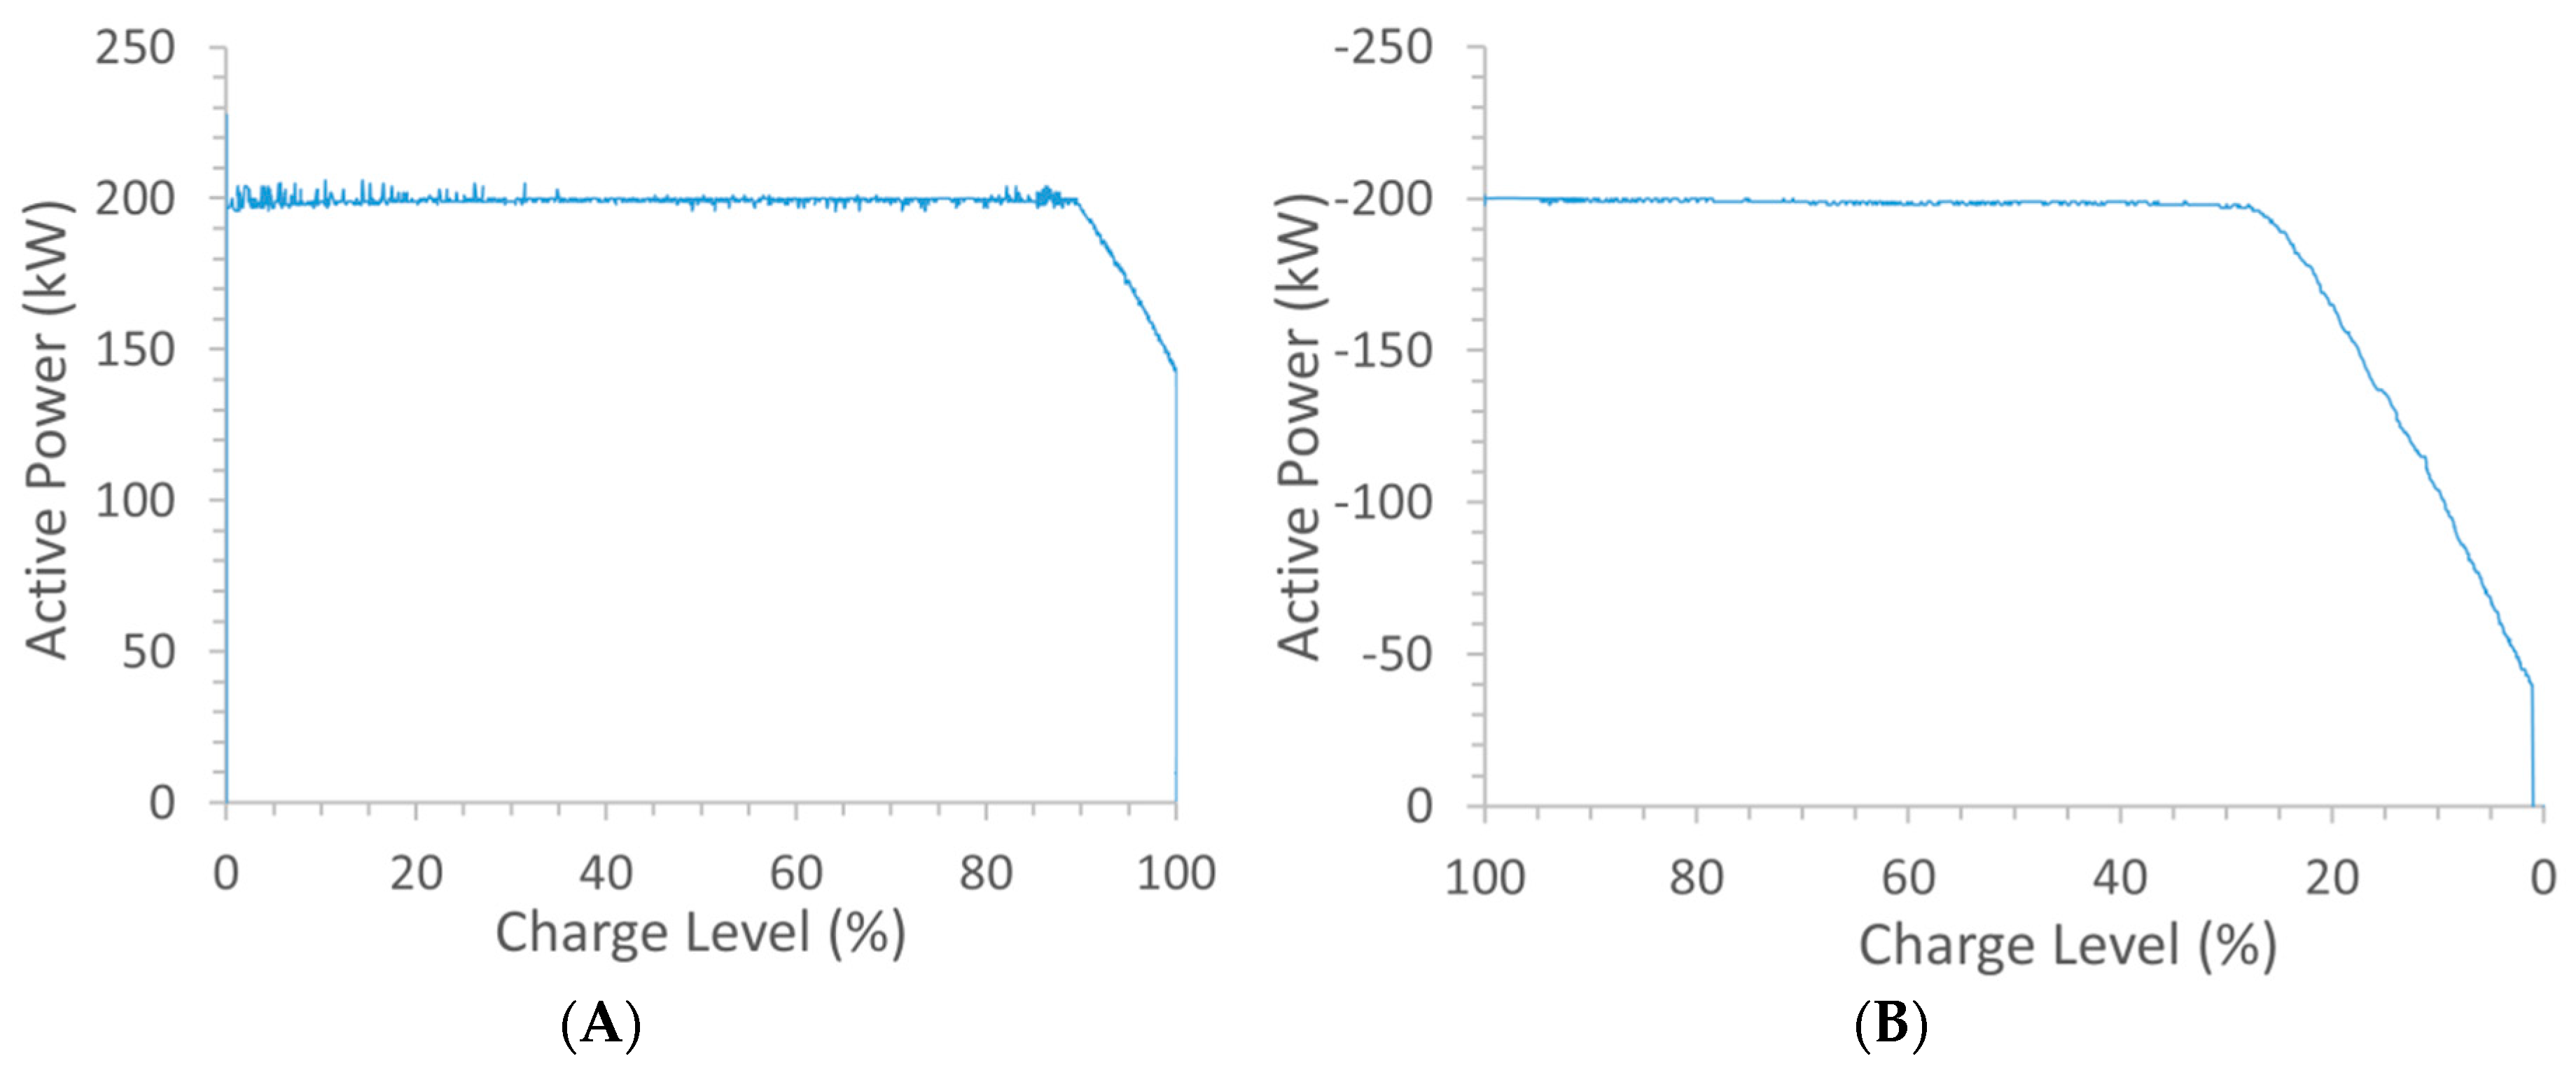
Figure 2A shows the 200 kW of power being applied to charge up the battery. A constant power level was maintained here until a charge level of 90% was indicated on the human-machine interface (HMI). The applied power was then linearly decreased at a rate of 1.8 kW/min until the 100% charge level was achieved, by which time the applied power was only ca. 140 kW.
The power-charge level profile applied during discharge (Figure 2B) was overall very similar to that used during charge except that here, when the charge level had reduced to between 25% and 15% (depending on the applied voltage level) on the HMI, the power was decreased along with it. In this system, as the charge level approached 0%, charge pulses were automatically applied so as to prevent the charge level dropping below the 0% level. For both charge and discharge, voltage limits were set so as to minimise the risk of secondary reactions, such as H2 or O2 evolution, vanadium precipitation arising from a drop in electrolyte acidity or damage to the electrode materials [18].
4. System Energy Efficiency
Repeated charge/discharge cycles were conducted in order to determine the system’s energy efficiency at different power set-points. The cycles were operated between 50–200 kW in increments of 50 kW to provide information on the battery’s power capability over this range. In addition, a cycle at 50 kW was also run to simulate its function for integration with the on-site alkaline electrolyser. Both RFB system and 50 kW electrolyser were connected and controlled through the plant facility to a central unit.
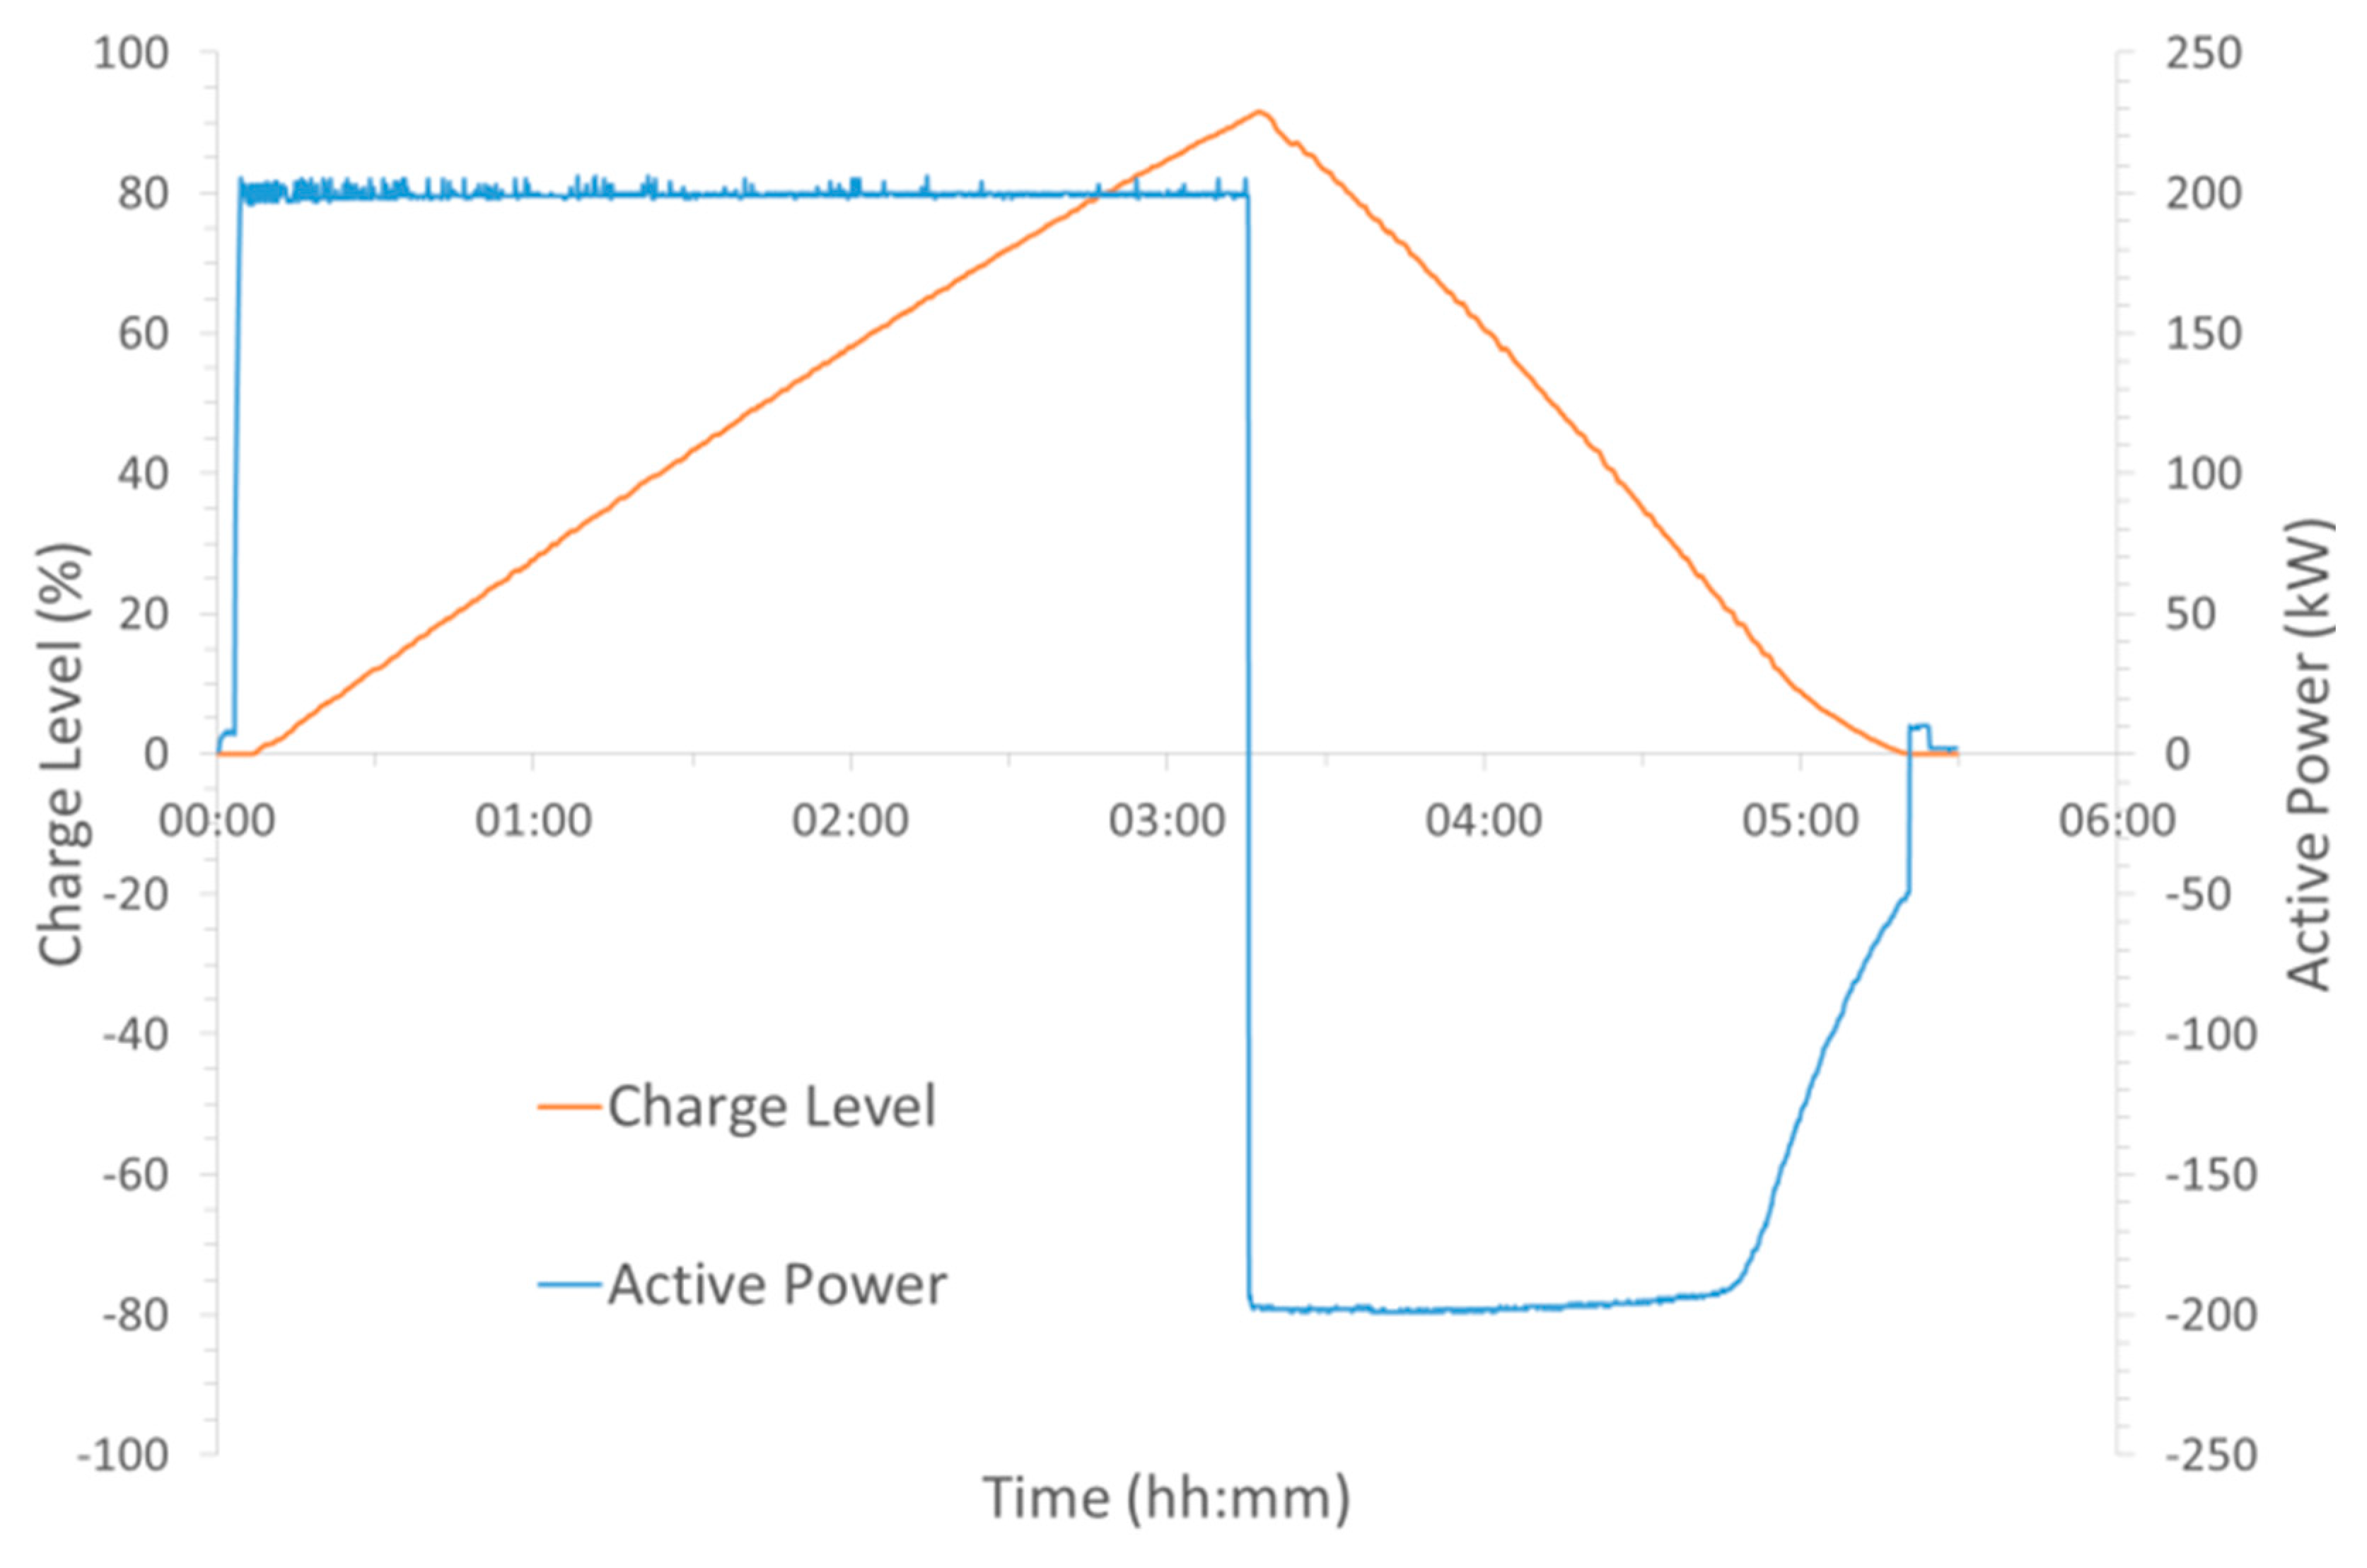
Figure 3 displays a typical data set achieved from these test cycles. It is worth noting here that the charge level for the 200 kW charge was not taken to 100%, so as to avoid the above noted linear reduction in power near the charge level’s upper limit. However, the battery was set to fully discharge to 0% charge level in order to examine how much of the input energy was returned on the discharge part of the cycle.
The system energy efficiency was simply evaluated as the ratio of the total energy returned from what was originally input into the battery. Table 1 gives the energy efficiencies for each of the cycles carried out and it can be seen that at charging/discharging power ≥60 kW, a value of 56.5 ± 2% was obtained. At 50 kW, the energy efficiency found was 48% and the reason for this lower value is examined below. The impact of electrolyte temperature on the system efficiency is shown by the * data for the 100 kW charge/discharge cycle in the table. Here, the cycle was initiated when the electrolyte in the tank was 44.8 °C and this resulted in a system energy efficiency of only 47% compared to 59% when operating over the normal temperature range (10 °C to 40 °C).
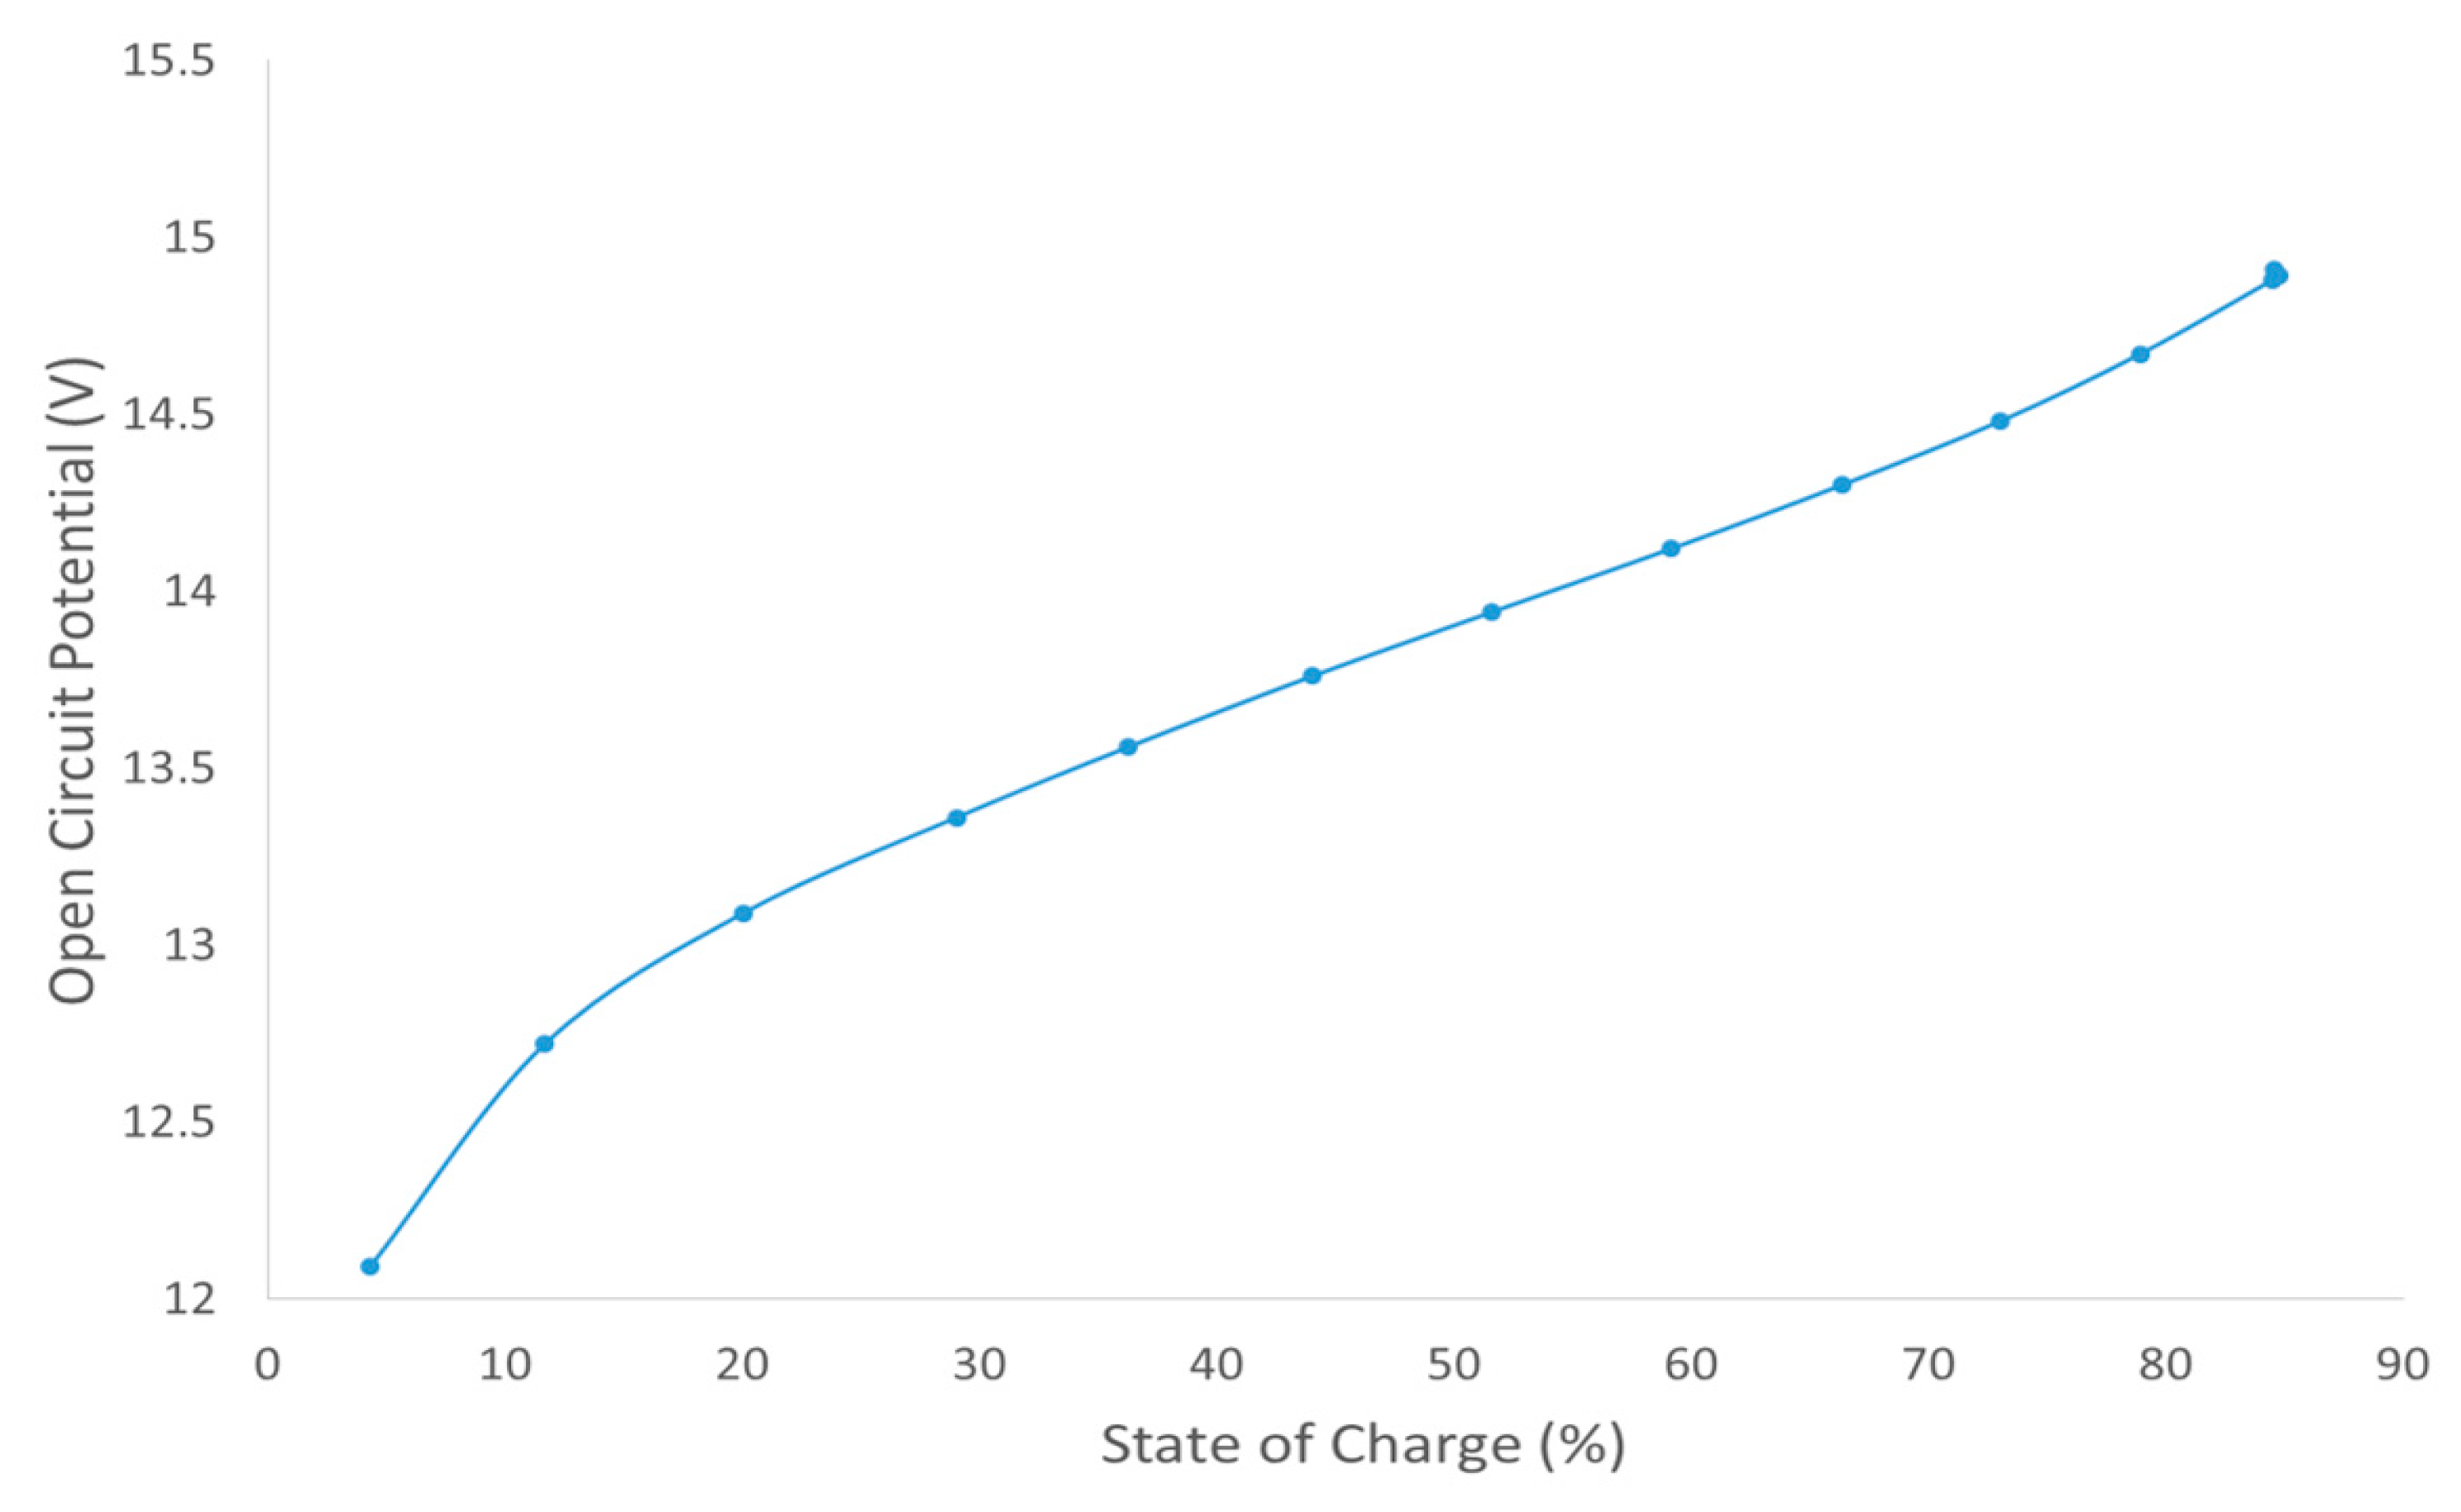
It can also be noted from the table that the charge level at the different powers achieved shows some variation and does not correlate with the actual amount of energy stored in the battery. The 50 kW charge achieved a charge level of 91.8% with 737.8 kWh compared to which 91.6% with 637.8 kWh at 200 kW charge. However, these were determined in the HMI through the open circuit voltage (OCV) value as opposed to simply calculating the theoretical charge level from the power input and time. Therefore, this could be a result of Figure 4 which shows the relationship between the charge level and the OCV and it illustrates what would be expected from the Nernst equation being applied to the cell reaction. At the lower limit, state of charge 5%, it is observed from the figure that the OCV starts to decrease rapidly. A rapid increase would also have been observed beyond an 85% state of charge (equivalent to 100% charge level), but the battery was never able to be charged beyond these limits, due to the system control which is to prevent secondary reactions primarily.
5. Voltage Efficiency
To identify the various contributions to the energy losses in the system, the measured system energy efficiency was decoupled into its separate voltage and coulombic efficiencies. The voltage efficiency is defined here as the ratio of the average voltage output during discharge to that during the charge. Table 2 shows that the higher the power employed for charge/discharge, the lower the voltage efficiency.
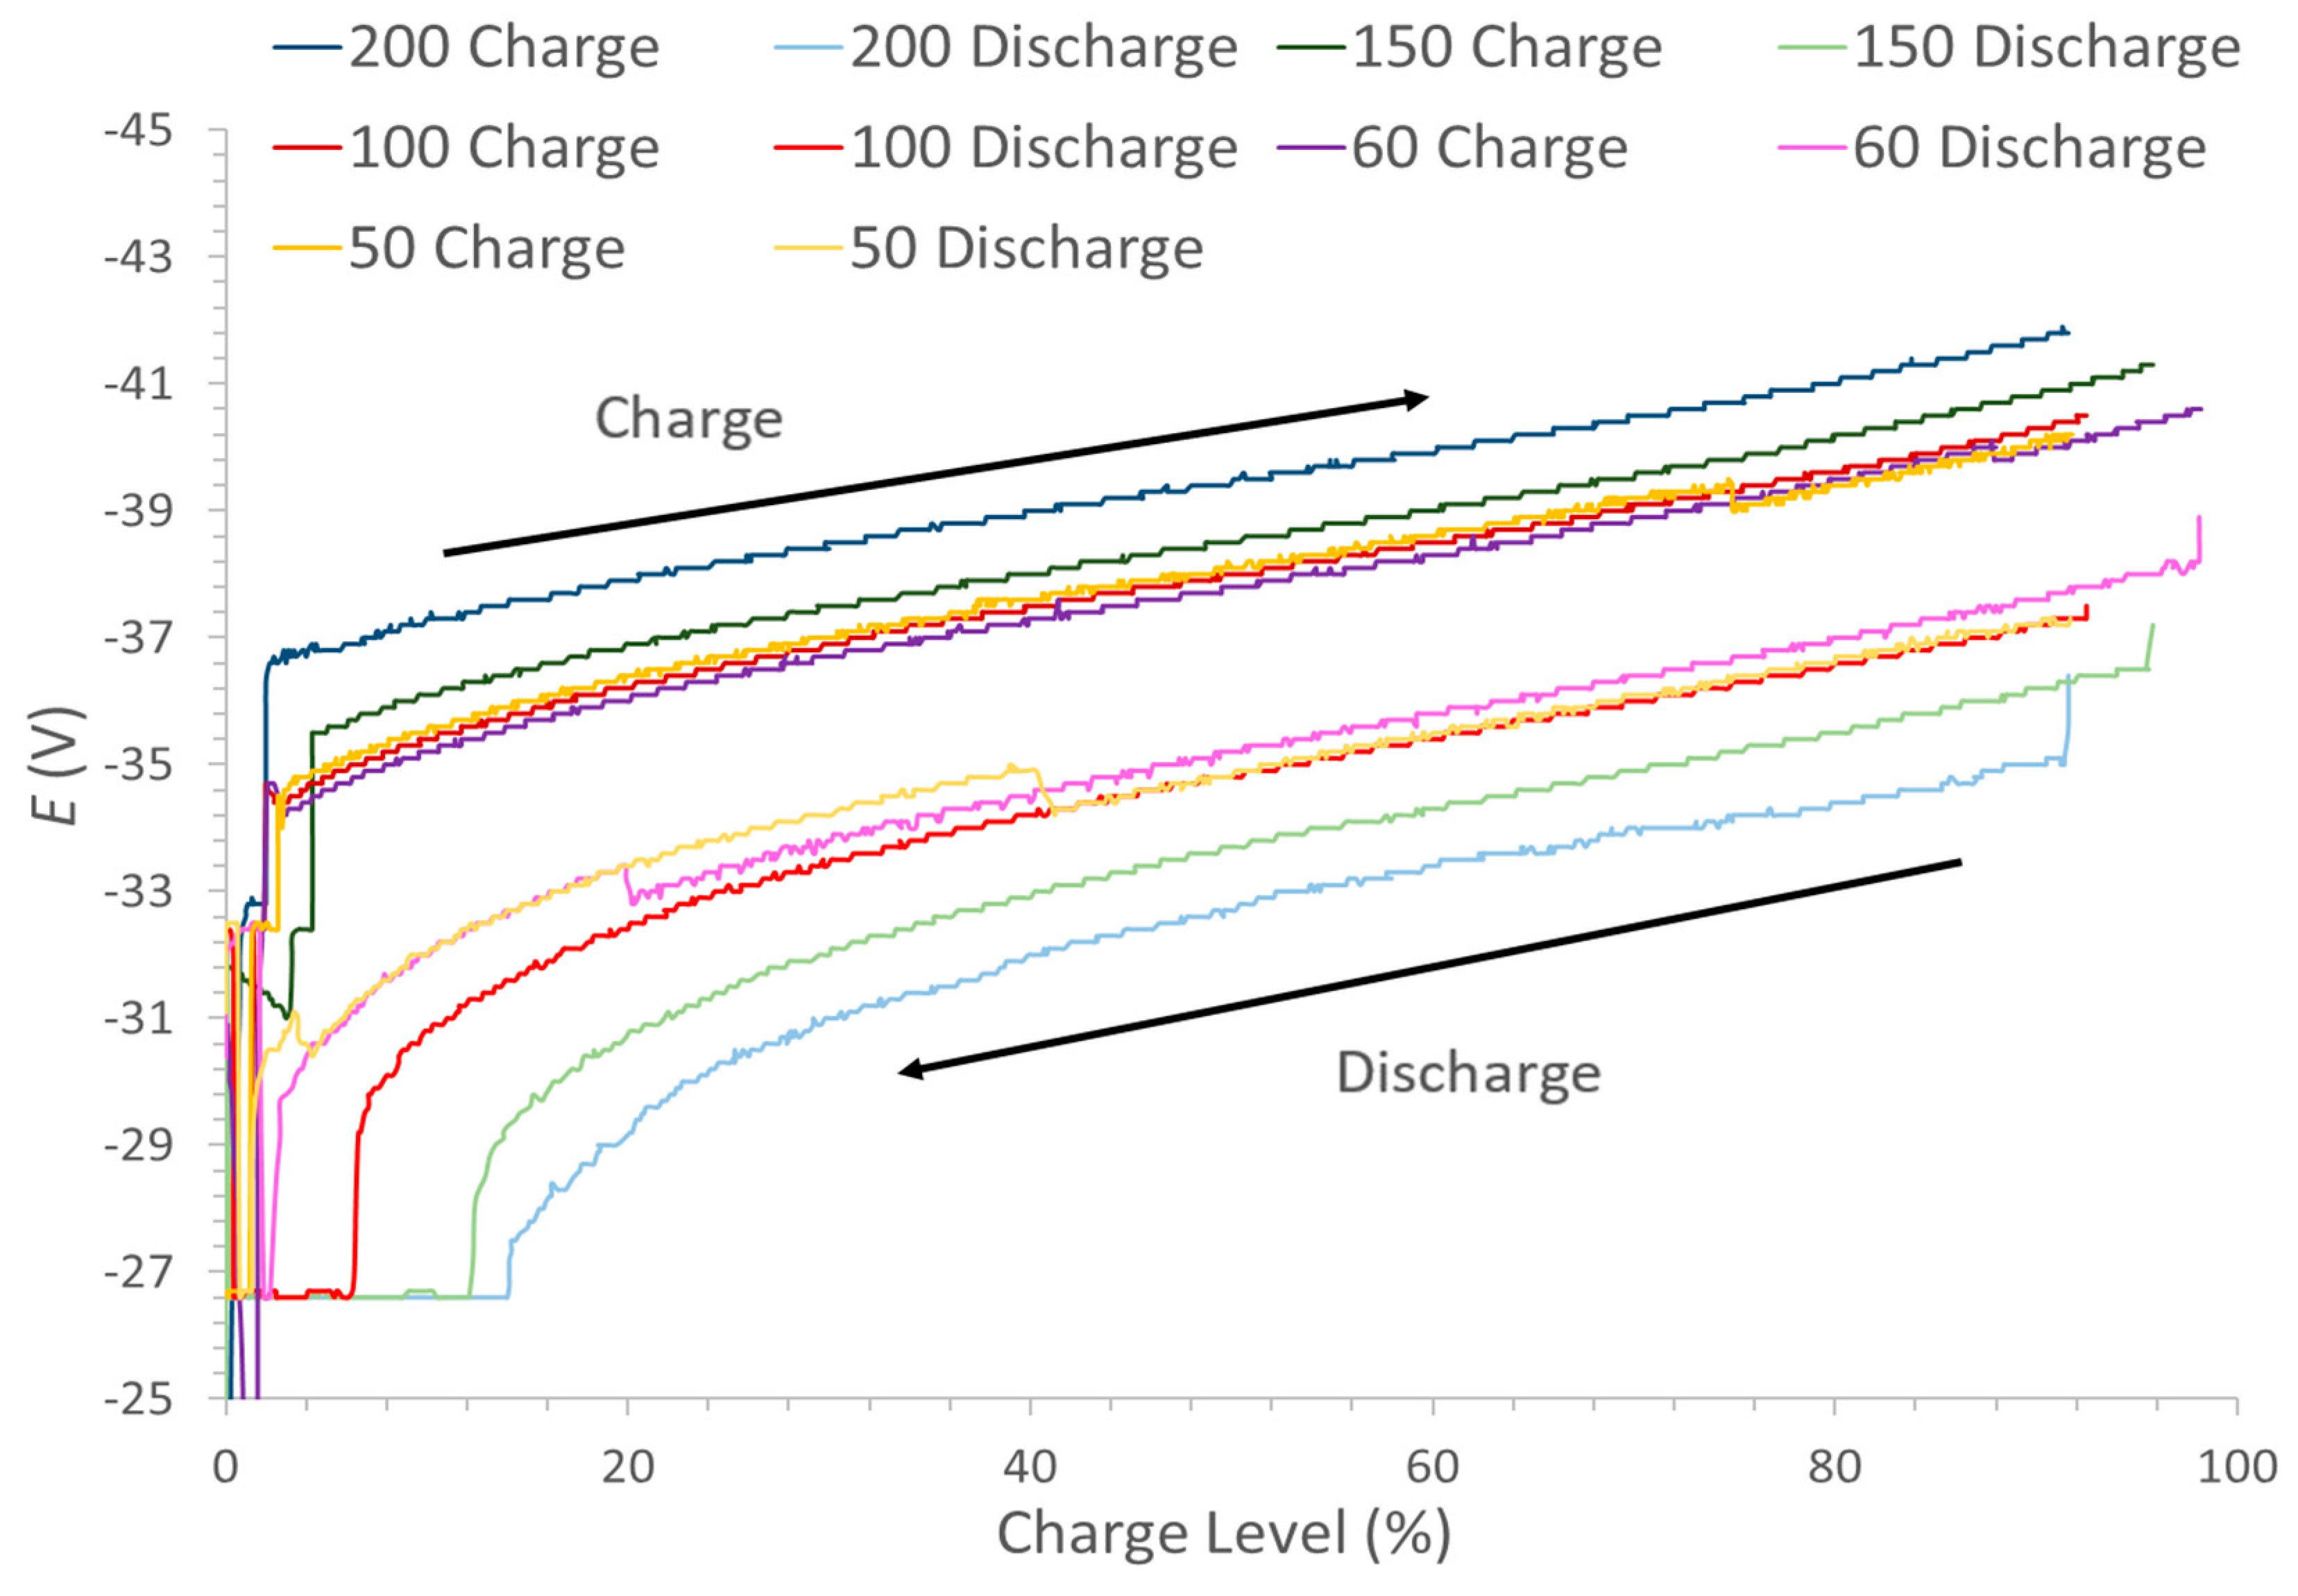
This trend partly comes from ohmic losses due to the internal resistances, viz. membrane and electrolyte and conducting bus bars between the stacks. Overpotential losses at the anode and cathode, associated with electron transfer processes at the electrode–electrolyte interfaces will also significantly contribute to the lowering of the voltage efficiency. As the power is increased, the ohmic losses also increase due to the higher current density (P = I2·R) and this impact on the stack voltage is shown in Figure 5. It can be seen from the figure that as expected, charge voltages for the stack were always higher than the corresponding discharge voltages at a given power. At the latter stages of the discharge, it can be noted that the voltage started to decrease rapidly, which is a consequence of mass transport polarisation, in not having enough reactants to sustain the reaction. It can be observed that on reaching the set voltage limit of −26.6 V on discharge (corresponding to the lower charge level limit set by the HMI), the rate of the discharge process was linearly decreased, as depicted in Figure 2. The voltage efficiency measured in this system was found to be in the range 80% to 93%.
6. Identification of the Energy Losses
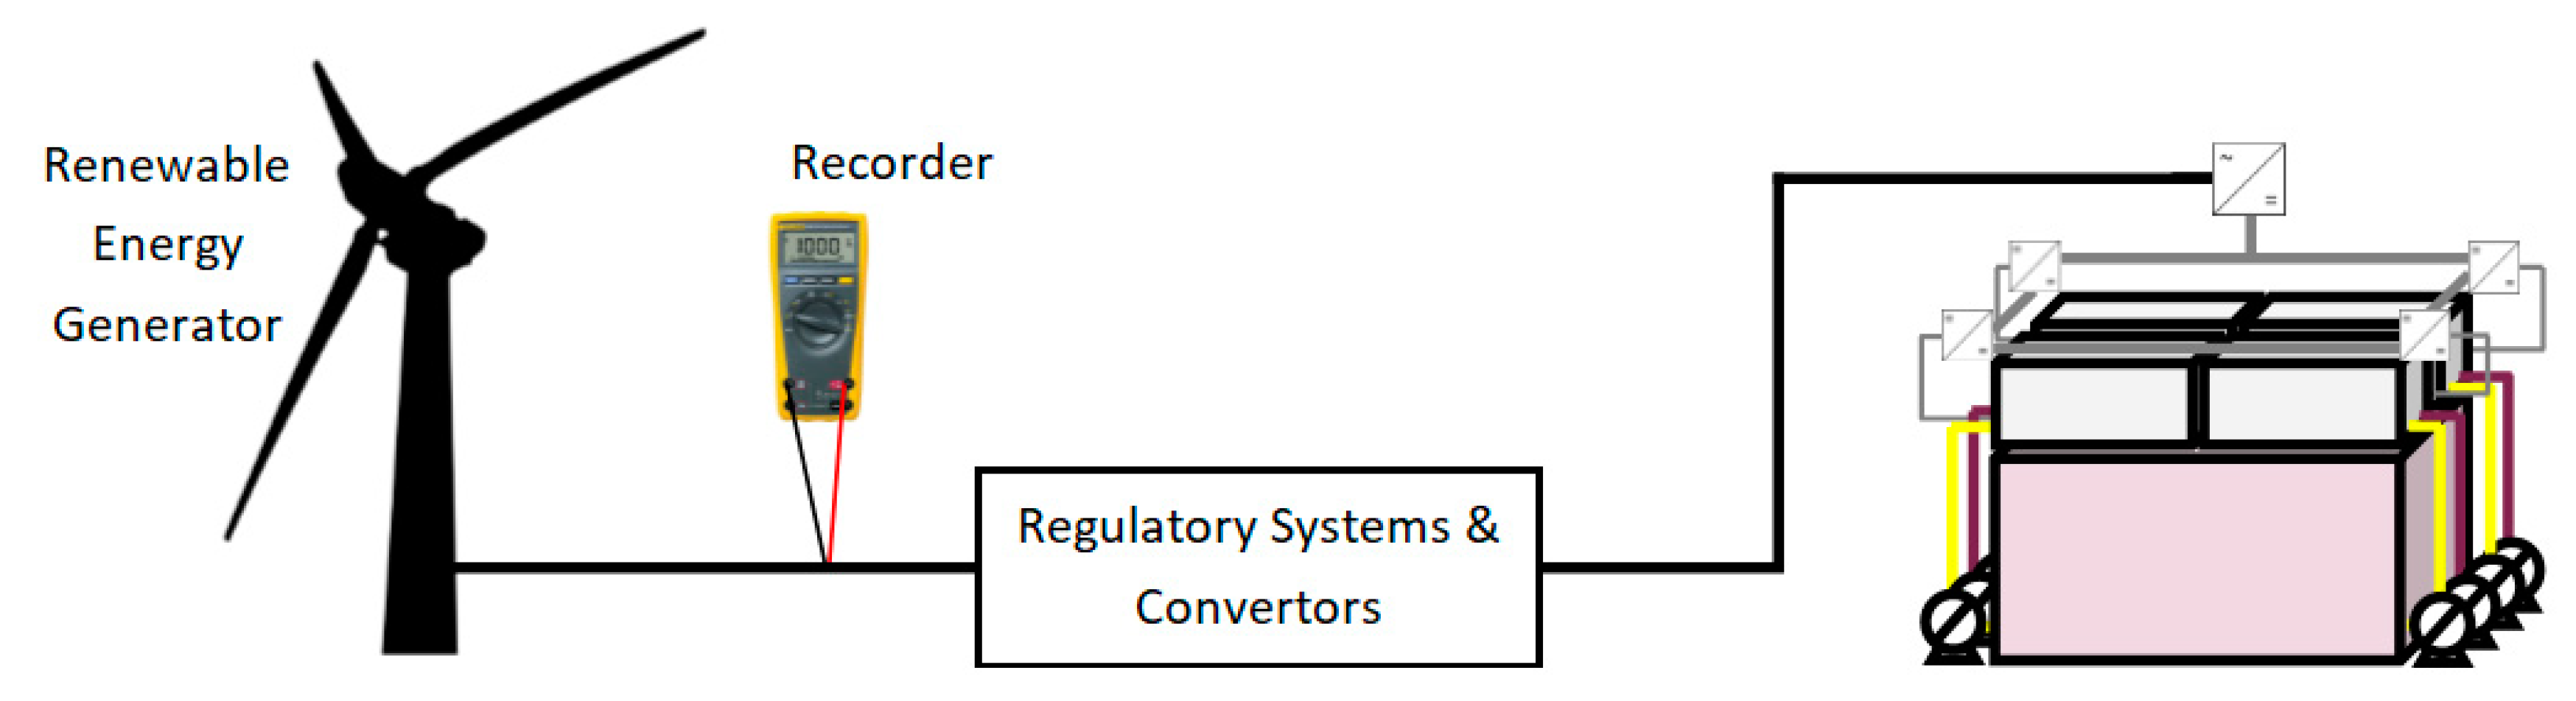
The overall system efficiency represented in Table 1 shows the system energy efficiency as measured on the AC electrical line. This efficiency includes all the energy consumed by regulatory systems, such as the centrifugal pumps used to circulate the positive and negative electrolytes through the four stacks; sensors used to monitor the temperature, measurement of the state of charge in the external cell, sensors for hydrogen monitoring and electrolyte leakages. Convertor losses between AC/DC links (at the same point as the regulatory systems) and DC/DC links (connected to each stack in the RFB) would also contribute to this low system efficiency as evaluated by the ACout/ACin recorder. An illustration for the setup is shown in Figure 6.
In view of the above, in order to determine the coulombic efficiencies, the method by which energy is stored and returned in this system must be considered in the following:
where ERec is the actual energy recorded, EReg is the energy required by the regulatory systems, and EConv is the energy loss from the convertors during the respective charge and discharge cycles. This expression allows for the energy efficiency of the battery, to be independently determined from that of the whole system. During charge, the convertor losses and the energy for the pumps could be subtracted from the total energy input to the system whereas, during discharge, these would be added on to the energy returned to the load. In this way, a more precise electrochemical energy efficiency could be calculated. However, it is to be noted that Equation (5) does not consider the additional auxiliary systems power requirements (e.g., for the sensors, cooling systems, recording apparatus, etc.) and so, the actual electrochemical current efficiency would still be higher than that evaluated here.
In the following sections, the losses from the AC/DC and DC/DC convertors and by the pumps are evaluated so as to allow the determination of the energy efficiency exclusively of the stacks.
7. Convertor Efficiencies
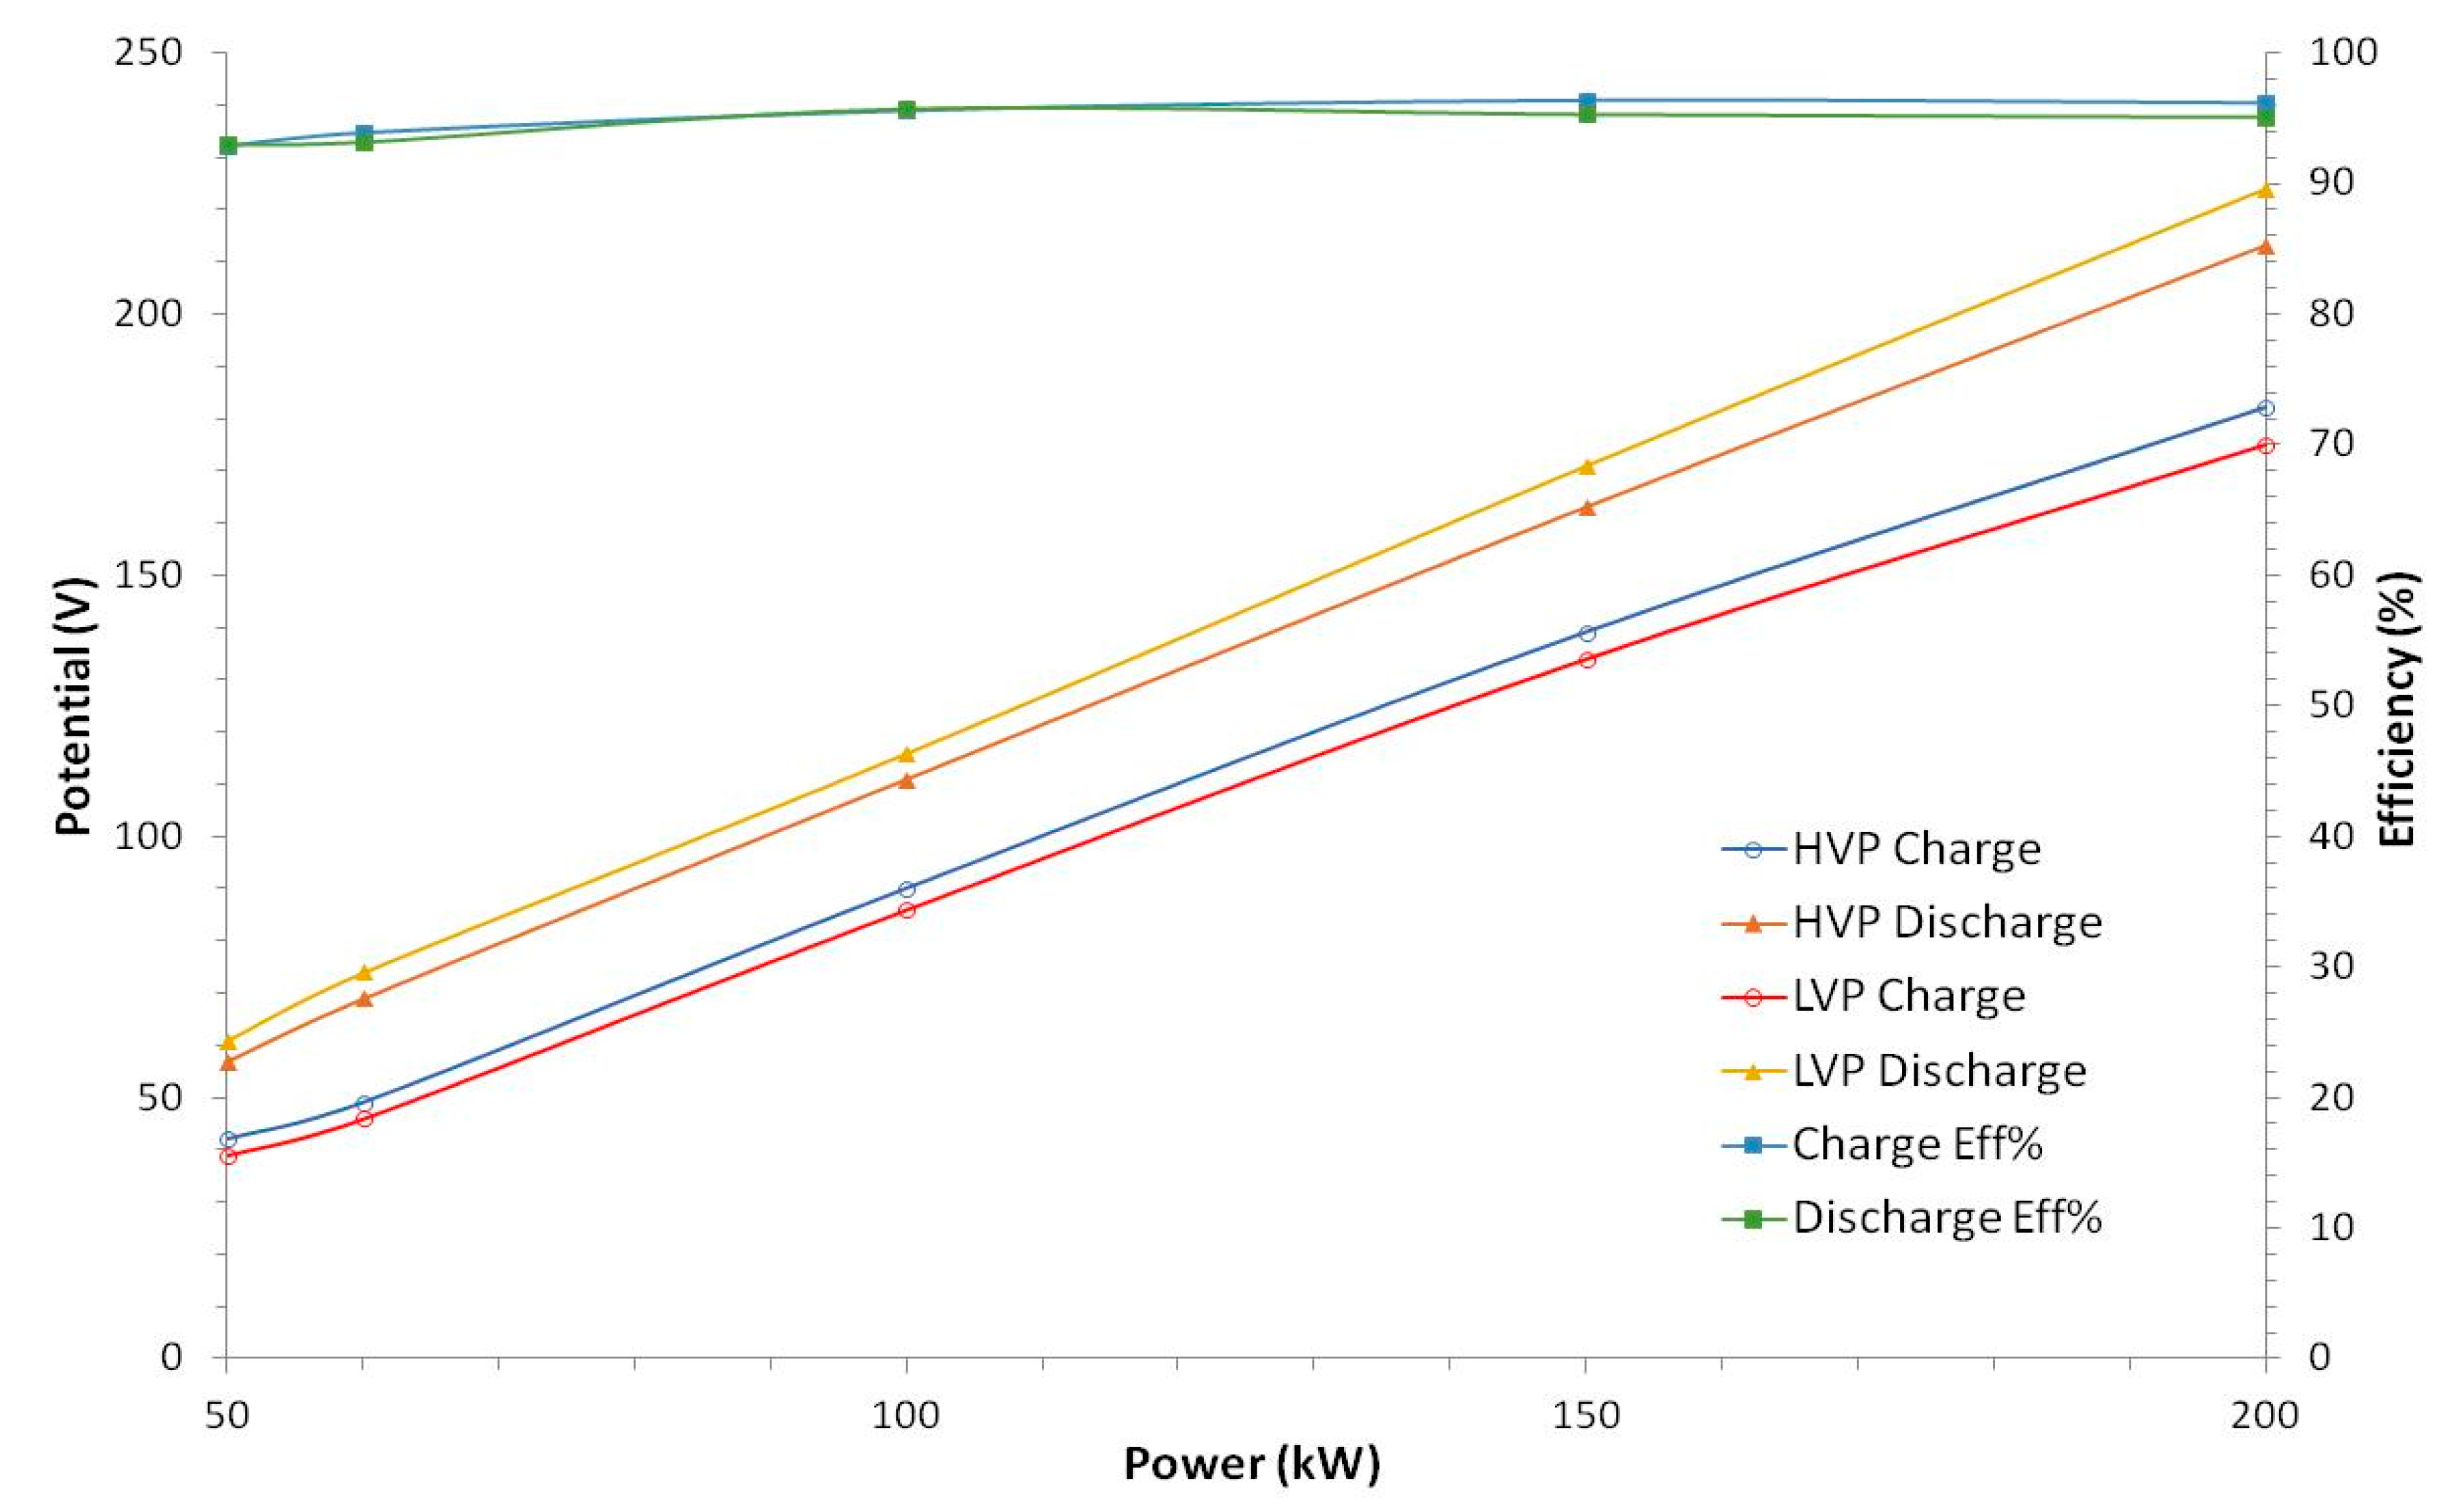
It is commonly observed that the AC/DC convertor presents larger losses than the DC/DC convertor [27]. However, in this system, the overall losses were found to be very similar, possibly due to the number of DC/DC convertors contained in the system. The measured DC/DC convertor losses could be as high as 7% with the higher values typically obtained on discharge, as indicated by the data in Figure 7. The low voltage potential (LVP) and high voltage potential (HVP) values recorded represent the potentials before and after the DC/DC convertors on the basis on measurements on 1 stack, respectively, with the ratio of low voltage to high voltage taken for charge and that of the high to low voltage for discharge.
Since the power to the regulatory systems also comes from the AC input power, the efficiencies are calculated using the values from Table 3 according to:
As Table 3 indicates, the AC/DC efficiency losses can be as high as up to 10% and the discharge losses are also typically less than the charge losses at given operating power.
8. Pump Energy Evaluation
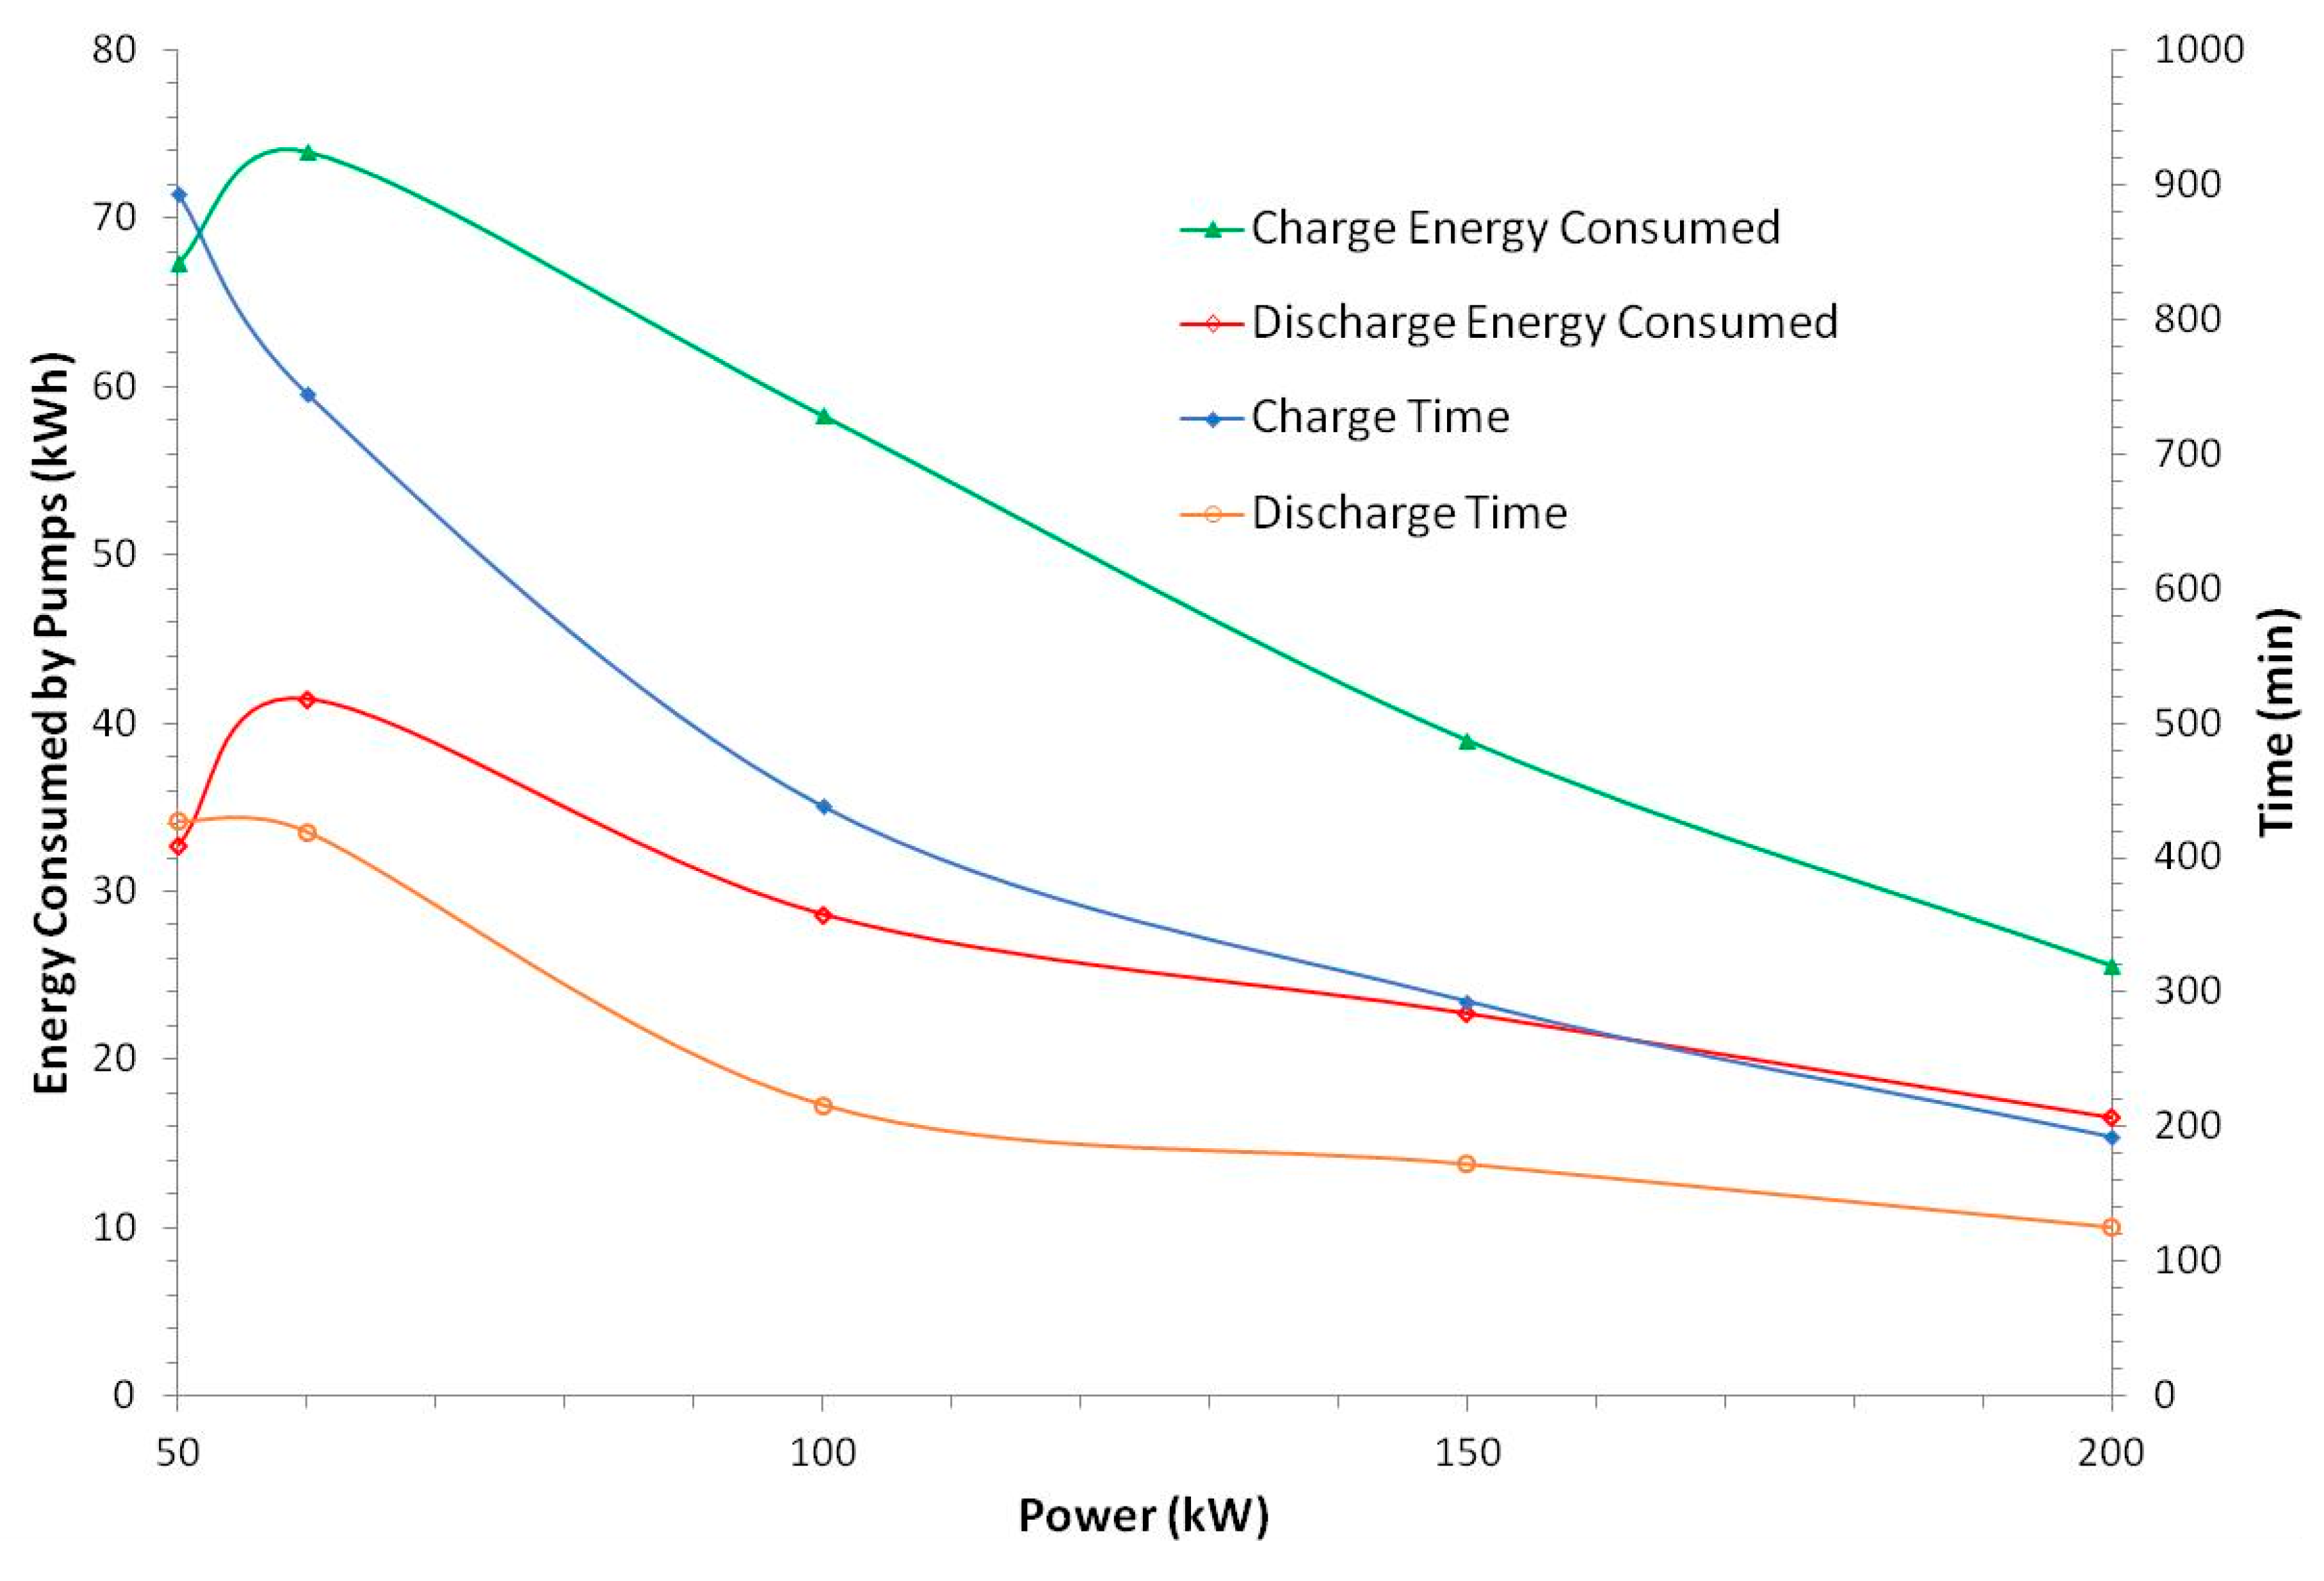
Since the programme and HMI used to control the battery did not record the power consumed by each pump during the charge/discharge cycles, the pump power was manually recorded for each stated charge/discharge power at three charge levels: 20%, 50% and 80%. The power consumed to the three indicated charge levels were then averaged and using the time of charge/discharge indicated in Table 1 to get to 100% charge level, the pumps’ energy requirements over the given charge/discharge cycle could be determined.
The data in Figure 8 shows that the amount of power used by the pumps was dependent on the number of stacks that were required to support a given cycle power rating. For instance, charge/discharge power between 100 kW and 200 kW consumed roughly 8 kW of pump power, whereas for charge/discharge power of <100 kW, only 4.5–6 kW was required. These values correlate well to the number of active stacks, since at 100–200 kW, four groups of stacks are utilised, whereas only three groups are required for the 60–100 kW range and only two groups for 50 kW. Furthermore, the lower the power rating employed for the charge/discharge cycles, the larger the contribution for the energy consumed by the pumps due to the prolonged operation required to achieve a set charge level. Figure 8 also indicates that the energy consumed at any set system power was greater during charge than on discharge. This is due to the charging cycle taking longer than the discharge cycle as although the power for the regulatory systems came from the AC mains during the charge cycle, the power for these systems during the discharge cycle came from the energy stored in the battery, which depleted the battery more quickly. However, the pump inefficiencies could come from the pumps operating out with their recommended specifications: as the differential head stated in the battery could have been much higher than the pumps stated capabilities.
9. Electrochemical Energy Efficiency and Coulombic Efficiency
As the energy consumption by the regulatory systems and losses from the convertors have been evaluated, the actual energy stored in the electrolytes could be determined, using the efficiency equation (Equation (5)). Table 4 compares the system energy efficiency (incorporating the losses from the pump energy consumptions and convertor losses) to the electrochemical energy efficiency. The coulombic efficiency in the table is determined from the voltage and electrochemical energy efficiencies and these yielded values between 73–97%, in line with reported data from literature and also from monitoring the open circuit voltage after the various charging/discharge regimes [28,29]. The 50 kW cycle provided the lowest coulombic efficiency (77%) whereas operation in the 60–200 kW power range gave on average ~90% coulombic efficiency.
10. Effect of the Electrolyte Temperature
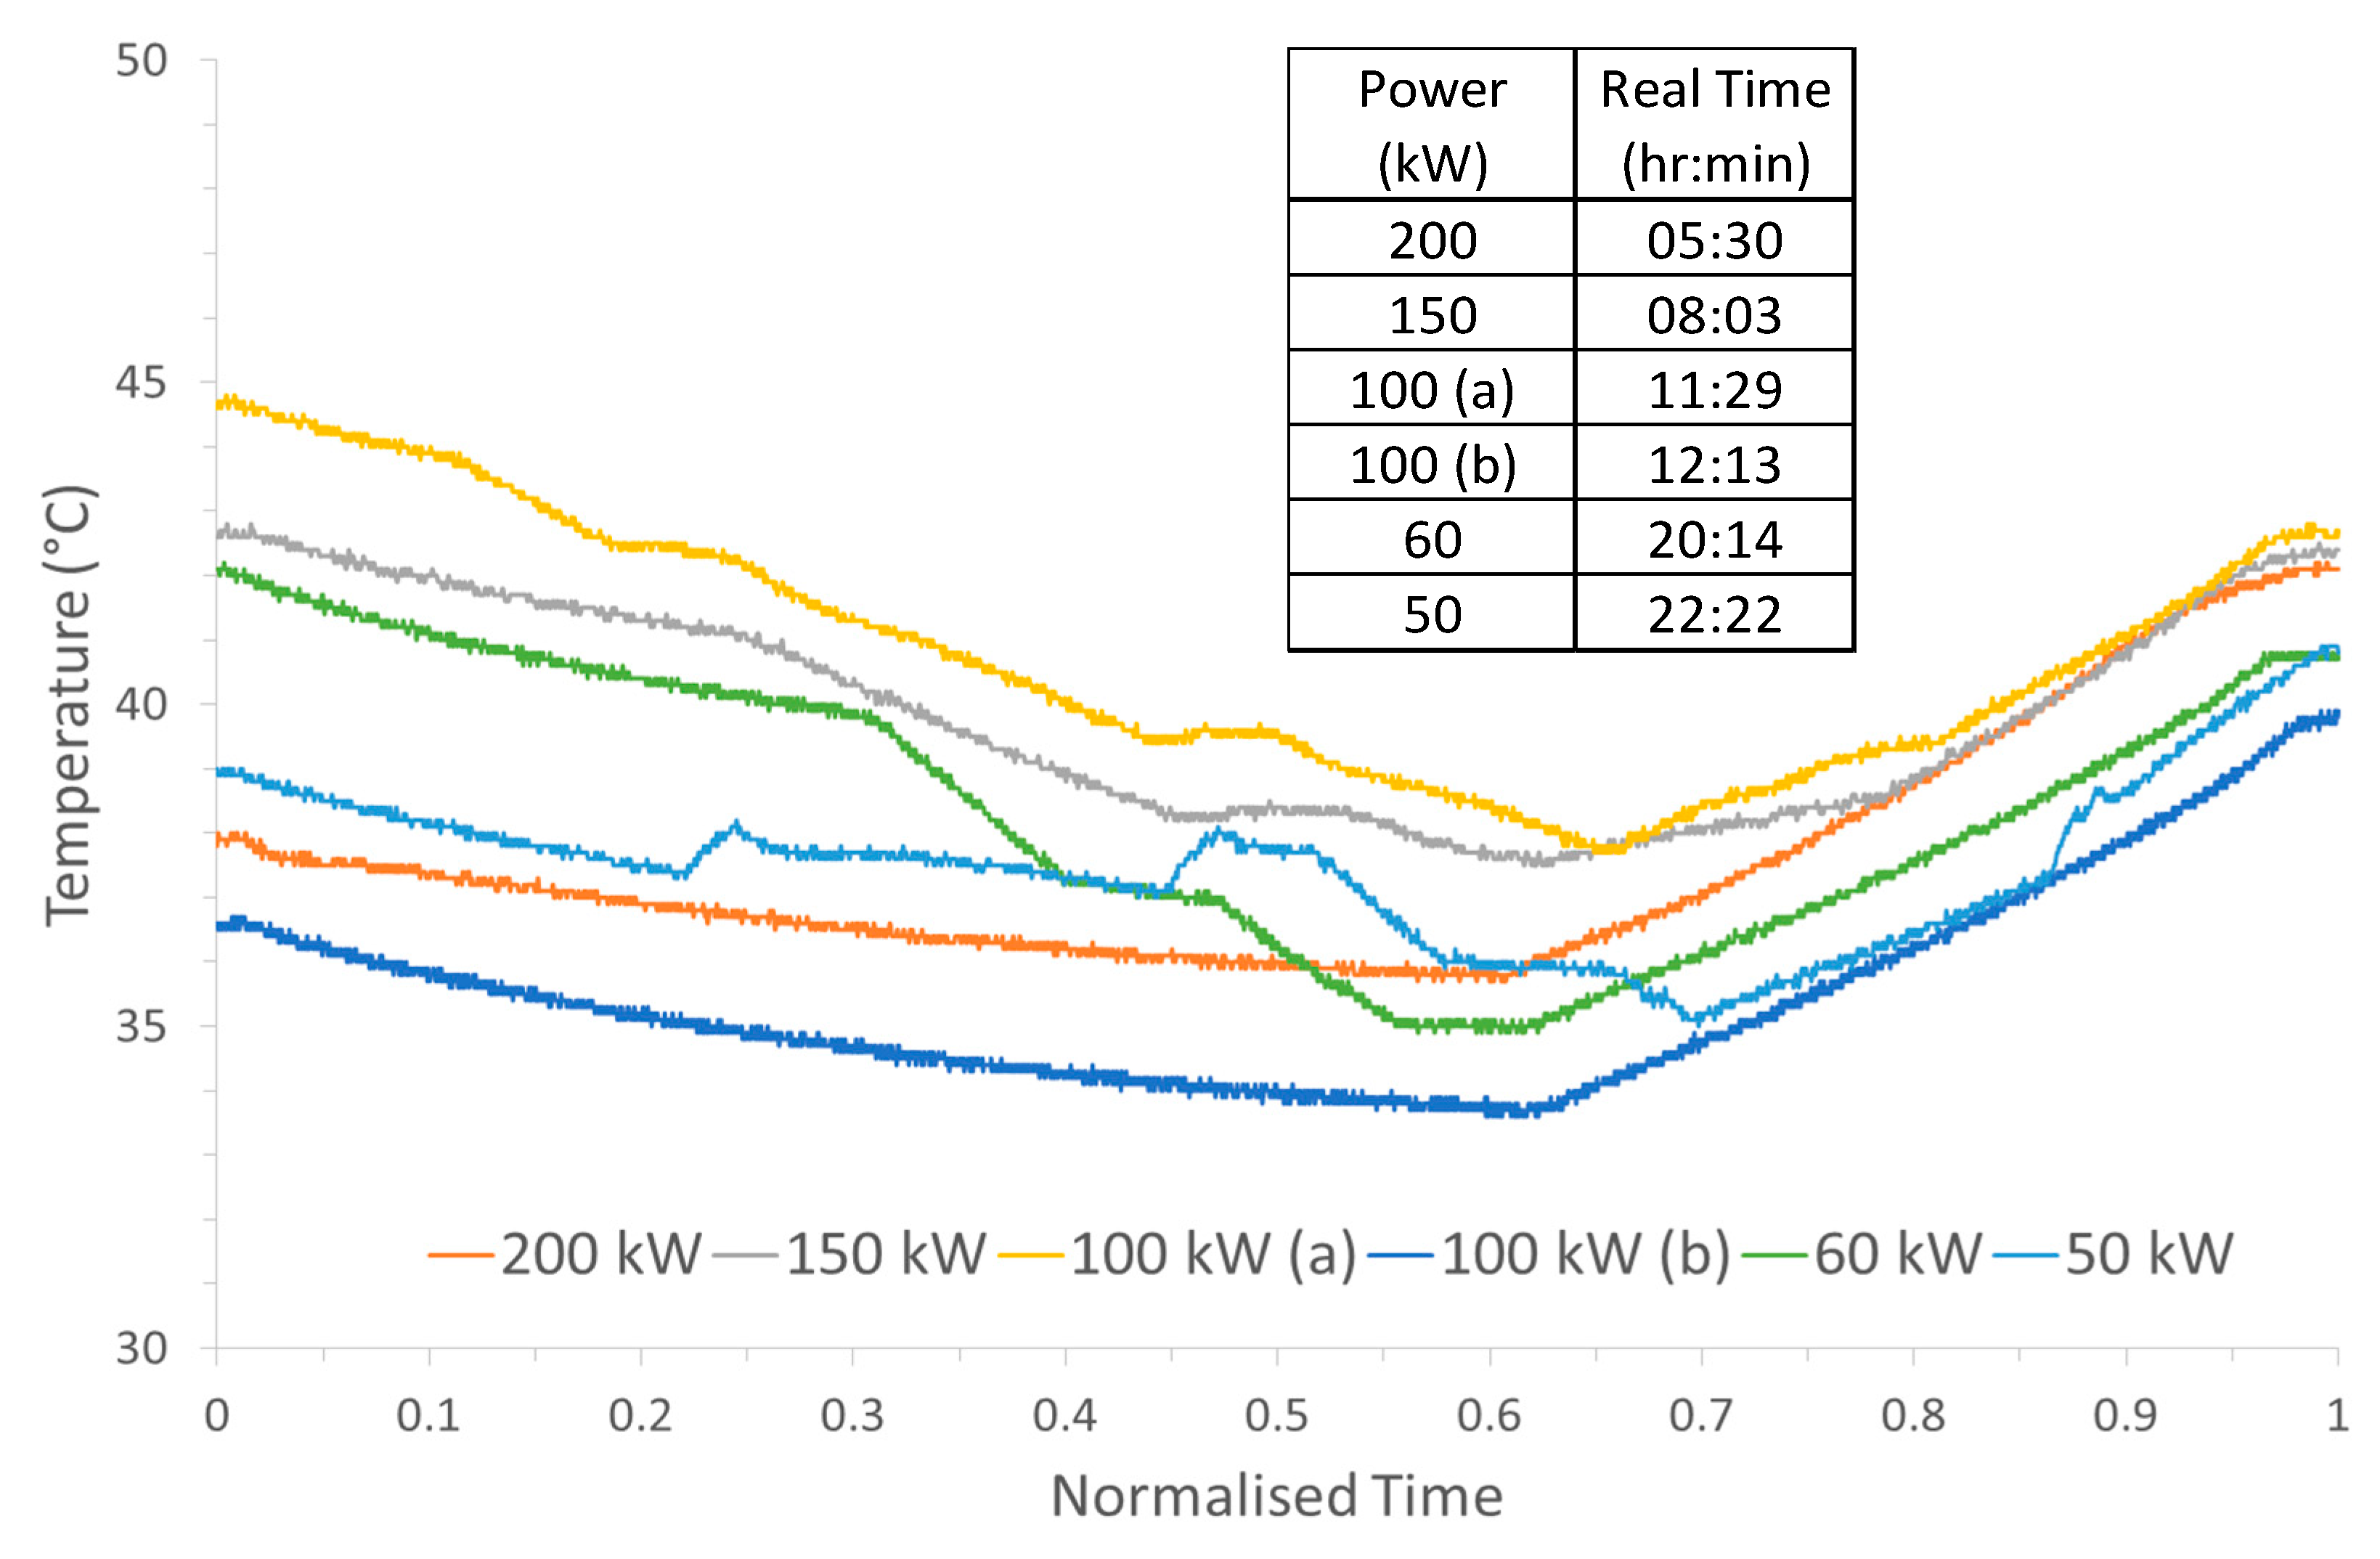
The overall system energy efficiency was also examined as a function of the average temperature of the electrolyte in both reservoirs. The cycles that exhibited the higher efficiencies were found to originate from runs where the electrolyte solution had low temperatures (<40 °C). Figure 9 shows the observed variation in temperature for the different charge/discharge cycles carried out at the different power settings. The general trend is that there is a drop in temperature as charging occurs, but during discharge, the temperature increases. The main contributions for these could be from the electrode overpotential requiring heat during the charge step, causing the decrease in temperature, whereas the increase in temperature is from the electrode overpotential generating this heat during the discharge step. This effect was utilised in D Reynard et al. study, where the temperature of the electrolyte was controlled to meet the thermal requirements at both charging and discharging steps to improve the efficiency of the VRFB system [30]. The data in Figure 9 show that for the cycles carried out at 200 kW and at 100 kW (b) had the lowest temperatures resulted in the highest energy efficiencies. However, the 60 kW cycle is the outlier to this trend as that power produced one of the highest electrochemical efficiencies, but also had one of the highest electrolyte temperatures. The step-like features during the charge at the lower input powers which results in an increase in temperatures is from the process which rebalances the electrolyte, as the mixing of the V2+/V3+ and V4+/V5+ results in a release of energy in the form of heat. The drops in temperature could be an effect of the change in the ambient temperature over the course of the charge/discharge cycles which ran through the day, evening and night. The temperature swing in Martigny, Switzerland, where the system is installed could be from 8 to 32 °C in July. Alternatively, these drops in temperature could be from the cooling control system operating when a specific value of charge level, or power applied, is reached at a certain temperature.
In addition, the drop in temperature could originate from the electrolyte retaining the elevated temperature from a previous discharge cycle and slowly returning to the ambient temperature.
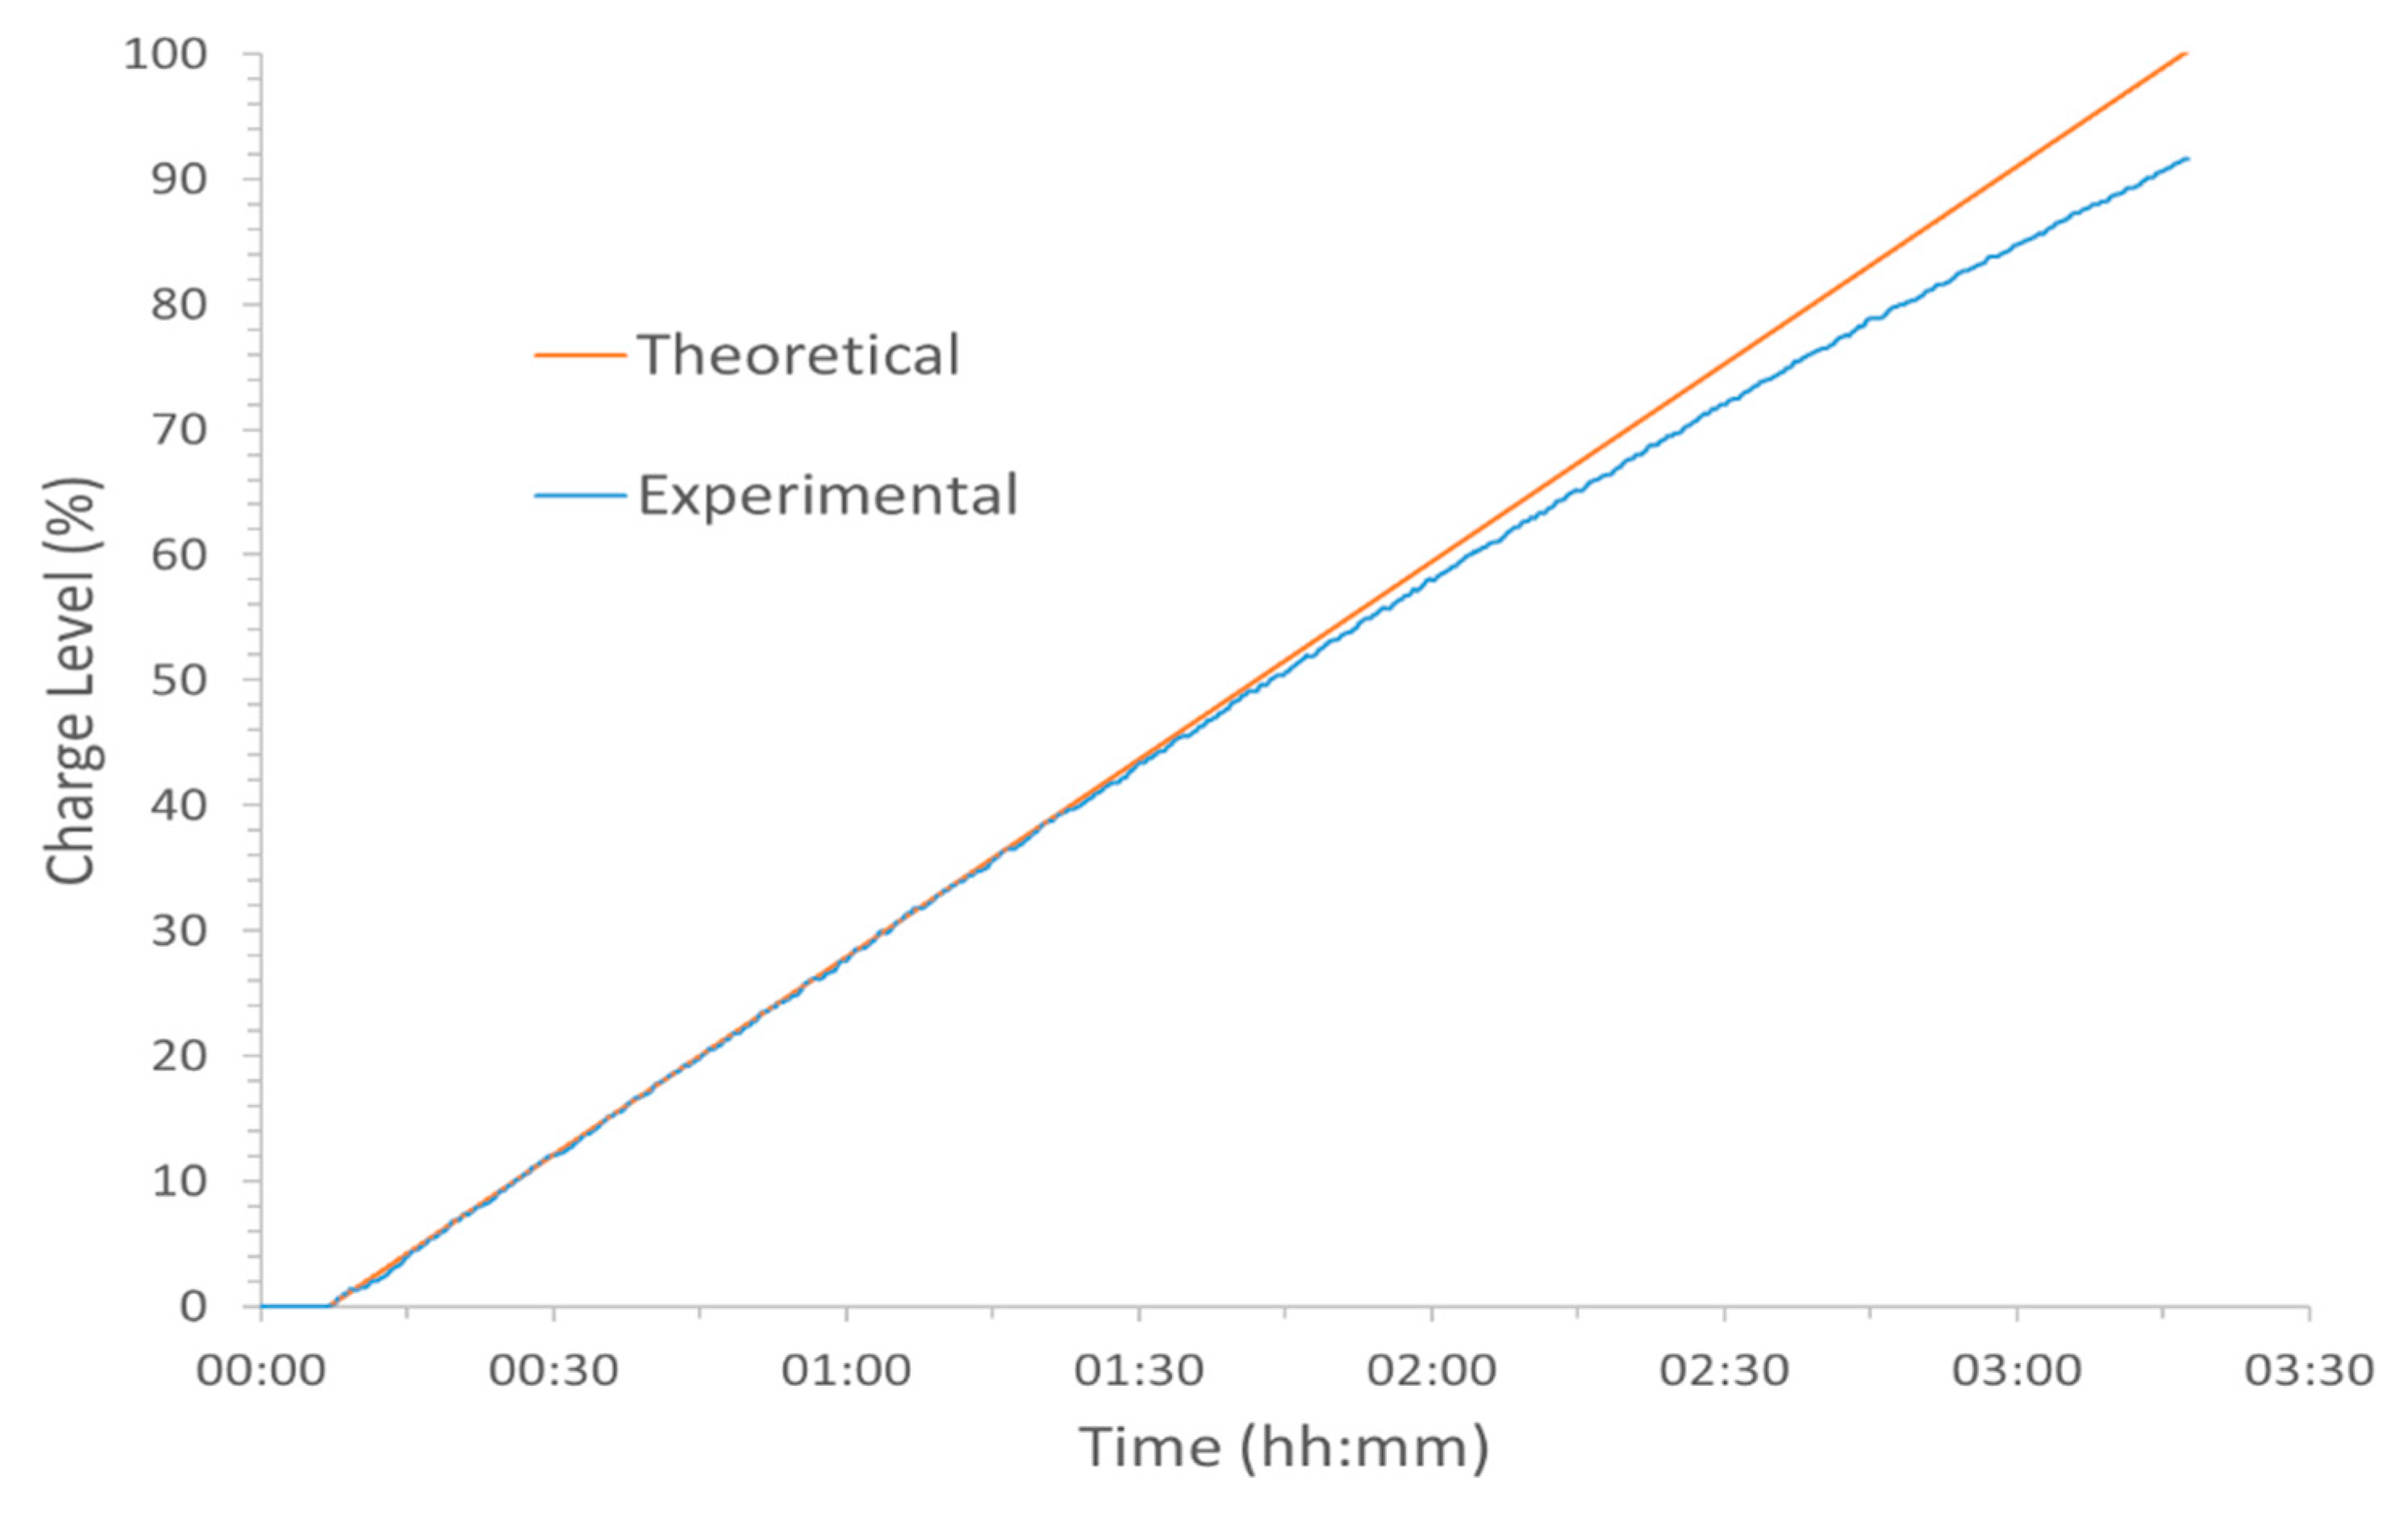
11. Charging Inefficiencies
It can be seen from Figure 10 that during charging, the rate of increase in the charge level deviates from the ideal theoretical line as the battery approaches 100% charge level. To assess the extent of this energy loss occurring (e.g., due to either side reactions, electrolyte rebalancing, or regulatory controls’ impact), the initial linear portion of the charge level at low values was extrapolated to create the trend the charge should follow if all the energy was used to charge the vanadium electrolyte. The equations for both lines were determined by linear regression and by integration, the respective areas under the curves were found. A limit of y = 100 was placed on the ideal curve and the difference between both curves allowed for energy used in the side reactions to be determined.
The extent of the energy consumed by side reactions correlates well with the performances of the battery. Examining the 100 kW (a) and 50 kW cycle, which lost the most energy to side reactions, these were also the cycles with the highest electrolyte temperatures, as indicated in Table 5. This suggests that the temperature increase from 37 ± 1 °C to 43 ± 1 °C could have provided a better environment for the hydrogen evolution reaction to occur as the soluble vanadium concentration on the positive side decreased due to precipitation of V2O5. This decreased the coulombic efficiency and with it, the performance of the battery. These losses could potentially be minimised with appropriate control on the electrolyte temperature. The loss of the input energy to these side reactions prolonged the charging of the battery to reach the set charge level limit, monitored through the OCV. This resulted in additional energy being consumed by the regulatory systems which further reduced the system’s overall efficiency.
12. Rate of Self-Discharge
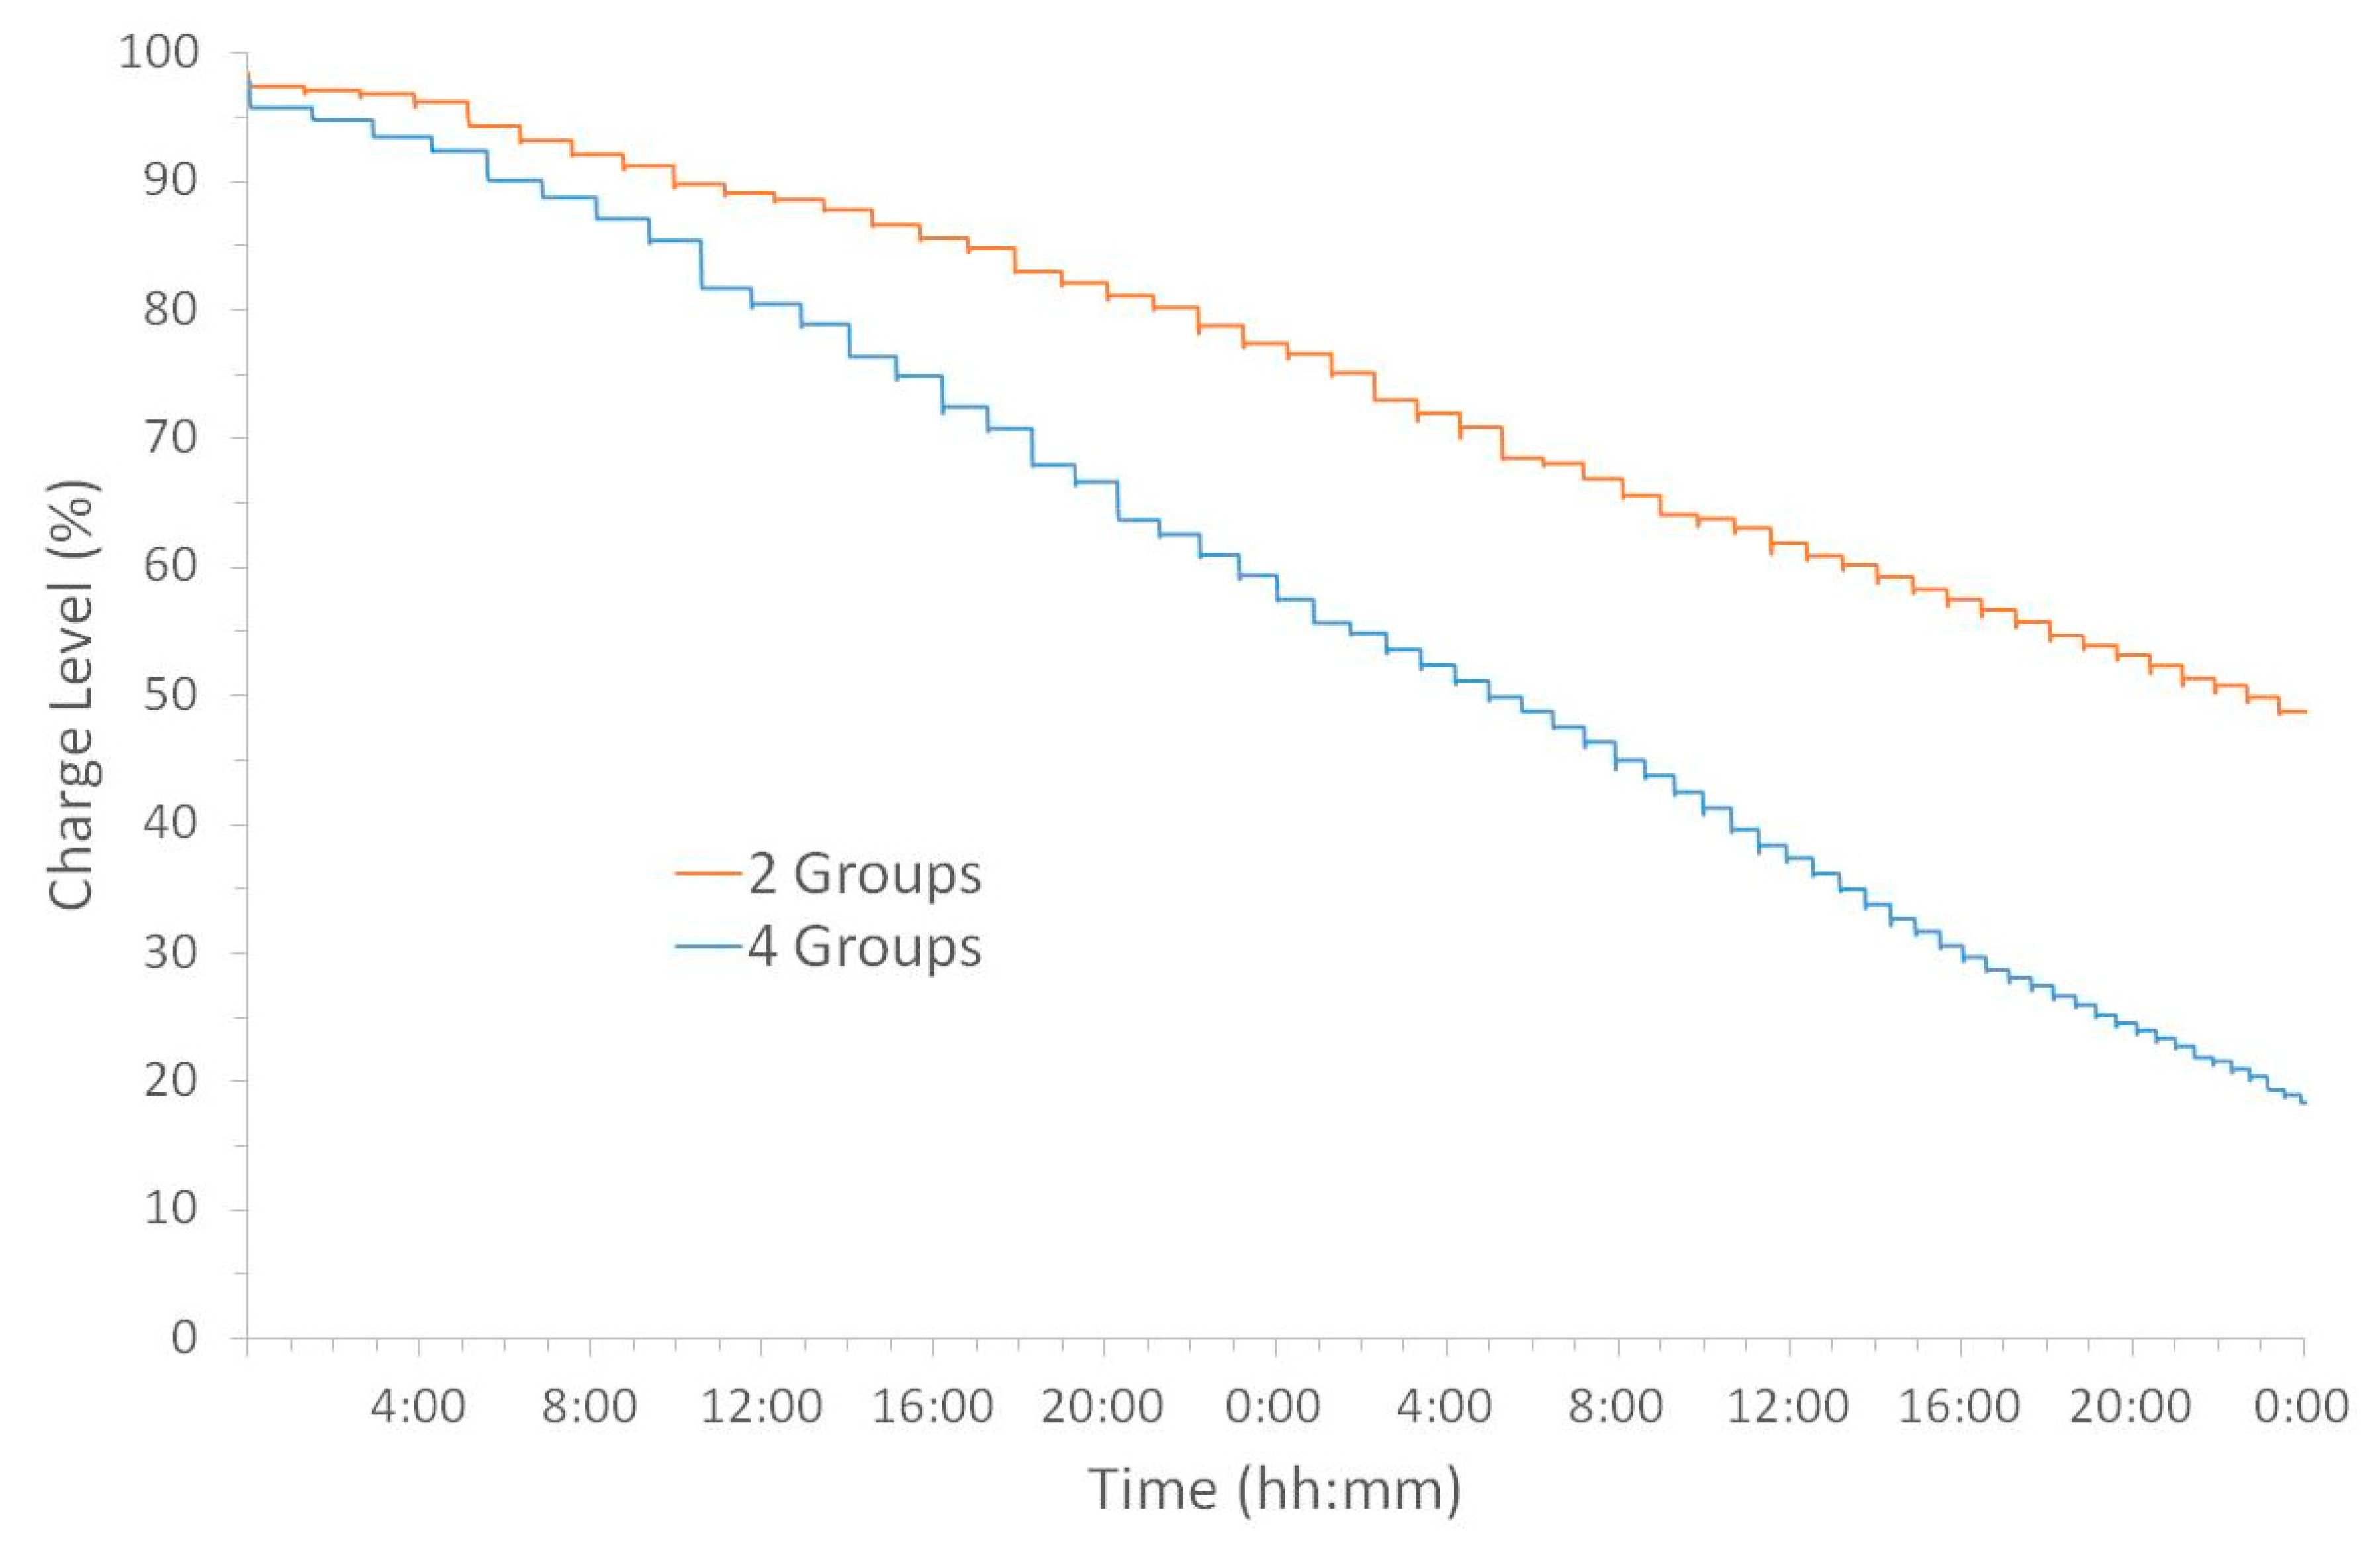
The final aspect of the flow battery operation examined was the rate of self-discharge. In order to improve the stacks’ response time to satisfy the energy demand, these stacks were kept prepared for imminent discharge by periodically flowing electrolyte through them. However, in doing so, the system also loses a small amount of stored chemical energy in the form of vanadium crossover as well as energy consumed by the pumps. The standard operating procedure was that one group of stacks was kept in this constant standby mode by regular pulses (duration = 300 s) of fresh electrolytes through that group. However, to quantify the extent of self-discharge, two separate experiments were conducted in which four and then two groups of stacks were kept active while the AC applied power was set to 0 kW. From Figure 11, these electrolyte pulses can be clearly observed as steps during the standby mode of the battery, overlaid on the gradual fall in the overall charge level. As expected the more groups of stacks that were active, the faster the rate of self-discharge. In the experiment using four groups almost 80% of the charge was lost in 48 h compared to only 45% from the experiment with two stacks in standby. This was in line with the expectation that the level of discharge in the two stack groups would be approximately half that of the four active stack groups.
13. Conclusions
The characterisation of the 200 kW/400 kWh flow battery system revealed that it had an overall system AC efficiency varying between 48% and 60% over the AC power range of 50–200 kW. However, analysis of the data showed that this low system efficiency largely originated from the regulatory procedures (including the centrifugal pumps, sensors and cooling system) as well as the AC/DC and DC/DC convertor losses which combined to contribute up to 24% of the system energy consumption. From the electrochemical characteristics of the battery, the voltage efficiency and coulombic efficiencies were evaluated and were found to be in the range of 80–93% and 73–97% respectively, to give an electrochemical energy efficiency range between 65% and 90%. The coulombic and voltage efficiencies are in good agreement with the values found in the literature for laboratory scale systems. The main source of electrochemical energy loss for this battery originated from the energy consumed during the charge cycle with the temperature of the electrolyte playing a large role in this. This energy loss could be prevented by monitoring the electrolyte temperature and operating the charge cycle when the temperature was below 40 °C.
The purpose of this work was to analyse and characterise the 200 kW/400 kWh VRFB and determine whether it would be possible to ascertain the most appropriate application for this energy storage system at the facility in Martigny, Switzerland. This energy storage system would be suitable for either intermittent energy storage or as a cheaper, back-up power source for the 50 kW alkaline electrolyser or the 50 kW electric vehicle recharging application.
Author Contributions
D.B. carried out all the measurements and subsequent data analyses and prepared the manuscript. V.A. directly supervised in data acquisition and analyses and assisted in the editing of the manuscript for submission. H.H.G. was responsible for the overall project and facilities at Martigny and assisted in the editing of the manuscript for submission. L.E.A.B. helped in obtaining the funding to support this project and assisted in the data analyses, preparation and editing of the manuscript for submission.
Funding
This research was funded by Energy Technology Partnership (ETP) Postgraduate & Early Career Exchange (PECRE) grant number [PECRE13] And OFEN, the Office fédéral de l’énergie (Switzerland).
Acknowledgments
One of the authors (D.B.) would like to extend his gratitude to the Energy Technology Partnership for the PECRE grant award to finance the travel and accommodation to Switzerland to undertake this work. The University of Strathclyde and École Polytechnique Fédérale de Lausanne—Laboratory of Physical and Analytical Electrochemistry (EPFL—LEPA) for supporting the application for the exchange. Furthermore, authors (H.H.G. and V.A.) would like to acknowledge OFEN, the Swiss Federal Office for Energy, for their financial support in the setup of the demonstration equipment at the facility in Martigny, Switzerland. In addition, Heron Vrubel, project and demonstration site manager for the facility, for his technical support in the data acquisition from the VRFB. As well as, Christopher Dennison, Alberto Battistel, Yorick Ligen, and Patricia Byron-Exarcos, for their support during and after this project’s duration.
Conflicts of Interest
The authors declare no conflict of interest.
References
- Yang, Z.; Zhang, J.; Kintner-Meyer, M.C.W.; Lu, X.; Choi, D.; Lemmon, J.P.; Liu, J. Electrochemical energy storage for green grid. J. Chem. Rev. 2011, 111, 3577–3613. [Google Scholar] [CrossRef] [PubMed]
- Amstutz, V.; Toghill, K.E.; Powlesland, F.; Vrubel, H.; Comninellis, C.; Hu, X.; Girault, H.H. Renewable hydrogen generation from a dual-circuit redox flow battery. Energy Environ. Sci. 2014, 7, 2350–2358. [Google Scholar] [CrossRef] [Green Version]
- Huskinson, B.; Marshak, M.P.; Suh, C.; Er, S.; Gerhardt, M.R.; Galvin, C.J.; Chen, X.; Aspuru-Guzik, A.; Gordon, R.G.; Aziz, M.J. A metal-free organic-inorganic aqueous flow battery. Nature 2014, 505, 195–198. [Google Scholar] [CrossRef] [PubMed] [Green Version]
- Sezer, H.; Aygun, M.; Mason, J.H.; Baran, E.; Celik, I. A computational model for sodium sulfur battery analysis. ECS Trans. 2015, 69, 91–100. [Google Scholar] [CrossRef]
- Peng, P.; Jiang, F. Thermal safety of lithium-ion batteries with various cathode materials: A numerical study. Int. J. Heat Mass Transf. 2016, 103, 1008–1016. [Google Scholar] [CrossRef]
- Skyllas-Kazacos, M.; Chakrabarti, M.H.; Hajimolana, S.A.; Mjalli, F.S.; Saleem, M. Progress in flow battery research and development. J. Electrochem. Soc. 2011, 158, R55. [Google Scholar] [CrossRef]
- Repp, S.; Harputlu, E.; Gurgen, S.; Castellano, M.; Kremer, N.; Pompe, N.; Wörner, J.; Hoffmann, A.; Thomann, R.; Emen, F.M.; et al. Synergetic effects of Fe3+ doped spinel Li4Ti5O12 nanoparticles on reduced graphene oxide for high surface electrode hybrid supercapacitors. Nanoscale 2018, 10, 1877–1884. [Google Scholar] [CrossRef] [PubMed]
- Kurzweil, P.; Shamonin, M. State-of-charge monitoring by impedance spectroscopy during long-term self-discharge of supercapacitors and Lithium-Ion batteries. Batteries 2018, 4, 35. [Google Scholar] [CrossRef]
- Garcia, J.; Garcia, P.; Capponi, F.G.; de Donato, G. Analysis, modeling, and control of half-bridge current-source converter for energy management of supercapacitor modules in traction applications. Energies 2018, 11, 2239. [Google Scholar] [CrossRef]
- Rahman, F.; Skyllas-Kazacos, M. Vanadium redox battery: Positive half-cell electrolyte studies. J. Power Sources 2009, 189, 1212–1219. [Google Scholar] [CrossRef]
- Weber, A.Z.; Mench, M.M.; Meyers, J.P.; Ross, P.N.; Gostick, J.T.; Liu, Q. Redox flow batteries: A review. J. Appl. Electrochem. 2011, 41, 1137–1164. [Google Scholar] [CrossRef]
- Roe, S.; Menictas, C.; Skyllas-Kazacos, M. A high energy density vanadium redox flow battery with 3 M vanadium electrolyte. J. Electrochem. Soc. 2016, 163, A5023–A5028. [Google Scholar] [CrossRef]
- Bryans, D.; McMillan, B.G.; Spicer, M.; Wark, A.; Berlouis, L. Complexing additives to reduce the immiscible phase formed in the hybrid ZnBr2 flow battery. J. Electrochem. Soc. 2017, 164, A3342–A3348. [Google Scholar] [CrossRef]
- Wu, M.C.; Zhao, T.S.; Jiang, H.R.; Zeng, Y.K.; Ren, Y.X. High-performance zinc bromine flow battery via improved design of electrolyte and electrode. J. Power Sources 2017, 355, 62–68. [Google Scholar] [CrossRef]
- Armstrong, C.G.; Toghill, K.E. Stability of molecular radicals in organic non-aqueous redox flow batteries: A mini review. Electrochem. Commun. 2018, 91, 19–24. [Google Scholar] [CrossRef]
- Rychcik, M.; Skyllas-Kazacos, M. Characteristics of a new all-vanadium redox flow battery. J. Power Sources 1988, 22, 59–67. [Google Scholar] [CrossRef]
- Kazacos, M.S.; Kazacos, G. Recent advances with UNSW vanadium-based redox flow batteries. J. Energy 2010, 34, 182–189. [Google Scholar]
- Ding, C.; Zhang, H.; Li, X.; Liu, T.; Xing, F. Vanadium flow battery for energy storage: prospects and challenges. J. Phys. Chem. Lett. 2013, 4, 1281–1294. [Google Scholar] [CrossRef] [PubMed]
- Energy Strategy 2050. Available online: http://www.bfe.admin.ch/energiestrategie2050/06445/index.html?lang=en (accessed on 2 September 2017).
- Wind Energy Plants. Available online: http://www.uvek-gis.admin.ch/BFE/storymaps/EE_WEA/index.php?lang=en (accessed on 2 September 2017).
- Swissinfo.ch, Swiss Solar. Available online: https://www.swissinfo.ch/eng/green-energy_a-place-in-the-sun-for-swiss-solar-power/38103970 (accessed on 8 September 2017).
- Lund, H. Renewable energy strategies for sustainable development. Energy 2007, 32, 912–919. [Google Scholar] [CrossRef] [Green Version]
- Zhao, H.; Wu, Q.; Hu, S.; Xu, H.; Rasmussen, C.N. Review of energy storage system for wind power integration support. Appl. Energy 2014, 137, 545–553. [Google Scholar] [CrossRef]
- EPFL-LEPA. Charging an Electric Car. Available online: https://actu.epfl.ch/news/charging-an-electric-car-as-fast-as-filling-a-tank/ (accessed on 3 September 2017).
- EPFL-LEPA. Future Fuelling Station. Available online: https://actu.epfl.ch/news/epfl-inaugurates-the-fueling-station-of-the-future/ (accessed on 3 September 2017).
- Carbon, S. EC-GFD-46EA Sigracell Graphite Felt. Available online: http://fuelcell.com/product/ec-gfd-46ea-sigracell-graphite-felt/ (accessed on 19 July 2016).
- Starke, M.; Tolbert, L.M.; Ozpineci, B. AC vs. DC distribution: A loss comparison. In Proceedings of the Transmission and Distribution Exposition Conference: 2008 IEEE PES Powering Toward the Future, Chicago, IL, USA, 21–24 April 2018. [Google Scholar] [CrossRef]
- Leung, P.; Li, X.; de León, C.P.; Berlouis, L.; Low, C.T.J.; Walsh, F.C. Progress in redox flow batteries, remaining challenges and their applications in energy storage. RSC Adv. 2012, 2, 10125. [Google Scholar] [CrossRef]
- Soloveichik, G.L. Flow batteries: Current status and trends. Chem. Rev. 2015, 115, 11533–11558. [Google Scholar] [CrossRef] [PubMed]
- Reynard, D.; Dennison, C.R.; Battistel, A.; Girault, H.H. Efficiency improvement of an all-vanadium redox flow battery by harvesting low-grade heat. J. Power Sources 2018, 390, 30–37. [Google Scholar] [CrossRef] [Green Version]
Figure 1.
(A) Simple representation of the 200 kW/400 kWh vanadium redox flow battery (RFB) showing the four stacks and electrolyte tanks; (B) Schematic of the bipolar plates used in the RFB stacks.
Figure 1.
(A) Simple representation of the 200 kW/400 kWh vanadium redox flow battery (RFB) showing the four stacks and electrolyte tanks; (B) Schematic of the bipolar plates used in the RFB stacks.
Figure 2.
Power profiles on (A) charging and (B) discharging across the charge levels 0–100% at 200 kW power.
Figure 2.
Power profiles on (A) charging and (B) discharging across the charge levels 0–100% at 200 kW power.
Figure 3.
Active power and charge level for a charge and discharge cycle at 200 kW.
Figure 4.
Relationship between the open circuit voltage (OCV) for one stack and the battery state of charge.
Figure 4.
Relationship between the open circuit voltage (OCV) for one stack and the battery state of charge.
Figure 5.
Voltage from one of the battery stacks at various constant power levels for charge and discharge.
Figure 5.
Voltage from one of the battery stacks at various constant power levels for charge and discharge.
Figure 6.
Placement of the data recorder on the AC line between the battery and power source.
Figure 7.
High voltage potential (HVP) and low voltage potential (LVP) values and DC/DC conversion efficiencies as a function of operating power.
Figure 7.
High voltage potential (HVP) and low voltage potential (LVP) values and DC/DC conversion efficiencies as a function of operating power.
Figure 8.
Pump energy consumption and operating periods for all power levels used for charge and discharge.
Figure 8.
Pump energy consumption and operating periods for all power levels used for charge and discharge.
Figure 9.
Temperature profiles for each charge/discharge cycle at different power levels under a normalised time for direct comparison. Actual times shown in insert.
Figure 9.
Temperature profiles for each charge/discharge cycle at different power levels under a normalised time for direct comparison. Actual times shown in insert.
Figure 10.
Predicted theoretical charge level and actual charge level (from OCV) at 200 kW charge.
Figure 11.
Rates of self-discharge in standby mode when two or four groups of stacks were active (i.e., ready to provide energy to the battery for a fast start-up of a charging or discharging process).
Figure 11.
Rates of self-discharge in standby mode when two or four groups of stacks were active (i.e., ready to provide energy to the battery for a fast start-up of a charging or discharging process).


Table 1.
Charge and discharge energies and system energy efficiencies at different charge/discharge powers.
Table 1.
Charge and discharge energies and system energy efficiencies at different charge/discharge powers.
| Cycle Power (kW) | Time Charging (min) | Charged Energy (kWh) | Charge Level (%) | Time Discharging (min) | Discharged Energy (kWh) | System Energy Efficiency (%) |
|---|---|---|---|---|---|---|
| 50 | 894 | 738 | 91.8 | 427 | 353 | 48 |
| 60 | 745 | 739 | 98.2 | 419 | 416 | 56 |
| 100 (a) * | 438 | 743 | 92.6 | 216 | 350 | 47 |
| 100 (b) | 443 | 727 | 100.0 | 272 | 435 | 59 |
| 150 | 293 | 730 | 95.8 | 172 | 397 | 54 |
| 200 | 192 | 638 | 91.6 | 125 | 365 | 57 |
* (a) Cycle initiated when electrolyte temperature exceeded upper temperature limit; (b) cycle initiated within normal temperature range.
Table 2.
Battery voltage efficiency at different power levels.
| Cycle Power (kW) | Mean Charge Voltage (V) | Mean Voltage Discharge (V) | Voltage Efficiency (%) |
|---|---|---|---|
| 50 | 38.1 | 34.7 | 91.0 |
| 60 | 37.7 | 35.0 | 92.7 |
| 100 | 37.8 | 33.6 | 89.0 |
| 150 | 38.6 | 32.7 | 84.7 |
| 200 | 39.3 | 31.4 | 80.1 |
Table 3.
Regulatory system power requirement at various charge and discharge power levels with resulting AC/DC efficiencies recorded from the human–machine interface (HMI).
Table 3.
Regulatory system power requirement at various charge and discharge power levels with resulting AC/DC efficiencies recorded from the human–machine interface (HMI).
| Set Power (kW) | PIN/OUT-Grid (kW) | Regulatory Systems (kW) | HVP (V) | AC/DC Efficiency (%) |
|---|---|---|---|---|
| 200 | 204 | 8.52 | 182 | 93.2 |
| −200 | 199 | 8.54 | 213 | 97.3 |
| 150 | 152 | 8.32 | 139 | 96.9 |
| −150 | 151 | 8.32 | 163 | 97.4 |
| 100 | 99 | 6.45 | 90 | 97.2 |
| −100 | 99 | 8.22 | 111 | 96.5 |
| 60 | 63 | 8.09 | 49 | 90.0 |
| −60 | 61 | 6.98 | 69 | 97.9 |
| 50 | 49 | 6.12 | 42 | 96.9 |
| −50 | 52 | 4.17 | 57 | 98.6 |
Table 4.
The coulombic efficiency, evaluated from system and battery energy efficiencies, at the various power levels.
Table 4.
The coulombic efficiency, evaluated from system and battery energy efficiencies, at the various power levels.
| Charge | Discharge | ||||||
|---|---|---|---|---|---|---|---|
| Cycle Power (kW) | AC Energy in (kWh) | Electrochemical Energy Stored (kWh) | AC Energy out (kWh) | Electrochemical Energy Released (kWh) | System Energy Efficiency (%) | Electrochemical Energy Efficiency (%) | Coulombic Efficiency (%) |
| 50 | 738 | 597 | 353 | 416 | 48 | 70 | 77 |
| 60 | 739 | 550 | 416 | 497 | 56 | 90 | 97 |
| 100 (a) * | 743 | 632 | 350 | 408 | 47 | 65 | 73 |
| 100 (b) | 727 | 617 | 435 | 504 | 60 | 82 | 92 |
| 150 | 730 | 643 | 397 | 451 | 54 | 70 | 83 |
| 200 | 638 | 546 | 365 | 411 | 57 | 75 | 94 |
* (a) Cycle initiated when electrolyte temperature exceeded upper temperature limit; (b) cycle initiated within normal temperature range.
Table 5.
Electrochemical energy loss from side reactions as a function of electrolyte temperature and power levels.
Table 5.
Electrochemical energy loss from side reactions as a function of electrolyte temperature and power levels.
| Cycle (kW) | Percentage Loss (%) | Energy (kWh) | Start Temperature (°C) |
|---|---|---|---|
| 200 | 3.64 | 26.8 | 37.0 |
| 150 | 5.11 | 37.8 | 42.7 |
| 100 (a) * | 7.84 | 58.3 | 44.8 |
| 100 (b) | 3.54 | 22.6 | 36.6 |
| 60 | 2.40 | 17.5 | 42.1 |
| 50 | 13.66 | 99.7 | 38.0 |
* (a) Cycle initiated when electrolyte temperature exceeded upper temperature limit; (b) cycle initiated within normal temperature range.
© 2018 by the authors. Licensee MDPI, Basel, Switzerland. This article is an open access article distributed under the terms and conditions of the Creative Commons Attribution (CC BY) license (http://creativecommons.org/licenses/by/4.0/).
Share and Cite
MDPI and ACS Style
Bryans, D.; Amstutz, V.; Girault, H.H.; Berlouis, L.E.A. Characterisation of a 200 kW/400 kWh Vanadium Redox Flow Battery. Batteries 2018, 4, 54. https://doi.org/10.3390/batteries4040054
AMA Style
Bryans D, Amstutz V, Girault HH, Berlouis LEA. Characterisation of a 200 kW/400 kWh Vanadium Redox Flow Battery. Batteries. 2018; 4(4):54. https://doi.org/10.3390/batteries4040054
Chicago/Turabian StyleBryans, Declan, Véronique Amstutz, Hubert H. Girault, and Léonard E. A. Berlouis. 2018. "Characterisation of a 200 kW/400 kWh Vanadium Redox Flow Battery" Batteries 4, no. 4: 54. https://doi.org/10.3390/batteries4040054
Note that from the first issue of 2016, this journal uses article numbers instead of page numbers. See further details here.