Consumer-Based Evaluation of Commercially Available Protected 18650 Cells


College of Engineering, Penn State University-Hazleton Campus, 76 University Dr, Hazleton, PA 18202, USA
*
Author to whom correspondence should be addressed.
Batteries 2018, 4(3), 45; https://doi.org/10.3390/batteries4030045
Submission received: 20 August 2018
/
Revised: 6 September 2018
/
Accepted: 7 September 2018
/
Published: 12 September 2018
Abstract
:Over the past few years, the use of 18650 form factor lithium-ion (Li-ion) cells have transitioned from primarily commercial applications to consumer/residential use. An evaluation of eight commercially available, circuit protected, 18650 form factor Li-ion cells were performed, with analysis focusing on a residential consumer evaluation of performance. As typical consumer cell usage occurs at a relatively low discharge rate, cells were evaluated between 4.2 V and 2.7 V at C/10, C/5, and C/2 discharge rates. The evaluated cells ranged from “high-cost” Panasonic, Hixon, Orbtronic, and EastValley cells to “low-cost” UltraFire (UF) and Eilong cells. Initial discharge comparisons revealed that no cells delivered their nameplate capacity, with a large overstatement of cell capacity occurring for low-cost cells. On average, high-cost cells delivered 92.5% of their advertised capacity, with low-cost cells delivering 20.6% at a C/10 rate. Basing consumer evaluation on a cost per unit capacity and/or cost per unit energy, even with this large overstatement in capacity, low-cost cells still offer an advantage over higher-cost alternatives. The average cost per amp-hour for each cell group ranged from $1.65 to $3.38 for the low-cost and high-cost cell groupings, respectively. Analysis of voltage profiles highlighted two chemistries used in cell production, coinciding with each cell grouping.
1. Introduction
Since commercialization by Sony in the early 1990s, the lithium-ion (Li-ion) battery has continued to define portable and rechargeable electrochemical energy. Initial use of Li-ion cells was concentrated primarily to cameras, camcorders, mobile phones, laptop computers and power tools [1], but as demand for portable power increases, the ways in which these cells are used continue to grow and expand accordingly. At present, some of these uses include children’s toys, medical devices, e-cigarettes, electric vehicles, and e-bikes, among others [2,3]. Throughout the continued development of Li-ion battery technology, various form factors and chemistries have become available for both consumer (residential) and commercial use [4], where consumers can now purchase Li-ion cells from numerous online retailers, ranging from 3.7 V–25 mAh small cells for children’s toys to large 52 V–6.5 Ah e-bike battery packs, and larger. These commercially available cells come in both pouch cell packaging as well as cylindrical or prismatic hardware cells, and although many form factors are available, standardized sizes such as 18650 and 26650 type cells are currently produced in high quantities [5]. A large percentage of these standardized form factor cells are assembled into battery packs for various commercial applications, such as electric vehicles [6] and grid storage [7]. These packs, containing multiple cells assembled in series and parallel, generally contain ancillary equipment to monitor individual cell properties such as voltage and temperature. This equipment accompanies standard internal cell safety designs, such as positive temperature coefficient (PTC) devices and current interrupting devices (CID) [8]. PTCs are resettable devices in which cell resistance increases rapidly when a set temperature is reached, lowering cell current to acceptable levels [9]. CID protection operates as a pressure switch for cells when high internal pressures are reached—normally during misuse or overcharge. These devices disconnect internal components, eliminating further discharge through an external circuit [10]. Cells can also be purchased with additional protection in the form of over-discharge and overcharge protection circuitry installed. These are labeled as “protected” 18650 cells and can be differentiated by an increase in cell length (~69 mm) and a pronounced button top, as opposed to unprotected cells (~65 mm). These protections limit cell charging to a maximum voltage, and discharging to a minimum voltage.
For commercial applications, cells can be designed for a specific application, with performance evaluation and verification testing taking place under specific conditions, possibly mirroring cell use. For residential cells, consumers generally base their cell purchasing decisions on limited available performance data. High-cost cell manufacturers provide this performance data under a limited range of conditions, whereas low-cost cell manufactures typically only provide nominal discharge voltage and nameplate cell capacity [1]. These reporting methods could lead to an overstatement in cell capacity, which would make a lesser product more competitive.
For each residential cell application, different performance characteristics drive cell selection. These characteristics include cost, capacity, cycle life, and storage capability, among others [11,12]. Based on this idea, an evaluation was performed on eight different commercially available protected 18650 Li-ion cells purchased through Amazon.com. This evaluation aimed to determine cell performance at lower rates, highlight any discrepancies in available cell data, and present results on a cost per capacity and cost per energy basis, while also noting differences in cell physical characteristics and electrode active material.
2. Materials and Methods
Physical characteristics from eight circuit-protected, commercially available 18650 form factor cells are recorded in Table 1. These characteristics include mass, height, and diameter, along with the published cell nameplate capacity and nominal discharge voltage. The listed nameplate capacities are printed on the cell outer wrap alongside the cell nominal voltage. Two cells of each cell type were electrochemically characterized following physical measurements. For energy density calculations, the average height, diameter, and mass of each cell type was used, with the plus/minus value in Table 1 highlighting the manufacturing variability of the two cells tested for each type.
From the data in Table 1, the cells can be split into two distinct groups: High-cost cells (Panasonic, Hixon, Orbtronic, and EastValley), which cost between $7.45 and $15.00 per cell, and the low-cost cells (Eilong, UltraFire (UF)-Yellow, UF-Blue, and UF-Red), which cost between $1.50 and $2.31 per cell. These two cell groups are discernible through inspection of the cell height, diameter, nameplate capacity, mass, as well as variation in mass. All high-cost cells had a nameplate capacity of either 3400 mAh or 3500 mAh, while low-cost cell capacity was listed between 4000 mAh and 9800 mAh. The low-cost cells showed a much larger variability in cell mass compared to high-cost cells, with the two UF-Red cells weighing between 32.55 g and 35.30 g, or demonstrating a variation of 4% from the average cell mass. The low-cost cells also weighed considerably less than the high-cost cells, with the average mass of the lower-cost cells being 74% that of the higher-cost alternatives. Figure 1 is an image of the eight cell types evaluated, where the cells are shown as purchased.
Electrochemical characterization was performed at room temperature using an MTI-BST8-3 8-channel battery analyzer. All received cells had an initial voltage reading between 3.6 V and 3.8 V. Based on cell nameplate capacity and mass, the capacities of the low-cost cells were verified prior to cell characterization. One low-cost cell of each type was charged at 200 mA constant current to 4.2 V, followed by a constant voltage taper to 20 mA. Evaluated cells delivered between 975 mAh and 1250 mAh at a 40 mA discharge current to 2.7 V. For all follow-on characterization, the testing of low-cost cells was de-rated to a capacity of 1200 mAh. For both high-cost and low-cost cells, capacity was measured at three rates (C/10, C/5, and C/2) using the procedure outlined in Table 2, with a relatively short three-minute rest following each charge and discharge step [13,14]. For cell performance evaluation, relatively small discharge rates were used with a maximum occurring at C/2. For this consumer-based evaluation, discharge rates in most consumer products are relatively low and were covered by the presented range.
The calendar age of Li-ion cells also influences cell performance, affecting electrolyte, solid electrolyte interface (SEI), positive and negative electrodes, as well as internal mechanical stress [15]. This aging typically leads to a decrease in cell capacity and an increase in cell internal resistance. The age of the received cells was unknown, as no manufacturing date was available and thus is not reported here.
For the following results, average capacities between two cells from the same manufacturer are shown. Data presented in this matter demonstrate the average performance of a cell type purchased by an “everyday” consumer of protected 18650 cells.
3. Results
3.1. Capacity
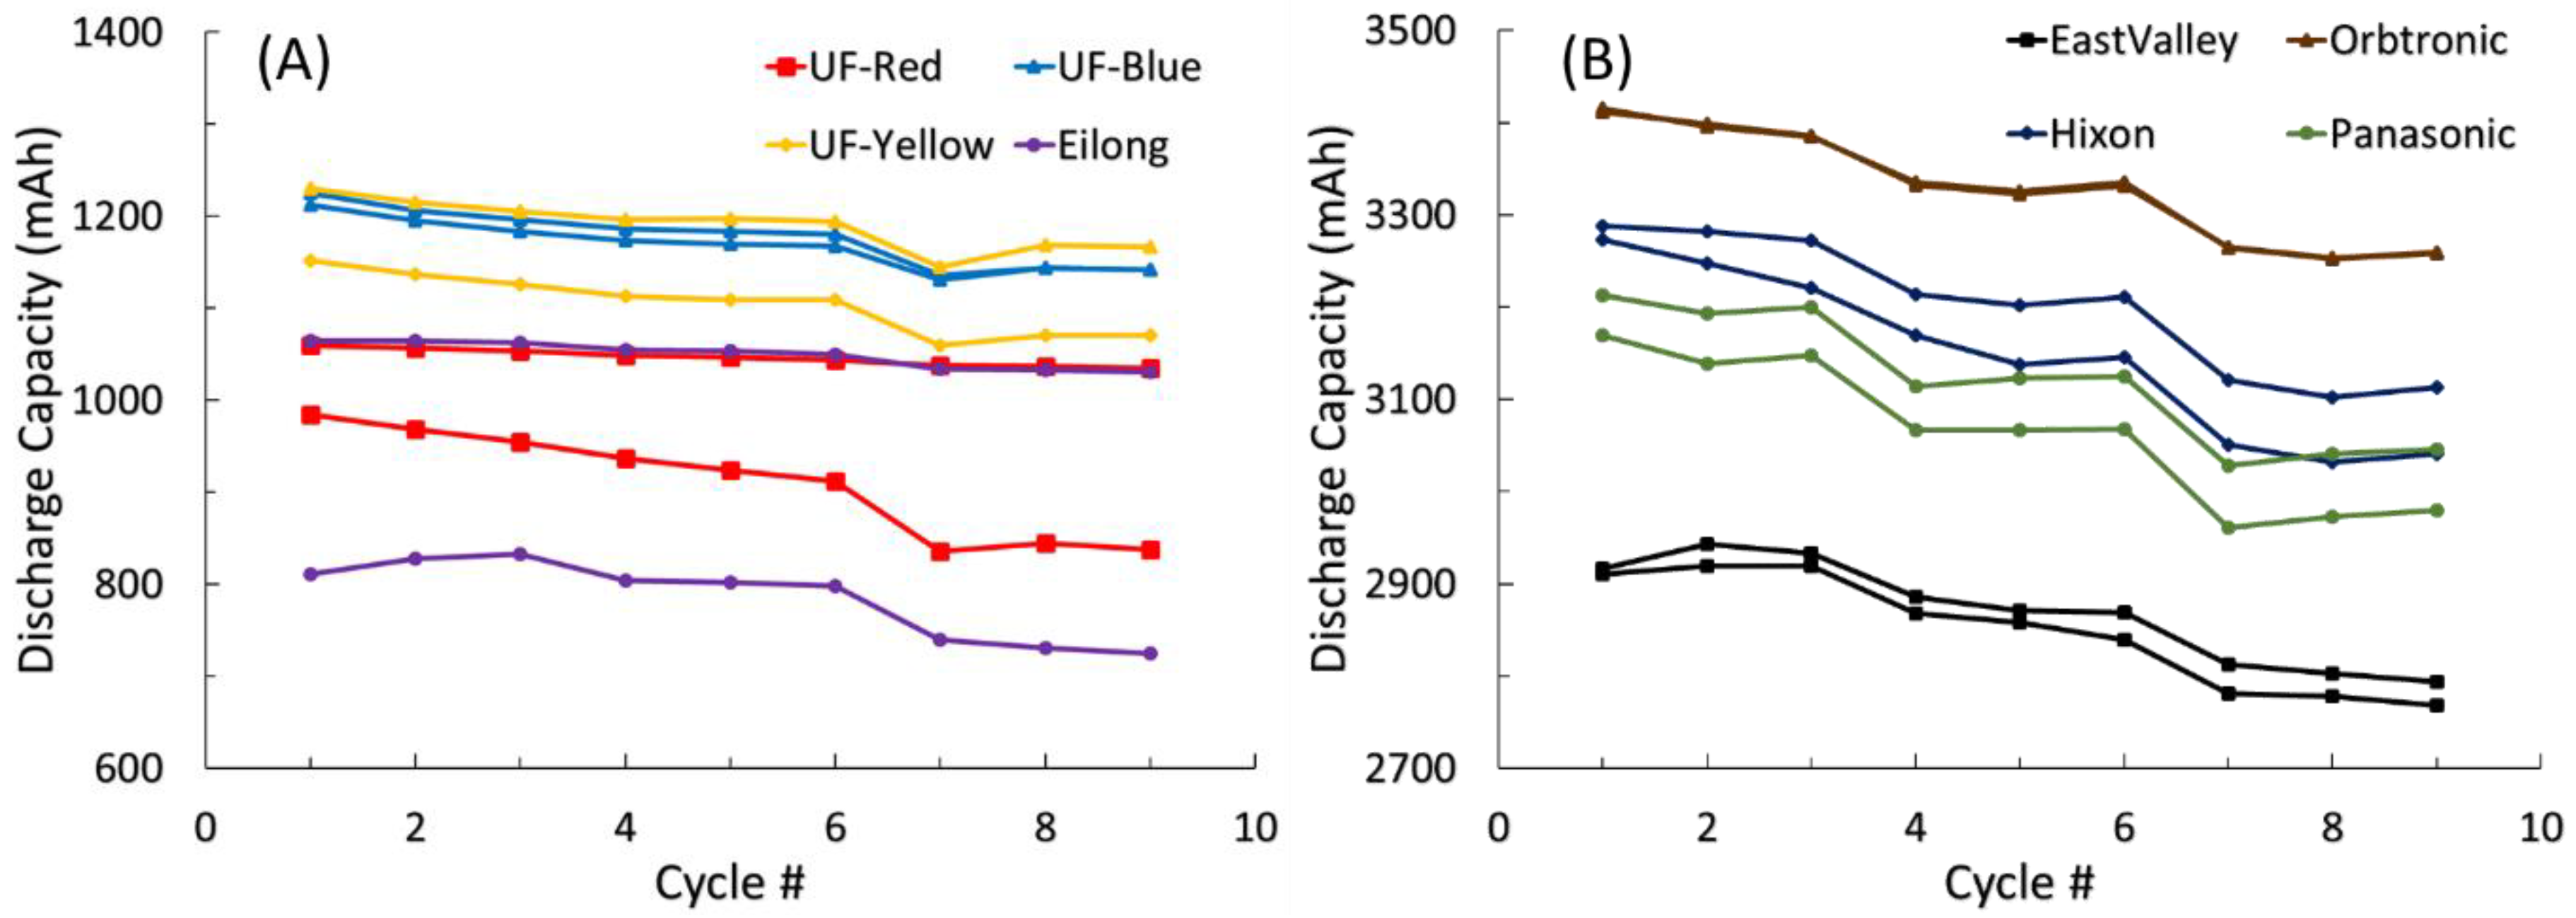
Using the test procedure outlined in Table 2, the discharge capacities from sixteen cells are shown in Figure 2. These capacities are from cycles following the first discharge and full charge, with three discharges occurring at each rate: C/10, C/5, and C/2. Cell variability was always present to some degree between two cells of the same cell type, but was noticeably more pronounced in the low-cost cells. Eilong cells showed the highest capacity variation through the nine cycles, and the UF-Red cells showed the highest variation in performance between the cells, highlighted by the capacity fade of only one cell over nine cycles.
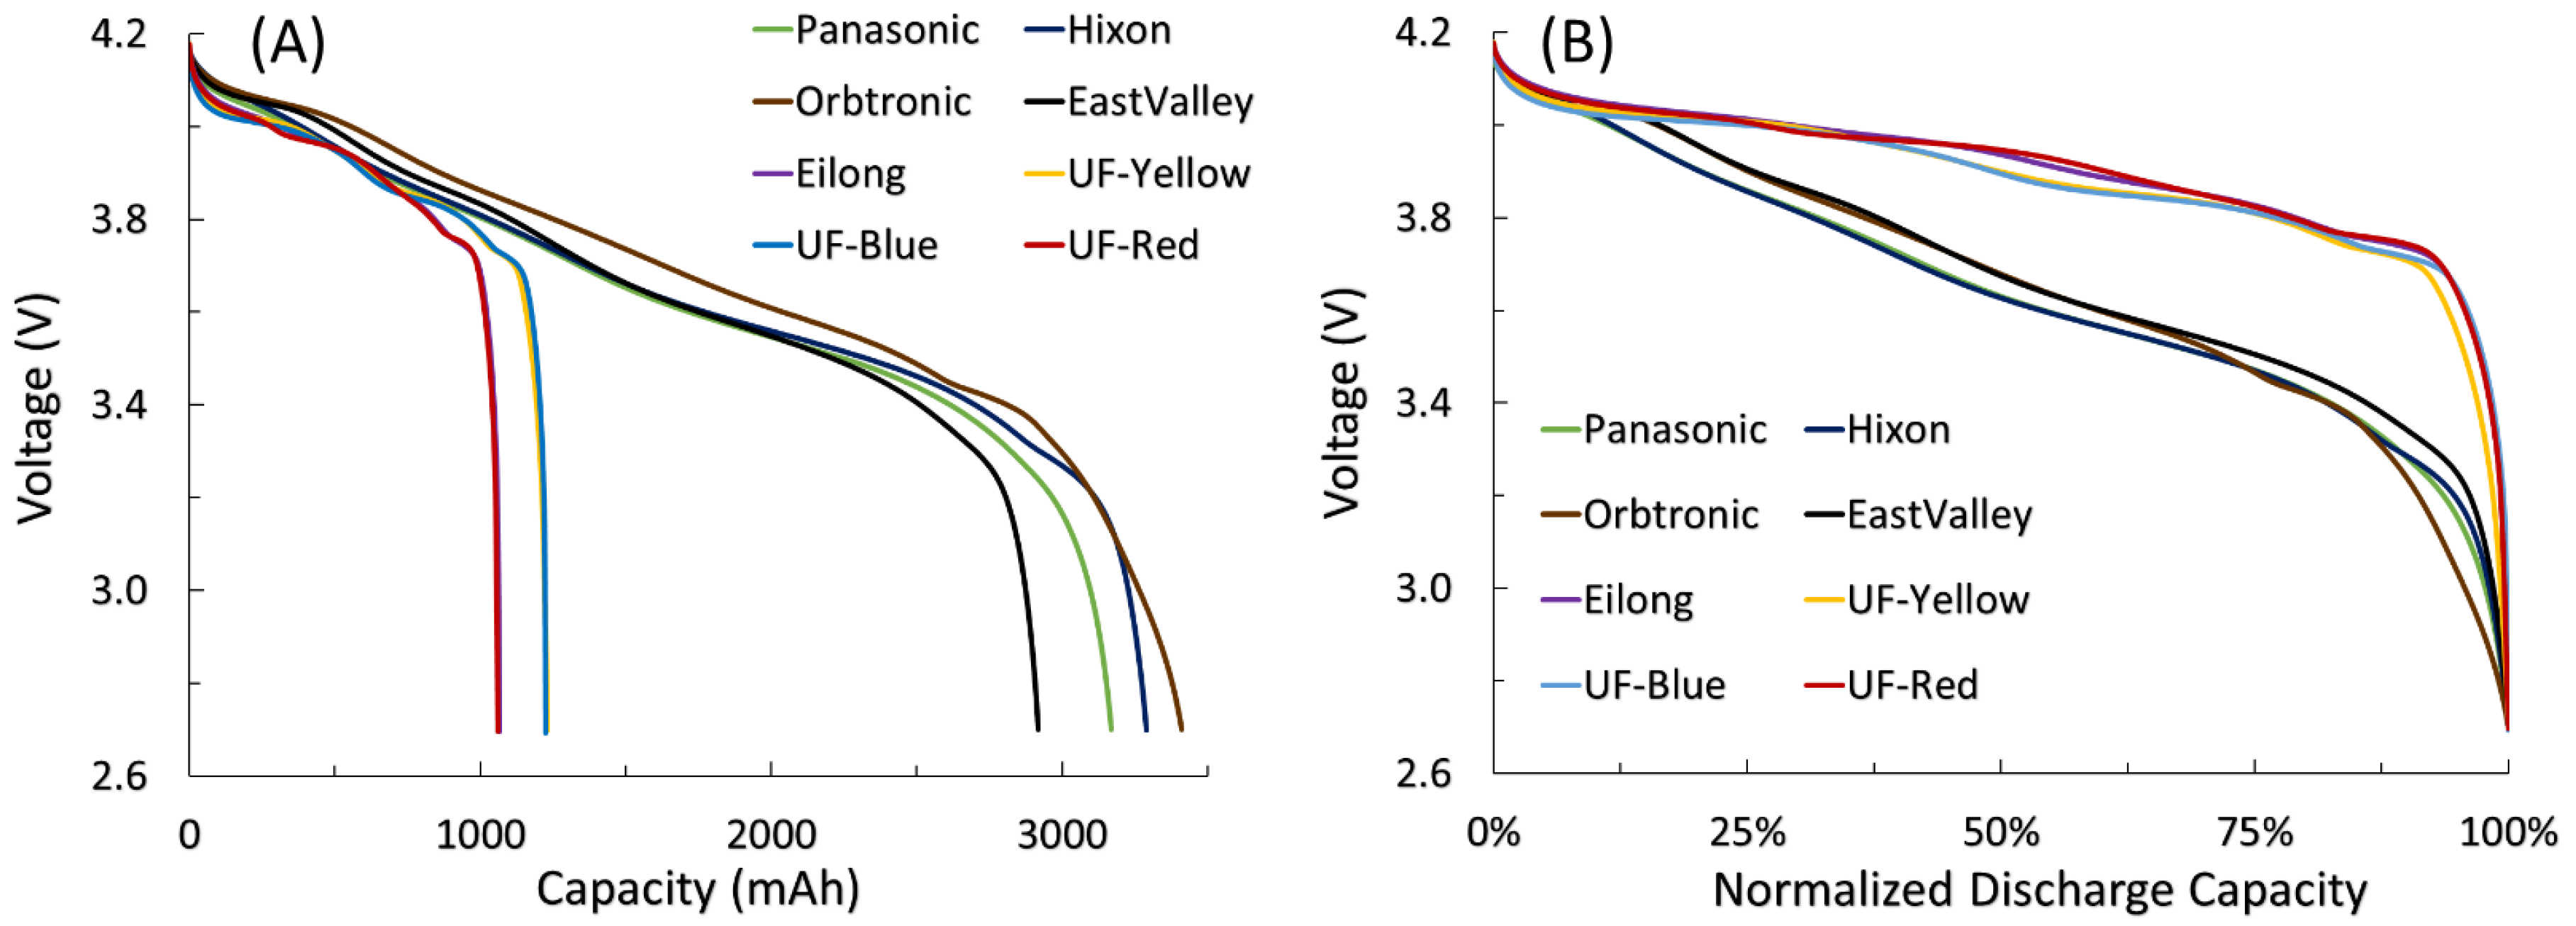
Comparing cell voltage profiles offers a perspective into cell chemistry without performing destructive physical analysis. Figure 3 compares cell voltage profiles for one cell of each type discharged at a C/10 rate.
Figure 3 illustrates two distinct groups of cells, showing these two groups based on overall C/10 discharge capacity to 2.7 V (Figure 3A) and normalized discharge voltage profile (Figure 3B). Again, these cell groups match up well with the low-cost and high-cost cells. Visually, Figure 3A offers little in terms of cell chemistry, while Figure 3B highlights a difference in voltage profile, normalized to cell discharge capacity. Based on package labeling, one would expect similar normalized voltage profiles, since all cells had a nominal voltage rating of 3.7 V for a 4.2 V maximum charge voltage. This 3.7 V rating is typically associated with lithium cobalt dioxide (LCO) cathode chemistry, paired with a graphite anode, while a lower rating of 3.6 V usually points to a nickel-based chemistry, paired with graphite for a 4.2 V charge voltage. A nominal voltage rating of 3.3 V will usually confirm a lithium iron phosphate (LFP) cathode/graphite anode pairing. Although all cells were labeled as 3.7 V, the two groups of cells shown in Figure 3B are most likely from different cathode active materials used in cell production.
During the lithiation and de-lithiation of cathode materials, each material produces a different voltage profile and voltage versus Li/Li+ for the same percentage discharge (4.2–2.7 V), corresponding to active material content, composition, binder, particle size, temperature, electrode loading, and rate, among others [16]. Similar effects, to a lesser degree, were noted for negative electrodes, as the majority of negative electrode capacity occurs within 100 mV versus Li/Li+ [17]. Other cell design parameters, such as negative to positive matching ratio, also result in small variations of cell voltage profiles [18]. Pairing these effects, the large differences observed between the high-cost and low-cost cell groups are believed to be the result of different positive electrode active materials.
An additional indicator of different cell chemistries is the voltage drop-off, which occurs between 90% and 100% state of discharge. LCO material typically exhibits a steep drop in voltage which can be observed in Figure 3B for the low-cost cells, compared to the high-cost cells, which demonstrated a less-extreme voltage decay [4]. These two distinct groupings of cells directly match both the high and low capacity groupings from Figure 3A, as well as the previously discussed high-cost and low-cost cell groupings. Comparing these normalized discharge profiles, it is believed that the Eilong and UF cells contain LCO cathode material, while Panasonic, Hixon, Orbtronic, and EastValley cells contain a nickel-based cathode material, possibly nickel cobalt aluminum oxide (NCA). Although material cost inevitably affects cell cost, the cost difference noted in cell types is not believed to be the result of the active cathode material cost, as LCO and NCA have similar material costs [19]. This price difference is believed to be related to material content, expressed by the large difference in cell mass, along with differences in the cell manufacturing process.
3.2. Rate Capability
Following C/10 discharge capacity and voltage profile comparisons, cells were discharged at C/5 and C/2 rates. Again, these rates were based on nameplate capacity for the high-cost cell group and de-rated 1200 mAh capacity for the low-cost cell group. The data presented in Table 3 are the discharge capacity delivered at each rate, as well as the percentage of cell nameplate capacity delivered at each rate.
It should be noted that no cells delivered their nameplate capacity at any discharge rate, with Hixon and Orbtronic cells delivering the highest percentage of the cell nameplate capacity at the C/10 rate, being 96.0% and 97.1% or 3264 mAh and 3399 mAh, respectively. As expected, all de-rated low-cost cells delivered a small percentage of the nameplate capacity. For a C/10 rate, UF-Red cells delivered the maximum, at 25.3%, while Eilong cells delivered the minimum, at 9.6%. These low percentage performance numbers are a direct result of an overstatement of cell capacity.
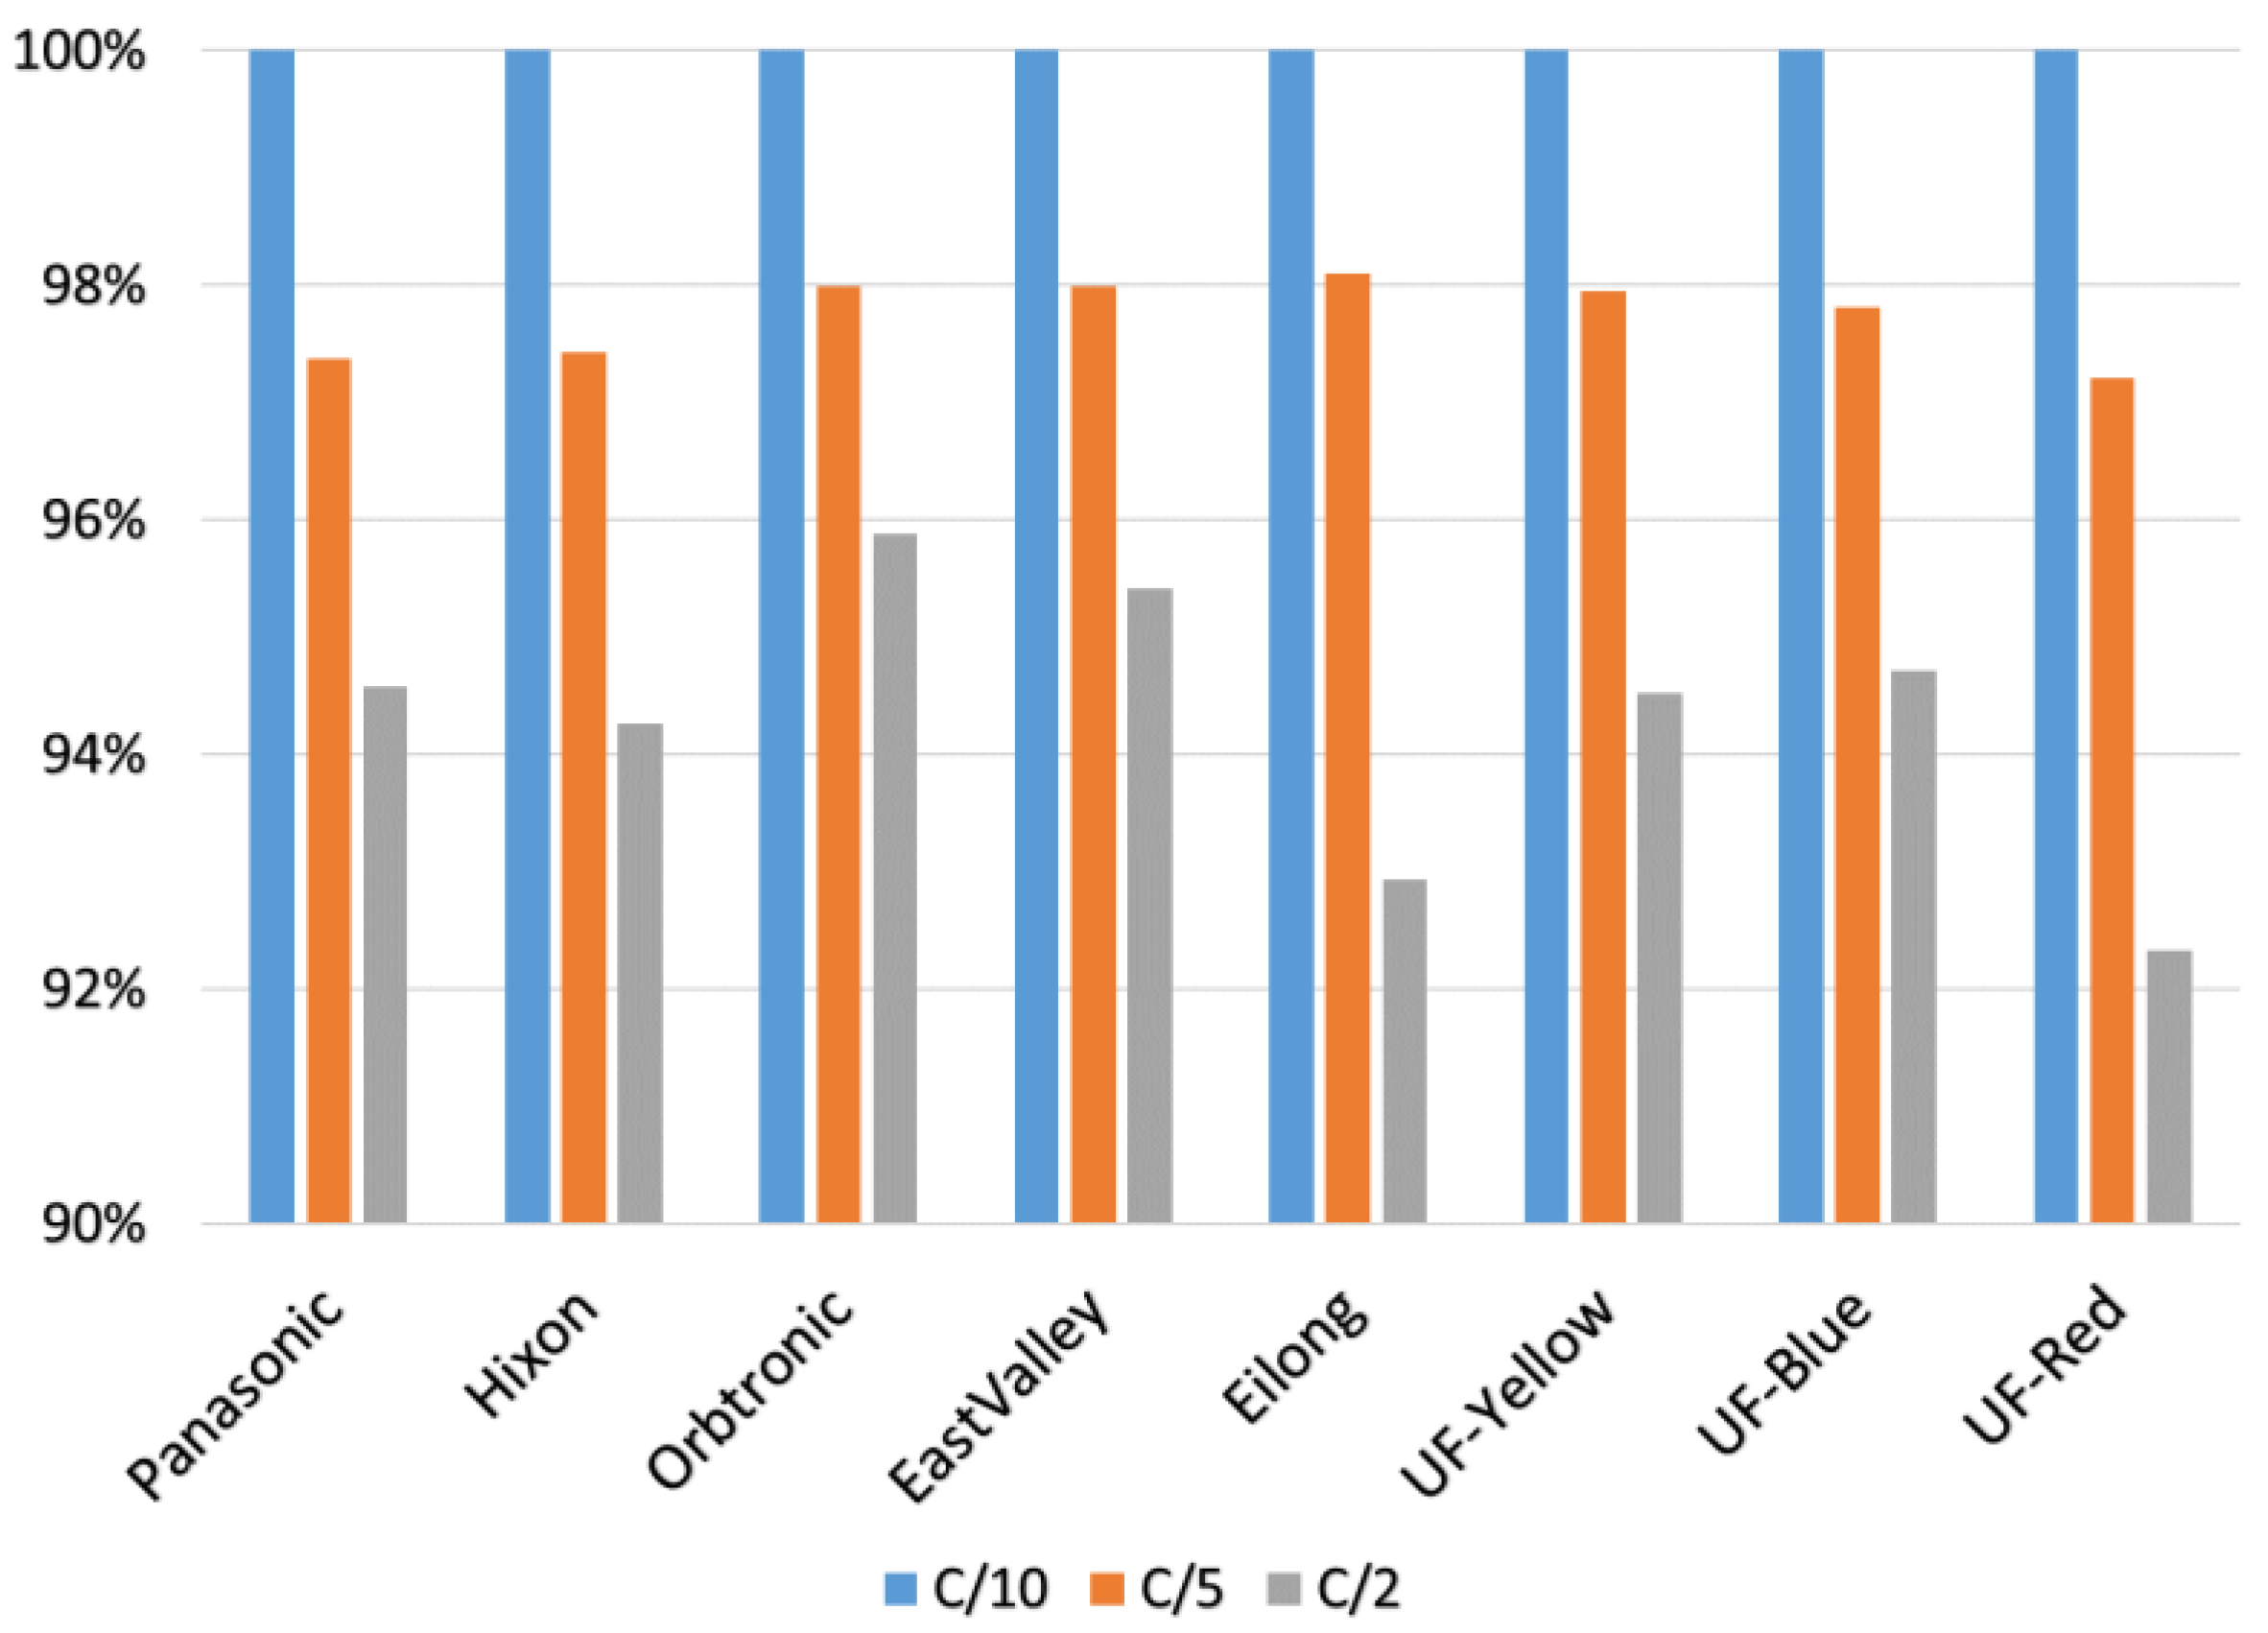
For further rate capability analysis, cell discharge capacities at C/5 and C/2 rates were normalized to percentage of C/10 discharge capacity (Figure 4). This method of cell evaluation eliminates any bias or benefit from overstated capacity by cell manufacturing, packaging, or distribution entities.
Normalizing discharge rate performance to C/10 capacity revealed that there was little to no statistical difference in rate capability between the high-cost and low-cost 18650 cells. A C/5 capacity retention of 97.2–98.1%, compared to C/10 capacity was observed between all cell types. Capacity retention at a C/2 rate, compared to C/10, delivered 92.3–95.9%, with UF-Red cells delivering the minimum, and Orbtronic cells delivering the maximum.
3.3. Cost/Energy
The cost for cells purchased from online vendors is provided in Table 4, along with cost per unit capacity (Ah) and unit energy (Wh). The data presented in Table 4 are based on cell nameplate capacity and nominal voltage labeling. This data summary represents the data that is typically available to consumers purchasing protected 18650 cells. Based on this table, the low-cost cells are clearly the best purchase, with Eilong cells costing $0.18/Ah and $0.05/Wh, compared to Orbtronic cells costing $4.28/Ah and $1.16/Wh. This method of cell evaluation is one of many, as type of cell use would dictate which performance characteristics are critical for selection. Alternative selection criteria may be based on capacity, cycle life, performance at desired temperature, minimum charge time, gravimetric energy density, and power performance, among others.
Table 5 shows a similar data comparison, using cell capacity delivered at a C/10 rate. A voltage de-rating of 100 mV was also used for cell types with a lower nominal discharge voltage, as shown in Figure 3B.
Based on C/10 discharge data, the low-cost cells still offer a consumer advantage when comparing cost per capacity or cost per energy. Other possible determining factors for purchasing cells could be volumetric and gravimetric energy density. We also provide gravimetric energy density, which is typically not critical for fixed form factor consumer selection, and as expected, the high-cost cells showed a gravimetric energy density that was approximately double that of the low-cost cells. Volumetric energy density is also provided, as large variations in cell dimensions were observed (Table 1). Similar to the gravimetric energy density data, the volumetric energy density data showed a 2–3× improvement when evaluating high-cost 18650 cells compared to the lower-cost alternatives.
4. Conclusions
As the consumer/residential markets for protected 18650 Li-ion cells continue to grow, numerous manufacturers are marketing protected versions of cells, which historically have been available as unprotected cells for commercial battery pack applications. Numerous cells available for purchase were found to have a large overstatement of cell capacity—namely the lower-cost UF and Eilong type cells. Although capacity is not the only evaluation criterion, this listed cell capacity is normally the only data available for consumers when specifically purchasing cells online. A quick “best bang for my buck” evaluation is performed, and cells are purchased with highly overstated capacities. However, the results showed that when this overstated capacity was normalized to cell performance, these low-cost cells were still the best option when evaluated on a cost per amp-hour selection criteria, with UF-Blue cells costing $1.25/Ah. Regardless, caution is highly stressed when considering cell type, as use is the primary driver for cell selection. Cells used as reserve cells, for example in an emergency flashlight or survival kit, would prioritize cell capacity, reliability, and low self-discharge over cost-effectiveness as selection criteria.
Author Contributions
S.B. and W.Y. conceived, designed, and performed the experiments; S.B. and W.Y. analyzed the data; S.B. and W.Y. wrote the paper.
Funding
This research received no external funding.
Acknowledgments
This work has been partially supported by the Engineering Technology and Commonwealth Engineering Program Enhancement Grant.
Conflicts of Interest
The authors declare no conflicts of interest.
References
- Muenzel, V.; Hollenkamp, A.F.; Bhatt, A.I.; de Hoog, J.; Brazil, M.; Thomas, D.A.; Mareels, I. A Comparative Testing Study of Commercial 18650-Format Lithium-Ion Battery Cells. J. Electrochem. Soc. 2015, 162, A1592–A1600. [Google Scholar] [CrossRef] [Green Version]
- Blomgren, G.E. The Development and Future of Lithium Ion Batteries. J. Electrochem. Soc. 2017, 164, A5019–A5025. [Google Scholar] [CrossRef]
- Hossain, S.; Tipton, A.; Mayer, S.; Anderman, M.; Surumpudi, S. Lithium-ion cells for aerospace applications. In Proceedings of the IECEC-97: Thirty-Second Intersociety Energy Conversion Engineering Conference (Cat. No. 97CH6203), Honolulu, HI, USA, 27 July–1 August 1997; Volume 1, pp. 35–38. [Google Scholar]
- Nitta, N.; Wu, F.; Lee, J.T.; Yushin, G. Li-ion battery materials: Present and future. Mater. Today 2015, 18, 252–264. [Google Scholar] [CrossRef]
- Waldmann, T.; Hogg, B.-I.; Wohlfahrt-Mehrens, M. Li plating as unwanted side reaction in commercial Li-ion cells—A review. J. Power Sources 2018, 384, 107–124. [Google Scholar] [CrossRef]
- Uitz, M.; Sternad, M.; Breuer, S.; Täubert, C.; Traußnig, T.; Hennige, V.; Hanzu, I.; Wilkening, M. Aging of Tesla’s 18650 Lithium-Ion Cells: Correlating Solid-Electrolyte-Interphase Evolution with Fading in Capacity and Power. J. Electrochem. Soc. 2017, 164, A3503–A3510. [Google Scholar] [CrossRef]
- Hesse, H.C.; Schimpe, M.; Kucevic, D.; Jossen, A. Lithium-Ion Battery Storage for the Grid—A Review of Stationary Battery Storage System Design Tailored for Applications in Modern Power Grids. Energies 2017, 10, 2107. [Google Scholar] [CrossRef]
- Augeard, A.; Singo, T.; Desprez, P.; Perisse, F.; Menecier, S.; Abbaoui, M. Arc analysis to the CID of li-ion battery cells in high-current applications. In Proceedings of the 2014 IEEE 60th Holm Conference on Electrical Contacts (Holm), New Orleans, LA, USA, 12–15 October 2014; pp. 1–7. [Google Scholar]
- Reddy, T. Linden’s Handbook of Batteries, Fourth Edition, 4th ed.; McGraw-Hill: New York, NY, USA, 2002; ISBN 978-0-07-162421-3. [Google Scholar]
- Morley, R. Lithium-Ion 18650 Battery Failures. Hartwood Consulting 3. Available online: http://hartwood.com.au/project_item/lithium-ion-18650-battery-failures/ (accessed on 31 August 2018).
- Burke, A.; Miller, M. Performance Characteristics of Lithium-ion Batteries of Various Chemistries for Plug-in Hybrid Vehicles. In Proceedings of the EVS24 International Battery, Hybrid and Fuel Cell Electric Vehicle Symposium, Stavanger, Norway, 13–16 May 2009; pp. 1–13. [Google Scholar]
- Barkholtz, H.M.; Fresquez, A.; Chalamala, B.R.; Ferreira, S.R. A Database for Comparative Electrochemical Performance of Commercial 18650-Format Lithium-Ion Cells. J. Electrochem. Soc. 2017, 164, A2697–A2706. [Google Scholar] [CrossRef] [Green Version]
- Wang, C.-Y.; Xu, T.; Ge, S.; Zhang, G.; Yang, X.-G.; Ji, Y. A Fast Rechargeable Lithium-Ion Battery at Subfreezing Temperatures. J. Electrochem. Soc. 2016, 163, A1944–A1950. [Google Scholar] [CrossRef] [Green Version]
- Krieger, E.M.; Cannarella, J.; Arnold, C.B. A comparison of lead-acid and lithium-based battery behavior and capacity fade in off-grid renewable charging applications. Energy 2013, 60, 492–500. [Google Scholar] [CrossRef]
- Tröltzsch, U.; Kanoun, O.; Tränkler, H.-R. Characterizing aging effects of lithium ion batteries by impedance spectroscopy. Electrochim. Acta 2006, 51, 1664–1672. [Google Scholar] [CrossRef]
- Whittingham, M.S. Lithium Batteries and Cathode Materials. Chem. Rev. 2004, 104, 4271–4302. [Google Scholar] [CrossRef] [PubMed]
- Bugga, R.V.; Smart, M.C. Lithium Plating Behavior in Lithium-Ion Cells. ECS Trans. 2010, 25, 241–252. [Google Scholar] [CrossRef]
- Kim, C.S.; Jeong, K.M.; Kim, K.; Yi, C.W. Effects of capacity ratios between anode and cathode on electrochemical properties for lithium polymer batteries. Electrochim. Acta 2015, 155, 431–436. [Google Scholar] [CrossRef]
- Berckmans, G.; Messagie, M.; Smekens, J.; Omar, N.; Vanhaverbeke, L.; Van Mierlo, J. Cost Projection of State of the Art Lithium-Ion Batteries for Electric Vehicles Up to 2030. Energies 2017, 10, 1314. [Google Scholar] [CrossRef]
Figure 1.
Evaluated commercially available protected 18650 cells purchased from Amazon.com. Arrangement of cells shown are: Panasonic, Orbtronic, Hixon, EastValley, Eilong, UF-Yellow, UF-Blue, and UF-Red.
Figure 1.
Evaluated commercially available protected 18650 cells purchased from Amazon.com. Arrangement of cells shown are: Panasonic, Orbtronic, Hixon, EastValley, Eilong, UF-Yellow, UF-Blue, and UF-Red.
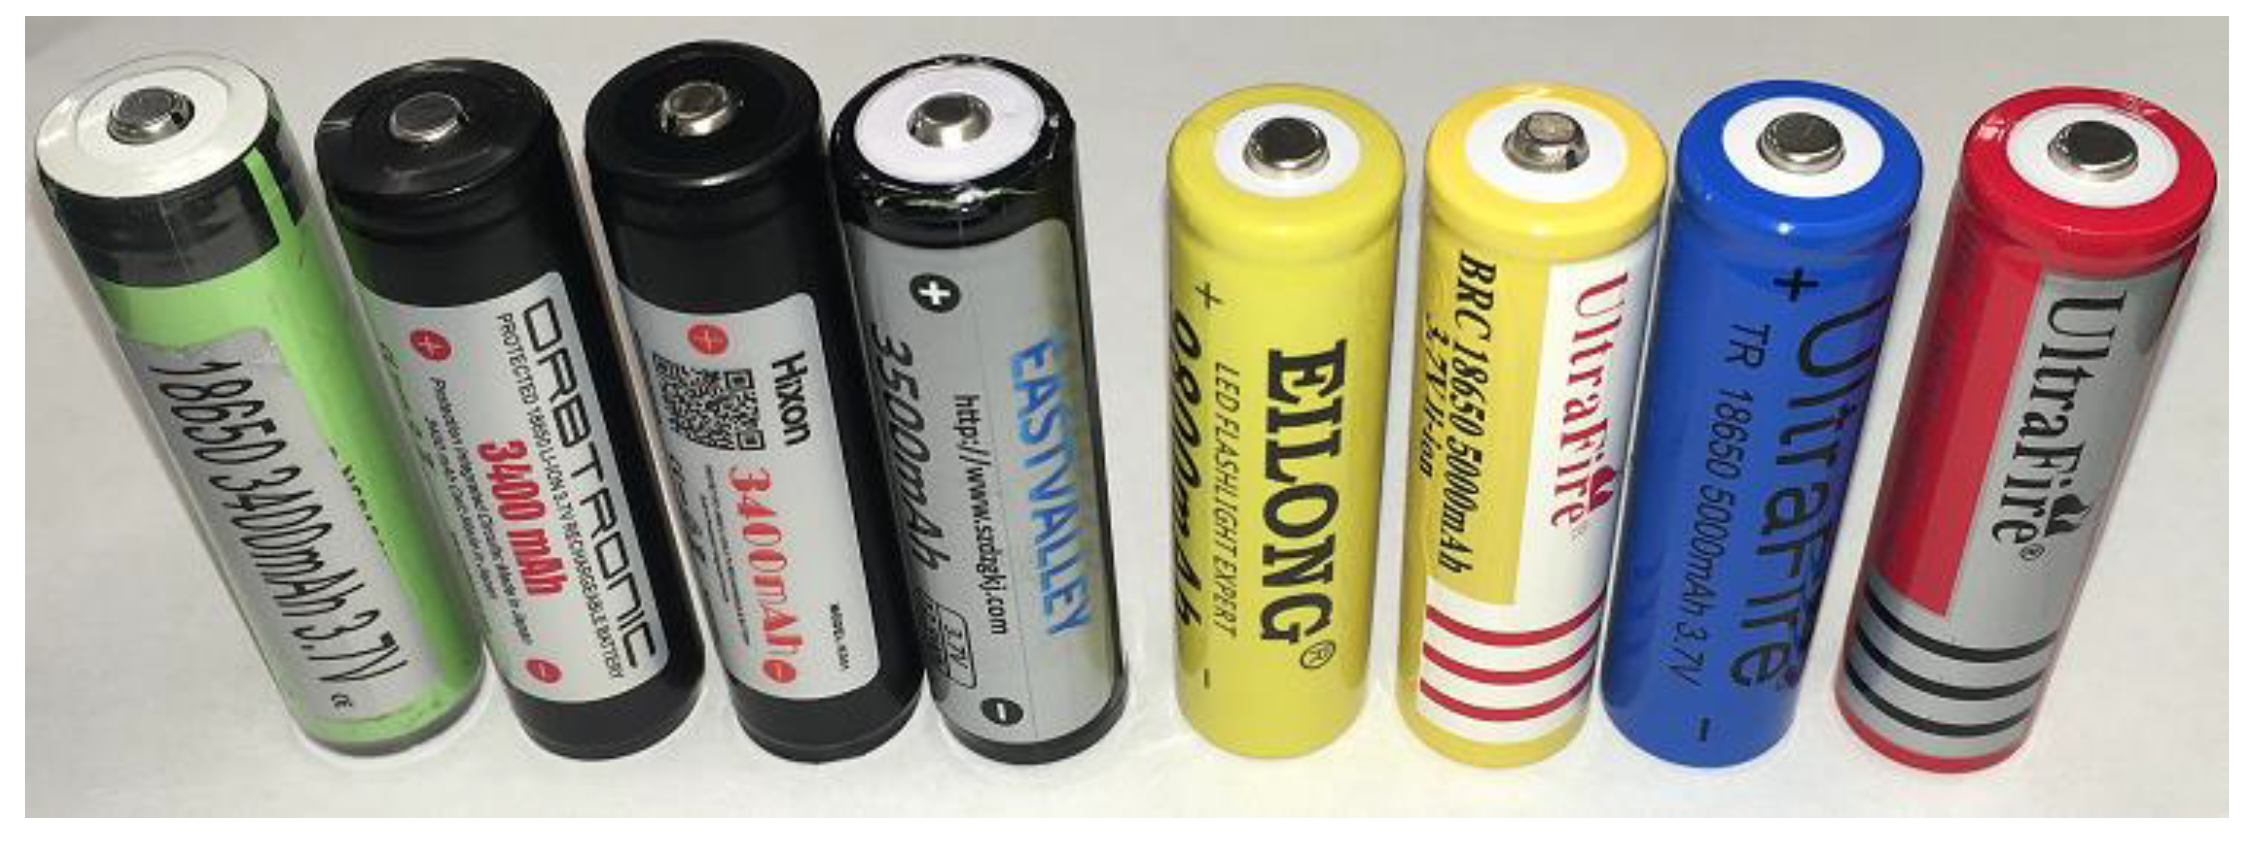
Figure 2.
Cell capacity vs. cycle number for (A) low-cost and (B) high-cost cells, with cycles 1–3 performed at rate C/10, cycles 4–6 at C/5, and cycles 7–9 at C/2, based on cell nameplate capacity (low-cost cells all de-rated to 1200 mAh capacity rating).
Figure 2.
Cell capacity vs. cycle number for (A) low-cost and (B) high-cost cells, with cycles 1–3 performed at rate C/10, cycles 4–6 at C/5, and cycles 7–9 at C/2, based on cell nameplate capacity (low-cost cells all de-rated to 1200 mAh capacity rating).

Figure 3.
(A) Discharge voltage profile at C/10 rate and (B) normalized discharge voltage profile for one cell of each type discharged at a C/10 rate.
Figure 3.
(A) Discharge voltage profile at C/10 rate and (B) normalized discharge voltage profile for one cell of each type discharged at a C/10 rate.

Figure 4.
Capacity comparisons for each cell type normalized to C/10 discharge capacity. Data shown are the average of discharges at each rate.
Figure 4.
Capacity comparisons for each cell type normalized to C/10 discharge capacity. Data shown are the average of discharges at each rate.

Table 1.
Protected 18650 cell characteristics.
| Cell/Model | Nominal Voltage (V) * | Nameplate Capacity (mAh) * | Height (mm) | Diameter (mm) | Weight (g) |
|---|---|---|---|---|---|
| Panasonic NCR18650B | 3.7 | 3400 | 69.53 ± 0.00 | 18.54 ± 0.13 | 47.62 ± 0.03 |
| Hixon NCR18650 | 3.7 | 3400 | 69.27 ± 0.17 | 18.52 ± 0.02 | 47.88 ± 0.07 |
| Orbtronic FBA | 3.7 | 3500 | 68.96 ± 0.09 | 18.56 ± 0.15 | 48.78 ± 0.05 |
| EastValley B35-18650 | 3.7 | 3500 | 69.85 ± 0.08 | 18.52 ± 0.05 | 46.48 ± 0.02 |
| Eilong TR18650 | 3.7 | 9800 | 66.34 ± 0.11 | 18.27 ± 0.07 | 35.52 ± 0.20 |
| UF-Yellow BRC18650 | 3.7 | 5000 | 67.16 ± 0.00 | 18.13 ± 0.02 | 36.25 ± 0.76 |
| UF-Blue TR18650 | 3.7 | 5000 | 66.66 ± 0.14 | 18.08 ± 0.03 | 34.59 ± 0.20 |
| UF-Red BRC18650 | 3.7 | 4000 | 66.38 ± 0.12 | 18.05 ± 0.00 | 33.99 ± 1.38 |
* Cell nominal voltage and nameplate capacity are found on cell outer wrap.
Table 2.
Test procedure for protected 18650 cells. 3-min rest following all charge and discharge steps.
Table 2.
Test procedure for protected 18650 cells. 3-min rest following all charge and discharge steps.
| Step | Description |
|---|---|
| 1 | Discharge to 2.7 V @ C/10 |
| 2 | Charge to 4.2 V @ C/5 rate with C/50 taper |
| 3 | Discharge to 2.7 V @ C/10 |
| 4 | Repeat Steps 2–3 three times |
| 5 | Repeat Steps 2–4 @ C/5 discharge rate |
| 6 | Repeat Steps 2–4 @ C/2 discharge rate |
| 7 | Charge cell to 3.7 V |
Table 3.
Discharge performance compared to cell nameplate capacity. Discharge capacities are the average of two cells at each rate.
Table 3.
Discharge performance compared to cell nameplate capacity. Discharge capacities are the average of two cells at each rate.
| Cell Type | Nameplate Capacity (mAh) | C/10 (mAh) | C/5 (mAh) | C/2 (mAh) | C/10 (%) | C/5 (%) | C/2 (%) |
|---|---|---|---|---|---|---|---|
| Panasonic | 3400 | 3177 | 3094 | 3005 | 93.4 | 91.0 | 88.4 |
| Hixon | 3400 | 3264 | 3180 | 3076 | 96.0 | 93.5 | 90.5 |
| Orbtronic | 3500 | 3399 | 3330 | 3259 | 97.1 | 95.2 | 93.1 |
| EastValley | 3500 | 2924 | 2865 | 2789 | 83.5 | 81.9 | 79.7 |
| Eilong * | 9800 | 944 | 927 | 882 | 9.6 | 9.5 | 9.0 |
| UF-Yellow * | 5000 | 1178 | 1154 | 1113 | 23.6 | 23.1 | 22.3 |
| UF-Blue * | 5000 | 1203 | 1177 | 1140 | 24.1 | 23.5 | 22.8 |
| UF-Red * | 4000 | 1013 | 986 | 938 | 25.3 | 24.6 | 23.5 |
* Rating de-rated from nameplate capacity to 1200 mAh.
Table 4.
Cost comparisons of cells based on published cell data and labeling.
| Type | Nominal Voltage (V) | Nameplate Capacity (mAh) | Cost/Cell ($) | Cost/Capacity ($/Ah) | Cost/Energy ($/Wh) |
|---|---|---|---|---|---|
| Panasonic | 3.7 | 3400 | $10.44 | $3.07 | $0.83 |
| Hixon | 3.7 | 3400 | $10.75 | $3.16 | $0.85 |
| Orbtronic | 3.7 | 3500 | $15.00 | $4.28 | $1.16 |
| EastValley | 3.7 | 3500 | $7.45 | $2.13 | $0.58 |
| Eilong | 3.7 | 9800 | $1.80 | $0.18 | $0.05 |
| UF-Yellow | 3.7 | 5000 | $2.31 | $0.46 | $0.13 |
| UF-Blue | 3.7 | 5000 | $1.50 | $0.30 | $0.08 |
| UF-Red | 3.7 | 4000 | $1.50 | $0.37 | $0.10 |
Table 5.
Cost comparisons of cells based on C/10 discharge performance.
| Type | Nominal Voltage (V) | C/10 (mAh) | Cost/Cell ($) | Cost/Capacity ($/Ah) | Cost/Energy ($/Wh) | Gravimetric Energy Density (Wh/kg) | Vol. Energy Density (Wh/L) |
|---|---|---|---|---|---|---|---|
| Panasonic | 3.6 | 3177 | $10.44 | $3.29 | $0.91 | 240.2 | 609.64 |
| Hixon | 3.6 | 3264 | $10.75 | $3.29 | $0.91 | 245.4 | 630.06 |
| Orbtronic | 3.6 | 3399 | $15.00 | $4.41 | $1.23 | 250.9 | 655.83 |
| EastValley | 3.6 | 2924 | $7.45 | $2.55 | $0.71 | 226.5 | 559.70 |
| Eilong | 3.7 | 944 | $1.80 | $1.91 | $0.52 | 98.3 | 200.83 |
| UF-Yellow | 3.7 | 1178 | $2.31 | $1.96 | $0.53 | 120.2 | 251.43 |
| UF-Blue | 3.7 | 1203 | $1.50 | $1.25 | $0.34 | 128.7 | 260.28 |
| UF-Red | 3.7 | 1013 | $1.50 | $1.48 | $0.40 | 110.5 | 220.30 |
© 2018 by the authors. Licensee MDPI, Basel, Switzerland. This article is an open access article distributed under the terms and conditions of the Creative Commons Attribution (CC BY) license (http://creativecommons.org/licenses/by/4.0/).
Share and Cite
MDPI and ACS Style
Baksa, S.; Yourey, W. Consumer-Based Evaluation of Commercially Available Protected 18650 Cells. Batteries 2018, 4, 45. https://doi.org/10.3390/batteries4030045
AMA Style
Baksa S, Yourey W. Consumer-Based Evaluation of Commercially Available Protected 18650 Cells. Batteries. 2018; 4(3):45. https://doi.org/10.3390/batteries4030045
Chicago/Turabian StyleBaksa, Steven, and William Yourey. 2018. "Consumer-Based Evaluation of Commercially Available Protected 18650 Cells" Batteries 4, no. 3: 45. https://doi.org/10.3390/batteries4030045
Note that from the first issue of 2016, this journal uses article numbers instead of page numbers. See further details here.