
Recurrent Neural Networks for Estimating the State of Health of Lithium-Ion Batteries


Postgraduate Programme in Metrology, Pontifical Catholic University of Rio de Janeiro, Rio de Janeiro 22451-900, RJ, Brazil
*
Author to whom correspondence should be addressed.
Batteries 2024, 10(3), 111; https://doi.org/10.3390/batteries10030111
Submission received: 25 January 2024
/
Revised: 12 March 2024
/
Accepted: 14 March 2024
/
Published: 20 March 2024
(This article belongs to the Section Battery Performance, Ageing, Reliability and Safety)
Abstract
:Rapid technological changes and disruptive innovations have resulted in a significant shift in people’s behavior and requirements. Electronic gadgets, including smartphones, notebooks, and other devices, are indispensable to everyday routines. Consequently, the demand for high-capacity batteries has surged, which has enabled extended device autonomy. An alternative approach to address this demand is battery swapping, which can potentially extend the battery life of electronic devices. Although battery sharing in electric vehicles has been well studied, smartphone applications still need to be explored. Crucially, assessing the batteries’ state of health (SoH) presents a challenge, necessitating consensus on the best estimation methods to develop effective battery swap strategies. This paper proposes a model for estimating the SoH curve of lithium-ion batteries using the state of charge curve. The model was designed for smartphone battery swap applications utilizing Gated Recurrent Unit (GRU) neural networks. To validate the model, a system was developed to conduct destructive tests on batteries and study their behavior over their lifetimes. The results demonstrated the high precision of the model in estimating the SoH of batteries under various charge and discharge parameters. The proposed approach exhibits low computational complexity, low cost, and easily measurable input parameters, making it an attractive solution for smartphone battery swap applications.
1. Introduction
Electronic devices play a crucial role in almost every human activity in today’s highly electricity-dependent world. Consequently, a reliable energy supply is essential for these devices, making batteries a key component in the era of mobility and connectivity.
Lithium-ion batteries have emerged as the most widely used electronic equipment because of their environmentally friendly nature compared with lead–acid or NiCd batteries. They offer higher power and energy levels per unit mass, enabling compact designs without compromising energy capacity [1,2,3].
Developing energy storage systems with large capacity and compact dimensions, ensuring safety, reliability, and energy autonomy for mobile electronics, remains a significant challenge in battery technology. Battery sharing and swaps have emerged as viable alternatives for addressing the issue of autonomy. When combined with high-energy-density batteries, these solutions can extend the runtime of electronic devices without requiring frequent recharging.
The battery sharing market has witnessed significant global growth, primarily driven by the increasing adoption of electric vehicles and their energy storage demands [4]. Several types of battery stations have been proposed to cater to this application, considering factors such as initial cost, battery lifespan, charging times, and availability of the power grid. However, the sustainability of these exchange stations poses business challenges, particularly concerning customer demands [5].
Another alternative discussed in the literature is the battery swap approach, where users exchange their device batteries for pre-charged ones available within a swap network, reducing the time spent on recharging. However, user satisfaction depends on the quality of the exchanged batteries. Some authors, such as Infante et al. [4], Liu et al. [6], Yang et al. [7], and Gueller et al. [8], proposed systems that provide only healthy batteries to customers and discard unfit batteries. Although this approach preserves customer satisfaction, it may lead to unnecessary disposal of batteries that still have a usable life, contributing to ecological concerns.
Battery applications extend to everyday devices, such as smartphones, laptops, and emerging wearable devices for activity monitoring, including childcare applications [9]. In Brazil, Energy2Go has addressed battery energy challenges by implementing a battery swap infrastructure based on smartphone-compatible power bank batteries, enabling users to exchange fully charged power banks at city terminals instead of owning personal rechargeable batteries [10].
For the battery swap model to thrive, understanding the evolution of battery health over time is crucial to avoid power disruptions and predict replacement needs. State of health (SoH), defined as a battery cell’s ability to retain charge concerning its nominal capacity, plays a vital role in observing battery degradation and preventing critical system failures [11,12].
Extensive research has been devoted to the advancement and implementation of model-based, physics-informed machine learning, and adaptive approaches for estimating the SoH [12,13,14,15]. Research has also been conducted on the thermal behavior of lithium-ion batteries using neural networks to better understand the safety risks and degradation processes that could help predict the state of charge of the batteries [16].
Although significant progress has been made, to the best of our knowledge, relatively few investigations have specifically focused on the estimation of SoH in lithium-ion batteries utilized in battery swap systems intended for smartphone charging. Hence, precise SoH estimation is crucial for the advancement of battery swap applications or shared models.
In this context, this study aims to build a model for estimating the SoH curve of lithium-ion batteries using the state of charge (SoC) curve. The model was designed for smartphone battery swap applications utilizing Gated Recurrent Unit (GRU) neural networks. This methodological choice offers the advantage of being designed to recognize patterns in data sequences and has a lower computational cost compared to other artificial neural networks (ANNs). To validate the model, a system was developed to conduct laboratory destructive tests to study battery behavior during charging and discharging cycles, and the results were used to train and validate the neural network model.
The remainder of this paper is organized as follows. The study’s contextualization and relevance are presented in Section 1. Section 2 provides a literature review on lithium-ion batteries, including the concepts of SoH and SoC. Section 3 outlines the research design for building a model for estimating the SoH of lithium-ion batteries in battery swap applications. Section 4 describes the construction of the system to test and validate the proposed SoH predictive model and its application to swapping systems. Section 5 presents and discusses the results of this study. Finally, in Section 6, conclusions and recommendations for future work are presented.
2. Main Parameters of Lithium-Ion Batteries
Currently, research on batteries is increasing as the demand for mobile energy increases, and aspects such as safety, security, and reliability have become increasingly important.
The primary parameter of interest in battery degradation studies is battery energy capacity. The energy capacity determines the duration of battery discharge, and it is not a fixed value; rather, it is affected by the discharge current (higher discharge leads to lower capacity), operating temperature, usage patterns, and charging and discharging patterns [14,17,18].
Some researchers have observed the importance of the recovery effect [17,19]. This effect involves ionic reorganization within the electrolyte during periods of no or significantly reduced discharge current. As a result, the effective battery capacity can be increased [17,19]. However, when a battery is stressed with high discharge currents without sufficient time for electron reorganization, its effective capacity can be decreased [1].
The key battery characteristics summarize the significant conditions and energy capacity [11], as follows:
- C-Rate: C-Rate represents the charge and discharge currents related to maximum battery capacity. This indicates the rate at which the battery was charged or discharged relative to its full capacity in one hour;
- State of charge (SoC): SoC is expressed as a percentage of the battery’s current capacity relative to its maximum capacity, which is the nominal capacity provided by the manufacturer. Typically, SoC is used to monitor changes in battery capacity over time during a cycle;
- State of health (SoH): SoH is a percentage that indicates the battery’s charge capacity, referring to the number of charge/discharge cycles it has undergone. SoH is commonly used to predict the lifespan of a battery;
- Depth of Discharge (DoD): DoD quantifies the battery capacity discharged as a percentage of its maximum capacity. A discharge of 80% or more is considered a deep discharge;
- Life Cycle: The number of charge and discharge cycles a battery can endure without experiencing significant performance degradation. The life cycle of batteries is influenced by factors such as charging rate (C-Rate), depth of discharge, temperature, and humidity. Generally, a battery is considered to have completed its life cycle when its capacity falls between 80 and 70% of its rated capacity;
- Charge Voltage: The voltage applied to charge the battery to its maximum capacity. The charging process typically involves a constant-current charge until the battery reaches a specific voltage, after which it enters constant-voltage mode, allowing the charging current to decrease until no more current flows or becomes too small;
- Charge Current: The ideal current at which the battery is initially charged (to approximately 70% SoC) under constant-current conditions before transitioning to constant-voltage charging.
- Cut-off Voltage: The voltage is associated with the fully discharged battery.
Compared with Ni-Cd and Ni-MH batteries, lithium-ion batteries are less toxic and less prone to self-discharge effects, respectively. Li-ion batteries have a higher energy capacity per unit mass, making them widely used in mobile devices that require high power levels, such as smartphones [19].
LiCoO2 batteries are commonly used in mobile phones, laptops, and digital cameras owing to their high-energy characteristics. During discharge, Li ions move from the anode to the cathode, whereas during charging, the flow direction is reversed. However, LiCoO2 batteries have a shorter lifespan, poor charge stability, and limited energy capabilities compared with other types of lithium batteries [20]. Compared to other types of lithium-ion batteries, LiCoO2 batteries have (i) a better cost-to-recharge cycle ratio and (ii) a higher specific energy than LiMn2O4 batteries. LiCoO2 batteries also have an excellent ability to provide consistent and stable discharge currents, which are crucial for high-performance equipment. In addition, they are chemically stable, ensuring safety during both storage and use. The charging process of lithium-ion batteries can be divided into two phases: constant current and constant voltage. In the constant-current phase, a specific current value is applied based on the power capacity of the battery, which gradually increases the battery voltage. Once the maximum voltage is reached, the charging process enters the constant-voltage phase, during which the charging current decreases as the battery reaches full charge [18]. The battery is considered fully charged when the voltage reaches the limit and the current drops to approximately 3% of the rated current. A battery is also considered fully charged if the current becomes steady and cannot be further decreased.
Manufacturers typically specify the life of lithium-ion batteries to be between 300 and 500 discharge/charge cycles. However, evaluating battery life solely based on cycle counts is inconclusive, as discharge can vary in depth, and there are no universally defined standards for defining a cycle. Instead, battery performance is measured in capacity, a crucial indicator of battery health. Although internal resistance and self-discharge also affect battery life, they are less significant in predicting end of life [21].
The concept of a discharge/charge cycle sometimes entails complete discharge of the battery, followed by recharge. Batteries are rarely fully discharged, and manufacturers often use an 80% depth of discharge as a parameter to assess battery performance [21].
Regarding the charging and discharging currents, lithium-ion batteries should only be subjected to currents whose C-rate is greater than 1 C with special treatment for fast charging [20]. For example, a 5000 mAh battery should only be charged and discharged up to a current of 5000 mA, which represents a C-rate of 1 C (e.g., analogously to the current for the case of 2 C, it would be equal to 10,000 mA, and in the case of 5 C, 25,000 mA). Applying a fast charge or a current higher than 5000 mA can lead to overheating and unnecessary stress on the battery. Consequently, the temperature must be controlled during the charging and discharging processes, with interruptions if it exceeds the specified threshold at moderate charging speeds [22].
High charge voltages and elevated temperatures also stress lithium-ion batteries. Reducing the peak charge voltage by 0.10 V/cell can double the battery life.
2.1. State of Health (SoH) of Batteries
The absence of well-established methods and reliable techniques in the literature has led to a lack of consensus on the best model for estimating the SoH of batteries [13,23,24,25,26,27,28,29]. All the models reviewed in the exploratory phase of this study are not completely accurate and are highly complex. Applied models of SoH estimation for batteries intended for use in battery swap systems are rare in the literature.
Pajovic et al. [24] state that the energy capacity should be considered an excellent indicator of the battery’s SoH. A lithium-ion battery is considered to reach the end of its useful life when its capacity decreases by 20% or 30% from its nominal value. Nevertheless, measuring battery capacity directly poses a challenge owing to its inaccessibility [21]. According to Hannan et al. [26], the SoH can be defined as the percentage of the maximum available capacity relative to the maximum rated capacity, serving as an indicator of the battery’s long-term capacity. Typically, SoH is expressed as:
where is the current maximum battery capacity, and is the maximum battery capacity at the beginning of its life cycle.
Ungurean et al. proposed a new approach for calculating SoH [23]. Their approach was used in this study to determine the most suitable method for estimating and defining the SoH (Equation (2)).
where state of charge (SoC) is defined in Equation (3), and is the SoC chosen to determine that the end of battery life has been achieved. is usually determined as 0.2 or 0.3, that is, when the battery loses 20% or 30% of its rated capacity, it is defined as the end of its life. For this work, is set to 0.2.
where is the current capacity of the battery, and is the initial capacity of the battery, that is, the capacity absorbed by the battery at the beginning of its life according to its mode of operation.
Various models for estimating the SoH of a battery have been reported in the literature, ranging from intermittent manual voltage measurements and electrical parameters to fully automated online supervision of various measured and estimated battery parameters [12,26]. Methods for estimating SoH are divided into model-based and adaptive approaches [29].
Model-based methods use measured or calculated data and batteries over time under various operating conditions. With these data and prior knowledge of the influence of the main parameters that affect the battery during its useful life, an estimate of the SoH can be performed. This approach requires a deep understanding of the physical and electrochemical parameters of batteries to trace the relationship between battery operation and degradation. Models constructed using this approach tend to be entirely accurate but cannot be replicated in other types of batteries and generally use a more complex mathematical formulation [29]. Table 1 presents model-based methods used to estimate the SoH.
Adaptive methods determine the SoH using parameters that are sensitive to battery cell degradation. These parameters must be measurable throughout battery operation. This approach offers the advantage of requiring only a few tests and simulations of battery behavior. In addition, it guarantees better adaptability to different types of batteries. However, it has the disadvantages of high computational complexity and a large volume of measurement data, which can hinder the online execution of models in real applications [28]. Table 2 presents the adaptive methods used to estimate SoH.
Semanjski and Gautama performed an SoH forecasting work of batteries of two identical electric vehicles being used in different tests [65]. This result can provide a valuable reference for designers of vehicle battery swap systems. Specifically, the findings of this study demonstrate that batteries eventually reach the end of their useful lifespans at different times depending on the conditions of use and charging.
Chen et al. used the cycle number, voltage drop value, and internal resistance variation over time to estimate the SoH of lithium-ion batteries [66]. These authors used the Fuzzy T-S model to establish a dynamic method for the SoH prediction.
Yu proposed a battery health prognosis system developed using Bayesian inference and state–space models that integrated logistic regression and particle filtering [25]. The probabilistic model of Bayesian inference quantifies and indicates the health status of the battery. The model proposed in this study offers the probability of failure for monitored batteries, which is intuitively related to the SoH. The state–space model is used to model the spread of battery health over time, where logistic regression and particle filters are integrated to predict the remainder of battery life. The experimental results obtained for a lithium-ion battery illustrate the possible application of the proposed system as an effective tool for the prognosis of battery health.
Considerable research has been dedicated to developing and applying model-based and adaptive methods to estimate the SoH of batteries (Table 1 and Table 2). Despite the importance of the results achieved thus far, to the best of our knowledge, no previous studies have focused on estimating the SoH of lithium-ion batteries used in battery swap systems for smartphone charging. To address this research gap, we chose an adaptive method based on an Artificial Neural Network (ANN) to construct a predictive model for estimating the SoH of lithium-ion batteries in battery swap applications.
Gated Recurrent Units (GRUs) as a gating mechanism in recurrent neural networks were chosen to estimate the SoH of smartphone battery swap applications to achieve the proposed objective, given their lower computational cost compared with other recurrent neural networks. Additionally, the limitation of the available database size for training the Artificial Neural Network (ANN) has a more significant impact on a traditional network than on a GRU neural network, as it has memory to evaluate the evolution of the variable over time, providing greater robustness to the proposed model. Laboratory destructive tests were conducted to analyze the battery behavior during charging and discharging cycles, and the results were used to train and test the neural network model.
3. Research Design
This section outlines the research design for building a model for estimating the SoH of lithium-ion batteries in battery swap applications. It follows a procedural model based on [67], which consists of three phases and five stages, providing a clear structure and well-established course of action for this research, as shown in Table 3. The research phases were: (i) motivation, (ii) development, and (iii) validation.
The first stage involved defining the problem and providing a rationale for the research, as discussed in the introductory section.
The second stage entails conducting a thorough review of existing research on core topics and identifying unresolved matters in the field of study. Initially, a literature review was conducted focusing on the central research topics. The current state of research analysis summarized in Table 1 and Table 2 led to identifying a research gap, that is, a model designed for smartphone battery swap applications utilizing recurrent neural networks.
The third stage refers to the research methodology to develop the referred predictive model. The focus on the unaddressed research gap led to the selection of an adaptive method based on Artificial Neural Networks (ANNs). First, this section describes the charging/discharging system of lithium-ion batteries built for this research. This system was used to generate training data for the neural network and validate the proposed model (Section 4.1). Next, we describe the construction of the proposed model (Section 4.2).
Finally, in the last stage, the results and implications of this research are discussed (Section 5).
4. Materials and Methods
This section addresses the materials and methods used to build the model to estimate the SoH of lithium-ion batteries in battery swap applications. Section 4.1 describes the charging/discharging system of lithium-ion batteries built for this study. This system was used to generate training data for the neural network and validate the proposed model. Section 4.2 presents the proposed model.
4.1. Battery Charging/Discharging System
This subsection describes the development of the system used to test the influence of various parameters that characterize the charge and discharge cycles on the life of lithium-ion batteries. The entire project was built based on the characteristics of lithium-ion batteries presented in Section 2. The system can measure and store data on the parameters necessary to use the proposed neural network. The proposed system is responsible for generating the training and testing data for the neural network. It is important to note that the measurement system, including data storage, has a low cost and can be adapted to work on battery swap systems. Thus, the neural network can be improved by collecting real data from batteries for business model applications.
The system comprises three stages: charge, open circuit, and discharge. In the charging stage, the battery was initially charged with a constant current, as detailed in Section 2.1. After reaching full charge, the battery is in open-circuit mode for a set time, which is vital for the internal reactions of the battery to occur, and it enters the discharge stage after the recovery effect. The last stage is discharging, where the battery is discharged using resistance until it reaches the specified cutting voltage.
The system aims to test the effect on the lifetime of 16 lithium-ion batteries examined simultaneously and some parameters that characterize the charge and discharge steps of this type of battery. The parameters considered for the development of the system are:
- : Characteristic current of the charging stage with constant current;
- : Voltage limit featuring the end of the charge stage constant current;
- : Open voltage of the measured battery between the charge stage and discharge;
- : Current that establishes the end of the stage with constant voltage and the beginning of the discharge stage;
- : Resistance used to discharge the battery;
- : Current characteristic at the beginning of the discharge stage (VC/RD);
- : Voltage limit establishing the end of the discharge stage;
- : storage capacity of the battery charge.
The system was designed with a modular configuration, in which the 16 test batteries for smartphones were organized into four groups, each containing four batteries. The choice of batteries is associated with the research problem (smartphone battery swap), but the study could potentially be extrapolated to other types of batteries, such as those used in bicycles and electric vehicles. Charge and discharge parameters can be controlled by hardware or software. The parameters of each group are listed in Table 4.
The parameters were selected according to various charging modes commonly employed in the market. To enhance battery durability, a minimum discharge voltage of 3.3 V was uniformly established for all groups. For all groups, the discharge stage started when the load current was equal to 10% of the constant-current charge value. For all batteries, = 1.64 Ω.
The block diagram in Figure 1 presents the components of the proposed system as if it were used for testing only one battery. The diagram shows both electronic components, such as resistors, switches, and voltage sources, as well as the three module blocks: the charging circuit (CC), the drive module and data acquisition system (DAS), and a microcomputer that runs the supervision and control software (COMP).
Although Figure 1 indicates only the and settings, the charging circuit allows to be adjusted internally. The variation in the value is made externally to the charging circuit through the change in the resistor, while has its value established by the software.
The charging circuit is a refed linear circuit capable of implementing two charge stages (constant current and constant voltage). Its design was based on a standard battery charging circuit, which was changed to meet the requirements of the test system (increased charge current capacity, inclusion of discharge stage control feature, use of high thermal stability voltage reference, etc.). To make the charging system more robust and reliable, a circuit was introduced to supervise and control the battery temperature, where the data were stored using software.
A timing circuit was introduced to control the battery voltage readings in the open circuit. Thus, it is possible to measure the voltage without the influence of the charge circuit and the internal inductance of the battery at the end of each complete charge cycle.
At the end of the tests with the single-channel prototype, a stable configuration was achieved that operated in conjunction with the Acquisition and Control Units (ACUs) according to the design specifications. It was then set out to create a definitive layout for each of the 4-channel plates that would make up the lithium-ion battery life test system. The final schematic of the 4-battery charge/discharge circuits is shown in Appendix A (Figure A1). The charge and discharge tests of a single battery were carried out 16 times to measure the charge and discharge of the four groups of batteries. Thus, it was possible to build four boards that contained four test circuits. Thus, each battery group could be tested on a board.
Figure 2 shows the complete circuit, which was assembled on a bench to begin testing. It was also possible to observe the two power sources used to power the batteries. Two ACUs were used to communicate with the circuits using a computer. Two ACUs were used owing to the limitations of the available bus bars on a single board.
It is worth emphasizing that the tests outlined in this study were intended to charge and discharge the batteries until the end of their useful lives, so the system remained on for a long time. Therefore, it was necessary to insert a series of safety measures into the circuit to ensure that any external problem (e.g., lack of power) did not interfere with the measurements or integrity of the batteries.
An initial specification was designed for the software to control the charging/discharging system through the ACU. The input and output lines of the ACU are shown in Figure 3, where VB is the Analog input line 1, the battery voltage; VT is the Analog input line 2, the battery temperature; FD is the Digital output line 1, end of the discharging step; FT is the Digital output line 2, end of the test; LCA is the Digital input line 1, and the command for reading the open battery voltage.
The software was created using LabVIEW ® (National Instruments, Austin, TX, USA) and served to store test data and manage the battery charge/discharge system via the Acquisition and Control Unit. The ACU collects voltage readings (in both open and closed circuits) and battery temperature data from the circuit. Subsequently, the software stores the data in ‘.csv’ file format, which was chosen because of its capacity to accommodate unlimited rows. The test comprised three stages: charging, open circuit, and discharge. By default, the program initiates the charging mode and transitions to the open-circuit stage when it detects the constant-voltage charging period.
The program was responsible for controlling the discharge, starting a new cycle of loading, open-circuit measurement, and discharge. The software also indicated the end of the test when it identified that the battery had reached the limit of its useful life, that is, when the total battery charge was less than 80% of its initial total charge. This control is achieved through the digital signals sent at the end of each process. Thus, the software is responsible for storing the data and automatically controlling the charge and discharge of the batteries.
As mentioned, the voltage (open and closed circuits) and temperature data are stored in a table format (‘.csv’ file). In addition, full-capacity data are stored at the end of each cycle. The software calculates these data by using the current integral over time. This information will be used to analyze the battery life over time and will also be essential for building a predictive model of the battery health curve. It is important to note that the battery capacity is also calculated from the data measured by the Coulomb counting method. In this mode, it is possible to compare the results obtained from both calculations and check the quality of the measurements and the operation of the software.
The software also plays a crucial role in ensuring circuit safety. This is accomplished by continuously monitoring the temperature data; if it surpasses 50 °C, the circuit is automatically deactivated, and a notification of the interruption caused by high temperature is displayed on the program screen. A discharge voltage limit of 2.6 V was established to safeguard battery integrity. This limit comes into effect in the case of hardware failure in any control, ensuring that the battery does not discharge continuously. Consequently, when this voltage threshold is reached, the system activates an alarm and disconnects the battery, rendering it in an open circuit.
4.2. Proposed Model for Estimating the State of Health of Lithium-Ion Batteries
An Artificial Neural Network (ANN) is a computational algorithm designed for information processing that draws inspiration from the functioning of the human brain. Similar to the human brain, an ANN is capable of learning, generalizing, and making decisions based on acquired knowledge [68]. Training is an essential aspect of ANN functionality, resembling the learning process in the human brain. A common method for training an ANN is supervised learning, in which input data are provided to the network, allowing it to generate a corresponding response or output. The learning process involves comparing the output produced by the ANN with pre-existing reference information. By analyzing the disparity between the generated output and known reference value, the ANN adjusts its internal processing to minimize the identified error. This adjustment primarily involves modifying the weights (synaptic weights) associated with each neuron in the ANN. Consequently, the training process proceeds through iterative presentation of data, comparison of the output with known values, and subsequent weight adjustments. [69].
It is crucial to emphasize that, during the training process, all ANNs inherently work towards minimizing errors associated with the specific dataset used for training. However, caution must be exercised to prevent overtraining (or overfitting) because this can lead to the network exclusively representing the training data, resulting in a diminished ability to generalize.
The fundamental architecture of a neural network consists of three layers: input, hidden, and output layers. In the context of the SoH estimation, the input layer typically comprises a vector of instantaneous current, voltage, and temperature values. These inputs constitute multiple explanatory factors that assist the neural network in reproducing the SoH value, which is represented by the last layer of the ANN [70]. In the proposed model, the input parameters include the state of charge (SoC), estimated using the Coulomb counting method, along with the maximum battery voltage, charging time, and charge current during the constant-current phase.
According to [68], a basic ANN model has several components, as follows:
- Set of synapses: Connections between ANN neurons. Each has a synaptic weight;
- Activation function: Responsible for restricting the amplitude of the output value of a neuron;
- Bias: Value applied externally to each neuron and has the effect of increasing or decreasing the input value of the activation function.
By training the neural network with input–output pairs, a nonlinear map that accurately captures the input–output relationship can be constructed without requiring prior knowledge of the battery’s internal structure [26]. The relationship between the input and output layers is determined by configuring an optimal combination of hidden layers, hidden neurons, and activation functions. From the input data received by n neurons (yi), the neuron k (hk) calculates its output using Equation (4).
where hi is the output calculated by neuron , represents the synaptic weight between neurons and , is the bias value, and f is the activation function. If the neuron is connected to the inputs, the term hi is replaced by the inputs provided.
The estimation of the synaptic weights and bias occurs through the training of the network, that is, through an iterative process in which the initial parameters are used until the convergence of the process [68].
Several neural network configurations have been reported in the literature, including the neural network back propagation (NNBP), radial base function neural network (RBFNN), recurrent neural network (RNN), and wavelet neural network (WNN). However, the fundamental concepts of these variations remain similar.
In this study, a Gated Recurrent Unit (GRU) Recurrent Neural Network was employed. This type of recurrent neural network processes data considering their evolution over time. Given that the state of health (SoH) of batteries changes over time, with a decrease in the expected SoH corresponding to an increase in the number of battery cycles, a recurrent neural network is suitable for estimating the SoH.
Recurrent neural networks are characterized by their rapid learning pace, necessitating fewer training iterations (typically fewer than 1000), requiring fewer input parameters, and offering enhanced generalization capabilities [66]. Information from previous iterations was stored in the hidden layers of the recurrent neural network. In contrast to the hidden layer of classical neural networks, which receives signals solely from the input layer, the hidden layer of the recurrent neural network receives signals from both the input and hidden layers in the preceding iteration. Thus, RNNs can process sequential or temporal information more appropriately than ANNs. Figure 4 depicts the recurrent neural network’s data’s interaction.
As illustrated in Figure 4, the hidden layer functions as memory. During each period, the neural network stores the observed information and retrieves the information from the previous hidden states.
Recurrent neural networks are generally not adept at handling noisy data. However, the GRU recurrent neural network is specifically designed to identify oscillations in data and disregard unreliable data, enabling it to manage noise effectively [23]. Given that the data used to train the proposed model contain noise, employing this type of neural network is a suitable choice.
The batteries possess nominal capacity values, as specified by the manufacturer. Nevertheless, depending on the mode of use, a battery may fail to retain the entire charge, as promised by the manufacturer, thereby failing to deliver the rated capacity. In this study, identical batteries were tested under various modes of use, exhibiting distinct capacities, despite sharing the same specifications. To enhance the performance of the neural network, one of the battery parameters to be considered is the state of charge (SoC), as per Equation (3). The same equation, expressed in terms of instantaneous battery capacity, is presented in Equation (5).
where is the current capacity of the battery, and is the initial capacity of the battery, that is, the capacity absorbed by the battery at the beginning of its life according to its mode of operation. is thought of as the battery’s nominal capacity but without necessarily having the same value indicated by the manufacturer. Thus, the SoC values were normalized, improving the neural network performance.
In addition to SoC, the other parameters of the batteries needed for the construction of the network are the maximum voltage, charge current, and charging time. Once it is a recurrent neural network (with memory), data from different batteries should not be mixed, avoiding a negative influence on the result. As mentioned in Section 2.1, SoH is defined using Equations (1) and (2), and their results are compared.
The RNN with GRU was programmed in Python, which is a widely used open-source programming language. The data used to train the network were extracted from the testing system, which was also used to validate the tests. These essays are explained in the next section. The quality of the ANN was measured using the mean squared error (MSE) and root-mean-square error (RMSE). The algorithm automatically calculated the error according to the calculated and measured data. MSE and RMSE were calculated according to Equations (6) and (7), respectively.
The Mean-Squared Error (MSE) squares the error, magnifying predictions significantly far from the actual value, making it an excellent evaluation metric for problems intolerant to large errors. However, one drawback of using this metric is its lack of direct interpretability. Specifically, to predict the unit x values, the MSE unit is x2. Therefore, the Root-Mean-Squared Error (RMSE) was also analyzed. Both MSE and RMSE are effective parameters for evaluating the quality of the network.
It would not be valid to use the technique of splitting training data into batches, because they have a significant temporal dependency. However, because the measurement system evaluated four batteries for each of the four tested charging regimes, the records of the three batteries were selected for use in the network training, leaving the records of the remaining battery for testing. To achieve optimal results, the training data were partitioned into three groups based on load current. Consequently, batteries charged with 1 A in the constant-current phase constitute Group 1, those charged with 2 A form Group 2, and batteries charged with 3 A belong to Group 3.
Thus, four Gated Recurrent Unit (GRU) recurrent neural networks were constructed. An RNN received training data from all batteries, irrespective of the load current. The other networks received battery training data specific to a given group (based on the load current in the constant-current phase). Consequently, the RNN with GRU 1 received training data from Group 1, the RNN with GRU 2 received training data from Group 2, and the RNN with GRU 3 received training data from Group 3. All RNNs were configured in identical settings.
When a battery is submitted to predict its SoH over time, the algorithm identifies the charging current during the constant-current phase. The SoH curve was then estimated using a network trained by batteries with the same charging current. Additionally, SoH estimation is carried out using the RNN with GRU4, which incorporates training data from all available batteries. The RMSE, MSE, and MAE indicators were compared, and the algorithm output the SoH curve with the smallest values for the adopted comparison metrics.
The RNN with GRU was designed to predict the SoH curve of the battery over time based on information such as the charging current, maximum voltage, charging time, and state of charge (SoC). The method for SoH estimation is summarized in Figure 5 and Figure 6. Figure 5 depicts the training process of the RNN with GRU in the proposed model, while Figure 6 outlines the structure for estimating the SoH curve of lithium-ion batteries.
Several RNNs were tested under different parameters until the network with the lowest errors was identified. For training, three batteries from each group were used, and one battery from each group served as a test. Cross-validation was conducted to determine the optimal RNN, characterized by the lowest errors. This technique aims to detect overtraining and prevent an RNN from losing its generalization power. During RNN training, it was tested with a dataset distinct from the training data to identify the point where the errors associated with the validation data were significantly larger than those observed during training.
The neural network employed a regression model that utilized the last ten measured battery data. It consisted of four hidden layers, including three GRU-type layers and one dense layer (a type found in traditional neural networks). The first hidden layer employs 300 units serving as memory cells, whereas the subsequent layers have 250 units. Dropout layers with a rate of 0.3 are also incorporated to prevent overfitting. The optimizer used is RMSprop, which maintained a moving average (discounted) of the square of gradients and divided the gradient by the root of this mean. Another crucial parameter is the number of epochs, which represents the number of times the network is trained, with each epoch exhibiting varying performance. The neural network retains the training weights from the epoch with the best performance. In this study, 400 epochs were employed along with Early Stopping. Early Stopping halts training when the neural network fails to improve performance over 10 consecutive epochs. Additionally, for every five epochs without improvement, the learning rate decreased, potentially enhancing the performance in subsequent epochs.
The construction of the neural network was designed to minimize errors with a manageable computational cost. The network yielded a curve containing the estimation of the SoH of the battery under investigation. Two methods were employed to define SoH in this study, presenting a curve for each method generated by the artificial neural network. The results and performance of the neural network are analyzed in the subsequent section.
5. Results
5.1. Battery Charging/Discharging Testing
After the implementation and testing of the proposed measurement system, measurements were performed using 16 batteries that were never used, according to the parameters described in Table 4. The batteries were lithium-ion (LiCoO2) with 5000 mAh of rated capacity, nominal voltage of 3.6 V, and typical operating range of 3.0 and 4.2 V/cell. In terms of C-rate, these batteries were recommended to charging regimes that vary between 0.7 and 1 C, while the recommended discharging is at 1 C.
The proposed measurement system presented in Section 4.1 automatically charges and discharges the batteries. Figure 7 shows the charge/discharge curves of one of the batteries. As can be observed, 19 cycles were performed for this battery. In this case, the charge/discharge cycle took approximately 5 h, reaching four cycles per day.
The measurements indicated that the charging parameters significantly altered the behavior of the batteries over their lifetimes. It is important to remember that the mode of use of the batteries during testing was not as expected by the manufacturer (for example, the cutting voltage was 3.3 V in the tests, whereas the manufacturer recommended a discharge up to 3 V). Thus, no battery reached the nominal capacity proposed by the manufacturer.
Table 5 lists the average number of cycles performed during the measurements, average cycle time, average charging time, and average capacity of each battery group. As anticipated, Group 4 (with a constant current of 3 A) exhibited a shorter charging time for the batteries, resulting in more cycles than the other groups. However, this group exhibited the lowest charge retention. The increased load instability in Group 4 is attributed to the stress experienced by the batteries during the constant-current charging processes.
Group 3 exhibited the highest average capacity among all groups. The only difference from Group 2 was the voltage during the constant voltage phase, indicating that this voltage level significantly influenced the battery’s charge retention capacity. Nonetheless, it is worth noting that the Group 3 batteries required longer charging times than those in Group 2.
Group 1 batteries were charged with a current of 1 A, resulting in longer charging times compared to the other groups. Consequently, the batteries in this group underwent fewer charge–discharge cycles. Therefore, the training data for this group were significantly less extensive than those of the other groups.
5.2. Model for Estimating State of Health (SoH) in Lithium-Ion Batteries
Recurrent neural networks were employed to construct the proposed model. This type of neural network possesses memory, with each layer retaining information from past times to estimate the SoH of lithium-ion batteries. They are well suited for working with time-series datasets, making them a favorable choice for regression analysis. The SoH of batteries is influenced by time, with a decrease in the SoH occurring as more cycles are performed. Therefore, it is advantageous for the proposed model to consider information from previous results. This rationale guided the decision to use the RNNs in the proposed model.
Among the available recurrent neural networks, Long Short-Term Memory (LSTM) and Gated Recurrent Unit (GRU) are prominent. Although both can yield good results, the LSTM neural network requires greater computational capacity. Because the RMSE, MSE, and MAE values did not surpass those generated by the GRU recurrent neural network, we decided to use GRU neural networks in the proposed model.
Various input parameters were tested for the RNN with the GRU, and those that produced the best network performance results were selected. The chosen input parameters for the GRU recurrent neural network include the charge current during the constant-current phase, maximum voltage, charging time, and SoC.
As indicated by the results presented in the previous sections, the charge current serves as a parameter capable of modifying battery behavior, showing differences in the ability to retain charge among the four groups. This behavior significantly influences the training of the RNN with a GRU that considers past data. Owing to notable differences in the behavior of batteries between distinct groups, network training was hindered, resulting in outcomes with substantial errors. To address this training challenge arising from diverse battery behaviors, three RNNs with GRU were constructed, as detailed in Section 4.2.
After determining the type of network to be used, selecting input parameters, and adopting the strategy of employing four RNNs with GRU, the internal parameters of the network were fine-tuned through successive tests. The objective was to achieve the lowest possible values of RMSE, MSE, and MAE without incurring excessive computational costs. The adjusted internal parameters included the number of hidden layers, units, dropout rate, optimizer, and time delay for SoH forecasting.
Hidden layers in recurrent neural networks receive signals from both the input and hidden layers in the previous iteration. In other words, the hidden layer functions as memory, where, in each period, the neural network retrieves information from the previous state and stores information from the data observed over time. Consequently, the number of hidden layers is a critical parameter in network operations.
Figure 8 shows bar charts containing the RMSE, MSE, and MAE averages for four battery groups. These charts graphically represent the performance of the three tested networks with varying numbers of hidden layers, units, optimizers, dropout, and time delay values.
The unit parameter serves as the memory cell of the GRU neural network and is associated with each layer of the neural network, allowing for different quantities of units in each layer.
Multiple GRU recurrent neural networks were tested to determine the optimal number of units for each layer in the proposed model. All the networks maintained identical parameters, with variations occurring solely in the number of units within each layer. Based on the error evaluation metric adopted in this study, the number of memory units for each layer was selected from the GRU recurrent neural network that achieved the smallest RMSE, MSE, and MAE values. However, when choosing this parameter, consideration was given to the computational cost involved in training the network. A higher number of units in each layer resulted in increased processing costs. This consideration aligns with one of the objectives of the proposed model, which aims to minimize computational costs in comparison with other models involving neural networks.
Following successive tests, it was observed that using more units in the input layer compared to the hidden layers yielded similar results to using an equal number of units in both the hidden and input layers. However, utilizing fewer units in the hidden layers incurs lower computational costs.
It can be observed that, on average, the results obtained by Network 3 were superior to those of the other networks. However, the computational costs required to train this network are excessive, leading to operational issues with the machine responsible for executing the model. Because of this, and considering that the results of the evaluation metrics for the networks were not significantly lower than those of Network 2, 400 units were used in the input layer and 350 units in the other layers.
The dropout layer randomly sets the input units to 0 with a rate determined at each step during training, aiding in the prevention of overfitting. To configure this parameter, the percentage of data that will be assigned a value of zero must be defined.
Various GRU recurrent neural networks were tested to determine the optimal value for the dropout layers in the proposed model. All the networks maintained identical parameters, with only the dropout value in each layer being altered. Following the error evaluation metric adopted in this study, the dropout value was selected from the GRU neural network that achieved the lowest RMSE, MSE, and MAE.
The networks presented aim to illustrate how the proposed model operates with a low dropout value (Network 1), high dropout value (Network 3), and dropout value used in the proposed model (Network 2). According to Figure 8, Network 2 exhibited better results than the other two networks. This suggests that a low dropout value may potentially lead to overfitting, whereas a high dropout value may cause the training base to lose significant data, thereby worsening network performance. Consequently, a dropout value of 0.3 was chosen for all layers, as the results surpassed those of all other tested networks.
Optimizers play a crucial role in updating the weights of the hidden layers of a neural network. To identify the optimal optimizer, various GRU neural networks were tested, all maintaining identical parameters, with only the optimizer being altered. Consistent with the error evaluation metric adopted in this study, the optimizer was determined from the GRU neural network, which achieved the smallest RMSE, MSE, and MAE values. The featured optimizers were Adam (Network 1), RMSprop (Network 2), and Adamax (Network 3). All three optimizers are recommended for use in problems involving regression models. Notably, Network 2 outperformed the other two networks, leading to the selection of RMSprop as the chosen optimizer.
The battery SoH over the cycles can be modeled as a time series. Therefore, the proposed model uses n values that are delayed in time to estimate the future values of the SoH. Several GRU neural networks with identical parameters were tested by changing only n (the time delay). Following the error evaluation metric adopted in this study, the best time delay was defined from the GRU neural network that obtained the lowest RMSE, MSE, and MAE.
The proposed model operates with small time delay (Network 1), large time delay (Network 3), and a number of delayed values used in the proposed model (Network 2). As can be observed in Figure 8, Network 2 achieved superior performance in estimating the state of health (SoH) for batteries in all groups.
5.3. Discussion
For neural network training, three batteries from each group were employed, and one battery from each group served as a test to validate the model. Figure 9 illustrates the SoH curves generated by the model proposed, based on the usual definition of SoH (Equation (1)).
In Figure 9, each curve represents one battery in each group, as listed in Table 4. As mentioned in Section 2.1, the LiCoO2 batteries (utilized in these tests) exhibit charging retention instability. This characteristic was apparent during the measurements, with notable variation in the capacity of the batteries observed over time. It is crucial to clarify that the tests involved continuous charging and discharging of the batteries. However, at certain times, the system experienced shutdowns for various reasons such as power outages. This leads to relaxation of the internal structure of the battery. Consequently, upon resuming the system operation, the state of health of the battery might show higher values than in previous cycles, thereby influencing the observed SoH.
Notably, based on this SoH definition criterion, none of the batteries reached the end of their useful lives (defined as 80% SoH).
Figure 10 shows the results obtained in the tests performed with one battery of each group using the definition of SoH expressed in Equation (2). As this is another approach for calculating SoH, the results differ between the two methods. It should be noted that this new method is more punitive about the SoH of batteries because the batteries of Groups 2 and 3 were considered at the end of their useful lives, whereas by the traditional method of SoH definition, they are still considered usable. Although the Group 3 battery lost significant charge retention capacity over time, the battery finished testing satisfactorily, as did the Group 2 battery. Therefore, the traditional definition of SoH is more valid for this study to avoid wasting batteries still in conditions of use in battery swap systems.
It is interesting to note that each case presented distinct results, with some showing smaller errors between the neural network output and the real value (Figure 10b,d). This occurs because of particularities, such as representativeness and noise in the training data.
Table 6 lists the metrics used to evaluate the neural network. In addition to the RMSE and MSE, the absolute mean error (MAE), which is the average of the absolute difference between the actual and measured SoH values, is also presented. The neural network presented good performance, with values compatible with the best SoH estimation models found in the literature. However, despite being a neural network, the model presented in this work presents a low computational cost because the training base needed to build a good neural network does not need to be extensive because of the characteristics of recurrent neural networks. However, it is worth noting that if the training base was larger, the neural network would present even better results.
Figure 11 shows the RMSE graphs for each measurement of the four batteries tested. It should be noted that the battery in Group 1 presented the highest variation in error. This may have occurred because this group had the least training data, which may have affected network performance. However, the overall average score was satisfactory. It is possible to notice that some measurements had higher errors in the four groups. These data are possible outliers that, if deleted, could improve neural network performance.
Table 7 presents previous relevant work involving the SoH estimation of lithium-ion batteries. It can be observed that the error values found resemble those obtained by the proposed model. This confirms that the proposed model is consistent with that found in the literature and serves its intended purpose. It is worth noting that the proposed model features a low computational cost and easily measurable parameters, allowing for its online use without significant computational expenses.
The models presented in Table 7, which exhibit errors much lower than those achieved by the model presented in this paper, have high mathematical and computational complexity, in addition to requiring parameters that are challenging to calculate or measure.
6. Conclusions
In this study, an attempt was made to present a model for estimating the SoH curve of lithium-ion batteries using the state of charge curve. The model was designed for smartphone battery swap applications utilizing Gated Recurrent Unit (GRU) neural networks.
The system can be adjusted using software and hardware to define the charging parameters for testing. Therefore, the testing system is easily usable and can be implemented in mobile energy sharing systems. Thus, machines that store and recharge batteries can collect the necessary data for SoH estimation, allowing the proposed model to be embedded in systems involving battery swaps.
The results demonstrated the high precision of the model in estimating the SoH of batteries under various charge and discharge parameters. The proposed approach exhibits low computational complexity, low cost, and easily measurable input parameters, making it an attractive solution for smartphone battery swap applications.
The low number of batteries available for the measurement system poses a limitation that prevents experiments with a greater variety of battery parameter variations. Additionally, the loss of any battery owing to malfunctioning may compromise the performance of the model by depriving the neural network of the training data.
The principal differences between the proposed model and those in the literature lie in the parameters used and the low computational cost. Because the model does not rely on the specific parameters of lithium-ion batteries, it can be applied to other types of batteries, provided that there is a suitable database for training the neural network.
The model also differs from other studies in that it uses the SoC of the battery to define the SoH rather than the total capacity. Consequently, the SoH of the battery can be estimated from any level of battery discharge, eliminating the need to completely discharge the battery. The model aligns with operational demands such as low cost and easy implementation. This study was essential for understanding how different battery parameters influence their life cycles and for studying the behavior of batteries used in smartphones.
Recommendations for future work include the following:
- Incorporating state-of-the-art techniques for parameter optimization (e.g., Bayesian optimization);
- Expanding the database for neural network training to anticipate smaller error margins while retaining the benefits of the model;
- Testing a single GRU recurrent neural network when more data are available for training, and comparing it with the results obtained using a model composed of four GRU neural networks;
- Considering ambient temperature as a parameter for constructing the model;
- Working with other types of batteries to validate the hypothesis that the proposed model can be applied to batteries of different classes and applications while maintaining similar performance;
- Studying batteries subjected to fast-charging processes to understand their behavior and estimate their SoH;
- Calculating measurement uncertainties of neural network output;
- Integrating the proposed model into a battery swap system and testing the model prediction through machine learning;
- Analyzing the causes of SoH degradation in lithium-ion batteries from the perspective of electrochemical reactions inside the battery.
Author Contributions
Conceptualization, R.S.D.T., R.F.C. and D.R.L.; methodology, R.S.D.T., R.F.C. and D.R.L.; software, R.S.D.T. and D.R.L.; validation, R.S.D.T., R.F.C. and D.R.L.; supervision, R.F.C. and D.R.L.; formal analysis, R.F.C.; writing—review and editing, R.F.C., M.F.A. and D.R.L.; writing—original draft preparation, R.S.D.T. and M.F.A. All authors have read and agreed to the published version of the manuscript.
Funding
This research was funded by two Brazilian Funding Agencies: Coordination for the Improvement of Higher Education Personnel (CAPES-Finance Code 001) and National Council for Scientific and Technological Development (CNPq) and by the Development and Research Program of ANEEL in partnership with ENEL Rio Enterprise (PD-00383-0060/2017).
Data Availability Statement
The raw data supporting the conclusions of this article will be made available by the authors on request.
Acknowledgments
The authors thank for the financial support provided by two Brazilian Funding Agencies (CNPq and CAPES) and the R&D program of the Brazilian Electricity Regulatory Agency (ANEEL) in partnership with ENEL Rio Enterprise. Special thanks go to the anonymous reviewers for their careful reading of the manuscript.
Conflicts of Interest
The authors declare no conflicts of interest.
Appendix A
Figure A1.
Final schematic of charge/discharge circuits.

References
- Brondani, M.F. Mathematical Modeling of the Lifetime of Lithium-Ion Polymer Batteries Using Genetic Algorithms. Master’s Thesis, Universidade Regional do Noroeste do Estado do Rio Grande do Sul (Unijuí), Rio Grande do Sul, Brazil, 2015. [Google Scholar]
- Koch, S.; Birke, K.P.; Kuhn, R. Fast Thermal runaway detection for lithium-ion cells in large scale traction batteries. Batteries 2018, 4, 16. [Google Scholar] [CrossRef]
- Parekh, M.H.; Palanisamy, M.; Pol, V.G. Reserve lithium-ion batteries: Deciphering in situ lithiation of lithium-ion free vanadium pentoxide cathode with graphitic anode. Carbon 2023, 203, 561–570. [Google Scholar] [CrossRef]
- Infante, W.F.; Ma, J.; Chi, Y. Operational Strategy and Load Profile Sensitivity Analysis for an Electric Vehicle Battery Swapping Station. In Proceedings of the 2016 IEEE International Conference on Power System Technology (POWERCON), Wollongong, NSW, Australia, 28 September–1 October 2016. [Google Scholar] [CrossRef]
- Zhong, L.; Pei, M. Optimal design for a shared swap charging system considering the electric vehicle battery charging rate. Energies 2020, 13, 1213. [Google Scholar] [CrossRef]
- Liu, J.; Li, G.; Fathy, H.K. An extended differential flatness approach for the health-conscious nonlinear model predictive control of Lithium-Ion batteries. IEEE Trans. Control Syst. Technol. 2017, 25, 1882–1889. [Google Scholar] [CrossRef]
- Xiong, R.; Duan, Y.; Zhang, K.; Lin, D.; Tian, J.; Chen, C. State-of-charge estimation for onboard LiFePO4 batteries with adaptive state update in specific open-circuit-voltage ranges. Appl. Energy 2023, 349, 121581. [Google Scholar] [CrossRef]
- Gueller, N.; Martinelli, R.; Fanzeres, B.; Louzada, D. Optimization of battery swapping stations with heterogeneity, charging degradation and PV-option. J. Energy Storage 2023, 74, 109509. [Google Scholar] [CrossRef]
- Sendra, S.; Parra, L.; Lloret, J.; Tomás, J. Smart system for children’s chronic illness monitoring. Inf. Fusion 2018, 40, 76–86. [Google Scholar] [CrossRef]
- Monteiro, L.E.C.; Repolho, H.M.V.; Calili, R.F.; Louzada, D.R.; Teixeira, R.S.D.; Vieira, R.S. Optimization of a mobile energy storage network. Energies 2022, 15, 186. [Google Scholar] [CrossRef]
- MIT Electric Vehicle Team. A Guide to Understanding Battery Specifications. 2008. Available online: http://web.mit.edu/evt/summary_battery_specifications.pdf (accessed on 10 January 2024).
- Yao, L.; Xu, S.; Tang, A.; Zhou, F.; Hou, J.; Xiao, Y.; Fu, Z. A review of lithium-ion battery state of health estimation and prediction methods. World Electr. Veh. J. 2021, 12, 113. [Google Scholar] [CrossRef]
- Kim, J.; Cho, B.H. State-of-charge estimation and state-of-health prediction of a Li-Ion degraded battery based on an EKF combined with a per-unit system. IEEE Trans. Veh. Technol. 2011, 60, 4249–4260. [Google Scholar] [CrossRef]
- Zou, B.; Xiong, M.; Wang, H.; Ding, W.; Jiang, P.; Hua, W.; Zhang, Y.; Zhang, L.; Wang, W.; Tan, R. A deep learning approach for state-of-health estimation of lithium-ion batteries based on differential thermal voltametry and attention mechanism. Front. Energy Res. 2023, 11, 1178151. [Google Scholar] [CrossRef]
- Xu, Z.; Guo, Y.; Saleh, J.H. A physics-informed dynamic deep autoencoder for accurate state-of-health prediction of lithium-ion battery. Neural Comput. Appl. 2022, 34, 15997–16017. [Google Scholar] [CrossRef]
- Pang, H.; Wu, L.; Liu, J.; Liu, X.; Liu, K. Physics-informed neural network approach for heat generation rate estimation of lithium-ion battery under various driving conditions. J. Energy Chem. 2023, 78, 1–12. [Google Scholar] [CrossRef]
- Richardson, R.; Osborne, M.; Howey, D. Gaussian process regression for forecasting battery state of health. J. Power Sources 2017, 357, 209–219. [Google Scholar] [CrossRef]
- Teixeira, R.S.D.; Louzada, D.R.; Gusmão, L.A.P.; Calili, R.F. Development of a voltage curve prediction model for lithium-ion battery based on destructive tests. J. Phys. Conf. Ser. 2021, 1826, 012091. [Google Scholar] [CrossRef]
- Castro, B.H.R.; Barros, D.C.; Veiga, S.G. Baterias Automotivas: Panorama da Indústria No Brasil. BNDES Setorial 2013, 37, 396–443. Available online: https://web.bndes.gov.br/bib/jspui/handle/1408/1511 (accessed on 10 January 2024).
- Zubi, G.; Dufo-López, R.; Carvalho, M.; Pasaoglu, G. The Lithium-ion battery: State of the art and future perspectives. Renew. Sustain. Energy Rev. 2018, 89, 292–308. [Google Scholar] [CrossRef]
- Smith, K.; Shi, Y.; Santhanagopalan, S. Degradation Mechanisms and Lifetime Prediction for Lithium-Ion Batteries—A Control Perspective. In Proceedings of the 2015 American Control Conference (ACC), Chicago, IL, USA, 1–3 July 2015. [Google Scholar]
- Placke, T.; Kloepsch, R.; Dühnen, S.; Winter, M. Lithium ion, Lithium metal, and alternative rechargeable battery technologies: The odyssey for high energy density. J. Solid State Electrochem. 2017, 21, 1939–1964. [Google Scholar] [CrossRef]
- Ungurean, L.; Micea, M.V.; Cârstoiu, G. Online state of health prediction method for Lithium-ion batteries, based on gated recurrent unit neural networks. Int. J. Energy Res. 2020, 44, 6767–6777. [Google Scholar] [CrossRef]
- Pajovic, M.; Orlik, P.V.; Wada, T.; Takegami, T. A Data-Driven Method for Predicting Capacity Degradation of Rechargeable Batteries. In Proceedings of the 2019 IEEE 17th International Conference on Industrial Informatics (INDIN), Helsinki, Finland, 22–25 July 2019. [Google Scholar] [CrossRef]
- Yu, J. State-of-health monitoring and prediction of lithium-ion battery using probabilistic indication and state-space model. IEEE Trans. Instrum. Meas. 2015, 64, 2937–2949. [Google Scholar] [CrossRef]
- Hannan, M.; Lipu, M.; Hussain, A.; Mohamed, A. A review of lithium-ion battery state of charge estimation and management system in electric vehicle applications: Challenges and recommendations. Renew. Sustain. Energy Rev. 2017, 78, 834–854. [Google Scholar] [CrossRef]
- Lee, J.; Choi, W. Novel state-of-charge estimation method for lithium polymer batteries using electrochemical impedance spectroscopy. J. Power Electron. 2012, 11, 237–243. [Google Scholar] [CrossRef]
- Berecibar, M.; Devriendt, F.; Dubarry, M.; Villarreal, I.; Omar, N.; Verbeke, W.; Van Mierlo, J. Online state of health estimation on NMC cells based on predictive analytics. J. Power Sources 2016, 320, 239–250. [Google Scholar] [CrossRef]
- Noh, T.W.; Kim, D.H.; Lee, B.K. Online state-of-health estimation algorithm for lithium-ion batteries in electric vehicles based on compression ratio of open circuit voltage. J. Energy Storage 2023, 57, 106258. [Google Scholar] [CrossRef]
- Theuerkauf, D.; Swan, L. Characteristics of open circuit voltage relaxation in lithium-ion batteries for the purpose of state of charge and state of health analysis. Batteries 2022, 8, 77. [Google Scholar] [CrossRef]
- Liu, X.; Li, Y.; Gu, P.; Zhang, Y.; Duan, B.; Zhang, C. An Accurate State of Health Estimation for Retired Lithium-ion Batteries Based on Electrochemical Impedance Spectroscopy. In Proceedings of the 2022 41st Chinese Control Conference (CCC), Hefei, China, 25–27 July 2022. [Google Scholar] [CrossRef]
- Unterrieder, C.; Lunglmayr, M.; Marsili, S.; Huemer, M. Battery state-of-charge estimation prototype using EMF voltage prediction. In Proceedings of the 2014 IEEE International Symposium on Circuits and Systems (ISCAS), Melbourne, VIC, Australia, 1–5 June 2014. [Google Scholar] [CrossRef]
- Chen, L.; Lü, Z.; Lin, W.; Li, J.; Pan, H. A new state-of-health estimation method for lithium-ion batteries through the intrinsic relationship between ohmic internal resistance and capacity. Measurement 2018, 116, 586–595. [Google Scholar] [CrossRef]
- Ji, H.; Zhang, W.; Pan, X.H.; Hua, M.; Chung, Y.H.; Shu, C.M.; Zhang, L.J. State of health prediction model based on internal resistance. Int. J. Energy Res. 2020, 44, 6502–6510. [Google Scholar] [CrossRef]
- Koc, Y.; Doğru, U.E.; Bilir, R.A. Evaluation of Internal Resistance Methods for Tracking Battery State of Health. In Proceedings of the 2022 4th Global Power, Energy and Communication Conference (GPECOM), Nevsehir, Turkey, 14–17 June 2022. [Google Scholar] [CrossRef]
- Messing, M.; Shoa, T.; Habibi, S. Electrochemical impedance spectroscopy with practical rest-times for battery management applications. IEEE Access 2021, 9, 66989–66998. [Google Scholar] [CrossRef]
- Liu, S.; Dong, X.; Yu, X.; Ren, X.; Zhang, J.; Zhu, R. A method for state of charge and state of health estimation of lithium-ion battery based on adaptive unscented Kalman filter. Energy Rep. 2022, 8, 426–436. [Google Scholar] [CrossRef]
- Zhang, Q.; Huang, C.G.; Li, H.; Feng, G.; Peng, W. Electrochemical impedance spectroscopy based state-of-health estimation for lithium-ion battery considering temperature and state-of-charge effect. IEEE Trans. Transp. Electrif. 2022, 8, 4633–4645. [Google Scholar] [CrossRef]
- Ng, K.S.; Moo, C.-S.; Chen, Y.-P.; Hsieh, Y.-C. Enhanced coulomb counting method for estimating state-of-charge and state-of-health of lithium-ion batteries. Appl. Energy 2009, 86, 1506–1511. [Google Scholar] [CrossRef]
- Lee, J.; Won, J. Enhanced Coulomb counting method for SoC and SoH estimation based on Coulombic efficiency. IEEE Access 2023, 11, 15449–15459. [Google Scholar] [CrossRef]
- Bhangu, B.S.; Bentley, P.; Stone, D.A.; Bingham, C.M. Nonlinear observers for predicting state-of-charge and state-of-health of lead-acid batteries for hybrid-electric vehicles. IEEE Trans. Veh. Technol. 2005, 54, 783–794. [Google Scholar] [CrossRef]
- Shen, P.; Ouyang, M.; Lu, L.; Li, J.; Feng, X. The co-estimation of state of charge, state of health, and state of function for lithium-ion batteries in electric vehicles. IEEE Trans. Veh. Technol. 2018, 67, 92–103. [Google Scholar] [CrossRef]
- Ling, L.; Wei, Y. State-of-charge and state-of-health estimation for lithium-ion batteries based on dual fractional-order extended Kalman filter and online parameter identification. IEEE Access 2021, 9, 47588–47602. [Google Scholar] [CrossRef]
- Ma, L.; Xu, Y.; Zhang, H.; Wang, F.Y.X.; Li, C. Co-estimation of state of charge and state of health for lithium-ion batteries based on fractional-order model with multi-innovations unscented Kalman filter method. J. Energy Storage 2022, 52 Pt B, 104904. [Google Scholar] [CrossRef]
- Xu, Y.; Shu, H.; Qin, H.; Wu, X.; Peng, J.; Jiang, C.; Xia, Z.; Wang, Y.; Li, X. Real-time state of health estimation for solid oxide fuel cells based on unscented Kalman filter. Energies 2022, 15, 2534. [Google Scholar] [CrossRef]
- Laurin; Heiries, V.; Montaru, M. State-of-charge and state-of-health online estimation of Li-ion battery for the more electrical aircraft based on semi-empirical ageing model and Sigma-Point Kalman Filtering. In Proceedings of the 2021 Smart Systems Integration (SSI), Grenoble, France, 27–29 April 2021. [Google Scholar] [CrossRef]
- Plett, G.L. Sigma-point Kalman filtering for battery management systems of LiPB-based HEV battery packs: Part 2: Simultaneous state and parameter estimation. J. Power Sources 2006, 161, 1369–1384. [Google Scholar] [CrossRef]
- Chen, Y.; He, Y.; Li, Z.; Chen, L.; Zhang, C. Remaining useful life prediction and state of health diagnosis of lithium-ion battery based on second-order central difference particle filter. IEEE Access 2020, 8, 37305–37313. [Google Scholar] [CrossRef]
- Shao, S.; Bi, J.; Yang, F.; Guan, W. On-line estimation of state-of-charge of Li-ion batteries in electric vehicle using the resampling particle filter. Transp. Res. D Transp. Environ. 2014, 32, 207–217. [Google Scholar] [CrossRef]
- Putra, W.S.; Kuswanto, J.; Ashari, W.M.; Koprawi, M. Comparative Study of Kalman Filter and H infinity Filter for Current Sensorless Battery Health Analysis. In Proceedings of the 4th International Conference on Information and Communications Technology (ICOIACT), Yogyakarta, Indonesia, 30–31 August 2021. [Google Scholar] [CrossRef]
- Gao, M.; Bao, Z.; Zhu, C.; Jiang, J.; He, Z.; Dong, Z.; Song, Y. HFCM-LSTM: A novel hybrid framework for state-of-health estimation of lithium-ion battery. Energy Rep. 2023, 9, 2577–2590. [Google Scholar] [CrossRef]
- Lee, G.; Kwon, D.; Lee, C. A convolutional neural network model for SOH estimation of Li-ion batteries with physical interpretability. Mech. Syst. Signal Process. 2023, 188, 110004. [Google Scholar] [CrossRef]
- Zenati, A.; Desprez, P.; Razik, H.; Rael, S. A Methodology to Assess the State of Health of Lithium-Ion Batteries based on the Battery’s Parameters and a Fuzzy Logic System. In Proceedings of the IEEE International Electric Vehicle Conference, Greenville, SC, USA, 4–8 March 2012. [Google Scholar] [CrossRef]
- Ananto, P.; Syabani, F.; Indra, W.D.; Wahyunggoro, O.; Cahyadi, A.I. The State of Health of Li-Po Batteries Based on the Battery’s Parameters and a Fuzzy Logic System. In Proceedings of the 2013 Joint International Conference on Rural Information & Communication Technology and Electric-Vehicle Technology (rICT & ICeV-T), Bandung, Indonesia, 26–28 November 2013. [Google Scholar] [CrossRef]
- Hassanzadeh, M.E.; Nayeripour, M.; Hasanvand, S.; Waffenschmidt, E. Intelligent fuzzy control strategy for battery energy storage system considering frequency support, SoC management, and C-rate protection. J. Energy Storage 2022, 52, 104851. [Google Scholar] [CrossRef]
- Xiong, W.; Mo, Y.; Yan, C. Online state-of-health estimation for second-use lithium-ion batteries based on weighted least squares support vector machine. IEEE Access 2021, 9, 1870–1881. [Google Scholar] [CrossRef]
- Wu, T.; Huang, Y.; Xu, Y.; Jiang, J.; Liu, S.; Li, Z. Soh prediction for lithium-ion battery based on improved support vector regression. Int. J. Green Energy 2023, 20, 227–236. [Google Scholar] [CrossRef]
- Lyu, Z.; Wang, G.; Gao, R. Synchronous state of health estimation and remaining useful lifetime prediction of Li-ion battery through optimized relevance vector machine framework. Energy 2022, 251, 123852. [Google Scholar] [CrossRef]
- Li, N.; He, F.; Ma, W.; Wang, R.; Jiang, L.; Zhang, X. An indirect State-of-Health estimation method based on improved genetic and back propagation for online lithium-ion battery used in electric vehicles. IEEE Trans. Veh. Technol. 2022, 71, 12682–12690. [Google Scholar] [CrossRef]
- Xue, A.; Yang, W.; Yuan, X.; Yu, B.; Pan, C. Estimating state of health of lithium-ion batteries based on generalized regression neural network and quantum genetic algorithm. Appl. Soft Comput. 2022, 130, 109688. [Google Scholar] [CrossRef]
- Xu, W.; Xu, J.; Lang, J.; Yan, X. A multi-timescale estimator for lithium-ion battery state of charge and state of energy estimation using dual H infinity filter. IEEE Access 2019, 7, 181229–181241. [Google Scholar] [CrossRef]
- Yang, H.; Wang, P.; An, Y.; Shi, C.; Sun, X.; Wang, K.; Zhang, X.; Wei, T.; Ma, Y. Remaining useful life prediction based on denoising technique and deep neural network for lithium-ion capacitors. eTransportation 2020, 5, 100078. [Google Scholar] [CrossRef]
- Ezemobi, E.; Silvagni, M.; Mozaffari, A.; Tonoli, A.; Khajepour, A. State of health estimation of lithium-ion batteries in electric vehicles under dynamic load conditions. Energies 2022, 15, 1234. [Google Scholar] [CrossRef]
- Chen, Z.; Zhao, H.; Zhang, Y.; Shen, S.; Shen, J.; Liu, Y. State of health estimation for lithium-ion batteries based on temperature prediction and gated recurrent unit neural network. J. Power Sources 2022, 521, 230892. [Google Scholar] [CrossRef]
- Semanjski, I.; Gautama, S. Forecasting the state of health of electric vehicle batteries to evaluate the viability of car sharing practices. Energies 2016, 9, 1025. [Google Scholar] [CrossRef]
- Chen, Z.; Song, X.; Xiao, R.; Shen, J.; Xia, X. State of health estimation for lithium-ion battery based on long short-term memory networks. In Proceedings of the 2018 Joint International Conference on Energy, Ecology and Environment (ICEEE) and International Conference on Electric and Intelligent Vehicles (ICEIV), Melbourne, Australia, 21–25 November 2018. [Google Scholar]
- Martins, F.; Almeida, M.F.; Calili, R.; Oliveira, A. Design thinking applied to smart home projects: A user-centric and sustainable perspective. Sustainability 2020, 12, 10031. [Google Scholar] [CrossRef]
- Simon, H. Neural Networks: A Comprehensive Foundation; Prentice Hall PTR: Hoboken, NJ, USA, 1998. [Google Scholar]
- Khan, N.; Ullah, F.U.M.; Ullah, A.; Lee, M.Y.; Baik, S.W. Batteries state of health estimation via efficient neural networks with multiple channel charging profiles. IEEE Access 2021, 9, 7797–7813. [Google Scholar] [CrossRef]
- Bengio, Y.; Courville, A.; Vincent, P. Representation learning: A review and new perspectives. IEEE Trans. Pattern Anal. Mach. Intell. 2013, 35, 1798–1828. [Google Scholar] [CrossRef]
- Li, Y.; Sheng, H.; Cheng, Y.; Stroe, D.-I.; Teodorescu, R. State-of-health estimation of lithium-ion batteries based on semi-supervised transfer component analysis. Appl. Energy 2020, 277, 115504. [Google Scholar] [CrossRef]
Figure 1.
Block diagram of the charging/discharging system.

Figure 2.
The final version of the proposed measurement system.

Figure 3.
Interconnection lines with the acquisition and control unit (ACU).

Figure 4.
The basic structure of a GRU neural network.

Figure 5.
Structure of the measurement and training scheme to be used by the RNN with GRU.

Figure 6.
Structure of the proposed model: estimation of the SoH curve of lithium-ion batteries.

Figure 7.
Charge/discharge curve over time for a lithium-ion battery: five cycles.

Figure 8.
Average performance metrics of the proposed model for four groups of batteries.

Figure 9.
SoH prediction according to the usual definition: (a) Group 1; (b) Group 2; (c) Group 3; (d) Group 4.
Figure 9.
SoH prediction according to the usual definition: (a) Group 1; (b) Group 2; (c) Group 3; (d) Group 4.

Figure 10.
SoH prediction according to definition through SoC: (a) Group 1 battery; (b) Group 2 battery; (c) Group 3 battery; (d) Group 4 battery.
Figure 10.
SoH prediction according to definition through SoC: (a) Group 1 battery; (b) Group 2 battery; (c) Group 3 battery; (d) Group 4 battery.

Figure 11.
SoH error over time: (a) Group 1; (b) Group 2; (c) Group 3; (d) Group 4.


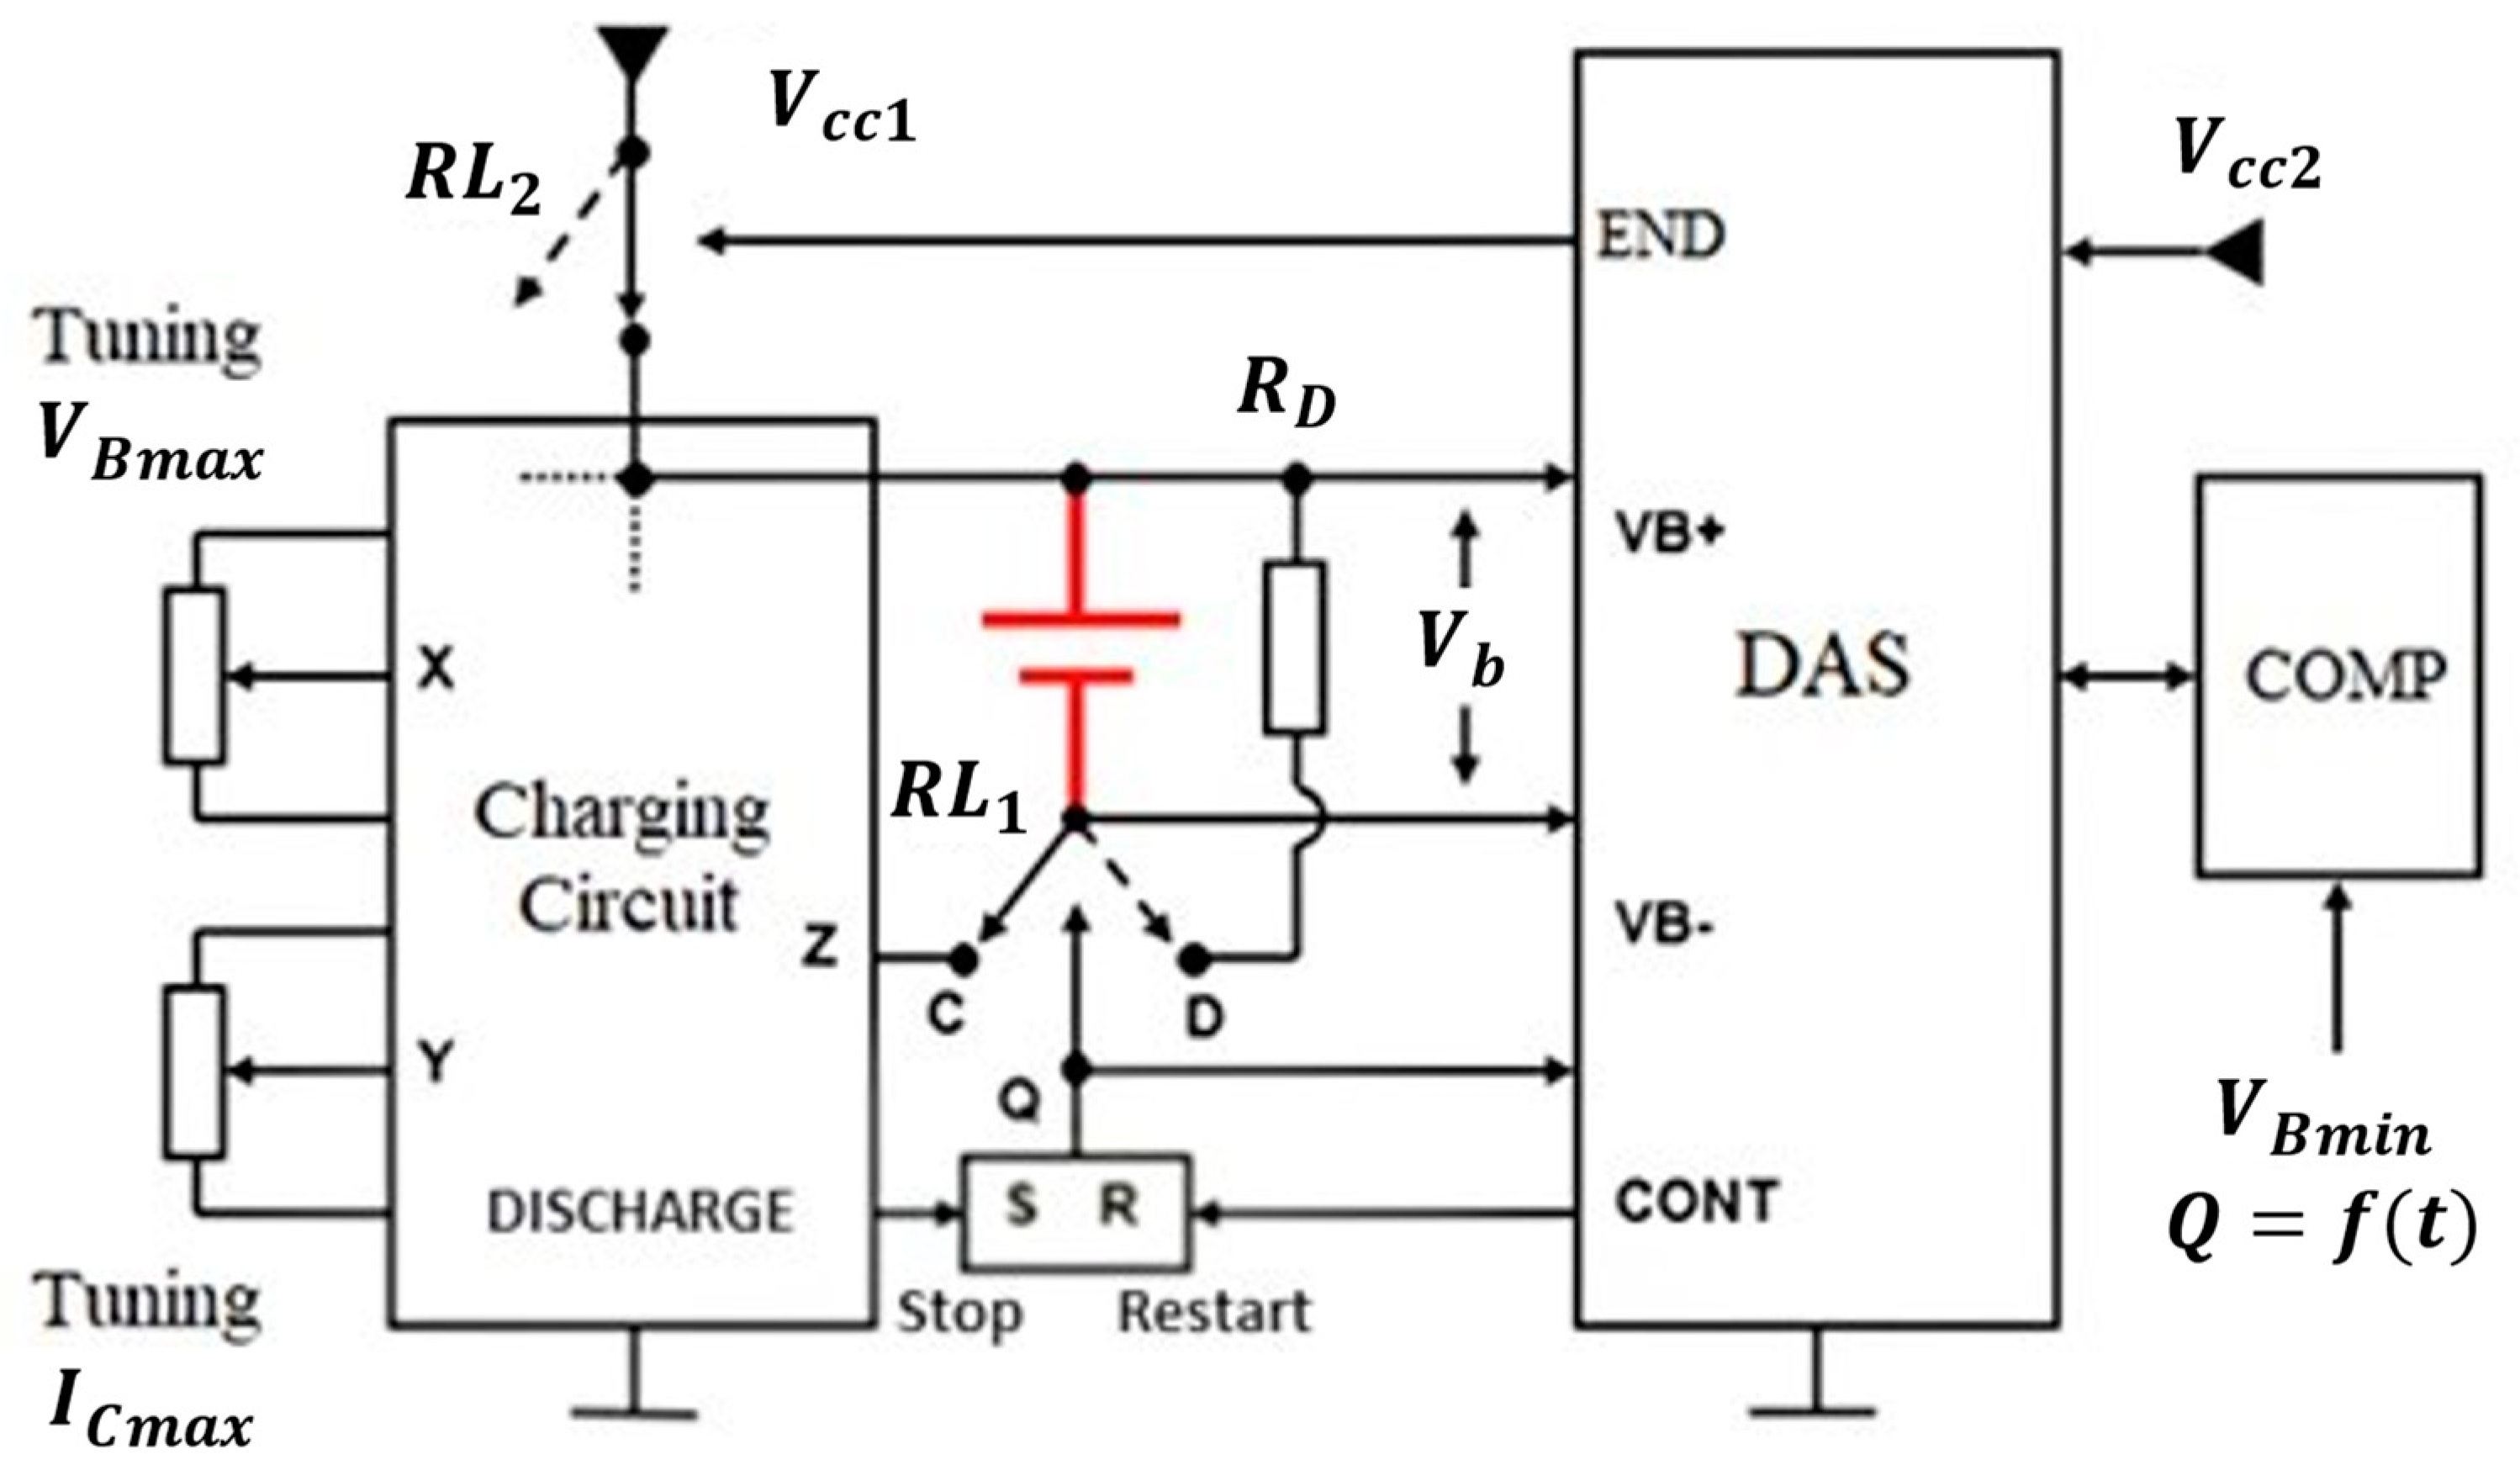
Table 1.
Model-based methods to estimate the SoH of a battery.
| Method | Advantages | Disadvantages | References |
|---|---|---|---|
| Open-circuit voltage (OCV) | Easy to implement and high accuracy. | Required a long period with the battery open to achieve the equilibrium conditions. It can only be applied with out-of-use equipment. | [29,30,31] |
| Electro-Motive Force (EMF) | Simple method and low cost. | It is necessary to interrupt the circuit current for a significant time. Inaccurate results depending on unexpected disturbances. | [32] |
| Internal resistance | Simple and easy implementation. | Only has high accuracy during the final discharge period. Resistance changes throughout the cycle. | [33,34,35] |
| Electrochemical Impedance Spectroscopy (EIS) | Online, low cost, and good accuracy if the impedance is normalized. | Results impact with temperature and remaining battery life. | [36,37,38] |
Table 2.
Adaptive methods to estimate the SoH of a battery.
| Method | Advantages | Disadvantages | References |
|---|---|---|---|
| Coulomb Counting (CC) | CC is easy to implement and incurs little energy expenditure. |
| [39,40] |
| Kalman Filter (KF) | KF precisely estimates the states influenced by external disturbances (e.g., noise governed by a Gaussian distribution). |
| [41] |
| Extended Kalman Filter (EKF) | EKF exhibits good accuracy in nonlinear dynamic systems. |
| [13,42,43] |
| Unscented Kalman Filter (UKF) | Jacobian matrix and Gaussian noises are not necessary for the calculation. Good accuracy for system states up to the third order of any nonlinear system. |
| [44,45] |
| Sigma point Kalman Filter (SPKF) | The calculation complexity of the SPKF is identical to that of the EKF, thereby providing good accuracy and robustness. |
| [46,47,48] |
| Particle Filter (PF) | PF has a shorter computational time and provides a high accuracy. |
| [45,48,49] |
| Filter Hꝏ | Satisfactory performance in terms of accuracy, computational complexity, and efficiency. |
| [50] |
| Artificial Neural Network (ANN) | ANN can be applied to batteries in nonlinear conditions. |
| [23,51,52] |
| Fuzzy logic | Good performance in modelling dynamic nonlinear systems. Effective in any state of charge, time of use, and temperature. |
| [53,54,55] |
| Support vector machine (SVM) | Good performance with nonlinear systems. Fast and accurate SoH forecasting when using a good training base. |
| [56,57,58] |
| Genetic Algorithm (GA) | High accuracy and robust noise scan. |
| [59,60] |
| Proportional–integral observer (PIO) | Good SoH estimation accuracy with low computational time. The model’s resilience is improved in the face of model uncertainty. |
| [61] |
| Nonlinear observer (NLO) | Improved performance in terms of accuracy, speed, and computational cost.Robust against disturbances. |
| [41] |
| Convolutional Neural Network (CNN) and Bidirectional Long Short-Term Memory Network (BiLSTM) | It provides a more robust and accurate approach for predicting SoH. The hybrid neural network’s ability to resist environmental interference contributes to the accuracy and stability in predicting SoH, ensuring reliable results across different conditions. |
| [62] |
| ANN-based classifier using SoC as a parameter | ANN-based classifier shows cases of the adoption of a sophisticated and adaptable methodology known for its ability to handle complex and nonlinear relationships in data. |
| [63] |
| ANN GRU | ANN GRU can achieve accurate SoH predictions using only partial random and discontinuous charging data. |
| [64] |
Table 3.
Authors’ contributions.
| Phase | Stage | Research Questions [Section/Subsection] |
|---|---|---|
| Motivation | Problem definition and rationale for the research. | Why should we develop a predictive model to estimate the SoH of lithium-ion batteries in battery swap applications? [Section 1]. |
| Development (What? How?) | State of research on central themes, identification of research gaps, and unsolved problems. | What are the significant gaps in the existing knowledge about lithium-ion batteries, including the concept of SoH? [Section 2]. |
| Definition of the research methodology. | How can we build a system for testing and validating a predictive model to estimate the SoH of lithium-ion batteries and their application in battery swap systems? [Section 4—Section 4.1]. To what extent can an adaptive approach based on Artificial Neural Networks (ANNs) effectively contribute to developing a new predictive model to estimate the SoH of lithium-ion batteries in battery swap applications? [Section 4—Section 4.2]. | |
| Development of a predictive model to estimate the SoH of lithium-ion batteries in battery swap applications. | Which internal parameters of the recurrent neural network should be adjusted through consecutive tests, aiming at the lowest values of Root-Mean-Squared Error (RMSE), Mean-Squared Error (MSE), and Mean Absolute Error (MAE)? [Section 4—Section 4.2]. | |
| Validation (How can we demonstrate the applicability of the predictive model?) | Discussion of the results and implications of this research. | Could the research results demonstrate the applicability of the proposed SoH predictive model in battery swap systems? [Section 5]. What are the primary differentiating factors of this model compared to previous studies reviewed in Section 2? [Section 5]. |
Table 4.
Parameter sets for each battery group.
| Parameter | Group 1 | Group 2 | Group 3 | Group 4 |
|---|---|---|---|---|
| Ic [A] | 1 | 2 | 2 | 3 |
| Vc [V] | 4.1 | 4.1 | 4.2 | 4.1 |
| Vmin [V] | 3.3 | 3.3 | 3.3 | 3.3 |
Table 5.
Average parameters of the four battery groups.
| Group | Number of Cycles | Average Cycle Time [h] | Average Charging Time [h] | Average Capacity [mAh] |
|---|---|---|---|---|
| Group 1 | 215 | 6.38 | 4.34 | 3761.25 |
| Group 2 | 382 | 3.60 | 1.87 | 3131.86 |
| Group 3 | 305 | 4.53 | 2.29 | 4004.68 |
| Group 4 | 473 | 3.00 | 1.66 | 2858.47 |
Table 6.
Artificial neural network assessment metrics.
| RMSE (%) | MSE (%) | MAE (%) | |
|---|---|---|---|
| Group 1 | 0.0418 | 0.0017 | 0.0138 |
| Group 2 | 0.0708 | 0.0050 | 0.0143 |
| Group 3 | 0.0595 | 0.0035 | 0.0261 |
| Group 4 | 0.0820 | 0.0067 | 0.0454 |
Table 7.
Errors in some state of health (SoH) values of previous estimation models.
| Reference | Method | RMSE | MSE | MAE |
|---|---|---|---|---|
| [9] | Charge current analysis | 0.025 | 0.000625 | 0.015 |
| [28] | Predictive analysis | - | - | 0.0314 |
| [42] | Recursive least-squares algorithm | - | - | 0.0209 |
| [48] | Extreme metabolic machine learning combining degradation state model and error compensation | 0.0635 | 0.0040 | 0.0193 |
| [53] | Fuzzy logic and internal resistance | - | - | 0.03 |
| [65] | Linear approximation | 0.1304 | 0.0170 | - |
| [69] | Efficient neural networks with multi-channel loading profiles | 0.0259 | 0.0006708 | 0.0197 |
| [70] | Machine learning | 0.05196 | 0.0027 | 0.02 |
| [71] | Semi-supervised transfer component analysis | - | - | 0.0129 |
Disclaimer/Publisher’s Note: The statements, opinions and data contained in all publications are solely those of the individual author(s) and contributor(s) and not of MDPI and/or the editor(s). MDPI and/or the editor(s) disclaim responsibility for any injury to people or property resulting from any ideas, methods, instructions or products referred to in the content. |
© 2024 by the authors. Licensee MDPI, Basel, Switzerland. This article is an open access article distributed under the terms and conditions of the Creative Commons Attribution (CC BY) license (https://creativecommons.org/licenses/by/4.0/).
Share and Cite
MDPI and ACS Style
Teixeira, R.S.D.; Calili, R.F.; Almeida, M.F.; Louzada, D.R. Recurrent Neural Networks for Estimating the State of Health of Lithium-Ion Batteries. Batteries 2024, 10, 111. https://doi.org/10.3390/batteries10030111
AMA Style
Teixeira RSD, Calili RF, Almeida MF, Louzada DR. Recurrent Neural Networks for Estimating the State of Health of Lithium-Ion Batteries. Batteries. 2024; 10(3):111. https://doi.org/10.3390/batteries10030111
Chicago/Turabian StyleTeixeira, Rafael S. D., Rodrigo F. Calili, Maria Fatima Almeida, and Daniel R. Louzada. 2024. "Recurrent Neural Networks for Estimating the State of Health of Lithium-Ion Batteries" Batteries 10, no. 3: 111. https://doi.org/10.3390/batteries10030111
Note that from the first issue of 2016, this journal uses article numbers instead of page numbers. See further details here.