

Design and Development of Flow Fields with Multiple Inlets or Outlets in Vanadium Redox Flow Batteries

Department of Energy, Politecnico di Milano, Via Lambruschini 4, 20156 Milano, Italy
*
Author to whom correspondence should be addressed.
Batteries 2024, 10(3), 108; https://doi.org/10.3390/batteries10030108
Submission received: 12 February 2024
/
Revised: 4 March 2024
/
Accepted: 14 March 2024
/
Published: 16 March 2024
(This article belongs to the Special Issue Energy Storage of Redox-Flow Batteries)
Abstract
:In vanadium redox flow batteries, the flow field geometry plays a dramatic role on the distribution of the electrolyte and its design results from the trade-off between high battery performance and low pressure drops. In the literature, it was demonstrated that electrolyte permeation through the porous electrode is mainly regulated by pressure difference between adjacent channels, leading to the presence of under-the-rib fluxes. With the support of a 3D computational fluid dynamic model, this work presents two novel flow field geometries that are designed to tune the direction of the pressure gradients between channels in order to promote the under-the-rib fluxes mechanism. The first geometry is named Two Outlets and exploits the splitting of the electrolyte flow into two adjacent interdigitated layouts with the aim to give to the pressure gradient a more transverse direction with respect to the channels, raising the intensity of under-the-rib fluxes and making their distribution more uniform throughout the electrode area. The second geometry is named Four Inlets and presents four inlets located at the corners of the distributor, with an interdigitated-like layout radially oriented from each inlet to one single central outlet, with the concept of reducing the heterogeneity of the flow velocity within the electrode. Subsequently, flow fields performance is verified experimentally adopting a segmented hardware in symmetric cell configuration with positive electrolyte, which permits the measurement of local current distribution and local electrochemical impedance spectroscopy. Compared to a conventional interdigitated geometry, both the developed configurations permit a significant decrease in the pressure drops without any reduction in battery performance. In the Four Inlets flow field the pressure drop reduction is more evident (up to 50%) due to the lower electrolyte velocities in the feeding channels, while the Two Outlets configuration guarantees a more homogeneous current density distribution.
1. Introduction
Vanadium redox flow batteries (VRFBs) are receiving increasing interest as pivotal electrochemical technologies for a 21st century low-carbon energy transition [1]. Because of their potential for decoupling power and stored energy, and their long charge-discharge cycle life [1,2,3,4,5], VRFBs show great promise for large-scale energy storage in electrical power grids. However, VRFBs still present some technological issues, among which one of the most important is the effective and homogeneous distribution of the electrolyte over the porous electrode [5,6,7]. In fact, the flow field regulates the distribution of reactant concentration throughout the active area, strongly affecting reactions overpotential [8]. Moreover, the flow field geometry defines electrolyte velocities and thus the corresponding pressure drops (i.e., auxiliaries consumption [9]). The aspects that characterize an ideal flow field geometry are reduced auxiliaries consumption and high cell performance promoted by improved electrolyte transport through the electrodes and homogeneous electrolytes distribution throughout active area.
In the literature, different flow field modifications have been analysed [10,11,12,13]. Houser et al. [10] designed an equal path length flow-through design, achieving a higher net discharged energy coupled with increased pressure drops. Lisboa et al. [11] developed corrugated channels able to improve mass transport phenomena in small-scale flow batteries, achieving a significant improvement in net power density compared to the one obtained with a parallel-channels flow field. Akuzum et al. [13] introduced 3D-printed ramps in the channels, increasing the peak power by 15% while decreasing the pressure drop by 40%. Zeng at al. [12] presented a interdigitated-based geometry composed by primary and secondary branches, obtaining a 4.2% enhancement of the pump-based efficiency with respect to a conventional interdigitated geometry. All these works [10,11,12,13] demonstrated VRFB performance improvement, but further theoretical analyses would be necessary to provide a more solid interpretation of the underlying physical phenomena. Moreover, in [10,11,12,13] the performance improvement was evaluated considering overall cell performance, without any insight into the local effects introduced by the flow field modifications.
In a recent work by the authors [14], a computational fluid dynamics (CFD) model was coupled with local performance characterization, permitting analysis of the cell operation at the local level with different flow field configurations and thus strengthening the understanding of the physical phenomena regulating electrolyte mass transport. In [14], the relevance of pressure difference between adjacent channels was highlighted, promoting the under-the-rib fluxes through the electrode [15]. This mechanism is illustrated in Figure 1 in the case of a conventional interdigitated geometry, where the electrolyte is forced to permeate through the porous electrode from the inlet channels to the outlet ones. This transport mechanism is regulated by the pressure difference between inlet and outlet channels and results in increased electrolyte velocities under the distributor ribs.
In Messaggi et al. [14], because of the introduction of different channel obstructions, it was possible to induce and control localized pressure differences between channels, improving cell performance with a limited impact on pressure drops.
After providing an insight into the relation between distribution of under-the-rib fluxes and battery performance [15], this work presents the development of novel distributor geometries designed with the concept of tuning the direction of the under-the-rib flux mechanism and the uniformity of the velocity field over the electrode, with beneficial effects on performance and operation heterogeneities.
Starting from a conventional interdigitated flow field, which is characterized by low pressure drops and is therefore suitable for the scale-up to larger active area, two different geometries are proposed, with the aid of a previously developed CFD model [14,15]. The first geometry is named Two Outlets and exploits the splitting of the electrolyte flow into two adjacent interdigitated layouts, with the aim of giving the pressure gradient a more transverse direction with respect to the channels, raising the intensity of under-the-rib fluxes and making their distribution more uniform throughout the electrode area. The second geometry is named Four Inlets and presents four inlets located at the corners of the distributor, with an interdigitated-like layout radially oriented from each inlet to one single central outlet, with the aim of reducing the heterogeneity of the flow velocity within the electrode. The developed flow fields are then characterized in terms of performance, pressure drops and distribution of current density and impedance spectra, measured in a segmented cell hardware in a symmetric cell configuration with a positive electrolyte.
This work is organised as follows: model development and assumptions are reported in Section 2, while Section 3 describes the hardware for local performance characterization and the experimental tests. Section 4 firstly reports modelling analyses and subsequently experimental characterization of the developed flow field. Finally, Section 5 reports the conclusions of the work.
2. Model
2.1. Model Assumptions
The model used in this work was already presented by the authors in [14], in which it was used to design channel obstructions in order to induce localized pressure drops along the channel length. By contrast, in this work the model is used as a tool to evaluate the influence of multiple inlets and outlets on the distribution of under-the-rib fluxes. The model was developed in ANSYS Fluent 18 and combines the standard fluid dynamics module with user-defined functions (UDFs) for the description of electrochemistry. The model replicates VRFB operation in a 25 cm2 symmetric cell configuration adopting positive electrolyte. For negative cell voltage, the reactions occurring at the negative and positive electrodes are, respectively:
As reported in [15], the dissociation rate of sulphuric acid is neglected [16]: the first step of H2SO4 dissociation into H⁺ and is assumed complete, while the second step of dissociation into and H⁺ is assumed at equilibrium. Therefore, the concentrations of and remain constant, while the concentration of H⁺ varies since it is involved in the electrochemical oxidation and reduction of vanadium ions (Equations (1) and (2)). As frequently reported in the literature, the following assumptions are considered:
- Membrane permeable to only protons and not permeable to vanadium ions, since in the symmetric cell configuration the net vanadium flux through the separator is negligible and moreover it does not affect the battery state of charge (SoC).
- Laminar flow regime due to the reduced electrolyte velocities expected from the investigated flow rates. This assumption is then verified analysing the simulated velocity field.
- Electroneutrality of the electrolytes, permitting the calculation of the concentration of without the resolution of the corresponding Nernst–Planck equation [20].
In the following, the main governing equations, the boundary conditions and the simulated flow field configurations along with model implementation are carefully described.
2.2. Model Governing Equations
2.2.1. Mass Balance
The continuity equation was implemented in all model domains to impose mass conservation:
where u is the electrolyte velocity and its density.
2.2.2. Momentum Balance
Conservation of momentum in the flow-field channels was computed with the Navier–Stokes equation (Equation (4)), while the Brinkmann equation (Equation (5)) was solved in the porous electrodes. This approach guarantees at channel-electrode interface a smooth transition of the velocity profile.
is the pressure, is the dynamic viscosity of the electrolyte and is the electrode permeability. The porosity of the compressed porous electrode was calculated according to Equation (6), in which the void volume of the electrode was reduced by the compression ratio of 20%, while the volume occupied by the incompressible carbon fibres was kept constant [23]:
where , , represent uncompressed electrode thickness, compressed electrode thickness and porosity before compression, respectively.
In Equations (4) and (5), the Forchheimer drag coefficient and the volume force vector are set equal to zero.
2.2.3. Species Balance
The species conservation was computed according to the following equation:
where is the species molar source, that is, the function of the intensity of electrochemical reactions in the porous electrodes, as reported in Table 1. The molar flux was governed by the Nernst–Planck equation (Equation (8)), that takes into account the transport mechanisms due to diffusion, convection and migration.
The effective diffusivity was calculated adopting the Bruggeman correction [15], is the molar concentration, is the charge number, is the mobility calculated according to the Nernst–Einstein equation [15] and is the electrolyte potential. Equation (8) was computed for all the species except for , whose concentration was obtained by imposing the electroneutrality principle:
2.2.4. Charge Balance
In all the model domains the conservation of charge was solved with the following equation:
where is the electronic current density, is the ionic current density and is a source term that is not null only in the porous electrodes. and are then given by:
The source term associated with the electrochemical reactions follows Butler–Volmer kinetics and is defined as:
where , , , and represent the reaction rate constant, the specific surface area, the charge transfer coefficient, and the vanadium ions concentration on the electrode surface. is the overpotential and is defined as:
where is the equilibrium potential set equal to 1.004 VSHE. As reported in [15], the concentration of vanadium ions on the electrode surface results from convective mass transport of the electrolyte in the electrode pores. It can be expressed as a function of vanadium ions bulk concentration introducing the convective mass transport coefficient , that is calculated with the correlation reported in [24]. The resulting source term is thus equal to:
Finally, the values of the species molar source (Equation (7)) are listed in Table 1. (In symmetric cell configuration, when a negative voltage is applied to the battery, reduction (Equation (1)) and oxidation (Equation (2)) occur at the negative and positive electrode, respectively. Therefore is negative at the negative electrode and it is positive at the positive electrode).
2.3. Boundary Conditions
A uniform flow velocity and the mass fraction of each species were imposed at the inlet of the distributor channel of the negative electrode, while the stimulated values of velocity and species concentrations at the outlet of the negative electrode were imposed as boundary conditions at the inlet of the positive electrode. Table 2 reports the values of the concentrations set as boundary conditions for both the positive and negative electrodes. (The subscript ‘out’ indicates the quantities obtained from the simulations at the outlet of the negative electrode and are therefore dependent on the simulated current density at a given electrolyte flow rate.)
At the channel outlet of the positive electrode the pressure gauge value was set to zero, and consequently the simulated pressure at the inlet of the positive electrode was set as the boundary condition at the outlet of the negative electrode.
At the interface between the negative electrode and the current collector (not present in the model domain) the electric potential was imposed according to the simulated cell voltage, while the same interface at the positive electrode was set to be the electrical ground. By contrast, null flux of the electrolytic potential was set on the abovementioned interfaces. The continuity of the electrolytic potential and its flux was set at the surfaces between the porous electrodes and the membrane.
2.4. Simulated Flow Field Configurations and Model Resolution
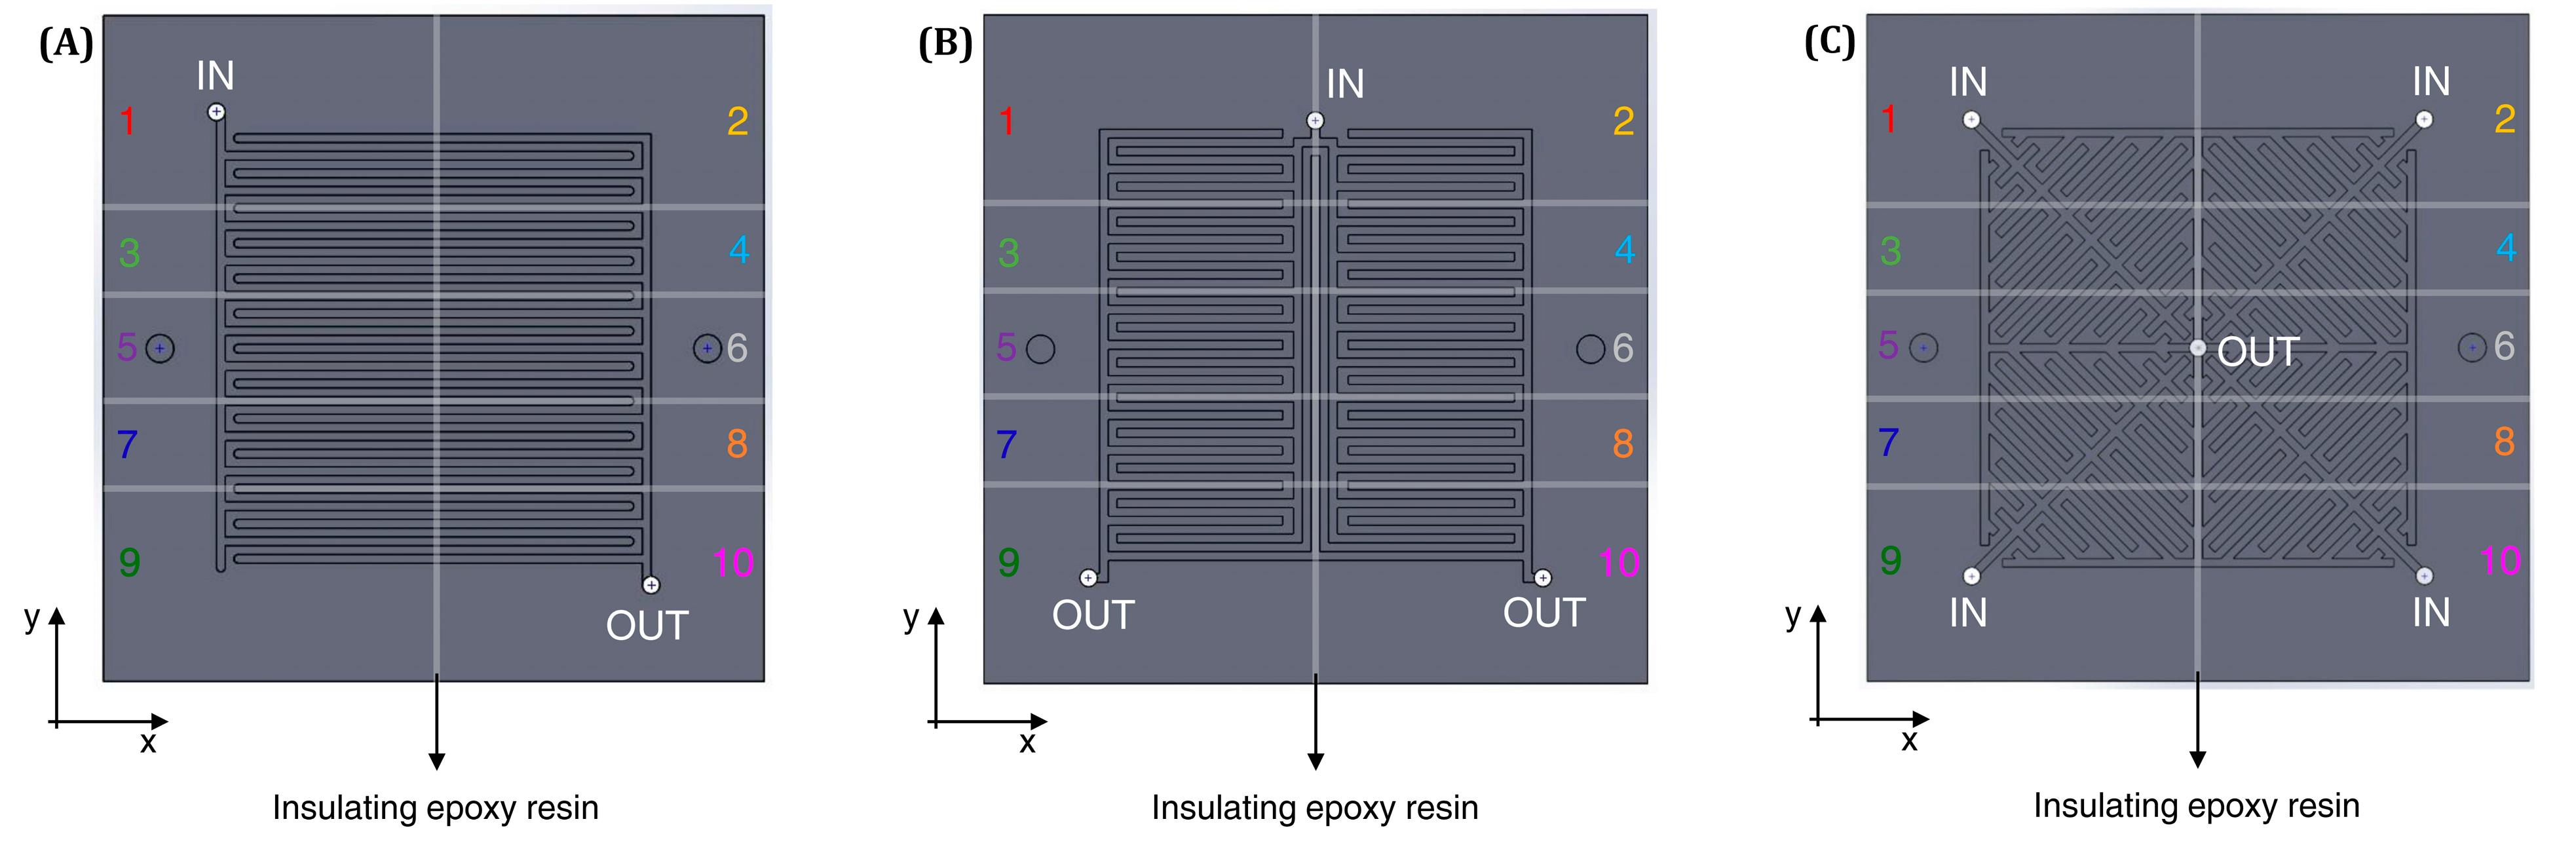
The model simulates the 25 cm2 experimental hardware described in Section 3.1: it is composed of 1 mm × 1 mm distributor channels with different in-plane geometries, that are designed to tune the direction of the pressure gradients between channels in order to promote the under-the-rib fluxes mechanism. Figure 2 illustrates the simulated flow field configurations: the first one is a conventional Interdigitated (Figure 2A), the second one is the Two Outlets (Figure 2B) exploiting the splitting of the electrolyte flow into two adjacent interdigitated layouts and the third one is the Four Inlets (Figure 2C), that presents an interdigitated-like layout radially oriented from each inlet located at the corners to one single central outlet. In Figure 2 the presence of epoxy resins highlights the ten different electrically insulated regions of the flow fields in which both current density and impedance spectra are measured.
As reported in [14], A SIMPLE algorithm was adopted for the resolution of the pressure-velocity coupling, while a PRESTO! scheme and a second-order upwind scheme were used for the resolution of pressure and for the discretisation of the other equations, respectively.
In all the investigated flow field configurations a hexahedral structured mesh was employed. It was refined for the sake of accuracy in the porous electrode and in specific regions of the flow field that are expected to present higher gradients of the physical quantities. The Grid Convergence Index (GCI) analysis was performed in order to verify the solutions independency from the adopted spatial discretization. The resulting error band was lower than 1% with respect to the asymptotic solution for all the simulated flow field configurations.
Table 3 reports the adopted model parameters, that are taken from the previous work by the authors [14], in which they were either assumed, taken from the literature or fitted after extensive model validation at local level with interdigitated and single serpentine distributors varying the operating conditions [14]. Since, in this work, the developed model is used to support the design of innovative distributors prior to their realization and experimental characterization, a re-calibration of model parameters was not necessary.
3. Experimental
3.1. Experimental Setup
The custom macro-segmented flow battery (m-SFB) setup described in details in previous works of the authors [14,29] was exploited to locally characterize the performance of the battery with the different flow field geometries. Such m-SFB setup consisted in both graphite flow fields and current collectors divided into ten electrically insulated segments (Figure 3), while no modification of the electrodes was necessary. In-house manufactured flow fields were realized with the m-SFB setup for the Two Outlets and Four Inlets geometries, as well as a conventional Interdigitated geometry.
The operation of each segment of the m-SFB setup was controlled and measured by a high-precision source-measure unit (SMU) module (NI PXIe-4139, National Instruments, Austin, TX, USA), for a total of ten SMUs. The ten SMUs allowed the measurement of local polarization curves and electrochemical impedance spectroscopies (EIS). The operating mode of the SMUs was potentiostatic to ensure the same voltage value for each segment to avoid internal cross-currents and to guarantee the operation of a cell as if it was in a standard hardware [14,29].
The electrochemical characterization was performed in a flow battery of active area 25 cm2 in the symmetric-cell configuration, operating only with the positive electrolyte at a State of Charge (SoC) of 50%. Despite a null open circuit voltage, this cell configuration is frequently adopted since it permits the maintenance of a constant SoC during the measurements, eliminating the losses and uncertainties due to vanadium cross-over. In particular, the electrolyte is fed into the inlet of the negative half-cell through a peristaltic pump (Watson-Marlow 323Du with a 4-roller head pump), while the positive half-cell inlet is connected to the outlet of the negative half-cell (Figure 3) [14,29]. It must be emphasised that in a symmetric cell vanadium cross-over does not affect battery performance, thus the adoption of this configuration provides the possibility to easily control electrolyte SoC, permitting the opportunity for repeatable experimental results. In fact, the characterization in the full-cell configuration is affected by the presence of cross-over phenomena and the related capacity decay, implying a not ideal management of electrolytes that can alter battery performance in an uncontrolled way. Moreover, a symmetric-cell configuration with a positive electrolyte is not limited by kinetic losses, permitting the evaluation of flow field performance towards the operation at high current densities.
Untreated Sigracet® 39AA carbon papers (290 µm nominal thickness) were used as electrodes for both half-cells with active area of 25 cm2. Both electrodes were compressed to about 80% of nominal thickness, using 230 µm thick glass-PTFE sealing gaskets. The membrane was a 127 µm thick NafionTM N115.
The positive electrolyte solution was an aqueous solution of 1.6 M vanadium ions (, obtained by mixing vanadium IV sulphate oxide hydrate (Alfa Aesar) in 5 M sulfuric acid (VWR), following the procedure described in [30]. The electrolyte was kept in a bottle slightly over-pressured with nitrogen to avoid air intake.
A pressure transducer (Druck PMP1400, accuracy ±0.15% of pressure) was connected in the hydraulic circuit to measure the pressure drop between cell inlet and outlet.
3.2. Experimental Tests
The performance of the flow battery with the different flow field geometries was investigated through global and locally resolved polarization curves and electrochemical impedance spectroscopies, along with the evaluation of pressure drops. Data recording and all instrument operations were managed through the LabVIEW® programming environment by National Instruments.
3.2.1. Polarization Curves
Polarization curves were performed at SoC 50% in positive symmetric cell configuration in potentiostatic mode. It is worth mentioning that the symmetric cell configuration guaranteed a constant SoC throughout the polarization curve. The polarization curves were limited in the voltage range ±0.5 V to avoid the occurrence of side-reactions such as oxygen evolution or carbon corrosion, which occur at high potentials for the oxidation reaction [14,29]. Voltage steps were applied with a holding time of 120 s to ensure a steady state condition. In the post-processing of the experimental data of the measured current densities, the initial transitory of each voltage step (the initial 80% of each voltage step) is discarded and the average value of the remaining raw data were plotted with respect to the applied potential step.
The polarization curves were performed at the flow rates of 20, 40 and 90 to evaluate the influence of the flow rate on the performance of the battery with the different flow fields. These values of flow rates correspond to a stoichiometry evaluated at 0.2 A cm−2 of 5, 10 and 23, respectively. Moreover, the influence of each flow field geometry on the heterogeneity of operation was investigated by calculating the heterogeneity index of the local distribution of the current density. As reported in Messaggi et al. [29], the heterogeneity index is calculated as the standard deviation of the local current density of the segments normalized with respect to the value of the global current density.
3.2.2. Electrochemical Impedance Spectroscopy
Local EIS analysis was performed at 0.1 A cm−2 exploiting the ability of the SMUs to generate high-speed digital current/voltage profiles coupled with high-speed acquisition. EIS were performed on all cell segments simultaneously to avoid interferences between the segments, ensuring that each of the segment oscillation profiles were precisely synchronized by combining native LabVIEW® functions by National Instrument to set output sequences and synchronizing digital triggers with nominal source event delay of 10 µs [31]. EIS were performed by fixing the total current density and not the voltage of the cell to ensure a fair comparison between the different configurations, as working at the same total current density guarantees the same values of the involved overall mass and charge fluxes [29]. The EIS were performed at 40 frequencies during four periods logarithmically distributed in the range 50 kHz–10 mHz, while the semi-amplitude of the oscillation was 10 mA.
It is worth mentioning that since the EIS were performed in symmetric cell configuration, the SoC of the electrolyte was kept constant for the overall duration of the spectroscopy, ensuring a steady-state condition [29].
3.2.3. Pressure Drops
The pressure drops through the symmetric cell varying the flow rate were investigated by measuring the pressure of a pulse dampener inserted in the hydraulic circuit before the cell inlet, following the procedure described by Pezeshki et al. [28] The gas pressure inside the dampener, which is a sealed glass bottle acting as a “gas spring”, builds up until it reaches a stable value corresponding to the pressure drop at the desired electrolyte flow rate [28].
4. Results and Discussion
4.1. Model Simulations
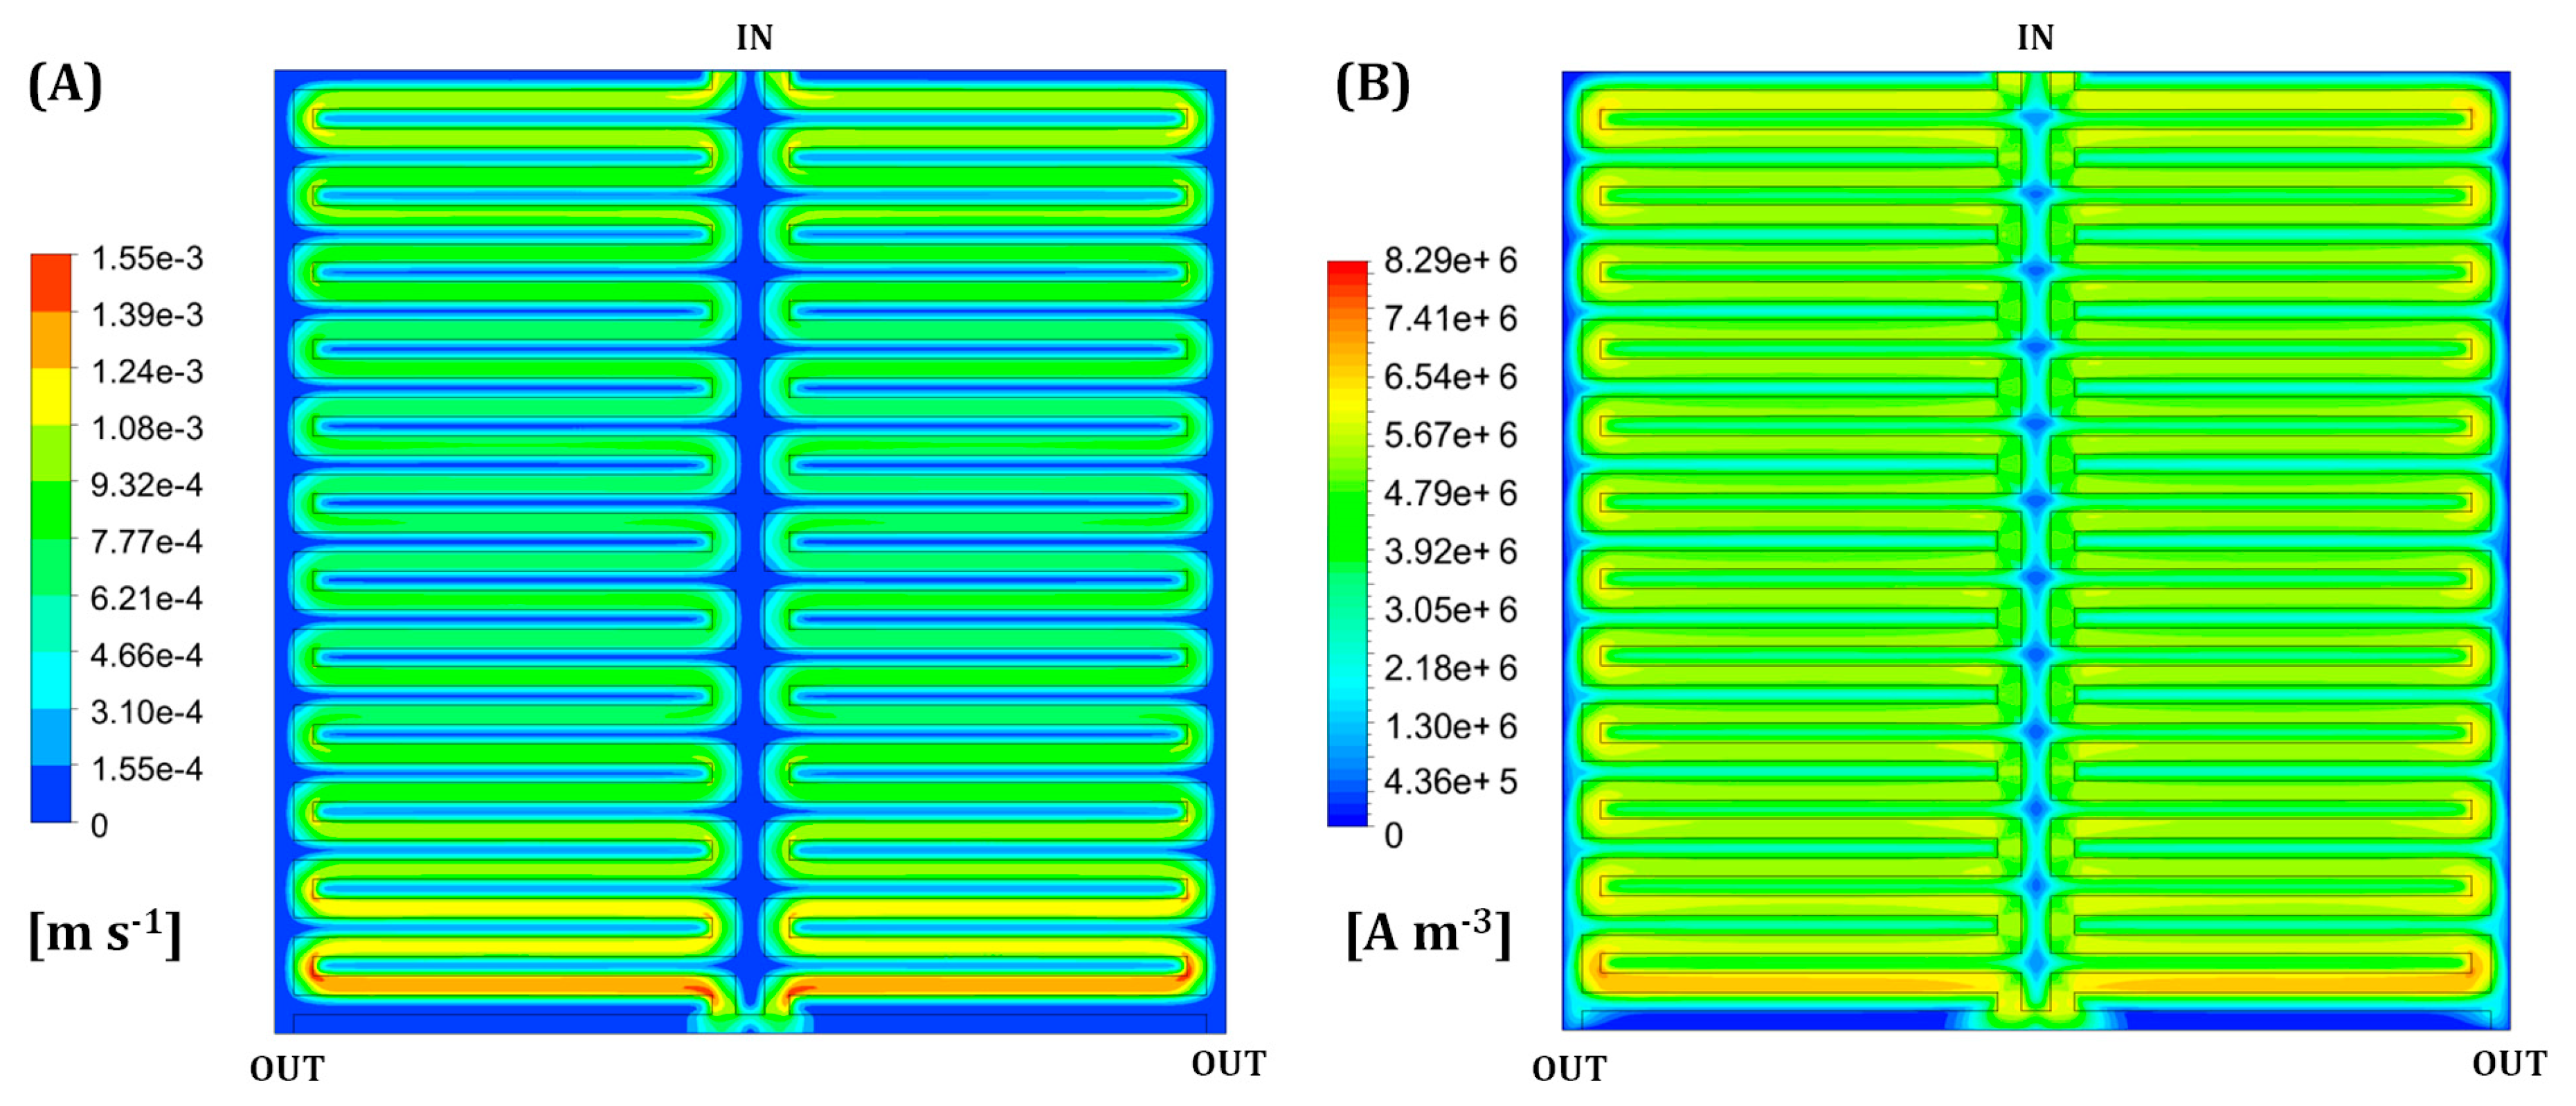
The CFD model previously developed was used to investigate the changes in the fluid dynamics inside the porous electrode and in the distribution of reaction rate with the introduction of the proposed geometries with respect the conventional Interdigitated flow field. Figure 4 reports the resulting contours of velocity field magnitude and reaction rate inside the electrode on a plane at half thickness for the Interdigitated flow field at 0.15 A cm−2 and 20 mL min−1. As reported in a previous work by the authors [15], the velocity field inside the electrode presents local maxima values of its magnitude (Figure 4A) in the under-the-rib zones between adjacent channels. Moreover, it is possible to observe that the central area of the electrode is characterized by lower velocities with respect to the areas closer to cell inlet and outlet. Indeed, the segments close to cell inlet and outlet are slightly influenced by pressure drops associated to the inlet and outlet manifold, respectively, while the electrolyte distribution across the central region of cell active area is affected by the pressure drops occurring in both the inlet and outlet manifold. The distribution of the local reaction rate (Figure 4B) recalls the distribution of the velocity magnitude, as higher reaction rates can be observed between the distribution channels rather than under them. Accordingly, the central area of the electrode is characterized by lower local performance with respect to the outer zones.
This correlation between velocity and local performance is caused by the fact that more intense convective fluxes through the porous electrode favour the local feeding of reactants and higher local concentrations on the active carbon surface, leading to higher local performances in presence of higher local velocities [15].
Analysing the newly-designed Two Outlets flow field (Figure 5A) at 0.15 A cm−2 and 20 mL min−1, the velocity field in the porous electrode shows lower values of the velocity magnitude with respect to the Interdigitated geometry because of to the flow splitting in more distribution channels at the inlet. However, it is characterized by a more homogenous distribution of the local velocities over the electrode area, also reducing the differences between the middle area of the electrode and the ones near the inlet and outlet. The increase in homogeneity of the velocity field in the Two Outlets geometry guarantees also a more homogenous distribution of the local reaction rates across the active area compared to the Interdigitated geometry (Figure 5B). This allowed a reduction in the differences in terms of local reaction rate between the different areas of the electrode, obtaining high values also in the central area, where the Interdigitated flow field suffers of poor performance. However, the Two Outlets geometry is characterized by a lower value of the peak reaction rate because of the reduced velocity values in the porous electrode due to the flow splitting at the inlet.
As regards the Four Inlets geometry, Figure 6A depicts the magnitude of the velocity fields inside the porous electrode at 0.15 A cm−2 and 20 mL min−1: the distribution results are homogeneous among the four quadrants, with the highest values in the central area of the electrode, near the outlet. This is the opposite case of the conventional Interdigitated geometry, where the central area presents the lowest velocity values. However, the model highlights that the flow splitting into four channels resulted in very low values of the velocity in the electrode portions under the distribution channels. Comparing Figure 5A and Figure 6A it is possible to observe that the Four Inlets geometry is characterized by lower values of velocity inside the electrode due to the higher flow splitting.
The distribution of the local reaction rates (Figure 6B) follows the profile of the velocity magnitude (Figure 6A) and it appears to be uniform among the four quadrants. In particular, the Four Inlets geometry suffers with poor performance in the zones located under the channels due to the lower velocities. It is worth noting that the inlet channels are less penalised by the low velocity with respect to the outlet channels because the inlet channels operate with a less depleted electrolyte than the outlet ones. As with the case of the Two Outlets geometry, the Four Inlet geometry is characterized by a lower value of the peak reaction rate than the conventional Interdigitated flow field.
The CFD model analysis of the developed flow field geometries highlighted the differences in the fluid-dynamic behaviour inside the porous electrode. In the next section, the considered flow field geometries are characterized experimentally in symmetric-cell configuration to determine the effect of different electrolyte distribution on performance at local level and pressure drops.
4.2. Experimental Results
Figure 7A–C compare polarization curves of the Two Outlets and Four Inlets geometries with the ones of conventional Interdigitated at different volumetric flow rates. (Since the polarization curves were symmetric, only the polarization at negative voltage was reported for the sake of figure readability. The difference between polarization curves at negative and positive voltage was always lower than 5%.) The stoichiometry calculated at the highest measured current density, at 20, 40 and 90 ml min−1, was 2.5, 3.7 and 7, respectively.
Battery performances are regulated by a complex interplay of kinetic and mass transport phenomena, occurring with a different intensity throughout the cell active area. Considering CFD simulations, Interdigitated geometry presents higher electrolyte velocities, while Two Outlets and Four Inlets guarantee a more even electrolyte distribution. The latter is a key aspect in determining VRFB performance: in fact, if a portion of active area suffers from severe electrolyte starvation, other regions need to operate at a higher current density, thus increasing the reaction’s overpotential.
At 20 mL min−1 (Figure 7A) the proposed geometries allowed a slight increase in performance at high current: the Four Inlets and the Two Outlets geometries induced an increase in the maximum current density at −0.5 V of about 10% and 15%, respectively. This is most probably associated with a more heterogeneous distribution of under-the-rib fluxes in the Interdigitated flow field. By contrast, at lower current densities the differences among the tested flow fields are minor, since the operation is less affected by the distribution of under-the-rib fluxes and the Interdigitated slightly overperforms the new geometries due to the higher electrolyte velocities in the porous electrode. Increasing the flow rate to 40 mL min−1 (Figure 7B) led to similar performance among the different geometries in the low current region due to the increased velocity in the electrodes, while in the high current region the proposed geometries still slightly out-performed the Interdigitated flow field, increasing the maximum current density by nearly 9%. This suggests that the proposed geometries can reduce the mass transport related losses because of a more homogenous distribution of reactants through the electrode, coherently with the CFD analysis reported in Figure 5 and Figure 6. Indeed, increasing the flow rate to 90 mL min−1 (Figure 7C) resulted in similar performance among the three flow fields, as the higher stoichiometry of reactants limited mass transport issues throughout active area.
As mentioned in Section 3, the pressure drop through the cell is one of the fundamental parameters to consider during the design of a flow field geometry, since it influences the consumption of the auxiliaries. For this reason, the pressure drops of the novel geometries were measured and compared with those of the reference geometry, as depicted in Figure 7D. The proposed geometries significantly reduced the pressure drops through the cell due to the lower velocities in the electrodes. In particular, at 90 mL min−1 the Two Outlets and the Four Inlets induced a reduction of around 50% and 60%, respectively. The lower pressure losses with the Four Inlets with respect to the Two Outlets are coherent with the lower velocities in the electrode (Figure 5 and Figure 6).
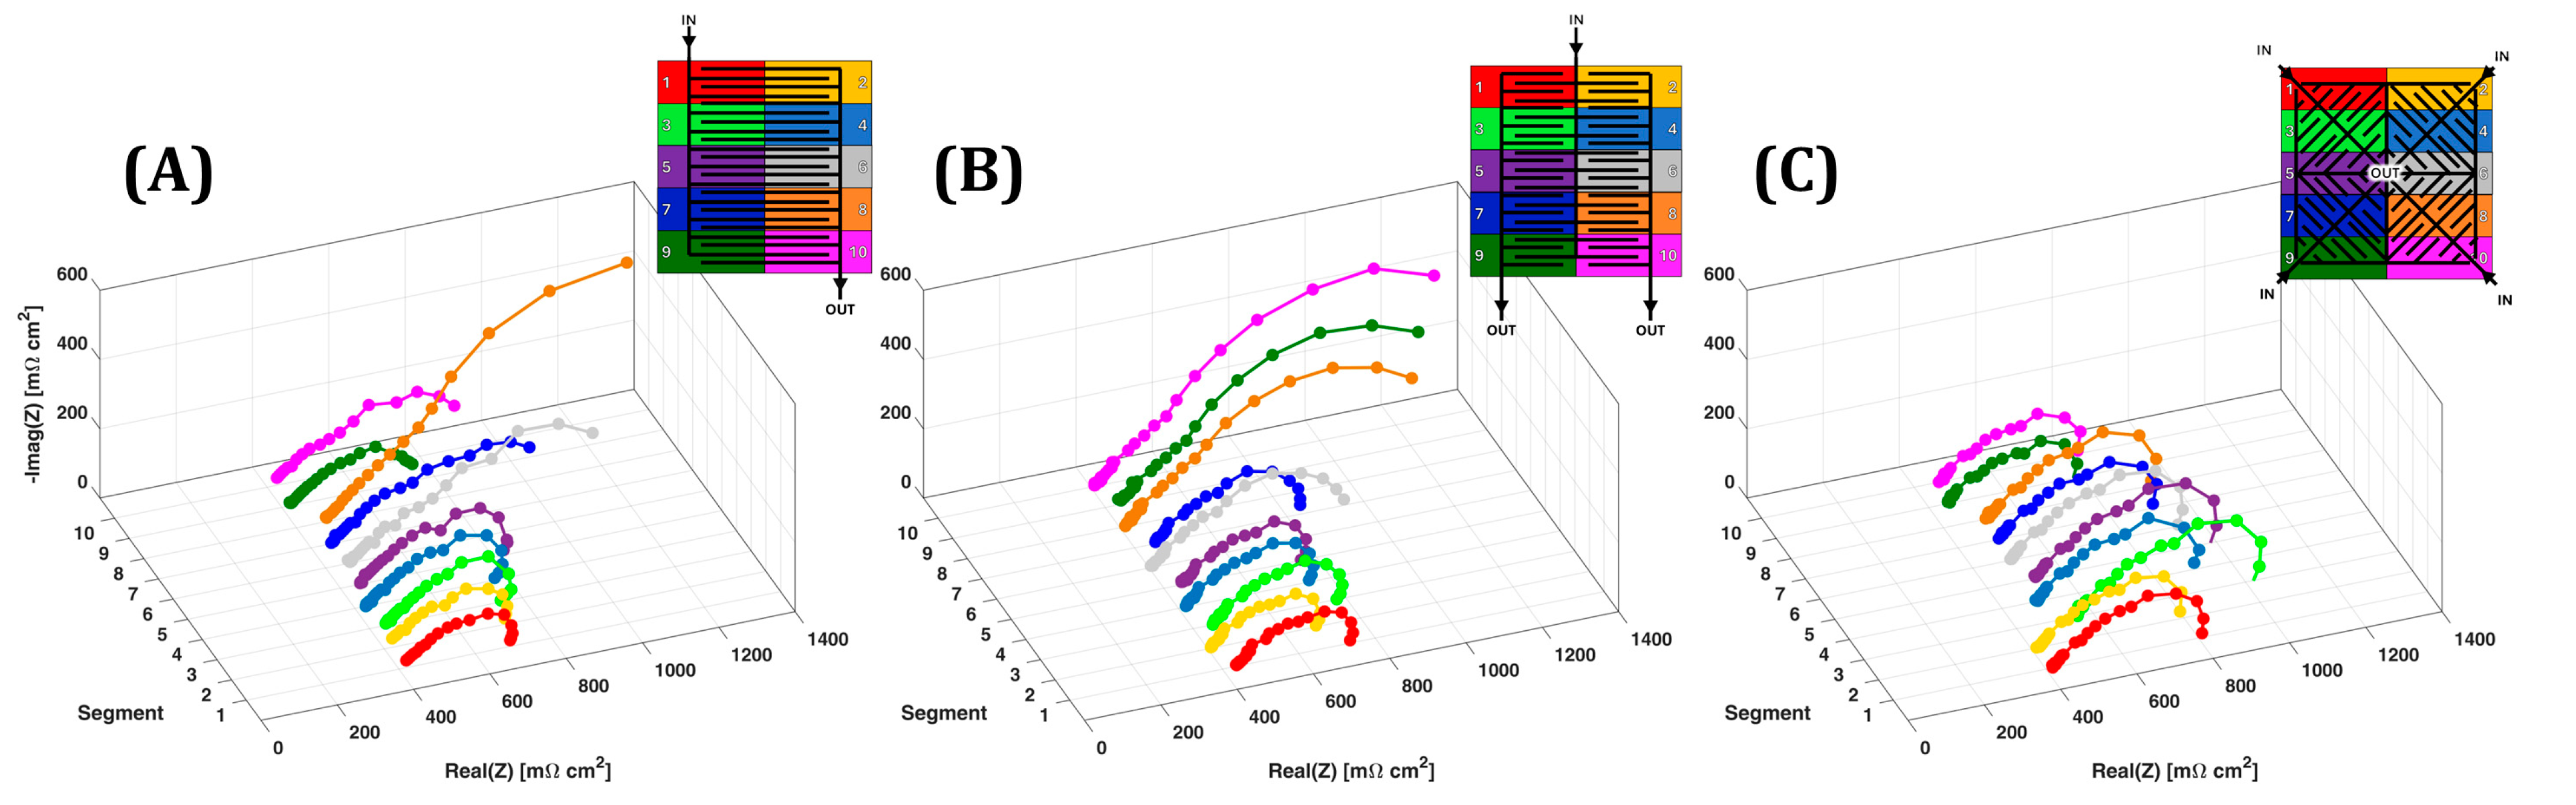
Reduced pressure drops are not the only benefit that the Two Outlets and Four Inlets geometries introduced: the proposed geometries allowed a reduction in the heterogeneity of operation, in particular at high current density and low volumetric flow rate, as it can be observed from the local distributions of the performance, reported in Figure 8, and from the heterogeneity indexes listed in Table 4. (In Figure 8 only the local polarization curves at 20 ml min−1 and 90 ml min−1 are reported for the clarity of the figure. The experimental data at 40 ml min−1 are not reported since the current density distribution is similar to the one obtained at 90 ml min−1).
Coherently with the simulated reaction rate in Figure 4B, Interdigitated flow field (Figure 8A,B) is characterized by a parabolic distribution of the local current density with the segments closer to the inlet and outlet operating with higher values of the current density than the central ones. This is related to the velocity field in the porous electrode, exhibiting higher values close to cell inlet and outlet, as already illustrated in Figure 4A. By contrast, the Two Outlets flow field (Figure 8C,D) presented a more homogeneous distribution of the local performances as the flow splitting allowed the reduction of differences in the velocity field among the electrode active area (Figure 5A). In this configuration the performances of the segments close to cell outlets exhibit lower performance due to the occurrence of local starvation, as highlighted in the simulated reaction rate in Figure 5B. The lower heterogeneity indexes with respect to the Interdigitated geometry, in particular at high current density at 20 mL min−1 (Table 4), confirms that the Two Outlets flow field guarantees a more even distribution of the local current density, which can be related to a more homogenous distribution of the reactants across the active area, reducing the occurrence of localized mass transport losses. Increasing the flow rate at 90 mL min−1 made the operation for both flow field geometries more homogenous due to the higher stoichiometry of the reactants.
As regards the local performance of the Four Inlets (Figure 8E), the distribution of the local current densities recalls the one for the Interdigitated geometry. In this case, the central segments are characterized by lower performance since they are close to the electrolyte outlet, where all the depleted electrolyte recollects. This behaviour is mitigated by increasing the flow rate to 90 mL min−1 (Figure 8F), due to the higher operating stoichiometry. By contrast, the segments closer to the four inlets operate with higher reactant concentrations, favouring the reaction rates. For these reasons and considering the excessive reduction of the velocity due to the higher splitting of the flow, the Four Inlets presented more heterogeneous performance than the Two Outlets, as reported by the heterogeneity indexes in Table 4. Moreover, the excessive reduction of the velocity in the electrode and the reduction of reactant concentrations in the central region prevented a reduction of the heterogeneity with respect to the Interdigitated flow field, as occurred in the case of Two Outlets. Indeed, the benefit of the Four Inlets flow field in terms of reduction of heterogeneity occurred only at low flow rate and high current density, where mass transport losses are more impactful, and a more uniform distribution of the flow rate helped in improving the local performance. By contrast, at higher flow rate the heterogeneity indexes for the Four Inlets and Interdigitated flow fields are very similar as the higher stoichiometry contributed to homogenise the performance.
Figure 9 reports the local electrochemical impedance spectroscopy spectra for the different flow fields at 0.1 A cm−2 and 20 mL min−1. (The data at 40 mL min−1 and 90 mL min−1 are not reported since the measurements are performed down to 10 mHz: this value is not very low and results in minor differences among the spectra.) Since the experimental configuration was the symmetric cell with positive electrolyte, whose reactions are not limited by kinetic, the high frequency charge-transfer semi-circle is not visible in all the spectra [29]. By contrast, it is possible to distinguish a linear trait in the middle frequencies range and a low frequency semi-circle. These two features depend on mass transport phenomena occurring both in the electrode and in the distribution channels [32] and therefore present differences among the tested flow fields.
It is worth noting that the total resistance of an impedance spectrum, defined as the intercept with the x-axis at null frequency, is proportional to the slope of the polarization curve [33]: thus, minor differences in local polarization curves are more evident analysing local impedance spectra. Moreover, in VRFB impedance spectra are strongly influenced by the operating current [32,34]: in this work the measurements were performed at an average cell current density of 0.1 A cm−2, but each local spectrum was evaluated at the local operating current, which was not the same for all the different segments. This results in a more complex comparison of local impedance spectra. However, according to the performance analysis of polarization curves, the local spectra of the central segments of the Interdigitated (Figure 9A) and Four Inlets (Figure 9C) flow fields exhibit larger low-frequency features with respect to the external segments, coherently with the local performance reported in Figure 8A,C and the fluid-dynamics in the electrodes described in Section 3. It also worth noting that for the Interdigitated flow field (Figure 9A), the segments in which the depleted electrolyte is recollected, in particular the numbers six and eight on the outlet manifold, present larger spectra with respect the others. While in the case of the Four Inlets, the differences between the segments are smaller because the fresh electrolyte is fed into four different regions, resulting in a more homogeneous distribution.
5. Conclusions
This work presents the development of novel flow field geometries that are designed to tune the direction of the pressure gradients between channels in order to promote and distribute across the active area the under-the-rib fluxes mechanism. With the aid of a 3D CFD model two geometries have been developed, that are characterized with a different number of electrolyte outlets or inlets. The first geometry is the Two Outlets and exploits the splitting of the electrolyte flow into two adjacent interdigitated layouts with the aim of giving to the pressure gradient a more transverse direction with respect to the channels, raising the intensity of under-the-rib fluxes and making their distribution more uniform throughout electrode area. The second geometry is the Four Inlets and presents four inlets located at the corners of the distributor, with an interdigitated-like layout radially oriented from each inlet to one single central outlet, with the aim of reducing the heterogeneity of the flow velocity within the electrode. The performance of the developed flow fields was characterized in a segmented-cell hardware in a symmetric-cell configuration with positive electrolyte, analysing the local distribution of current density and impedance spectra and comparing them with the ones of a conventional Interdigitated geometry. The main conclusions of the work are the following:
- Compared to the conventional Interdigitated, in the Two Outlets model simulations highlight a more homogenous distribution of the local velocities over the electrode area, while in the Four Inlets the predicted electrolyte velocities under the distribution channels result in very low values due to the flow splitting into four inlets. Accordingly, the simulated local reaction rate in the Two Outlets is also more homogenous across the active area, while the Four Inlets presents a lower value of the peak reaction rate.
- Compared to a conventional Interdigitated geometry, both the developed configurations allow a significant decrease in the pressure drops without any reduction in battery performance. In particular, at 90 mL min−1 the Two Outlets and the Four Inlets induced a reduction of around 50% and 60%, respectively.
- The heterogeneity index, that quantifies the variability of the current density distribution, exhibits a sensible reduction in the case of Two Outlets, suggesting that the considered geometry tends to homogenize battery operation across the active area. By contrast, the Four Inlets induces a reduction of heterogeneity only at low flow rate and high current density.
In conclusion, both the developed flow fields are able to considerably reduce pressure drops and guarantee a more homogeneous battery operation, without any reduction in battery performance. Limited pressure drops and homogeneous operation are key aspects for flow field scale-up to larger active areas.
Author Contributions
Conceptualization, M.M. and M.Z.; methodology, M.M.; software, M.M.; validation, M.C. and M.M.; formal analysis, M.C. and M.M.; investigation, M.M.; resources, M.Z.; data curation, M.C.; writing—original draft preparation, M.C., M.M. and M.Z.; writing—review and editing, M.C. and M.Z.; visualization, M.M. and M.Z.; supervision, M.Z. and A.C.; project administration, M.Z. and A.C.; funding acquisition, M.Z and A.C. All authors have read and agreed to the published version of the manuscript.
Funding
This research was partially funded by ENI S.p.A. in the framework of the research project entitled: “Batterie a flusso al vanadio innovative” (OdL 4310296114 of 6 September 2018).
Data Availability Statement
The data presented in this study are available on request from the corresponding author.
Conflicts of Interest
The authors declare no conflict of interest.
Nomenclature
| List of symbols | |
| a | Specific active area [m2 m−3] |
| c | Molar concentration [mol m−3] |
| D | Diffusivity of vanadium ions [m2 s−1] |
| Eeq | Equilibrium potential [V] |
| F | Faraday constant [C mol−1] |
| f | Volume force vector [N m−3] |
| hm | Mass transport coefficient [m s−1] |
| i | Current density [A m−2] |
| iR | Reaction rate [A m−3] |
| k0 | Reaction rate constant [m s−1] |
| M | Molarity [mol l−1] |
| N | Species molar flux [mol m−2 s−1] |
| p | Pressure [Pa] |
| R | Universal gas constant [J mol−1 K−1] |
| T | Temperature [K] |
| u | Velocity vector [m s−1] |
| t | Compressed electrode thickness [m] |
| t0 | Uncompressed electrode thickness [m] |
| ui | Species mobility [mol s kg−1] |
| z | Charge number [-] |
| Greek symbols | |
| α | Charge transfer coefficient [-] |
| β F | Forchheimer drag coefficient [m−1] |
| ε | Porosity of compressed electrode [-] |
| εno compression | Porosity of uncompressed electrode [-] |
| η | Overpotential [V] |
| κ | Permeability [m2] |
| μ | Viscosity [Pa s] |
| ρ | Density [kg m−3] |
| ϕ | Potential [V] |
| Superscripts | |
| b | Relative to bulk |
| eff | Effective properties |
| s | Relative to surface |
| T | Transposed |
| Subscripts | |
| - | Relative to negative electrode |
| acid | Relative to sulphuric acid |
| H+ | Relative to protons |
| Relative to hydrogen sulphate ions | |
| l | Relative to electrolyte |
| out | Relative to channel outlet |
| s | Relative to solid phase |
| Relative to sulphate ions | |
| V | Relative to Vanadium |
| VO2+ | Relative to VO2+ ion—Vanadium (IV) |
| Relative to ion—Vanadium (V) | |
Glossary
| CFD | Computational fluid dynamics |
| PRESTO! | Pressure staggering options |
| SIMPLE | Semi-implicit method for pressure linked equations |
| SoC | State of charge |
| VRFB | Vanadium redox flow battery |
References
- Puleston, T.; Clemente, A.; Costa-Castelló, R.; Serra, M. Modelling and Estimation of Vanadium Redox Flow Batteries: A Review. Batteries 2022, 8, 121. [Google Scholar] [CrossRef]
- Alotto, P.; Guarnieri, M.; Moro, F. Redox flow batteries for the storage of renewable energy: A review. Renew. Sustain. Energy Rev. 2014, 29, 325–335. [Google Scholar] [CrossRef]
- Soloveichik, G.L. Flow Batteries: Current Status and Trends. Chem. Rev. 2015, 115, 11533–11558. [Google Scholar] [CrossRef]
- Parasuraman, A.; Lim, T.M.; Menictas, C.; Skyllas-Kazacos, M. Review of material research and development for vanadium redox flow battery applications. Electrochim. Acta 2013, 101, 27–40. [Google Scholar] [CrossRef]
- Weber, A.Z.; Mench, M.M.; Meyers, J.P.; Ross, P.N.; Gostick, J.T.; Liu, Q. Redox flow batteries: A review. J. Appl. Electrochem. 2011, 41, 1137–1164. [Google Scholar] [CrossRef]
- Wu, M.; Liu, M.; Long, G.; Wan, K.; Liang, Z.; Zhao, T.S. A novel high-energy-density positive electrolyte with multiple redox couples for redox flow batteries. Appl. Energy 2014, 136, 576–581. [Google Scholar] [CrossRef]
- Chakrabarti, M.; Brandon, N.; Hajimolana, S.; Tariq, F.; Yufit, V.; Hashim, M.; Hussain, M.; Low, C.; Aravind, P. Application of carbon materials in redox flow batteries. J. Power Sources 2014, 253, 150–166. [Google Scholar] [CrossRef]
- Zhang, X.; Higier, A.; Zhang, X.; Liu, H. Experimental studies of effect of land width in PEM fuel cells with serpentine flow field and carbon cloth. Energies 2019, 12, 471. [Google Scholar] [CrossRef]
- Arenas, L.F.; de León, C.P.; Walsh, F.C. Pressure drop through platinized titanium porous electrodes for cerium-based redox flow batteries. AIChE J. 2018, 64, 1135–1146. [Google Scholar] [CrossRef]
- Houser, J.; Pezeshki, A.; Clement, J.T.; Aaron, D.; Mench, M.M. Architecture for improved mass transport and system performance in redox flow batteries. J. Power Sources 2017, 351, 96–105. [Google Scholar] [CrossRef]
- Lisboa, K.M.; Marschewski, J.; Ebejer, N.; Ruch, P.; Cotta, R.M.; Michel, B.; Poulikakos, D. Mass transport enhancement in redox flow batteries with corrugated fluidic networks. J. Power Sources 2017, 359, 322–331. [Google Scholar] [CrossRef]
- Zeng, Y.; Li, F.; Lu, F.; Zhou, X.; Yuan, Y.; Cao, X.; Xiang, B. A hierarchical interdigitated flow field design for scale-up of high-performance redox flow batteries. Appl. Energy 2019, 238, 435–441. [Google Scholar] [CrossRef]
- Akuzum, B.; Alparslan, Y.C.; Robinson, N.C.; Agar, E.; Kumbur, E.C. Obstructed flow field designs for improved performance in vanadium redox flow batteries. J. Appl. Electrochem. 2019, 49, 551–561. [Google Scholar] [CrossRef]
- Messaggi, M.; Gambaro, C.; Casalegno, A.; Zago, M. Development of innovative flow fields in a vanadium redox flow battery: Design of channel obstructions with the aid of 3D computational fluid dynamic model and experimental validation through locally-resolved polarization curves. J. Power Sources 2022, 526, 231155. [Google Scholar] [CrossRef]
- Messaggi, M.; Canzi, P.; Mereu, R.; Baricci, A.; Inzoli, F.; Casalegno, A.; Zago, M. Analysis of flow field design on vanadium redox flow battery performance: Development of 3D computational fluid dynamic model and experimental validation. Appl. Energy 2018, 228, 1057–1070. [Google Scholar] [CrossRef]
- Wang, Y.; Cho, S.C. Analysis and Three-Dimensional Modeling of Vanadium Flow Batteries. J. Electrochem. Soc. 2014, 161, A1200–A1212. [Google Scholar] [CrossRef]
- Lei, Y.; Zhang, B.W.; Bai, B.F.; Chen, X.; Zhao, T.S. A transient model for vanadium redox flow batteries with bipolar membranes. J. Power Sources 2021, 496, 229829. [Google Scholar] [CrossRef]
- Li, Y.; Sun, L.; Cao, L.; Bao, J.; Skyllas-Kazacos, M. Dynamic model based membrane permeability estimation for online SOC imbalances monitoring of vanadium redox flow batteries. J. Energy Storage 2021, 39, 102688. [Google Scholar] [CrossRef]
- Cecchetti, M.; Toja, F.; Casalegno, A.; Zago, M. A Comprehensive Experimental and Modelling Approach for the Evaluation of Cross-Over Fluxes in Vanadium Redox Flow Battery. J. Energy Storage 2023, 68, 107846. [Google Scholar] [CrossRef]
- Knehr, K.W.; Agar, E.; Dennison, C.R.; Kalidindi, A.R.; Kumbur, E.C. A Transient Vanadium Flow Battery Model Incorporating Vanadium Crossover and Water Transport through the Membrane. J. Electrochem. Soc. 2012, 159, A1446–A1459. [Google Scholar] [CrossRef]
- Lei, Y.; Zhang, B.; Bai, B.; Zhao, T. A transient electrochemical model incorporating the Donnan effect for all-vanadium redox flow batteries. J. Power Sources 2015, 299, 202–211. [Google Scholar] [CrossRef]
- Chen, J.Q.; Wang, B.G.; Lv, H.L. Numerical Simulation and Experiment on the Electrolyte Flow Distribution for All Vanadium Redox Flow Battery. Adv. Mater. Res. 2011, 236–238, 604–607. [Google Scholar] [CrossRef]
- Ghimire, P.C.; Bhattarai, A.; Schweiss, R.; Scherer, G.G.; Wai, N.; Yan, Q. A comprehensive study of electrode compression effects in all vanadium redox flow batteries including locally resolved measurements. Appl. Energy 2018, 230, 974–982. [Google Scholar] [CrossRef]
- Schmal, D.; Van Erkel, J.; Van Duin, P.J. Mass transfer at carbon fibre electrodes. J. Appl. Electrochem. 1986, 16, 422–430. [Google Scholar] [CrossRef]
- Yamamura, T.; Watanabe, N.; Yano, T.; Shiokawa, Y. Electron-Transfer Kinetics of Np3+/Np4+, NpO2+/NpO22+, V2+/V3+, and VO2+ /VO2+ at Carbon Electrodes. J. Electrochem. Soc. 2005, 152, A830–A836. [Google Scholar] [CrossRef]
- Schweiss, R.; Meiser, C.; Damjanovic, T.; Galbiati, I.; Haak, N. SIGRACET® Gas Diffusion Layers for PEM Fuel Cells, Electrolyzers and Batteries (White Paper). 2016. Available online: https://www.fuelcellstore.com/spec-sheets/sigracet-gdl-white-paper-new-generation.pdf (accessed on 10 February 2024).
- Xu, Q.; Zhao, T.S.; Zhang, C. Effects of SOC-dependent electrolyte viscosity on performance of vanadium redox flow batteries. Appl. Energy 2014, 130, 139–147. [Google Scholar] [CrossRef]
- Pezeshki, A.M.; Sacci, R.L.; Delnick, F.M.; Aaron, D.S.; Mench, M.M. Elucidating effects of cell architecture, electrode material, and solution composition on overpotentials in redox flow batteries. Electrochim. Acta 2017, 229, 261–270. [Google Scholar] [CrossRef]
- Messaggi, M.; Rabissi, C.; Gambaro, C.; Meda, L.; Casalegno, A.; Zago, M. Investigation of vanadium redox flow batteries performance through locally-resolved polarisation curves and impedance spectroscopy: Insight into the effects of electrolyte, flow field geometry and electrode thickness. J. Power Sources 2019, 449, 227588. [Google Scholar] [CrossRef]
- Aaron, D.S.; Liu, Q.; Tang, Z.; Grim, G.M.; Papandrew, A.B.; Turhan, A.; Zawodzinski, T.A.; Mench, M.M. Dramatic performance gains in vanadium redox flow batteries through modified cell architecture. J. Power Sources 2012, 206, 450–453. [Google Scholar] [CrossRef]
- National Instruments, PXIe-4139 Specifications. 2024. Available online: https://www.ni.com/docs/en-US/bundle/pxie-4139-specs/page/specs.html (accessed on 10 February 2024).
- Vivona, D.; Messaggi, M.; Baricci, A.; Casalegno, A.; Zago, M. Unravelling the Contribution of Kinetics and Mass Transport Phenomena to Impedance Spectra in Vanadium Redox Flow Batteries: Development and Validation of a 1D Physics-Based Analytical Model. J. Electrochem. Soc. 2020, 167, 110534. [Google Scholar] [CrossRef]
- Barsoukov, E.; Macdonald, J.R. Impedance Spectroscopy, Theory, Experiment, and Applications, 2nd ed.; Wiley-Interscience: New York, NY, USA, 2005. [Google Scholar]
- Schneider, J.; Tichter, T.; Khadke, P.; Zeis, R.; Roth, C. Deconvolution of electrochemical impedance data for the monitoring of electrode degradation in VRFB. Electrochim. Acta 2019, 336, 135510. [Google Scholar] [CrossRef]
Figure 1.
Schematic representation of under-the-rib fluxes with Interdigitated flow field geometry.

Figure 2.
Simulated flow fields configurations: (A) Interdigitated; (B) Two Outlets; (C) Four Inlets.
Figure 2.
Simulated flow fields configurations: (A) Interdigitated; (B) Two Outlets; (C) Four Inlets.

Figure 3.
Schematic representation of the experimental setup.

Figure 4.
Velocity magnitude (A) and reaction rate (B) with the Interdigitated geometry at 0.15 A cm−2 and 20 mL min−1 on a plane at half electrode thickness. Miniature: position of the plane at half electrode thickness (red line).
Figure 4.
Velocity magnitude (A) and reaction rate (B) with the Interdigitated geometry at 0.15 A cm−2 and 20 mL min−1 on a plane at half electrode thickness. Miniature: position of the plane at half electrode thickness (red line).

Figure 5.
Velocity magnitude (A) and reaction rate (B) with the Two-Outlet geometry at 0.15 A cm−2 and 20 mL min−1 on a plane at half electrode thickness.
Figure 5.
Velocity magnitude (A) and reaction rate (B) with the Two-Outlet geometry at 0.15 A cm−2 and 20 mL min−1 on a plane at half electrode thickness.

Figure 6.
Velocity magnitude (A) and reaction rate (B) with the Four Inlets geometry at 0.15 A cm−2 and 20 mL min−1 on a plane at half electrode thickness.
Figure 6.
Velocity magnitude (A) and reaction rate (B) with the Four Inlets geometry at 0.15 A cm−2 and 20 mL min−1 on a plane at half electrode thickness.

Figure 7.
Polarization curves with the different flow field geometries at (A) 20 mL min−1, (B) 40 mL min−1 and (C) 90 mL min−1. (D) Pressure drops through the cell at different volumetric flow rates.
Figure 7.
Polarization curves with the different flow field geometries at (A) 20 mL min−1, (B) 40 mL min−1 and (C) 90 mL min−1. (D) Pressure drops through the cell at different volumetric flow rates.

Figure 8.
Local polarization curves with (A,B) Interdigitated, (C,D) Two Outlets and (E,F) Four Inlets geometries at 20 mL min−1 (A,C,E) and 90 mL min−1 (B,D,F). Miniatures: schematic representation of the segmented flow fields.
Figure 8.
Local polarization curves with (A,B) Interdigitated, (C,D) Two Outlets and (E,F) Four Inlets geometries at 20 mL min−1 (A,C,E) and 90 mL min−1 (B,D,F). Miniatures: schematic representation of the segmented flow fields.

Figure 9.
Nyquist plots of local electrochemical impedance spectra at 0.1 A cm−2 and 20 mL min−1 with the (A) Interdigitated, (B) Two Outlets and (C) Four Inlets flow fields. Miniatures: schematic representation of the segmented flow fields.
Figure 9.
Nyquist plots of local electrochemical impedance spectra at 0.1 A cm−2 and 20 mL min−1 with the (A) Interdigitated, (B) Two Outlets and (C) Four Inlets flow fields. Miniatures: schematic representation of the segmented flow fields.


Table 1.
Species molar source Si for the negative and positive electrodes.
| Negative Electrode | Positive Electrode | |
|---|---|---|
Table 2.
Values of ion concentrations set as boundary conditions at the negative and positive electrodes.
Table 2.
Values of ion concentrations set as boundary conditions at the negative and positive electrodes.
| Negative Electrode | Positive Electrode | |
|---|---|---|
Table 3.
Model parameters.
| Symbol | Description | Value | Unit | Reference |
|---|---|---|---|---|
| Electrode equilibrium potential | 1.004 | V | - | |
| Faraday constant | 96,485 | C mol−1 | - | |
| Universal gas constant | 8.314 | J mol−1 K−1 | - | |
| Temperature | 300 | K | - | |
| V4+ diffusivity | 3.9·10−10 | m2 s−1 | [25] | |
| V5+ diffusivity | 3.9·10−10 | m2 s−1 | [25] | |
| H+ diffusivity | 9.3·10−9 | m2 s−1 | [20] | |
| diffusivity | 1.33·10−9 | m2 s−1 | [20] | |
| SO2− diffusivity | 1.065·10−9 | m2 s−1 | [20] | |
| Electrode porosity w/o compression | 0.89 | - | [26] | |
| Electrode porosity with compression | 0.859 | - | ||
| Specific active area | 8·104 | m2 m−3 | [14] | |
| Electrolyte density | 1350 | kg m−3 | measured | |
| Electrolyte viscosity | 1.32·10−3 | Pa s | [27] | |
| Transfer coefficient | 0.5 | - | [28] | |
| Reaction rate | 4.94·10−6 | m s−1 | [14] | |
| Electrode permeability | 6.67·10−11 | m2 | [14] | |
| Convective mass transport coefficient | 2.5·10−4· | - | [14] | |
| Electrolyte conductivity | 3 | S m−1 | measured | |
| Electrode conductivity | 5 | S m−1 | [26] | |
| Vanadium molarity in the electrolyte | 1.6 | mol L−1 | - | |
| Sulfuric acid molarity | 5 | mol L−1 | - | |
| Electrolyte state of charge | 50 | % | - |
Table 4.
Heterogeneity index trends against current density at 20 mL min−1 and 90 mL min−1 with the different flow field geometries.
Table 4.
Heterogeneity index trends against current density at 20 mL min−1 and 90 mL min−1 with the different flow field geometries.
| Flow Rate [mL min−1] | 20 mL min−1 | 90 mL min−1 | |||||||
|---|---|---|---|---|---|---|---|---|---|
| Current Density [A cm−2] | 0.05 | 0.1 | 0.2 | 0.3 | 0.05 | 0.1 | 0.2 | 0.3 | 0.4 |
| Interdigitated | 0.080 | 0.083 | 0.105 | 0.157 | 0.071 | 0.072 | 0.076 | 0.081 | 0.098 |
| Two Outlets | 0.089 | 0.090 | 0.096 | 0.101 | 0.050 | 0.048 | 0.052 | 0.056 | 0.065 |
| Four Inlets | 0.112 | 0.114 | 0.121 | 0.135 | 0.083 | 0.083 | 0.084 | 0.084 | 0.084 |
Disclaimer/Publisher’s Note: The statements, opinions and data contained in all publications are solely those of the individual author(s) and contributor(s) and not of MDPI and/or the editor(s). MDPI and/or the editor(s) disclaim responsibility for any injury to people or property resulting from any ideas, methods, instructions or products referred to in the content. |
© 2024 by the authors. Licensee MDPI, Basel, Switzerland. This article is an open access article distributed under the terms and conditions of the Creative Commons Attribution (CC BY) license (https://creativecommons.org/licenses/by/4.0/).
Share and Cite
MDPI and ACS Style
Cecchetti, M.; Messaggi, M.; Casalegno, A.; Zago, M. Design and Development of Flow Fields with Multiple Inlets or Outlets in Vanadium Redox Flow Batteries. Batteries 2024, 10, 108. https://doi.org/10.3390/batteries10030108
AMA Style
Cecchetti M, Messaggi M, Casalegno A, Zago M. Design and Development of Flow Fields with Multiple Inlets or Outlets in Vanadium Redox Flow Batteries. Batteries. 2024; 10(3):108. https://doi.org/10.3390/batteries10030108
Chicago/Turabian StyleCecchetti, Marco, Mirko Messaggi, Andrea Casalegno, and Matteo Zago. 2024. "Design and Development of Flow Fields with Multiple Inlets or Outlets in Vanadium Redox Flow Batteries" Batteries 10, no. 3: 108. https://doi.org/10.3390/batteries10030108
Note that from the first issue of 2016, this journal uses article numbers instead of page numbers. See further details here.