Article

The Impact of a Combined Battery Thermal Management and Safety System Utilizing Polymer Mini-Channel Cold Plates on the Thermal Runaway and Its Propagation

1
Institute of Fluid Dynamics and Thermodynamics, Otto von Guericke University Magdeburg, 39106 Magdeburg, Germany
2
Department of Applied Biosciences and Process Engineering-Thermal Process and Energy Engineering, Anhalt University of Applied Sciences, 06366 Köthen, Germany
3
Institute of Apparatus and Environmental Technology, Otto von Guericke University Magdeburg, 39106 Magdeburg, Germany
*
Author to whom correspondence should be addressed.
Batteries 2024, 10(1), 1; https://doi.org/10.3390/batteries10010001
Submission received: 15 November 2023 / Revised: 7 December 2023 / Accepted: 12 December 2023 / Published: 20 December 2023
(This article belongs to the Special Issue Thermal Safety of Lithium Ion Batteries)

Abstract

:
Lithium-ion batteries are widely used in mobile applications because they offer a suitable package of characteristics in terms of specific energy, cost, and life span. Nevertheless, they have the potential to experience thermal runaway (TR), the prevention and containment of which require safety measures and intensive thermal management. This study introduces a novel combined thermal management and safety application designed for large aspect-ratio battery cells such as pouches and thin prismatics. It comprises polymer-based mini-channel cold plates that can indirectly thermally condition the batteries’ faces with liquid. They are lightweight and space-saving, making them suitable for mobile systems. Furthermore, this study experimentally clarifies to which extent the application of polymer mini-channel cold plates between battery cells is suitable to delay TR by heat dissipation and to prevent thermal runaway propagation (TRP) to adjacent cells by simultaneously acting as a thermal barrier. NMC pouch cells of 12.5 Ah capacity were overcharged at 1 C to induce TR. Without cold plates, TR and TRP occurred within one hour. Utilizing the polymer mini-channel cold plates for face cooling, the overcharge did not produce a condition leading to cell fire in the same time frame. When the fluid inlet temperature was varied between 5 and 40 °C, the overcharged cell’s surface temperature peaked between 50 and 60 °C. Indications were found that thermal conditioning with the polymer cold plates significantly slowed down parts of the process chain before cell firing. Their peak performance was measured to be just under 2.2 kW/m2. In addition, thermal management system malfunction was tested, and evidence was found that the polymer cold plates prevented TRP to adjacent cells. In conclusion, a combined thermal management and safety system made of polymer mini-channel cold plates provides necessary TR-related safety aspects in lithium battery systems and should be further investigated.

Graphical Abstract

1. Introduction

Lithium-ion batteries heat up under load due to electrochemical reactions and various multi-physical processes, which interact closely. The underlying thermal effects have distinct origins and can be further differentiated. The operation temperature exerts a significant influence on these processes and, thus, on the performance, aging, and, ultimately, the hazard potential of the batteries. Ideally, a cell temperature of approximately 25 °C is maintained during operation to prevent the slow down of reaction and transport processes, increasing overvoltages. In contrast, at elevated temperatures, the battery performance increases, but simultaneously, parasitic reaction mechanisms intensify, which leads to accelerated cell degradation and, in the worst case, to thermal runaway (TR).
Different research groups [1,2] urgently recommend a closer evaluation of integrated safety measures for fire and thermal runaway propagation (TRP) in the battery thermal management system (BTMS). In particular, this applies to mobile applications because of weight and space availability limitations. However, every battery electric vehicle (BEV) must fulfill strict regulatory safety requirements before road approval. Thermal barriers enhance safety during abnormal operation conditions by containing the damage of cell fires and avoiding propagation to adjacent cells. However, they disrupt the regular heat transport path during normal operation. Thermal conditioning, which involves heating and cooling, maintains battery cells within their optimal temperature range and slows down critical processes during their early stages by intensive heat dissipation. Therefore, a trade-off between the rapid dissipation of heat and heat blockage is required in the design of a combined thermal management and safety system. In this article, a novel approach to an application addressing this trade-off is introduced, consisting of polymer-based mini-channel cold plates suitable for the face cooling of large surface-to-volume battery cells. Additionally, the effectiveness of this approach in achieving the trade-off is experimentally investigated.
In a regular use case of lithium-ion battery cells, three fundamental shares of irreversible heat production can be pointed out [3,4] that result from the following effects: (I) ohmic losses based on Joule heating related to charge transport and polarization, as well as overvoltages originating from (II) activation losses of the kinetics at the catalytic surface, and (III) concentration losses due to imperfections in the species transport during diffusion. Additionally, a reversible share related to the entropic heat production of the primary reaction system is noticeable under load [5]. In Equation (1), a simplified expression [3,6] of the released battery heat during cycling, initially proposed by [7], can be found.
Q ˙ = I 2 r i Q ˙ i r r e v + I   T 𝜕 U O C V 𝜕 T Q ˙ r e v
The irreversible heat increases as the current I does and depends on the cell’s internal resistance, r i . The reversible heat is proportional to the current. Since it is related to the electrochemical reactions’ entropy alterations, determinable by the derivative of the open circuit voltage U O C V with respect to the temperature T , it is contingent on the direction of the reactions [5]. Despite both shares of heat production depending on the state of charge (SOC), at charging and discharging rates around 1 C, they are of similar magnitude and, as such, pertinent to heat dissipation [8,9].
Outside the regular operation range in voltage and temperature, rapid battery degradation occurs, accompanied by accelerated aging [10]. The cycle stability of such abused and irreversibly damaged cells is not guaranteed anymore [11], and there is an increased risk of TR and cell fire. A TR’s cell fire results from a long and complex process chain, which commences with the intensification of parasitic side reactions at cell temperatures as low as 40 °C [12]. The deposition and oxidation of different species hinder the charge and mass transports inside the cell, and the polarization overvoltage and internal resistance rise, as does the temperature level because of an increased side reaction heat production. The runaway’s nature can be depicted well as a sequence of alternating causes and effects. Species degenerate, and a mixture of highly flammable gases is formed and then ignited from internal short circuits upon reaching the onset temperature. The remaining chemically bound energy is released quickly through more heat, and highly toxic substances are emitted while the cell burns out explosively [13,14]. If adjacent cells are exposed to severe heating, with a delay in time, they also undergo the process chain toward TR, referred to as TRP. In the experimental part of this study, battery cells are overcharged to induce TR, which is further explained in Section 2.1.
To comply with TR and cell fire safety regulations, numerous technical approaches have been integrated and tested in battery systems as safety mechanisms at cell, module, and pack levels in recent years, incorporating resistant cell materials [15], sensor-based hazard detection [16], or safety valves [17,18], and thermal barriers [19,20] to reduce criticality and hinder TRP and its impact. BTMS-related safety approaches aim towards a slowdown of the TR’s underlying process chain in its early stages by compensating for the temperature rise through intensive heat dissipation since it is subject to Arrhenius law [21]. As a general rule, a temperature rise of 10 K doubles the reaction rates. However, BTMS should regulate battery packs during normal operation conditions to maintain a temperature range of 15–35 °C while ensuring a high degree of uniformity with gradients below 5 K within each cell and between all cells in the pack [3,22]. On the downside, implementing a BTMS increases the battery pack’s complexity, weight, and volume. An enormous variety of BTMS options has been developed in the past. Figure 1 offers a potential classification of prevalent thermal management concepts, highlighting the type of system introduced in this article. Further classification can be conducted in terms of flow configuration (serial, parallel), exceptional media cooling (nano-fluids, heat pipes), or a unique location of heat dissipation, such as from the cell tabs [23]. The state-of-the-art applications of each category are discussed in detail in [1,24,25,26,27,28,29].
In general, battery cells can be cooled by air, liquids, or Phase Change Materials (PCMs). Air cooling shows poor heat dissipation rates because of its inherent thermophysical limitations. Nevertheless, these systems are simple, low-cost, and lightweight [26]. If high heat dissipation requirements have to be met, such as those experienced during fast charging, liquid cooling remains the preferred method, as recently affirmed by [25]. However, the need for leakage prevention increases the price and complexity [26]. PCM cooling uses the latent heat during the material’s melting and solidification. These systems can prevent TRP as PCM media serve as thermal buffers and insulators [30]. However, heat cannot be dissipated actively, so PCMs are mostly coupled with another method into hybrid approaches.
Cold plates are usually flat metal plates with internal fluid channels [2,29] that exhibit a significant cooling performance in combination with rectangular cells. The placement of the cold plates to the cell, either attached to its faces or sides, is of the essence for the quality of the heat dissipation in terms of cell temperature uniformity and, even more importantly, for enhancing the safety potential as a thermal barrier. In this experimental study, face cooling with cold plates is utilized; see Section 2.2 for more details. The method is paired with pouch cells, whose response to thermal conditioning is significant [24].
Integration of small ducts into cold plates is considered where space and weight limitations apply. Mini-channel cold plates of only 5 mm thickness are reported to be capable of demonstrator usage [31,32]. Even approaches with plates as thin as 2 mm, used on a laboratory scale, have been found [33] to cool individual cells up to 4 C. However, its sealing and applicability to battery modules remain unclear. The demonstrators mentioned above are composed of aluminum, an excellent thermal conductor, whose capability to avoid TRP as an intercellular application is weak. However, the implementation of insulation layers between large-capacity prismatic cells of at least 2 mm thickness and 0.1–0.2 W/(mK) thermal conductivity was reported to prevent TRP [34,35].
The concept of non-metallic, polymer mini-channel cold plates is introduced to combine the cold plates as a BTMS with a safety aspect. Channel geometries on a mini-scale can be conveniently machined, and sealing is reached with thermal bonding [36], which results in very thin structures containing internal fluid channels.
The combination of passive heat blockage and active heat dissipation into one component is deemed necessary to comply with forthcoming battery system safety regulations [27]. However, it is seldom mentioned in literature. In Table 1, the most relevant studies addressing this trade-off are outlined. As a further restriction, the studies’ applications exclusively utilized a polymer component or thin aluminum structures with mini-channels coupled with layers of thermally insulating materials.
The closest resemblance between this study’s application and literature comes from hybrid thermal management approaches, whose liquid cooling inlay serves heat dissipation, while the PCM matrix performs as a thermal buffer and insulator during abnormal heat generation but at a much higher weight and volume compared to the polymer mini-channel cold plates.
Consequently, to the authors’ best knowledge, this article represents the first experimental study utilizing a polymer mini-channel cold plate as a combined thermal management and safety system for batteries integrated into a single component. This study examines whether non-metallic cold plates are viable for the trade-off between dissipative heat removal from batteries during the early stages of TR while acting as a thermal barrier under critical circumstances in the later stages to prevent propagation to adjacent cells.
In the experiments, NMC pouch cells of 12.5 Ah are overcharged at 1 C while receiving thermal conditioning from the polymer mini-channel cold plates. The following questions regarding the application’s functionality will be investigated:
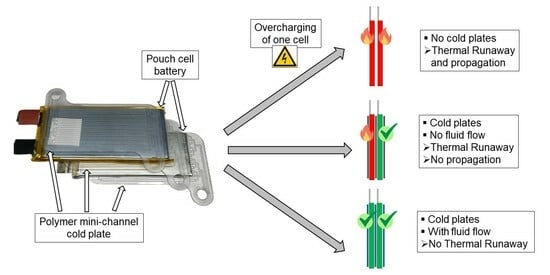
  • Is there a difference in battery cell behavior between thermally conditioned and non-conditioned cells when subjected to overcharge-induced TR up to the cell fire? Is there a significant temporal impact on the process chain recognizable, especially before the TR and cell fire?
  • Which heat dissipation rate is achievable using the polymer mini-channel cold plates?
  • If the TR and cell fire are reached, is there a detectable preventive influence of the polymer cold plates on TRP to the adjacent cells?

2. Theory

Safety testing for different battery abuse scenarios and battery level scales has been developed [43]. However, establishing standardized TR test procedures is challenging due to the large variety of cell formats and chemistries. The methods used must be field-relevant [44], and an essential distinction is made in terms of the thermal, mechanical, or electrical triggering of the TR. The organic electrolyte is flammable, and cells may be exposed to overtemperature due to a fire scenario. The potential for crush or penetration is crash-related, which may result in an internal short circuit occurring at the intrusion site. Excessive overcharging of lithium batteries is reported to be one of the most prevalent safety issues for large-scale applications [45]. An overcharged battery releases more heat and combustible gases during cell fire events than those triggered by overheating or penetration [46] because of an increased energy content [47]. The TR in this study’s experiments is overcharge-induced, posing a challenging scenario for the combined thermal management and safety system.

2.1. Overcharge-Induced Thermal Runaway

In the overcharging process of a battery cell, five distinct stages occur before TR and the cell fire, which is widely applicable to cells of varying capacities across different cell chemistries [13,14,48,49]. Regarding NMC chemistries, charging leads to oxidation at the NMC cathode, lithium-ion charge transfer, as well as intercalation and lithium reduction at the graphite anode; see the reactions in Equations (2) and (3).
Cathode :   L i a N i x M n y C o z O 2 L i a k N i x M n y C o z O 2 + k L i + + k e   with   k < 1
Anode :   n C + k L i + + k e L i k C n   with   n 6
During the first stage of overcharging, the regular charging process continues beyond the upper cutoff voltage because not all available spots in the anode active material are occupied by lithium-ions at 100 % SOC. Stage I comprises the most substantial time until the TR but is strongly connected to cell chemistry. Nickel-rich cathodes, responsible for increased capacities, exhibit a decreasing thermal stability [50]. The external appearance of the cell remains unchanged during stage I, but there is a gradual increase in surface temperatures and voltage. This relatively stable stage ends, and lithium plating occurs if any successive steps involved in the lithium transport and intercalation become sluggish. Initially, diffusion of solvated lithium-ions in the electrolyte takes place, followed by the charge transfer at the electrode/electrolyte interface, and finally, lithium diffusion into the solid electrode material [51].
In stage II, the cell begins to expand, and significant voltage and surface temperature increases are noticeable. Metallic lithium deposits at the anode as mosses or dendrites [52,53]. The SOC, from which this overcharging phenomenon occurs, is a vital function of anode oversizing in terms of capacity and size compared to the cathode, making it cell-specific [54,55]. Experiments are documented, which show no lithium plating up to 120% SOC [56]. With nearly complete lithiation of the graphite anode, there is an increase in the concentration of lithium-ions at the anode/electrolyte interface because, per time step, fewer ions can deposit and intercalate compared to the number moved to the anode [57,58,59]. The widely accepted criteria conception for lithium plating occurrence necessitates a lithium-ion concentration that exceeds the saturation at the interface and an interface potential equally or below that of Li/Li+ at 0 V [60,61]. The negative potential shift raises the cell voltage [62]. Electrolytes become unstable at excessively high voltage levels in contact with lithium metal. Spontaneous reactions lead to species consumption [63] and the formation of additional passivation layers at the electrode interface [51,58], similar to the primary Solid Electrolyte Interface (SEI) film formed during the first battery cycle [64,65]. With elevated temperatures, the SEI grows more porous and subsequently less stable and performing [4]. Consequently, the charge and mass transports inside the cell are hindered, coupled with an increase in the polarization overvoltage and the cell’s internal resistance, making lithium plating a self-accelerating process [66,67]. Additionally, electrolyte decomposition at high voltages of 4.9–5 V leads to gas generation and cell swelling [68,69,70], and its consumption decreases the ionic conductivity, causing a further increase in overpotentials, which results in an additional heat generation and significant temperature rise. In stage I and early stage II, Joule and reaction heating contributed the most to the overall heat production. However, as the temperature and voltage levels increase, parasitic side reactions intensify, introducing more side reaction heat into the system and marking the transition to the later stages of overcharging [71,72]. Stages III and IV are characterized by species decomposition, cell deformation due to substantial swelling, and further increases in surface temperature.
The transition to stage III is characterized by a brief voltage plateau, ascribed to a disproportionation reaction and intensive species conversion, as referred to in [73,74]. Electrode surfaces show significant defects like pits and cracks, leading to a substantially non-uniform lithium deposition beneath the SEI layer [75,76,77]. The resultant mechanical stress causes dendrites to break through the SEI layer, leading to its partial destruction [78]. Destruction and healing processes of the SEI take place simultaneously, supporting the voltage stagnation. As the internal cell temperature surpasses a critical threshold of approximately 60 °C, the thermal electrolyte decomposition is further promoted [79], and a mixture of highly flammable gases is formed [69]. The cell expansion increases the electrode spacing, leading to higher internal resistance, overpotentials, and additional heating [14,48]. Following the voltage plateau, the voltage elevates to a local maximum or crest value.
At the transition to stage IV, the voltage decreases due to various phenomena. For example, excessive delithiation of the cathode led to an irreversible structural change and a collapse of the crystal [80,81]. The cell envelopes or casings reach the tensile limit of the seam because of the internal pressure build-up. They open up and release warm gas during the first venting [16,49]. The core temperature of the cell reaches a point at which the SEI decomposes, and dendrite growth from the deposition of solid materials on the electrodes’ surface leads to separator penetration and the emergence of micro short circuits [81]. These result in local hot spots because of high current densities and corresponding Joule heating. The cell voltage increases to a global maximum due to a rising ohmic resistance and then sharply drops to zero as the separator melting and shrinkage leads to an immense short circuit.
Finally, at the beginning of stage V of overcharging, the onset temperature for cell fire is reached. In this context, we define it as a detectable steep surge in surface temperature, the start of the second venting, and rapid thermal runaway. Sparks at the short circuit ignite the highly flammable gas mixture, and the cell undergoes TR while burning out explosively [82,83,84]. During this fifth stage, there is a short peak in Joule heating, followed by a dominant heat release due to the release of chemically bound energy [48].

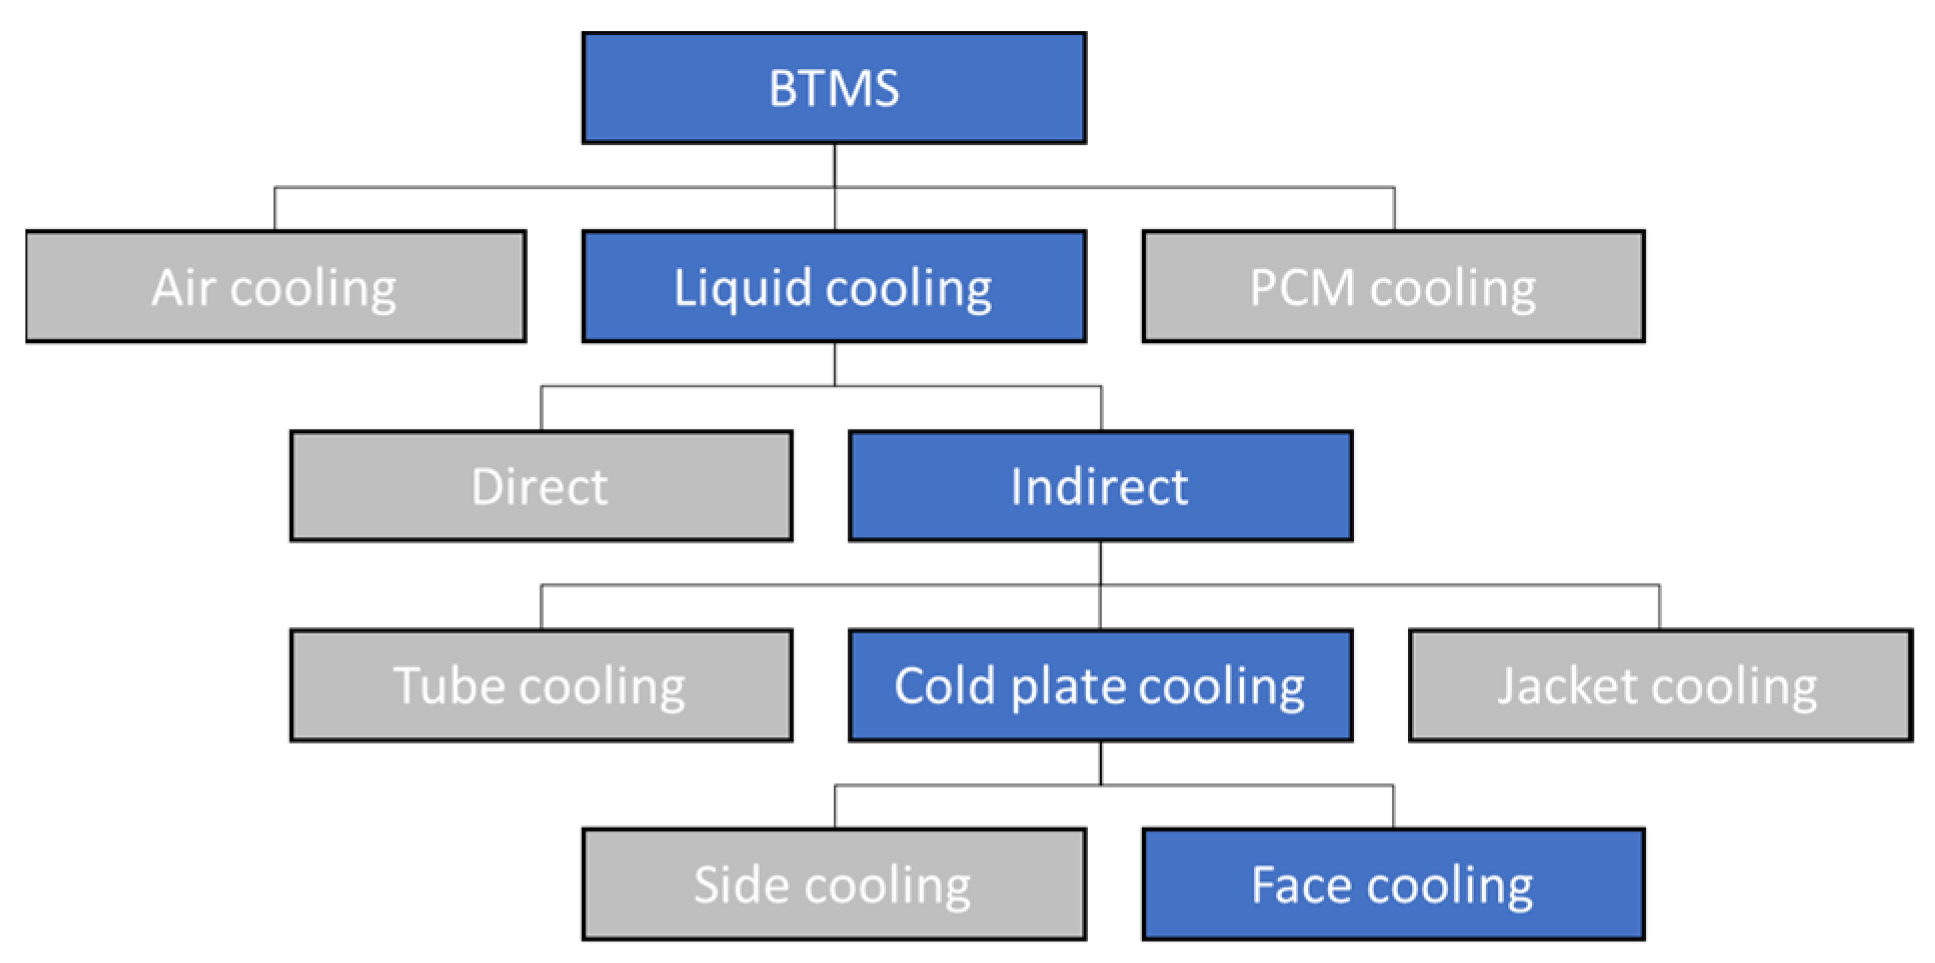
2.2. Cold Plate Thermal Management

Designing a performant thermal conditioning system must consider the cell’s internal structure; see Figure A1 in the Appendix A.2. The pouch contains a stack of numerous thin layers, which in the smallest repeatable structure, the unit cell, comprises the cathode and anode current collectors with electrodes’ coatings and the separator. The porous layers are filled with electrolytes. All other components except the metallic current collectors show inferior thermal conductivity [85]. When it comes to heat dissipation out of the battery volume, acc. to Equation (4), the effective thermal conductivity k e f f of the materials being involved in the transport process and hence the path available l for heat transfer is pivotal [86]. Nevertheless, the available heat transfer surface A also plays a crucial role.
Q ˙ = k e f f l A ( T 2 T 1 )
The heterogeneous cell stack exhibits a greatly anisotropic thermophysical behavior [85]. The effective thermal conductivity for the direction perpendicular to the stacking direction has to be described as a series connection of thermal resistances. In contrast, the direction parallel to the stack is a parallel connection; see Equations (A1) and (A2) in the Appendix A.1. Consequently, battery cells show significantly higher thermal bulk conductivities in-plane than perpendicular to the stacked layers, typically differing by more than one order of magnitude; see Section 3.1. However, these are still relatively poor and one magnitude short compared to the metallic materials commonly used for heat sinks (Al ~240 W/(mK) and Cu ~400 W/(mK)). In this context, it is concluded that heat dissipation from lithium-ion batteries is not an issue of high heat flux, as seen in microelectronic devices. However, it is influenced by low effective conductivities and high heat flow rates [3]. Heat dissipation from the center of a battery presents a greater difficulty than from the outer layers near the surface. The close arrangement of cells in battery packs, the trend towards large formative cells of high thickness, and fast charging, in general, aggravate the challenge of thermal conditioning [4].
If manufacturers of mobile applications use cold plate thermal management, they typically opt for side cooling, particularly from the bottom. These approaches show easy technical feasibility and are cost-effective, feature a solid safety aspect with the cooling fluid staying outside the high-voltage compartment, and exploit the cells’ higher in-plane thermal bulk conductivity. A notable instance is the VW ID.3, whose battery modules are situated atop an aluminum cooling plate with internal macro fluid channels [87]. Furthermore, although marginally more complex and costly, face cooling through cold plates is similarly industrialized. In the high-voltage battery of the Chevrolet Volt, slender fin-like aluminum cold plates hosting multiple mini-channels are placed between the cells [88,89].
To realize a combined thermal management and safety system embodied by a single component of the polymer mini-channel cold plates, these must be positioned between the cells and not at their sides. Only under this condition can the polymer plates fulfill their purpose of a thermal barrier to prevent TRP. Furthermore, trend-setting studies of several research groups have shown far-reaching advantages of a thermal management concept with cold plates applied to the batteries’ faces over side-cooling approaches in terms of quantity and quality of heat dissipation. During the cycling of large-format batteries [32,90] and commercially available electric vehicle battery packs [91] of up to 3 C, face cooling resulted in a lower mean cell temperature and a significantly smaller temperature gradient across the cells’ central section than bottom cooling. The outcome was attributed to a much larger heat transfer interface of the face cooling system with the batteries and the cell’s poor thermal conductivity, which comes into calculation if the complete heat has to be transported internally toward the bottom cold plate, where it is dissipated through a small area. Other advantageous aspects of face cooling concern a short reaction time of the battery system temperatures [92] and more homogeneous aging at the electrode level [93,94].
The term cold plate is widely used but can be misleading, as the thermal management of battery cells is not exclusively about cooling but thermal conditioning. Consequently, the investigated polymer structure is also referred to as a mini-channel heat sink or heat source (MCHS).

3. Materials and Methods
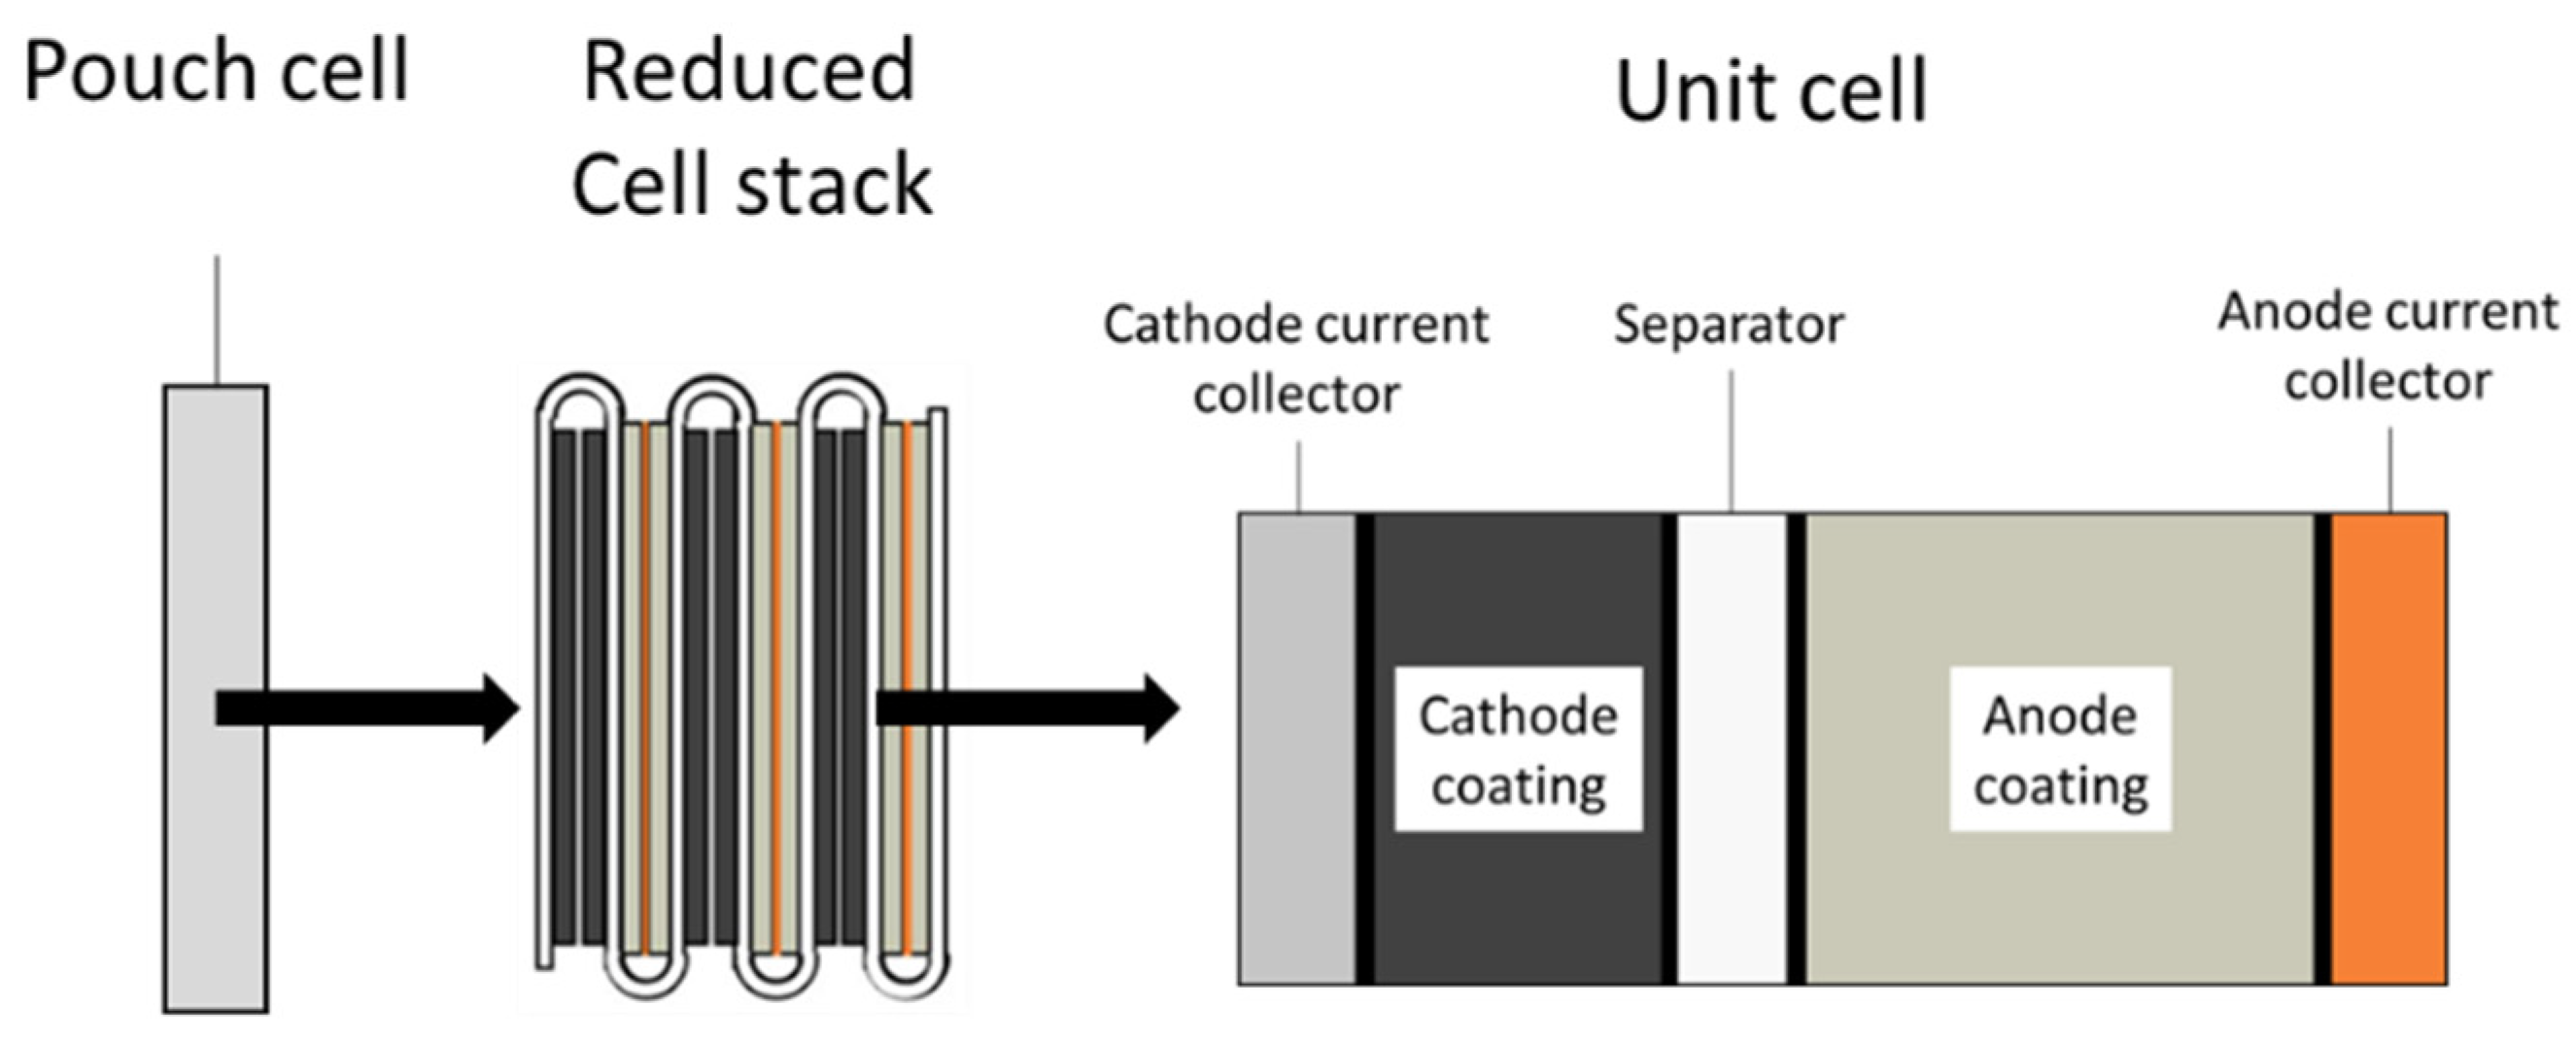
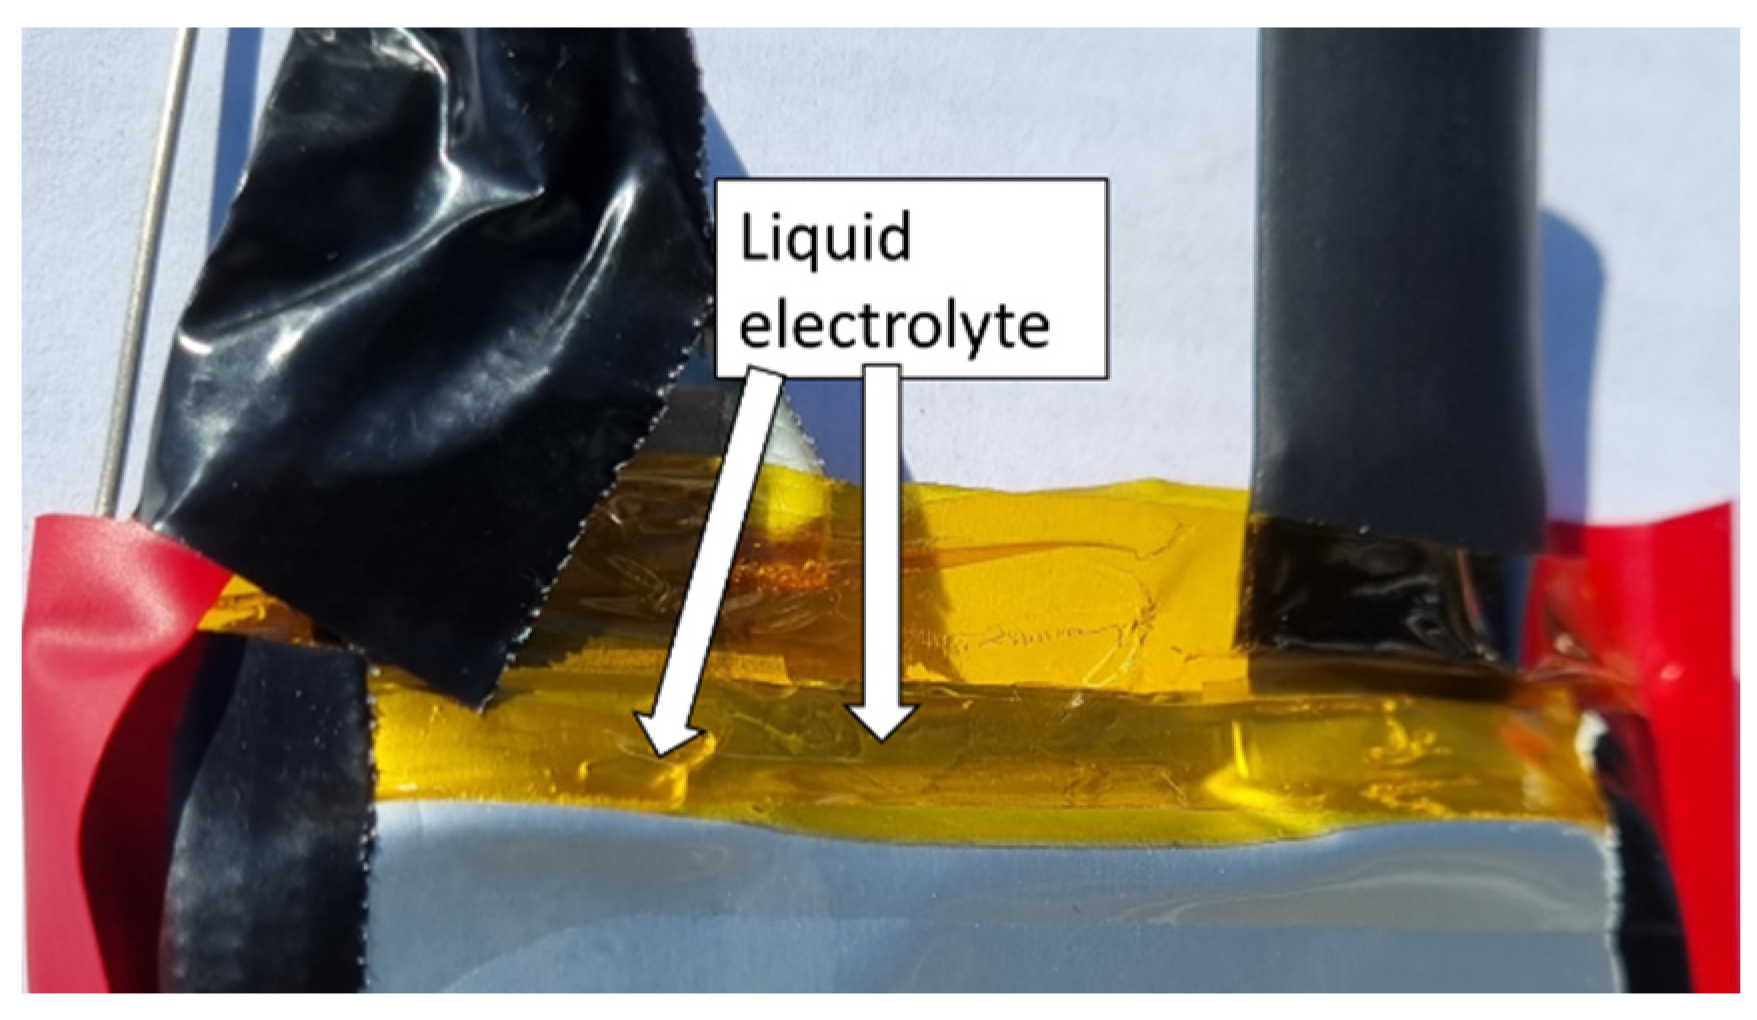
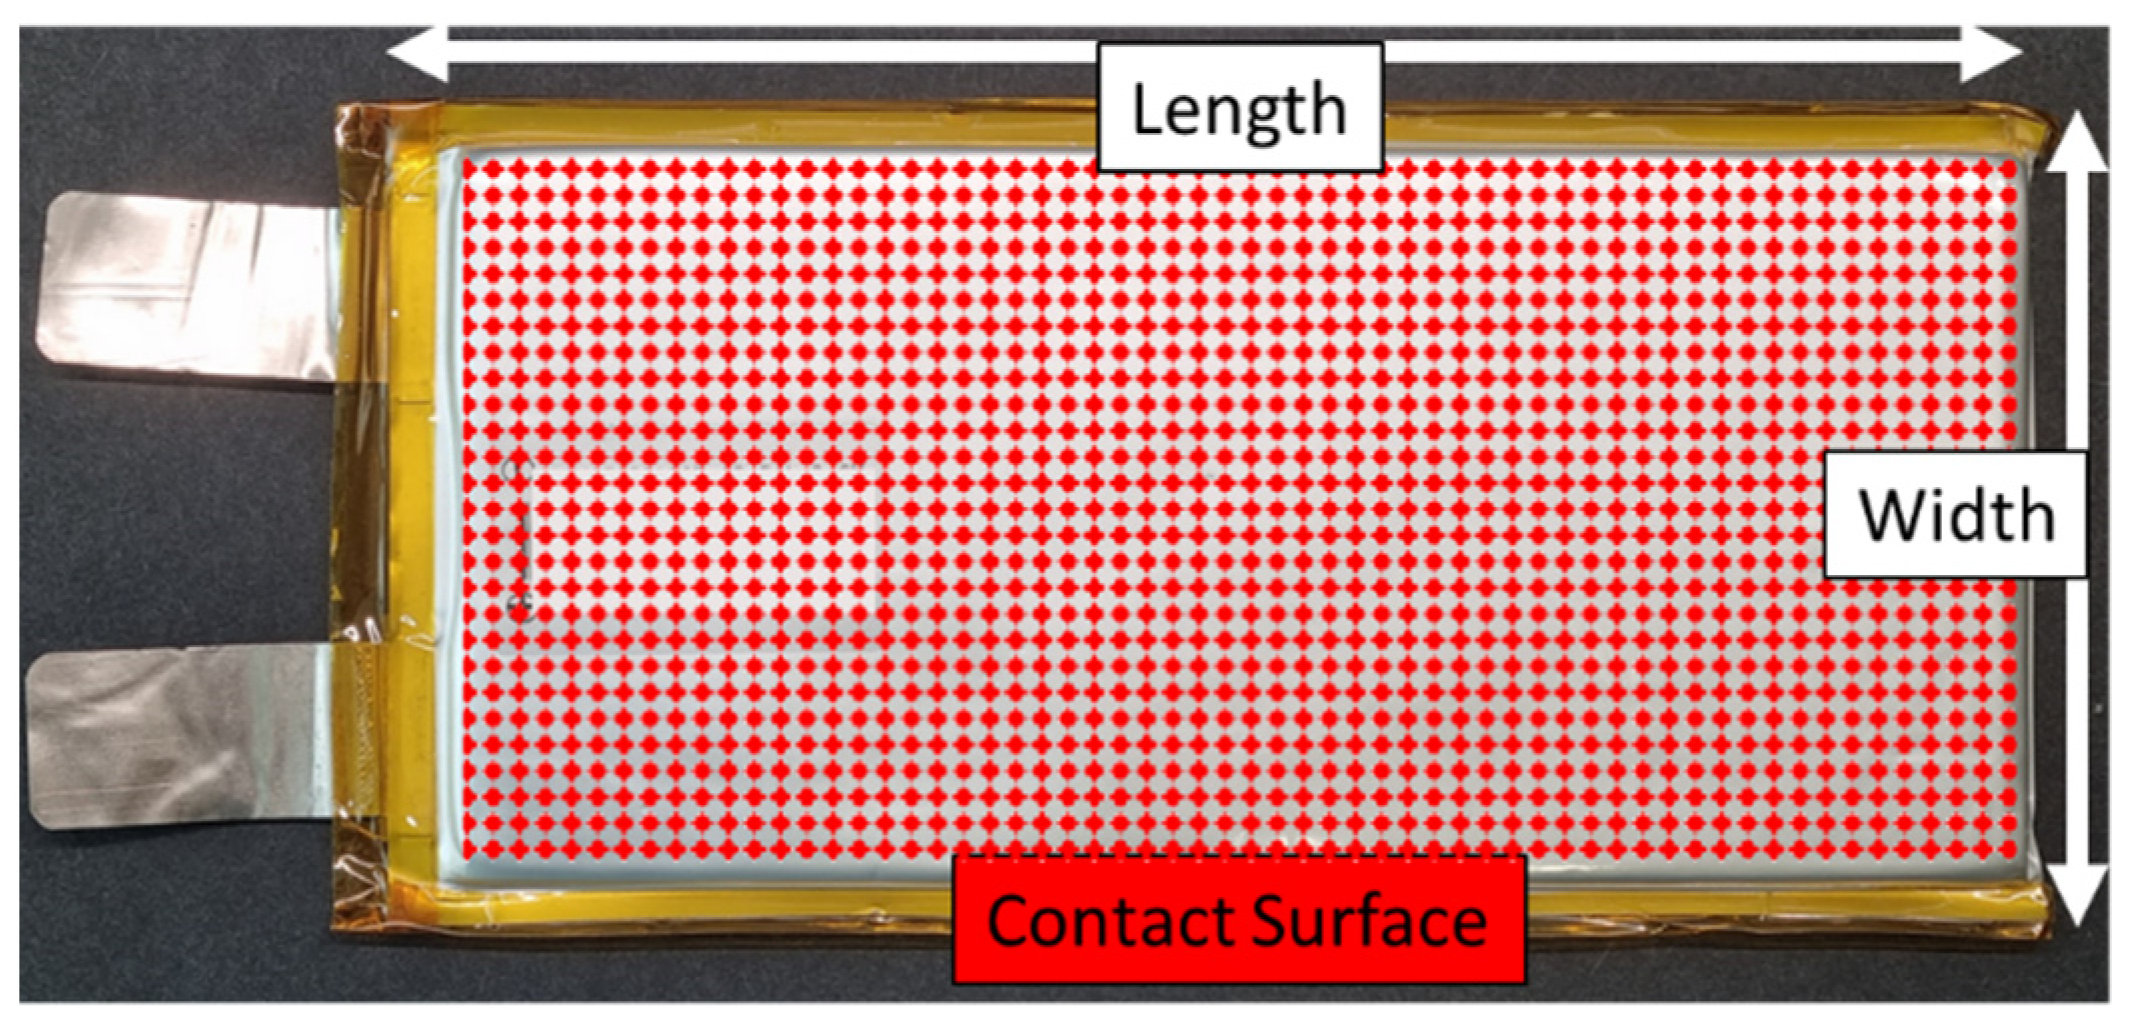
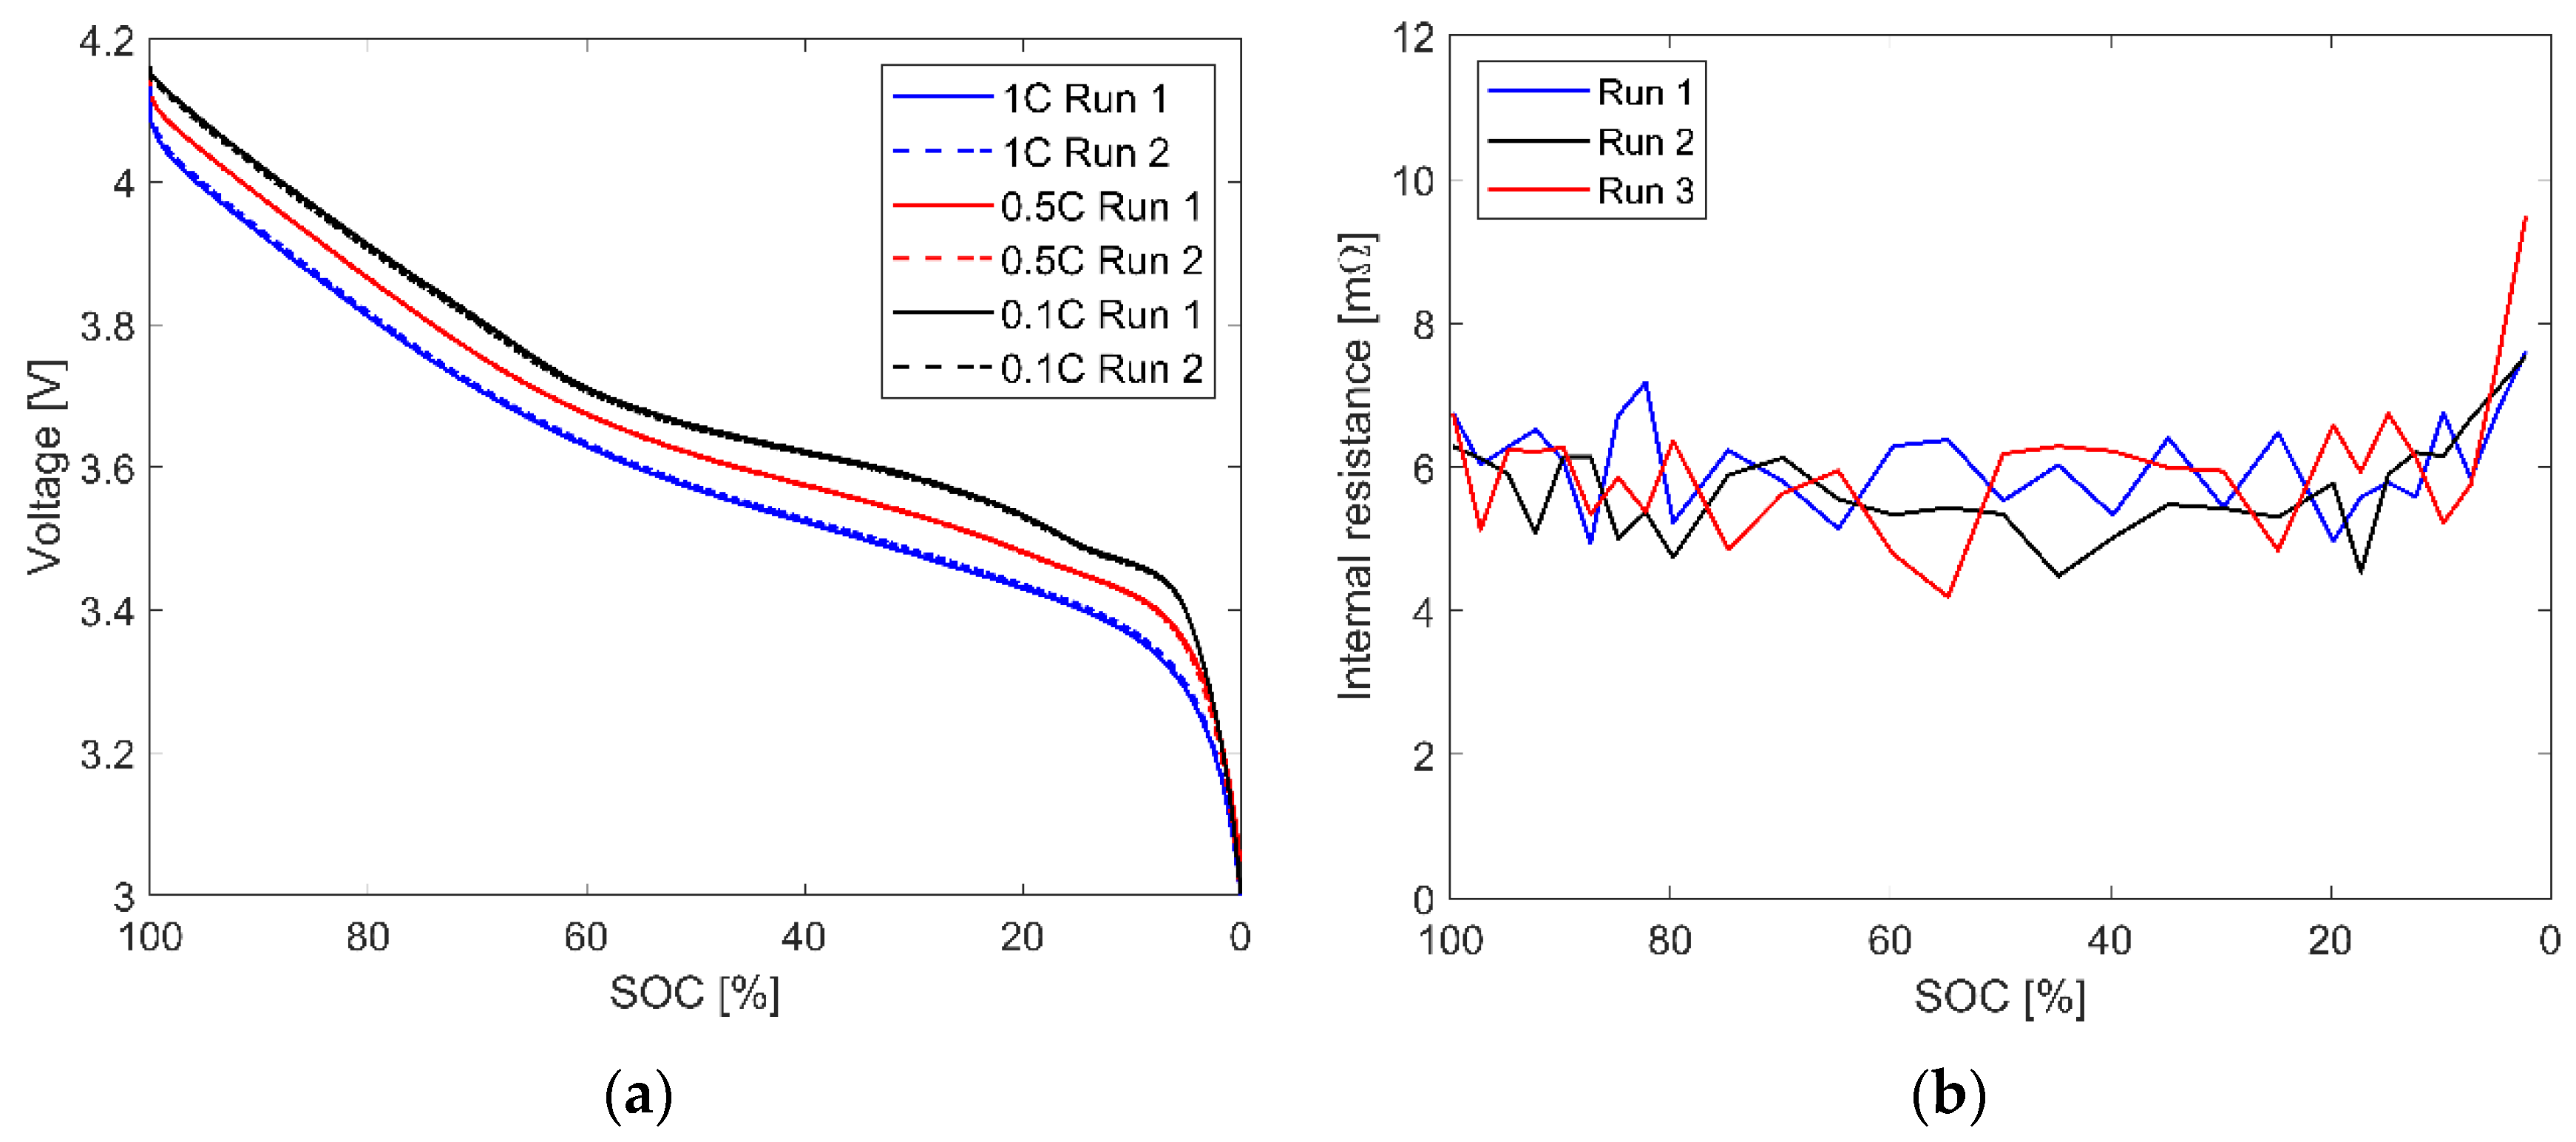
This chapter contains information about the battery cells and polymer mini-channel cold plates used in the overcharging experiments. Additionally, the experimental design, including the setup, procedure, and measurement plan performed, is explained.

3.1. Battery Cell

Batteries manufactured by CTS Technology Co. (Hunan, China) were used; see Figure 2. This pouch cell of 12.5 Ah capacity has an NMC cathode, while the anode is graphite-based. The manufacturer-provided information and properties are shown in Table 2. The cell does not contain a safety vent at the sealing. The pouch cells are thin and have the highest surface-to-volume ratio of any commercially available cell type [24], which makes them an attractive fit for face cooling. The cell components are not surrounded by a hard casing but a resistive composite aluminum envelope. Therefore, the cells require a mechanical pre-stress under load. The pouch is slightly larger than the effective contact surface (84 mm × 182 mm), which is in contact with the adjacent cell or the cold plates in the assembled stack; see Section 3.3.1.
The cells’ performance was pre-tested for quality control [95], and they were approved for experimental use if the results matched the manufacturer’s datasheet. A Delta Elektronika SM 15–200 D power supply and a Höcherl & Hackl PLI6406 electrical load were used for cycling. The cell capacity was determined by charge counting; see Equation (5).
q e l = 0 t I t d t
The cells were fully CCCV-charged to 4.2 V at 1 C, then cycled and measured during a full 1 C CC-discharge to 3 V at a room temperature of 25 ± 2 °C. The resulting capacities were measured between 12.6 and 12.8 Ah, with no cell showing significant deviations. Additionally, a randomized sample set of cells was characterized with respect to their internal resistance, according to the IEC 62620 standard [96], and their voltage response to CC-discharging at rates of 1 C, 0.5 C, and 0.1 C. As can be taken from Equation (6), the internal resistance is determined as the direct current resistance r D C with currents of I 2 = 0.5 C and I 1 = 0.2 C.
r D C   = V 2 V 1 I 2 I 1  
Instead, the manufacturer-provided data refers to an Electrochemical Impedance Spectroscopy (EIS) at 1 kHz and 50% SOC and amounts to 3.5 m Ω . However, multiple research groups have shown that this value tends to underestimate internal resistance [97,98]. For a representative cell, in Figure 3a,b, the voltage response and the internal resistance according to DIN EN 62620 can be found. As expected, the voltage response decreases with higher discharge rates. The measured resistance values are between 5 and 7 m Ω , which is up to twice as high as the manufacturer’s specification for the abovementioned reason. Below 15% SOC, the resistance increases up to 10 m Ω . All of the tested cells showed this behavior with no significant deviations.
Transient Plane Source (TPS) method measurements of the effective thermal bulk conductivity were made for cell characterization. Using a 4922 Mica-insulated sensor and 20 averaged single shots at a power of 1 W and a time of 10 s, values of k e f f , = 0.72 ± 0.02 W/(m K) perpendicularly k e f f , = 30.3 ± 0.5 W/(m K) in-plane were obtained.

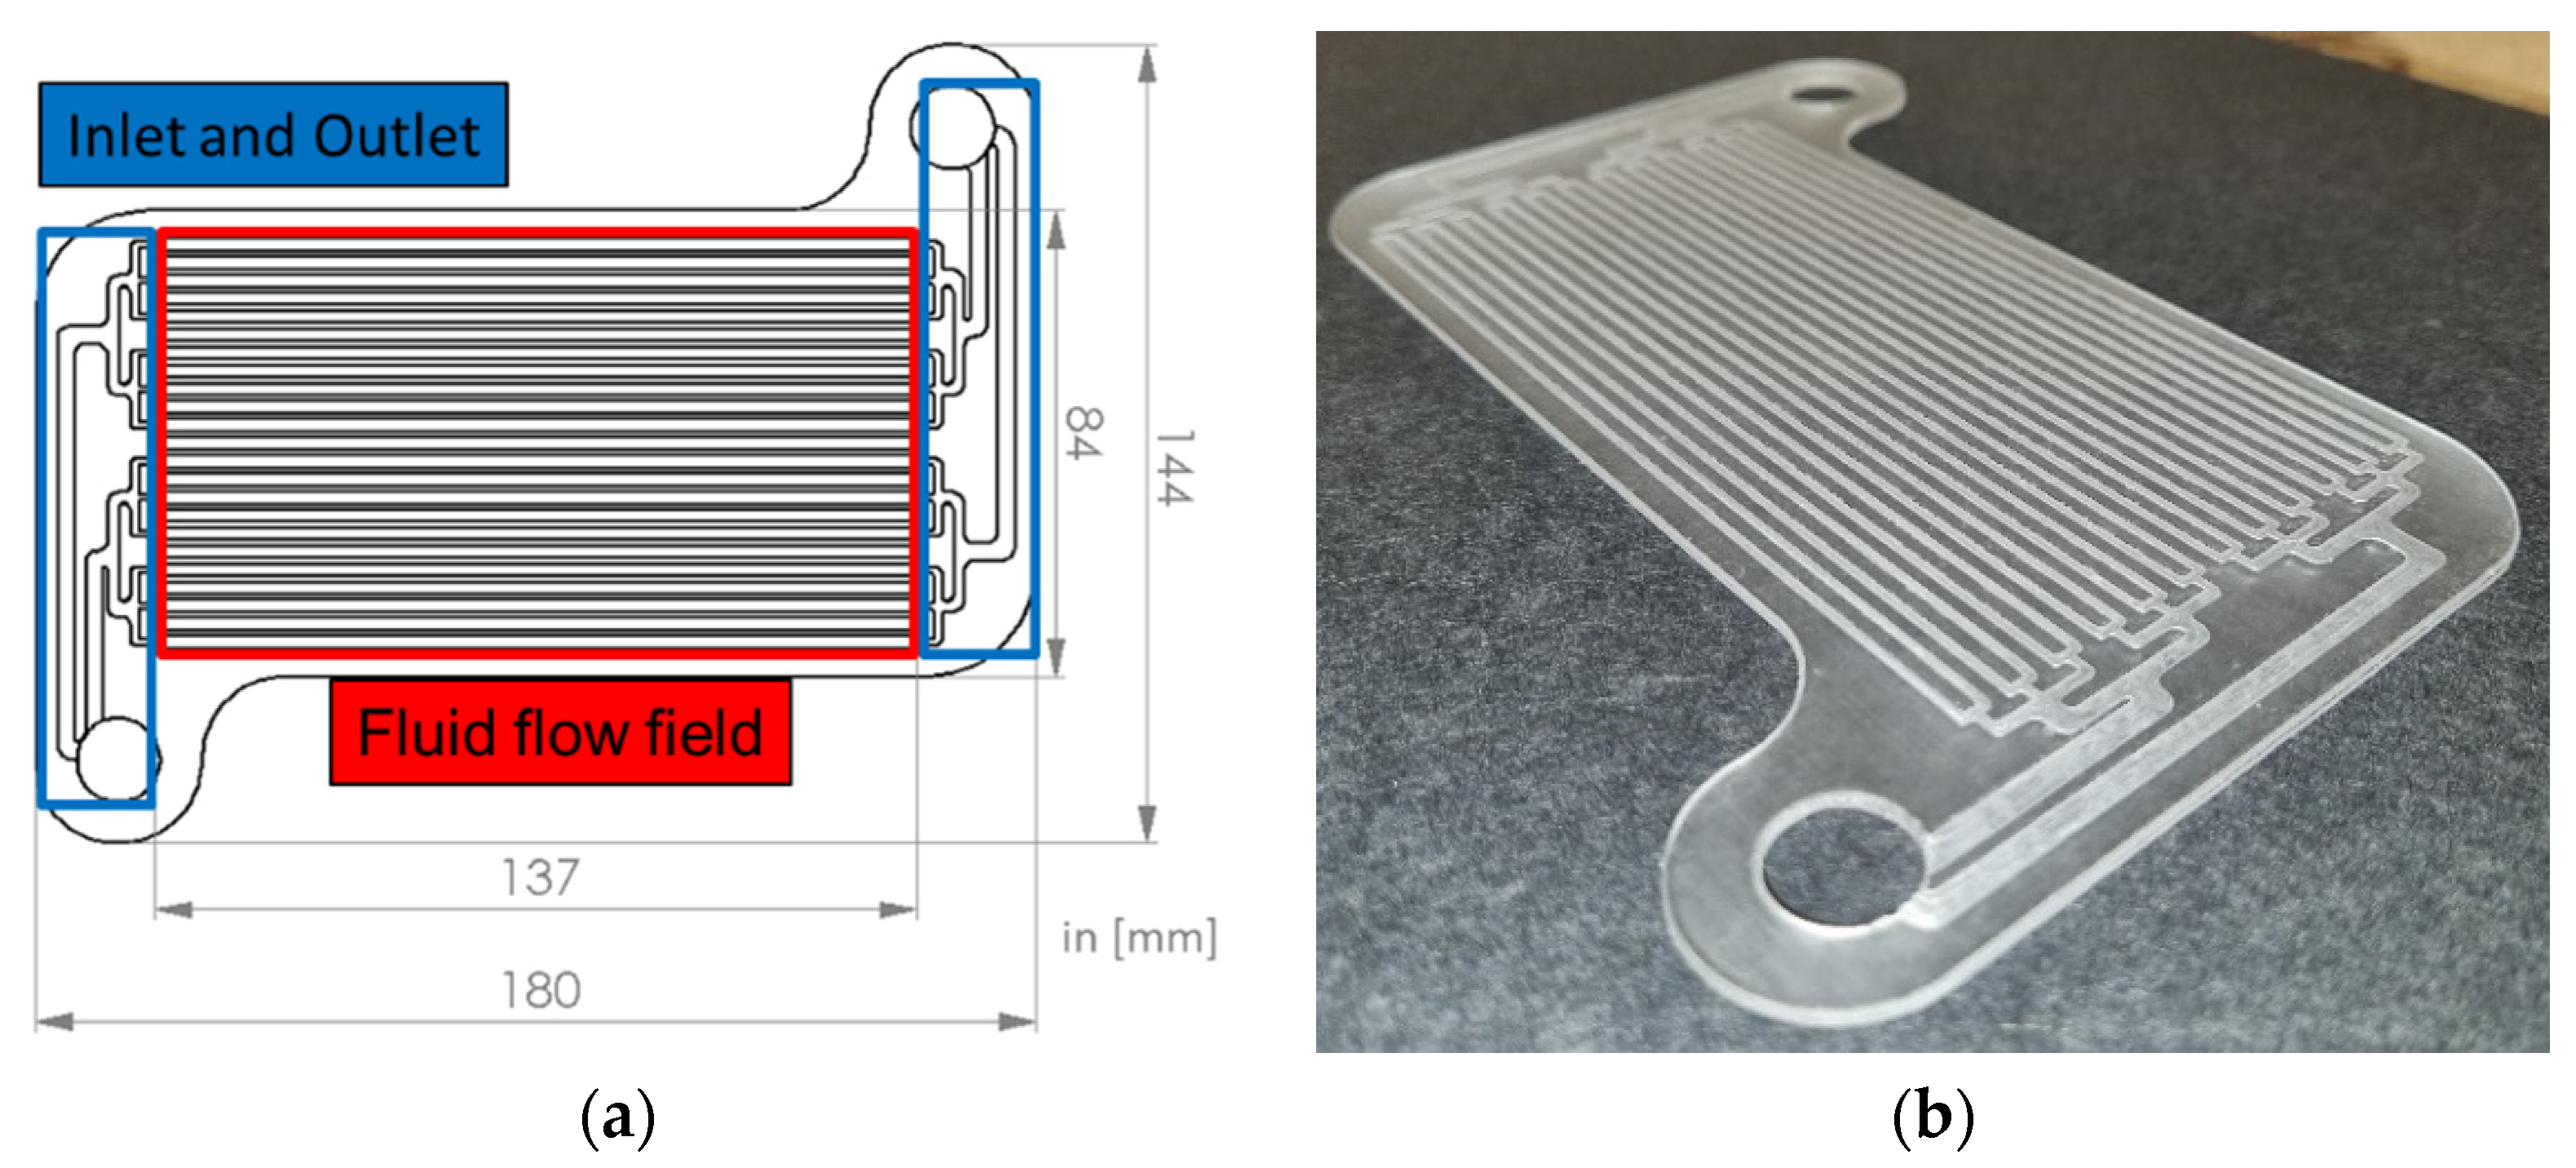
3.2. Polymer Mini-Channel Cold Plates

In recent years, non-metallic mini-channel cold plates, or MCHSs, have been developed at the OVGU Magdeburg. They consist of robust polymer materials to promote lightweight construction and own an internal channel system sealed tightly for leakage-free fluid transport. They are manufactured by micro-milling and thermal bonding at the glass transition temperature [36]. To prevent the fine channels from clogging, adhesives of any kind are averted. The channel geometry is adaptable to the applications’ needs. Aluminum adapters with circumferential holes were used for the connection to the macroscopic fluid supply system. Figure 4a,b show the demonstrator used in the experiments.
The mini-channel cold plates are made of standard polycarbonate (Makrolon®), an amorphous thermoplastic polymer. It has a high fatigue strength that does not lead to material flow and deformation of the mini-channels during pre-stressing of the pouch cells. According to the manufacturer, the material has a thermal conductivity of 0.2 W/(mK), a heat capacity of 1170 J/(kg K), a density of 1200 kg/m3, and the glass transition temperature is reached at about 148 °C.
The cooling channel geometry is divided into two sections; see Figure 4a. The inlet and outlet are designed to distribute and collect the fluid evenly to and from each channel. The fluid flow field dissipates heat from the cells’ faces. The dissipated heat rate can be calculated from the fluid mass flow rate m ˙ , the fluid heat capacity c , and the fluid temperature difference between the inlet and outlet; see Equation (7). Deionized water was used as the fluid in the experiments.
Q ˙ = m ˙ c ( T F l u i d , o u t T F l u i d , i n )
Regarding the flow field geometry, a multi-channel system results in a more uniform temperature field during thermal conditioning than a single channel, while an increased channel width and height reduce the pressure drop and may result in a lower maximum temperature [29]. At the cost of a slightly higher pressure drop, the inlet and outlet were designed as a bifurcation, leading to better flow uniformity and a more homogeneous heat transfer than a consecutive manifold [99,100], borrowed from fuel cell technology [101]. The width and height of the flow field channels are 1 and 0.5 mm, respectively. The hydraulic diameter of 667 µm classifies the geometry as a mini-channel system according to [102]. The walls between the channels are 2.25 mm wide. The flow field contains 24 channels with a length of 137 mm.
With a total thickness of 2 mm and a relatively low thermal conductivity of the polycarbonate, the manufactured mini-channel cold plates match the properties of the aforementioned insulation material layers tested in [34,35], which prevented TRP.

3.3. Experimental Design

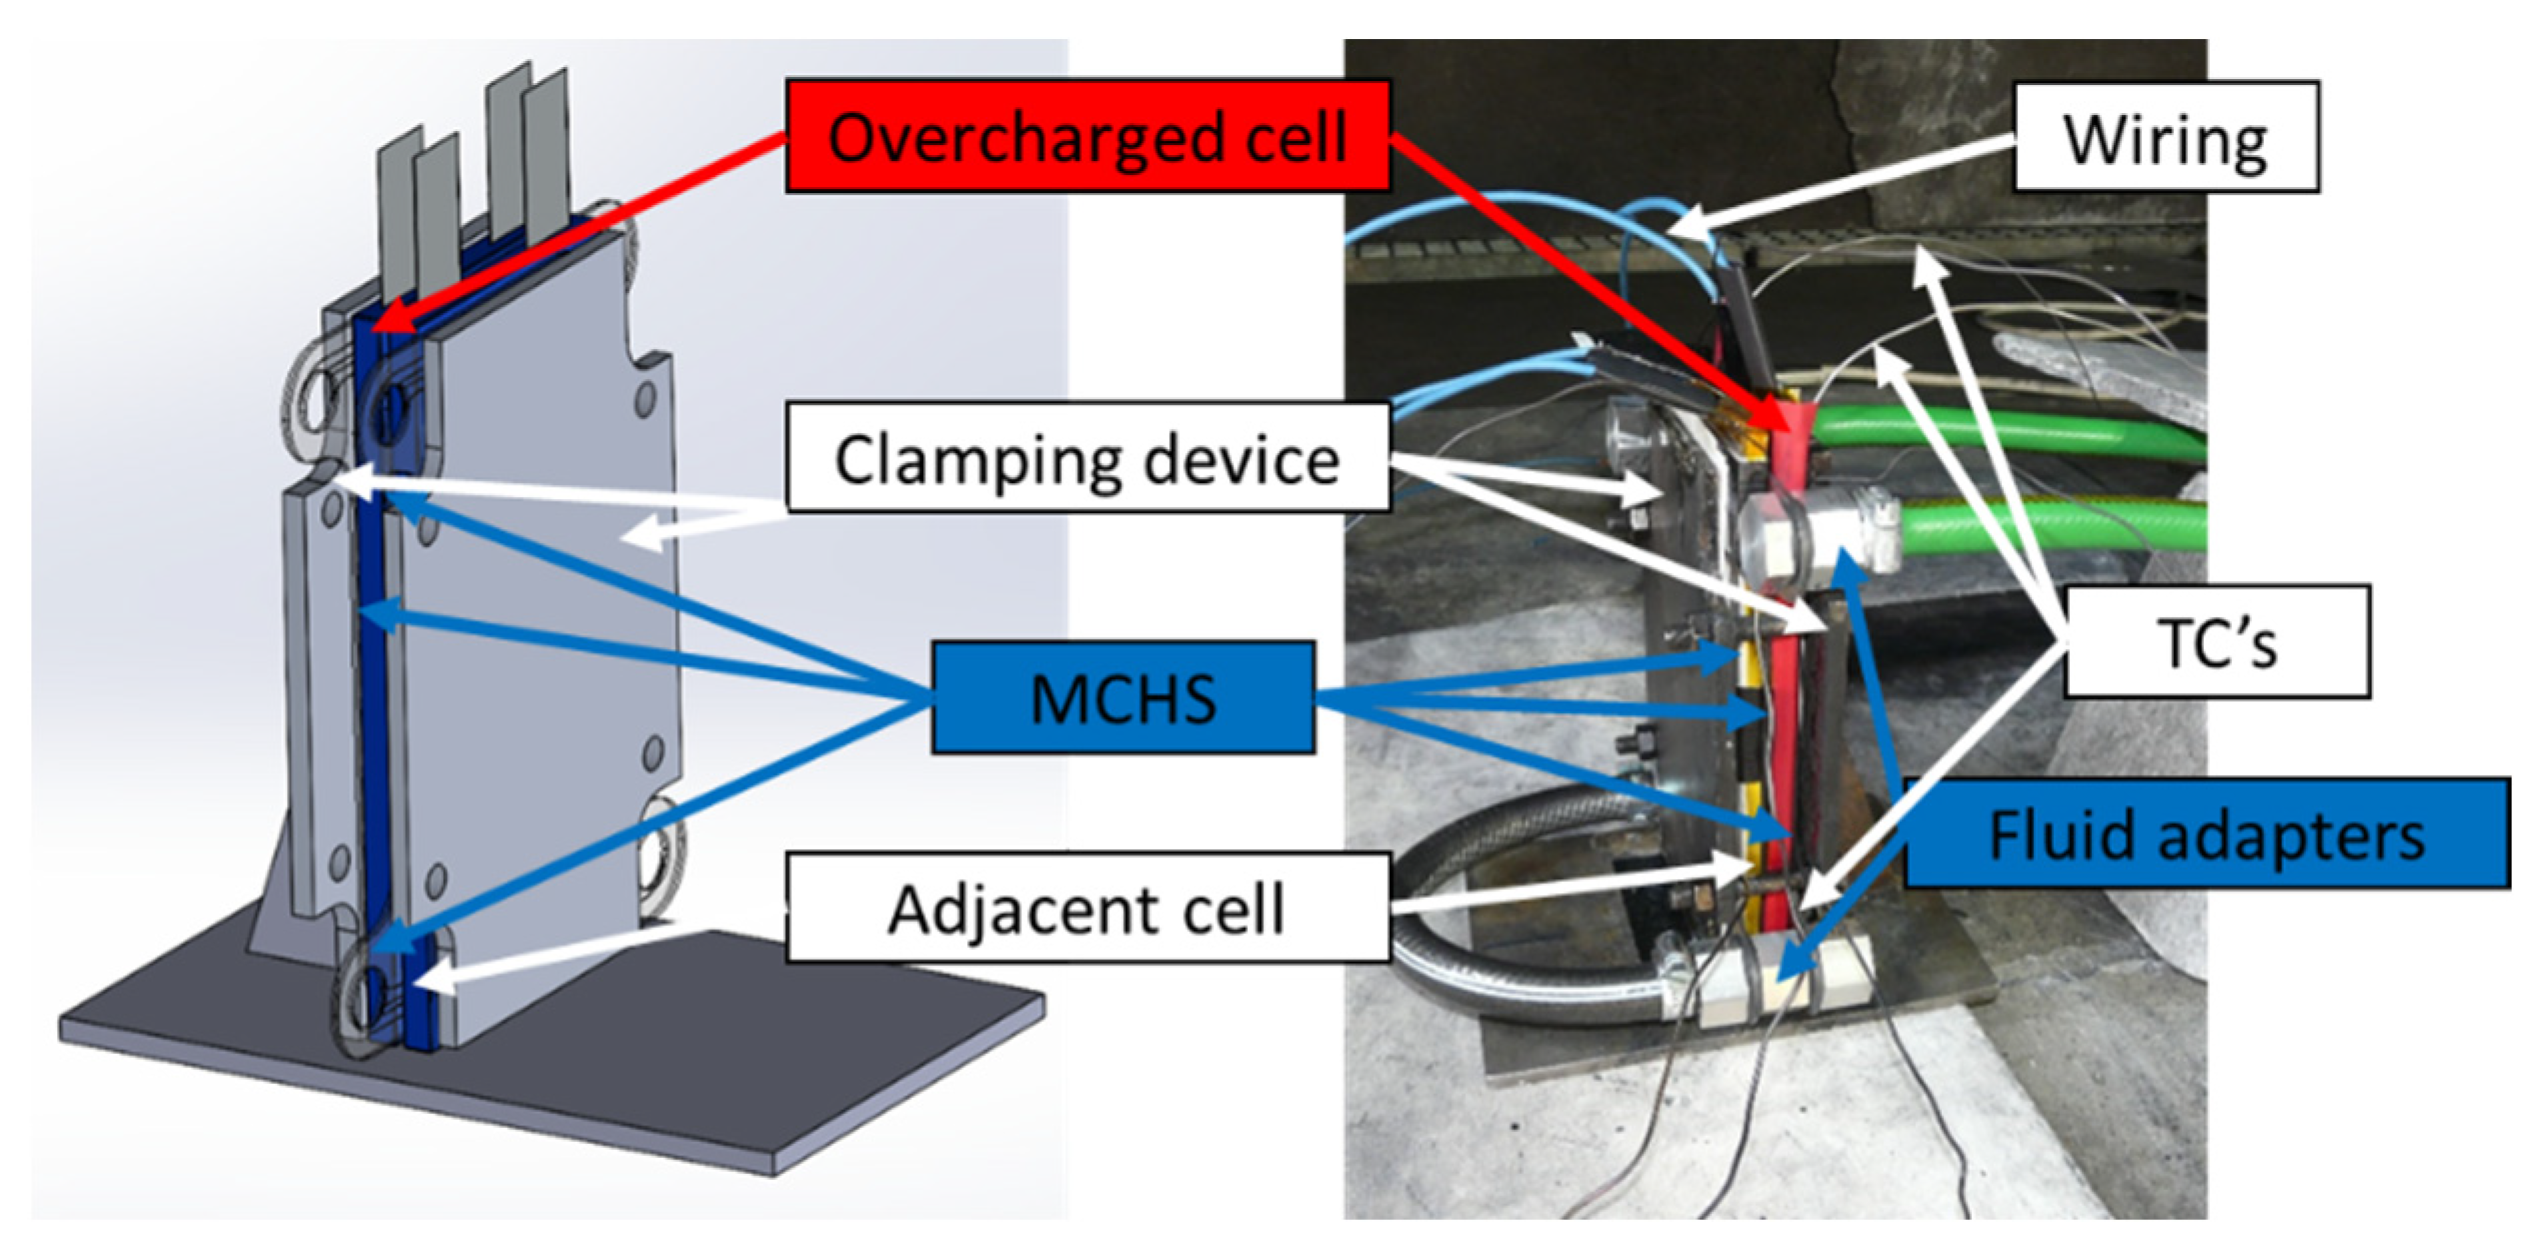
3.3.1. Structure of the Battery Assembly

The batteries and the mini-channel cold plates were placed into a steel clamping device during overcharging; see Figure 5. The setup contains two fully charged pouch cells, tabs to the top, three cold plates in the case of thermal conditioning, and multiple sheath thermocouples (TCs). The cell to be overcharged is consecutively designated as the “OC cell” and its neighbor as “cell 2”. Insulation layers reduce the heat transfer from the cell and cold plate stack into the clamping device [103].
Pre-stress applied by the clamping device’s bolting serves proper operation during the experiment. Firstly, the swelling behavior of the pouch cell is homogenized, which prevents early non-reproducible short circuit failures, and secondly, thermal contact resistances between batteries and cold plates are reduced. Industrial manufacturers typically use Thermal Interface Materials (TIMs) in the form of conductive pastes and adhesives for contact resistance reduction. A previous paper showed that TIMs usually embody one of the largest thermal resistances in a cooling system [104]. Furthermore, they complicate the recycling of battery systems. Therefore, with large heat transfer areas and moderate heat flux in battery modules [3,26], the TIMs are entirely dispensed with.
In Figure 6a,b, the cell and cold plate assembly is presented in detail. Three MCHSs are placed next to the cells in the thermally conditioned setup. To achieve a homogeneous conditioning performance, the mini-channel plates were connected in parallel to the fluid supply, and the fluid ran in countercurrent through adjacent plates [26,29].
Eight calibrated type-K sheath TCs (1 mm) were installed to observe the temperature changes in the assembly during the overcharging procedure, the TR, and its propagation; cf. Figure 6a,b. In the setup without thermal conditioning, they are located in the upper and lower thirds of the battery faces and laterally in the fold of the aluminum envelope of the overcharged cell. In contrast, good contact between the batteries and the MCHSs is required in the conditioned setup. Consequently, the TCs are located in the upper- and lower thirds between the outer cold plates and the thermal insulation (not displayed) and laterally in the aluminum folds of both batteries. During the measurement campaign, no significant differences were found between the respective TCs at the assembly’s head and foot. For clarity, the averaged corresponding temperatures are presented in the results in Section 4. A pre-test for evaluation of the TC positioning showed good agreement between the temperatures measured laterally at the sides of the OC cell and its face between both cells before TR; cf. Figure A2 in the Appendix A.2. During the cell fire, the TCs between both cells show the highest temperatures. Nevertheless, the laterally captured values reasonably indicate the OC cell’s surface temperature, which is consequently assumed for the thermally conditioned experiments.

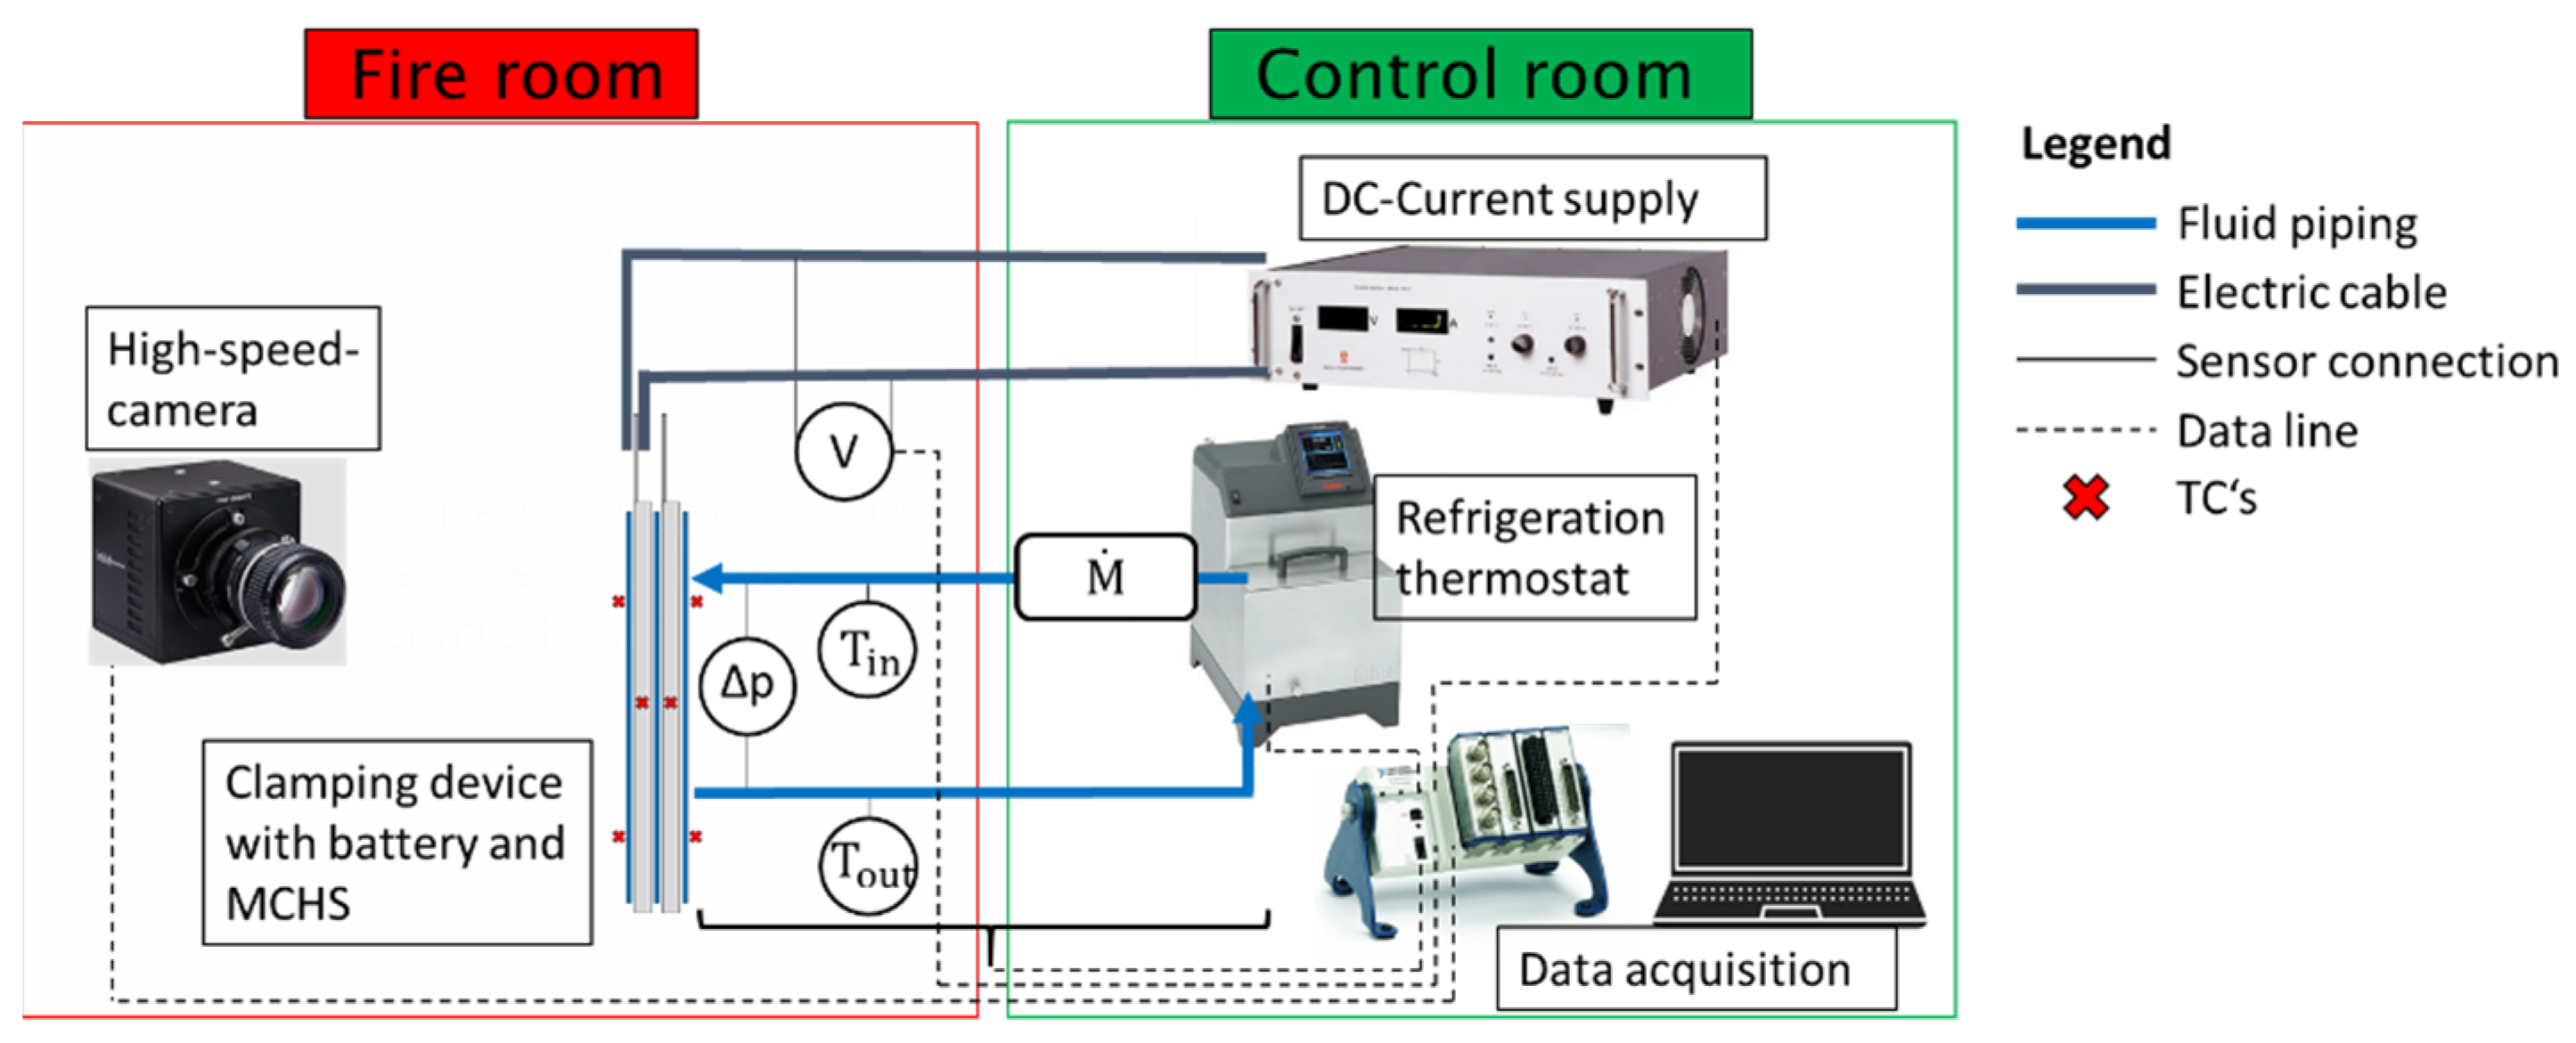
3.3.2. Experimental Setup and Procedure

The experimental setup must be split for reasons of protection and is partially located inside the fire and the control rooms; see Figure 7. The fire room is equipped with an exhaust gas purification system, and its robustness allows experiments up to EUCAR hazard level 7—the highest classification—and includes the explosion and complete disintegration of a battery cell. External monitoring from the control room becomes necessary. The clamping device, including batteries, cold plates, and distributed TCs, is installed in the fire room. A high-speed color camera allows for the visual detection of venting and cell fire events. The battery is charged by a DC power supply, and the voltage is measured at its tabs. A refrigeration thermostat supplies the system with tempered deionized water. The fluid’s mass flow and temperature at the inlet and outlet of the cold plate assembly are measured. A difference-pressure sensor signals potential leakage across the MCHSs. Data are recorded at 1 Hz and a camera frame rate of 250 fps. More detailed information about the equipment is provided in Table 3.
Before the experiment, each cell was fully CCCV-charged at a rate of 1 C and a cutoff current of 0.05 C. Thermal pre-conditioning begins, and overcharging at a rate of 1 C or 12.5 Ah is started when the desired fluid inlet temperature is reached and the fluid outlet temperature changes by less than 1 K within 10 min, which takes between 60 and 120 min, depending on the fluid temperature level. Without thermal conditioning, the overcharging procedure can start immediately. The camera starts recording after the detection of the cell opening and first venting, which embodies a critical state and an approaching TR. The experiments end with the potential TR and TRP.

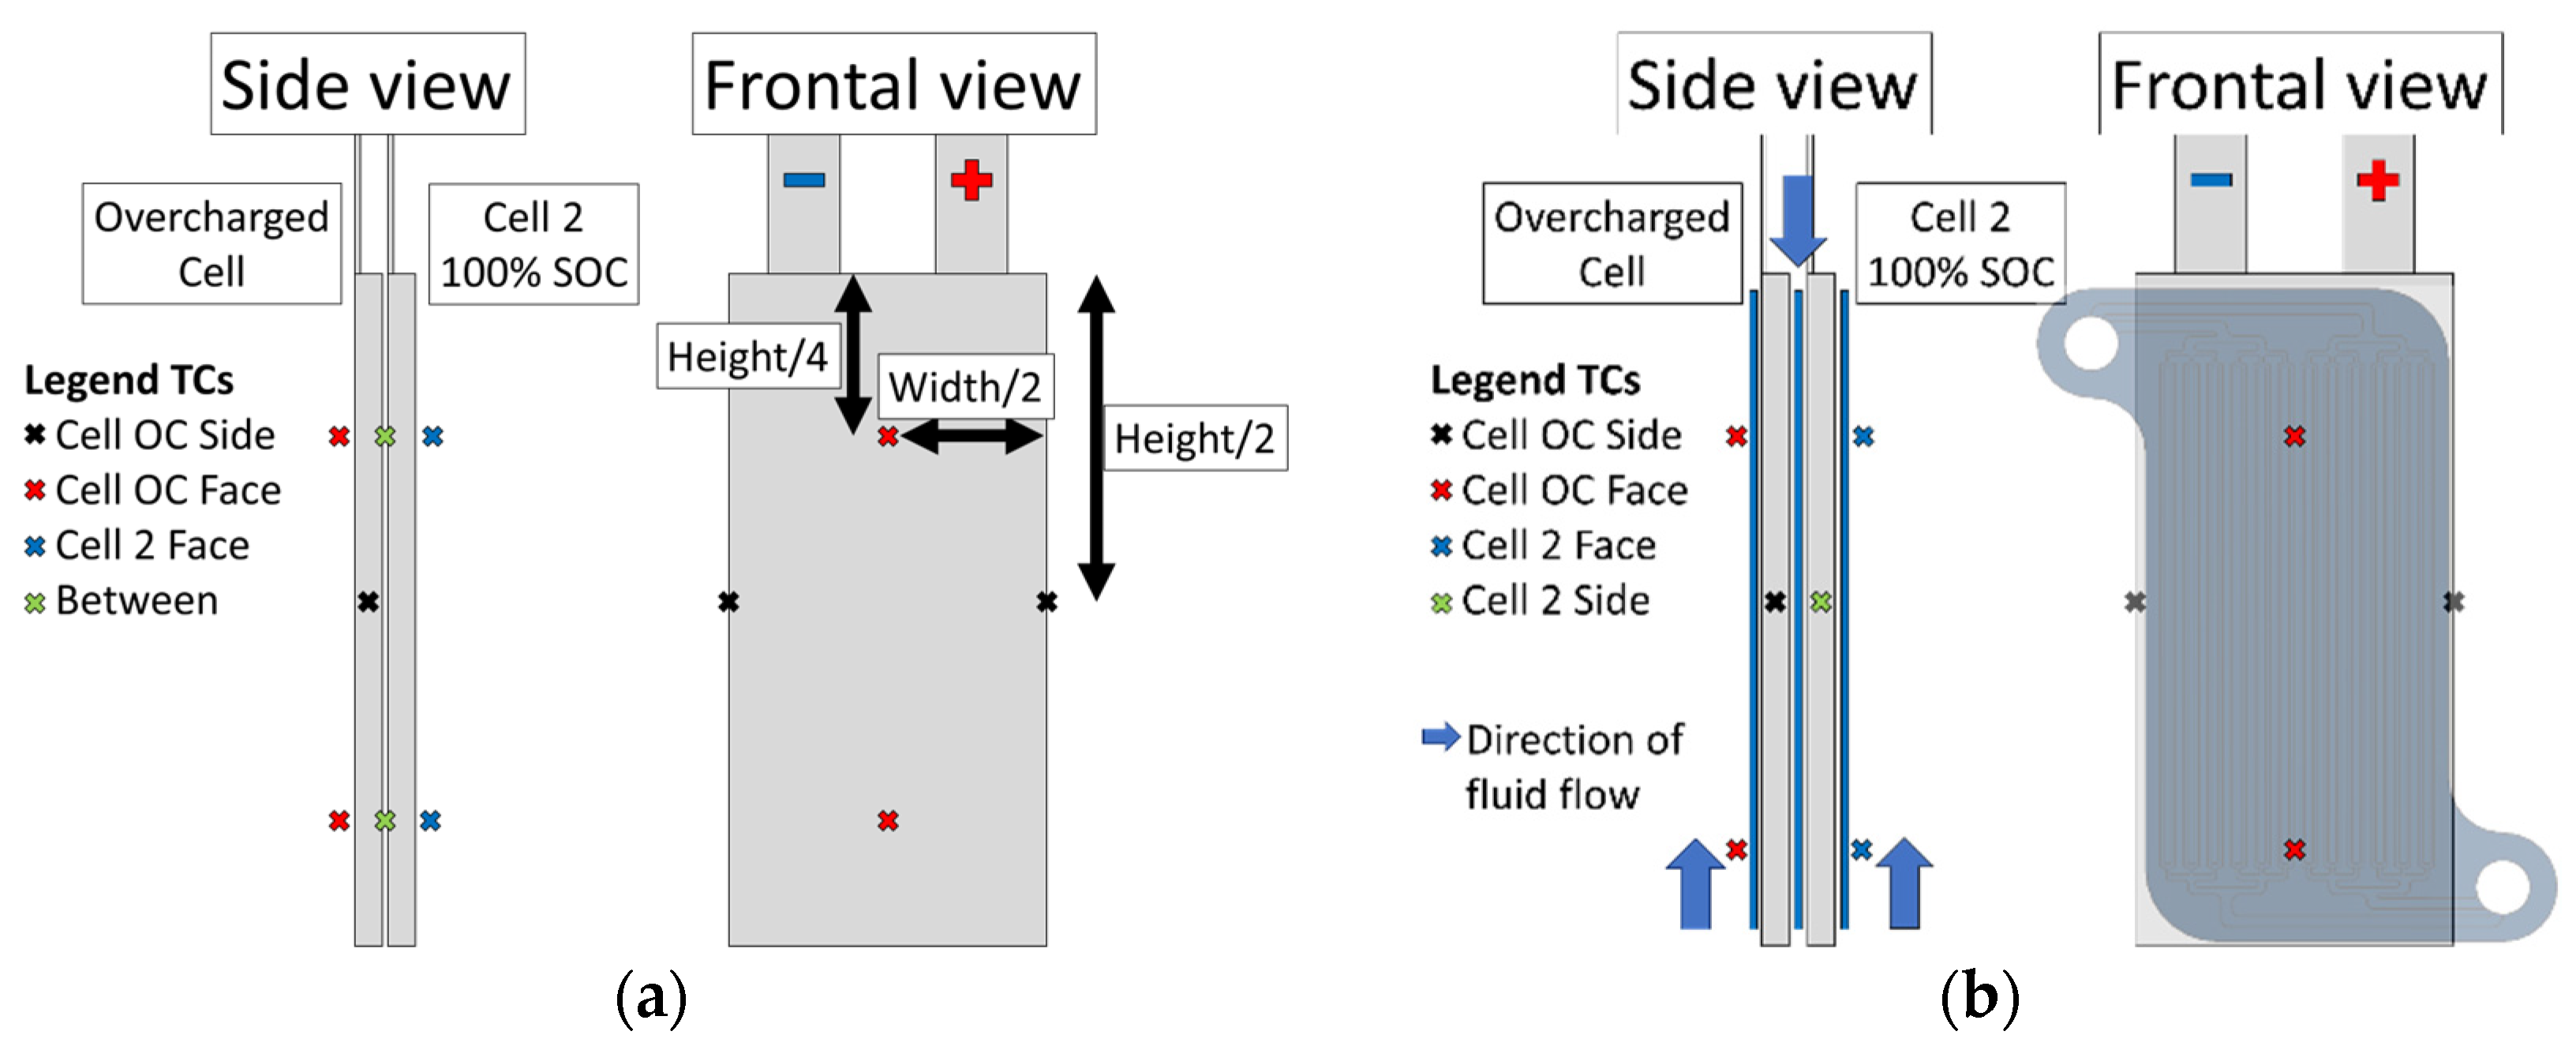
3.3.3. Measurement Plan

Table 4 provides an overview of the experimental overcharging scenarios performed in this study. In the first scenario (#1–9), no thermal conditioning or safety system was installed. This creates a base reference of the temporal process sequence of the overcharged cell towards the TR and the TRP to cell 2 without any safety measures. The second scenario (#1*–4*) captures whether the utilization of the polymer cold plates for thermal conditioning leads to significant temporal changes in the behavior of the OC cell or an overall different outcome from the first scenario. In the case of TR, evidence of protection regarding TRP to the adjacent cell is investigated. A variation in the fluid inlet temperature significantly affects heat transfer [104,105]. At 5 °C, it might impact the cell’s internal process chain the most because a significant temperature difference between the cold plate and the battery is created. Fluid inlet temperatures of 20 and 30 °C arise from applicational reasons and the desire to achieve ideal temperatures inside the battery system under load. In the third scenario (#5*c and 6*c), a malfunctioning thermal management system is emulated by raising the fluid inlet temperature to a critically high value of 40 °C, representing a heat dissipation limitation due to a damaged cooling circuit. The OC cells are brought to a high SOC after the pouch opening and first venting, and then, in two steps of escalation, either the current supply (#5*c) or the fluid supply (#6*c) is stopped. The outcome is examined to determine if the compromised combined thermal management and safety system maintains a protective effect, particularly respecting TRP towards the adjacent cell.

4. Results and Discussion

In the following, for each scenario, the description of the temperature and voltage characteristics, the visualization of the cell fire, and the evaluation of the results with literature are carried out.

4.1. Overcharging without Thermal Conditioning

In the first scenario without polymer cold plate utilization, the overcharged cell undergoes TR within less than an hour in every experiment. TRP is then followed to the adjacent cell in less than one minute.

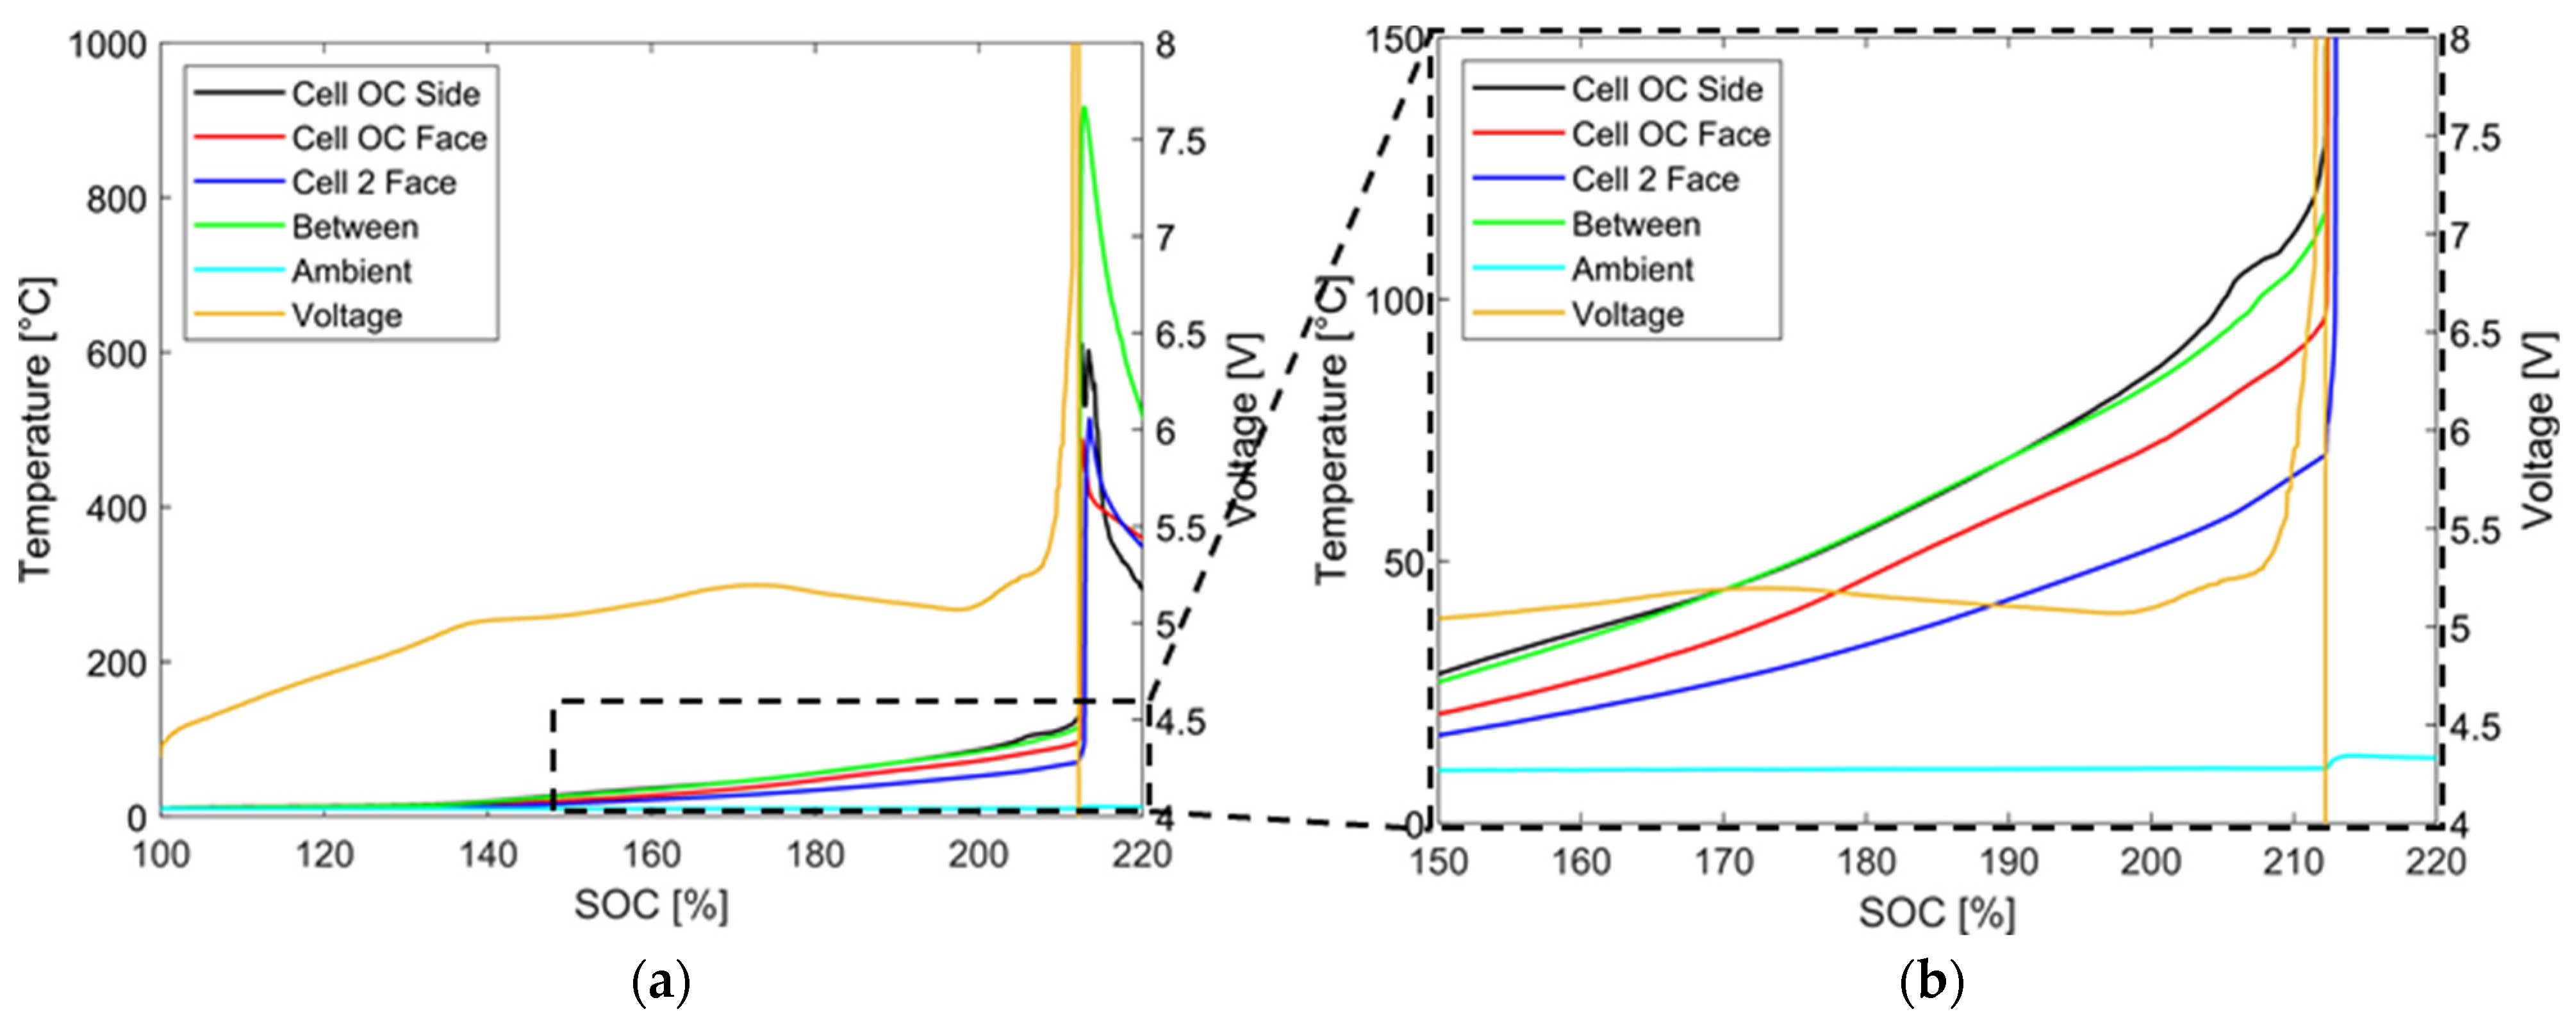
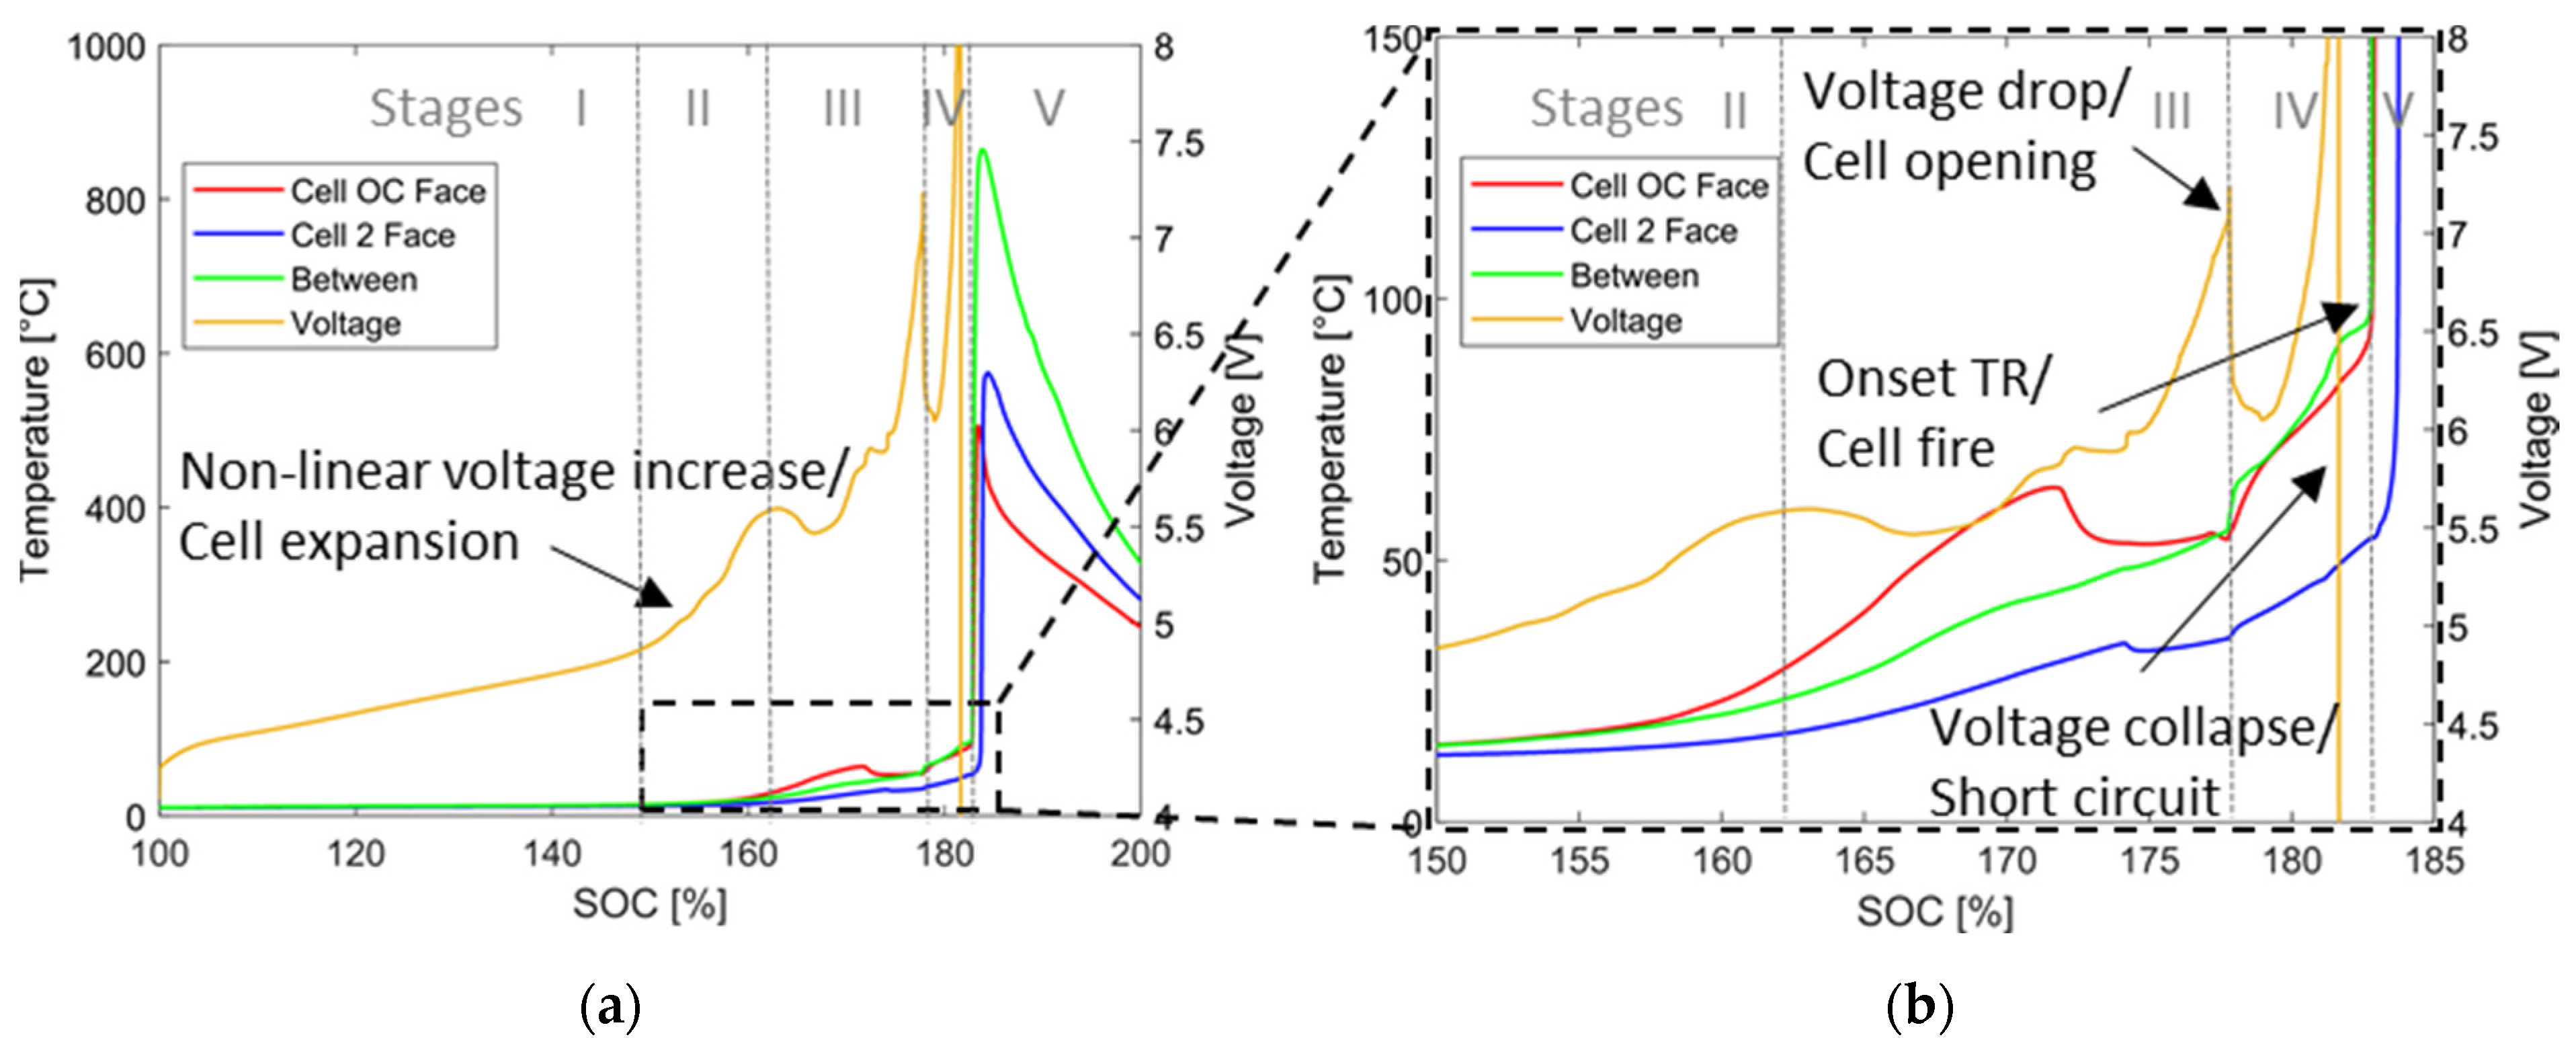
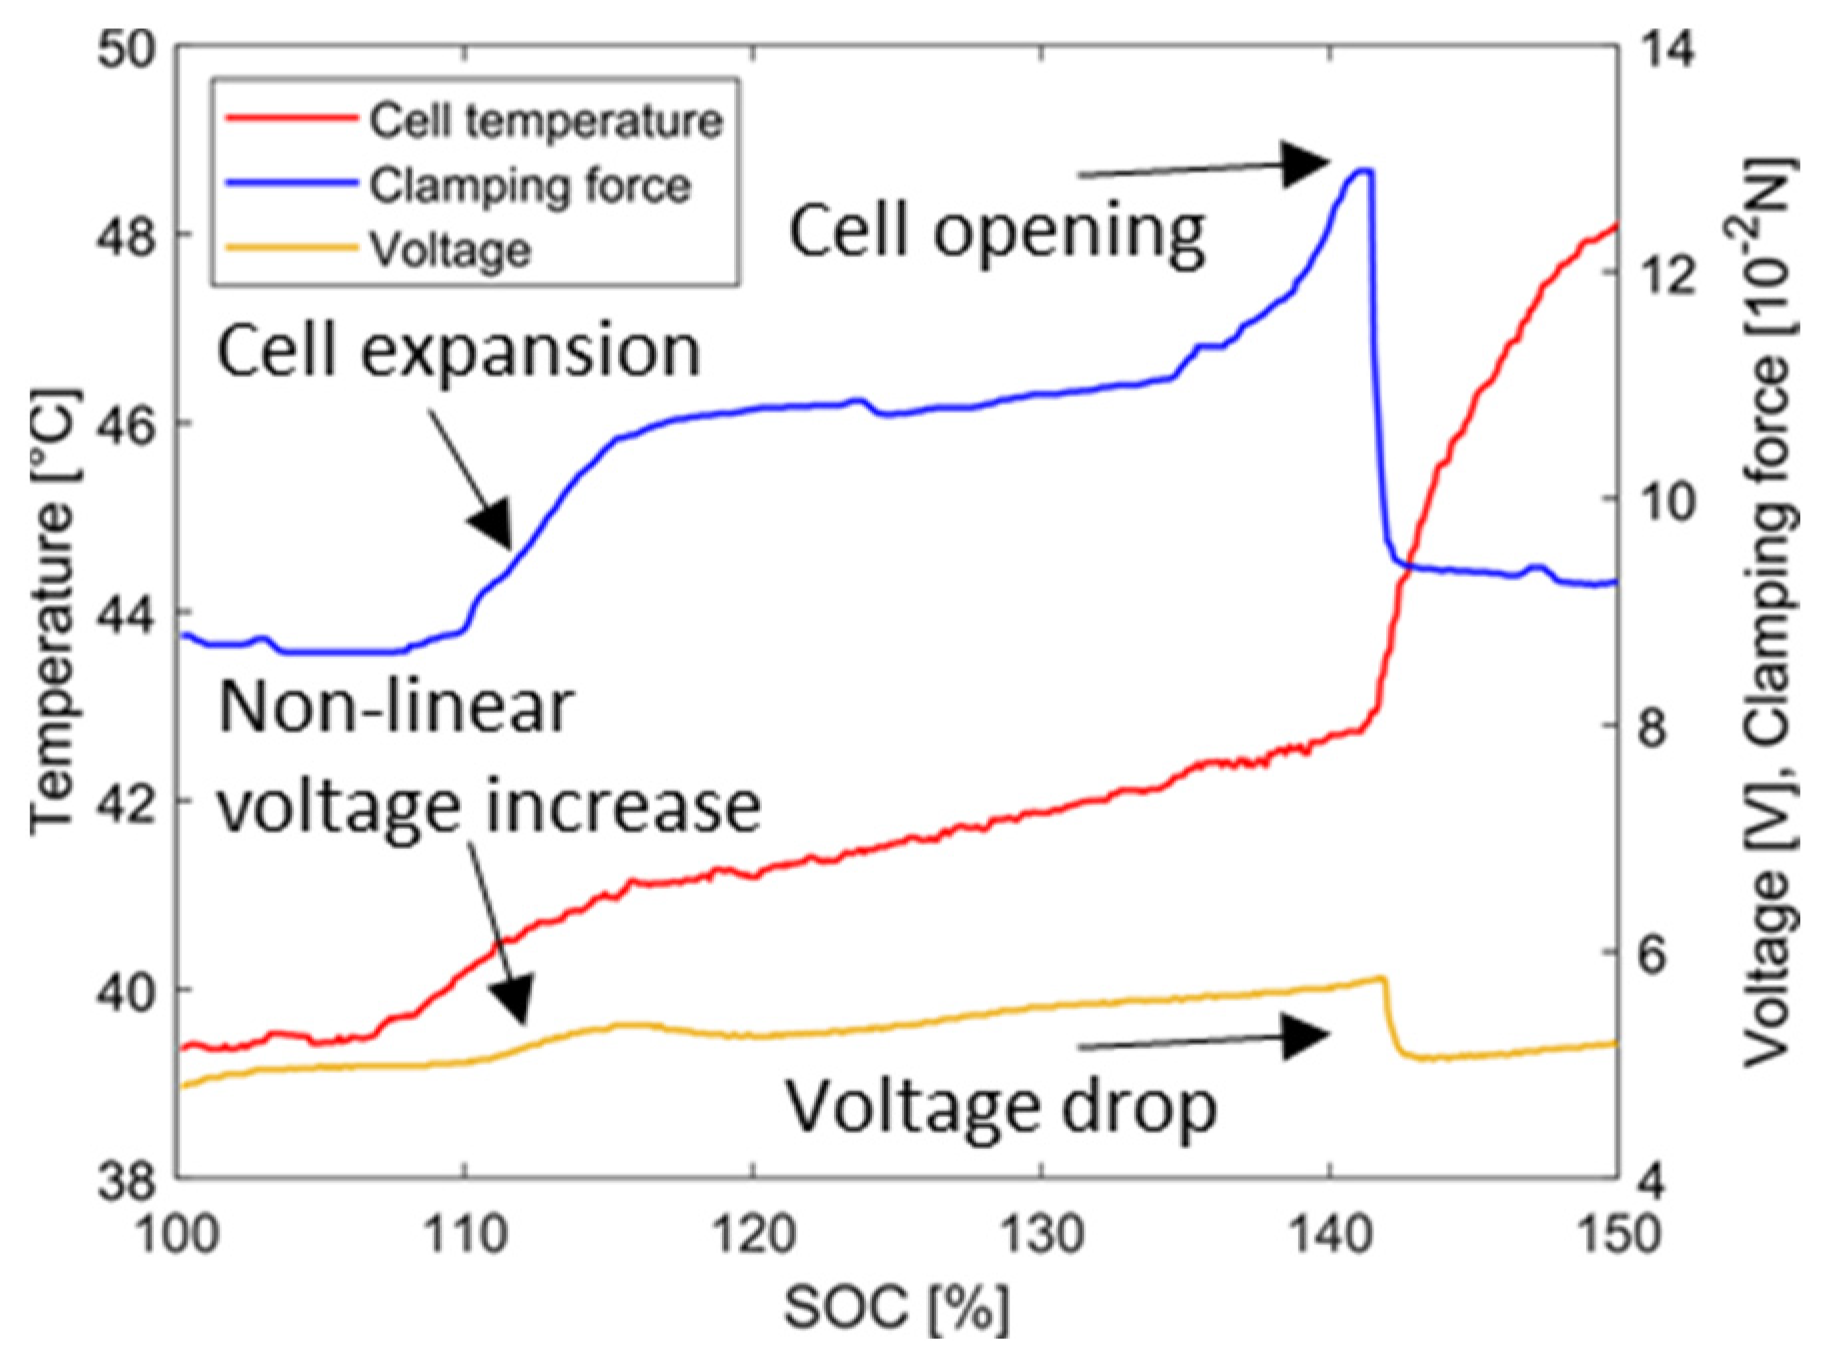
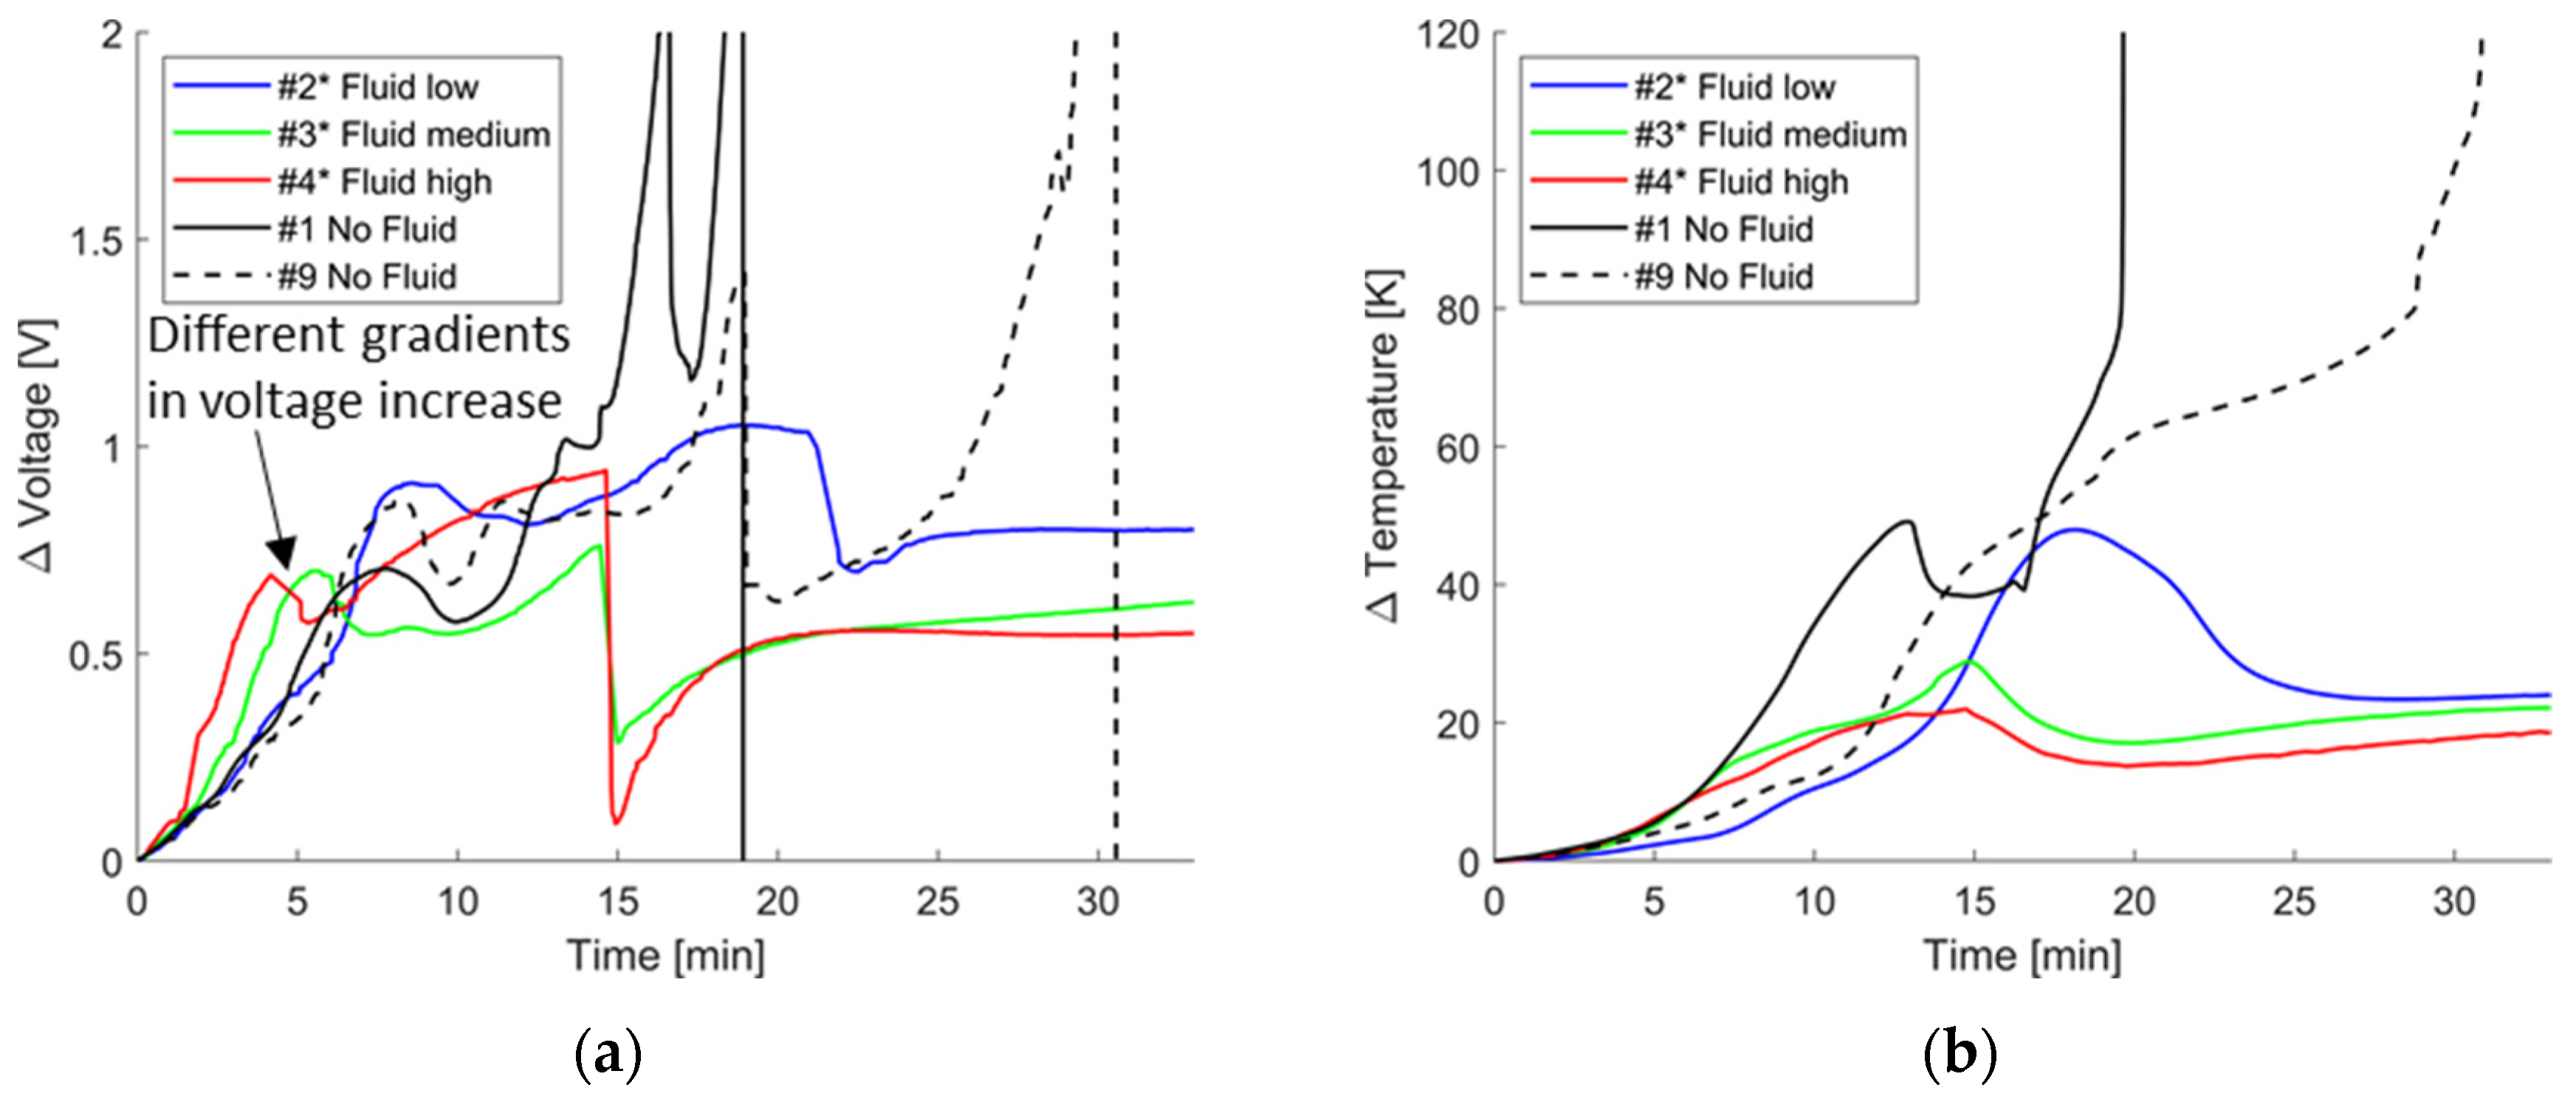
4.1.1. Temperature and Voltage Characteristics

Figure 8a presents the temperature and voltage changes during overcharging without thermal conditioning above the SOC based on representative experiment #1. At a C-rate of 1, a cell is charged from 100 to 200% SOC in 60 min. Figure 8b shows the time interval before the TR in more detail. As can be taken from it, certain characteristics of the changes were assigned to specific externally detectable phenomena, the backgrounds of which are discussed in Section 4.1.3.
During stage I of overcharging, the voltage and the measured temperatures increased steadily in a linear manner. At 150% SOC, the voltage started growing superlinearly from 4.84 V to a local maximum of 5.59 V at 162% SOC, which marked the beginnings of stages II and III, respectively. All temperatures, especially at the overcharged cell’s outer face, showed a noticeable increase. The phenomena can be associated with initiated lithium plating and cell expansion due to internal gas production. The voltage demonstrated a period of stagnation and then increased to a second local maximum at 178% SOC and 7.22 V, where it abruptly dropped by almost 1.2 V, showing the transition to stage IV. All temperatures spontaneously increased, which affected the TCs next to the OC cell more than those next to cell 2 and suggested the opening process of the pouch and first venting of warm gases from the inside had taken place. However, the camera did not capture any observable visual effect of this first gas ejection.
Shortly after, the voltage took a turn, rose progressively, spiked to 11.36 V at 182% SOC, and then collapsed, which embodied an internal short circuit. Around the voltage collapse, white vapor from the top of the overcharged cell was visible in the camera footage. After the first cell opening, the temperatures of the overcharged cell increased steadily to about 90 °C. At an onset surface temperature of 95 °C, the temperatures rose sharply and led to stage V with TR and the actual cell fire due to gas mixture ignition. Internal onset temperatures are known to be significantly higher than surface temperatures [72]. At 183% SOC, the overcharged cell’s outer face temperature peaked at 506 °C. An even higher temperature of up to 865 °C was reached between the cells. Less than one minute after the TR, the adjacent cell had heated up significantly, and TRP occurred, which is proven by a peak of the adjacent cell’s face temperature of 574 °C. Table 5 shows the averaged temporal characteristics of the selected events and stages regarding the overcharging procedure of experiments #1–9 with voltage noise and cell fire. In the Appendix A.2, Table A1 contains information on the individual experiments. At an average SOC of 145 %, stage II with a non-linear voltage increase, defined as 5 % deviation from linear increase, and cell expansion, at a SOC of 172% stage IV with voltage drop and cell opening including first venting, and at a SOC of 179% stage V with TR and cell fire began. Therefore, the non-linear voltage increase with gas development started after 27 min of overcharging. Another 16.2 min elapsed between the non-linear voltage increase and voltage drop with cell opening and first venting. Then, 4.5 min after the cell opening, at the earliest after 70 s, and the latest after 12 min, TR and cell fire commenced, cf. Table A1.

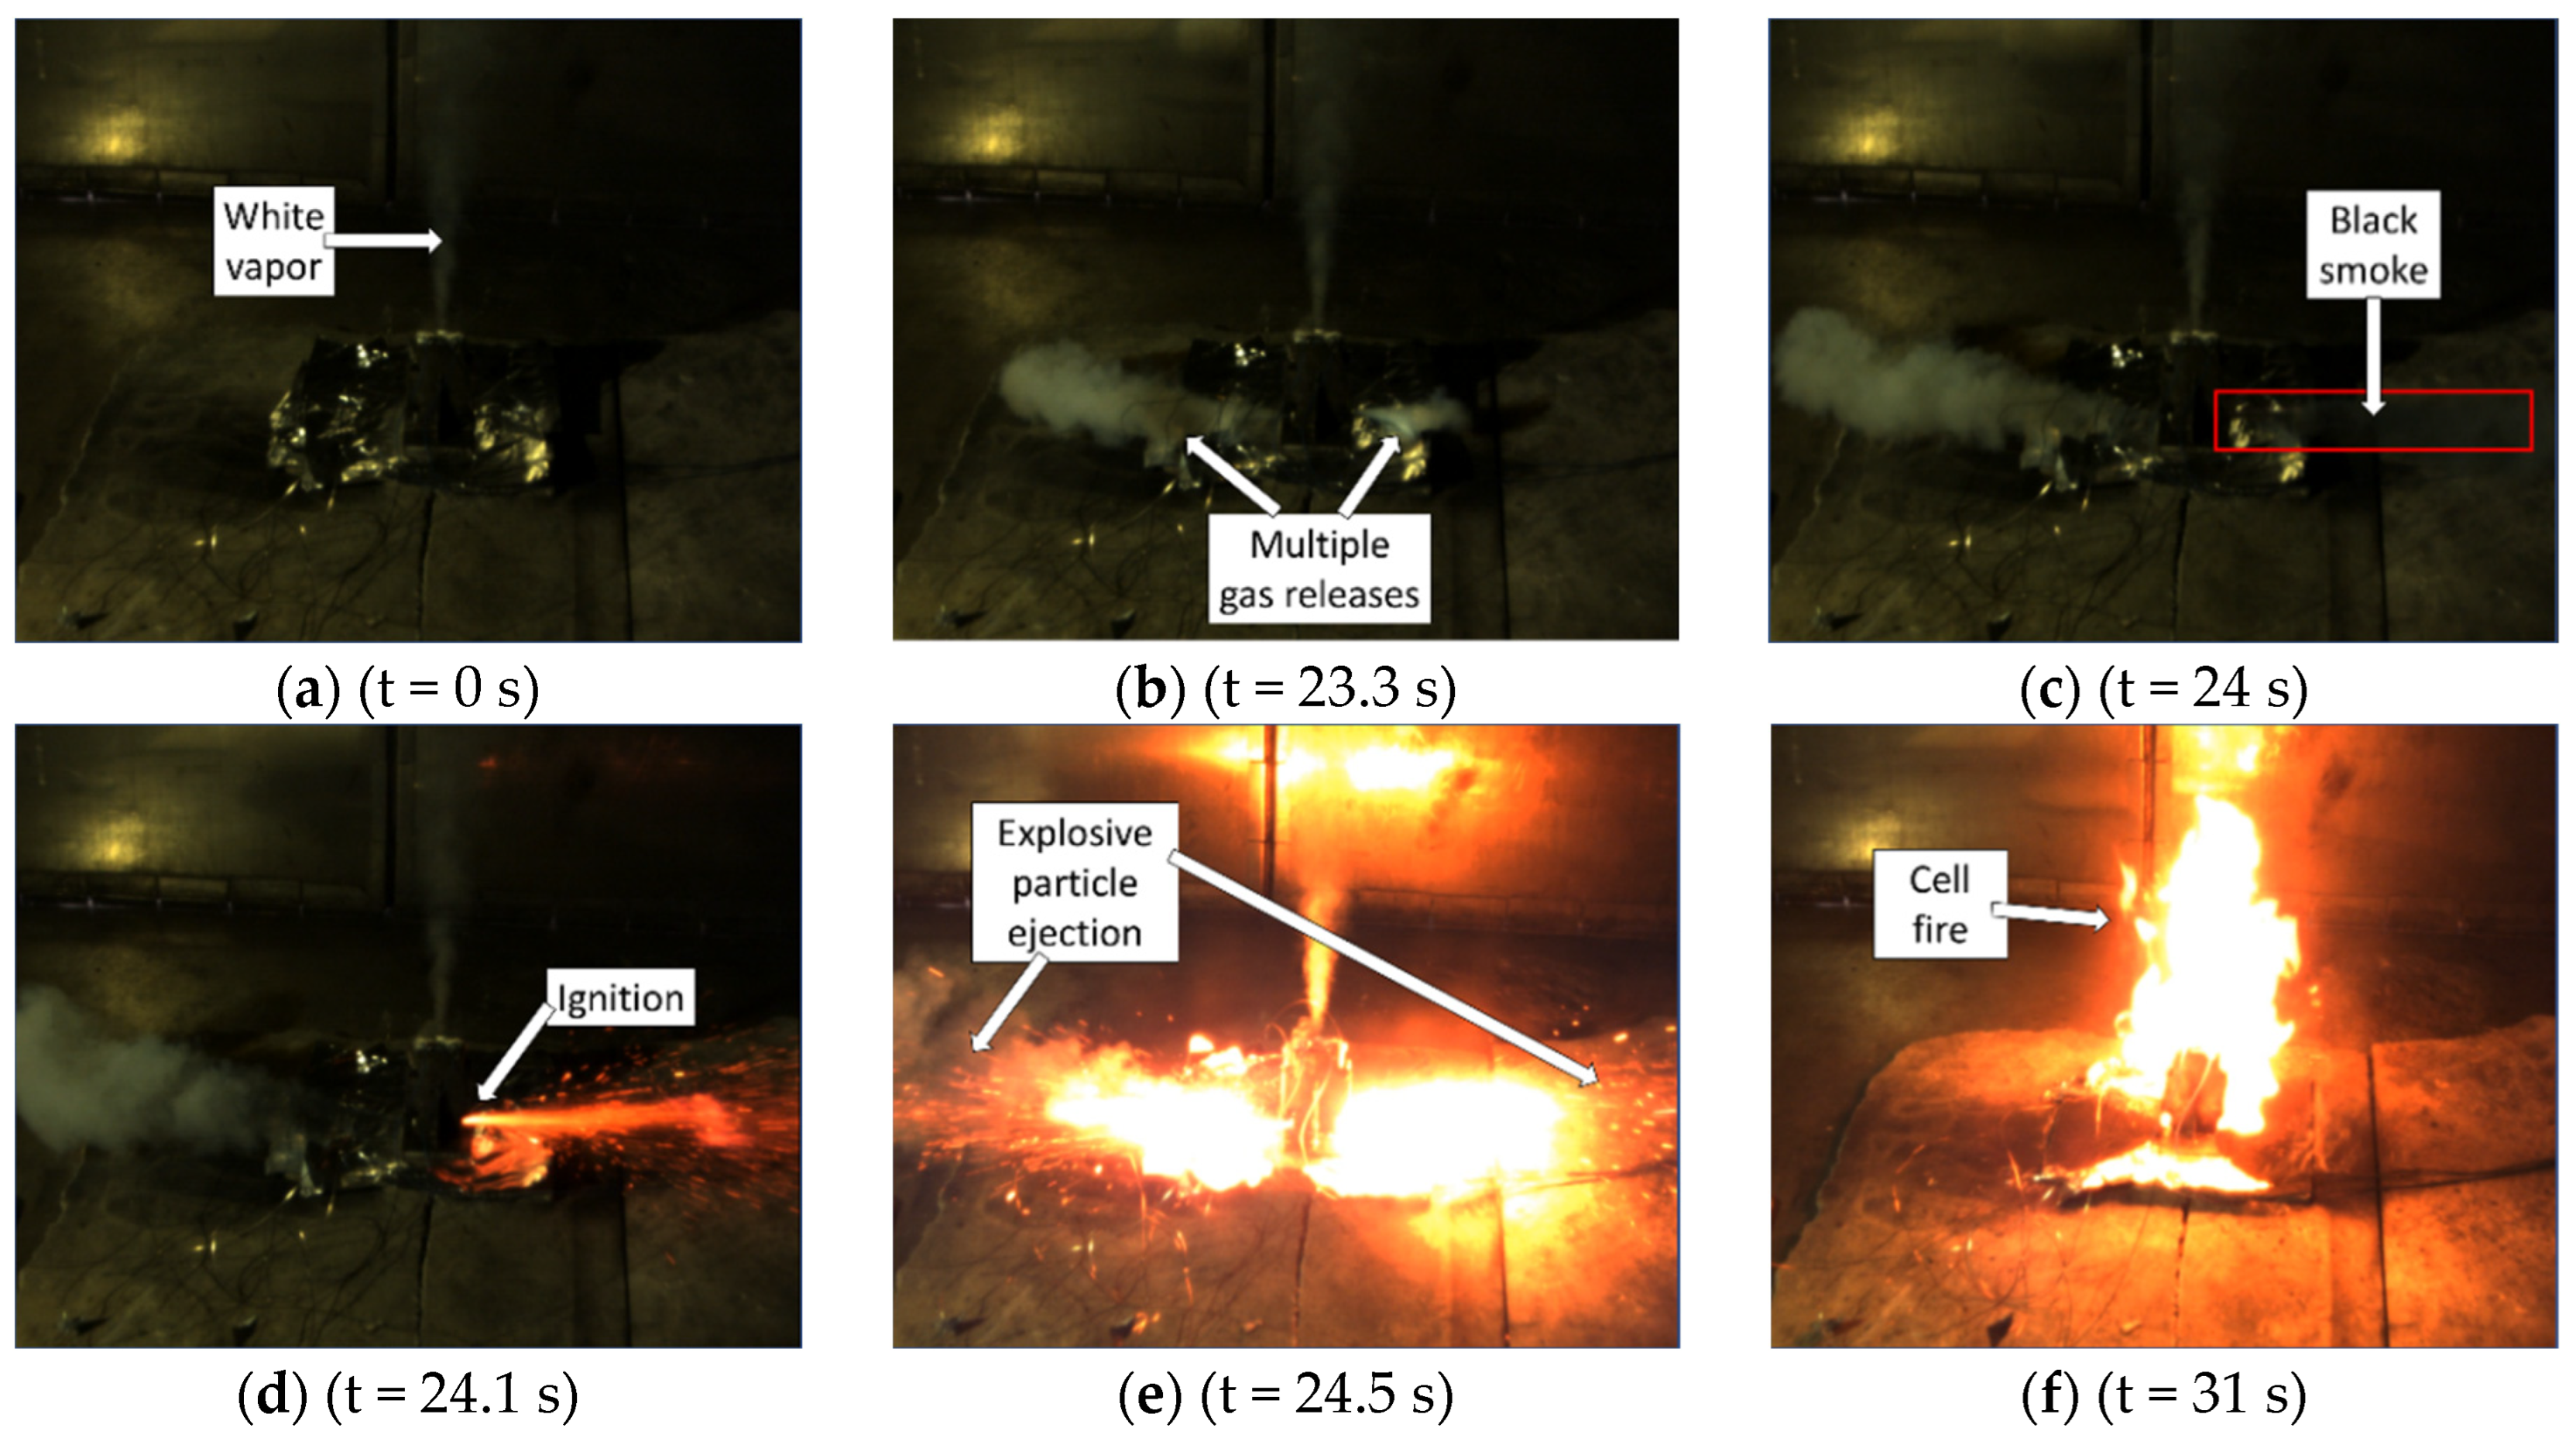
4.1.2. Visualization of the Cell Fire

In Figure 9, high-speed camera recordings of the overcharging procedure without thermal conditioning are shown shortly before and during the cell fire. During the first venting, the pouches tended to open at the top, near the cell’s tabs. In (a), the beginning of the second venting and the impending cell fire were indicated by white vapor. As the temperature difference between the battery cell and the ambience gradually increased due to further overcharging, the escaping gas mixture’s condensation became visible, marking the rising pouch internal temperatures. With an increasing gas production rate, the tensile strength of the seam was reached, and the envelope opened at multiple locations, evidenced in (b). As the internal temperature continued to rise, the vapor changed from white to gray, then to thick black smoke in (c), gradually containing higher proportions of active materials due to pouch internal degradation and melting [106]. In (d), the ignition of the combustible gas composition was triggered by local hot spots due to short circuits. Subsequently, the internal structures dissolved entirely, and a burst of fiery particles, as shown in (e), was forcefully discharged from the cell. The cell burned out completely, see (f), and posed a considerable risk of TRP because of its heat generation.

4.1.3. Evaluation of the Results

Specific characteristics of the voltage noise were assigned to externally detectable phenomena during overcharging in Section 4.1.1, namely the cell expansion and pouch opening before the cell fire. However, the relation between the mechanical processes and the voltage behavior under overcharging conditions is not considered much in the literature. In [107], pouch cells (NMC 622, 75 Ah) were overcharged at rates ranging from 1–3 C without thermal conditioning, and their swelling behavior up to TR was investigated. The cell’s expansion force to the clamping device and the proportional cell displacement were measured next to the voltage and temperature. Cell opening was detected offline with a Fourier Transform-Infrared Spectrometer (FT-IR). The group was able to predict upcoming TR events early by detecting the swelling behavior. However, the qualitative similarity between the change in voltage and cell expansion, of which in Figure 10 an excerpt [107] is shown, had been less emphasized.
The voltage and temperature characteristics closely resemble the results of the first experimental scenario without thermal conditioning, displayed in Figure 8. A first cell expansion due to gas formation was detected during the non-linear voltage increase. At the voltage drop, an increase in temperature was measured, and the FT-IR detected the first gaseous electrolyte components, denoting the cell opening and first venting. The clamping force remained with a positive offset compared to the experiment’s beginning, which can be attributed to an increased cell thickness because of excessive lithium plating [107]. The voltage correlates with the cell’s resistance and the electrode spacing, which varies depending on the cell expansion [16,49] and is one explanation for the related change in the voltage and cell expansion.
According to Arrhenius’s law, the gas production rate increases with temperature. Therefore, a quicker cell expansion and a higher gas production rate can be concluded from a steeper voltage increase. Since the voltage behavior directly reflects the cell expansion and pouch opening and allows an estimation of the internal processes during overcharging, it will consequently serve as the comparison between the experimental scenarios of this study.
Nevertheless, to illustrate the impact of the polymer cold plates on overcharge-induced TR, the temporal characteristics of the first experimental scenario without thermal conditioning must be validated with similar studies from the literature.
In the swelling behavior study of [107], it was observed that at 1 C overcharging, the expansion of the cell initiated at 112% SOC on average, the cell opened with a voltage drop at 147%, and a cell fire was experienced at 214%. The first two events were reached at lower SOCs, whereas the cell fire events were reached at a higher SOC than in the first experimental scenario of this study without thermal conditioning. Another group [14] conducted overcharging experiments on 40 Ah pouch cells of distinct chemistries (NMC 111, 622, and 811) at a rate of 1 C. The NMC 622 cell showed a non-linear voltage increase at a 129% SOC, and TR began at a 141% SOC with an onset surface temperature of 92 °C. According to their nickel contents, the NMC 111 and 811 cells showed higher and lower thermal stabilities with TRs at 155% and 134% SOCs, respectively. Consequently, all corresponding processes were reached at lower SOCs than in the first experimental scenario. Instead, in [13], cells of 1200 mAh capacity (NMC 523) were overcharged at 0.4 C and showed TRs ranging from 160 to 205% SOCs, aligning with the range of the first experimental scenario of this study. In both studies [13,14], no abrupt voltage drop and cell opening were detected before TR. Instead, a more gradual voltage drop was found.
The experimental results of the first scenario are generally in line with those findings of similar studies in the literature. The deviations in SOCs concerning certain events in the overcharging process could be significantly related to the cell-specific oversizing of the anode capacity.

4.2. Overcharging with Thermal Conditioning

In the second scenario, the polymer mini-channel cold plates were implemented between the pouch cells to provide thermal conditioning and prevent TR propagation.

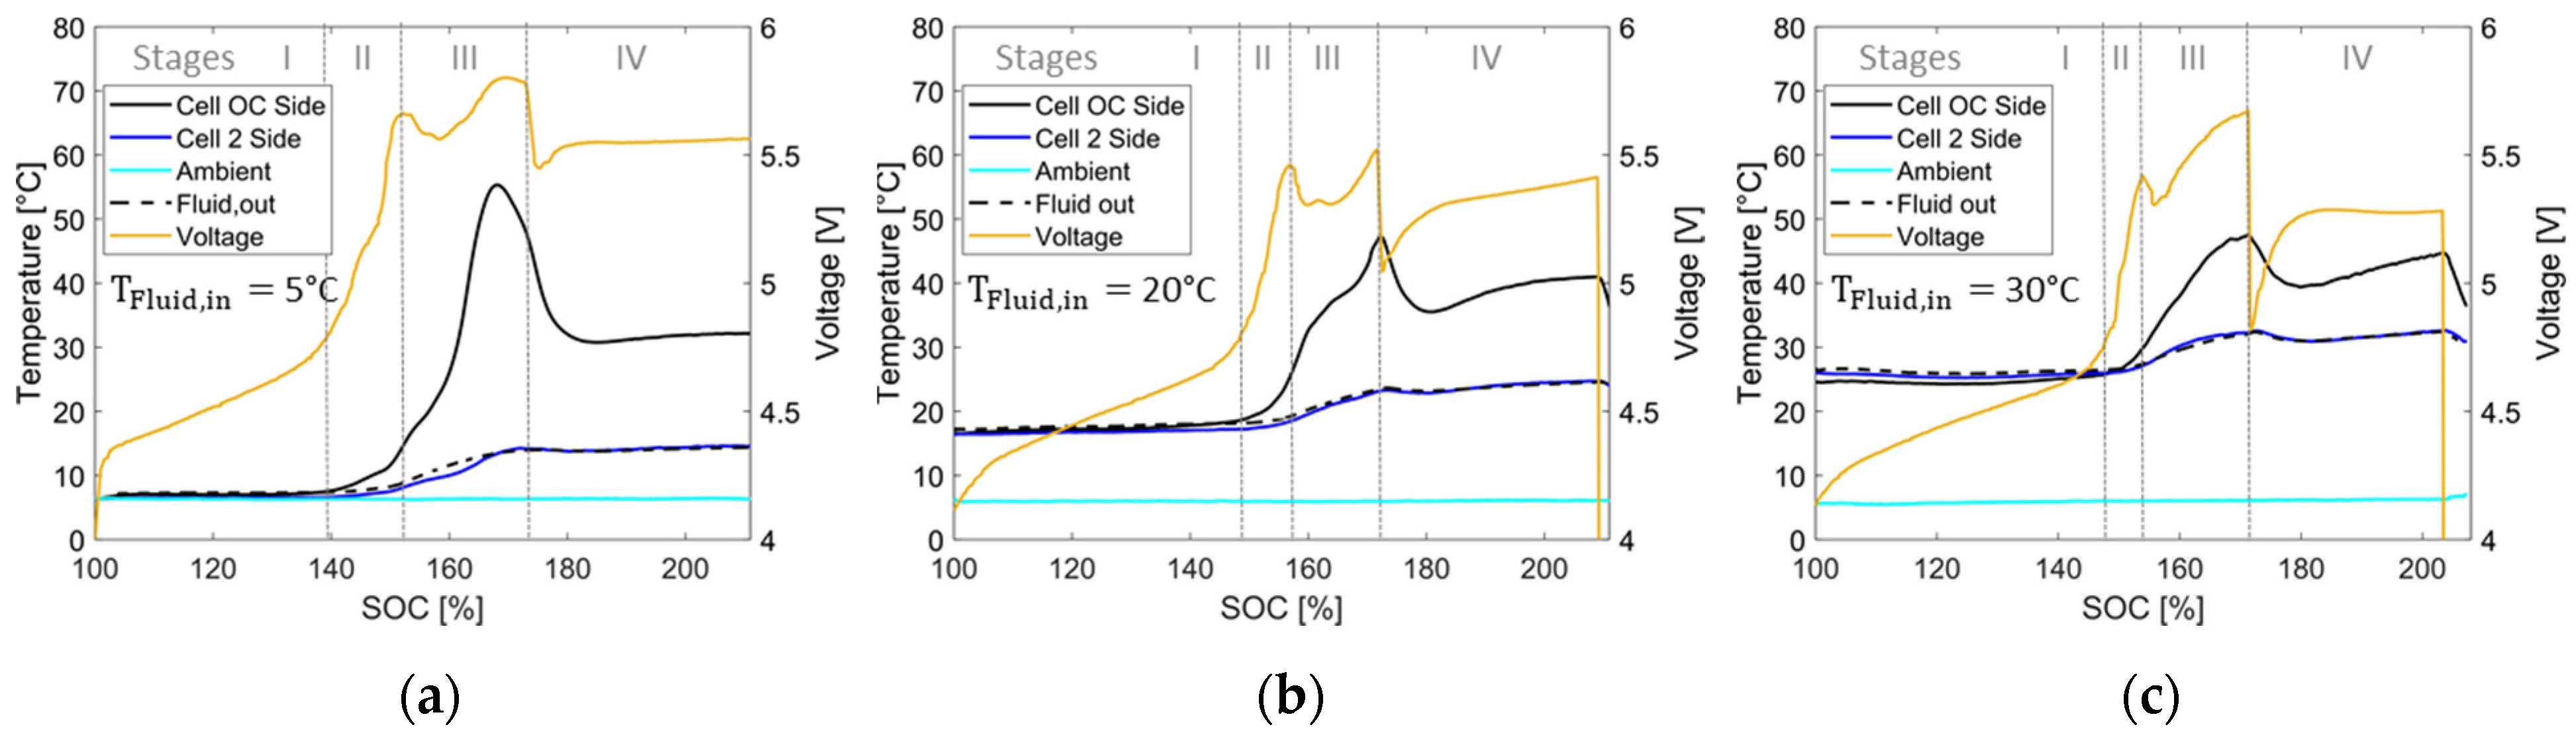
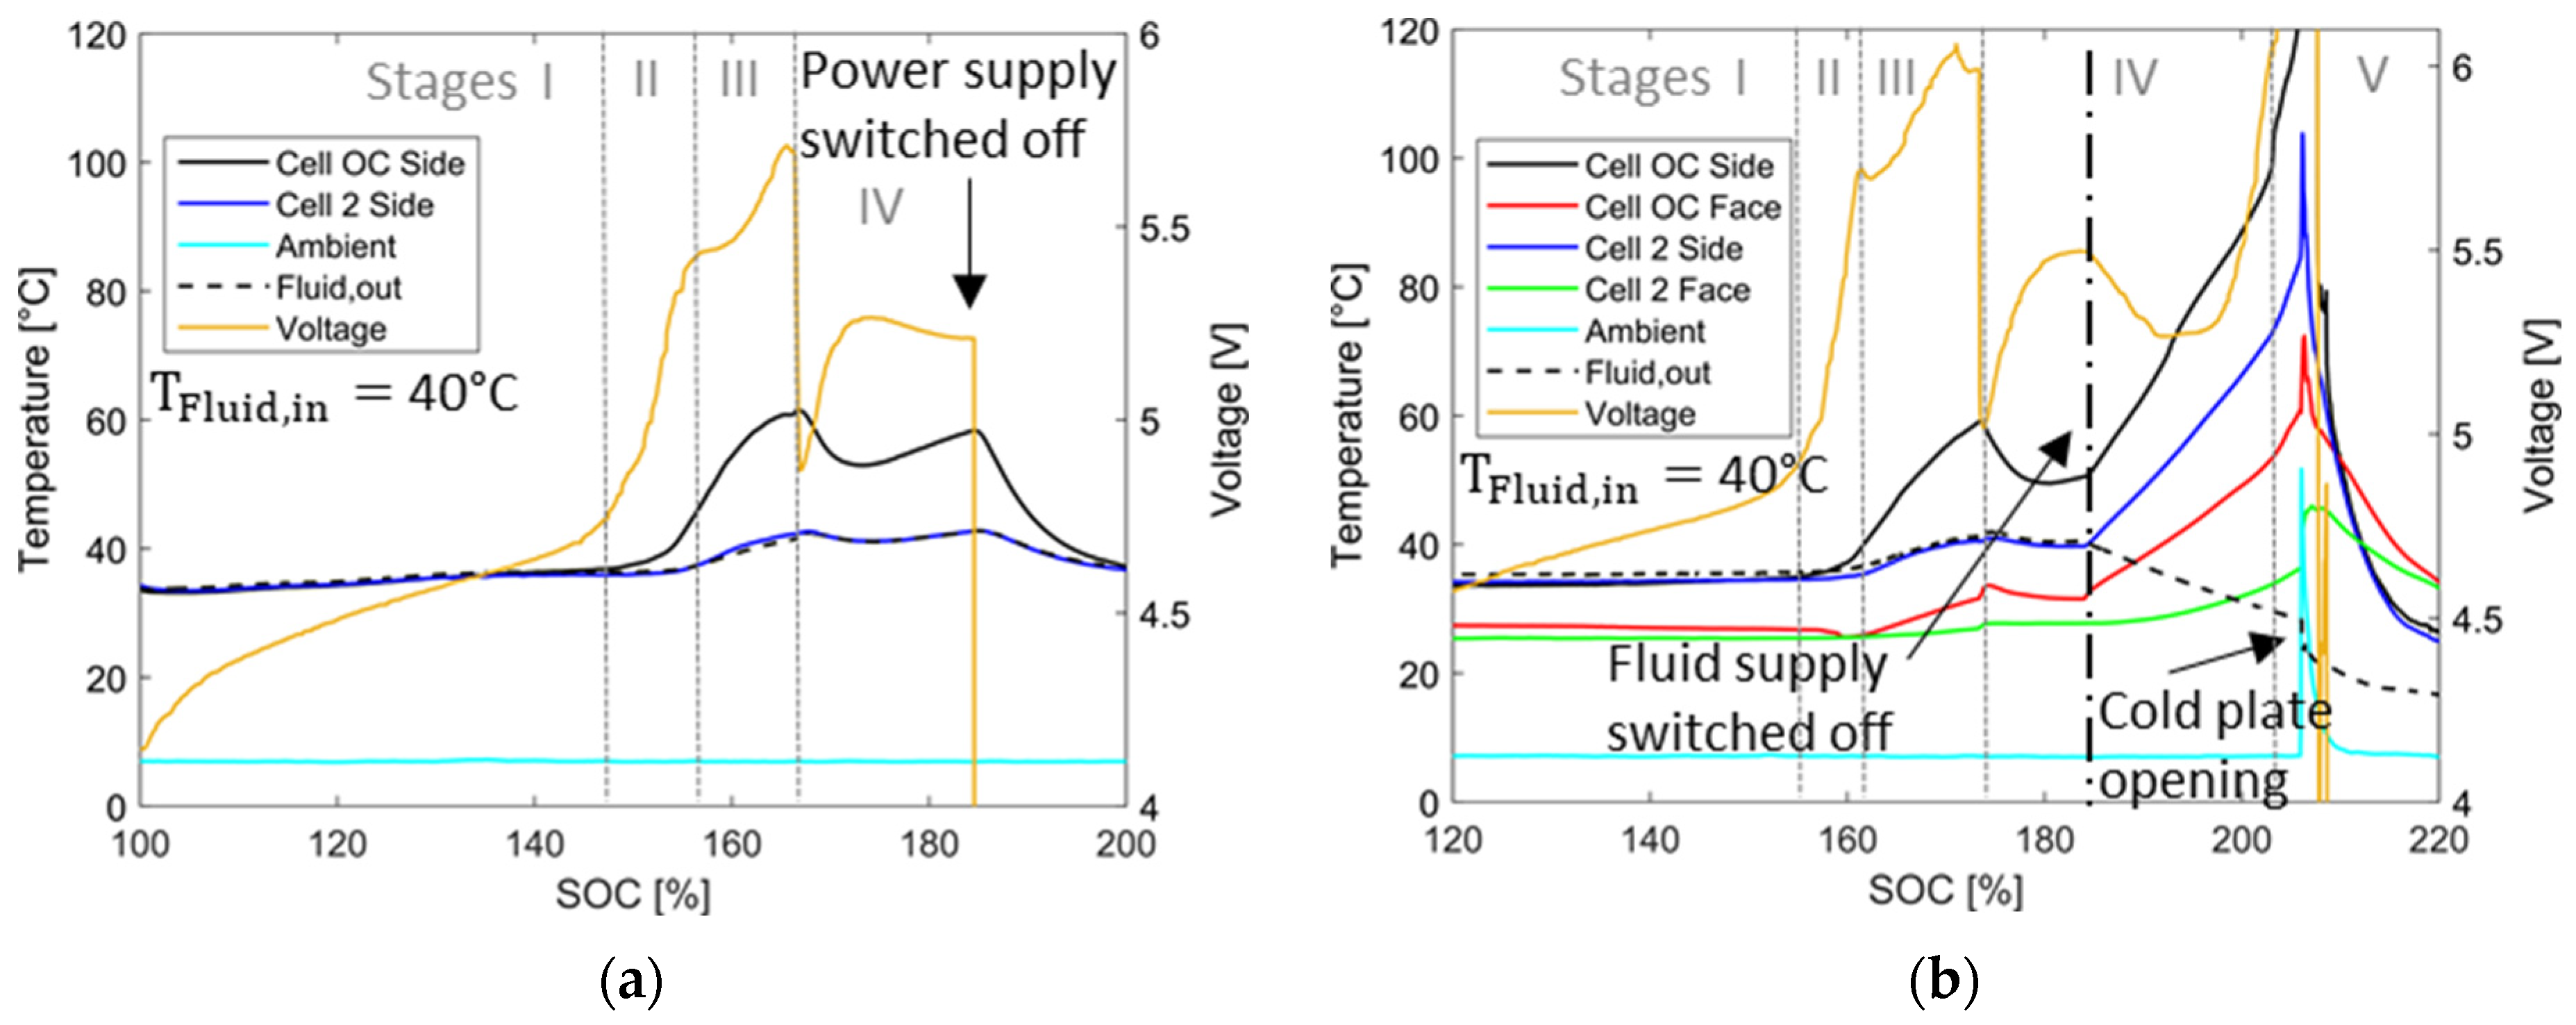
4.2.1. Temperature and Voltage Characteristics and Comparison

Figure 11a–c displays the characteristic cell temperature and voltage changes as a result of overcharging and thermal conditioning at different fluid inlet temperatures. The experiments were conducted with different fluid temperature levels, referred to as “low” (5 °C), “medium” (20 °C), and “high” (30 °C). For clarity, the temperatures have been reduced to the laterally measured ones, reflecting the cell’s state most accurately.
As in the first scenario without thermal conditioning (cf. Figure 8), in every experiment, a voltage noise containing a non-linear voltage increase, a local maximum, a voltage plateau, and an abrupt voltage drop, along with a peak in temperature of the OC cell was detected, which can be attributed to the internal gas production, and therefore to the cell expansion and pouch opening with the first venting. Table 6 shows the temporal characteristics of all thermally conditioned experiments. These were conducted in an ambient temperature range of 6 to 7 °C and at 11 °C in experiment #1*. Table 6 indicates that the process behavior was analogous for both experiments #1* and #2* under low fluid temperature conditions.
The temperature of the overcharged cell rose significantly from the start of the non-linear voltage increase. It peaked shortly before the voltage drop if conditioned under low fluid temperature conditions and at its voltage drop at medium and high fluid temperatures, as shown in Figure 11. The peak temperatures of the OC cell reached 59 and 55 °C under low fluid temperature conditions but stayed at lower temperatures of 47 and 48 °C when conditioned by medium- and high-tempered fluid. The reduction in the OC cell’s temperature after the voltage drop is more significant with a lower fluid temperature.
At a low fluid temperature, after the voltage drop at a 172% SOC, the voltage recovered in a degressive manner. Then, it remained constant, slightly above 5.5 V, for more than 20 min beyond a SOC of 200%, while the cell temperature dropped to 32 °C during the cell opening and then stagnated; see Figure 11a. The experimental time in the fire room is a valuable resource. Since the stage’s IV duration of overcharging in experiments #1* and #2*, from the cell opening to the potential TR, of more than 20 min exceeded the respective times of the unconditioned experiments with an average duration of 4.5 min and a maximum of 12 min by far, the overcharging procedure was terminated here.
Before doing so, the camera footage was checked for optical effects of white vapor; cf. Figure 9a. Its presence indicated elevated internal temperatures and the beginning of the second venting in the first scenario without thermal conditioning. Although every overcharged cell in the second thermally conditioned scenario opened at the top near its tabs during the first venting, vapor was not detectable in any experiments with low, medium, and high fluid inlet temperatures, which suggests a certain system stability. Ceasing the overcharging resulted in a cool down and stabilization of the OC cell in each experiment, with no TR and cell fire occurrence.
At a medium fluid temperature, the voltage recovered more significantly after its drop than at a low fluid temperature, yet in a degressive way. Then, it showed a slightly more linear increase, staying below 5.5 V. The temperature showed a degressive increase, reaching a limit of 41 °C after 20 min from the voltage drop, as depicted in Figure 11b. The voltage recovery was even more significant at high fluid temperature yet still degressive. It remained stable below 5.5 V throughout the experiment, while the cell temperature showed a degressive increase up to 44 °C about 20 min from the voltage drop; see Figure 11c. As before, the systems stabilized after the overcharging was terminated.
Comparing the temporal characteristics of the experiments conducted in the first two scenarios without and with thermal conditioning reveals significant findings, as indicated in Table 5 and Table 6. Stage II of overcharging, characterized by the initiation of a non-linear voltage increase, commenced at lower SOCs of 138 to 139% when conditioned at a low fluid temperature than at the medium and high levels (148% SOC). It began at an average of a 145% SOC without conditioning. The voltage drop and stage IV were reached at approximately the same SOC of 172% for both sets of experiments, leading to significant differences between the scenarios in the duration of stages II and III between the non-linear voltage increase and voltage drop. At a low fluid temperature, a length of 19 to 21 min was measured, whereas it took a good 16 min on average without thermal conditioning. It should be noted here that overcharging in the unconditioned experiments #1–9 started at ambient and cell temperatures of 7–14 °C; see Table A1. This temperature range falls between the OC cell’s starting temperatures in the conditioned experiments at low and medium fluid temperature levels. Finally, stages II and III were decreased to barely 15 min at medium and high fluid temperatures.

4.2.2. Evaluation of Results and Comparison

The disparities in the temporal characteristics of the first two experimental scenarios with and without thermal conditioning, as well as the prolongation of stage IV of overcharging after the cell opening in the thermally conditioned scenario, can be attributed to the cooling effect of the polymer cold plates.
Lithium plating on the anode, besides due to overcharging, is intensified at low-temperature working conditions as well as high-rate charging [108]. The batteries were not exposed to invalidly high currents, only to their maximum charging rate. At low temperatures, the poor battery performance of lithium batteries is related to the increased polarization of the anode, leading to the occurrence of early lithium plating before the anode intercalation sites are even fully utilized [109,110] because of the electrolyte’s reduced ionic conductivity and slow lithium diffusion within the graphite [111,112]. Early lithium plating, due to the low-temperature criterion, is promoted the most by using fluid for conditioning at a low temperature of 5 °C in experiments #1* and #2*, to a lesser extent in the thermally unconditioned first scenario and the least at higher fluid temperatures in experiments #3* und #4*. If lithium plating is already more pronounced at lower SOCs, the associated parasitic side reactions and gas production are also promoted earlier. Consequently, the non-linear voltage increase and pouch expansion occurred from lower SOCs of 138 to 139% during low fluid-temperature conditioning, on average at a 145% SOC in the experiments without thermal conditioning and at a 148% SOC with medium and high fluid temperatures.
According to Arrhenius law, the kinetics of the parasitic side reactions and the gas production rate are correlated to the OC cell temperature. At elevated temperatures, more gas volume per timestep is produced. Instead, the cell’s pouch opens up as the tensile limit of the seam is reached. Consequently, the time interval between the initial gas production and pouch opening is reduced if the cell is conditioned at elevated fluid temperatures.
Figure 12 presents the voltage and laterally measured temperature changes in the overcharged cell from meaningful experiments of the thermally conditioned and unconditioned scenarios in (a) and (b), respectively.
Two unconditioned experiments, #1 and #9, are included next to the thermally conditioned experiments, #2*, #3*, and #4*, at low, medium, and high fluid temperatures. Experiment #1 introduced the first experimental scenario in Section 4.1.1. With a duration of 3 min, this cell exhibited a relatively short stage IV of overcharging between the pouch opening and cell fire, while it lasted the longest in experiment #9 with 12 min. To enable comparability between all experiments, every curve’s starting point refers to the beginning of stage II of overcharging, marked by the non-linear voltage increase, after deducting the corresponding voltage and temperature offsets.
Firstly, the voltage increased more rapidly if fluid at medium and high temperatures was used, compared to low-tempered fluid or no conditioning, due to the increased gas production rate and faster cell expansion at higher temperatures. Despite the two unconditioned cells and the cells conditioned at a low fluid temperature showing a more significant temperature increase over the subsequent minutes than those conditioned at medium and high fluid temperatures, their pouches opened later.
Secondly, the impact of face conditioning by the polymer MCHS was noticeable after the voltage drop. Without thermal conditioning in experiments #1 and #9, the voltage immediately took a turn and continued to rise progressively until a cell fire event occurred. The cell temperature rose steadily and reached the onset of TR at approximately 100 °C, the latest 12 min after the pouch opening. In contrast, after each cell opening during the thermally conditioned experiments, a degressive voltage increase and a reduction in cell temperature, followed by a limited growth and stagnation of both metrics, were observable for at least 20 min until the overcharging process was terminated. Consequently, the thermally conditioned cells outlasted the unconditioned ones regarding the system’s stability. However, although there was no discernible superlinear and progressive voltage increase after the cell opening, the possibility of TR and cell fire cannot be ruled out entirely after an additional overcharging time.
The utilization of the polymer MCHS for thermal conditioning showed a recognizable temporal impact on the cell behavior and the process chain during the attempted overcharge-induction of the TR. Despite their low thermal conductivity material, the cold plates facilitated a significant heat dissipation from the pouch cells. The cell temperatures were lowered in the later stages of overcharging. Stage IV, starting from the pouch opening, was exceptionally prolonged, without reaching a cell fire for the next 20 min. The absence of white vapor at the end of the overcharging procedure indicated a significant reduction in the OC cell’s internal temperatures using the polymer cold plates for face cooling.

4.3. Overcharging with Malfunctioning Thermal Management

In the third experimental scenario, a malfunctioning thermal management system is emulated. If the cooling system is damaged, the heat dissipation of the mini-channel cold plates can be reduced, and reaching the onset of the TR and cell fire is more likely. The polymer cold plate’s function as a thermal barrier in the system is investigated regarding the differences in TRP compared to the first scenario without any safety measures. Two different escalation levels were tested. After setting a “critical” fluid inlet temperature of 40 °C, either the power supply is switched off in experiment #5*c at a specific SOC 12 min after the voltage drop and pouch opening, or the cooling unit is switched off in #6*c at the same SOC.

4.3.1. Temperature and Voltage Characteristics

Figure 13 presents the voltage and temperature characteristics during overcharging with a malfunctioning thermal management system, with (a) and (b) showing the outcomes of experiments #5*c and #6*c, respectively. Table 7 shows the temporal characteristics of the corresponding experiments. As in the first two experimental scenarios, a voltage noise containing a non-linear voltage increase and voltage drop was identified. With 10.6 and 10.1 min, the shortest times between cell expansion and cell opening were found, correlating with the critically high fluid temperature and elevated gas production rates.
In experiment #5*c, the cell opening occurred at the lowest SOC of 165% among all thermally conditioned experiments; see Figure 13a. The change in voltage then showed strong similarities to the previous experiments #1*–4*. After the drop, the voltage recovered quickly, but degressively, to a local maximum of 5.26 V and then stagnated at that level. Meanwhile, the OC cell’s lateral temperature, after peaking to 62 °C during the pouch opening and reducing by 9 K afterward, changed its orientation and linearly increased to 58 °C after 12 min. Here, at a 185% SOC, the power supply was switched off, while no white vapor from the cell and a beginning second venting had been visible before; cf. Figure 9a. All measured temperatures immediately decreased, and the overcharged cell stabilized at 37 °C 9 min later.
In experiment #6*c, the events and their outcomes diverged. In the early overcharging stages, an analogous appearance to experiment #5*c was observed; see Figure 13b. The voltage noise occurred slightly later. Consequently, at a SOC of 185%, the voltage drop was experienced just a good 6 min prior. However, the voltage and OC cell’s lateral temperature had already leveled to 5.5 V and 51 °C shortly after. Upon switching off the thermostat’s pump and halting the fluid flow, the temperature at every point in the clamping device increased significantly in a linear manner, with the most rapid ascent occurring at the OC cells’ sides. The voltage decreased by 0.2 V and subsequently increased significantly. After approximately 10 min, white vapor was observed in the camera footage. About 11 min after switching off the fluid supply, at an onset temperature of 98 °C, the TR and cell fire occurred at a 203% SOC. While the lateral temperatures at the overcharged and now burning-out cell were measured to a maximum of 769 °C, the corresponding TCs of cell 2 only captured a temperature of 104 °C for a concise amount of time. The TCs, located at the face positions of the OC and the adjacent cell between the outer MCHS and the clamping device, recorded peaks of 72 and 46 °C, respectively. Although the temperature on the adjacent cell shortly exceeded a critical value of 60 °C at its sides, no evidence of a TRP was found. A decrease in the fluid outlet temperature was detected upon cell ignition, which revealed the opening of one of the cold plates next to the overcharged burning cell. The remaining cooling fluid flew out of the piping towards the opening, and the TC in the fitting adjusted accordingly to the cooler downstream fluid.

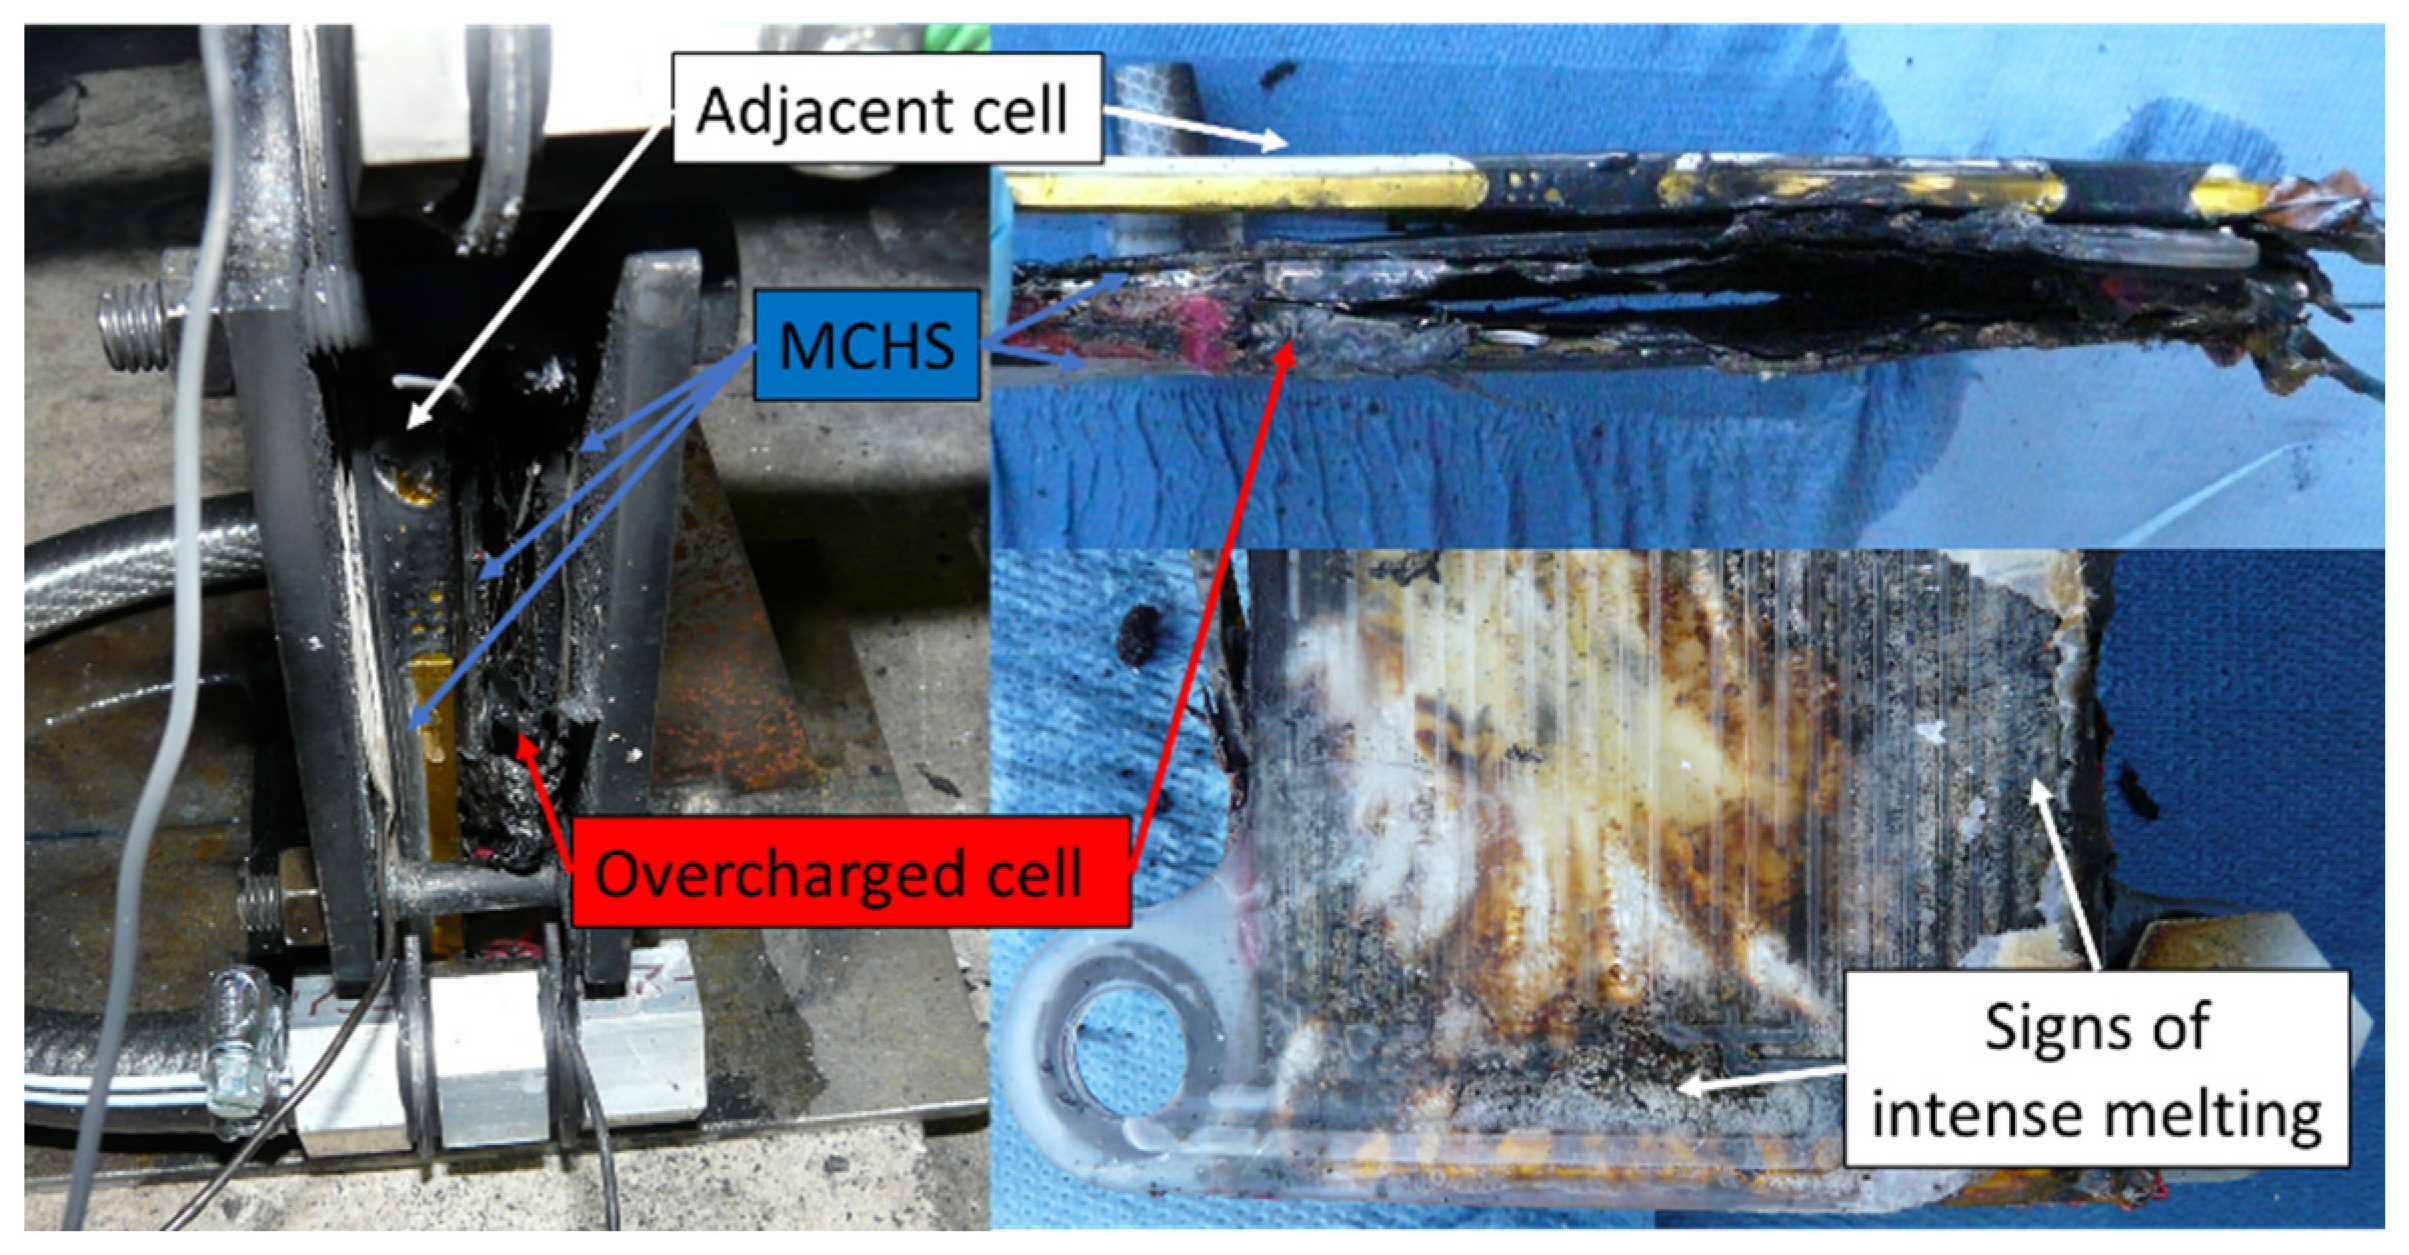
4.3.2. Visualization of the Cell Fire with Thermal Management and Safety System

Figure 14 displays the characteristics of the cell fire in experiment #6*c, including the water-supplied combined thermal management and safety system. Here it must be noted that inside an actual battery pack, alternative non-reactive heat transfer media are needed to supply the cold plates, since water which is in contact with lithium reacts and produces hydrogen gas, which serves the cell fire as additional fuel.
Shortly before the cell caught fire, white vapor was released from the opened cell in (a). The cell ignited spontaneously without the occurrence of black smoke beforehand in (b), and the active material was ejected explosively from the cell in (c). When the polymer cold plates next to the cell melted and opened in (d), a reaction of the water droplets with the hot lithium was likely, which fueled the cell fire with further combustible gases. The cell fire persisted in (e) until an extinguishing of the flame next to the opened cold plates was observed in (f). After the TR of the OC cell, no propagation and second TR were observed.

4.3.3. Impact of Polymer-Based Cold Plates as Thermal Barriers

Figure 15 shows the clamping device after the cell fire in experiment #6*c, the disassembled cell array with the central polymer mini-channel cold plate being attached to the overcharged and now burned-out cell, and the condition of the outer polymer mini-channel cold plate next to the overcharged cell. The overcharged cell had burned out violently, revealing a see-through of its core. The adjacent polymer MCHSs were partly molten and opened at several positions, so cooling water flooded the setup. No evidence of propagation of the TR towards the adjacent cell could be detected.
After the experiment, the vacuum of the adjacent pouch cell remained intact, and the cell maintained a steady voltage of 4.2 V during a 14-day observation period. In summary, implementing a mini-channel cold plate of 2 mm thickness as a thermal barrier next to a pouch cell, which is subject to an overcharge-induced TR, can have a significant effect on the prevention of TRP to the adjacent cell.

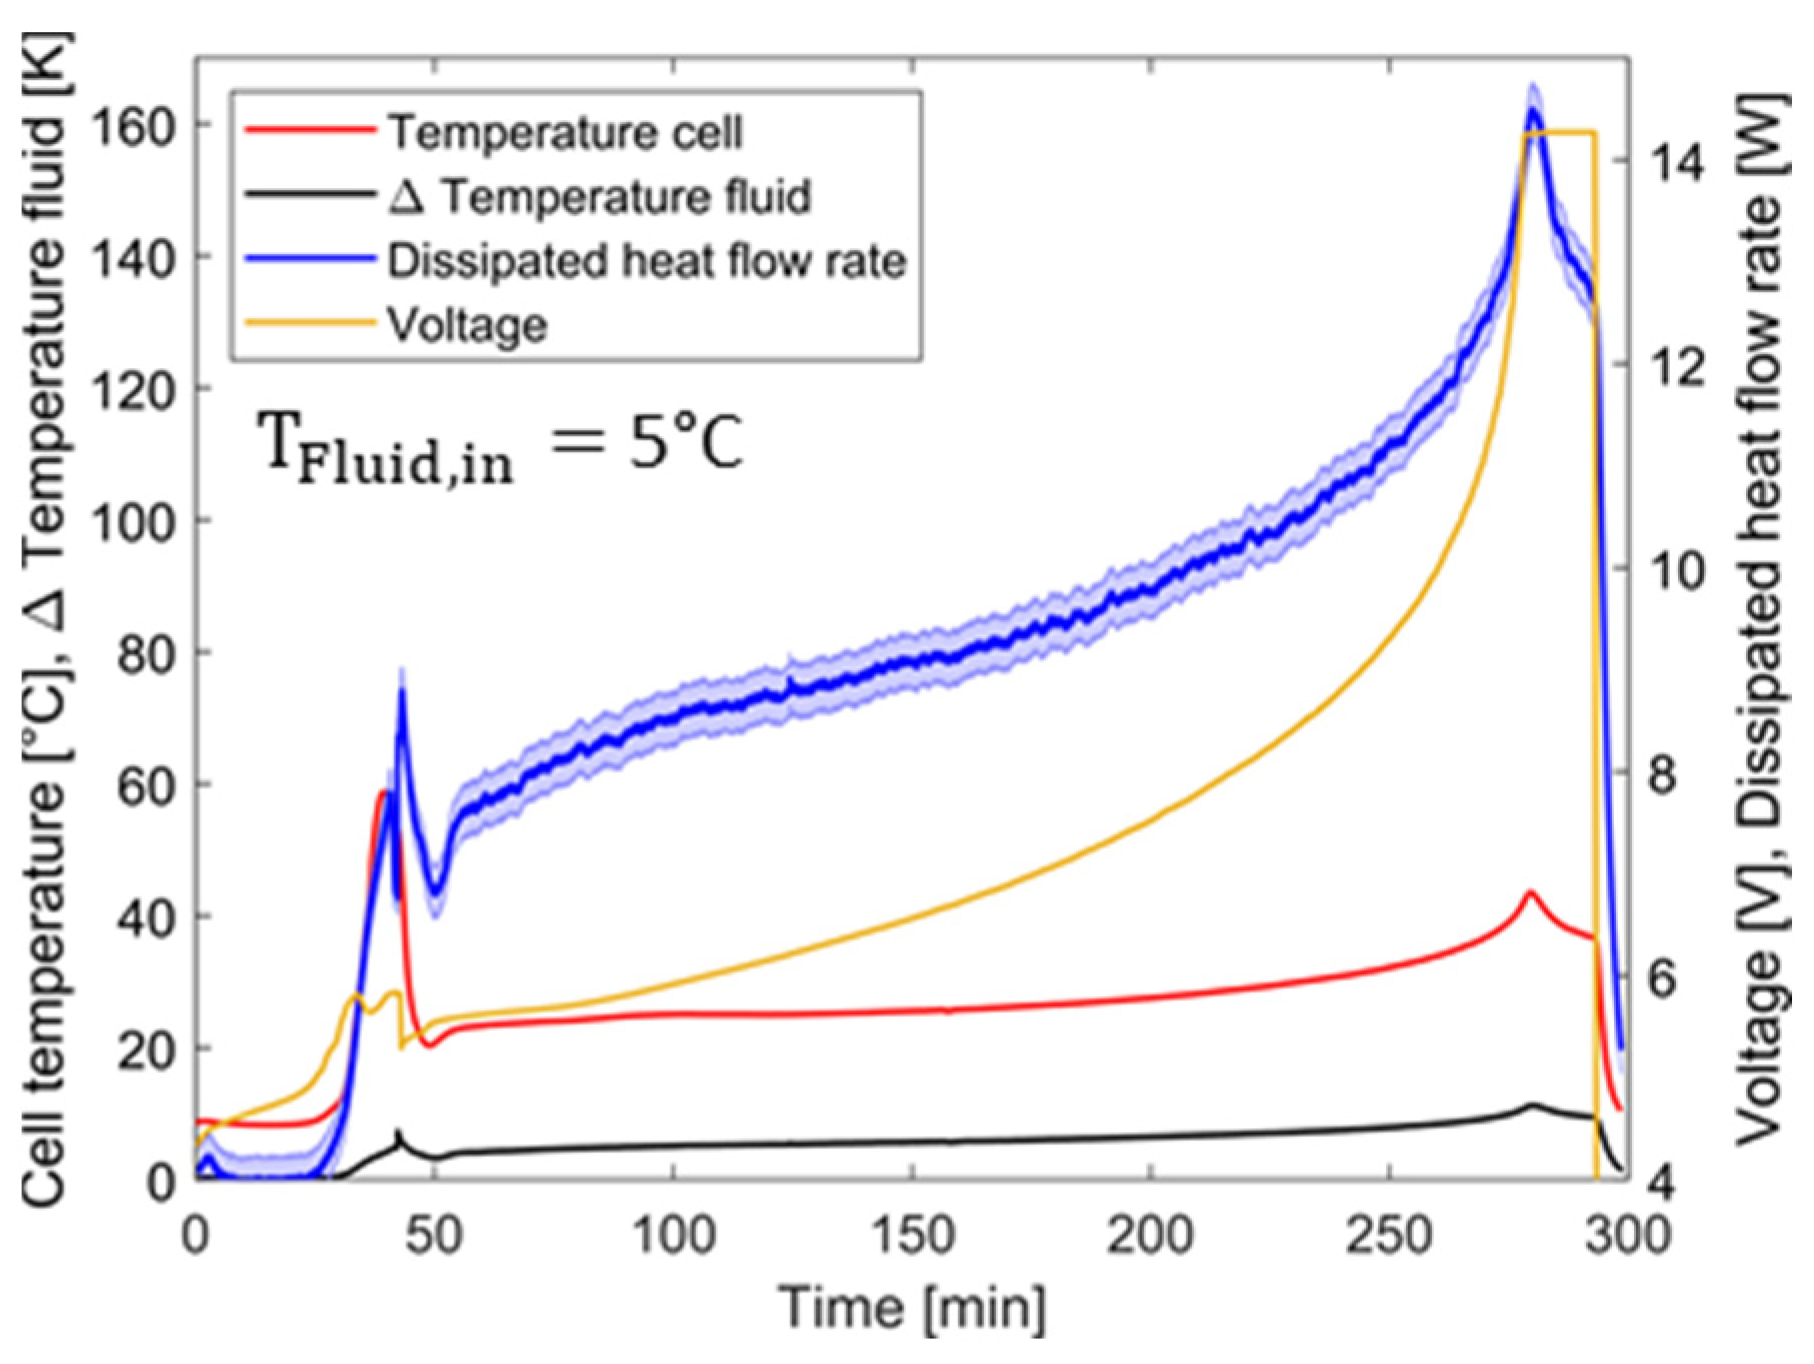
4.4. Performance of the MCHS

Implementing polymer mini-channel cold plates significantly impacted the overcharge-induced TR and TRP of the tested pouch cells, which warrants further investigations. For an evaluation of subsequent development stages of the cold plates and ongoing optimizations, the characteristics of the dissipated rate of heat flow are shown in Figure 16a,b regarding the low and medium fluid temperatures in experiments #2 and #3, respectively. These results are representative and applicable to the other experiments.
The mass flow was set to 2 g/s at the lowest fluid inlet temperature level and increased slightly at higher temperatures. Significant heat dissipation began analogously to the cell’s temperature increase during cell expansion from stage II of overcharging. A temporal peak of 60.9 ± 2.54 W and 51 ± 2.71 W was achieved at low and medium fluid temperatures, correspondingly. After the cell opening and first venting, the cell’s surface cooled down, and the dissipated heat flow reached a local minimum, which was more pronounced at higher fluid temperatures. As soon as the cell temperature rose again during stage IV of overcharging, the dissipated heat flow rate increased until the cell temperature leveled out. Here, dissipated rates of heat flow of 65 ± 2.58 W and 57 ± 2.74 W at low and medium fluid temperatures were obtained. Based on the uncertainties from Table 3 pertaining to the mass flow and temperature sensors, the heat flow is estimated to have uncertainties of 4–5%. Even with a calibration of the TCs, around 90% of the uncertainty originates from the fluid temperature measurement.
Incorporating not only the flow field but the entire contact surface between cells and cold plates for heat transfer (see Section 3.2), the maximum dissipated heat flux was calculated to be 2150 and 1900 W/m2 at low and medium fluid temperatures, respectively. At this point, a determination of the exact heat transfer coefficients at the wall–fluid interface does not seem appropriate based on the experimental results since it has been found that none of the generally applied ideal thermal boundary conditions are valid, and the characteristic length of the flow cross-section changes in the inlet and outlet regions.
Nevertheless, this first development stage of the polymer cold plates showed an adequate and satisfactory dissipation performance if heat fluxes in lithium-ion battery modules between 200 and 3000 W/m2 are assumed according to [3,26].

5. Conclusions

This study presents a novel combined thermal management and safety system for thin prismatic and pouch battery cells and tests its impact on delaying and preventing TR and TRP through experimentation. Such a system must solve an inevitable trade-off. On the one hand, it must successfully dissipate a sufficient heat flow rate during regular operation and the early stages of an impending TR to slow and delay its progress. On the other hand, in the event of a cell fire, it must serve as a thermal barrier to avoid irregular heating of adjacent cells to prevent TRP. The introduced combined thermal management and safety system consists of polymer mini-channel cold plates for application between battery cells.
The experimental setup in this study contained a cell array of two fully charged pouch cells with NMC chemistry, of which one cell was overcharged at 1 C to induce TR and TRP. In detail, three scenarios were distinguished: (1) no application of cold plates, (2) cold plate application between the cells at regular fluid inlet temperatures ranging from 5 to 30 °C, and (3) a cold plate application as before, but with a malfunction in the cooling system, resulting in a critically high fluid inlet temperature of 40 °C and an interruption of the fluid supply during overcharging.
In the first scenario, the TR and TRP occurred within one hour of overcharging in each experiment. Prior to the cell fire, a voltage noise indicated a cell expansion from an average SOC of 145%, and a pouch opening with first venting due to internal gas development was found at an average SOC of 172%. The time interval between both events averaged 16.2 min across nine experiments. After another 4.5 min, on average, at a SOC of 179%, but at a maximum after 12 min, the onset of TR and cell fire occurred. The sensed temperatures between the two cells exceeded 800 °C, and within less than one minute, the TR propagated to the adjacent cell.
In the second scenario, utilizing the cold plates as a combined thermal management and safety application at different fluid inlet temperatures of 5, 20, and 30 °C, overcharging the cell did not produce a TR and a subsequent TRP in the same time scale. Instead, a temporal shift in the characteristic process chain was observed. At low fluid temperatures, gas production and cell expansion commenced at a lower SOC of 138% than without thermal conditioning. Conversely, they began later at 148% with medium and high fluid temperatures. The gas production rate is directly correlated with the fluid inlet temperature level, subsequently affecting the time from the first expansion to the cell opening. On average, this process took 20 min at a low fluid temperature and approximately 14.5 min at medium and high levels.
Altogether, no significant impact of thermal conditioning was observed on the cell opening itself, which consistently occurred at SOCs ranging between 171% and 173% with and without thermal conditioning. Instead, with thermal conditioning, a significant temperature decrease at the cell’s surface was detectable after the pouch opening and first venting, which was not observable without thermal conditioning. Stage IV of overcharging between the pouch opening and a potential TR with cell fire was most affected by thermal conditioning. In the subsequent experimental runtime, the polymer cold plates dissipated an increasing rate of heat flow. This enabled a significant stabilization in the overcharged cell’s voltage and temperature, which was not detectable without thermal conditioning. Even 20 min after the cell opening, no thermal runaway had occurred. Additionally, there was no visual evidence indicating the initiation of the second venting, such as white vapor being released from the overcharged cell at this point of the overcharging experiment if the cells were thermally conditioned by the polymer cold plates between a 5–30 °C fluid temperature. After the overcharging procedure was terminated, the system managed to stabilize.
In the third scenario, a defective thermal management system was simulated with a critical fluid inlet temperature of 40 °C. A similar outcome to the second scenario was observed in the early overcharging stages. The period from initial cell expansion to pouch opening was reduced to 10.8 min, according to an increased gas production rate at elevated temperatures. Despite the critically high fluid temperature, the cell stabilized utterly after the overcharging procedure was terminated 12 min after the cell opening at a SOC of 185%. At this point, no visual indications of a second venting initiation were detected. If the fluid supply was halted at the same SOC, the overcharged cell heated up promptly, and then second venting and TR occurred approximately 10 and 11 min later at a SOC of 203%. Since the polymer cold plates served as an excellent thermal barrier, despite a violent cell fire that started from the overcharged cell in the assembly, the lateral temperatures of the adjacent cell just peaked momentarily at 100 °C, which did not result in a TRP. While the overcharged cell burned out entirely, the adjacent cell maintained a stable voltage and an intact vacuum within a fortnightly observation period.
In summary, the polymer mini-channel cold plates serve the requirements of a combined thermal management and safety application and effectively address the trade-off mentioned before. Despite the low thermal conductivity of the polymer, making use of extensive heat transfer surfaces, thermal conditioning and heat dissipation of the mini-channel cold plates are so intense that a significant delay of the overcharge-induced TR, especially in the form of prolongation of stage IV of overcharging, between the cell opening with first venting and TR with a cell fire, is observed. A heat flux of up to 2150 W/m2 is dissipated by the polymer cold plates, and the overcharged cells are stabilized so that no cell fire occurs within a time, leading to safe TR without thermal conditioning. In the event of TR and a cell fire, the polymer’s low thermal conductivity, typically considered a drawback, becomes beneficial since the cold plates serve as thermal barriers that protect the adjacent cells from excessive short-term heat generation during TR and prevent TRP.
The polymer-based mini-channel cold plates, next to their viability as a combined thermal management and safety application, are among the thinnest and lightest of their kind. They are robust and less expensive than comparable aluminum components, making them an appealing option for mobile applications. In the future, they should be further investigated as an alternative to conventional applications.

6. Outlook

Using the polymer cold plates within a battery system could extend the evacuation time during a hazardous situation inside a BEV. Numerous entry points regarding further investigations arise from the experimental study performed.
The experiments under thermal conditioning should be repeated to investigate the cell’s long-term behavior and stability during stage IV of overcharging. Online electrochemical mass spectrometry [113] is advised to acquire crucial insights into the effect of thermal conditioning on internal cell processes. According to Figure A3 in the Appendix A.2, a first long-term overcharging test at a low fluid temperature showed no TR for almost 300 min of overcharging. The pouch opened during the experiment with a first venting, but no white vapor and second venting were visually detected. A post-mortem examination revealed a completely dry cell without liquid electrolyte. A maximum heat flow of 162 ± 4.16 W was dissipated at a fluid temperature difference between the inlet and outlet of 11.2 K.
Further investigations should consider a higher quantity of cells in the experimental setup with a larger capacity situated in a more encapsulated environment to represent a mobile application-oriented scenario. Additionally, thermal and mechanical TR induction should be considered. The overcharging behavior of thicker cells should be studied comparatively. The focus should be on the internal temperature gradients and the TR risk potential at different cell thicknesses using the face-conditioning approach.
The investigation of the heat dissipation potential of the polymer cold plates during regular cycling or super-fast charging is advisable. In this context, a variation in the polymer material and the cooling channel geometry should be considered. If fluid mixing and boundary layer interruptions within the channel geometry can be intensified without disproportionately increasing the turbulence and pressure drop, a performance increase is expectable, compared to a flow field with straight channels [29]. Hybrid cooling approaches, such as the combination of face and tab cooling, should be evaluated, aiming for a high-temperature uniformity inside the cell volume at sufficiently high heat dissipation rates under a heavy load of the cells [23].
Nevertheless, it is imperative not to overlook the contradictory heat dissipation and protection requirements. Future work should explore material modifications, and the cold plate geometry should be redesigned to maintain the external temperature of the adjacent cells below 60 °C.
A month after the overcharging experiments, the thermally conditioned cells from experiments #1*–#4*c still posed a safety hazard since their voltages remained above the nominal upper limit of 4.2 V, and liquid electrolyte was discovered near the pouch opening, as shown in Figure A4 in the Appendix A.2. Their resistance was found to have raised by magnitudes, from 6–10 m Ω to 0.54–1.04 Ω , embodying substantial cell damage. Regular discharging failed, and alternative strategies must be considered in the context of recycling damaged cells. CCCV-discharging down to meager rates of 0.05 C allowed for greater discharge capacities but at the expense of longer discharging times.

Author Contributions

Conceptualization, H.-C.G., J.S., G.B. and F.B.; methodology, H.-C.G. and G.B.; software, H.-C.G. and G.B.; validation, H.-C.G.; formal analysis, H.-C.G. and G.B.; investigation, H.-C.G., G.B. and J.S.; resources, J.S., F.K. and F.B.; data curation, H.-C.G.; writing—original draft preparation, H.-C.G.; writing—review and editing, G.B., J.S., F.K. and F.B.; visualization, H.-C.G.; supervision, G.B., J.S. and F.B.; project administration, G.B. and F.B.; funding acquisition, G.B. and F.B. All authors have read and agreed to the published version of the manuscript.

Funding

Ministry of Science, Energy, Climate Protection, and Environment, Saxony-Anhalt, Germany.

Data Availability Statement

All data that justify and support the statements made in this article are included in the article.

Acknowledgments

Funding of parts of this work by the federal state of Saxony-Anhalt (Germany) is gratefully acknowledged. The authors thank the staff of IBK Heyrothsberge (Saxony-Anhalt, Germany) and C. Vogel particularly for their hospitality and support during the TR experiments. The authors would also like to thank P. Vorwerk, L. Bläubaum, L. Schmidt, A. Dlugosch, A. Weiß, and L. Block for discussions of diverse nature and ideas that have added value to this article. Further thanks to K. Amano, E. Gimadieva, and U. Krause for experiment-related support and to S. Thiele for support in preparing the experimental demonstrators. We acknowledge the support of Magdeburg University’s Open Access Publication Fund with the article processing charge.

Conflicts of Interest

The authors declare no conflict of interest.

Nomenclature

SymbolNameUnit
A Aream2
c Heat capacityJ/kg K
I CurrentA
k Thermal conductivityW/m K
l lengthm
m ˙ Mass flow ratekg/m3
t Times
T TemperatureK
q e l Electric chargeAh
Q HeatJ
Q ˙ Heat flow rateW
r Electric resistance Ω
U O C V Open circuit voltageV
V Electric voltageV

Subscripts

DCDirect current
effeffective
elelectric
Fluid,inFluid inlet
Fluid,outFluid outlet
iinternal
irrevirreversible
layer,jlayer number j
OCVOpen Circuit Voltage
revreversible
parallel
perpendicular

Abbreviation

Exp.Experimental
Ind.Induction
Max.Maximum
Num.Numerical
OCOvercharged
Std. dev.Standard deviation
Temp.Temperature

Acronyms

ABSAcrylonitrile butadiene styrene
CCConstant Current
CCCVConstant Current Constant Voltage
BEVBattery electric vehicle
BTMSBattery thermal management system
EISElectrochemical Impedance Spectroscopy
EUCAREuropean Council for Automotive Research & Development
FT-IRFourier Transform-Infrared Spectrometer
MCHSMini-channel heat sink or heat source
NMCNickel-Manganese-Cobalt
OVGUOtto-von-Guericke University
PCMPhase Change Material
SEISolid Electrolyte Interphase
SOCState of charge
TCsThermocouples
TIMThermal Interface Material
TPSTransient Plane Source
TRThermal runaway
TRPThermal runaway propagation

Appendix A

Appendix A.1. Equations

k e f f , = j = 1 n l l a y e r , j k l a y e r , j l t o t a l
k e f f , = l t o t a l j = 1 n l l a y e r , j k l a y e r , j

Appendix A.2. Figures and Tables

Figure A1. Simplified structure of a battery cell, the reduced stack, and the unit cell.
Batteries 10 00001 g0a1
Figure A2. (a) Temperature and voltage characteristics during TC positioning test; (b) magnification before TR.
Batteries 10 00001 g0a2
Table A1. Individual temporal characteristics during overcharging without thermal conditioning.
Exp.Ambient
Temp.
Non-Linear
Increase of Voltage/
Begin Stage II
Voltage Drop/
Begin Stage IV
TR/
Begin Stage V
Duration from
Voltage Increase
to Drop/
Stages II + III
Duration from Voltage Drop
to TR/
Stage IV
(°C)(V)Time
(min)
SOC
(%)
Upper
(V)
Lower
(V)
Diff.
(V)
Time
(min)
SOC
(%)
Time
(min)
SOC
(%)
Time (min)Time (min)
#184.8930.11507.226.051.1746.717849.718316.63.0
#2104.8927.81466.255.251.0043.717350.018315.96.3
#384.8526.11436.845.930.9143.817345.017517.71.2
#4104.9624.81418.336.911.4239.016540.516814.21.5
#5124.9126.41445.775.280.4942.517150.018316.17.5
#6114.8029.11496.836.230.6040.616841.717011.51.1
#7144.8629.21498.526.082.4445.217546.517816.01.3
#8104.8825.31426.515.690.8244.017350.318418.76.3
#974.7624.31406.175.430.7443.217255.219218.912.0
Figure A3. Long-term overcharging at 1 C at 5 °C fluid temperature and a mass flow of 3 g/s.
Batteries 10 00001 g0a3
Figure A4. Liquid electrolyte under the Kapton® tape near the pouch opening at the tabs.
Batteries 10 00001 g0a4

References

  1. Mallick, S.; Gayen, D. Thermal behaviour and thermal runaway propagation in lithium-ion battery systems—A critical review. J. Energy Storage 2023, 62, 106894. [Google Scholar] [CrossRef]
  2. Li, W.; Zhou, Y.; Zhang, H.; Tang, X. A Review on Battery Thermal Management for New Energy Vehicles. Energies 2023, 16, 4845. [Google Scholar] [CrossRef]
  3. Bandhauer, T.M.; Garimella, S.; Fuller, T.F. A Critical Review of Thermal Issues in Lithium-Ion Batteries. J. Electrochem. Soc. 2011, 158, R1. [Google Scholar] [CrossRef]
  4. Tomaszewska, A.; Chu, Z.; Feng, X.; O’Kane, S.; Liu, X.; Chen, J.; Ji, C.; Endler, E.; Li, R.; Liu, L.; et al. Lithium-ion battery fast charging: A review. eTransportation 2019, 1, 100011. [Google Scholar] [CrossRef]
  5. Newman, J.; Balsara, N.P. Electrochemical Systems, 4th ed.; Wiley: Hoboken, NJ, USA, 2021; ISBN 9781119514596. [Google Scholar]
  6. Gu, W.B.; Wang, C.Y. Thermal-Electrochemical Modeling of Battery Systems. J. Electrochem. Soc. 2000, 147, 2910. [Google Scholar] [CrossRef]
  7. Bernardi, D.; Pawlikowski, E.; Newman, J. A General Energy Balance for Battery Systems. J. Electrochem. Soc. 1985, 132, 5–12. [Google Scholar] [CrossRef]
  8. Heubner, C.; Schneider, M.; Lämmel, C.; Michaelis, A. Local Heat Generation in a Single Stack Lithium Ion Battery Cell. Electrochim. Acta 2015, 186, 404–412. [Google Scholar] [CrossRef]
  9. Hu, Y.; Choe, S.-Y.; Garrick, T.R. Measurement of heat generation rate and heat sources of pouch type Li-ion cells. Appl. Therm. Eng. 2021, 189, 116709. [Google Scholar] [CrossRef]
  10. Duan, J.; Tang, X.; Dai, H.; Yang, Y.; Wu, W.; Wei, X.; Huang, Y. Building Safe Lithium-Ion Batteries for Electric Vehicles: A Review. Electrochem. Energy Rev. 2020, 3, 1–42. [Google Scholar] [CrossRef]
  11. Kleiner, K.; Jakes, P.; Scharner, S.; Liebau, V.; Ehrenberg, H. Changes of the balancing between anode and cathode due to fatigue in commercial lithium-ion cells. J. Power Sources 2016, 317, 25–34. [Google Scholar] [CrossRef]
  12. Korthauer, R. Lithium-Ion Batteries: Basics and Applications; Springer: Berlin/Heidelberg, Germany, 2019; ISBN 9783662530719. [Google Scholar]
  13. Liu, J.; Huang, Z.; Sun, J.; Wang, Q. Heat generation and thermal runaway of lithium-ion battery induced by slight overcharging cycling. J. Power Sources 2022, 526, 231136. [Google Scholar] [CrossRef]
  14. Wang, Z.; Yuan, J.; Zhu, X.; Wang, H.; Huang, L.; Wang, Y.; Xu, S. Overcharge-to-thermal-runaway behavior and safety assessment of commercial lithium-ion cells with different cathode materials: A comparison study. J. Energy Chem. 2021, 55, 484–498. [Google Scholar] [CrossRef]
  15. Liu, B.; Jia, Y.; Yuan, C.; Wang, L.; Gao, X.; Yin, S.; Xu, J. Safety issues and mechanisms of lithium-ion battery cell upon mechanical abusive loading: A review. Energy Storage Mater. 2020, 24, 85–112. [Google Scholar] [CrossRef]
  16. Cai, T.; Valecha, P.; Tran, V.; Engle, B.; Stefanopoulou, A.; Siegel, J. Detection of Li-ion battery failure and venting with Carbon Dioxide sensors. eTransportation 2021, 7, 100100. [Google Scholar] [CrossRef]
  17. Wang, Q.; Ping, P.; Zhao, X.; Chu, G.; Sun, J.; Chen, C. Thermal runaway caused fire and explosion of lithium ion battery. J. Power Sources 2012, 208, 210–224. [Google Scholar] [CrossRef]
  18. Battery Pack Directed Venting System. Available online: https://patents.google.com/patent/US8557416B2/en (accessed on 12 November 2023).
  19. Vehicle Battery Pack Thermal Barrier. Available online: https://patents.google.com/patent/US8875828B2/en (accessed on 12 November 2023).
  20. Bai, Q.; Li, K.; Zan, J.; Liu, J.; Ou, J.; Liu, J. Influence of Insulation Material Thickness on Spread of Thermal Runaway in Battery Packs. Processes 2023, 11, 1321. [Google Scholar] [CrossRef]
  21. Arrhenius, S. XXXI. On the influence of carbonic acid in the air upon the temperature of the ground. Lond. Edinb. Dublin Philos. Mag. J. Sci. 1896, 41, 237–276. [Google Scholar] [CrossRef]
  22. Jalkanen, K.; Karppinen, J.; Skogström, L.; Laurila, T.; Nisula, M.; Vuorilehto, K. Cycle aging of commercial NMC/graphite pouch cells at different temperatures. Appl. Energy 2015, 154, 160–172. [Google Scholar] [CrossRef]
  23. Hunt, I.A.; Zhao, Y.; Patel, Y.; Offer, J. Surface Cooling Causes Accelerated Degradation Compared to Tab Cooling for Lithium-Ion Pouch Cells. J. Electrochem. Soc. 2016, 163, A1846–A1852. [Google Scholar] [CrossRef]
  24. Gungor, S.; Gocmen, S.; Cetkin, E. A review on battery thermal management strategies in lithium-ion and post-lithium batteries for electric vehicles. J. Therm. Eng. 2023, 9, 1078–1099. [Google Scholar] [CrossRef]
  25. Liu, J.; Chen, H.; Huang, S.; Jiao, Y.; Chen, M. Recent Progress and Prospects in Liquid Cooling Thermal Management System for Lithium-Ion Batteries. Batteries 2023, 9, 400. [Google Scholar] [CrossRef]
  26. Xia, G.; Cao, L.; Bi, G. A review on battery thermal management in electric vehicle application. J. Power Sources 2017, 367, 90–105. [Google Scholar] [CrossRef]
  27. Shahid, S.; Agelin-Chaab, M. A review of thermal runaway prevention and mitigation strategies for lithium-ion batteries. Energy Convers. Manag. X 2022, 16, 100310. [Google Scholar] [CrossRef]
  28. Kumar, A.; Kumar, A. Identification and Mitigation of Shortcomings in Direct and Indirect Liquid Cooling-Based Battery Thermal Management System. Energies 2023, 16, 3857. [Google Scholar] [CrossRef]
  29. Sarvar-Ardeh, S.; Rashidi, S.; Rafee, R.; Karimi, N. A review on the applications of micro-/mini-channels for battery thermal management. J. Therm. Anal. Calorim. 2023, 148, 7959–7979. [Google Scholar] [CrossRef]
  30. Wilke, S.; Schweitzer, B.; Khateeb, S.; Al-Hallaj, S. Preventing thermal runaway propagation in lithium ion battery packs using a phase change composite material: An experimental study. J. Power Sources 2017, 340, 51–59. [Google Scholar] [CrossRef]
  31. Jiaqiang, E.; Han, D.; Qiu, A.; Zhu, H.; Deng, Y.; Chen, J.; Zhao, X.; Zuo, W.; Wang, H.; Chen, J.; et al. Orthogonal experimental design of liquid-cooling structure on the cooling effect of a liquid-cooled battery thermal management system. Appl. Therm. Eng. 2018, 132, 508–520. [Google Scholar] [CrossRef]
  32. Tang, A.; Li, J.; Lou, L.; Shan, C.; Yuan, X. Optimization design and numerical study on water cooling structure for power lithium battery pack. Appl. Therm. Eng. 2019, 159, 113760. [Google Scholar] [CrossRef]
  33. Li, Q.; Shi, H.; Xie, G.; Xie, Z.; Liu, H. Parametric study and optimization on novel fork-type mini-channel network cooling plates for a Li-ion battery module under high discharge current rates. Int. J. Energy Res. 2021, 45, 17784–17804. [Google Scholar] [CrossRef]
  34. Yu, Y.; Huang, Z.; Mei, W.; Jia, Z.; Song, L.; Wang, Q. Preventing effect of different interstitial materials on thermal runaway propagation of large-format lithium iron phosphate battery module. J. Energy Storage 2023, 63, 107082. [Google Scholar] [CrossRef]
  35. Feng, X.; He, X.; Ouyang, M.; Lu, L.; Wu, P.; Kulp, C.; Prasser, S. Thermal runaway propagation model for designing a safer battery pack with 25 Ah LiNixCoyMnzO2 large format lithium ion battery. Appl. Energy 2015, 154, 74–91. [Google Scholar] [CrossRef]
  36. Tsao, C.-W.; DeVoe, D.L. Bonding of thermoplastic polymer microfluidics. Microfluid Nanofluid 2009, 6, 1–16. [Google Scholar] [CrossRef]
  37. Xu, Z.; Xu, J.; Guo, Z.; Wang, H.; Sun, Z.; Mei, X. Design and Optimization of a Novel Microchannel Battery Thermal Management System Based on Digital Twin. Energies 2022, 15, 1421. [Google Scholar] [CrossRef]
  38. Rui, X.; Feng, X.; Wang, H.; Yang, H.; Zhang, Y.; Wan, M.; Wei, Y.; Ouyang, M. Synergistic effect of insulation and liquid cooling on mitigating the thermal runaway propagation in lithium-ion battery module. Appl. Therm. Eng. 2021, 199, 117521. [Google Scholar] [CrossRef]
  39. Zhang, W.; Liang, Z.; Yin, X.; Ling, G. Avoiding thermal runaway propagation of lithium-ion battery modules by using hybrid phase change material and liquid cooling. Appl. Therm. Eng. 2021, 184, 116380. [Google Scholar] [CrossRef]
  40. Zhang, T.; Gao, Q.; Gu, Y.; Li, Y. Studies on thermal management of lithium-ion battery using non-metallic heat exchanger. Appl. Therm. Eng. 2021, 182, 116095. [Google Scholar] [CrossRef]
  41. Kshetrimayum, K.S.; Yoon, Y.-G.; Gye, H.-R.; Lee, C.-J. Preventing heat propagation and thermal runaway in electric vehicle battery modules using integrated PCM and micro-channel plate cooling system. Appl. Therm. Eng. 2019, 159, 113797. [Google Scholar] [CrossRef]
  42. Rao, Z.; Wang, Q.; Huang, C. Investigation of the thermal performance of phase change material/mini-channel coupled battery thermal management system. Appl. Energy 2016, 164, 659–669. [Google Scholar] [CrossRef]
  43. Ruiz, V.; Pfrang, A.; Kriston, A.; Omar, N.; van den Bossche, P.; Boon-Brett, L. A review of international abuse testing standards and regulations for lithium ion batteries in electric and hybrid electric vehicles. Renew. Sustain. Energy Rev. 2018, 81, 1427–1452. [Google Scholar] [CrossRef]
  44. Feng, X.; Zheng, S.; Ren, D.; He, X.; Wang, L.; Liu, X.; Li, M.; Ouyang, M. Key Characteristics for Thermal Runaway of Li-ion Batteries. Energy Procedia 2019, 158, 4684–4689. [Google Scholar] [CrossRef]
  45. Ren, D.; Feng, X.; Lu, L.; He, X.; Ouyang, M. Overcharge behaviors and failure mechanism of lithium-ion batteries under different test conditions. Appl. Energy 2019, 250, 323–332. [Google Scholar] [CrossRef]
  46. Essl, C.; Golubkov, A.W.; Fuchs, A. Comparing Different Thermal Runaway Triggers for Two Automotive Lithium-Ion Battery Cell Types. J. Electrochem. Soc. 2020, 167, 130542. [Google Scholar] [CrossRef]
  47. Larsson, F.; Mellander, B.-E. Abuse by External Heating, Overcharge and Short Circuiting of Commercial Lithium-Ion Battery Cells. J. Electrochem. Soc. 2014, 161, A1611–A1617. [Google Scholar] [CrossRef]
  48. Chen, Y. Recent advances of overcharge investigation of lithium-ion batteries. Ionics 2022, 28, 495–514. [Google Scholar] [CrossRef]
  49. Huang, L.; Zhang, Z.; Wang, Z.; Zhang, L.; Zhu, X.; Dorrell, D.D. Thermal runaway behavior during overcharge for large-format Lithium-ion batteries with different packaging patterns. J. Energy Storage 2019, 25, 100811. [Google Scholar] [CrossRef]
  50. Noh, H.-J.; Youn, S.; Yoon, C.S.; Sun, Y.-K. Comparison of the structural and electrochemical properties of layered Li[NixCoyMnz]O2 (x = 1/3, 0.5, 0.6, 0.7, 0.8 and 0.85) cathode material for lithium-ion batteries. J. Power Sources 2013, 233, 121–130. [Google Scholar] [CrossRef]
  51. Liu, Q.; Du, C.; Shen, B.; Zuo, P.; Cheng, X.; Ma, Y.; Yin, G.; Gao, Y. Understanding undesirable anode lithium plating issues in lithium-ion batteries. RSC Adv. 2016, 6, 88683–88700. [Google Scholar] [CrossRef]
  52. Broussely, M.; Biensan, P.; Bonhomme, F.; Blanchard, P.; Herreyre, S.; Nechev, K.; Staniewicz, R.J. Main aging mechanisms in Li ion batteries. J. Power Sources 2005, 146, 90–96. [Google Scholar] [CrossRef]
  53. Vetter, J.; Novák, P.; Wagner, M.R.; Veit, C.; Möller, K.-C.; Besenhard, J.O.; Winter, M.; Wohlfahrt-Mehrens, M.; Vogler, C.; Hammouche, A. Ageing mechanisms in lithium-ion batteries. J. Power Sources 2005, 147, 269–281. [Google Scholar] [CrossRef]
  54. Bugga, R.V.; Smart, M.C. Lithium Plating Behavior in Lithium-Ion Cells. ECS Trans. 2010, 25, 241–252. [Google Scholar] [CrossRef]
  55. Kim, C.-S.; Jeong, K.M.; Kim, K.; Yi, C.-W. Effects of Capacity Ratios between Anode and Cathode on Electrochemical Properties for Lithium Polymer Batteries. Electrochim. Acta 2015, 155, 431–436. [Google Scholar] [CrossRef]
  56. Arai, J.; Nakahigashi, R.; Sugiyama, T. Study on Cycle Life of Lithium-Ion Batteries Using in Situ7 li Solid-State Nuclear Magnetic Resonance. ECS Trans. 2015, MA2015-03, 449. [Google Scholar] [CrossRef]
  57. Grimsmann, F.; Brauchle, F.; Gerbert, T.; Gruhle, A.; Parisi, J.; Knipper, M. Impact of different aging mechanisms on the thickness change and the quick-charge capability of lithium-ion cells. J. Energy Storage 2017, 14, 158–162. [Google Scholar] [CrossRef]
  58. Petzl, M.; Kasper, M.; Danzer, M.A. Lithium plating in a commercial lithium-ion battery—A low-temperature aging study. J. Power Sources 2015, 275, 799–807. [Google Scholar] [CrossRef]
  59. Hossain, S.; Kim, Y.-K.; Saleh, Y.; Loutfy, R. Overcharge studies of carbon fiber composite-based lithium-ion cells. J. Power Sources 2006, 161, 640–647. [Google Scholar] [CrossRef]
  60. Purushothaman, B.K.; Landau, U. Rapid Charging of Lithium-Ion Batteries Using Pulsed Currents A Theoretical Analysis. J. Electrochem. Soc. 2006, 153, A533–A542. [Google Scholar] [CrossRef]
  61. Arora, P.; Doyle, M.; White, R.E. Mathematical Modeling of the Lithium Deposition Overcharge Reaction in Lithium-Ion Batteries Using Carbon-Based Negative Electrodes. J. Electrochem. Soc. 1999, 146, 3543–3553. [Google Scholar] [CrossRef]
  62. Burns, J.C.; Stevens, D.A.; Dahn, J.R. In-Situ Detection of Lithium Plating Using High Precision Coulometry. J. Electrochem. Soc. 2015, 162, A959–A964. [Google Scholar] [CrossRef]
  63. Aurbach, D. A short review of failure mechanisms of lithium metal and lithiated graphite anodes in liquid electrolyte solutions. Solid State Ion. 2002, 148, 405–416. [Google Scholar] [CrossRef]
  64. An, S.J.; Li, J.; Daniel, C.; Mohanty, D.; Nagpure, S.; Wood, D.L. The state of understanding of the lithium-ion-battery graphite solid electrolyte interphase (SEI) and its relationship to formation cycling. Carbon 2016, 105, 52–76. [Google Scholar] [CrossRef]
  65. Palacín, M.R. Understanding ageing in Li-ion batteries: A chemical issue. Chem. Soc. Rev. 2018, 47, 4924–4933. [Google Scholar] [CrossRef] [PubMed]
  66. Bhattacharyya, R.; Key, B.; Chen, H.; Best, A.S.; Hollenkamp, A.F.; Grey, C.P. In situ NMR observation of the formation of metallic lithium microstructures in lithium batteries. Nat. Mater. 2010, 9, 504–510. [Google Scholar] [CrossRef] [PubMed]
  67. Aurbach, D.; Zinigrad, E.; Teller, H.; Dan, P. Factors Which Limit the Cycle Life of Rechargeable Lithium (Metal) Batteries. J. Electrochem. Soc. 2000, 147, 1274. [Google Scholar] [CrossRef]
  68. Streich, D.; Guéguen, A.; Mendez, M.; Chesneau, F.; Novák, P.; Berg, E.J. Online Electrochemical Mass Spectrometry of High Energy Lithium Nickel Cobalt Manganese Oxide/Graphite Half- and Full-Cells with Ethylene Carbonate and Fluoroethylene Carbonate Based Electrolytes. J. Electrochem. Soc. 2016, 163, A964–A970. [Google Scholar] [CrossRef]
  69. Liu, Q.Q.; Xiong, D.J.; Petibon, R.; Du, C.Y.; Dahn, J.R. Gas Evolution during Unwanted Lithium Plating in Li-Ion Cells with EC-Based or EC-Free Electrolytes. J. Electrochem. Soc. 2016, 163, A3010–A3015. [Google Scholar] [CrossRef]
  70. Feng, X.; Fang, M.; He, X.; Ouyang, M.; Lu, L.; Wang, H.; Zhang, M. Thermal runaway features of large format prismatic lithium ion battery using extended volume accelerating rate calorimetry. J. Power Sources 2014, 255, 294–301. [Google Scholar] [CrossRef]
  71. Fleischhammer, M.; Waldmann, T.; Bisle, G.; Hogg, B.-I.; Wohlfahrt-Mehrens, M. Interaction of cyclic ageing at high-rate and low temperatures and safety in lithium-ion batteries. J. Power Sources 2015, 274, 432–439. [Google Scholar] [CrossRef]
  72. Yuan, Q.; Zhao, F.; Wang, W.; Zhao, Y.; Liang, Z.; Yan, D. Overcharge failure investigation of lithium-ion batteries. Electrochim. Acta 2015, 178, 682–688. [Google Scholar] [CrossRef]
  73. Zhu, X.; Wang, Z.; Wang, Y.; Wang, H.; Wang, C.; Tong, L.; Yi, M. Overcharge investigation of large format lithium-ion pouch cells with Li(Ni0.6Co0.2Mn0.2)O2 cathode for electric vehicles: Thermal runaway features and safety management method. Energy 2019, 169, 868–880. [Google Scholar] [CrossRef]
  74. Hestenes, J.C.; Sadowski, J.T.; May, R.; Marbella, L.E. Transition Metal Dissolution Mechanisms and Impacts on Electronic Conductivity in Composite LiNi0.5Mn1.5O4 Cathode Films. ACS Mater. Au 2023, 3, 88–101. [Google Scholar] [CrossRef]
  75. Yamaki, J.-I.; Tobishima, S.-I. Rechargeable lithium anodes. In Handbook of Battery Materials; Daniel, C., Besenhard, J.O., Besenhard, J.O., Eds.; Wiley: Weinheim, Germany, 2012; pp. 377–404. ISBN 9783527326952. [Google Scholar]
  76. Gireaud, L.; Grugeon, S.; Laruelle, S.; Yrieix, B.; Tarascon, J.-M. Lithium metal stripping/plating mechanisms studies: A metallurgical approach. Electrochem. Commun. 2006, 8, 1639–1649. [Google Scholar] [CrossRef]
  77. Aurbach, D.; Cohen, Y. Morphological Studies of Li Deposition Processes in LiAsF6/PC Solutions by In Situ Atomic Force Microscopy. J. Electrochem. Soc. 1997, 144, 3355–3360. [Google Scholar] [CrossRef]
  78. Ohsaki, T.; Kishi, T.; Kuboki, T.; Takami, N.; Shimura, N.; Sato, Y.; Sekino, M.; Satoh, A. Overcharge reaction of lithium-ion batteries. J. Power Sources 2005, 146, 97–100. [Google Scholar] [CrossRef]
  79. Nowak, S.; Winter, M. Review—Chemical Analysis for a Better Understanding of Aging and Degradation Mechanisms of Non-Aqueous Electrolytes for Lithium Ion Batteries: Method Development, Application and Lessons Learned. J. Electrochem. Soc. 2015, 162, A2500–A2508. [Google Scholar] [CrossRef]
  80. Chen, S.; Wang, Z.; Yan, W. Identification and characteristic analysis of powder ejected from a lithium ion battery during thermal runaway at elevated temperatures. J. Hazard. Mater. 2020, 400, 123169. [Google Scholar] [CrossRef] [PubMed]
  81. Wang, S.; Rafiz, K.; Liu, J.; Jin, Y.; Lin, J.Y.S. Effects of lithium dendrites on thermal runaway and gassing of LiFePO4 batteries. Sustain. Energy Fuels 2020, 4, 2342–2351. [Google Scholar] [CrossRef]
  82. Feng, X.; Ouyang, M.; Liu, X.; Lu, L.; Xia, Y.; He, X. Thermal runaway mechanism of lithium ion battery for electric vehicles: A review. Energy Storage Mater. 2018, 10, 246–267. [Google Scholar] [CrossRef]
  83. Jiang, L.; Luo, Z.; Wu, T.; Shao, L.; Sun, J.; Liu, C.; Li, G.; Cao, K.; Wang, Q. Overcharge Behavior and Early Warning Analysis of LiNi0.5Co0.2Mn0.3O2/C Lithium-Ion Battery with High Capacity. J. Electrochem. Soc. 2019, 166, A1055–A1062. [Google Scholar] [CrossRef]
  84. Feng, X.; He, X.; Ouyang, M.; Wang, L.; Lu, L.; Ren, D.; Santhanagopalan, S. A Coupled Electrochemical-Thermal Failure Model for Predicting the Thermal Runaway Behavior of Lithium-Ion Batteries. J. Electrochem. Soc. 2018, 165, A3748–A3765. [Google Scholar] [CrossRef]
  85. Richter, F.; Kjelstrup, S.; Vie, P.J.; Burheim, O.S. Thermal conductivity and internal temperature profiles of Li-ion secondary batteries. J. Power Sources 2017, 359, 592–600. [Google Scholar] [CrossRef]
  86. Oehler, D.; Bender, J.; Seegert, P.; Wetzel, T. Investigation of the Effective Thermal Conductivity of Cell Stacks of Li-Ion Batteries. Energy Technol. 2021, 9, 2000722. [Google Scholar] [CrossRef]
  87. Wassiliadis, N.; Steinsträter, M.; Schreiber, M.; Rosner, P.; Nicoletti, L.; Schmid, F.; Ank, M.; Teichert, O.; Wildfeuer, L.; Schneider, J.; et al. Quantifying the state of the art of electric powertrains in battery electric vehicles: Range, efficiency, and lifetime from component to system level of the Volkswagen ID.3. eTransportation 2022, 12, 100167. [Google Scholar] [CrossRef]
  88. Kurmaev, R.K.; Struchkov, V.S.; Novak, V.V. Experience in the development of an effective thermal management system for the high-voltage battery of the vehicle. IOP Conf. Ser. Mater. Sci. Eng. 2020, 819, 12020. [Google Scholar] [CrossRef]
  89. Parrish, R.; Elankumaran, K.; Gandhi, M.; Nance, B.; Meehan, P.; Milburn, D.; Siddiqui, S.; Brenz, A. Voltec Battery Design and Manufacturing. In Proceedings of the SAE 2011 World Congress & Exhibition, Detroit, MI, USA, 12–14 April 2011; SAE Technical Paper. SAE International: Warrendale, PA, USA, 2011. [Google Scholar] [CrossRef]
  90. Schmidt, A.; Oehler, D.; Weber, A.; Wetzel, T.; Ivers-Tiffée, E. A multi scale multi domain model for large format lithium-ion batteries. Electrochim. Acta 2021, 393, 139046. [Google Scholar] [CrossRef]
  91. Darcovich, K.; MacNeil, D.D.; Recoskie, S.; Cadic, Q.; Ilinca, F. Comparison of cooling plate configurations for automotive battery pack thermal management. Appl. Therm. Eng. 2019, 155, 185–195. [Google Scholar] [CrossRef]
  92. Loges, A.; Herberger, S.; Seegert, P.; Wetzel, T. A study on specific heat capacities of Li-ion cell components and their influence on thermal management. J. Power Sources 2016, 336, 341–350. [Google Scholar] [CrossRef]
  93. Paarmann, S.; Schuld, K.; Wetzel, T. Inhomogeneous Aging in Lithium-Ion Batteries Caused by Temperature Effects. Energy Technol. 2022, 10, 2200384. [Google Scholar] [CrossRef]
  94. Werner, D.; Paarmann, S.; Wiebelt, A.; Wetzel, T. Inhomogeneous Temperature Distribution Affecting the Cyclic Aging of Li-Ion Cells. Part II: Analysis and Correlation. Batteries 2020, 6, 12. [Google Scholar] [CrossRef]
  95. Kong, L.; Aalund, R.; Alipour, M.; Stoliarov, S.I.; Pecht, M. Evaluating the Manufacturing Quality of Lithium Ion Pouch Batteries. J. Electrochem. Soc. 2022, 169, 40541. [Google Scholar] [CrossRef]
  96. IEC 62620; Secondary Cells and Batteries Containing Alkaline or Other Non-Acid Electrolytes—Secondary Lithium Cells and Batteries for Use in Industrial Applications. International Electrotechnical Commission (IEC): Geneva, Switzerland, 2014.
  97. Onda, K.; Kameyama, H.; Hanamoto, T.; Ito, K. Experimental Study on Heat Generation Behavior of Small Lithium-Ion Secondary Batteries. J. Electrochem. Soc. 2003, 150, A285. [Google Scholar] [CrossRef]
  98. Abdul-Quadir, Y.; Laurila, T.; Karppinen, J.; Jalkanen, K.; Vuorilehto, K.; Skogström, L.; Paulasto-Kröckel, M. Heat generation in high power prismatic Li-ion battery cell with LiMnNiCoO2 cathode material. Int. J. Energy Res. 2014, 38, 1424–1437. [Google Scholar] [CrossRef]
  99. Alihosseini, Y.; Zabetian Targhi, M.; Heyhat, M.M.; Ghorbani, N. Effect of a micro heat sink geometric design on thermo-hydraulic performance: A review. Appl. Therm. Eng. 2020, 170, 114974. [Google Scholar] [CrossRef]
  100. Liu, H.; Li, P. Even distribution/dividing of single-phase fluids by symmetric bifurcation of flow channels. Int. J. Heat Fluid Flow 2013, 40, 165–179. [Google Scholar] [CrossRef]
  101. Li, P.; Coopamah, D.; Ki, J.-P. Uniform distribution of species in fuel cells using a multiple flow bifurcation design. In Proceedings of the ASME 2008 6th International Conference on Fuel Cell Science, Engineering and Technology, Denver, CO, USA, 16–18 June 2008; pp. 897–902. [Google Scholar] [CrossRef]
  102. Kandlikar, S.G.; Grande, W.J. Evolution of Microchannel Flow Passages—Thermohydraulic Performance and Fabrication Technology. Heat Transf. Eng. 2003, 24, 3–17. [Google Scholar] [CrossRef]
  103. López Bonilla, J.; Fond, B.; Graichen, H.; Hamann, J.; Beyrau, F.; Boye, G. Thermal characterization of high-performance battery cells during charging and discharging using optical temperature measurement methods. In Proceedings of the FISITA World Congress 2021—Technical Programme, Prague, Czech Republic, 13–17 September 2021; ISBN 9781916025929. [Google Scholar]
  104. Graichen, H.-C.; Sauerhering, J.; Stamann, O.; Beyrau, F.; Boye, G. Influence of Adhesive Tapes as Thermal Interface Materials on the Thermal Load of a Compact Electrical Machine. WEVJ 2022, 13, 42. [Google Scholar] [CrossRef]
  105. Graichen, H.-C.; Sauerhering, J.; Reuber, F.; Dlugosch, A.; Beyrau, F.; Chinni, M.; Boye, G. Advanced thermal management optimization of a liquid cooled compact electrical engine with air gap winding. In Proceedings of the FISITA World Congress 2021—Technical Programme, Prague, Czech Republic, 13–17 September 2021; ISBN 9781916025929. [Google Scholar]
  106. Feng, X.; Ren, D.; He, X.; Ouyang, M. Mitigating Thermal Runaway of Lithium-Ion Batteries. Joule 2020, 4, 743–770. [Google Scholar] [CrossRef]
  107. Vorwerk, P.; Hahn, S.-K.; Daniel, C.; Krause, U.; Keutel, K. Detection of Critical Conditions in Pouch Cells Based on Their Expansion Behavior. Batteries 2022, 8, 42. [Google Scholar] [CrossRef]
  108. Liu, P.; Yang, L.; Xiao, B.; Wang, H.; Li, L.; Ye, S.; Li, Y.; Ren, X.; Ouyang, X.; Hu, J.; et al. Revealing Lithium Battery Gas Generation for Safer Practical Applications. Adv. Funct. Mater. 2022, 32, 2208586. [Google Scholar] [CrossRef]
  109. Lin, H.; Chua, D.; Salomon, M.; Shiao, H.-C.; Hendrickson, M.; Plichta, E.; Slane, S. Low-Temperature Behavior of Li-Ion Cells. Electrochem. Solid-State Lett. 2001, 4, A71. [Google Scholar] [CrossRef]
  110. Huang, C.-K.; Sakamoto, J.S.; Wolfenstine, J.; Surampudi, S. The Limits of Low-Temperature Performance of Li-Ion Cells. J. Electrochem. Soc. 2000, 147, 2893. [Google Scholar] [CrossRef]
  111. Yaqub, A.; Lee, Y.-J.; Hwang, M.J.; Pervez, S.A.; Farooq, U.; Choi, J.-H.; Kim, D.; Choi, H.-Y.; Cho, S.-B.; Doh, C.-H. Low temperature performance of graphite and LiNi0.6Co0.2Mn0.2O2 electrodes in Li-ion batteries. J. Mater. Sci. 2014, 49, 7707–7714. [Google Scholar] [CrossRef]
  112. Li, J.; Yuan, C.F.; Guo, Z.H.; Zhang, Z.A.; Lai, Y.Q.; Liu, J. Limiting factors for low-temperature performance of electrolytes in LiFePO4/Li and graphite/Li half cells. Electrochim. Acta 2012, 59, 69–74. [Google Scholar] [CrossRef]
  113. Misiewicz, C.; Lundström, R.; Ahmed, I.; Lacey, M.J.; Brant, W.R.; Berg, E.J. Online electrochemical mass spectrometry on large-format Li-ion cells. J. Power Sources 2023, 554, 232318. [Google Scholar] [CrossRef]
Figure 1. Potential classification of BTMS.
Batteries 10 00001 g001
Figure 2. NMC pouch cell of 12.5 Ah capacity, CTS-S7688190.
Batteries 10 00001 g002
Figure 3. (a) Discharging voltage response at different C-rates; (b) internal resistance according to DIN 62620.
Batteries 10 00001 g003
Figure 4. (a) CAD sketch of the mini-channel cold plate (b) experimental demonstrator.
Batteries 10 00001 g004
Figure 5. CAD schematic and realization of the experimental setup.
Batteries 10 00001 g005
Figure 6. Distribution of TCs (a) setup without thermal conditioning; (b) setup with MCHS conditioning.
Batteries 10 00001 g006
Figure 7. Schematic representation of the experimental setup in the fire and control rooms.
Batteries 10 00001 g007
Figure 8. (a) Characteristic changes in temperature and voltage in experiment #1; (b) magnification before cell fire.
Batteries 10 00001 g008
Figure 9. Characteristic processes shortly before and during cell fire: (a) Second venting with white vapor emerging from the tabs; (b) intensified gas release at various openings; (c) active material release with the appearance of black smoke; (d) ignition of flammable components; (e) explosive particle discharge; and (f) cell fire.
Batteries 10 00001 g009
Figure 10. Characteristic changes in cell temperature, voltage, and clamping force during overcharging. Data revisualized with permission from [107].
Batteries 10 00001 g010
Figure 11. Characteristic changes in temperature and voltage during overcharging with face conditioning at fluid inlet temperatures in experiments #2*, #3*, and #4*: (a) Low at 5 °C; (b) medium at 20 °C; and (c) high at 30 °C.
Batteries 10 00001 g011
Figure 12. Comparison of thermally conditioned experiments #1*, #3*, and #4* at different fluid temperatures, along with unconditioned experiments #1 and #9: (a) Changes in voltage and (b) laterally measured OC cell temperature.
Batteries 10 00001 g012
Figure 13. Characteristic changes in temperature and voltage during overcharging with malfunctioning thermal management: (a) Power supply switched off at 185% SOC; (b) fluid supply switched off at 185% SOC.
Batteries 10 00001 g013
Figure 14. Characteristics of the cell fire with implemented MCHS: (a) Second venting with white vapor begins at the tabs; (b) intensified release and ignition of gaseous electrolyte; (c) explosive ejection of active material; (d) reaction between lithium and cooling water; (e) cell fire; and (f) extinguishing of flame by cooling water.
Batteries 10 00001 g014
Figure 15. Experimental setup (#6*c) with polymer mini-channel cold plates after TR and cell fire of the overcharged cell.
Batteries 10 00001 g015
Figure 16. Dissipated heat flow during overcharging at different fluid inlet temperatures: (a) Low at 5 °C; (b) medium at 20 °C.
Batteries 10 00001 g016
Table 1. Collection of combined thermal management and safety approaches.
Source/
Year
Type of
Examination
Type of Cell/
Configuration
Type of BTMSFindings
[37]/
2022
Num./exp.,
Cycling/cooling
Pouch, 10 Ah/
module
Direct cooling by immersion, ABS micro-channel plates as flow separator/
turbulator between cells
Micro-channel plate improves cooling
performance in narrow space by reducing
the temperature gradient in the system
[38]/
2021
Num./exp.,
TR ind./cooling
Prismatic, 37 Ah/
module
Indirect bottom cooling by aluminum mini-channel cold plate and insulation by aerogel layers between cellsSingular liquid cooling or insulation fails to mitigate TRP; coupling of cooling and
insulating with 1 mm layers avoids TRP
[39]/
2021
Num./exp.,
Cycling and TR ind./cooling
Prismatic, 25 Ah/
array of two cells
Indirect cooling aluminum plate-fin and fluid cooling channels, embedded in PCM layer between cellsCycling: coupled cooling results in more uniform temperatures than singular techniques;
TRP: induction by overheating only prevented by coupled cooling, not by singular techniques; PCM of high thermal conductivity lowers system temperature but increases TRP probability
[40]/
2021
Num./exp.,
Cycling/cooling
18650 Cylindrical,
Unknown cell capacity/ 50 Ah pack
Indirect cooling by polymer macro-channel tubes,
connected at one side with the cells
Heat dissipation requirements met at low
discharge rates; <5 °C temperature gradient in the system up to 2 C
[41]/
2019
Num.,
TR ind./cooling
18650 Cylindrical,
1.5 Ah/
module
Indirect cooling by aluminum micro-channel cold plates embedded in a PCM matrix between battery rowsTRP induced by nail penetration is prevented by coupled cooling, not by singular techniques
[42]/
2016
Num.,
Cycling/cooling
Prismatic, unknown capacity/
Module
Indirect cooling by aluminum mini-channel tubes coupled into PCM layer
between cells
Coupled cooling lowers maximum
temperatures; decreasing temperatures with rising thermal conductivity of the PCM
Table 2. Pouch cell properties.
ParameterValue
Voltage limits (V)3–4.2
Nominal capacity (Ah)12.5
Weight (g)260 ± 15
Energy density (Wh/kg)173
Max. charge/discharge current1 C
Operating temperatures (°C)0~50
Width/Length/Thickness (mm)88/192/7.6
Internal   resistance   ( m Ω )
@ 1 kHz and 50% SOC
3.5
Cycle stability (-)2000
Table 3. Technical details of the experimental equipment.
DeviceModelComment
Power SupplyDelta Elektronika SM15–200 DRange: 0–15 V, 0–200 A
Refrigeration thermostatHuber Ministat 240Range: −45–200 °C; Cooling power 550 W @ 0 °C
High-speed cameraPhotron Fastcam Mini UX1001.280 × 1024 pixels, 250 fps frame rate
SensorsModelRangeMax. uncertainty
TemperatureSheath TC Type K, 1 m × 1 mmUp to 1300 °C short-termAfter calibration: ±0.2 K
Mass flowKrohne Optimass 6400 C0–450 kg/h±0.05% of the value
PressureYokogawa EJX110A5–1000 mbar±0.04% of the value
VoltageVoltcraft VC 950 Datalogger0.001 mV–1000 V±0.03% of the value
Data acquisition system
Rack: NI cDAQ-9174; Modules: NI-9203 Current Input, NI-9213 Thermocouple
Table 4. Experimentally tested overcharging scenarios.
Test ScenarioExperiment NumberFluid Inlet Temperature (°C)Comment
Overcharging, no thermal conditioning#1–9-Base reference
Overcharging, thermal conditioning with MCHS#1*–4*5, 20, 30Regular cooling
Overcharging, malfunctioning thermal conditioning with MCHS at critical conditions#5*c40Interruption of overcharging
#6*c40Interruption of conditioning
Table 5. Average temporal characteristics of the first scenario without thermal conditioning.
Exp.
#1–9
Non-Linear
Increase of Voltage/
Begin Stage II
Voltage Drop/
Begin Stage IV
TR/
Begin Stage V
Duration from Voltage Increase to Drop/
Stages II + III
Duration from
Voltage Drop to TR/
Stage IV
(V)Time
(min)
SOC
(%)
Upper
(V)
Lower
(V)
Diff.
(V)
Time
(min)
SOC
(%)
Time
(min)
SOC
(%)
Time (min)Time (min)
Mean4.8727.01456.945.871.0743.217247.717916.24.5
Std. Dev.0.062.030.890.500.552.244.472.33.6
Table 6. Temporal characteristics of the second scenario with thermal conditioning.
Exp.Fluid
Inlet
Temp.
Starting
Temp.
of Cell
Non-Linear Increase
of Voltage/
Begin Stage II
Voltage Drop/
Begin Stage IV
Duration from Voltage Increase to Drop/
Stage II + III
Max. Temp.
OC Cell
(°C)(°C)(V)Time
(min)
SOC
(%)
Upper
(V)
Lower
(V)
Diff.
(V)
Time
(min)
SOC
(%)
Time
(min)
(°C)
#1*594.9123.71395.835.300.5342.917219.259
#2*564.7522.71385.795.450.3443.717320.955
#3*20174.7628.61485.525.050.4743.017214.547
#4*30254.7328.21485.674.820.8542.817114.748
Table 7. Temporal characteristics of the third scenario with malfunctioning thermal conditioning.
Exp.Fluid
Inlet
Temp.
Starting
Temp.
of Cell
Non-Linear Increase
of Voltage/
Begin Stage II
Voltage Drop/
Begin Stage IV
Duration from Voltage Increase to Drop/
Stage II + III
Max. Temp.
OC Cell
(°C)(°C)(V)Time
(min)
SOC
(%)
Upper
(V)
Lower
(V)
Diff.
(V)
Time
(min)
SOC
(%)
Time
(min)
(°C)
#5*c40334.7728.61485.694.870.8239.216510.662
#6*c40345.0133.91565.995.020.9744.017310.159
Disclaimer/Publisher’s Note: The statements, opinions and data contained in all publications are solely those of the individual author(s) and contributor(s) and not of MDPI and/or the editor(s). MDPI and/or the editor(s) disclaim responsibility for any injury to people or property resulting from any ideas, methods, instructions or products referred to in the content.

