1. Introduction
Productivity and crop growth are directly related to leaf area (LA). Therefore, accurate and prompt determination of this parameter is of great importance. Radiation and photosynthetic efficiency, crop transpiration, crop water use, and nutrient use are some of the processes impacted by the LA of a crop [
1,
2].
The implementation of tools for measuring and estimating crop LA has long been a concern for researchers. There are currently several approaches for LA determination, which include direct and indirect methods. Direct methods include planimetric or gravimetric analyses of leaves, harvested directly or indirectly [
3,
4]. Portable scanning planimeters (e.g., LI-3000, Licor, NE, USA) are often used as a reference method for obtaining the LA. Direct methods are more accurate but have the disadvantages of being very time-consuming, not user-friendly, and having constraints regarding equipment acquisition, price, and operation [
4]. Moreover, direct methods can be destructive, not allowing successive measurements of LA [
5].
One of the most frequently used indirect methods for LA estimation is based on observations and measurements of allometric parameters of the plants, which are used as inputs in mathematical models [
6]. Such mathematical models are based on the correlation between the allometric measures of plants and the area of the leaves. These methods are non-destructive and allow for faster LA determination, eventually being suitable for automation. Nevertheless, an adequate parameterization and calibration of such methods is necessary. Stereo and time-of-flight image combination [
7] and light curtain arrays [
8] have been used for non-destructive automatic leaf area measurements. Despite promising results in experimental conditions, the costs and operability of these approaches are, for now, still unknown.
Considering the advantages of indirect methods, they are now assuming a particular relevance when compared with direct methods [
4]. In 1911, scientists suggested for the first time estimating plant LA through its relation with allometric leaf measurements, using the width and length of the leaf [
9]. Since then, this method has been applied to different crops such as tomatoes and cucumbers [
10], grapevines [
11], peppers [
12], and soybeans [
13], as well as to fruit trees, such as hazelnut [
14], and to ornamental crops such as anthurium [
15], begonia [
16], and cut roses [
1,
5]. According to Zhang and Liu [
16], this indirect and non-destructive approach can provide precise and in situ LA estimations.
Several models are currently available for rose crop to determine the area of individual leaves [
1,
17,
18], leaflets [
5], and stems [
19] using allometric measures such as the length and width of leaves or leaflets, the number of leaflets, or the height of the stem. However, despite the economic importance of the rose as a major ornamental crop [
1,
5], these methods for estimating LA still have several limitations. For example, not all models that have been developed take into account the diversity of existing genotypes [
17,
19]. The limitations also extend to the architecture of the plant, with some models being developed using material exclusively from erect stems, disregarding samples resulting from the bending of weak stems of the plant [
1,
19]. Additionally, most models only consider a phenological stage, usually harvest, which limits its use along the cultural cycle of the crop and consequently the continuous monitoring of crop growth and leaf expansion.
Consequently, LA measurements along the crop cultural cycle are often not possible, although they have been empirically simulated in complex crop-specific growth models when available [
20]. Most of the models described in the literature are based on allometric measurements of compound leaves. However, this methodology, while allowing non-destructive LA estimation, can become time-consuming depending on the number of leaves whose area has to be determined.
In this context, the goal of this study was to develop a non-destructive and expeditious method and mathematical model for estimating LA in the cut rose cv. “Red Naomi” at different phenological stages. The specific goals included (i) the development of an estimation methodology based on morphological descriptors of the stems and biometric measurements of the leaves using image processing; and (ii) the development of a dynamic mathematical model that estimates the LA of the crop stems throughout the cultural cycle of the rose.
2. Materials and Methods
2.1. Study Area
This case study was carried out in a commercial glass “Venlo” greenhouse of the company Floralves, located in the Vila do Conde (41°19′40.8″N 8°42′17.4″W), in the North of Portugal. The greenhouse has a North–South orientation and an area of approximately 1 ha.
The greenhouse is exclusively occupied by the production of cut roses (Rosa hybrida L.) grown in a substrate cultivation system (coir). The cultivar “Red Naomi,” which occupies about 30% of the greenhouse area, was used for the case study. The plants used in this study were transplanted in 2011 with a density of eight plants per m2.
The culture was irrigated by a closed drip system with a standard nutrient solution for cut roses.
The irrigation water was reused after disinfection with ultraviolet light. The limit values for electrical conductivity and pH were 1.5 dS·m−1 and 5.4, respectively.
The crop was managed by the producer following standard cultural practices, using the stem-bending system, where nonproductive and lesser quality stems are bent into the canopy or aisle.
2.2. Field Data
The data used for the development of the LA estimation model were collected in an 11-day period between mid-March and early May of 2014.
A total of 26 erect stems (accounting for 232 leaves) in different stages of development, from randomly-selected plants located in the same sector of the greenhouse, were sampled. The stems were collected randomly among healthy plants and within the plant. Samples from bended stems and from stems with no floral bud formation (“blind stems”) were also collected. Data for several morphological/allometric descriptors were recorded on each date.
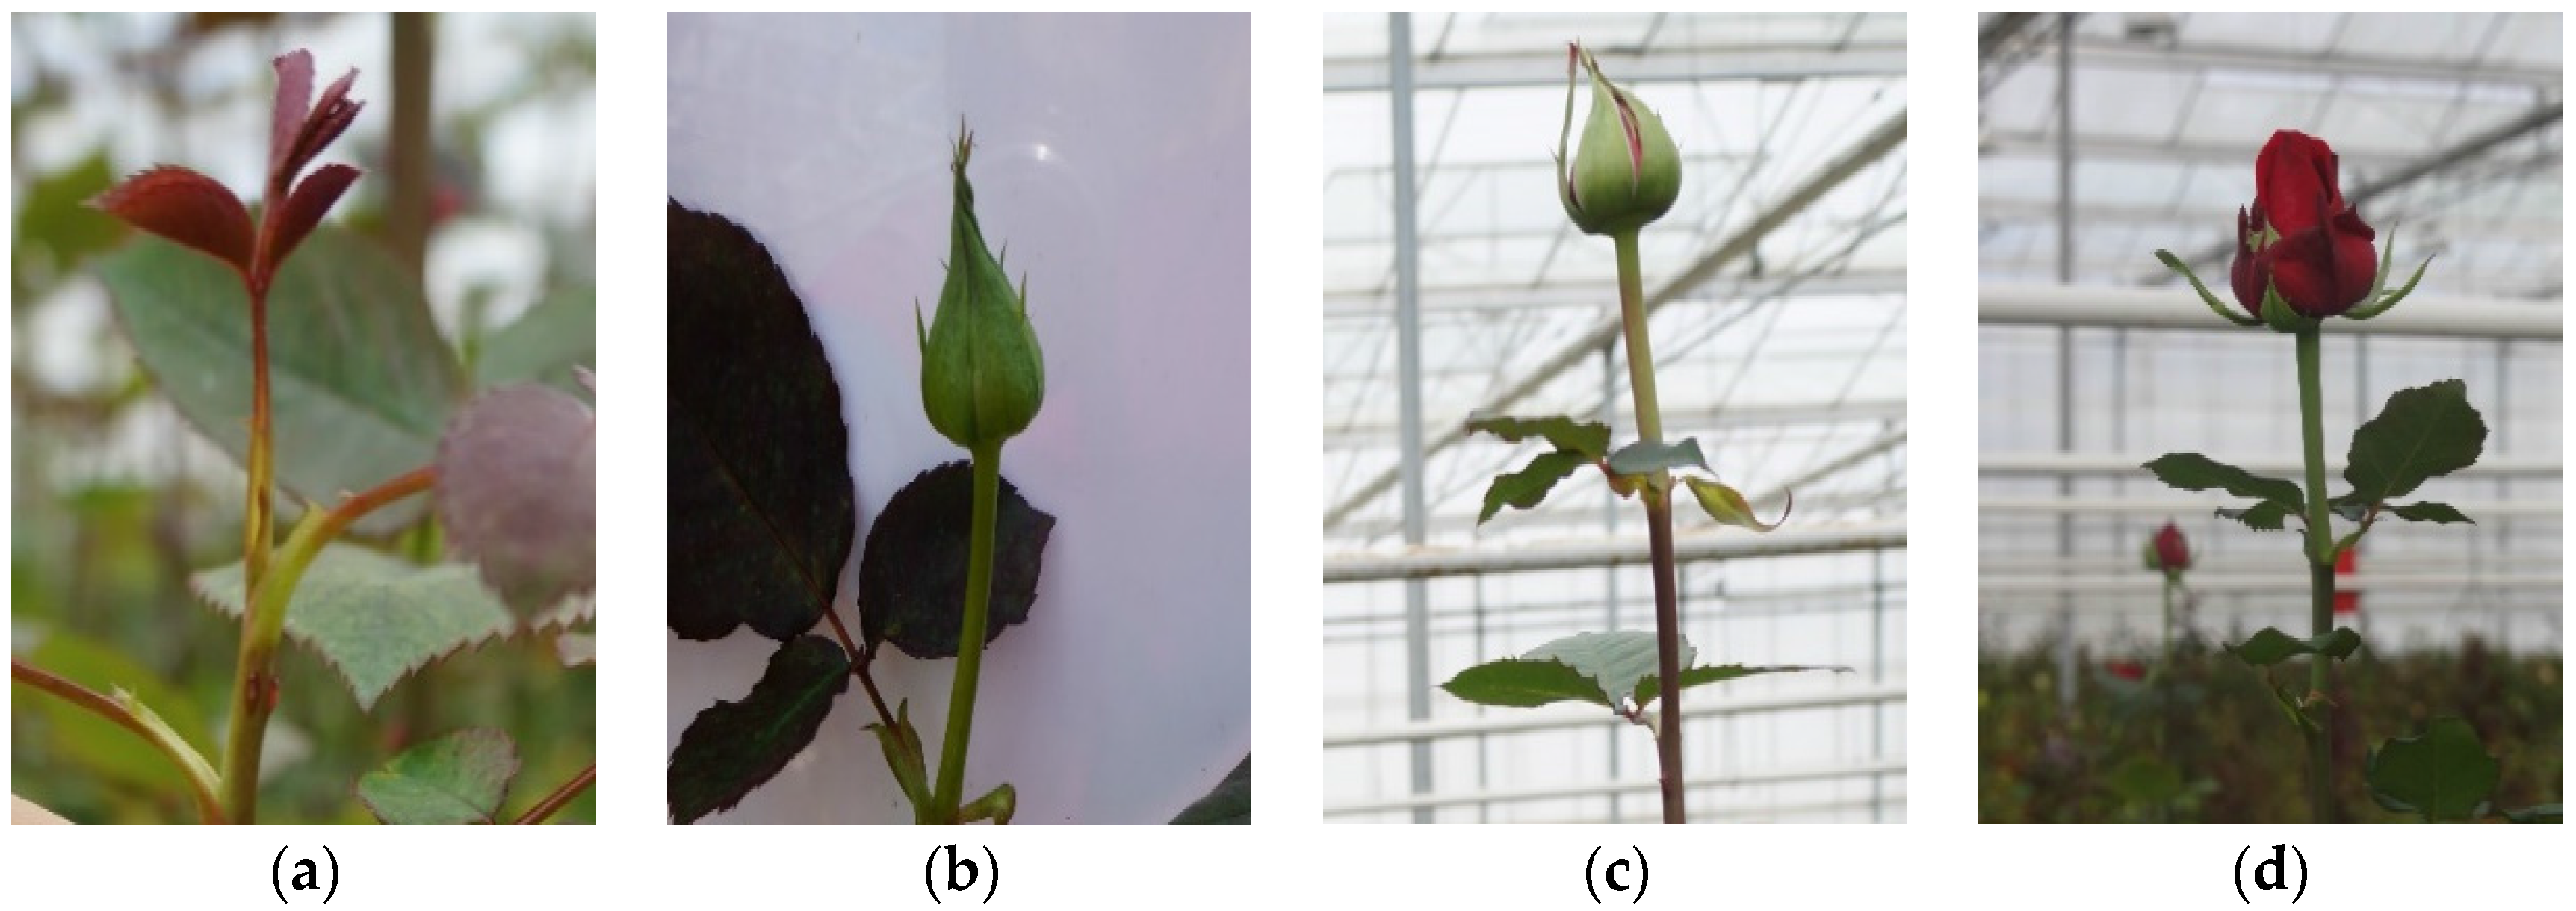
The effect of the phenological stage on LA estimation was evaluated through the qualitatively variable stages of flower buds (SB). This variable could assume three categories defined according to the level of aggregation of the floral bud stages—SB_A1, SB_A2, and SB_A3—which include 2, 4, and 3 classes, respectively, as shown in
Figure 1 and defined in
Table 1. These three flower bud categories were tested as potential predictors in the model for LA estimation. The classes within the SB_A1, SB_A2, and SB_A3 categories were based on the phenological stages of the rose reproductive period described by Flórez and Rodríguez [
21].
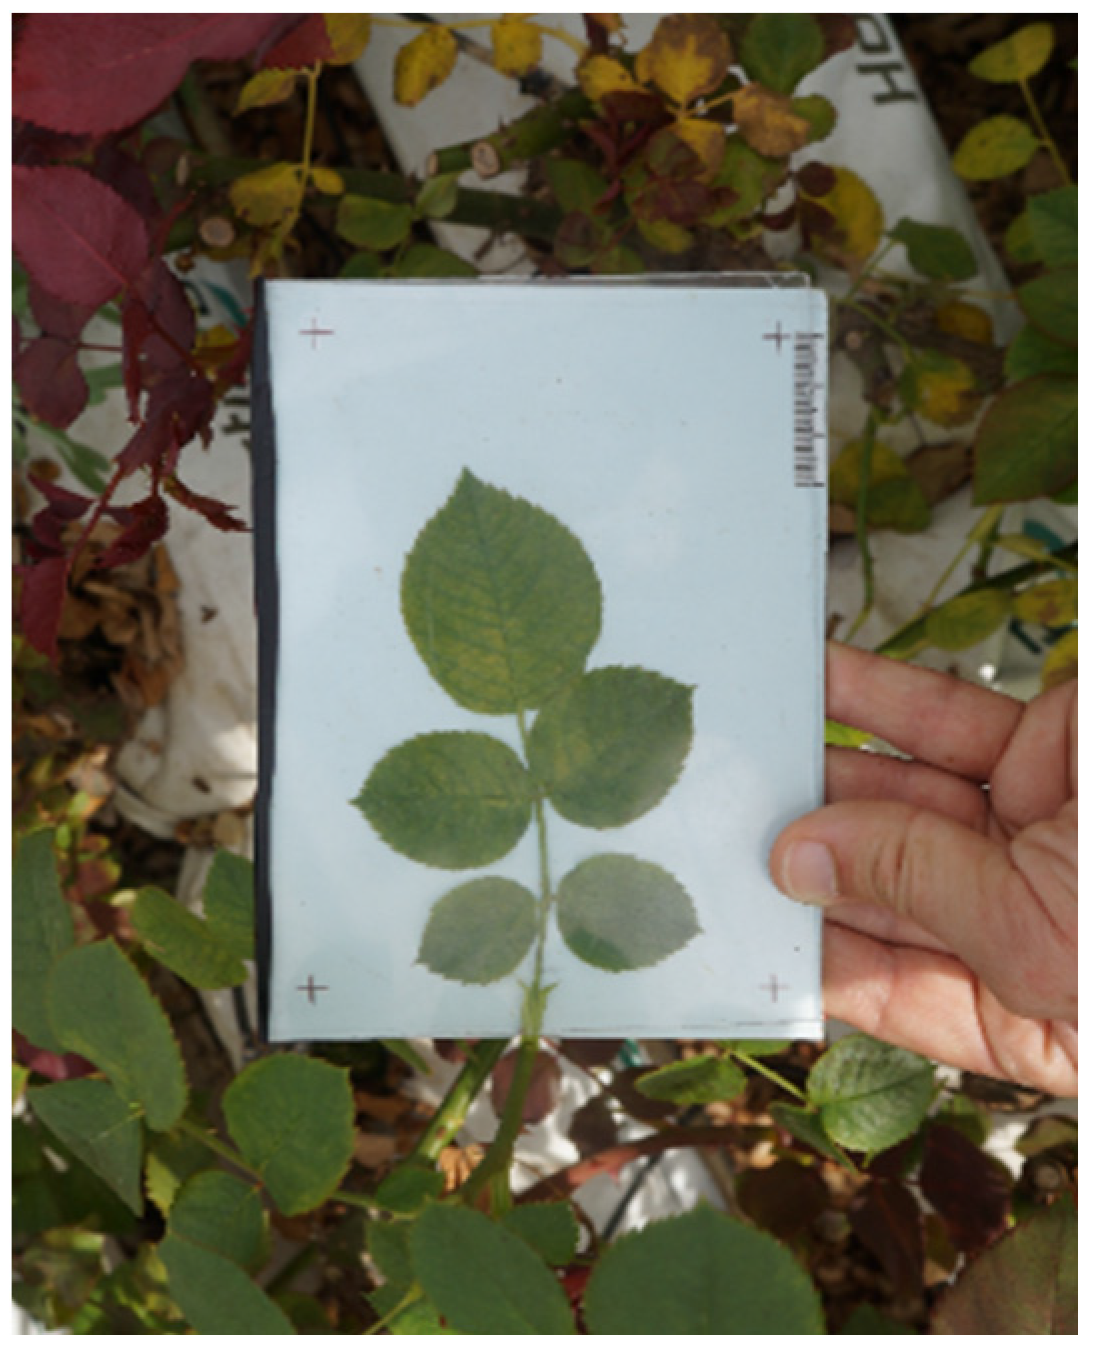
Additionally, images of the leaves from the selected stems were collected in the greenhouse using a digital camera (Sony Alpha Nex F3, New York, NY, USA) with a maximum resolution of 4912 × 3264 pixels in order to calibrate and further validate the model for the estimation of LA based on the morphological/allometric descriptors. The leaves were placed on a white color support plate suitable for the leaf size. The plates had a transparent acrylic cover in order to flatten the leaves, avoiding perspective distortion and allowing greater accuracy in the attainment of the total leaf area (
Figure 2). The plate also had a graduated scale and a mark at each corner forming a parallelogram with right angles. By combining the corner marks on the plate with the digital camera grid, it was possible to avoid perspective distortion and enhance the accuracy of the measurements.
The digital images were processed using Photoshop CS6 (San Jose, CA, USA) and included three main steps: (i) the assignment of the number of pixels that corresponded to one cm of the graduated scale in the image by using the Measurement Scale option in the Analysis feature; (ii) the selection of the area of interest within the image, i.e., the area to measure by using the Quick Selection Tool; and (iii) the acquisition of the area previously selected by using the Record Measurements option in the Analysis feature.
The accuracy of LA measurements based on image processing was compared with the LA obtained with a portable LA meter (AM350, ADC BioScientific Ltd., Hoddesdon, UK). This comparison was assessed by the measurement of four stems for a total of 36 leaves, from plants cultivated under the same conditions and from the same cultivar. Only open leaves with a minimum of three leaflets were considered. After the leaves were photographed in the greenhouse, the stems were cut and immediately placed in a container with water. After the stem harvest, they were rapidly transported to the laboratory for LA determination with the portable LA meter [
17].
2.3. Development of the Model for Stem LA Estimation
The model for stem LA estimation based on morphological and allometric descriptors was developed through a multiple stepwise regression. The descriptors considered were stem height (SH), leaves per stem (SLN), flower bud stage (SB), leaf length (LL), leaf width (LW), and leaflet number per leaf (LNL). The model development took into consideration potential allometric descriptor combinations such as the square of the SH. For each stem, the length and width of the leaf with the maximum LA, the length and width of the first and last leaf, the number of leaflets on the first and last leaf, the average number of leaflets, and the sum of the leaflets were also considered.
Multiple stepwise regression allows, at each step in calculation, the evaluation of the significance level (
p < 0.05) of each independent variable to the dependent variable. Assumptions of normality, homocedasticity, and the existence of multicollinearity among the independent variables were previously verified. In order to detect the existence of collinearity between the model variables, the value of the variance inflation factor (VIF) and tolerance (T) were calculated. The variables, selected by multiple stepwise regression, with VIF > 10 and T < 0.1, were excluded from the model [
22]. The statistical significance of the parameters of the model was evaluated by the Student’s
t-test.
The model adequacy was assessed by the percentage of variance explained by the model, expressed by the R-square. A set of indicators of residual estimation errors was also computed for model fitting analysis: the root mean square error (RMSE), the mean relative error (MRE) and the mean absolute error (MAE). Additionally, the analysis of uncertainty based on the model reliability was considered, which encompasses both accuracy and precision. The regression mean prediction interval for the 95% probability level was illustrated graphically [
22].
We performed all analyses using IBM SPSS statistical software (Version 23.0., IBM Corp., Armonk, NY, USA).
2.4. Model Validation and Prediction Accuracy
An external validation of the model for estimating LA based on allometric measurements was performed to evaluate the prediction reliability. The external validation was performed by analyzing the model performance in predicting the leaf area of three stems (total of 24 leafs) not used in the model parameter estimation.
An additional validation was applied over the full set of data (
n = 26) using the “leave-one-out” (LOO) cross-validation method [
23]. The LOO cross-validation evaluates the model performance for observations not considered in the estimation step, thus providing independent estimates of the predictive capability of the selected models. This technique consists in the removal of one observation from the dataset used, and the estimation of a new regression model with the remaining observations. This new regression model is then used to estimate the stem LA.
Residual errors (RMSE, MAE, and MRE) were also used to estimate the goodness of fit of both external and cross-validation results.
3. Results and Discussion
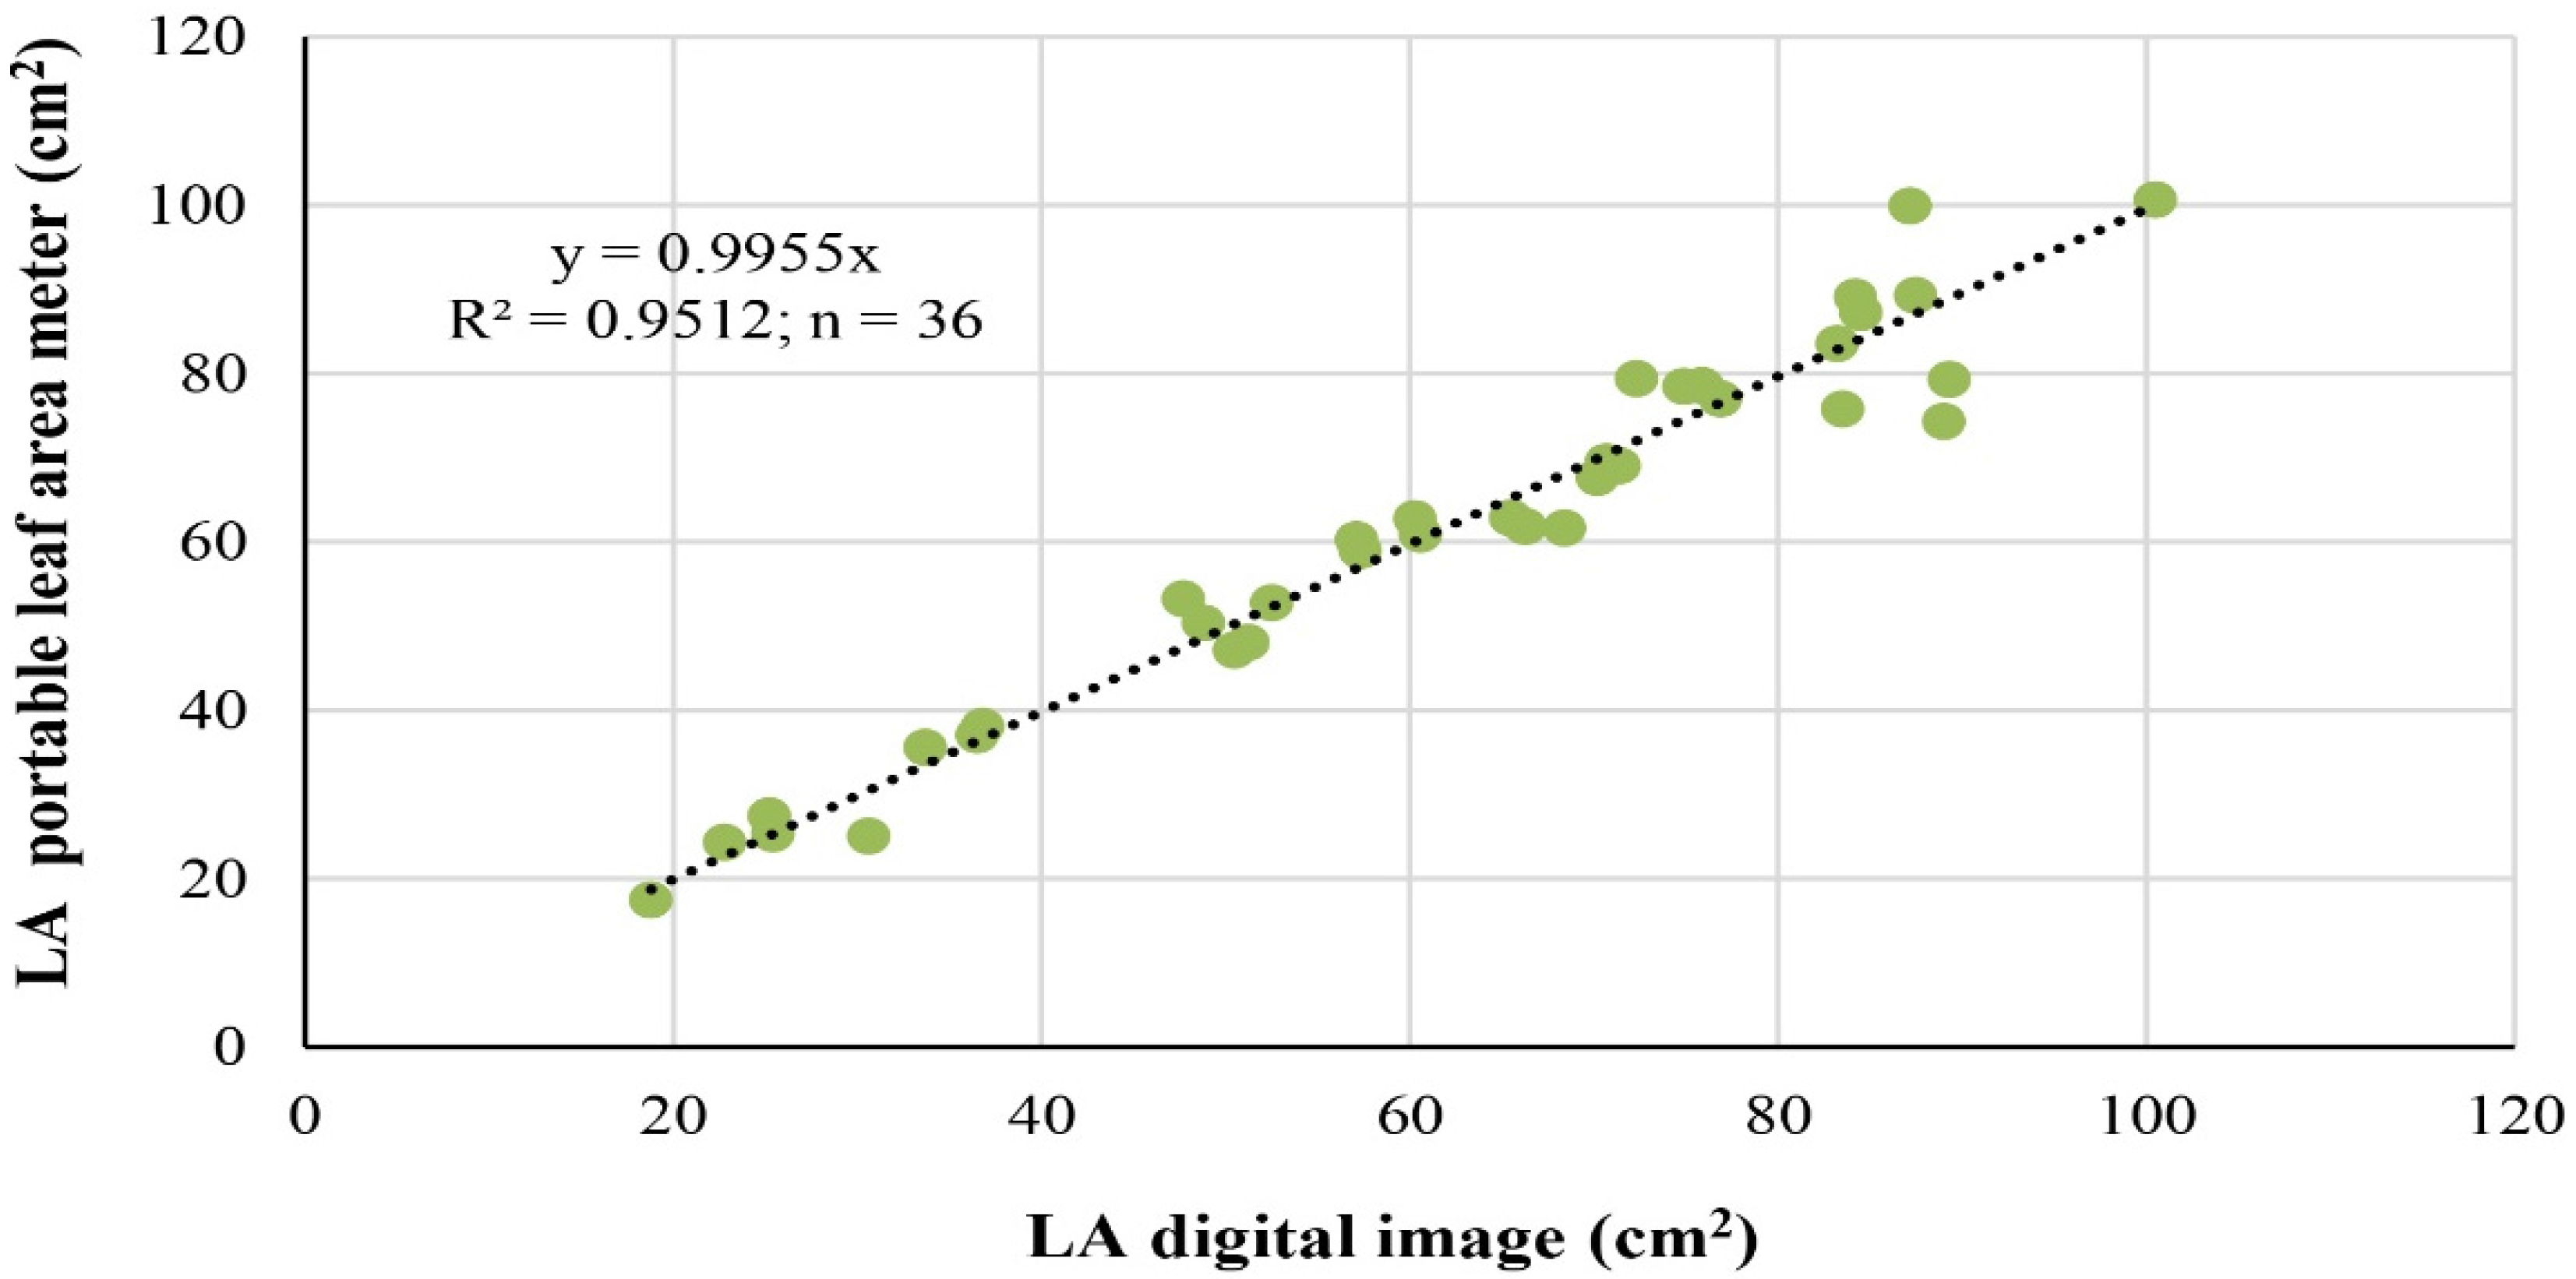
The comparison of the LA results obtained by the destructive method (portable leaf area meter) and by the newly-developed non-destructive image processing method (
Figure 3) showed a strong correlation (R
2 = 0.95;
n = 36) with the slope very close to one (0.995), which was strong evidence for the reliability of the image processing method. For the data set of 36 leaves, the descriptive statistics showed that 53% of cases of LA estimates had between-methods differences below 5%, with an average deviation of 5.7%.
The results were consistent with those for tomato and corn crops [
24], where the accuracy of LA determination methods using digital photographs processed by two different software programs against a standard method were compared. Results using 20 leaves showed no significant differences between methods, with a coefficient of correlation above 99%.
The image processing method used in the present study revealed an accuracy and precision that permits estimating a cut rose crop LA without the need to damage or replace the plants, although when compared to the reference method using a portable area meter, it was more time-consuming. The high correlation achieved supports the use of LA values estimated by the image processing method as a benchmark for the comparison with values estimated by models developed from morphologic and allometric descriptors.
The analysis of the range of values of the variables considered for the LA estimation model showed that a large set of morphological conditions were sampled (
Table 2). The values of SH ranged from 11.4 to 68.5 cm, and the values of SLN ranged from 4 to 15 (
Table 2). The SH and SLN coefficients of variation were 52% and 28%, respectively (
Table 2). There was a marked variability in the selected descriptors, which allowed for the formulation of LA estimates with a wide validation interval.
In the application of the stepwise regression technique, the variables selected for the LA estimation model were aggregation level SB_A1, SH, and SLN. Aggregation levels SB_A2 and SB_A3, LL, LW, and LNL were not statistically significant by the stepwise regression method.
Table 3 shows the estimated model parameters for the selected variables, adjustment and diagnostic tests, and the validation model results.
The selection by the model of aggregation level SB_A1 indicated that, in addition to the variables directly related to the stem (height and number of leaves), the phenological stage also influenced stem LA. This could be due to the distribution of assimilates between the vegetative and reproductive parts of the plant. On stems without a terminal flower bud, there will be a distribution of assimilates to other parts of the plant (leaves and roots). This influences the development of the stems and promotes leaf development [
25]. According to Matloobi et al. [
25], the practice of debudding favors leaf development and subsequently supplies assimilates to other organs, because this cultural practice suppresses terminal flower bud formation, a strong sink for assimilates. Yassin et al. [
26] also found that flower bud removal treatments had highly significant (
p < 0.01) effects on LA of anchote (
Coccinia abyssinica), a tuberous root crop, increasing its LA by 6.69%.
The final model, based on the variables SH, SB_A1, and SLN, explained 95% (
R2 = 0.95,
n = 26,
p < 0.0001) of the LA variability for different stages of leaves development (
Table 3). VIF values were lower than 10 and T values were higher than 0.1, indicating that there was no collinearity between the selected variables.
According to Suay et al. [
19], the estimation of stem LA in cut roses of the cv. “Dallas” can be done using a linear function based only on stem height. The model developed in our study presented a higher
R2 (
R2 = 0.95,
n = 26) than the value obtained by Suay et al. [
19], although a lower number of observations were used. These authors also concluded that only 11 stems were needed to estimate the LA of the flowering shoots with an error of less than 5%. Contrary to the Suay et al. [
19] study, the model developed in our study considered successive measurements of the LA of all erect stems of one plant through its crop cycle, enabling accommodation of a range of different development stages, which increases its potential applicability.
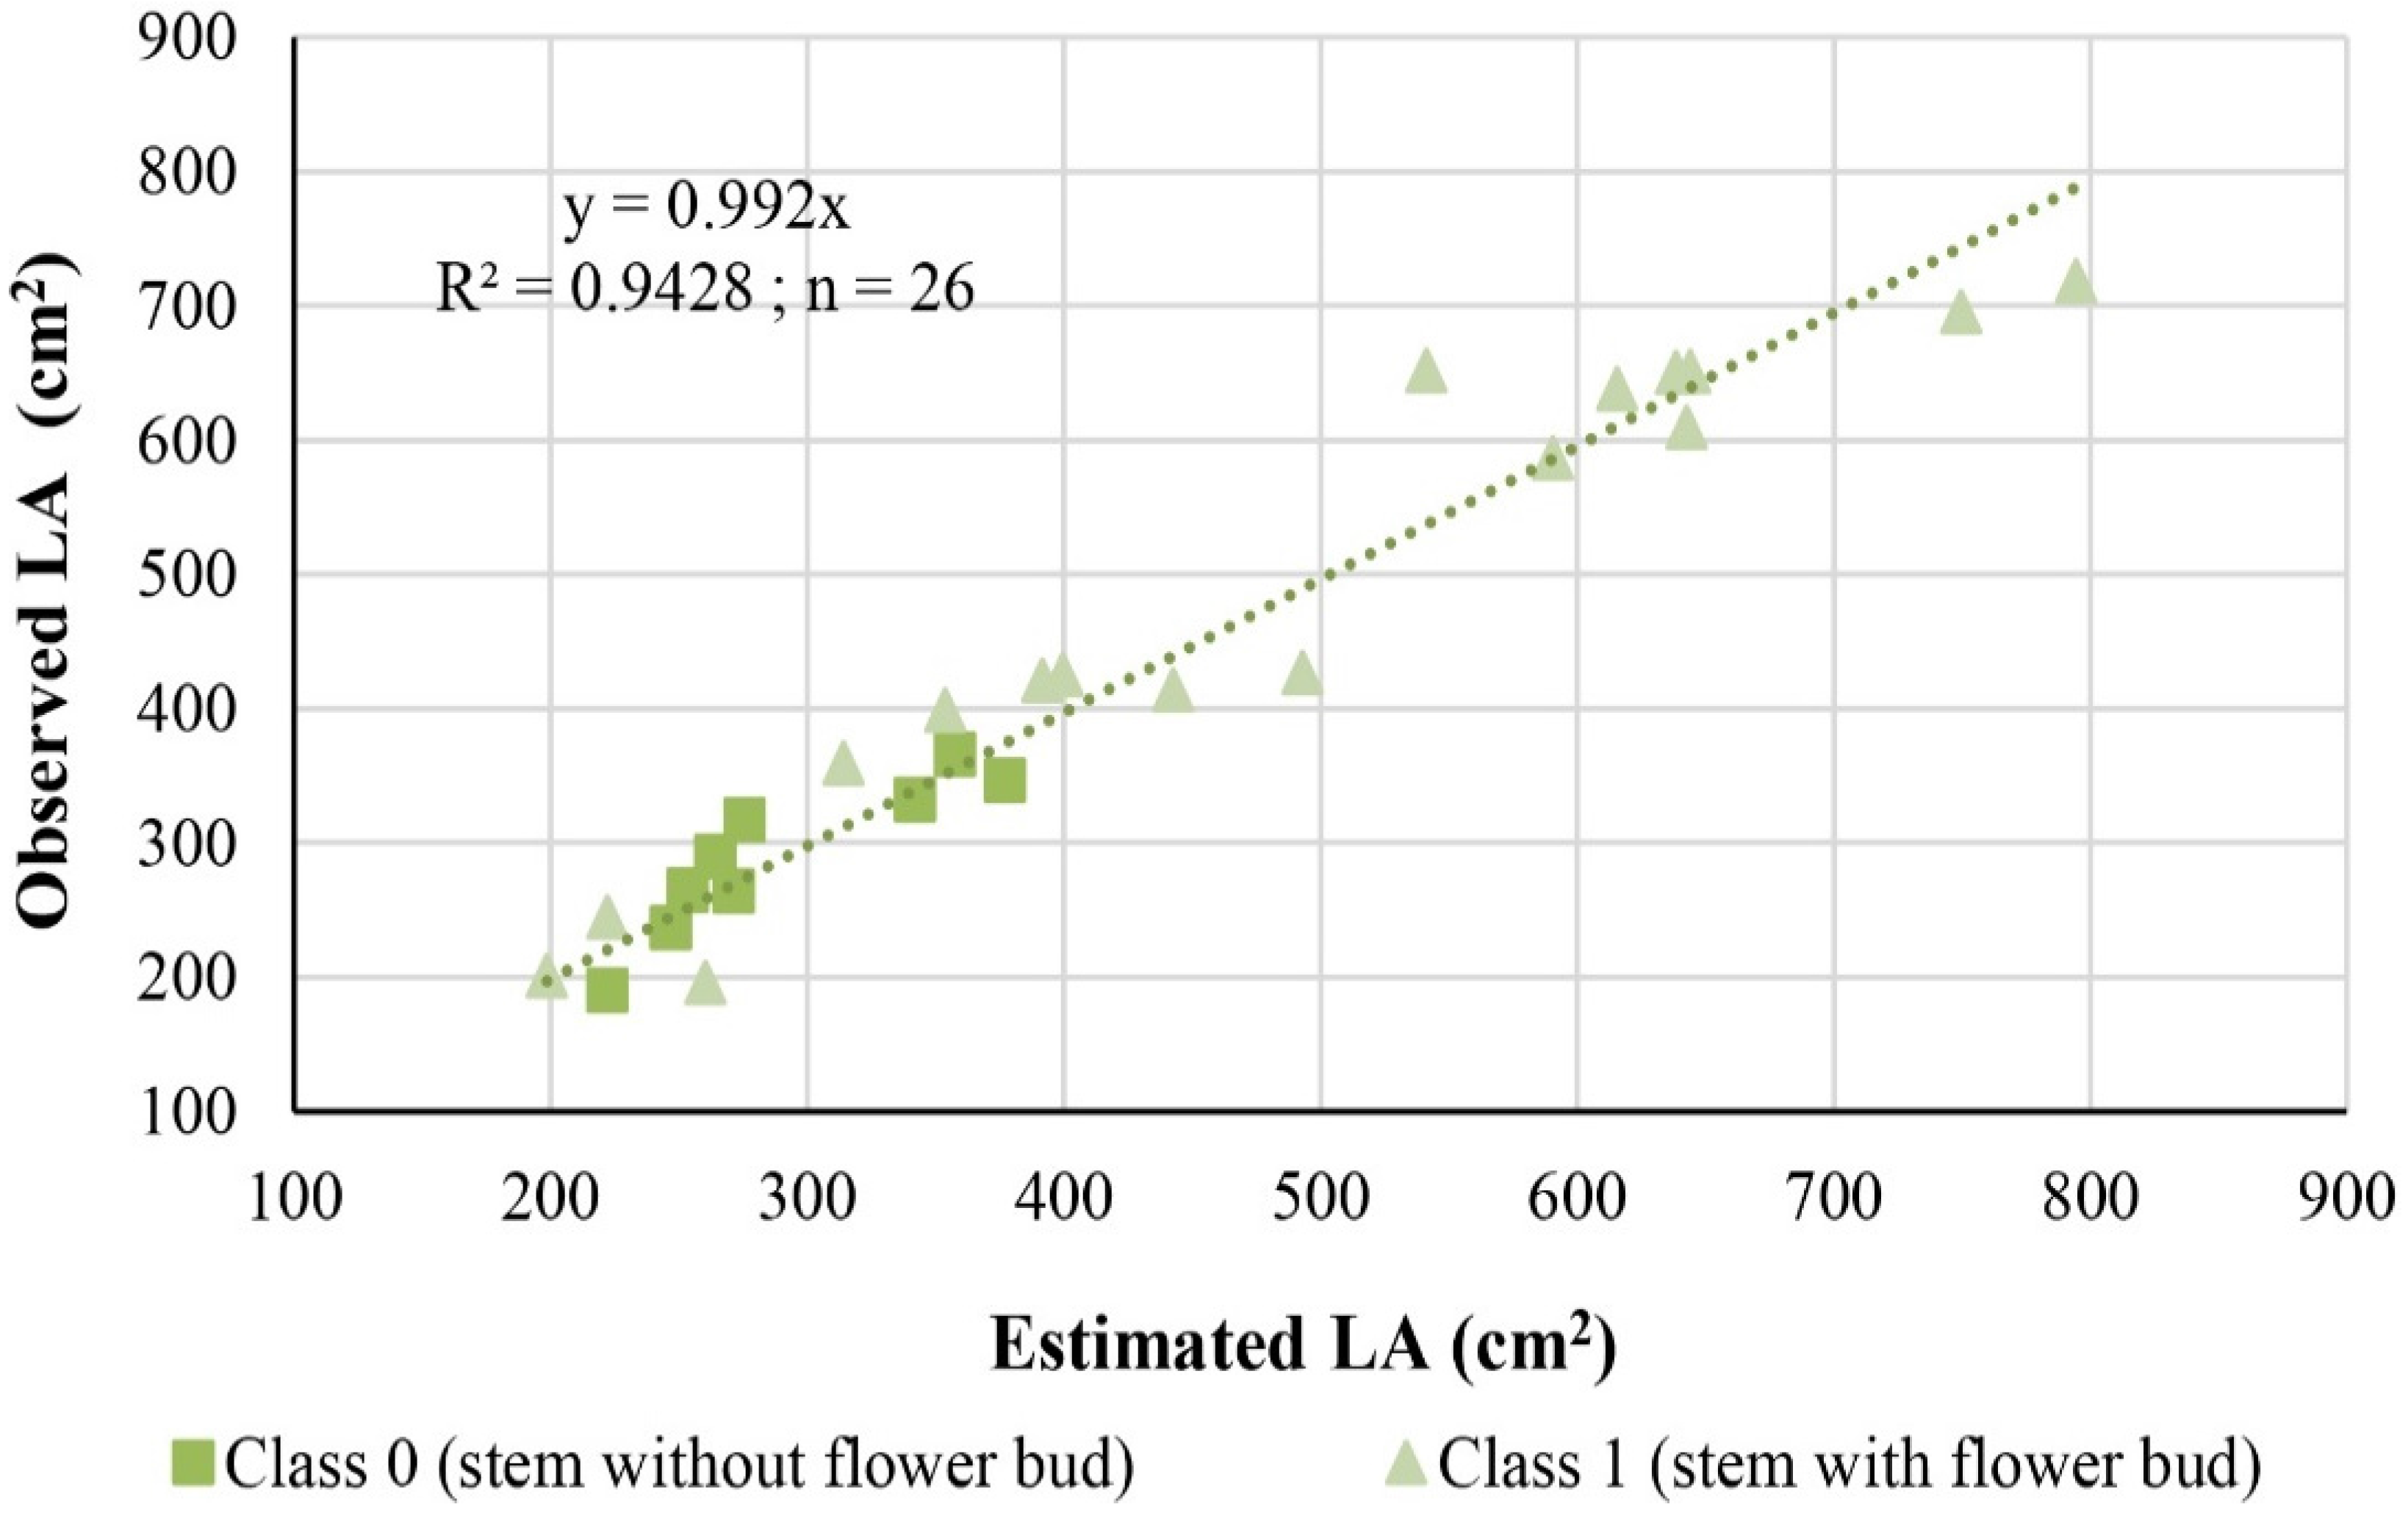
When the observed stem LA values obtained by the non-destructive image processing method were plotted against the LA values estimated by the model (
Figure 4), the slope was very close to one (0.99) and the coefficient of determination was 94%, showing that the model produced stem LA values with high accuracy and precision at different plant development stages. Moreover, the MRE between the observed and estimated LA was 8.2%, corresponding to a MAE of 31.71 cm
2 and RMSE of 40.20 cm
2, thus supporting the good performance of the model.
When applying the model to a dataset of three independent observations (external validation), a value of 50.7 cm2 and 41.3 cm2 were obtained for RSME and MAE, respectively. Similar values were obtained in the cross-validation with an RSME of 49.0 cm2 and MAE of 38.0 cm2. The MRE value of the external validation was 9.8%, lower than the value obtained by the cross-validation (MRE = 16.1%). The MRE values of the calibration process indicated model robustness.
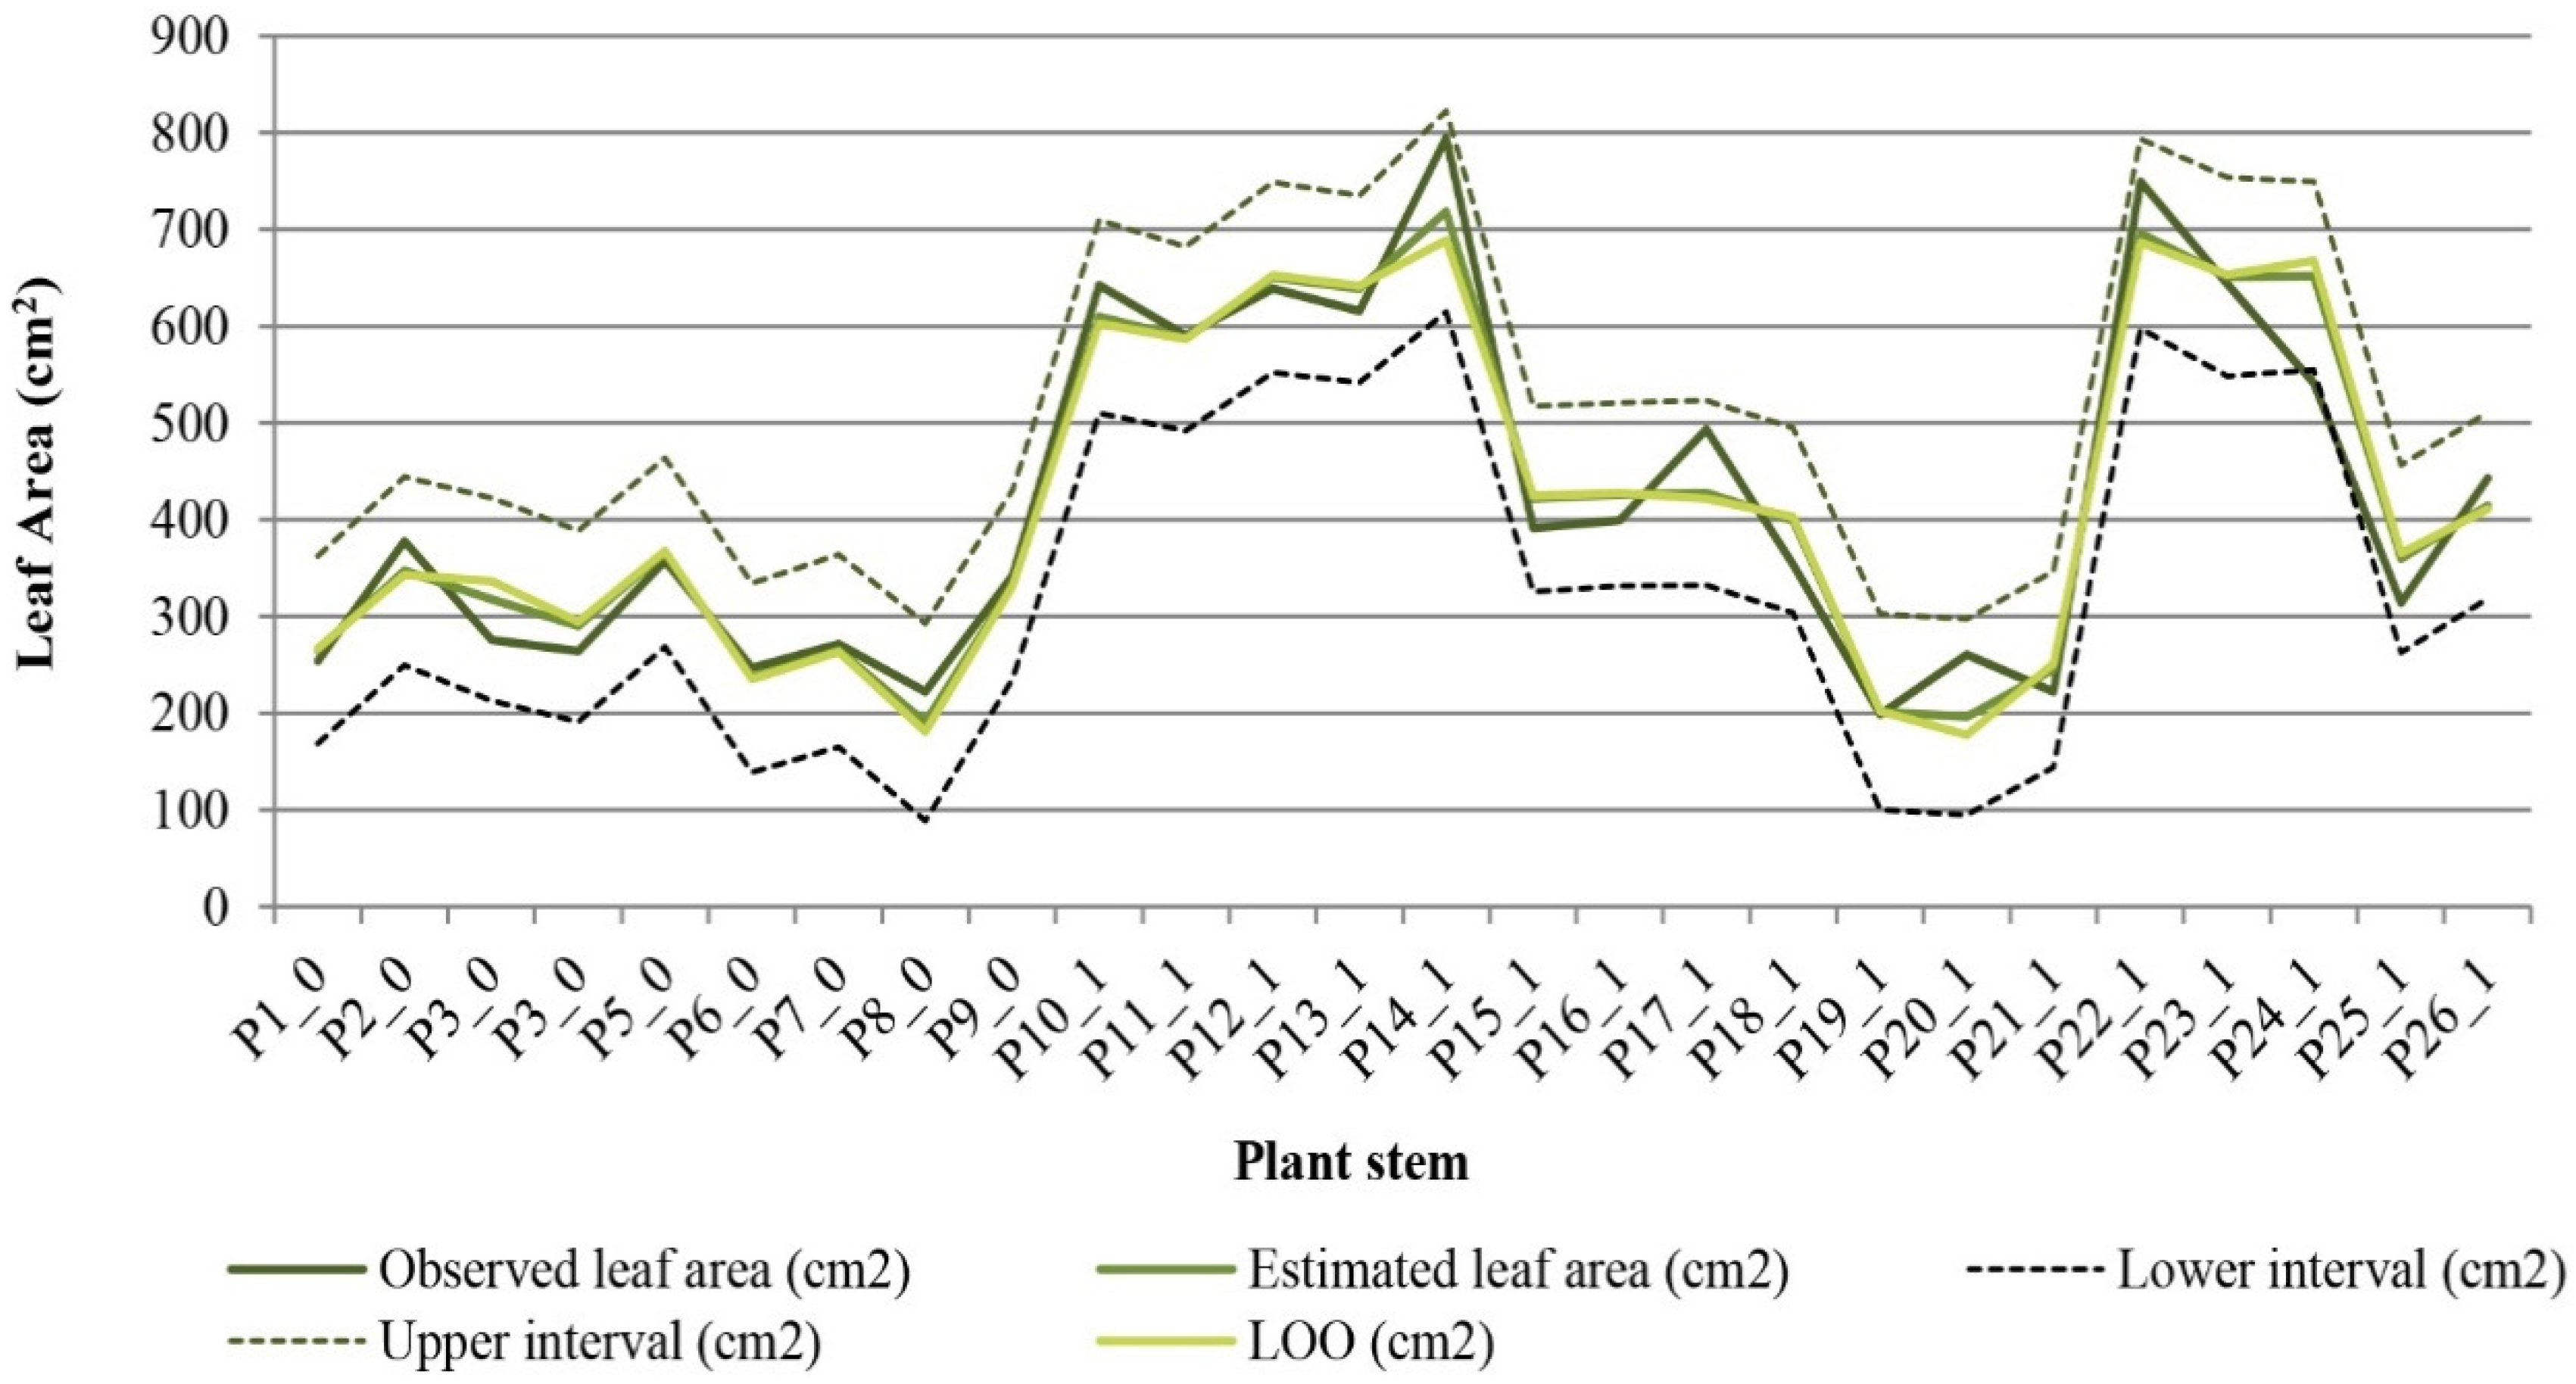
Observed and modeled LA values were compared using the leave-one-out cross validation procedure for 26 plant stems (
Figure 5). The results showed a good similarity between the sets of data, which indicate good performance of the predictive model.
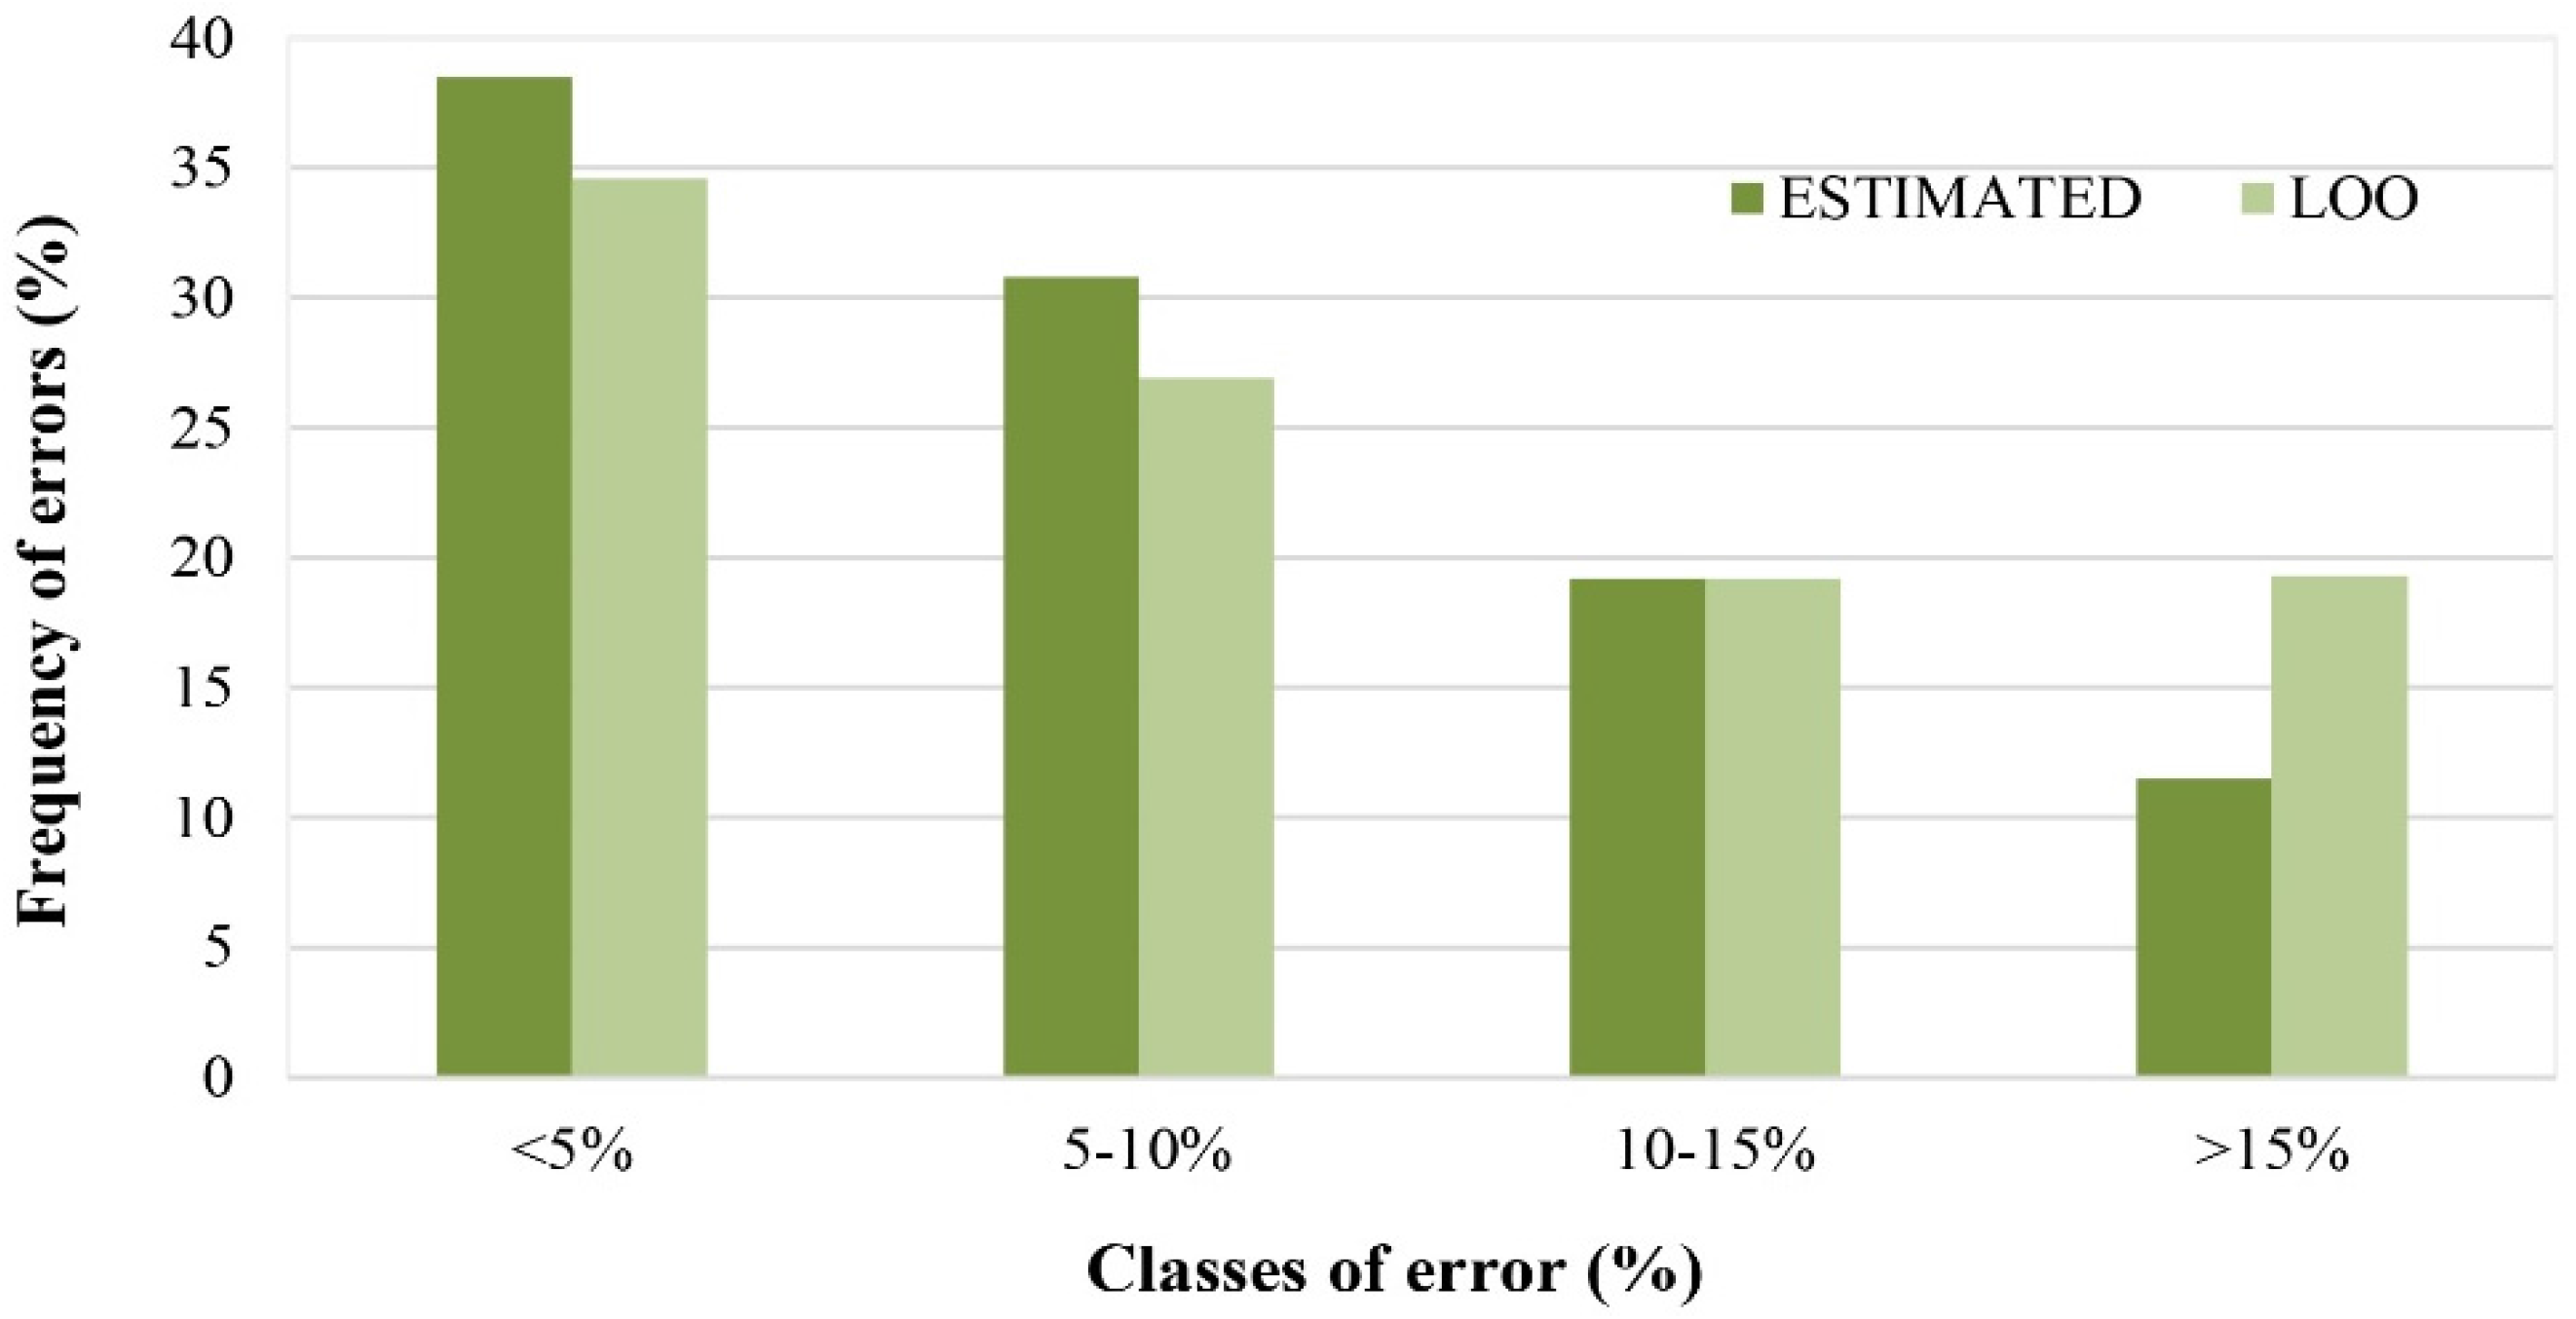
Additionally, 80% (cross validation) to 90% (estimation) of the errors between observed and modeled values were less than 15% (
Figure 6), all consistently inside the prediction interval (α = 5%).
4. Conclusions
In this work, the leaf area of cut “Red Naomi” roses were modeled from simple non-destructive allometric measurements. The LA estimation model based on in situ descriptors such as stem height, number of leaves, and flower bud stage provided accurate and rigorous estimates for this cut rose cultivar. The model presented in this study was unbiased and robust, allowing its use throughout the entire crop cycle instead of being limited to a specific stage of crop development, as has limited most models developed to date. Moreover, it allowed more rapid estimates of cut rose stem LA, potentiating its application in support of a decision-making process. The fact that this method is non-destructive, is user-friendly, and avoids the acquisition of expensive equipment also contributes important advantages when compared with other indirect methods.
A desirable model of non-destructive LA estimation must be able to predict LA independent of genotype and growing conditions. Future studies must be undertaken to test the robustness of the model for other cut rose cultivars and growing conditions.


