

Hemodynamic Insights into Abdominal Aortic Aneurysms: Bridging the Knowledge Gap for Improved Patient Care


1
School of Mechanical and Mechatronic Engineering, University of Technology Sydney, Ultimo, NSW 2007, Australia
2
Department of Mathematics, University of Dhaka, Dhaka 1000, Bangladesh
3
Department of Mathematics & Physics, North South University, Dhaka 1229, Bangladesh
*
Author to whom correspondence should be addressed.
Fluids 2024, 9(2), 50; https://doi.org/10.3390/fluids9020050
Submission received: 13 January 2024
/
Revised: 8 February 2024
/
Accepted: 13 February 2024
/
Published: 15 February 2024
(This article belongs to the Special Issue Advances in Hemodynamics and Related Biological Flows)
Abstract
:Background: Abdominal aortic aneurysms (AAAs) present a formidable public health concern due to their propensity for localized, anomalous expansion of the abdominal aorta. These insidious dilations, often in their early stages, mask the life-threatening potential for rupture, which carries a grave prognosis. Understanding the hemodynamic intricacies governing AAAs is paramount for predicting aneurysmal growth and the imminent risk of rupture. Objective: Our extensive investigation delves into this complex hemodynamic environment intrinsic to AAAs, utilizing comprehensive numerical analyses of the physiological pulsatile blood flow and realistic boundary conditions to explore the multifaceted dynamics influencing aneurysm rupture risk. Our study introduces novel elements by integrating these parameters into the overall context of aneurysm pathophysiology, thus advancing our understanding of the intricate mechanics governing their evolution and rupture. Methods: Conservation of mass and momentum equations are used to model the blood flow in an AAAs, and these equations are solved using a finite volume-based ANSYS Fluent solver. Resistance pressure outlets following a three-element Windkessel model were imposed at each outlet to accurately model the blood flow and the AAAs’ shear stress. Results: Our results uncover elevated blood flow velocities within an aneurysm, suggesting an augmented risk of future rupture due to increased stress in the aneurysm wall. During the systole phase, high wall shear stress (WSS) was observed, typically associated with a lower risk of rupture, while a low oscillatory shear index (OSI) was noted, correlating with a decreased risk of aneurysm expansion. Conversely, during the diastole phase, low WSS and a high OSI were identified, potentially weakening the aneurysm wall, thereby promoting expansion and rupture. Conclusion: Our study underscores the indispensable role of computational fluid dynamic (CFD) techniques in the diagnostic, therapeutic, and monitoring realms of AAAs. This body of research significantly advances our understanding of aneurysm pathophysiology, thus offering pivotal insights into the intricate mechanics underpinning their progression and rupture, informing clinical interventions and enhancing patient care.
1. Introduction
The exploration of fluid flow-induced wall shear stress within human biological organs stands as a foundational pillar of medical research, wielding a transformative influence on our comprehension of physiological dynamics, encompassing both states of health and pathophysiological conditions. This investigation has unfolded across a diverse spectrum, extending its purview into evaluations of shear stress within healthy and diseased lungs under varying surface tension conditions [1,2], scrutinizing bone scaffolds [3], and conducting comprehensive assessments of wall shear stress in AAAs [4,5,6].
The origins of this profound scientific inquiry can be traced back to the pioneering research by Taylor and Yamaguchi [7,8], whose contributions laid the foundation for the ongoing evolution of this field. Subsequently, Vorp et al. [9] contributed pivotal investigations into aneurysmal WSS within three-dimensional AAAs considering variations in aneurysm diameter. Their work yielded a three-dimensional asymmetric physical model of an AAA, revealing a stark divergence in the distribution of the WSS between the asymmetric AAA model and its axisymmetric counterpart. Building upon this foundation, Finol and Amon [10,11] ventured into blood flow patterns within AAAs, focusing on axisymmetric models, rigid wavy walls, and the intriguing complexities of double aneurysms. The intricacies of double aneurysm models had been previously explored by Guzman et al. [12] and Finol and Amon [13], whose findings resoundingly underscored the limitations of axisymmetric models when confronted with the intricate realities of real-world aneurysms. Expanding upon these findings, Finol et al. [14] introduced the integration of wall mechanics and employed large eddy simulations (LESs) with wall modeling. Meanwhile, Li and Kleinstreuer [15] delved into the intricate realm of blood flows within stented abdominal aortic aneurysms. Their research resonated with Frauenfelder et al. [16], who combined experimental and numerical approaches to explore blood flow patterns following stent-graft placement in AAAs. The deposition of monocytes within the walls of abdominal aortic aneurysms became the focus of Hardman et al. [17], who astutely deployed numerical methodologies and LESs to visualize the pattern of cell deposition. Their work introduced a discrete phase model (DPM), shedding light on the potential adverse consequences of monocyte penetration in AAA walls. A blend of numerical and experimental methods enriched the narrative as Deplano et al. [18] investigated blood flow characteristics within AAAs, revealing the inadequacy of simplifying blood as a mere Newtonian fluid to predict AAA flow patterns. In a numerical quest, Rana et al. [19] scrutinized the intricacies of blood flow behavior within AAAs, unveiling that non-Newtonian fluid elevates the WSS in comparison to its Newtonian counterpart while exerting a less profound impact on pressure. This journey culminated in the exploration of transitions to turbulent flow regimes within abdominal aortic aneurysms, carefully examined by Vergara et al. [20]. Their insightful findings not only accentuated the necessity of re-evaluating the assumptions of Newtonian blood properties but also underlined the imperative need for further research. Shit and Majee [21] explored the impact of magnetic fields on heat flow within AAAs, revealing a pronounced influence in the realm of enhancing heat transfer rates and suggesting possible applications in drug delivery to diseased arteries. The integration of numerical and experimental techniques became a defining hallmark through the work of Joly et al. [22]. In their thorough investigation, they offered a holistic analysis of blood flow behavior within patient-specific AAAs, disclosing the potential latent within such analyses to predict AAA growth and identify conditions conducive to rupture. Elhanafy et al. [23] broadened the spectrum by probing the impact of blood shear-thinning and viscoelasticity on AAA flow fields. Their research brought forth the Carreau-Yasuda and Oldroyd-B models as their tools of choice, leading to the exploration of profound influences on flow fields, particularly in the context of low shear rate cases. Their findings demonstrated elevated wall shear stress with increased flow rates in some regions, while in other regions of the aneurysm, a converse trend unfolded, characterized by reduced wall shear stress. Furthermore, Espa et al. [24] undertook an experimental expedition, displaying blood flow patterns within AAAs while considering the Reynolds number (Re) within the range of 410 < Re < 2650. They provided invaluable insights into the intricacies of hemodynamic behavior within AAAs, with their observations highlighting that the WSS remained conspicuously low at the surface of the aneurysm. Within this variety of research endeavors, Jafarzadeh et al. [25] explored the effect of nanoparticle diameter on blood flow within AAAs, uncovering the potential for drug delivery to the aneurysm, as they revealed that the concentrations of therapeutic agents remained resolutely low at the aneurysm’s boundary. Recently, Alsabery et al. [26] investigated hyperthermia as a non-invasive therapy for AAAs, analyzing laminar flow and heat transfer in a heated AAA using an isothermal boundary condition. Employing the Carreau model for non-Newtonian fluid behavior, the research highlighted the impact of blood viscosity on shear stress and emphasized the efficacy of hyperthermia therapy at higher Reynolds numbers when blood flows vigorously through the aorta. Subsequently, Hussain et al. [27] assessed the impact of iron oxide (Fe3O4) nanoparticles on heat transfer in AAAs. The findings revealed altered velocity in the aneurysmal region, increased velocity before and after the aneurysm, and improved heat dissipation, suggesting potential benefits for AAA treatment. The details of some of the mentioned numerical studies are summarized in Table 1 for reference and further exploration.
This extensive body of research weaves together the contributions of scientific luminaries, from Taylor and Yamaguchi [7,8] to the tireless efforts of the most recent pioneers, underscoring the dynamic evolution of AAA research and offering glimpses into the multidimensional nature of this complex pathology. Embarking on this comprehensive journey to further unravel the hemodynamics of AAAs, we draw upon the extensive backdrop of research conducted by the pioneers and contemporary scientists. This study is poised to build upon these foundations, delving deeper into the multifaceted aspects of blood flow dynamics and their associated parameters within AAAs by applying physiologically realistic boundary conditions. Through this investigation, valuable insights are anticipated on the interplay of these hemodynamic parameters and their potential role in modulating AAA evolution and the risk of rupture. By enhancing our understanding of the hemodynamics governing AAAs, we aim to pave the way for improved diagnostic methods to detect early signs of aneurysm growth and rupture risk. Early diagnosis is paramount in preventing life-threatening complications and reducing mortality rates associated with AAAs. Moreover, this research can potentially inform more targeted and effective treatment strategies, optimizing the outcomes for individuals with AAAs. It provides a foundation for developing patient-specific interventions tailored to the unique hemodynamic profiles of each case, thus minimizing unnecessary invasive procedures and their associated risks. This study aspires to yield tangible benefits to patient care by advancing the field toward more accurate and individualized methods for diagnosing, treating, and monitoring AAAs. This progress is underscored by our distinctive utilization of a highly realistic geometry and boundary conditions, setting it apart in the landscape of AAA research.
2. Key Hemodynamic Parameters in Abdominal Aortic Aneurysms
In pursuing this research objective, it is paramount to thoroughly examine several pivotal parameters that collectively provide a holistic understanding of the hemodynamics within AAAs [28]. WSS represents one of the central parameters of interest, as it provides insights into the instantaneous frictional forces exerted by blood as it flows along the aneurysm. It represents the force per unit area acting parallel to the vessel wall. A comprehensive understanding of WSS is essential, as it has been linked to the progression and rupture of AAAs. Time-averaged wall shear stress (TAWSS), another critical parameter, quantifies the average shear stress levels over a cardiac cycle (Equation (1)). This metric is particularly useful for assessing the cumulative or long-term effects of shear stress on the vessel wall and aids in identifying regions of consistently high or low shear stress within the aneurysm, shedding light on potential sites of vulnerability:
where ‘T’ represents the overall interval of the cycle, denotes the wall shear stress (Pa), which is a function of time and position, and ‘t’ symbolizes time.
The OSI plays a pivotal role in assessing the degree of oscillation in WSS during the cardiac cycle (Equation (2)). Elevated OSI values are associated with disturbed flow patterns and non-uniform shear stress distribution, which are recognized precursors to AAA growth and rupture.
Furthermore, relative residence time (RRT) is employed to determine the duration of blood residence in specific areas of the aneurysm (Equation (3)). This temporal dimension of analysis offers a unique perspective on how blood flow patterns evolve within an AAA, potentially uncovering flow characteristics that contribute to the development and progression of the condition.
In delving into these critical parameters, our investigation revealed the intricate hemodynamic factors governing the initiation and progression of AAA. This dataset enhances our comprehension of the disease’s pathophysiology, emphasizing the distribution of blood flow within the aneurysm. Furthermore, it sheds light on the forces influencing the aneurysm wall, crucial for evaluating the structural integrity of the vessel.
3. Modeling
3.1. Anatomical Representation of Aortic Aneurysm and Surrounding Vessels
A comprehensive review of the existing literature reveals the diversity in geometric representations utilized in prior studies. These varied from simple modifications and simplifications to extensive considerations of axisymmetric models, circular cross-sections, the employment of basic tube configurations, and those with curved sections housing the aneurysm, with certain studies opting to neglect the presence of arterial branches or vessels originating from the AAA. This patient-specific AAA model includes these branches to replicate the anatomical complexity and accurately simulate blood flow dynamics within the entire abdominal aorta.
This investigation commences with the design of a highly realistic physical geometry that closely mimics the intricate anatomical features of an AAA. This anatomical model was reconstructed from a high-resolution CT scan image, capturing the complete representation of the abdominal aorta and its associated branches. The branches incorporated in the model include the renal arteries, iliac arteries, and the inferior mesenteric artery, each of which plays a crucial role in supplying oxygenated blood to specific organs and tissues in the abdominal region, underscoring the clinical relevance of our research. The resulting physical diagram mirrors the entire abdominal aortic aneurysm with its intricate branching structure, as depicted in Figure 1. This anatomical representation includes one inlet positioned at the top, representing the abdominal aorta’s origin, and seven outlets located at the mid and lower sections of the abdominal aorta, symbolizing the branching vessels and their destinations. In the context of this anatomical model, the aneurysm exhibits a length of 5.7 cm, a diameter of 4.5 cm, and a wall thickness of 2 mm. The fluid contained within the aneurysm is characterized as non-Newtonian blood, acknowledging the importance of considering blood’s rheological behavior, particularly during the pulsatile cardiac cycle, encompassing the systole and diastole phases. This level of anatomical fidelity not only enhances the accuracy of our simulations but also ensures that our findings are clinically relevant, as they closely mirror the real-world AAA scenarios encountered in medical practice.
3.2. Fluid Dynamics
In the realm of hemodynamic research, numerical simulations have emerged as a pivotal tool for the comprehensive investigation of blood flow within an AAA. Employing the CFD technique, these simulations delve into the intricacies of fluid dynamics by solving the fundamental conservation equations for mass and momentum that govern the fluid’s motion within the AAA. Furthermore, accurate representations of blood properties, encompassing parameters such as viscosity and density, are essential for modeling the complexities of blood flow.
This study advances the field by employing a three-dimensional physical model, accommodating the intricate characteristics of blood as a non-Newtonian, incompressible fluid, using Ansys Fluent 2023 R1. The simulation considers the flow to be laminar and unsteady, mimicking the pulsatile nature of blood flow. Central to these simulations are the conservation equations for mass (Equation (4)) and momentum (Equation (5)). These equations describe the preservation of mass and the transfer of momentum within the fluid, which encapsulate a balance between inertial forces, pressure forces, viscous forces, and any external forces influencing the motion of the non-Newtonian fluid (blood):
where represents the velocity vector, is the time, denotes the fluid density, p is the pressure, is the unit tensor, is the dynamic viscosity, is the stress tensor, accounting for the viscosity and shear-thinning behavior of the non-Newtonian fluid, and denotes any external body force that may be acting on the fluid.
In the context of non-Newtonian fluid viscosity modeling, a power law profile, also known as the Ostwald-de Waele model, is one of several mathematical models used to describe the relationship between the shear rate and viscosity of the fluid. This model is particularly suitable for fluids that exhibit shear-thinning behavior, where the viscosity decreases as the shear rate (the rate of deformation) increases. The power law profile was adopted (Equation (6)) to capture and understand the complex behavior of blood flow [29]:
where signifies the consistency index, characterizes the power law index for shear-thinning fluid, and represents the shear rate.
3.2.1. Mesh Configuration and Grid Independence Analysis
The geometric model’s complexity mandates the utilization of an unstructured mesh that combines tetrahedral and prism elements. A focused effort is directed toward refining the mesh near the vessel walls to capture velocity gradients accurately. An essential step is the implementation of a grid-independent assessment, eliminating dependence on specific grid parameters to ensure result consistency. This procedure involves a series of simulations at varying grid resolutions, with results subjected to rigorous comparative scrutiny. In our study, we undertook a comprehensive grid-independent evaluation, conducting numerical experiments with grid sizes ranging from 3 to 15 million volume elements. Two primary parameters, the surface-weighted average total pressure (Pa) and surface-weighted average shear stress (Pa), as depicted in Figure 2, were at the forefront of this analysis. Additionally, the precision of results hinges significantly on accurately representing the boundary layer, a region of the fluid flow adjacent to vessel walls. Therefore, eight prism layers were placed near arterial walls, ensuring the precise capture of this vital region. The computational solver was paired with a least-squares cell-based spatial discretization technique and employed a second-order upwind scheme for the spatial discretization of momentum. Explicit relaxation factors for momentum, pressure, and body force are set at 0.5, with the computational process governed by a SIMPLE algorithm to maintain convergence at each iteration. The predetermined convergence criterion for all variables was set to 10−5, ensuring the precision and high accuracy of the computed results.
The outcomes clearly establish that deploying 6 million volume elements yields grid-independent results while maintaining the desired level of accuracy. Importantly, this configuration also provides the added benefit of reduced computational time and cost, rendering it the optimal choice for this study.
The mesh configuration, composed of 6 million tetrahedral volume elements accompanied by prism boundary layers, is illustrated in Figure 3. The mesh is visually dissected to offer detailed perspectives on crucial areas within the model. Notably, the aneurysm region is depicted with a highly resolved mesh structure that accurately captures the complex aneurysm walls and the associated fluid dynamics. The close-up view of the inlet region underscores the mesh’s precision in capturing the site of blood entry, a critical aspect for simulating physiologically accurate flow patterns. Similarly, the thoracic aorta region is characterized by a well-resolved mesh, ensuring an accurate representation of this vital segment of the circulatory system. With millions of tetrahedral elements, this mesh configuration ensures grid independence and facilitates high-accuracy simulations, deepening our insights into the AAA’s hemodynamics.
3.2.2. Physiological Blood Entry Control and Cardiac Cycle Phases
The precise control of blood entry into the aneurysm, mirroring the physiological conditions, is of paramount significance. The imposition of this entry pattern encompasses diverse techniques, catering to the distinct phases of the cardiac cycle. These phases, systole and diastole, regulate the rhythmic blood flow within the circulatory system. During systole, a critical juncture of the cardiac cycle spanning 0.3 s, the ventricles contract forcefully, expelling blood into the aorta. This energetic propulsion leads to a steep surge in the mass flow rate, peaking from 0.1 to 0.3 s. Subsequently, the diastole phase, extending for 0.5 s, commences. Here, the ventricles relax, allowing them to refill with blood from the atria. As the ventricles ease into this restorative phase, there is a sharp decline in the mass flow rate, dwindling to near-zero values around 0.5 s. These cardiac phases govern the flow rate profile, aligning with the circulatory system. In the present study, the selection of the inlet flow rate profile drew inspiration from the work of Boccadifuoco et al. [30] and underwent subsequent fine-tuning to harmonize with the distinctive attributes of the physical model, as depicted in Figure 4. This blood flow entry pattern closely mimics the physiological dynamics, enhancing the fidelity of the AAA hemodynamic simulations. Furthermore, the simulations were conducted over three cardiac cycles to ensure both the stability of the flow and the precision of the corresponding results.
3.2.3. Integrating the Windkessel Model with Outlet Boundary Conditions
The Windkessel model is a lumped parameter model used to represent the behavior of the arterial system, particularly in the context of blood flow and pressure dynamics [31,32]. This model is based on the concept of an electrical circuit with elements that mimic the compliance and resistance of arteries (Equation (7)):
where represents the mass flow rate at the inlet varying with time, constants Rp and Rd denote the proximal and distal resistances, respectively, C signifies the capacitance, and P is the pressure.
The compliance element represents the elasticity and capacitance of the large arteries and reflects the ability of the arterial walls to store blood during systole and push blood forward during diastole. The compliance element helps dampen the pulsatile nature of blood flow and maintain continuous flow downstream. The resistance element represents the opposition to blood flow in the arteries due to friction and viscosity. It influences the rate at which blood flows through the arterial system and significantly impacts the arterial pressure. According to this model, the pressure variations at individual outlets differ from one another, contingent on the resistances and capacitances associated with each outlet area, where for i = 1, …, .
The total and individual outlet areas were measured from our model, while the total resistance and capacitance constants were derived from the investigation conducted by Boccadifuoco et al. [30]. By integrating the blood flow rate variation calculated from the inlet mass flow rate profile, along with the resistance and capacitance values for each outlet and the constant for normal human blood pressure, we obtained the temporal variation in pressure using the Windkessel model at each of the seven outlets over a complete cardiac cycle (Figure 5). The cardiac cycle is initiated with the systole phase, lasting approximately for 0.3 s, during which the heart contracts vigorously, propelling blood through the vascular system. This results in dynamic fluctuations in pressure within the vessels. Following systole, the heart transitions into the diastole phase, characterized by relaxation and pressure stabilization at a minimum value. During this diastolic phase, the pressure profiles at the outlets exhibit an initial rise and subsequent decline in pressure from 0 to 0.3 s, followed by a period of relatively stable pressure values from 0.4 to 0.8 s. The three-element Windkessel model enhances the representation of the arterial system by incorporating the effects of inertia. It provides a more accurate description of the pressure and flow dynamics in the cardiovascular system during the cardiac cycle, considering the compliance of the arteries, resistance to flow, and the inertia of the moving blood.
4. Results
4.1. Validation
A comparison of the wavy cavity was conducted, referencing Esmaeilpour and Abdollahzadeh [33], utilizing the parameters Pr = 6.2, Gr = 104 and 105, and = 0, 0.05, 0.1. Figure 6 illustrates that the isotherms obtained in this study were qualitatively consistent with the findings reported in earlier works. The accuracy demonstrated by the current method encourages us to proceed to the next step and pursue additional experiments.
4.2. Temporal Hemodynamic Analysis in a Non-Newtonian Vascular Model
This study examined the dynamics of flow velocity, wall shear stress (WSS), the oscillatory shear index (OSI), and relative residence time (RRT) at various time increments to assess the hemodynamic behavior within the vascular model. The investigation characterizes the blood as non-Newtonian and models the flow as unsteady, laminar, and incompressible. The research aimed to gain comprehensive insights into the blood flow dynamics within the model concerning temporal variations. This attempt contributes to the identification of evolving flow patterns and mechanical stresses exerted on the vessel walls at distinct temporal phases, offering valuable insights into vascular health.
The initial analysis was centered on the cross-sectional velocity profile of blood flow, positioned at the mid-plane of the aneurysm. This profile was examined at four distinct time intervals (t = 0.12, 0.2, 0.3, and 0.34 s (s)), as illustrated in Figure 7. At t = 0.12 s, the velocity remains relatively low, consistent with the mass flow rate inlet profile. As time progresses to t = 0.2 s, the velocity intensifies, gradually converging toward the aneurysm’s centerline. The evaluation at t = 0.3 s delineates a velocity profile characterized by three distinct regions, demarcated by colors representing low, mid-high, and high-velocity areas in blue, yellow, and red, respectively. Within this profile, a prominent semi-circular region featuring high velocity occupies nearly half of the aneurysm’s cross-sectional plane. Lastly, at t = 0.34 s, the velocity surges to its pinnacle, exceeding 0.3 m/s, and areas marked by heightened velocity dominate the aneurysm’s cross section. Notably, the identification of a universally applicable velocity threshold, where hemodynamic forces precipitate deleterious effects within the context of an AAA, remains elusive and contingent upon the intricate interplay of various factors. These factors include the aneurysm’s dimensional attributes, anatomical location, the patient’s inherent health parameters, the presence of concurrent risk factors, and the inherent biomechanical properties of the aneurysmal wall.
Elevated flow velocities elicit a cascade of adverse consequences within the hemodynamic framework. For instance, these elevated velocities disrupt the normally orderly laminar flow patterns, provoking phenomena such as flow separation, recirculation zones, and vortices. This disturbance, in turn, results in areas of diminished OSI, further compromising the integrity of the vessel wall. Furthermore, they give rise to an escalation in the WSS, signifying the frictional force that blood imparts on the vascular wall. Over time, this heightened WSS may induce mechanical degradation. The association of high flow velocities with increased pressure plays a significant role in this context, contributing to the elongation and attenuation of the aneurysmal wall. Consequently, these combined effects accelerate the structural alterations of the aneurysm, ultimately compromising its stability. These implications will be expounded upon in subsequent paragraphs.
A velocity curl characterizes the rotational dynamics of blood flow within the complex milieu of the AAA. It offers invaluable insights into the intricate hemodynamic intricacies that define the behavior of blood as it traverses this pathological entity, revealing essential details about its complex flow patterns and their implications for mechanical forces acting upon the aneurysmal walls. As shown in Figure 8, a comprehensive temporal evaluation of the velocity curl was undertaken at the mid-plane of the aneurysm, unraveling its evolution at distinct stages during the cardiac cycle. At the initial temporal node (t = 0.2 s), the velocity curl values manifest a state of relative quiescence, portraying a predominantly laminar and orderly flow paradigm enveloping the aneurysm. Yet, as temporal progression unfurls toward t = 0.4 s, the velocity curl experiences an astonishing surge, approximating a value of 100 (1/s). This sharp escalation in the velocity curl suggests the emergence of vortices and strong swirling flow patterns within the aneurysm. Such a phenomenon is notably correlated with the systolic phase of the cardiac cycle, characterized by the forceful expulsion of blood from the heart. The temporal transition of the velocity curl from low values to a considerable magnitude reflects the dynamic nature of blood flow within an AAA. These alterations in the velocity curl wield considerable influence over the mechanical stresses impinging upon the aneurysm’s walls.
Subsequently, a comprehensive examination of the temporal evolution of the WSS at discrete time intervals was conducted, encompassing an exploration of the thoracic aorta, as well as the iliac, renal, and mesenteric arteries and presented in Figure 9. Initiated at t = 0.12 s, the initial time point reveals a relatively modest flow velocity across the computational domain, yielding uniformly low WSS values throughout the vasculature, including the thoracic aorta, the aforementioned arteries, and the aneurysm. As time progresses, notably at t = 0.2 s and t = 0.3 s, a concurrent elevation of the flow velocity gradient ensues, consequently leading to an augmented level of WSS, particularly in the larger arterial segments. This conspicuous surge in WSS, however, remains notably absent within the aneurysm, wherein WSS values persistently maintain lower values. As the cardiac cycle advances further, transitioning from 0.3 s to 0.4 s, a pronounced intensification in the flow velocity gradient becomes discernible within the aneurysm, culminating in notably higher WSS values. Subsequently, from t = 0.5 s to t = 0.78 s, a gradual reduction in WSS becomes apparent, influencing both the aorta and the aneurysm. This decline in WSS aligns with the decreasing velocity characteristic of the diastole phase. Within the aneurysmal region, approximately two-thirds of the area manifests exceedingly low WSS values, while the remaining portion exhibits slightly higher WSS levels. Additionally, this intriguing pattern of diminishing WSS within the aneurysm over time underscores the hypothesis that the persistent presence of low WSS contributes to the expansion and heightened risk of rupture in aneurysms, which is often associated with high OSI values [34,35].
The oscillatory shear index (OSI) plays a fundamental role in assessing the degree of disruption in fluid flow patterns in the proximity of an aneurysm, holding significant clinical relevance. This metric, ranging from 0 to 0.5, serves as a vital parameter, where a value of 0 designates undisturbed flow, and 0.5 indicates the most severe level of flow perturbation. The minimum OSI value is achieved when the average wall shear stress (AWSS) matches the time-averaged wall shear stress (TAWSS), denoting the preservation of an uninterrupted flow direction. Conversely, the maximum OSI value materializes when the differential between the higher and lower stress averages converges to zero, signifying a complete inversion in the flow direction, often associated with hemodynamic irregularities. Illustrated in Figure 10, the temporal progression of OSI over the duration spanning from t = 0.1 s to t = 0.78 s provides insights into the dynamics of fluid flow behavior within the cardiovascular system. At the onset, t = 0.1 s, the aneurysm region predominantly features an OSI level of approximately around 0.2, with notable elevation in the thoracic aorta. As time progresses to t = 0.2 s, a prominent augmentation in OSI values becomes discernible, with emphasis primarily on the upper segment of the aneurysm. By t = 0.3 s, this elevated OSI level extends over a considerable portion of the aneurysm region. The conspicuous surge in OSI values at t = 0.2 s and t = 0.3 s can be attributed to the heightened velocities prevalent during this specific phase of the cardiac cycle. Of particular significance, the pinnacle OSI value, hovering at approximately 0.5, is observed at multiple positions within both the aorta and aneurysm between t = 0.2 s and t = 0.3 s, signifying the occurrence of substantial flow reversal in these areas. However, in the subsequent temporal intervals, spanning from t = 0.4 s to t = 0.8 s, the OSI profile demonstrates stabilization and notable diminishment, concomitant with a marked reduction in velocity. A noteworthy observation is that during the diastole phase, specifically from t = 0.4 to 0.8 s, the shear stress within the system exhibits lower values, while the OSI registers heightened levels. This observed discrepancy is in consonance with the existing body of literature and underlines the inherent potential for wall deformations and the augmented risk of aneurysm rupture [36,37].
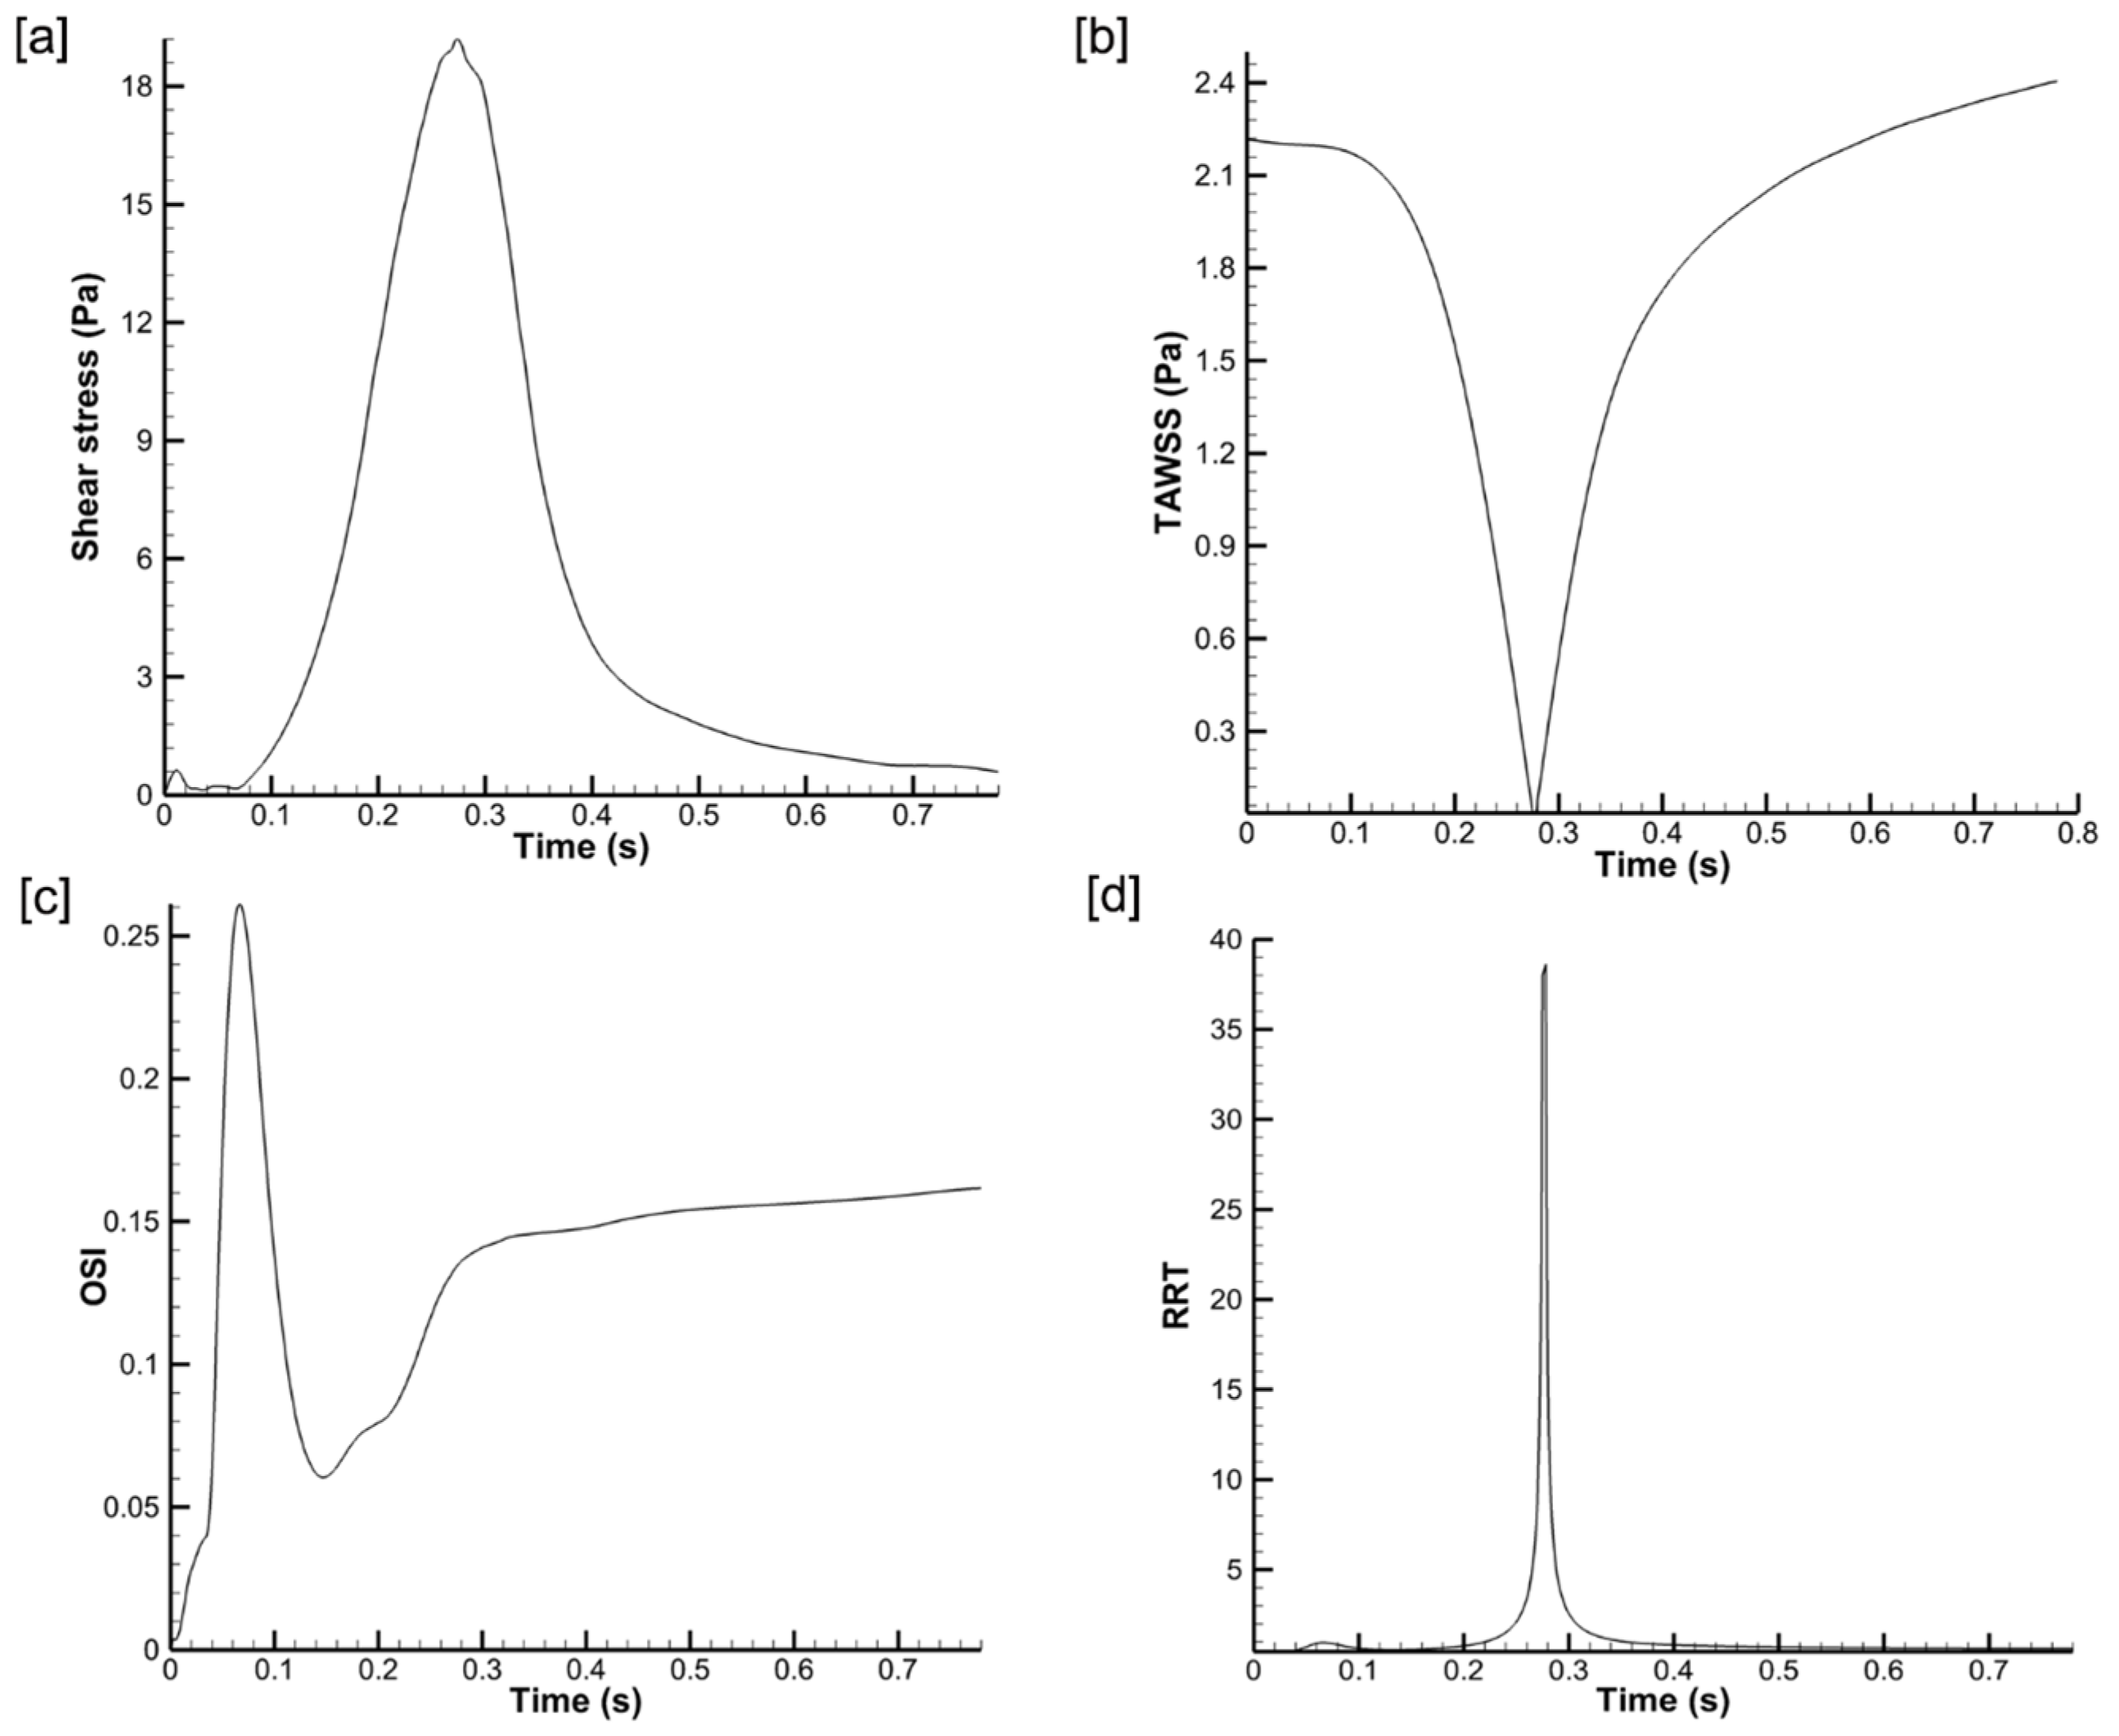
Figure 11 encapsulates a comprehensive assessment of crucial hemodynamic parameters, shedding light on their relationships and implications within the context of AAAs. One of the pivotal parameters, WSS, represented in Figure 11a, exhibits a distinctive zenith immediately post systole. This zenith is intricately aligned with the anticipated surge in blood pressure consequent to ventricular contraction during the systolic phase of the cardiac cycle. While a natural physiological response, this elevation in WSS harms the aneurysm’s internal wall, predisposing it to arterial damage and the peril of rupture, potentially resulting in life-threatening internal hemorrhaging. TAWSS, which measures the fluctuations in WSS that occur during the entire cardiac cycle, portrays a distinct pattern. It demonstrates a steep decline during the systolic phase, indicating high shear stress variation. Following the systolic phase, the TAWSS sharply ascends during the diastolic phase, denoting an abrupt decrease in shear stress (Figure 11b). Furthermore, the OSI profile in Figure 11c offers a unique insight into the cyclic nature of disturbed flow patterns. Elevated OSI levels are most conspicuous at the advent of the systolic phase, corresponding with shear stress fluctuations and the potential for flow reversal. A high OSI is an indicator of disturbed blood flow patterns, which can potentially damage blood cells, amplifying the potential pathological implications within an aneurysm [38]. Lastly, Figure 11d highlights the temporal evolution of RRT, revealing peaks in the vicinity of the systolic phase. Increased RRT within the artery, particularly the aneurysmal region, during this temporal phase signifies prolonged blood residence, a circumstance predisposing the formation of blood clots. These clots, if dislodged, can pose severe health risks as they may travel to critical organs like the heart or brain, resulting in potentially life-threatening conditions such as heart attacks or strokes. The complex interplay of these parameters refines our understanding of the physiological and pathological nuances that underpin the behavior of AAAs, charting a course toward more effective empirical therapeutic strategies for patient-specific management.
5. Conclusions
Our in-depth examination of crucial hemodynamic parameters, namely wall shear stress, time-averaged wall shear stress, the oscillatory shear index, and relative residence time, has enriched our comprehension of the multifaceted aspects of abdominal aortic aneurysms (AAAs). A distinctive feature of this study is the realistic representation of physiological conditions, achieved through the implementation of the Windkessel model, which accounts for volume flow rate, pressure dynamics, and a specific outlet surface area. The outcomes presented here not only demonstrate technical proficiency but also provide a solid foundation for future research, offering insights and opportunities for improved clinical applications in AAA diagnosis and management. In particular, patient-specific data encompassing precise vessel geometry and blood flow velocities extracted from advanced imaging modalities like CT scans or magnetic resonance imaging play a pivotal role in guiding medical decision making for AAAs. The integration of CFDs enables the calculation of shear stress and related parameters, which, in turn, equips healthcare professionals with invaluable insights for AAA assessments and tailored treatment strategies. Notably, regions characterized by elevated shear stress may be identified for targeted interventions, whereas those with lower shear stress may necessitate vigilant monitoring. This patient-specific approach holds immense promise in risk stratification, treatment planning, post-intervention surveillance, and the optimization of intervention timing. By incorporating these findings into clinical practice, healthcare providers are empowered to formulate individualized management plans, offering personalized recommendations and actively engaging patients in their healthcare journey. This patient-centered paradigm enhances treatment outcomes and transcends traditional, one-size-fits-all approaches, thereby revolutionizing AAA management. However, while our study establishes connections between hemodynamic dynamics, recognizing the inherent challenges in pinpointing definitive thresholds for the WSS or OSI that unequivocally lead to aneurysm progression is crucial. The complex interplay of various factors and individual variations poses difficulties in establishing a direct correlation. Furthermore, discussing the translational impact of our findings in clinical practices is essential. Our study acknowledges the need for a more in-depth exploration of how the obtained results could practically benefit clinical applications. It is vital to openly highlight these limitations and acknowledge the ongoing efforts to refine our understanding in these areas. Our commitment to addressing these challenges reflects the dynamic nature of research in hemodynamics and aneurysm progression. Additionally, we recognize the potential for further enriching our study by incorporating analyses of additional hemodynamic parameters in future research. Specifically, we acknowledge the importance of exploring the relative pressure distribution, circulation, or vorticity to enhance the comprehensiveness of our findings. These parameters could offer deeper insights into the dynamics of our proposed model and contribute to a more comprehensive understanding of the physiological implications.
Author Contributions
Conceptualization, S.C.S. methodology, X.H. and I.F.; software, X.H. and I.F.; validation, G.S. and M.M.M.; formal analysis, S.C.S., I.F. and G.S.; investigation, S.C.S., I.F. and G.S.; resources, S.C.S.; writing—original draft preparation, G.S., I.F. and S.C.S.; writing—review and editing, M.M.M.; visualization, I.F.; supervision, S.C.S.; project administration, S.C.S. All authors have read and agreed to the published version of the manuscript.
Funding
This research received no external funding.
Data Availability Statement
The data supporting this study’s findings are available from the corresponding author upon reasonable request.
Acknowledgments
The authors would like to acknowledge the computing facility at the University of Technology Sydney (UTS). The authors used AI-assisted technology (ChatGPT 3.0) for some language editing and grammar checking.
Conflicts of Interest
The authors have no conflicts to disclose.
Ethics Statement
This research project involved the utilization of a freely collected physical model for CFD simulations. No human participants were involved in the simulation or analysis process. As no human participants were involved, the need for informed consent was not applicable for this study.
Abbreviations
| d | Aortic vessel diameter |
| FEM | Finite element method |
| FVM | Finite volume method |
| Gr | Grashof number |
| HLPT | Hybrid Lagrangian particle tracking |
| L | Total length of the aorta |
| La | Total length of the aneurysm |
| PIMPLE | Combination of SIMPLE and PISO |
| PISO | Pressure-Implicit with Splitting of Operators |
| Pr | Prandtl number |
| Q | Flow rate |
| Remax | Maximum Reynolds number |
| Reavg | Average Reynolds number |
| SEM | Spectral element method |
| SIMPLE | Semi-Implicit Method for Pressure-Linked Equations |
| We | Weissenberg number |
| W0 | Womersley number |
| Y | Young’s modulus |
References
- Francis, I.; Saha, S.C. Surface tension effects on flow dynamics and alveolar mechanics in the acinar region of human lung. Heliyon 2022, 8, e11026. [Google Scholar] [CrossRef]
- Francis, I.; Saha, S.C. Computational fluid dynamics and machine learning algorithms analysis of striking particle velocity magnitude, particle diameter, and impact time inside an acinar region of the human lung. Phys. Fluids 2022, 34, 101904. [Google Scholar] [CrossRef]
- Ali, D.; Ozalp, M.; Blanquer, S.B.; Onel, S. Permeability and fluid flow-induced wall shear stress in bone scaffolds with TPMS and lattice architectures: A CFD analysis. Eur. J. Mech. B/Fluids 2020, 79, 376–385. [Google Scholar] [CrossRef]
- Derycke, L.; Avril, S.; Vermunt, J.; Perrin, D.; El Batti, S.; Alsac, J.M.; Millon, A.; Albertini, J.N. Computational prediction of proximal sealing in endovascular abdominal aortic aneurysm repair with unfavorable necks. Comput. Methods Programs Biomed. 2024, 244, 107993. [Google Scholar] [CrossRef]
- Mutlu, O.; Salman, H.E.; Al-Thani, H.; El-Menyar, A.; Qidwai, U.A.; Yalcin, H.C. How does hemodynamics affect rupture tissue mechanics in abdominal aortic aneurysm: Focus on wall shear stress derived parameters, time-averaged wall shear stress, oscillatory shear index, endothelial cell activation potential, and relative residence time. Comput. Biol. Med. 2023, 154, 106609. [Google Scholar] [CrossRef]
- Qiu, Y.; Wang, J.; Zhao, J.; Wang, T.; Zheng, T.; Yuan, D. Association between flow pattern and rupture risk of abdominal aortic aneurysm based on computational fluid dynamics. Eur. J. Vasc. Endovasc. Surg. 2022, 64, 155–164. [Google Scholar] [CrossRef]
- Taylor, T.; Yamaguchi, T. Three-Dimensional Simulation of Blood Flow in an Abdominal Aortic Aneurysm using Steady and Unsteady Computational Methods. ASME Adv. Bioeng. 1992, 22, 229–232. [Google Scholar]
- Taylor, T.; Yamaguchi, T. Three-Dimensional Simulation of Blood Flow in an Abdominal Aortic Aneurysm—Steady and Unsteady Flow Cases. ASME J. Biomech. Eng. 1994, 116, 89–97. [Google Scholar] [CrossRef]
- Vorp, D.A.; Raghavan, M.L.; Webster, M.W. Mechanical wall stress in abdominal aortic aneurysm: Influence of diameter and asymmetry. J. Vasc. Surg. 1998, 27, 632–639. [Google Scholar] [CrossRef]
- Finol, E.A.; Amon, C.H. Blood flow in abdominal aortic aneurysms: Pulsatile flow hemodynamics. J. Biomech. Eng. 2001, 123, 474–484. [Google Scholar] [CrossRef]
- Finol, E.A.; Amon, C.H. Flow-induced wall shear stress in abdominal aortic aneurysms: Part II—Pulsatile flow hemodynamics. Comput. Methods Biomech. Biomed. Eng. 2002, 5, 319–328. [Google Scholar] [CrossRef] [PubMed]
- Guzman, A.; Moraga, N.; Amon, C.H. Pulsatile Non-Newtonian Flow in a Double Aneurysm. ASME Adv. Bioeng. 1997, 36, 87–88. [Google Scholar]
- Finol, E.A.; Amon, C.H. Momentum Transfer in Abdominal Aortic Aneurysms: The Effect of Aneurysm Size in Steady Flow Hemodynamics. In Proceedings of the 34th ASME National Heat Transfer Conference—NHTC 2000, Pittsburgh, PA, USA, 21 August 2000. No. NHTC2000-12205. [Google Scholar]
- Finol, E.A.; Keyhani, K.; Amon, C.H. The effect of asymmetry in abdominal aortic aneurysms under physiologically realistic pulsatile flow conditions. J. Biomech. Eng. 2003, 125, 207. [Google Scholar] [CrossRef] [PubMed]
- Li, Z.; Kleinstreuer, C. Blood flow and structure interactions in a stented abdominal aortic aneurysm model. Med. Eng. Phys. 2005, 27, 369–382. [Google Scholar] [CrossRef] [PubMed]
- Frauenfelder, T.; Lotfey, M.; Boehm, T.; Wildermuth, S. Computational fluid dynamics: Hemodynamic changes in abdominal aortic aneurysm after stent-graft implantation. Cardio Vasc. Interv. Radiol. 2006, 29, 613–623. [Google Scholar] [CrossRef]
- Hardman, D.; Doyle, B.J.; Semple, S.I.K.; Richards, J.M.J.; Newby, D.E.; Easson, W.J.; Hoskins, P.R. On the prediction of monocyte deposition in abdominal aortic aneurysms using computational fluid dynamics. Proc. IMechE Part H J. Eng. Med. 2013, 227, 1114–1124. [Google Scholar] [CrossRef]
- Deplano, V.; Knapp, Y.; Bailly, L.; Bertrand, E. Flow of a blood analogue fluid in a compliant abdominal aortic aneurysm model: Experimental modeling. J. Biomech. 2014, 47, 1262–1269. [Google Scholar] [CrossRef]
- Rana, M.S.; Rubby, M.F.; Hasan, A.B.M.T. Study of physiological flow through an abdominal aortic aneurysm (AAA). Procedia Eng. 2015, 105, 885–892. [Google Scholar] [CrossRef]
- Vergara, C.; Van, D.L.; Quadrio, M.; Formaggia, L.; Domanin, M. Large eddy simulations of blood dynamics in abdominal aortic aneurysms. Med. Eng. Phys. 2017, 47, 38–46. [Google Scholar] [CrossRef]
- Shit, G.C.; Majee, S. Magnetic field interaction with blood flow and heat transfer through diseased artery having Abdominal Aortic Aneurysm. Eur. J. Mech.-B/Fluids 2018, 71, 1–14. [Google Scholar] [CrossRef]
- Joly, F.; Soulez, G.; Garcia, D.; Lessard, S.; Kauffmann, C. Flow stagnation volume and abdominal aortic aneurysm growth: Insights from patient-specific computational flow dynamics of Lagrangian-coherent structures. Comput. Biol. Med. 2018, 92, 98–109. [Google Scholar] [CrossRef]
- Elhanafy, A.; Guaily, A.; Elsaid, A. Numerical simulation of blood flow in abdominal aortic aneurysms: Effects of blood shear-thinning and viscoelastic properties. Math. Comput. Simul. 2019, 160, 55–71. [Google Scholar] [CrossRef]
- Espa, S.; Moroni, M.; Boniforti, M.A. In-vitro simulation of the blood flow in an axisymmetric abdominal aortic aneurysm. Appl. Sci. 2019, 9, 4560. [Google Scholar] [CrossRef]
- Jafarzadeh, S.; Sadr, A.N.; Kaffash, E.; Goudarzi, S.; Golab, E.; Karimipour, A. The Effect of Hematocrit and Nanoparticles Diameter on Hemodynamic Parameters and Drug Delivery in Abdominal Aortic Aneurysm with Consideration of Blood Pulsatile Flow. Comput. Methods Programs Biomed. 2020, 195, 105545. [Google Scholar] [CrossRef]
- Alsabery, A.I.; Ismael, M.A.; Al-Hadraawy, S.K.; Ghalambaz, M.; Hashim, I.; Chamkha, A.J. Fluid-structure interaction model of blood flow in abdominal aortic aneurysms with thermic treatment. Alex. Eng. J. 2023, 64, 81–95. [Google Scholar] [CrossRef]
- Hussain, A.; Dar, M.N.R.; Alrasheedi, N.H.; Hajlaoui, K.; Hamida, M.B.B. Assessment of heat transfer and the consequences of iron oxide (Fe3O4) nanoparticles on flow of blood in an abdominal aortic aneurysm. Heliyon 2023, 9, e17660. [Google Scholar] [CrossRef] [PubMed]
- Gallo, D.; De Santis, G.; Negri, F.; Tresoldi, D.; Ponzini, R.; Massai, D.; Deriu, M.A.; Segers, P.; Verhegghe, B.; Rizzo, G.; et al. On the use of in vivo measured flow rates as boundary conditions for image-based hemodynamic models of the human aorta: Implications for indicators of abnormal flow. Ann. Biomed. Eng. 2012, 40, 729–741. [Google Scholar] [CrossRef] [PubMed]
- Afrouzi, H.H.; Ahmadian, M.; Hosseini, M.; Arasteh, H.; Toghraie, D.; Rostami, S. Simulation of blood flow in arteries with aneurysm: Lattice Boltzmann Approach (LBM). Comput. Methods Programs Biomed. 2020, 187, 105312. [Google Scholar] [CrossRef]
- Boccadifuoco, A.; Mariotti, A.; Celi, S.; Martini, N.; Salvetti, M.V. Uncertainty quantification in numerical simulations of the flow in thoracic aortic aneurysms. In Proceedings of the ECCOMAS Congress 2016, VII European Congress on Computational Methods in Applied Sciences and Engineering, Crete Island, Greece, 5–10 June 2016. [Google Scholar]
- Westerhof, N.; Lankhaar, J.-W.; Westerhof, B.E. The arterial windkessel. Med. Biol. Eng. Comput. 2009, 47, 131–141. [Google Scholar] [CrossRef]
- Wang, X.; Ghayesh, M.H.; Kotousov, A.; Zander, A.C.; Amabili, M.; Dawson, J.A.; Psaltis, P.J. Biomechanics of abdominal aortic aneurysm in the framework of Windkessel effect and fully-developed inflow velocity via two-way non-linear FSI. Int. J. Non-Linear Mech. 2023, 157, 104517. [Google Scholar] [CrossRef]
- Esmaeilpour, M.; Abdollahzadeh, M. Free convection and entropy generation of nanofluid inside an enclosure with different patterns of vertical wavy walls. Int. J. Therm. Sci. 2012, 52, 127–136. [Google Scholar] [CrossRef]
- Omodaka, S.; Sugiyama, S.I.; Inoue, T.; Funamoto, K.; Fujimura, M.; Shimizu, H.; Hayase, T.; Takahashi, A.; Tominaga, T. Local hemodynamics at the rupture point of cerebral aneurysms determined by computational fluid dynamics analysis. Cerebrovasc. Dis. 2012, 34, 121–129. [Google Scholar] [CrossRef] [PubMed]
- Nagargoje, M.S.; Valeti, C.; Manjunath, N.; Akhade, B.; Sudhir, B.J.; Patnaik, B.S.V.; Kannath, S.K. Influence of morphological parameters on hemodynamics in internal carotid artery bifurcation aneurysms. Phys. Fluids 2022, 34, 101901. [Google Scholar] [CrossRef]
- Lu, G.; Huang, L.; Zhang, X.L.; Wang, S.Z.; Hong, Y.; Hu, Z.; Geng, D.Y. Influence of hemodynamic factors on rupture of intracranial aneurysms: Patient-specific 3D mirror aneurysms model computational fluid dynamics simulation. Am. J. Neuroradiol. 2011, 32, 1255–1261. [Google Scholar] [CrossRef]
- Xiang, J.; Natarajan, S.K.; Tremmel, M.; Ma, D.; Mocco, J.; Hopkins, L.N.; Siddiqui, A.H.; Levy, E.I.; Meng, H. Hemodynamic-morphologic discriminants for intracranial aneurysm rupture. Stroke 2011, 42, 144–152. [Google Scholar] [CrossRef]
- Ku, D.N. Blood flow in arteries. Annu. Rev. Fluid Mech. 1997, 29, 399–434. [Google Scholar] [CrossRef]
Figure 1.
Realistic physical model of abdominal aortic aneurysm featuring the abdominal aneurysm, thoracic aorta, renal arteries (5,6), iliac arteries (1,2,3,4), the inferior mesenteric artery (7), and a blood flow inlet.
Figure 1.
Realistic physical model of abdominal aortic aneurysm featuring the abdominal aneurysm, thoracic aorta, renal arteries (5,6), iliac arteries (1,2,3,4), the inferior mesenteric artery (7), and a blood flow inlet.
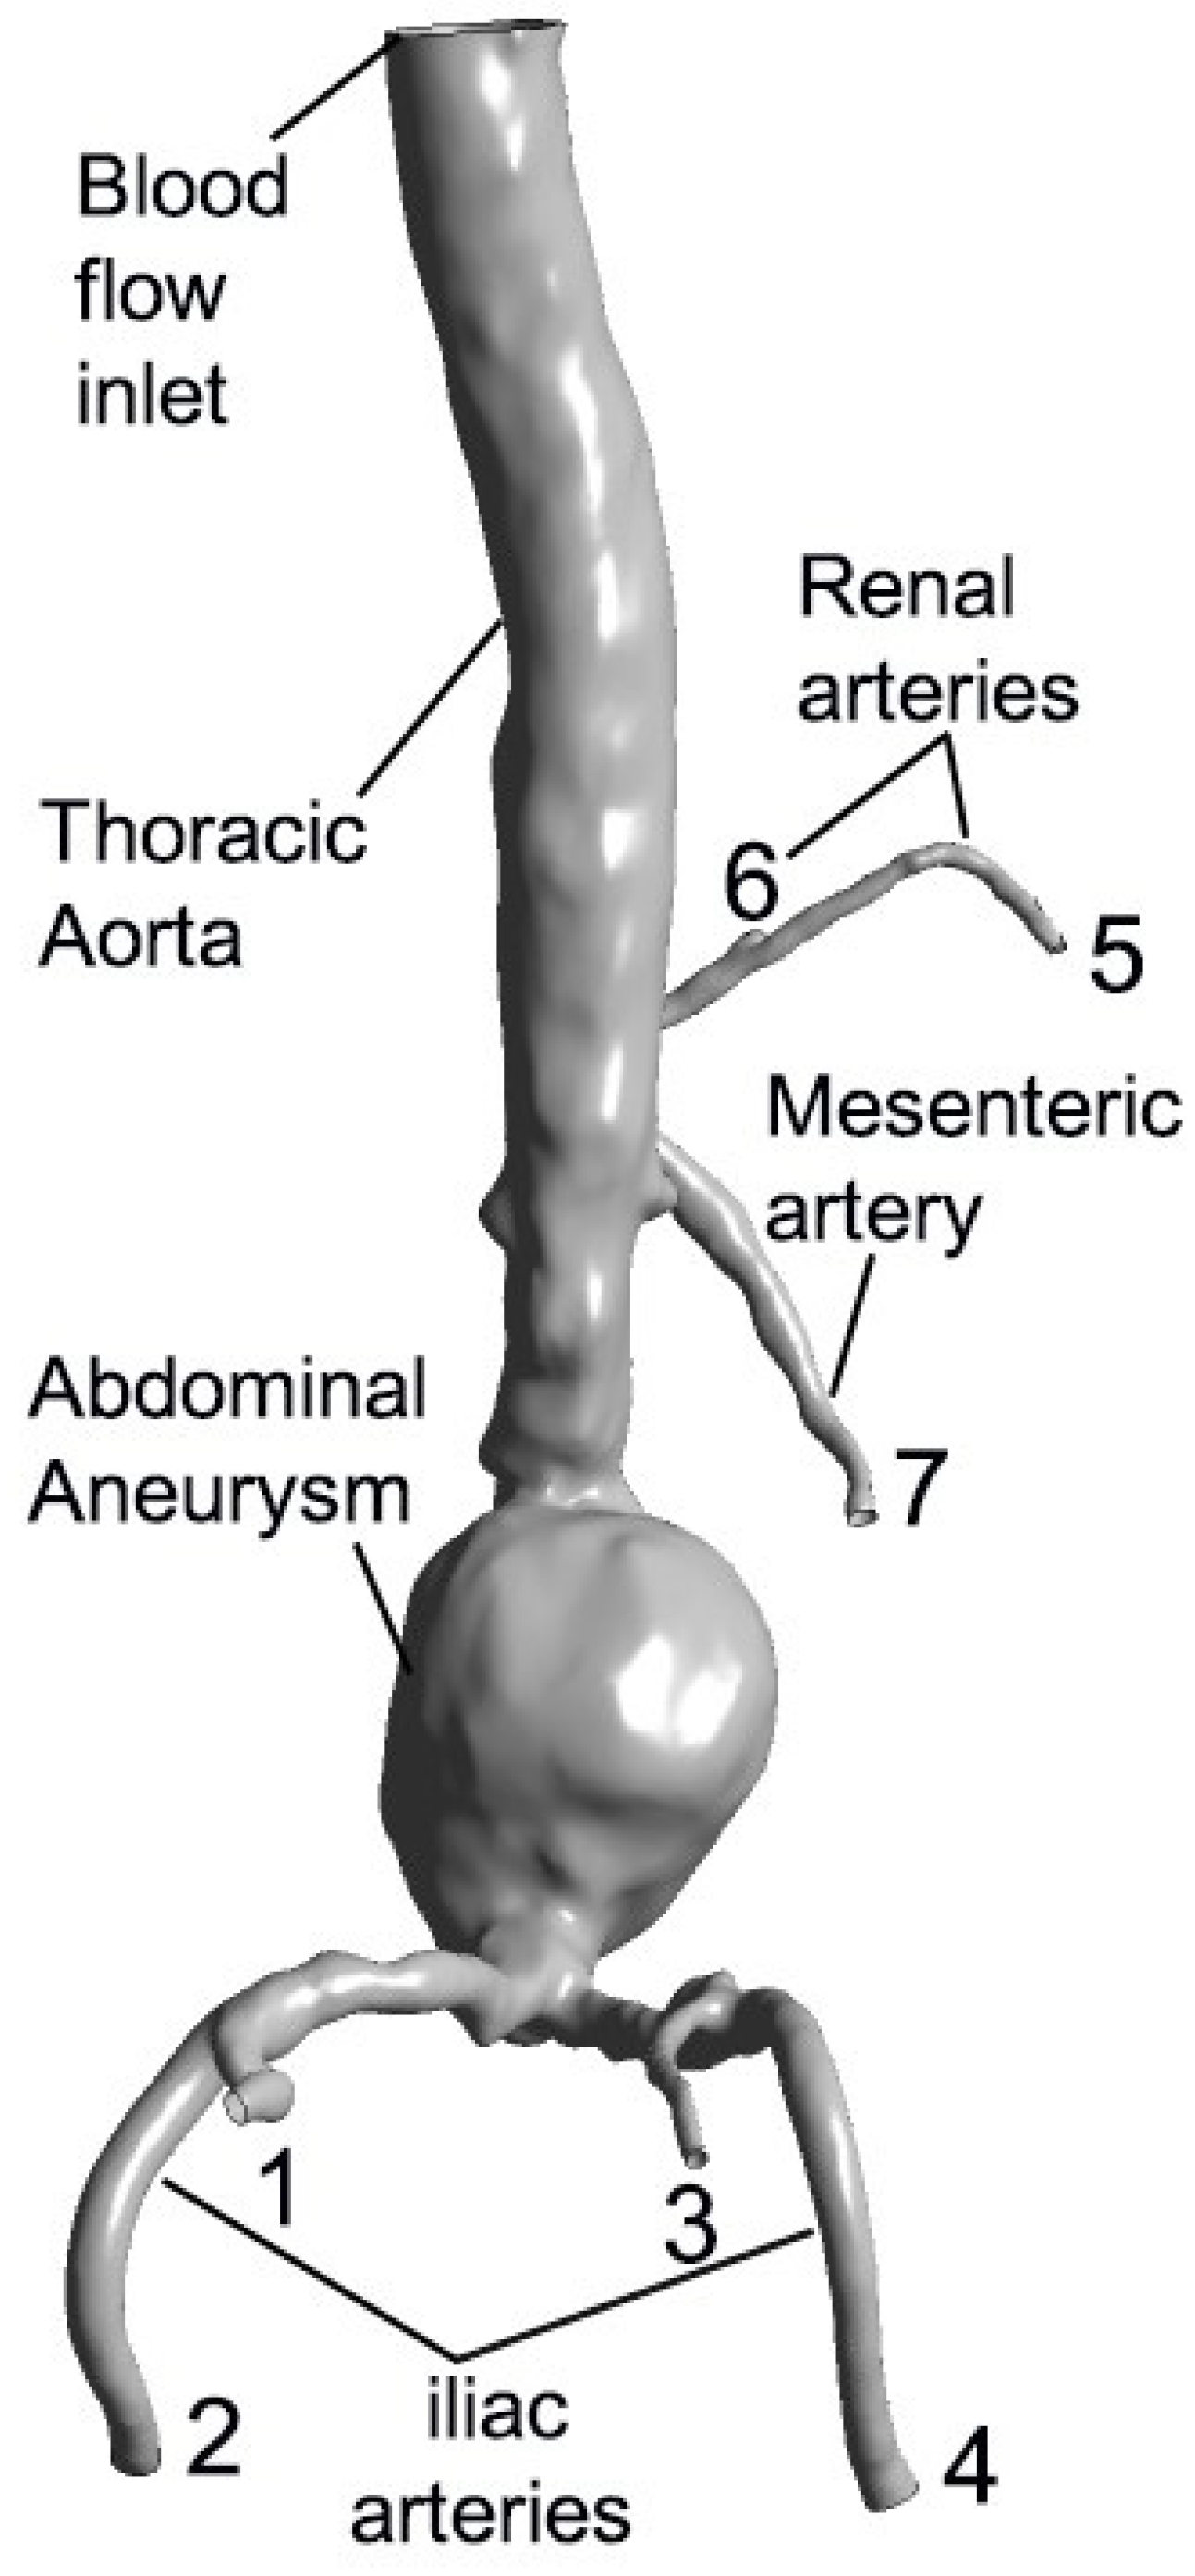
Figure 2.
Grid independence test: A comparative evaluation of the surface-weighted average total pressure (Pa) and shear stress (Pa) across varying grid resolutions, demonstrating consistency and convergence at 6 million volume elements.
Figure 2.
Grid independence test: A comparative evaluation of the surface-weighted average total pressure (Pa) and shear stress (Pa) across varying grid resolutions, demonstrating consistency and convergence at 6 million volume elements.
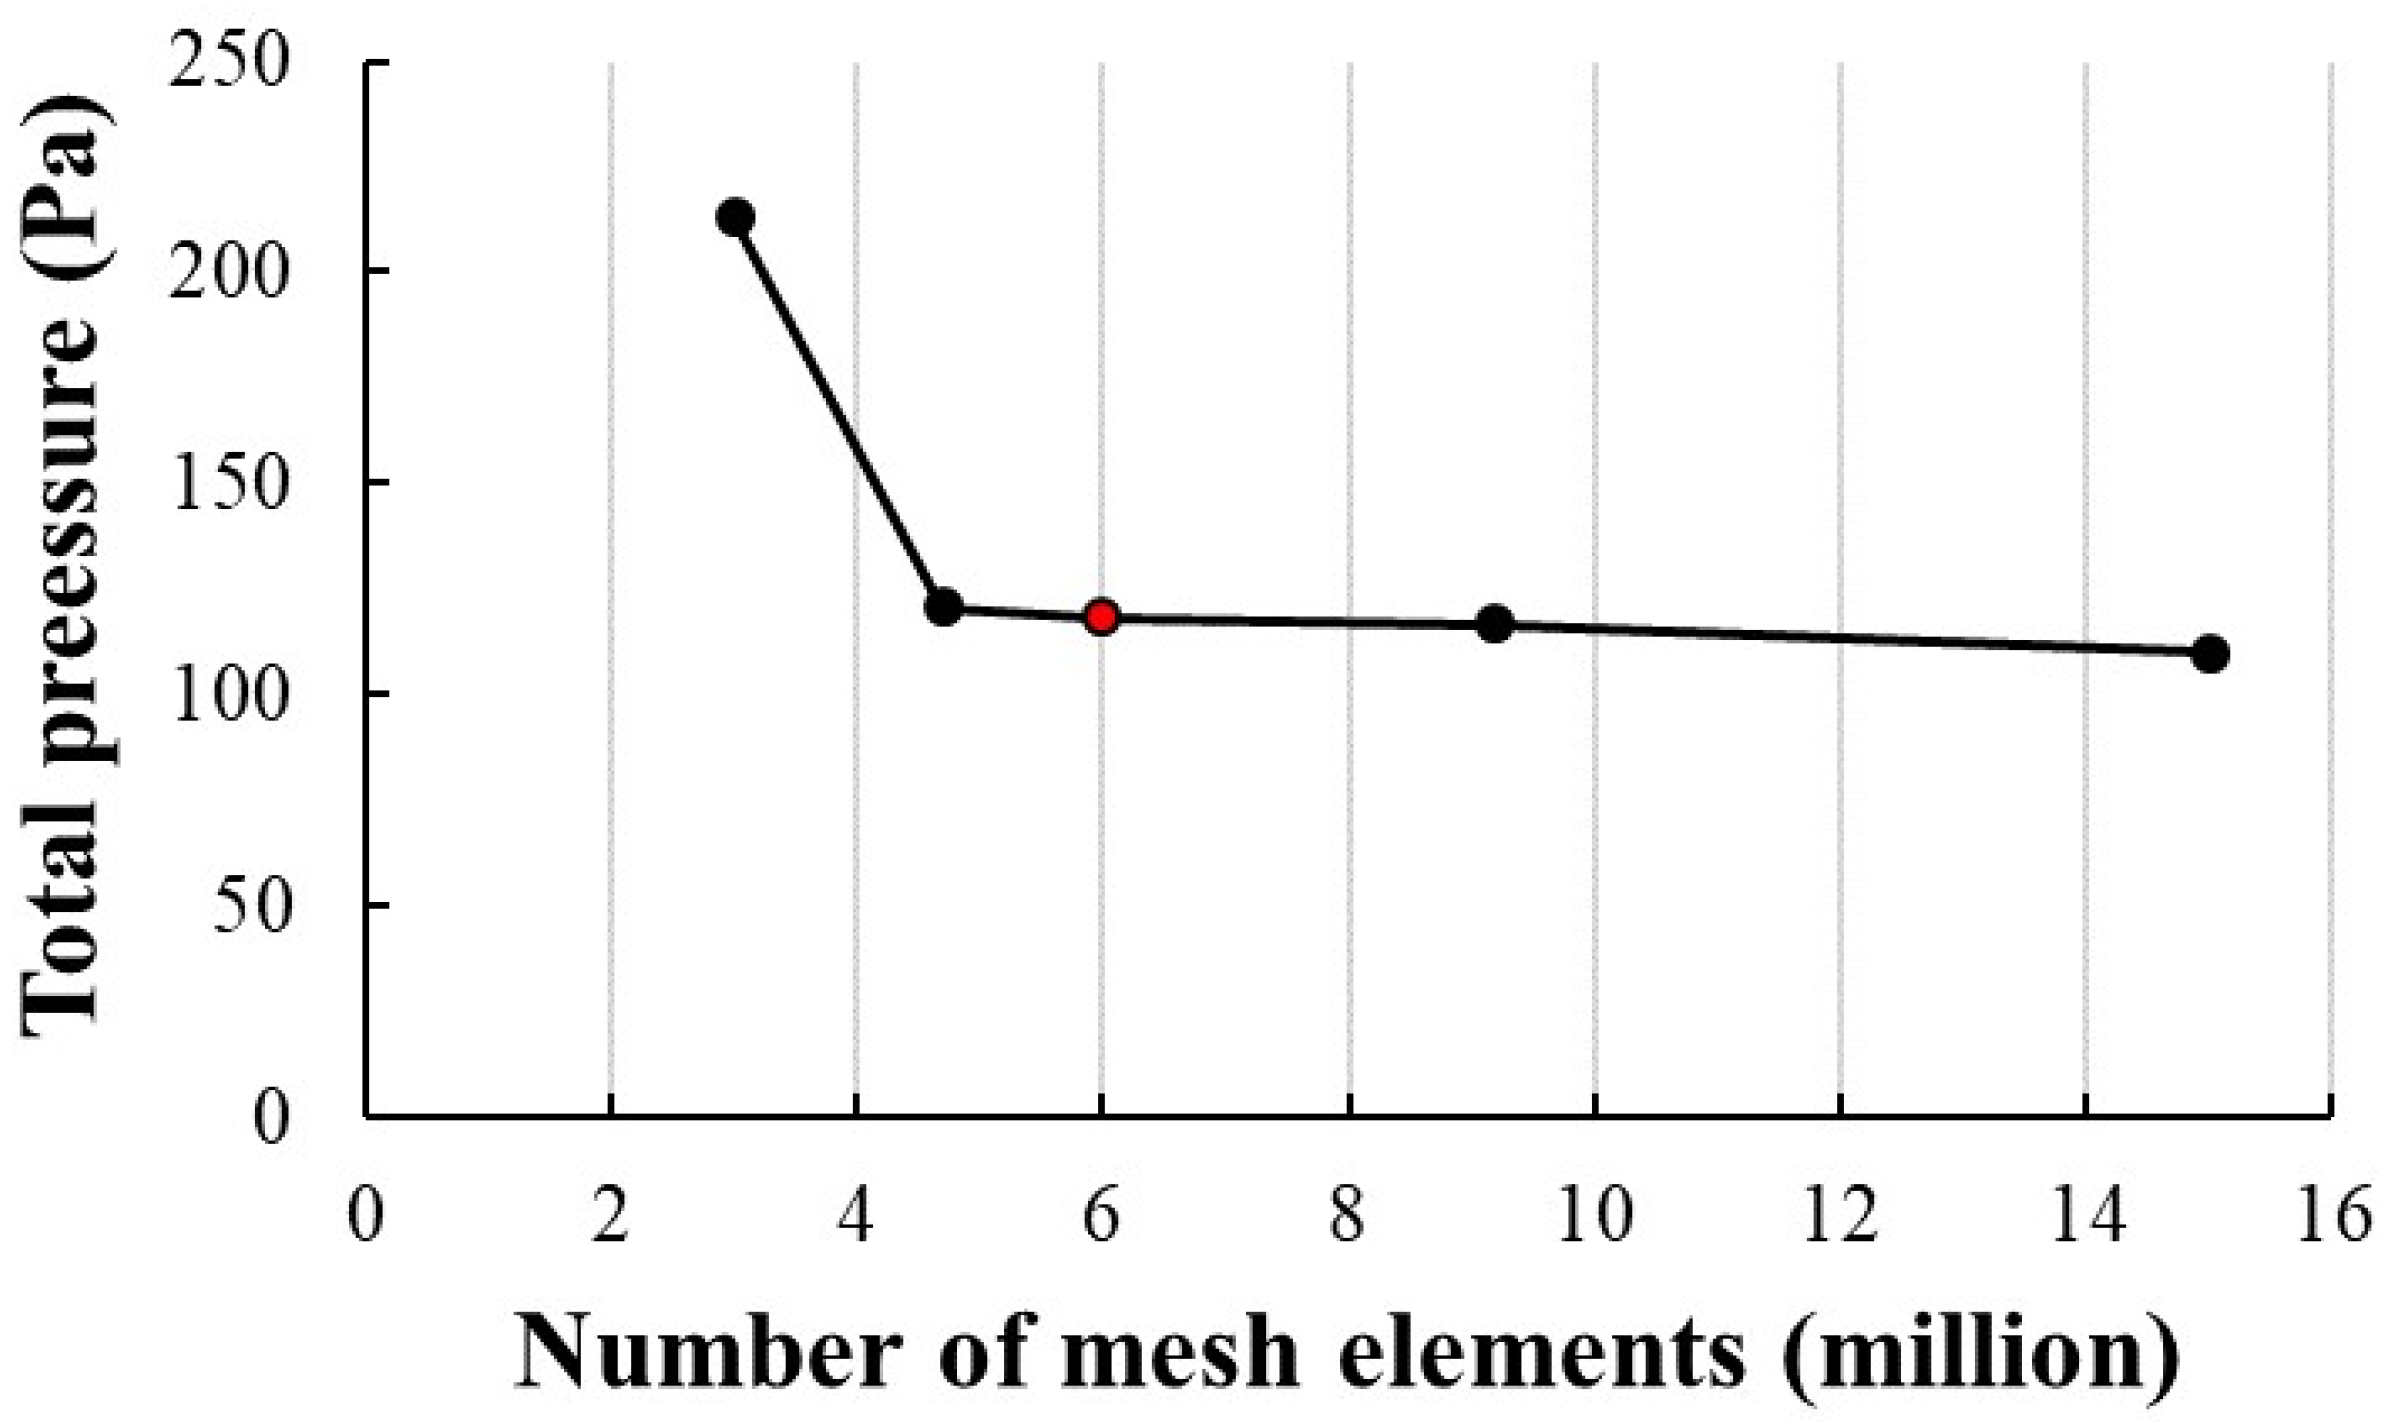
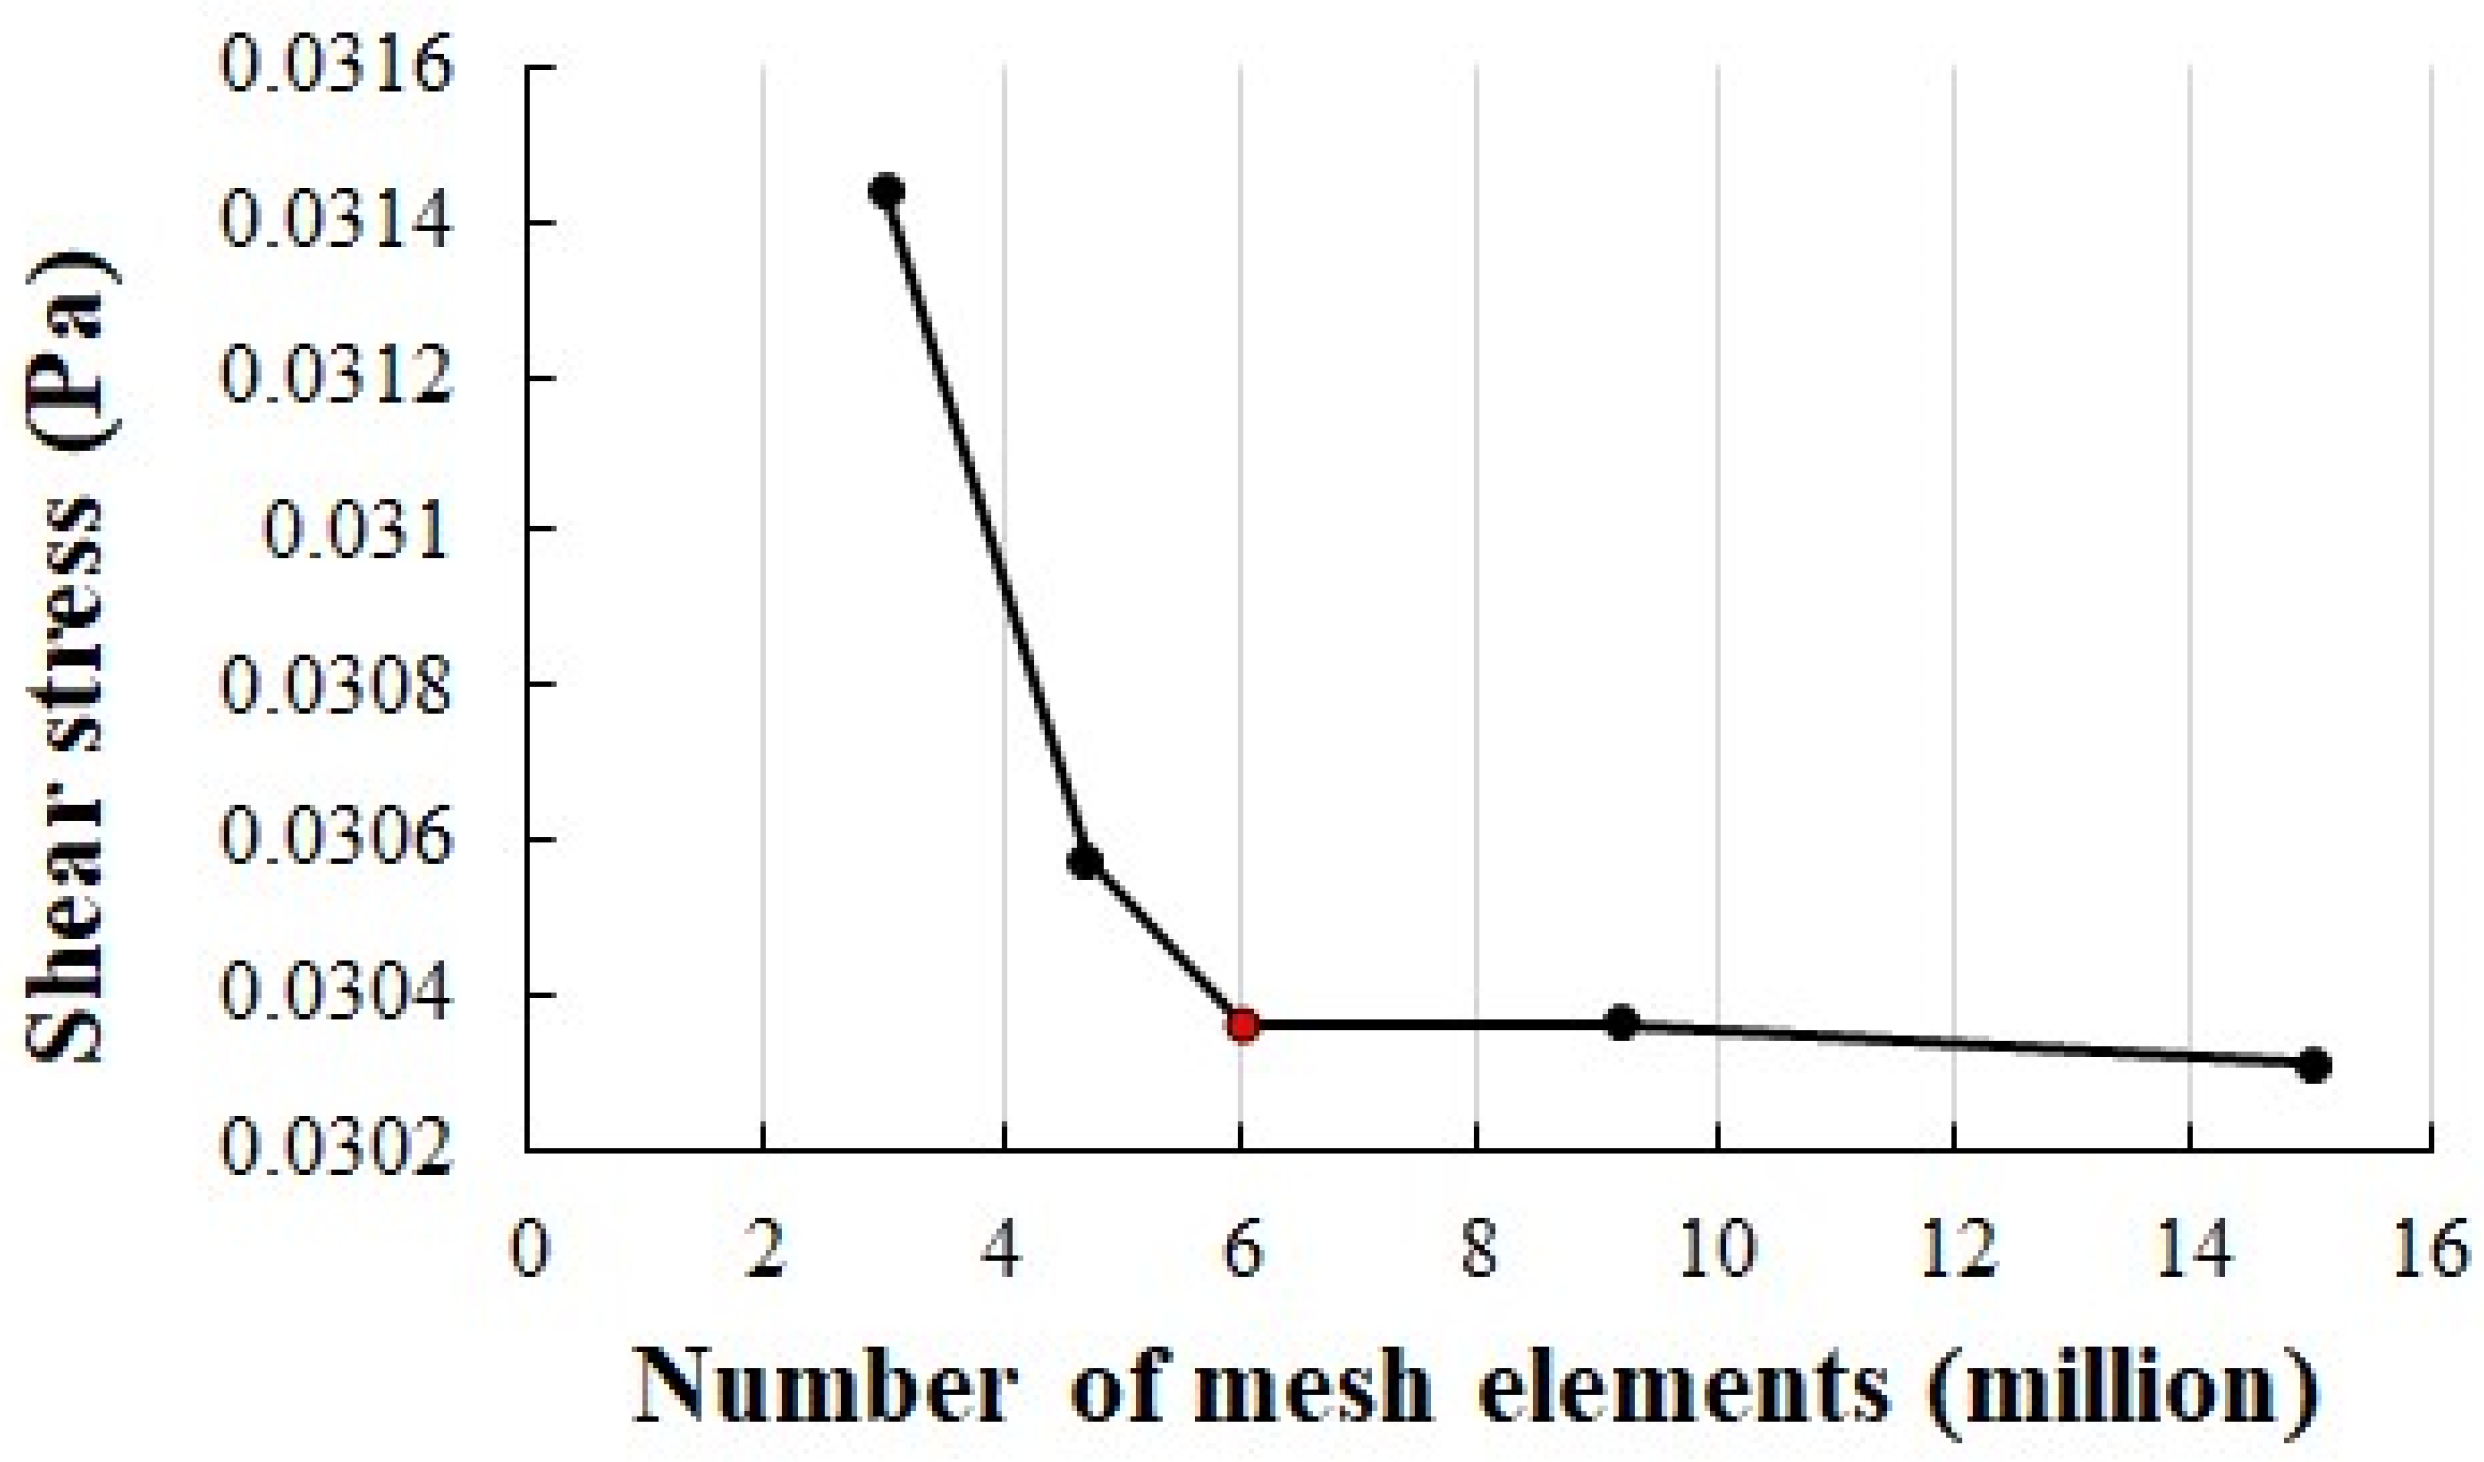
Figure 3.
Tetrahedral volume mesh of AAA geometry with zoomed-in views of the abdominal aneurysm, inlet of blood flow, and thoracic aorta.
Figure 3.
Tetrahedral volume mesh of AAA geometry with zoomed-in views of the abdominal aneurysm, inlet of blood flow, and thoracic aorta.
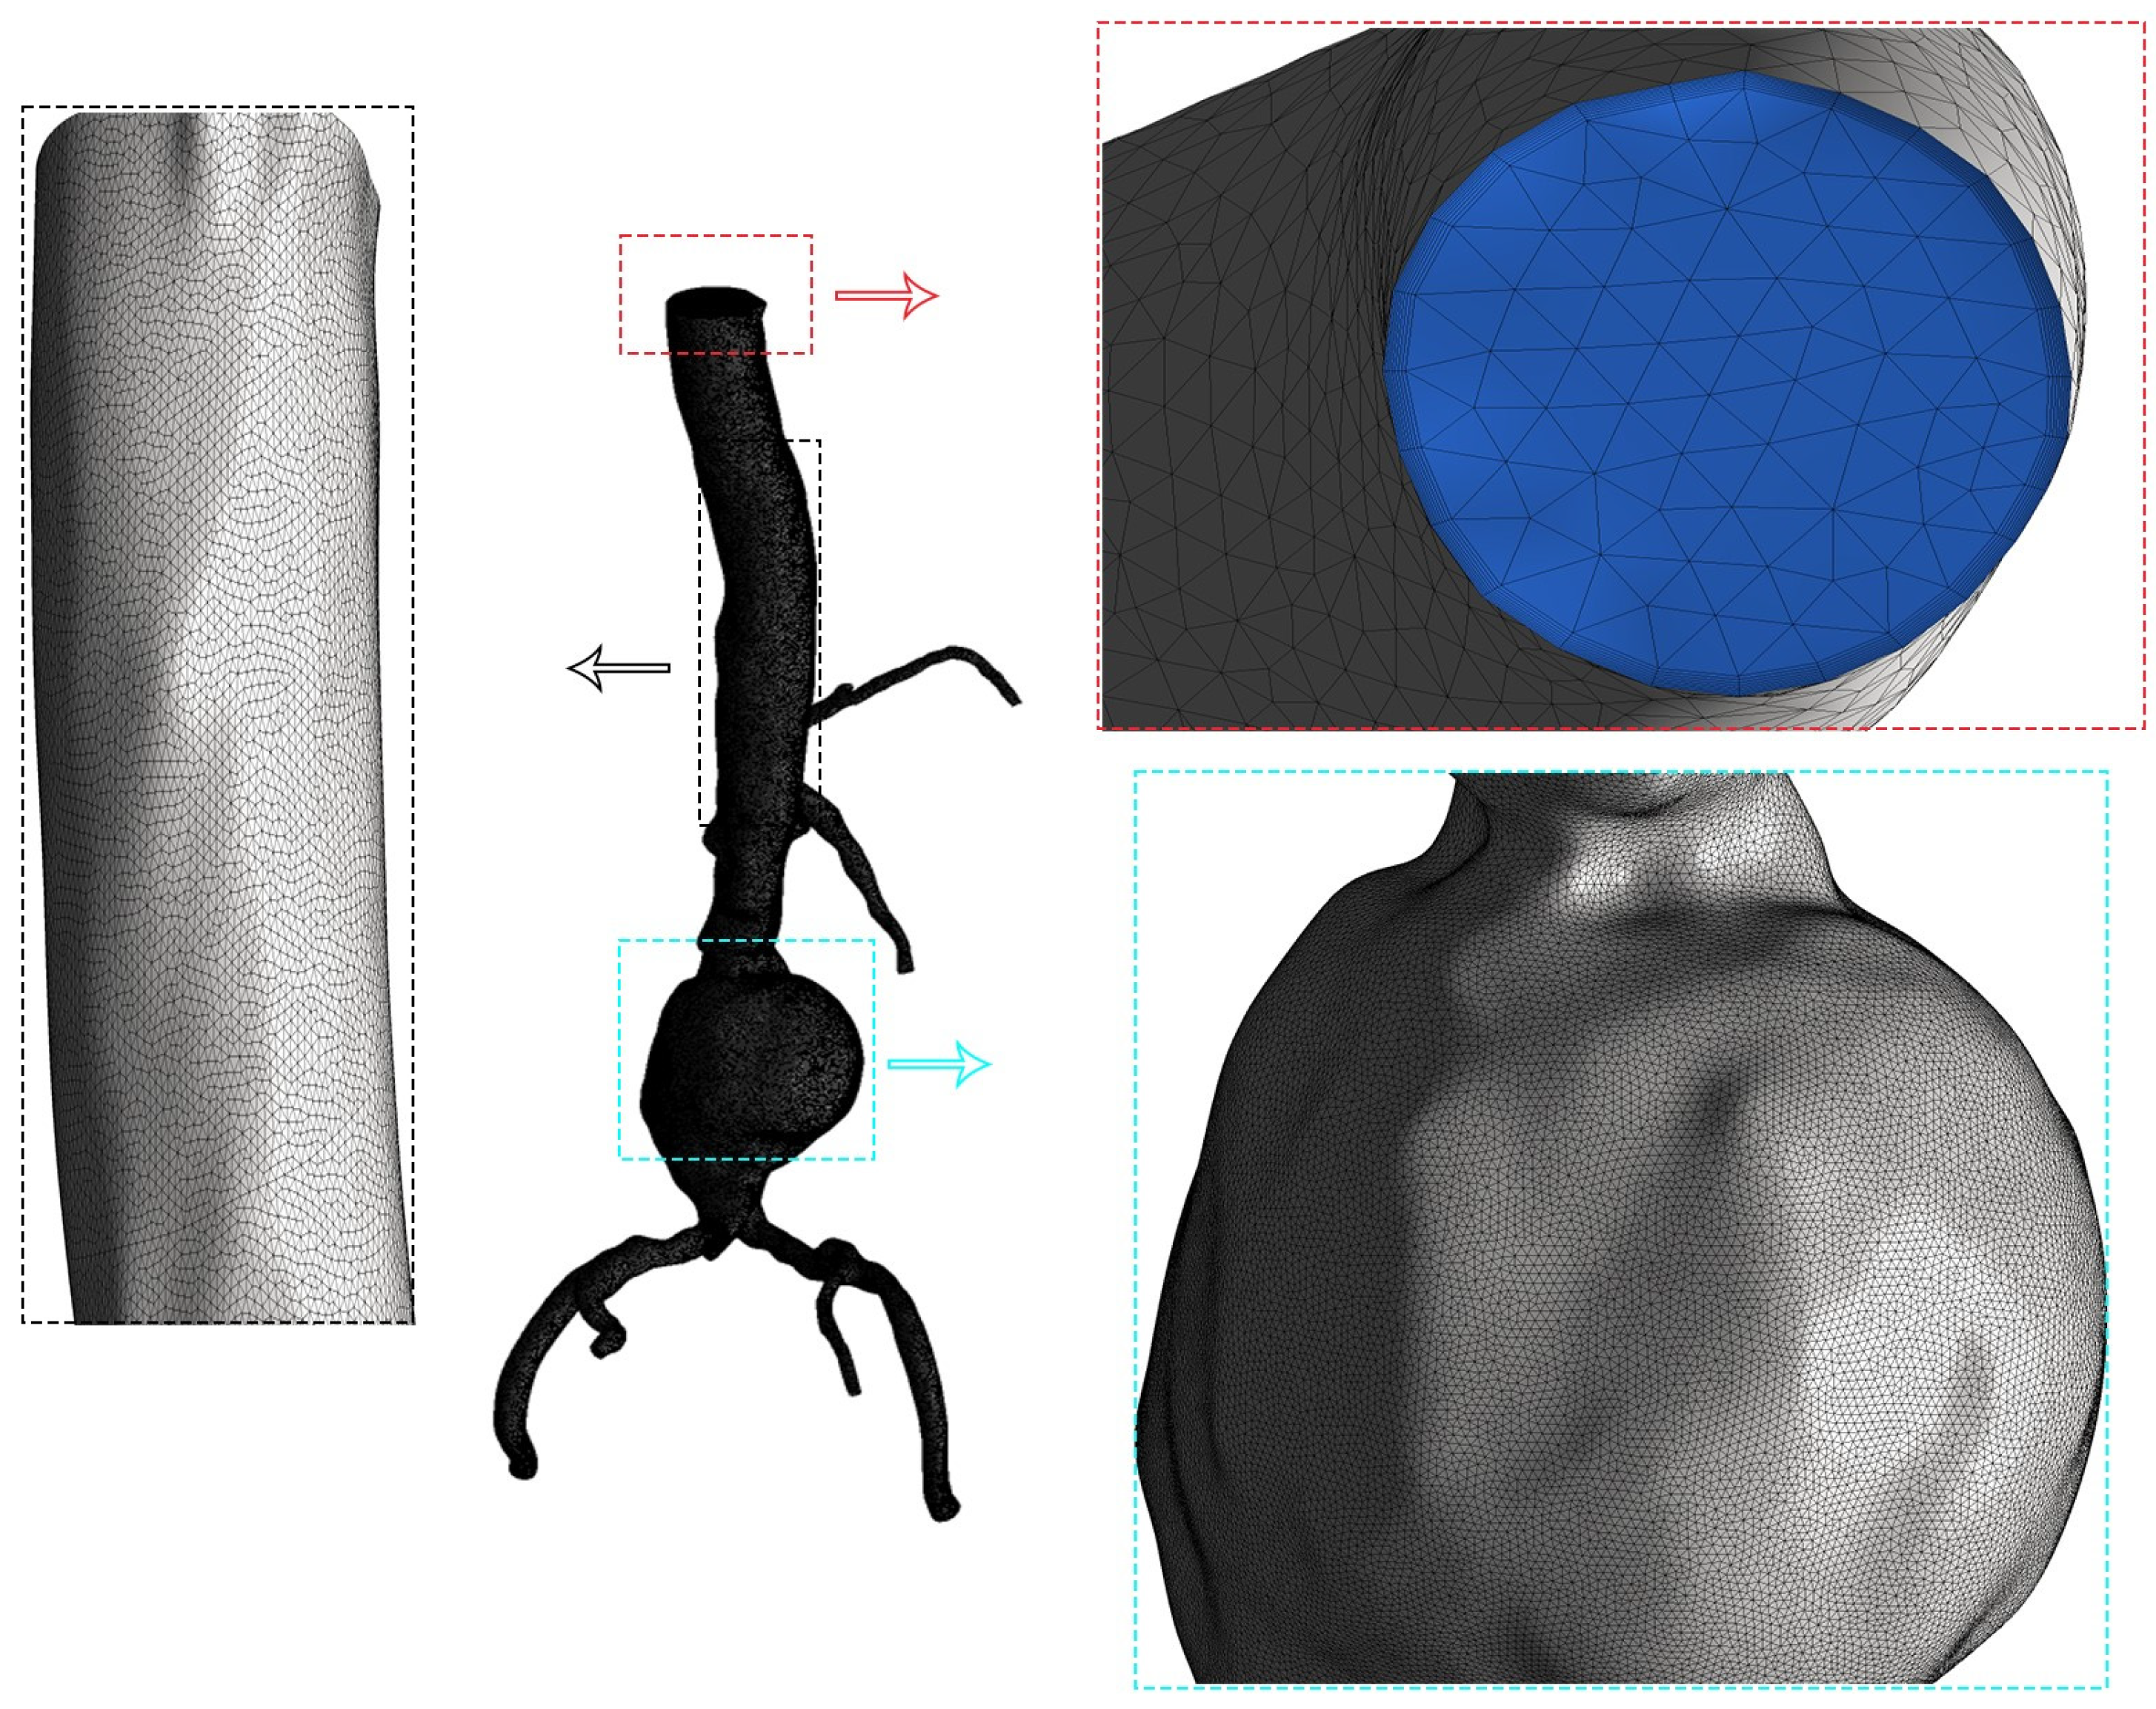
Figure 4.
Mass flow rate of inlet blood flow precisely representing physiological cardiac cycle phases. Systole (0.3 s) witnesses a forceful ventricular contraction, resulting in a steep flow rate surge from 0.1 to 0.3 s. Diastole (0.5 s) follows, allowing ventricular relaxation and a flow rate decline to near-zero values by 0.5 s.

Figure 5.
Pressure (mmHg) profiles at seven outlets throughout a complete cardiac cycle of 0.8 s. The systole phase (0.3 s) marks vigorous heart contraction, leading to dynamic pressure fluctuations. The subsequent diastole phase (0.5 s) brings relaxation and stable minimum pressure.
Figure 5.
Pressure (mmHg) profiles at seven outlets throughout a complete cardiac cycle of 0.8 s. The systole phase (0.3 s) marks vigorous heart contraction, leading to dynamic pressure fluctuations. The subsequent diastole phase (0.5 s) brings relaxation and stable minimum pressure.
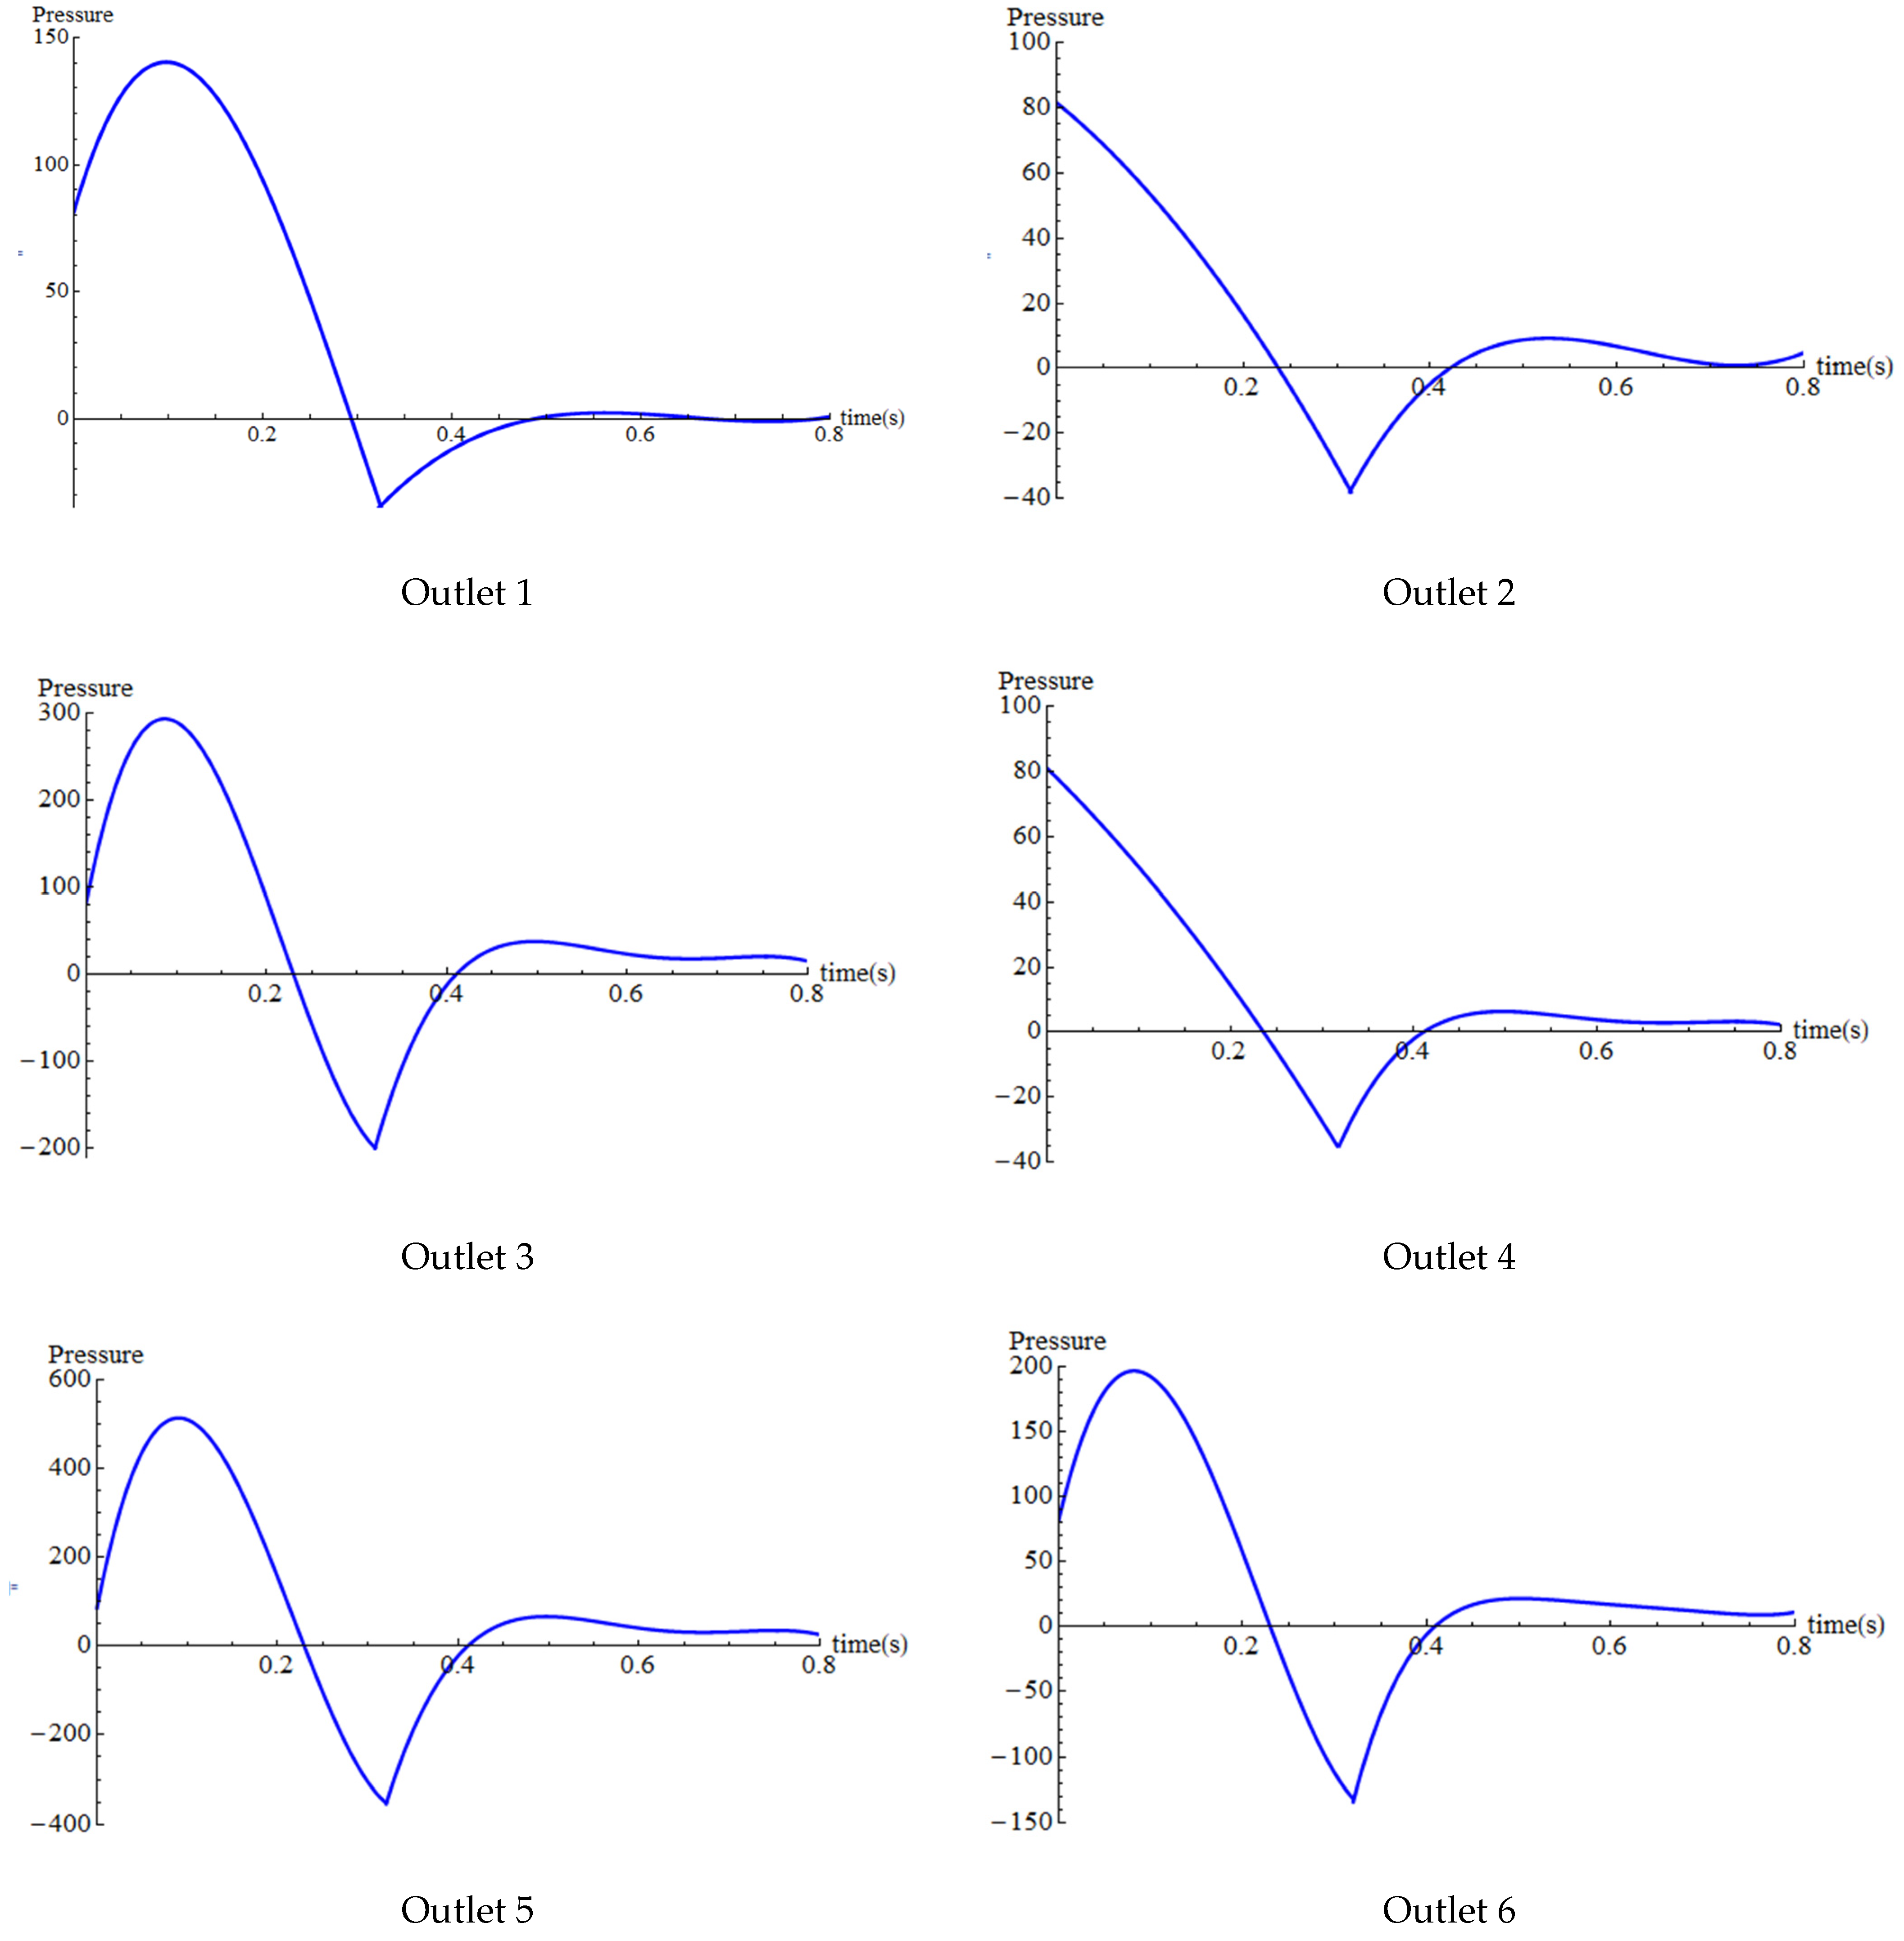
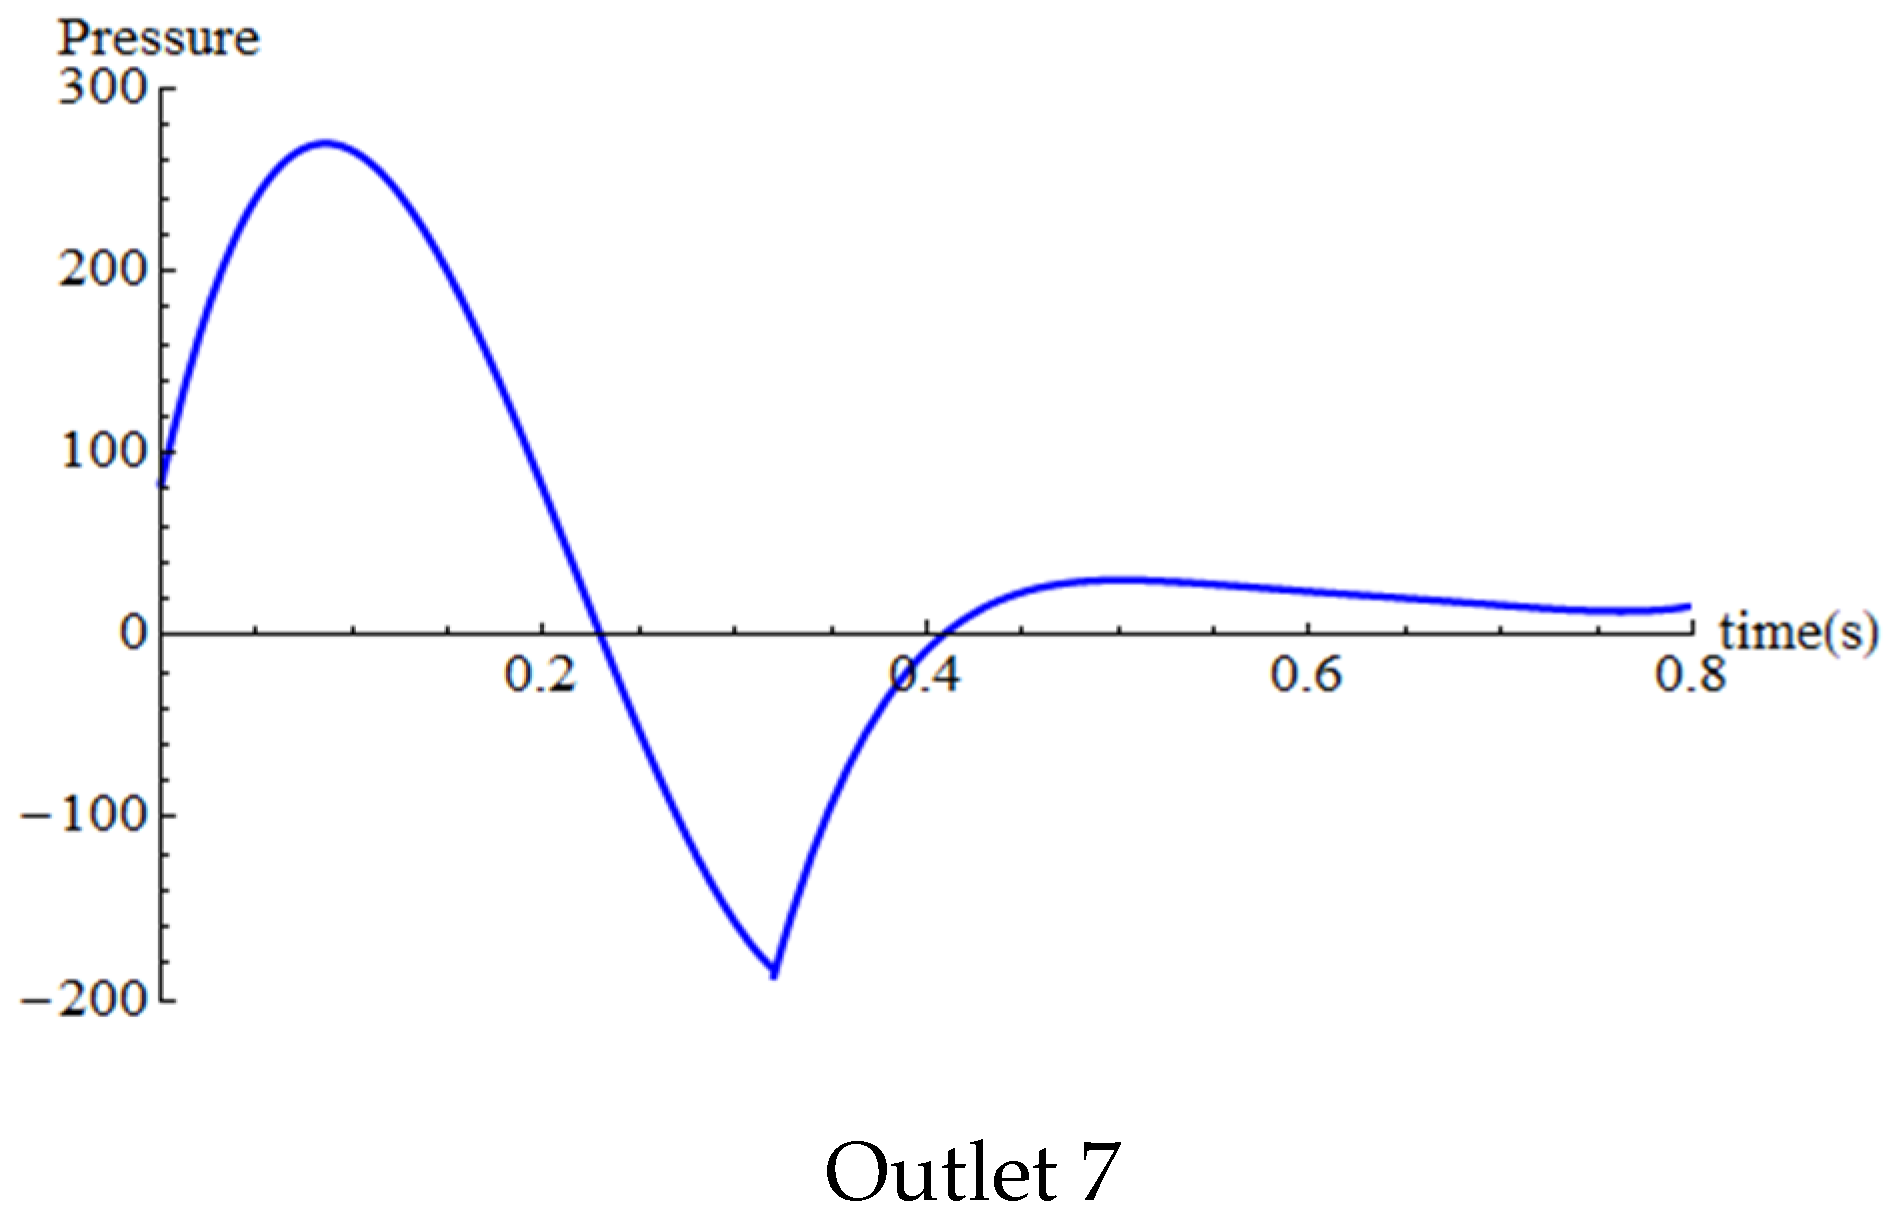
Figure 6.
Comparative analysis of our isotherm pattern with that of Esmaeilpour and Abdollahzadeh [33].
Figure 6.
Comparative analysis of our isotherm pattern with that of Esmaeilpour and Abdollahzadeh [33].
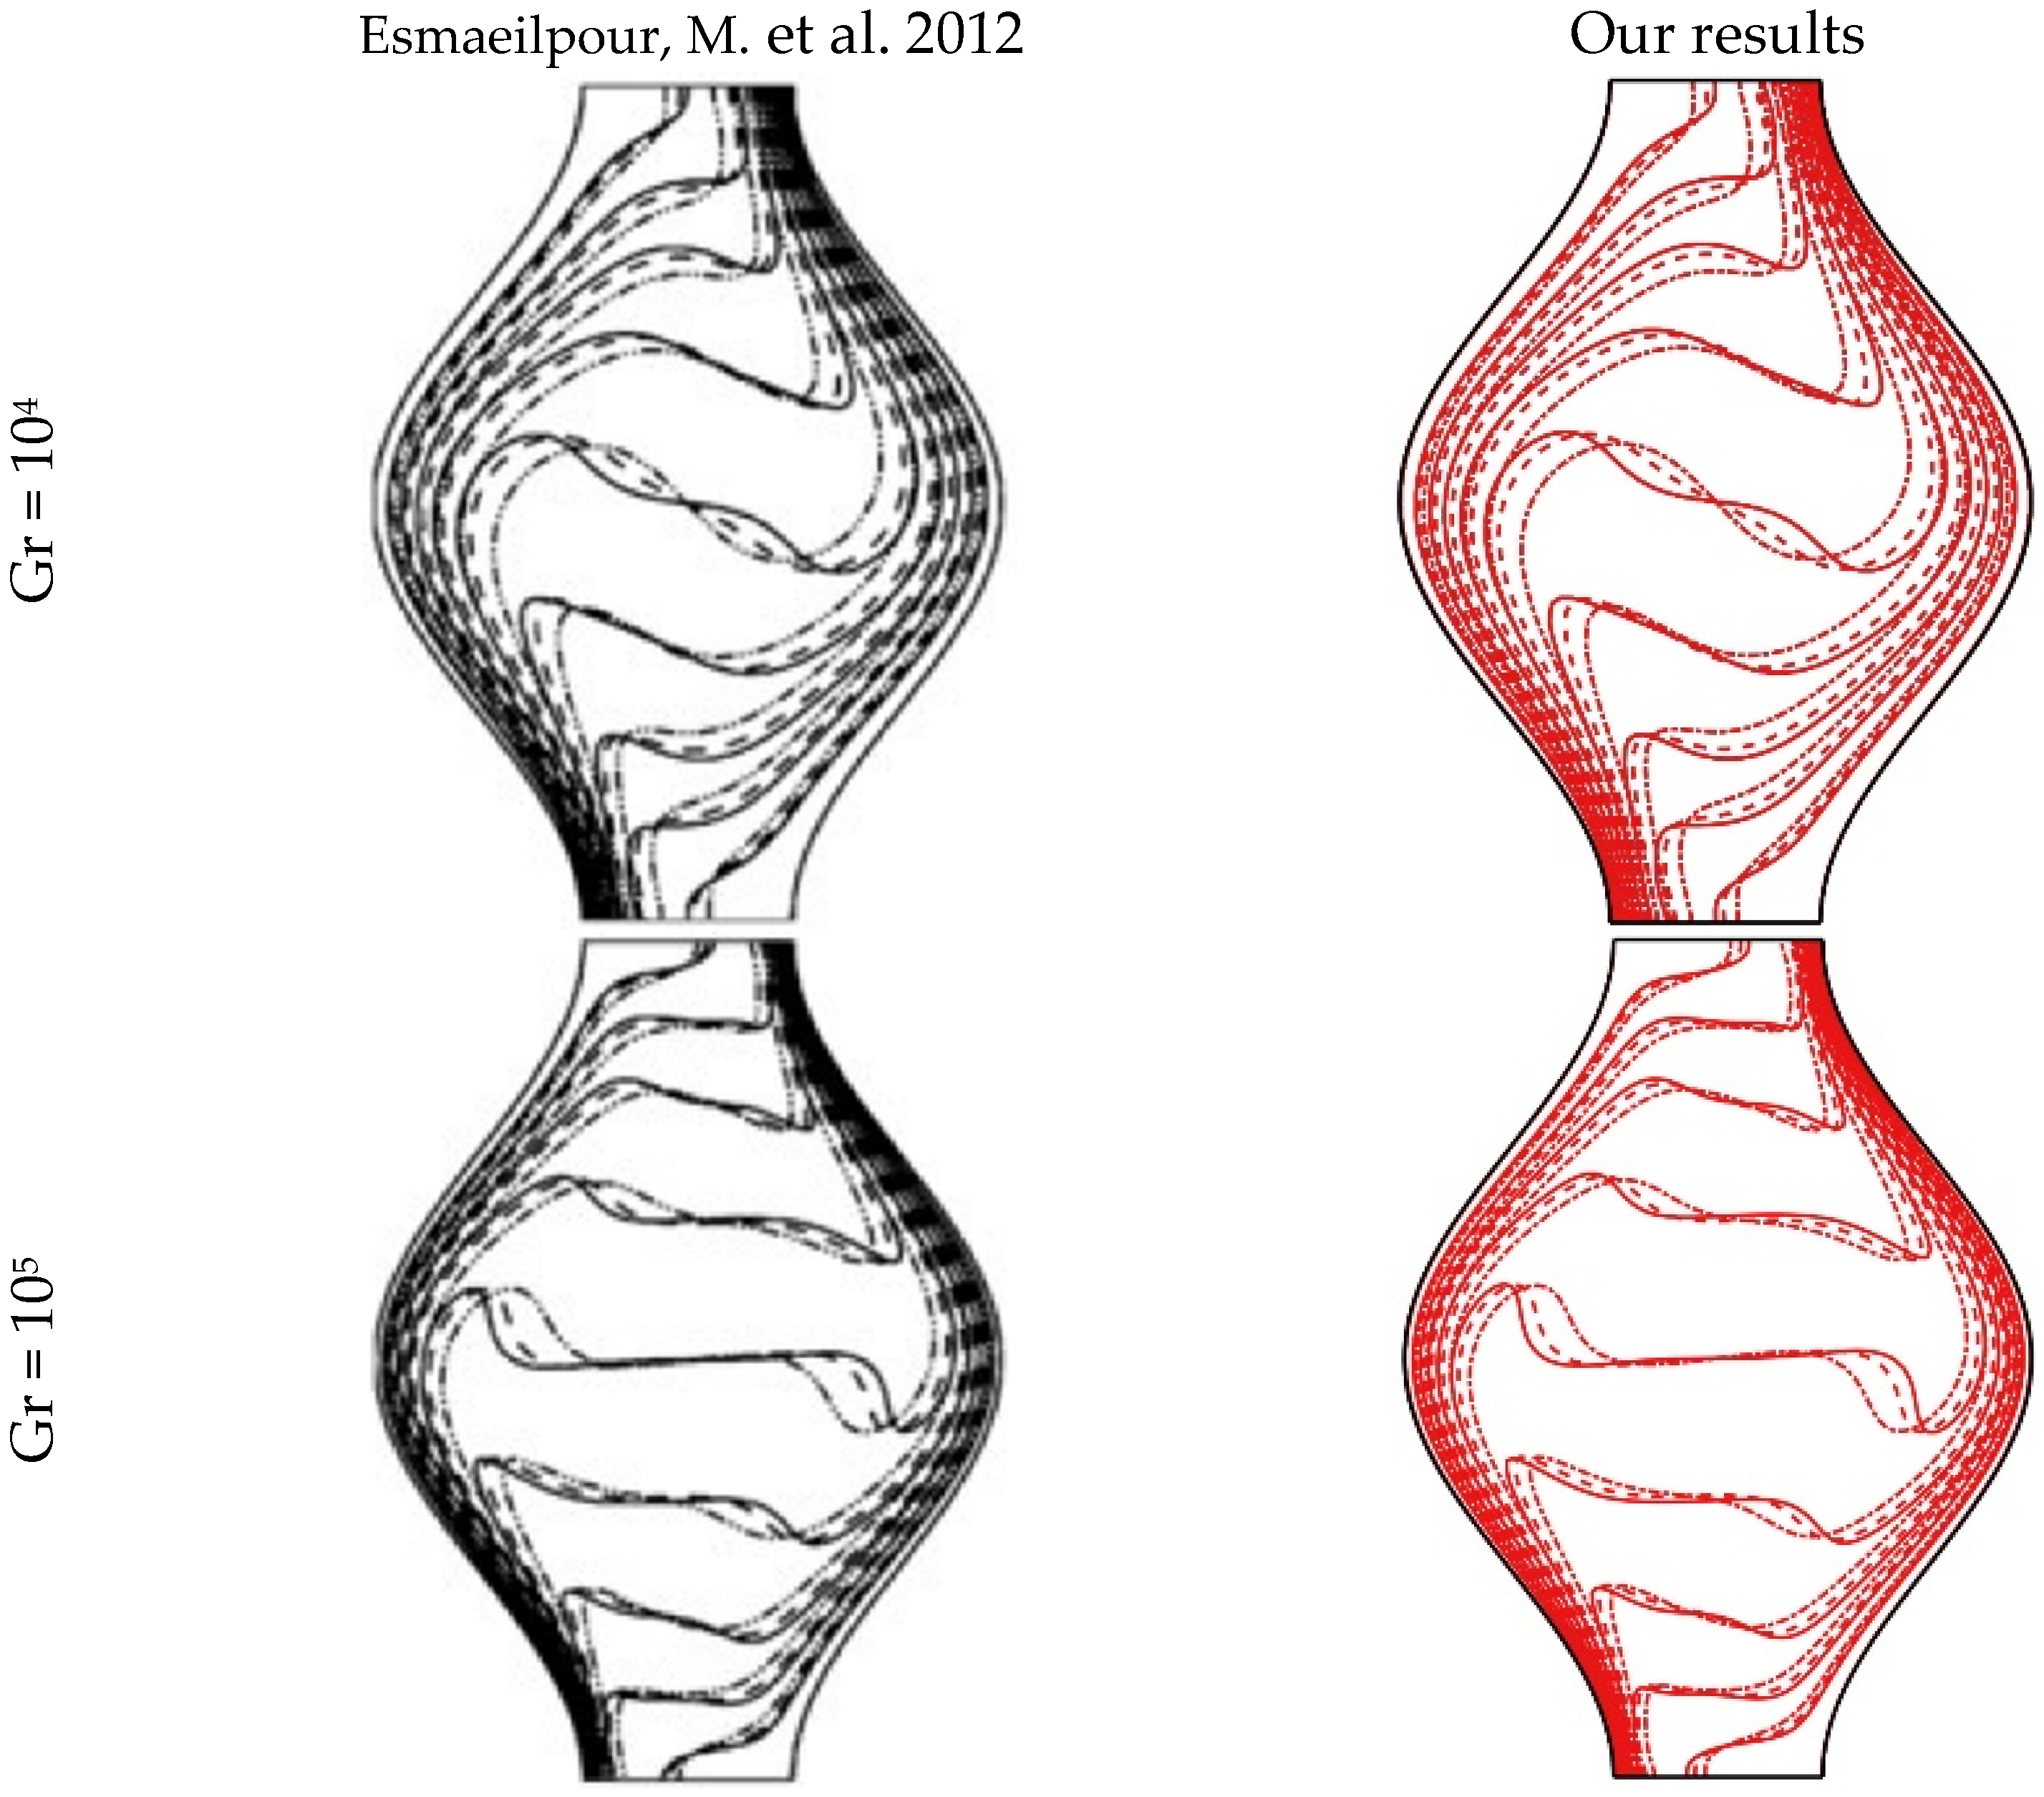
Figure 7.
Temporal evolution of velocity profiles in the aneurysm model assessment of blood flow velocity at distinct time points (t = 0.12, 0.2, 0.3, and 0.34 s).
Figure 7.
Temporal evolution of velocity profiles in the aneurysm model assessment of blood flow velocity at distinct time points (t = 0.12, 0.2, 0.3, and 0.34 s).
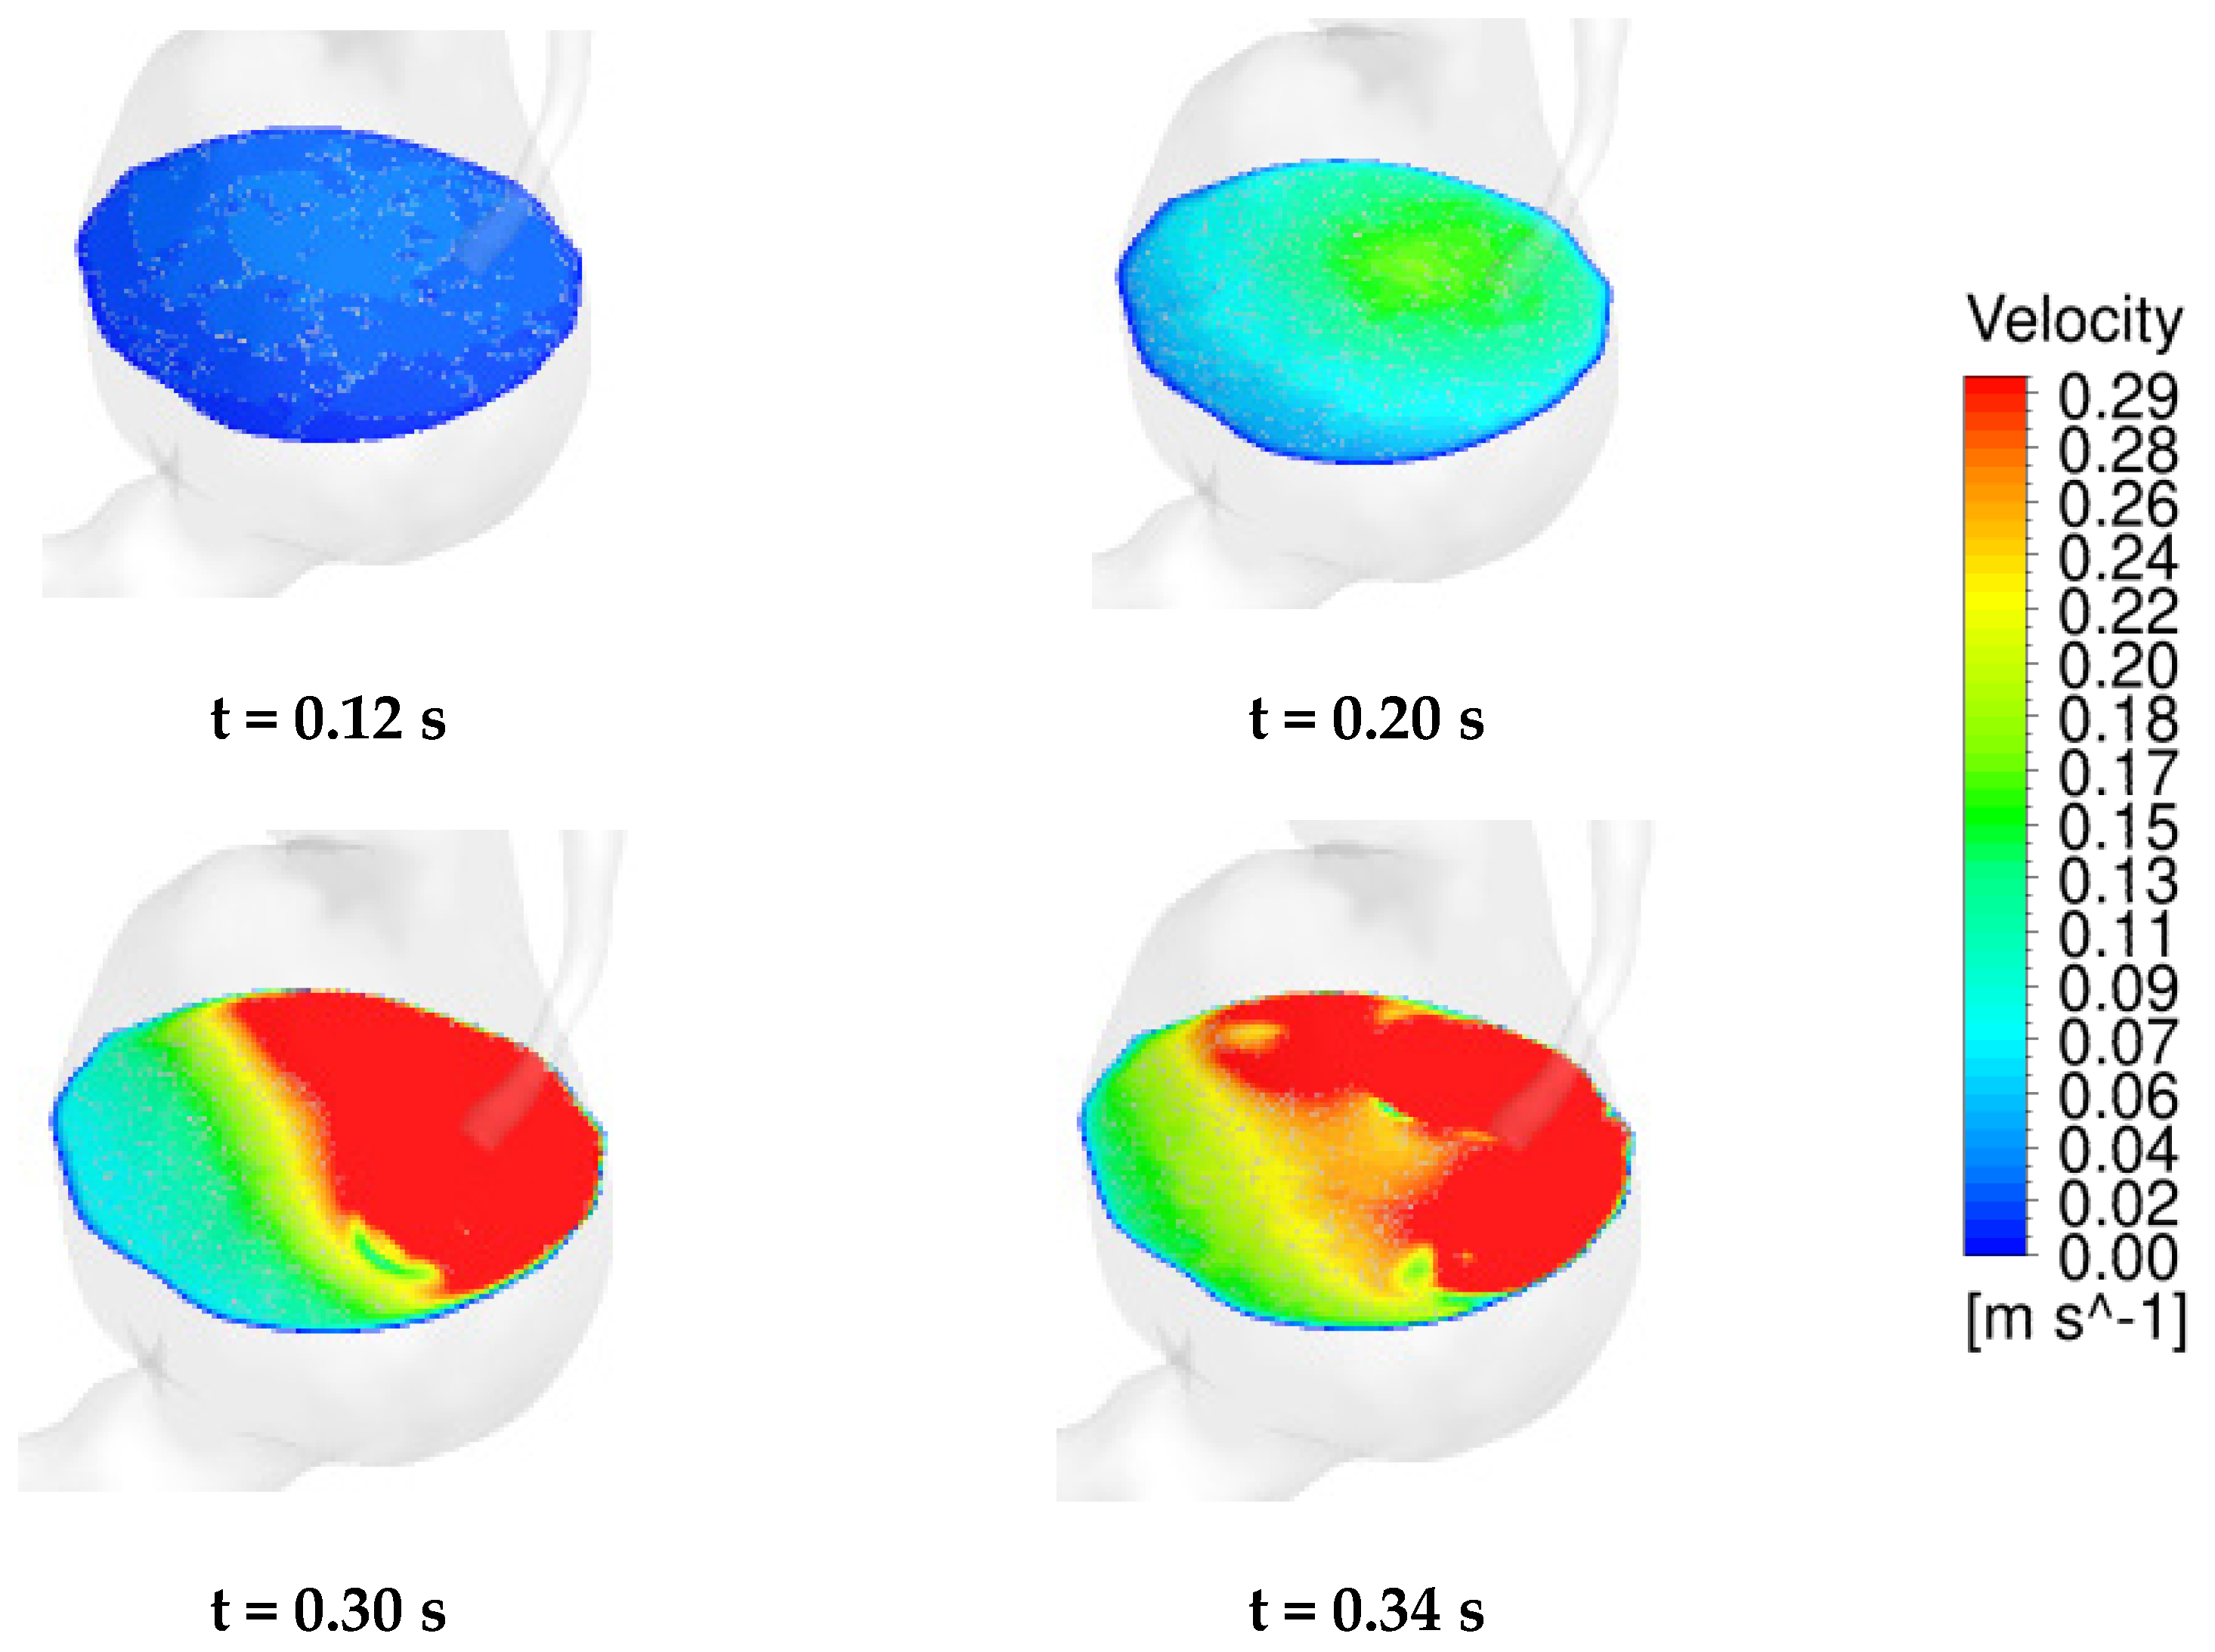
Figure 8.
Temporal dynamics of the velocity curl in the mid-plane of an AAA—exploring velocity curl evolution at key time intervals during the systole phase of the cardiac cycle.
Figure 8.
Temporal dynamics of the velocity curl in the mid-plane of an AAA—exploring velocity curl evolution at key time intervals during the systole phase of the cardiac cycle.

Figure 9.
Dynamic changes in shear stress throughout the cardiac cycle across the aorta, branch arteries, and abdominal aneurysm.
Figure 9.
Dynamic changes in shear stress throughout the cardiac cycle across the aorta, branch arteries, and abdominal aneurysm.
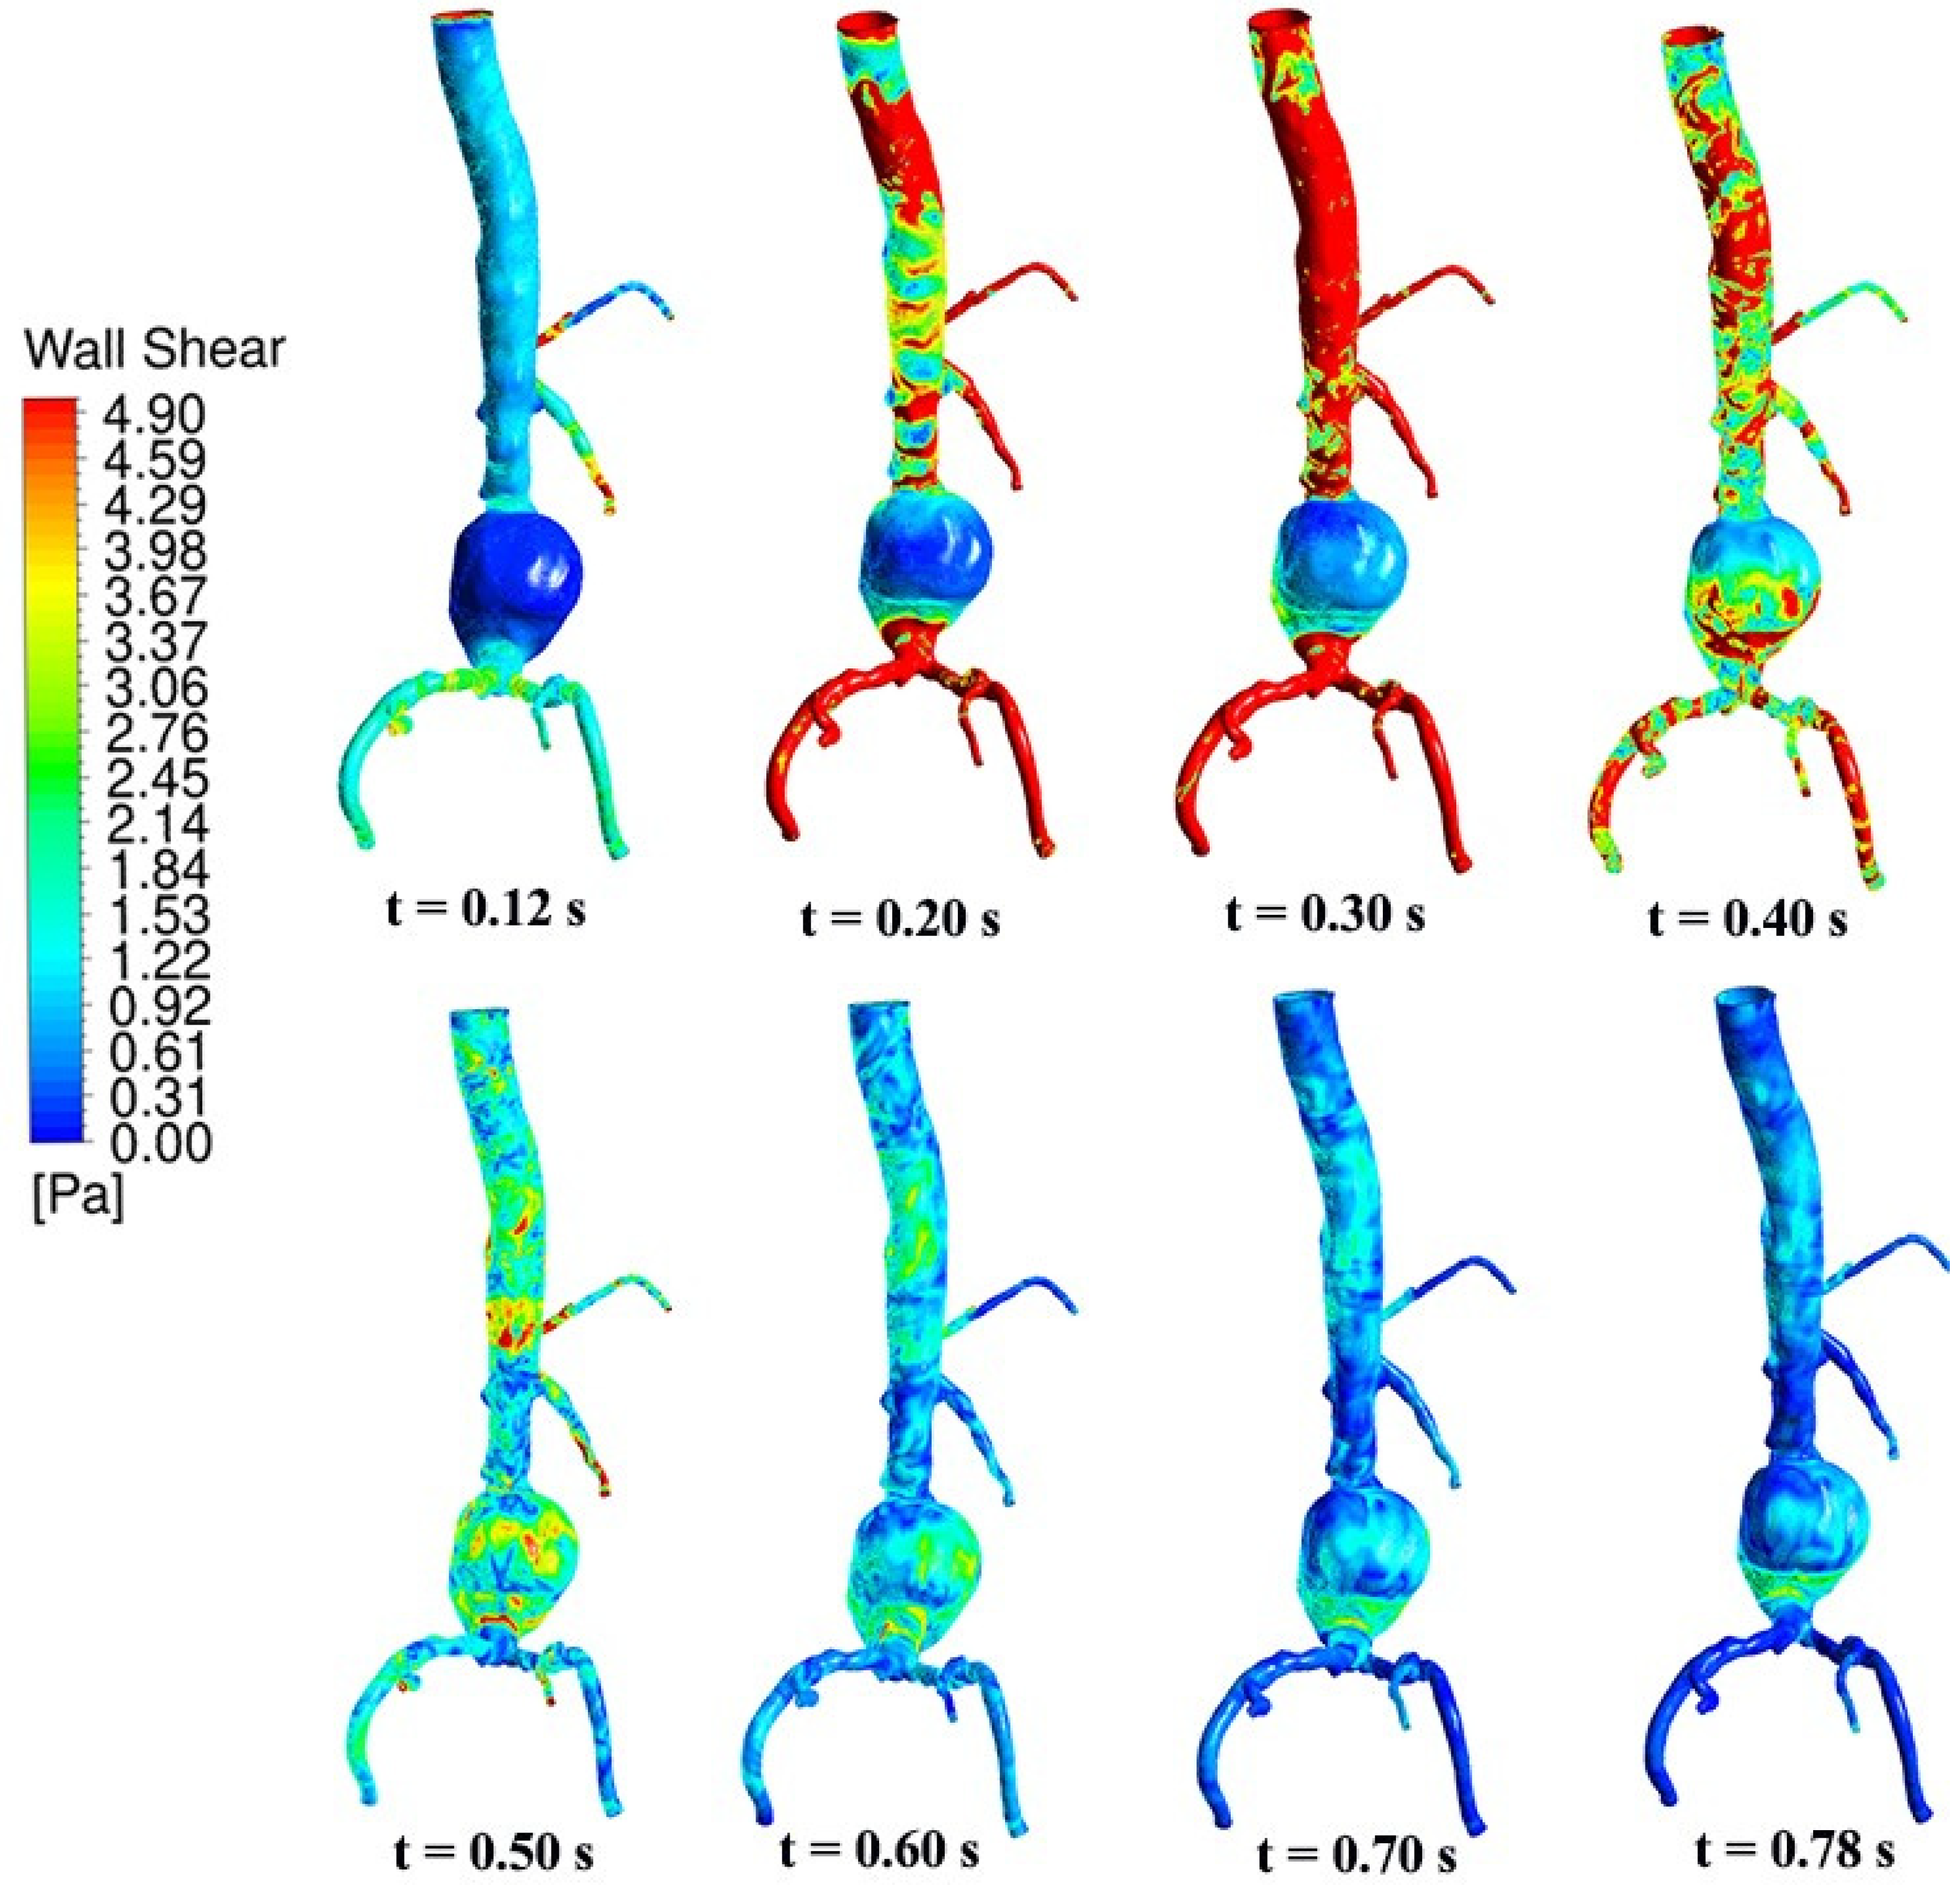
Figure 10.
Oscillatory shear index trends in the aorta, arteries, and abdominal aneurysm across the cardiac cycle (t = 0.1 s—t = 0.78 s).
Figure 10.
Oscillatory shear index trends in the aorta, arteries, and abdominal aneurysm across the cardiac cycle (t = 0.1 s—t = 0.78 s).

Figure 11.
Hemodynamic insights into abdominal aortic aneurysms. (a) Wall shear stress profile—notable systolic zenith, aligned with elevated systolic blood pressure, carries inherent risks of arterial damage and rupture. (b) Dynamics of time-averaged wall shear stress—a distinctive decline during systole followed by an abrupt diastolic increase signifies shear stress fluctuations. (c) Trends in the oscillatory shear index—peak values at systole onset denote disturbed flow patterns and potential blood cell damage. (d) Evolution of relative residence time—an elevated RRT during systole suggests an increased risk of clot formation, with life-threatening implications if dislodged.

Table 1.
Numerical studies on AAAs, highlighting their methods, mesh structures, and flow conditions.
Table 1.
Numerical studies on AAAs, highlighting their methods, mesh structures, and flow conditions.
| Ref. | Methods | Dimension, Type of Flow | Fluid, Type of Wall, Parameters, and/or Particles | Grid Type and Size |
|---|---|---|---|---|
| [8] | SCRYU Code, FVM, SIMPLE | 3D, steady, unsteady, Newtonian, incompressible | Blood, Re = 350, 700 (steady), Re = 350, 700, 1400 (unsteady), L = 8 cm, d = 1 cm, La = 4 cm | 24,000 grid points |
| [10] | SEM | 2D, axisymmetric, Newtonian, unsteady, incompressible | Blood, 50 Remax 300 | 228 quadrilateral macro elements |
| [15] | Ansys, FEM, ALE, FSI | 3D, asymmetric, unsteady, laminar, incompressible, non-Newtonian | Blood, Y = 4.66 MPa, Remax = 1950, Reavg = 330 | Structural 76,730 elements |
| [18] | Experiment | 2D, Newtonian | Mixture of sodium salt and distilled aqueous solution of glycerine, Q = 7.09 L/min, Re = 1941 | - |
| [20] | LES | 3D, Newtonian, transition to turbulent | Blood, Re = 1277, 1220, 1186, Re > 2250, d = 2 cm, Q = 120 cm3/s | - |
| [21] | FDM, SOR, ADI | 2D, laminar, unsteady, Newtonian, incompressible | Blood, Re = 100, 300, 500, Pr = 21, 25, Ec = 0.002, 0 Ha 10 | Uniform grid |
| [22] | Experiment, OpenFOAM, FVM, PIMPLE | 3D, laminar, non-Newtonian | Blood, rigid wall, 1634 Re 1954, 10 W0 14.97 | 463,000 polyhedral elements |
| [23] | FEM | 2D, unsteady, laminar, incompressible | Blood, 2.14 Re 535.61, 0.1 Q (cm3/s) 25, 0.001865 We 0.4662 | 5120 quadrilateral elements |
| [24] | Experiment, HLPT | 2D, Newtonian, laminar to turbulent | Water, 410 Re 2650, d = 1.8 cm, L = 140 cm, La = 6.6 cm | - |
| [25] | OpenFOAM, FVM, PIMPLE | 2D, non-Newtonian, unsteady, laminar, incompressible | Blood, Fe3O4 nanoparticles, rigid wall, d = 1.7 cm, Re = 264, Q = 0.8 lit/min, W0 = 12 | 680 × 72 |
Disclaimer/Publisher’s Note: The statements, opinions and data contained in all publications are solely those of the individual author(s) and contributor(s) and not of MDPI and/or the editor(s). MDPI and/or the editor(s) disclaim responsibility for any injury to people or property resulting from any ideas, methods, instructions or products referred to in the content. |
© 2024 by the authors. Licensee MDPI, Basel, Switzerland. This article is an open access article distributed under the terms and conditions of the Creative Commons Attribution (CC BY) license (https://creativecommons.org/licenses/by/4.0/).
Share and Cite
MDPI and ACS Style
Saha, S.C.; Francis, I.; Saha, G.; Huang, X.; Molla, M.M. Hemodynamic Insights into Abdominal Aortic Aneurysms: Bridging the Knowledge Gap for Improved Patient Care. Fluids 2024, 9, 50. https://doi.org/10.3390/fluids9020050
AMA Style
Saha SC, Francis I, Saha G, Huang X, Molla MM. Hemodynamic Insights into Abdominal Aortic Aneurysms: Bridging the Knowledge Gap for Improved Patient Care. Fluids. 2024; 9(2):50. https://doi.org/10.3390/fluids9020050
Chicago/Turabian StyleSaha, Suvash C., Isabella Francis, Goutam Saha, Xinlei Huang, and Md. Mamun Molla. 2024. "Hemodynamic Insights into Abdominal Aortic Aneurysms: Bridging the Knowledge Gap for Improved Patient Care" Fluids 9, no. 2: 50. https://doi.org/10.3390/fluids9020050