
The Role of Pin Fin Array Configurations and Bubble Characteristics on the Pool Boiling Heat Transfer Enhancement


Department of Mechanical and Industrial Engineering, Faculty of Engineering, Gadjah Mada University, Jl. Grafika No. 2 Kampus UGM, Yogyakarta 55281, Indonesia
*
Author to whom correspondence should be addressed.
Fluids 2022, 7(7), 232; https://doi.org/10.3390/fluids7070232
Submission received: 1 June 2022
/
Revised: 5 July 2022
/
Accepted: 6 July 2022
/
Published: 8 July 2022
(This article belongs to the Section Heat and Mass Transfer)
Abstract
:Pool boiling surface modification by pin fin array has demonstrated a practical but effective cooling enhancement. Whilst the main challenge is to determine the best configuration of the pin fin dimensions and positioning, it is known that the result varies among the working conditions. To obtain a more general formulation, it is utterly vital to obtain a deep understanding of the pool boiling mechanism during the phase-change process. This study aimed to analyze the role of pin fin array configuration on the pool boiling phenomenon by generating visualization and non-dimensional analysis. The results illustrated three different regimes occurring during the boiling process: natural convection, isolated bubble, and merged bubble. For all regimes, the average heat transfer performance was enhanced as the fin gap rose to 17% and 63% for circular and rectangular pin fins, respectively. Furthermore, Grashof (Gr) and Bond (Bo) numbers were calculated to quantitatively describe the effect on the bubble dynamics. From these approaches, it was found that the insulated bubble regime provides a better means of cooling by around 60% due to the better bubble dynamics.
1. Introduction
Boiling heat transfer showcases an excellent means of heat dissipation. As its name implies, it relies on a large amount of heat absorption during the phase-change process. The vapor generation during that process has also been demonstrated to improve the heat transfer coefficient due to the enhanced movement of the bulk fluid caused by bubble evaporation and quenching [1]. Among the other methods, pool boiling is entrusted as one of the most prevailing boiling applications. This method relies on the buoyancy force of the bubble, providing a simple but powerful passive cooling. Recently, pool boiling application has demonstrated an enhancement of the heat transfer coefficient up to 5 × 10⁴ W/m2∙K [2].
Many industrial activities, especially those which dissipate a large amount of heat, require pool boiling to maintain the operating temperature within the standard of safety and optimal conditions. One of the common applications that adopts this technology is electronic cooling. In the last decades, the heat flux released from such devices multiplied up to 100 times larger, exceeding the limit of traditional single-phase cooling technology [3]. This heat flux, albeit within the remit of current boiling heat transfer ability, will continue to grow in the next decades. This heat flux requires a proper heat removal system to maintain the junction temperature below the allowable criterion. Otherwise, the computer performance drops by 10% as the temperature increases by 2 K [4]. Hence, the enhancement of the existing boiling heat transfer technology is necessary.
The heat transfer enhancement of pool boiling remains one of the core interests in advanced cooling systems. A number of approaches are employed to obtain the desired cooling capacity, including the active and passive methods. In the active method, the enhancement relies on the attached system requiring an external power supply, for instance, surface electrowetting [5]. This method allows the flexibility of the enhancement range depending on the power input to the system. However, this requires a complicated design and additional energy, limiting its reliability in electronic device applications [6].
On the other hand, the passive method provides an enhancement by modifying the boundary or working conditions. Due to its practical and economical implementation, the passive method is entrusted as the state-of-the-art of pool boiling enhancement method [6]. An abundance of approaches have been developed incorporating this method, including the modification of working fluids [7,8], material selection [9], orientation [10], and surface modification [11,12].
As one of the mature and prevailing methods, the surface modification could be carried out by material selection such as porous media [13] and 3D-printer structure [14], surface coating by aluminum coating [15] and Carbone Nano Tube (CNT) [16], micro-structure modification [17,18], and macro-structure arrangement [19].
Among these methods, macro-structure enhancement is one of the most practical choices due to its simple but powerful performance, despite having lower performance than micro-structure surface modification. This approach provides a higher contact area for a prescribed base size. Similar to the other methods, this modification aims to control the bubble dynamics during the phase-change process by altering the properties of the adjacent surface. Hence, the main challenge of the finned surface is to find the best configuration of the dimensions and arrangement.
Several studies aiming to find the proper configuration of the pin fin array have been conducted. Rainey and Yu [20] investigated the effect of pin fin height on heat transfer performance. The results demonstrated a significant enhancement of heat transfer as the fin height rose. However, this effect is limited in pin fins with a height of more than 5 mm due to the reduction of surface superheat temperature; hence, the boiling phenomenon is absent on the top of the pin fin. A similar result was demonstrated by Parker and El-Genk [21] by incorporating HFE-7100 as the working fluid.
Kelin and Westwater [22] investigated the effect of horizontal sizing of the pin fin arrangement. The study showed that the heat transfer coefficient rise was limited at a distance of 1.5 mm, close to the bubble break-off diameter. At this configuration, each pin fin was indicated to perform individually as a vertical tube, undermining the interaction between the fins in the array.
The effect of the geometrical shape of the pin fin was observed by Pranoto et al. [19] by comparing the cooling performance of pool boiling from circular and rectangular pin fin arrays. The study proved that the rectangular pin fin provides better cooling capacity due to the higher nucleation site density number observed on the sharp corner. This phenomenon was also visually observed by Yong et al. [23] who suggested the concept of nucleation cavity sites on the corner due to natural defects.
As discussed previously, a deep analysis of bubble dynamics is necessary to obtain a better understanding of the boiling heat transfer. As a result of development from the first boiling observation from Nukiyama [24], many researchers have attempted to visualize the transient movement of the bubble during the phase-change process, including in the application of surface modification in narrow tunnels [25], micro-structure [17,18], and investigation of individual bubbles on the enhanced surface [26].
Furthermore, the bubble dynamics are also analyzed by considering non-dimensional analysis. Jin et al. [13] investigated the pool boiling performance from various porous graphite surfaces. In addition to the visual interpretation, the study compared three dimensionless numbers contributing to the bubble dynamics: Capillary number (Ca), Grashof number (Gr), and Bond number (Bo). The results demonstrated that the larger pore enhanced the bubble departure, which was indicated by higher Ca, Gr, and Bo simultaneously.
From these existing studies, it is found that the role of the pin fin on the boiling heat transfer has been widely investigated, resulting in some suggested dimensions. These empirical parameters are not suitable for every working condition. Hence, a deeper analysis incorporating bubble dynamics is required. However, so far, little work has been carried out to investigate the effect of pin fin configuration on the boiling heat transfer from a pin fin array that considers the bubble departure phenomenon, either visually or by dimensionless number.
This study aimed to understand the pool boiling heat transfer enhancement from the pin fin arrays with various configurations by considering the mechanism of bubble dynamics. To represent this mechanism, the pool boiling regime from visualization and non-dimensional analysis is discussed relative to the heat transfer performance.
2. Experimental Methodology
2.1. Experimental Facility
The experimental apparatus employed for this study consisted of three main components: heating base, boiling chamber, and condenser. The schematic diagram of this facility is presented in Figure 1.
The heating base was incorporated as the power supply to the test samples. This component consisted of an assembly of heating and insulation blocks with a total dimension of 100 mm (l) × 100 mm (w) × 50 mm (h). It represents the heat flux of electronic cooling by emitting heat from a cartridge heater with diameter of 15 mm and 300 W maximum power. The heat was then transmitted to the testing surface on the top of the heating base throughout a copper block. To eliminate the heat loss, the copper was surrounded by an insulation layer made of ceramics and thick Teflon block.
The heat supplied to the cartridge heater was controlled and monitored by a Watt-meter. A couple of k-type thermocouples were installed near the surface of the heating base to estimate the surface temperature. Additionally, a set of thermocouples was employed across the insulation layer to measure heat loss through the wall.
In this experiment, the boiling occurred in a chamber made of aluminum with a volume of 549.2 × 103 mm3. This boiling chamber could contain the working fluids up to 0.5 L. Two transparent windows were installed on the front and rear sides of the chamber to allow the observation of the bubble dynamics on the surface using a macro camera. For each part connection, a customized gasket was installed to restrict the heat and fluid leakage. A couple of k-type thermocouples were employed to measure the liquid and vapor temperature, respectively. Additionally, a pressure transducer was utilized for working pressure control and validation.
Lastly, a water-cooled condenser made of copper coil was installed on the top of the chamber. It was connected to the external reservoir with an adjustable cooling rate. The rate was adjusted to be equal to the input heat to ensure the steady state was maintained during the experiment.
2.2. Test Samples
In this study, the pin fin array was selected as the configuration of the extended surface. Six test samples were employed by varying the geometrical shape and dimensions. These variations are presented in Figure 2 and Table 1.
Table 1 implies that, for each geometrical shape, the total area was kept the same for a proper comparison. Meanwhile, as the point of interest of this study, the fin gap was varied between 1 mm and 1.5 mm. To compromise the area constraint, the number of pin fins and the fin height were adjusted as the fin gap rose. Furthermore, circular and rectangular were selected for the pin fin shapes.
Dielectric fluid HFE-7100 was employed as the working fluid. As explained previously, the use of dielectric fluids is a suitable choice for boiling heat transfer due to the low boiling point and high dielectric strength. The low boiling point allows the process to undergo a phase-change process below the electronic device’s temperature limit. Meanwhile, the high dielectric strength prevents the short circuit from occurring during the immersion process. The properties of HFE-7100 at saturation temperature are presented in Table 2.
2.3. Experimental Procedures and Uncertainty Analysis
The experiments were conducted in steady-state sub-cooled boiling. The power generated was increased gradually between 10 W and 50 W with an increment of 5 W. All sensors were connected to a National Instrument Data Acquisition System. The data captured by the sensors were then processed, compiled, and presented to a computer. To ensure a steady state, the data for each variation was recorded for 10 min by monitoring the variance of the recorded temperature from two thermocouples in the heating base. The cooling rate was adjusted accordingly. Additionally, the temperature and pressure of the boiling chamber were monitored as validation. The steady-condition data were then measured and processed by the data logger LabView for 20 iterations. The macro-lens camera was incorporated to capture the image of the boiling phenomenon on the test sample surface.
The heat flux in the radial direction in the heating chamber was restricted by the insulation layer, resulting in the majority of the heat flux flowing in one direction towards to test surface. However, to ensure accuracy, the heat loss through the wall (q″loss) was still considered by calculating the temperatures measured from a set of thermocouples installed across the insulation wall. The heat loss was quantified by using the conductive heat flux equation q″loss = kAΔT/L whereby k is thermal conductivity, A is total the area of insulation wall, ΔT is temperature discrepancy across the insulator, and L is the thickness of the insulation layer. From a set of experiments, q″loss was measured at 8% of the total heat loss. Finally, the heat flux employed for the calculation in this study is the net heat flux (q″) which is the input heat flux measured by wattmeter (q″input) subtracted by q″loss.
By incorporating the measured temperatures from thermocouples, locations, net heat flux, and thermal resistance of the heating base, surface temperatures were then calculated and notated as Ts1 and Ts2. Finally, the calculated surface temperature (Ts) is obtained from the following equation:
In this study, systematic uncertainty by human error was restricted by ensuring the repeatability and careful conduct of the experiment. Meanwhile, the Thermocouples utilized in the experiment had the measurement uncertainty of ±0.5 K, whilst the pressure transducer showed non-linearity of 0.25–0.5%. Further uncertainty quantifications of the quantity of interests (q″, hb, Gr, and Bo) were conducted by employing Taylor’s equation of uncertainty [31]. The uncertainty of the quantity of interest was determined by calculating the individual measured quantities which constitute the calculation, i.e., surface temperature and saturation temperature. By assuming that these individual quantities follow the normal distribution, the total uncertainty was calculated by the following equations:
In this equation, v, w, …, z are the uncertainty of individual parameters which contribute to the uncertainty of quantity q. Then, the uncertainty quantification was calculated by considering the standard derivation (σv) from the N number of samples by the following equation:
Here, is the measured value and is the mean value for the independent parameter of . Therefore, the uncertainty of is given by:
By following these procedures, the uncertainty of hb, Gr, and Bo were estimated to be 4%, 5.6%, and 8.9%, respectively.
3. Results and Discussion
3.1. Boiling Curve and Regime
The cooling performance of each surface is examined by measuring the surface temperature in various heat fluxes, as shown in Figure 3 and Figure 4. In these figures, lower temperature indicates a faster heat dissipation rate and, hence, better cooling capacity. Furthermore, the surface boiling phenomenon for each heat flux was recorded by a macro-lens camera for further evaluation.
The bubble dynamics observed in Figure 5, Figure 6, Figure 7 and Figure 8 demonstrate the regime of the bubble generation. Overall, there were three regimes pointed out from the experiment: natural convection, isolated bubble nucleate boiling, and merged bubble nucleate boiling.
The natural convection regime was observed whereby the surface temperature was lower than the boiling point. Due to the low temperature, the heat flux was not sufficient to trigger the Onset of Nucleation Boiling (ONB) when the bubble was supposed to generate. Hence, all results demonstrated no bubble generation (see Figure 5). During this process, the heat transfer relies only on the natural convection in the liquid. Hence, this regime showed the lowest slope among the other regimes.
The experiment for each circular and rectangular proves that the natural convection regime demonstrated no notable discrepancy for different pin fin gaps. This indicates that the buoyancy-driven flow under the compressed liquid was not significantly affected by the pressure drop within the pin fin arrays.
The ONB starts to initiate around the saturation temperature for all surfaces, indicating the nucleate boiling regime. This regime is identified by the generation of small bubbles on the surface. In the first half of the regime, the bubble detaches from the surface without interaction with the other nucleation site. This isolated nucleation site allows the bubbles to lift off without generating a considerate heat resistance on the adjacent surface.
In this study, an isolated bubble regime was observed between 0 K and 11 K for circular and 0 K and 9 K for rectangular pin fin arrays. As presented in Figure 6, a small bubble started to generate individually and detached in a straight path without any interference from the other active nucleation sites. Unlike the phenomenon observed in the natural convection regime, there was a significant discrepancy in the boiling curve for different fin gaps. This phenomenon indicates the importance of the gaps in the boiling heat transfer mechanism which is discussed further in the next section.
At the higher heat flux, the generated bubbles start to merge before the lift-off. In this regime, albeit the increase in bubble formation enhances the bubble dynamics, the effect on the cooling performance is undermined by the higher thermal resistance due to the merged bubbles. As the heat flux increases, the merged bubbles form a blanket of vapor which indicates the decrease in heat transfer coefficient.
The images captured during the experiment (see Figure 7) demonstrated the incipience of bubble merging around 23.0 W/cm2 and 23.6 W/cm2 for circular and rectangular, respectively. The figures clearly demonstrate the bubble crowding, whereby the generated bubbles turned into a blanket of vapor before detachment. Furthermore, the detached bubbles illustrated a larger diameter compared with those observed in the isolated bubble regime.
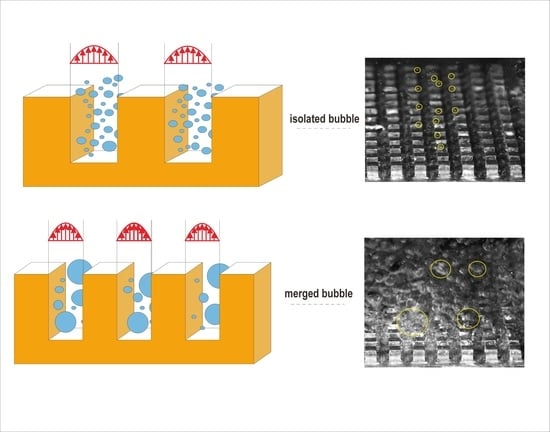
As illustrated in Figure 7, this regime underwent a bubble merging process which allows a bubble to interact with the adjacent nucleation site, creating a wider area occupied by the vapor phase. Due to its high thermal resistance, this vapor layer reduced the overall heat transfer coefficient. As a result, the heat transfer coefficient in this regime slightly reduced as illustrated by the lower slope in the boiling curve (Figure 3 and Figure 4) and average heat transfer coefficient (Figure 8 and Figure 9) albeit having more active nucleation sites and larger bubble departure frequency.
3.2. Heat Transfer and Bubble Characteristics
The enhancement of pool boiling performance was examined by comparing the average heat transfer coefficients, especially in the nucleate boiling regime. The heat transfer coefficients were calculated by the following equation:
Figure 8.
Boiling heat transfer coefficient in different fin gaps from circular pin fin arrays.
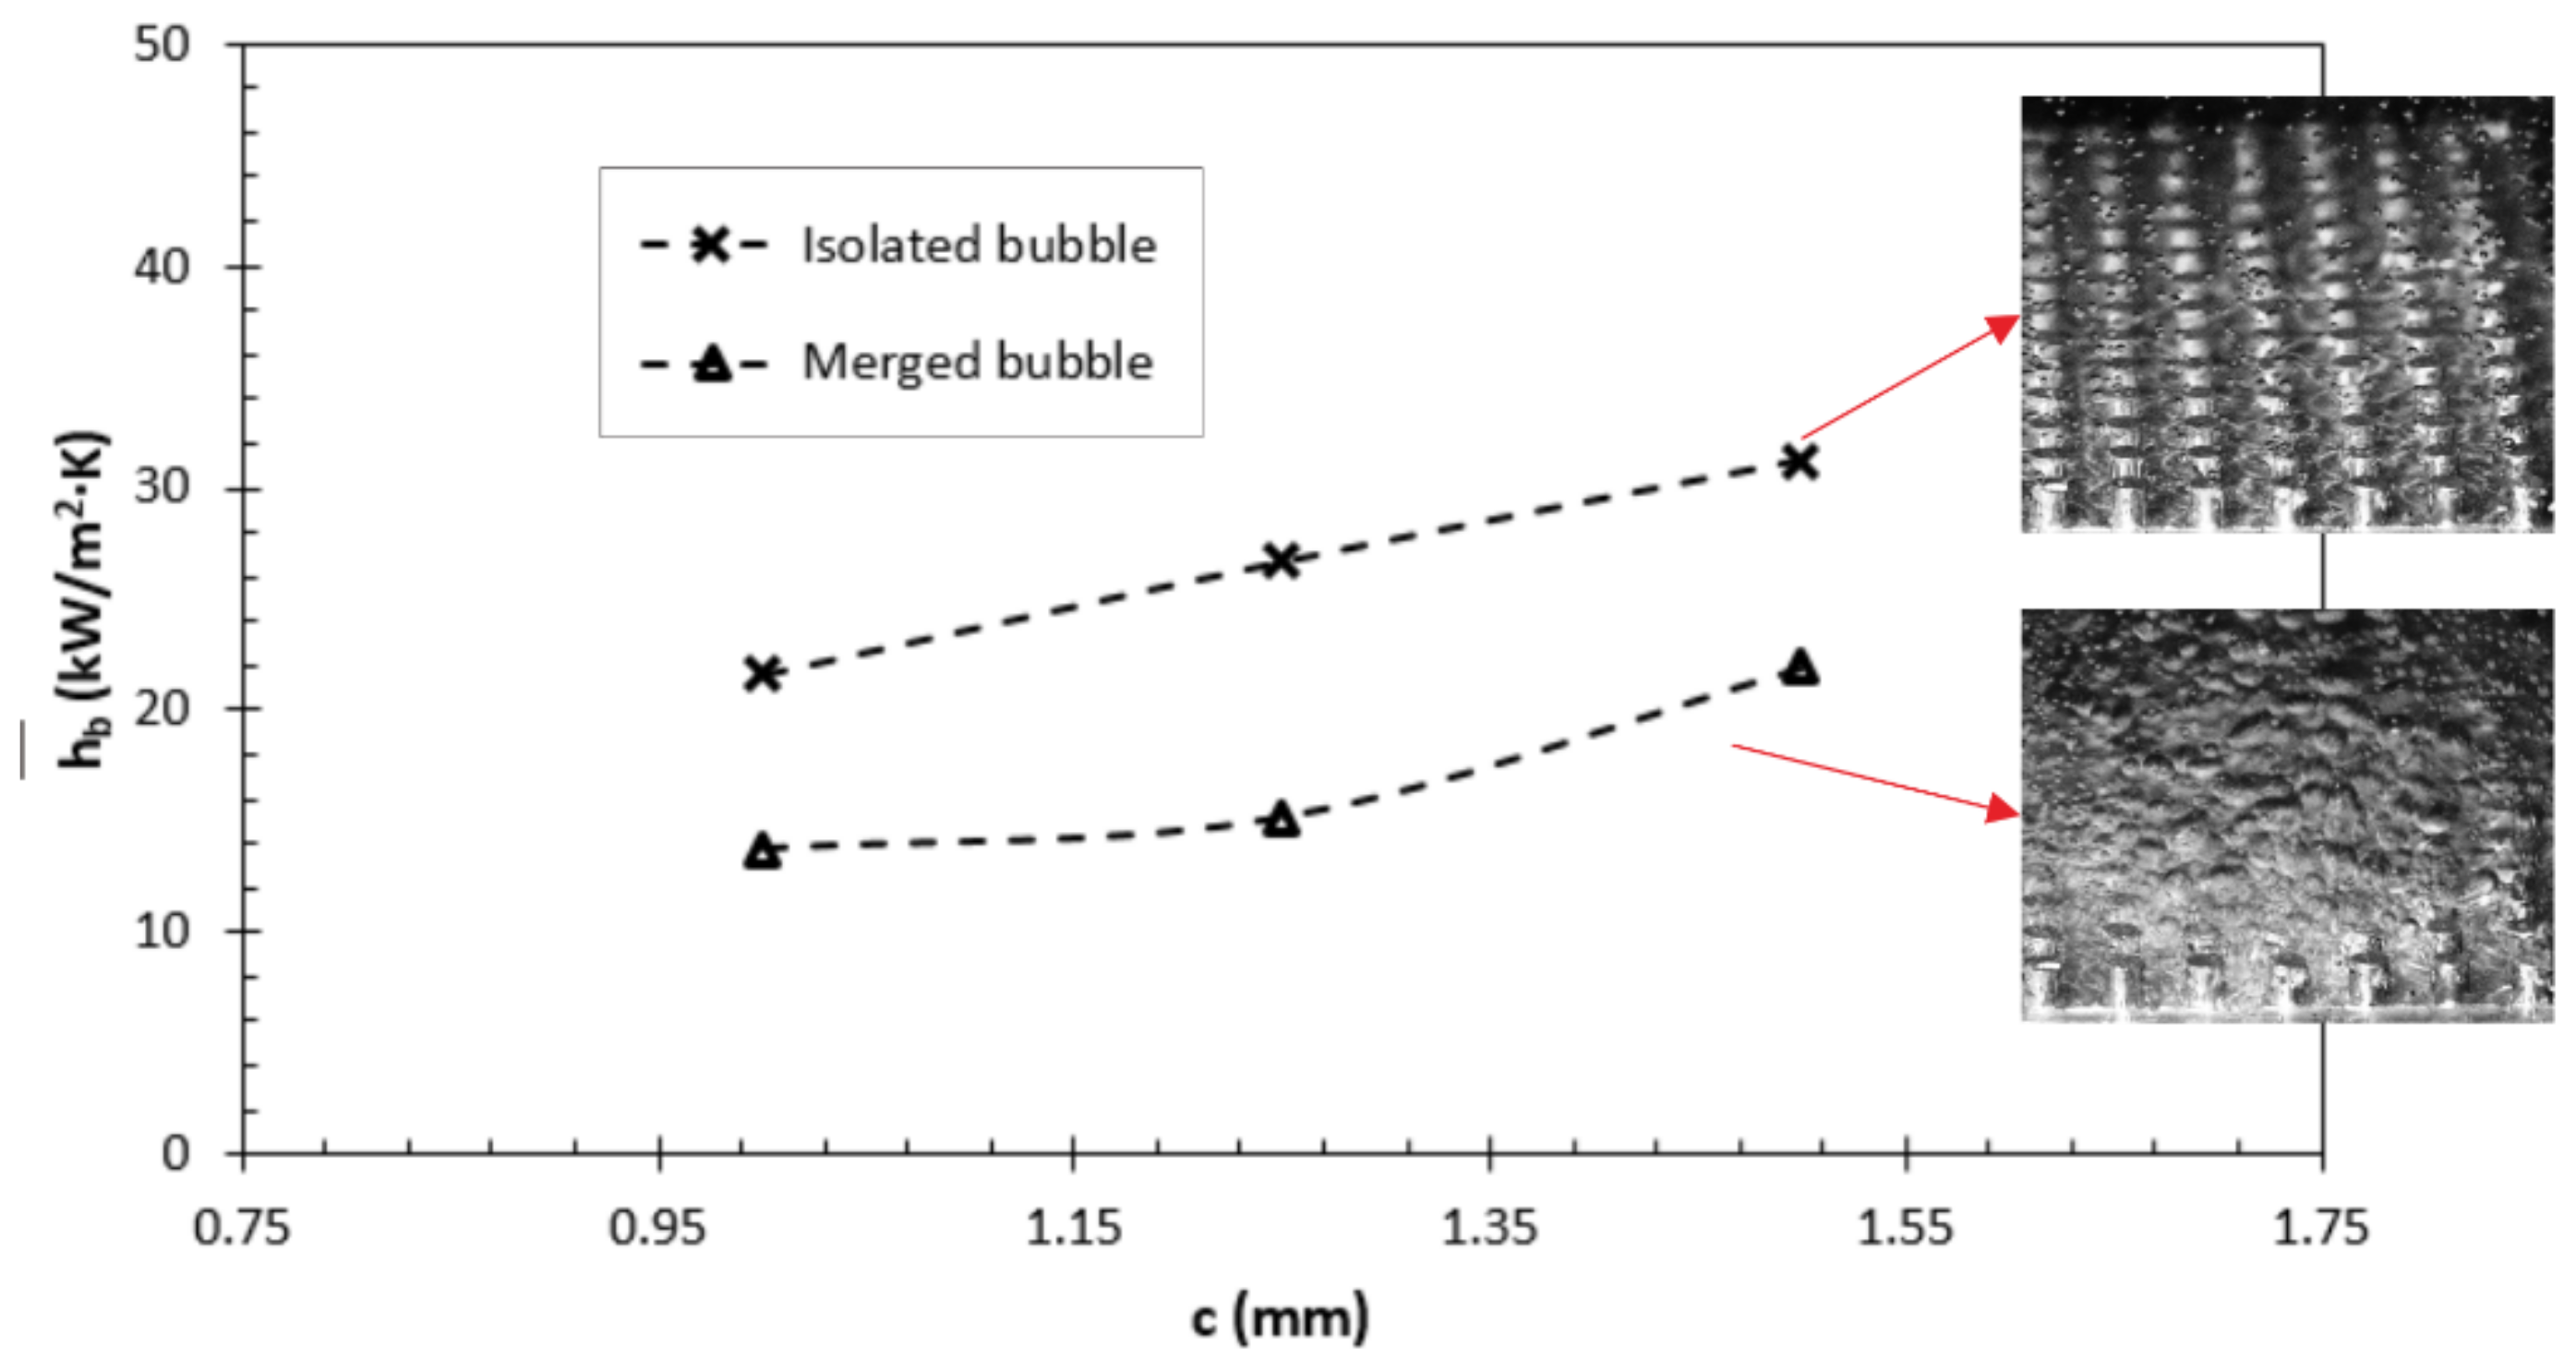
Figure 9.
Boiling heat transfer coefficient in different fin gaps from rectangular pin fin arrays.

For each regime, the average heat transfer coefficients in various surfaces were calculated by using Equation (5) and are plotted in Figure 8 and Figure 9. The results presented in Figure 8 demonstrate that the isolated bubble regime yielded a better cooling performance, proven by the average heat transfer coefficient enhancement of 56.31% and 62.31% for circular and rectangular pin fin arrays, respectively. As discussed in the previous section, the heat transfer of this regime relies on the evaporation and rewetting process of an individual bubble in the nucleation sites. The individual bubble occupies a small area on the adjacent surface, allowing the enhancement effect of bubble dynamics to undermine the vapor thermal resistance.
For both pin fin shapes, there were increasing trends of the heat transfer coefficient as the heat flux rose, which is indicated by steeper slopes on the boiling curve, especially in the isolated bubble regime (see Figure 3 and Figure 4). To understand this phenomenon, it is important to understand the mechanistic behavior of the bubble dynamics during the boiling process. Kurul and Podowski [1] proposed a semi-mechanistic wall-boiling model to represent the heat transfer performance which treats the boiling process as the constitution of three mechanisms: natural convection (q″conv), evaporation (q″evap), and quenching or rewetting (q″quench). Among these three mechanisms, q″evap and q″quench represent the bubble dynamics of the boiling process as the function of some parameters, two of which are active nucleation site density (NA) and bubble departure frequency (f), as presented in the following equations:
By increasing the applied heat, the number of active nucleation sites increases. This is marked by the denser distribution of the bubble across the region. Furthermore, an increase in bubble departure frequency was also observed, which is indicated by a shorter interval of bubble detachment from the same nucleation site (see Figure 10). By matching these trends with Equations (6) and (7), it was proven that the increasing trend is a result of bubble dynamics on the hot surface.
At the merged bubble regime, the blanket of vapor created by the merged bubble occupied a considerate area fraction on the surface. This resulted in a decrease in the heat transfer coefficient up to 36.03% and 38.39% for circular and rectangular pin fin arrays, respectively. This phenomenon is illustrated in Figure 11 and Figure 12.
As presented in Figure 8 and Figure 9, the average heat transfer coefficient increased as the fin gap rose, albeit there was an outlier in the rectangular pin fin array. This finding agrees with the observation of existing studies [20,21] which proposed that the fin gap affects the heat transfer due to the flow resistance of the bubble between the arrays, especially at the large bubble sizes. When the gap exceeds a particular value, the enhancement effect by increasing the gap is limited.
On average, the heat transfer coefficient was around 63% for circular and 18% for rectangular pin fin arrays for both nucleate boiling regimes as the gap rose by 0.5 mm. As discussed previously, the merged bubble regime is more dominant in the circular pin fin arrays compared with rectangular. This leads to a higher amount of slug bubbles detached from the surface and, hence, a more prominent effect of the fin gap during the merged bubble regime. As a comparison, the heat transfer coefficient enhancement observed from the circular pin fin in this regime was around 59.51% whereas the rectangular enhancement was limited to 4%, albeit having a higher heat transfer coefficient. This indicates that the increase of gap was more significant for the circular pin fin arrays, and the rectangular pin fin exceeded the required gap size to restrict the effect of flow resistance. To understand further regarding this phenomenon, a deeper analysis considering the bubble dynamics is required.
As discussed earlier, Kurul and Podowski [1] proposed a wall-boiling model which states the overall boiling heat transfer rate as the function of several parameters, for instance, bubble departure diameter (DB) and frequency (f). However, so far, little work has been carried out to predict these parameters accurately for every working condition, especially for non-conventional surfaces such as pin fin arrays. Hence, this study conducted a dimensionless analysis to investigate further the bubble dynamics on the boiling surface. To represent the phenomenon on the modified surface, two associated dimensionless numbers were examined: Grashof number (Gr), the ratio between buoyancy and viscous force; and Bond number (Bo), the ratio between buoyancy and surface tension. These dimensionless numbers were calculated by employing the following equations:
where , , and are thermal expansion coefficient, kinematic viscosity, and density of saturated liquid; is surface tension, and L is characteristic length.
In analyzing the flow within the fin arrays, several approaches could be executed in defining the characteristic length, for instance fin height [32] or fin gap [33]. However, in the case of the pin fin with finite pin fin gap and height, Chyu [34] proposed the hydraulic diameter as the characteristic length for the natural convection analysis. Therefore, this study adopted the hydraulic diameter for calculating Gr and Bo expressed in Equations (8) and (9).
The values of Gr presented in Figure 13 and Figure 14 demonstrated a significant increase as the temperature rose up to 191% and 111% for circular and rectangular pin fins, respectively. These results illustrate the enhancement of buoyancy-driven flow due to bubble movement. As the temperature increased, the bubble generation was more intensive, which resulted in a higher void fraction. This phenomenon led to the lower dispersed-fluid average density and, hence, greater buoyancy force. This result supports the visualization discussed in the previous section, whereby the trend tends to enhance the boiling heat transfer performance.
Furthermore, the results from both circular and rectangular pin fin test cases depicted a significant increase in Gr as the fin gap rose. For the circular pin fin, the rise at maximum heat flux was up to 202%, whilst the rectangular pin fin showcased a higher trend at 322%. This illustrates that the pin fin with a greater gap provides a larger ratio between the buoyancy and viscous force. By increasing the distance between the pin fins, the buoyancy force increased whilst the viscous force dropped. As a result, the bubble movement from the surface enhanced, hence improving the overall heat transfer coefficient.
By considering the order of magnitude (Gr > 1), it is clearly shown that the buoyancy force was more dominant than the viscous force. At the lower fin gap, even though the trend was still the same, the effect of viscous force rose. This result supports the previously discussed mechanism, whereby the bubble lift-off is restricted when the space within the array is too small, hence reducing the bubble dynamics and heat transfer performance. Furthermore, by approaching the finite pin fin dimension as a typical vertical plate, it was also found that the phenomena in all test cases were considered laminar natural convection (Gr < 108).
As presented in Figure 15 and Figure 16, there was only a slight change in Bo as the temperature rose. This is a result of the insignificant change in the mixture properties, especially vapor and liquid density, as the temperature rose. On the other hand, a similar trend was observed in the gap variation, whereby the highest gap resulted in the highest Bo. In the circular pin fin arrays, the average Bo increased by around 78% and 198% for 0.25 mm and 0.5 mm gap rises, respectively. Meanwhile, rectangular pin fins demonstrated slightly higher increases of 83% and 200%, respectively.
By considering the order of magnitude from these results (Bo > 1), it is indicated that the system is relatively unaffected by the surface tension, but rather influenced by buoyancy force. As the gap rose (hence the hydraulic diameter), the buoyancy force increased by the quadratic order as expressed by the numerator of Equation (9). This increase enhanced the bubble dynamics on the adjacent surface, allowing the heat transfer coefficient to rise.
The result obtained by the non-dimensional analysis of Gr and Bo demonstrated the importance of characteristic length in bubble dynamics. From both dimensionless numbers, characteristic length is found as the most important parameter whereby it acts as the numerator with cubic and quadratic order in Gr and Bo, respectively. Thus, in the further improvement of heat transfer enhancement of pin fin array, it is important to focus on manipulating the pin fin gap rather than the other design parameter.
This non-dimensional analysis, however, could not ideally describe the variation between circular and rectangular pin fin arrays. The results from Figure 13, Figure 14, Figure 15 and Figure 16 clearly illustrate the higher cooling performance obtained from rectangular pin fin, although Gr and Bo were much lower. As discussed in the first section of this paper, this trend has been discussed in the study conducted by Pranoto et al. [24] whereby the effect of bubble detachment of individual bubbles was undermined by the higher active nucleation site density on the sharp corner. Since the rectangular pin fin provides a higher wetted perimeter (P), the overall boiling heat transfer coefficient is significantly enhanced.
Finally, the summary of heat transfer performance comparison between the test samples is presented in Table 3. Here, was calculated by averaging the heat transfer coefficient in each test case from both isolated and merged bubble regimes. Furthermore, the enhancement of the hb was presented by comparing the for each fin gap variation to the 1 mm fin gap. Furthermore, the average Nusselt number for each test case was calculated by incorporating the average heat transfer coefficient () as presented in Equation (10). As discussed earlier, the characteristic length (L) employed for this study was the hydraulic diameter within the pin fin array. Additionally, kf is the thermal conductivity of the saturated liquid.
4. Conclusions
In this study, the heat transfer phenomenon and bubble dynamics of pool boiling from pin fin arrays were investigated. The experiments employed a set of test samples with various geometrical shapes and dimensions inside an experimental chamber filled with dielectric fluid HFE-7100. The test was conditioned in steady-state sub-cooled boiling. Some key findings were obtained from the results as follows:
- The boiling phenomenon was observed to be in the three regimes: natural convection (Ts < Tsat), isolated bubble (0 K < Tsat < ~10 K), and merged bubble (Tsat > 10 K). Natural convection showed no bubble generation due to a lack of surface temperature. Both isolated and merged bubble regimes were within the category of nucleate boiling, but demonstrated a discrepancy in the bubble interaction before lift-off. Whilst the isolated bubble did not have any interaction among the bubbles, the merged bubble regime showed the merging process occurring on the hot surface.
- The boiling heat transfer coefficient increased as the fin gap rose. The enhancement was observed at 63.4% for the circular pin fin array, whilst the rectangular pin fin array demonstrated lower enhancement at around 17.8%. This indicates that the enhancement was more impactful in the circular pin fin, particularly at the gap between 1 mm and 1.5 mm. This discrepancy is due to the different active nucleation site densities between both shapes.
- Overall, the isolated bubble regime demonstrated better cooling performance than the merged bubble at around 56.31% and 62.31% for circular and rectangular pin fin arrays, respectively. This is due to the blanket of vapor built on the hot surface due to bubble merging. This blanket increased the thermal resistance, undermining the bubble dynamics enhancement observed in the isolated bubble regime.
- Visualization and dimensionless number demonstrated enhanced bubble dynamics as the pin fin gap rose. By increasing the gap between the fins, the buoyancy force increased whilst the flow resistance reduced. This allows the bubble to depart easier and, hence, increases the heat transfer coefficient.
- From the dimensionless number plots, it was found that the buoyancy force was more dominant than the viscous force (Gr > 1), while the Bo plot showed that the buoyancy force was more influential than the surface tension (Bo > 1). Both results indicated the priority in enhancement, whereby the buoyancy force had a strong correlation with the pin fin gap which constitutes the magnitude of characteristic length.
Author Contributions
Conceptualization, I.P.; methodology, I.P.; formal analysis, I.P., M.A.R. and J.W.; validation, M.A.R.; result analysis, I.P. and M.A.R.; investigation, M.A.R. and J.W.; writing—original draft preparation, M.A.R. and I.P.; writing—review and editing, I.P. and M.A.R.; visualization, I.P., M.A.R. and J.W.; supervision, I.P.; funding acquisition, I.P. All authors have read and agreed to the published version of the manuscript.
Funding
This research was funded by research grant Penelitian Dasar Unggulan Perguruan Tinggi (PDUPT) Ministry of Education, Culture, Research, and Technology Indonesia Year 2022, Grant Number: 089/E5/PG.02.00.PT/2022 and 1825/UN1/DITLIT/Dit-Lit/PT.01.03/2022.
Institutional Review Board Statement
Not applicable.
Informed Consent Statement
Not applicable.
Data Availability Statement
Not applicable.
Conflicts of Interest
The authors declare no conflict of interest. The funders had no role in the design of the study; in the collection, analyses, or interpretation of data; in the writing of the manuscript, or in the decision to publish the results.
Nomenclature
| A | Insulation layer surface area (m2) |
| Af | Fin total area (mm2) |
| Fin width (mm) | |
| Bo | Bond number (dimensionless) |
| Fin height (mm) | |
| Fin gap (mm) | |
| Ca | Capillary number (dimensionless) |
| Specific heat of the liquid (kJ/kg∙K) | |
| DB | Bubble departure diameter (m) |
| Dh | Hydraulic diameter (mm) |
| Bubble departure frequency (Hz) | |
| Gr | Grashof number (dimensionless) |
| g | Gravity (m/s2) |
| Boiling heat transfer coefficient (kW/m2∙K) | |
| Average boiling heat transfer coefficient (kW/m2∙K) | |
| Enthalpy of vaporization (kJ/kg) | |
| Thermal conductivity of the fluid (W/m∙K) | |
| L | Wall thickness (m) |
| Characteristic length (mm) | |
| NA | Active nucleation site density (sites/m2) |
| Wetted perimeter (m) | |
| Net heat flux = (W/m2) | |
| Convection heat flux (W/m2) | |
| Evaporation heat flux (W/m2) | |
| Heat input of cartridge heater (W/m2) | |
| Heat loss through the heating base wall (W/m2) | |
| Rewetting heat flux (W/m2) | |
| Surface temperature (K) | |
| Saturation temperature (K) | |
| Thermal expansion coefficient (1/K) | |
| Superheat temperature = (K) | |
| σ | Surface tension (mN/m) |
| Kinematic viscosity (m2/s) | |
| Density of the liquid (kg/m3) | |
| Density of the vapor (kg/m3) |
References
- Kurul, N.; Podowski, M.Z. Multidimensional effects in forced convection subcooled boiling. In International Heat Transfer Conference Digital Library; Begel House Inc.: Danbury, CT, USA, 1990. [Google Scholar]
- El-Genk, M.S. Nucleate boiling enhancements on porous graphite and microporous and macro—Finned copper surfaces nucleate boiling enhancements on porous graphite and microporous and macro—Finned copper surfaces. Heat Transf. Eng. 2012, 33, 175–204. [Google Scholar] [CrossRef]
- Liang, G.; Mudawar, I. Review of pool boiling enhancement by surface modification. Int. J. Heat Mass Transf. 2021, 128, 892–933. [Google Scholar] [CrossRef]
- Kraus, A.D.; Bar-Cohen, A. Thermal Analysis and Control of Electronic Equipment; Hemisphere Publishing Corporation: Washington, DC, USA, 1983. [Google Scholar]
- Sur, A.; Lu, Y.; Pascente, C.; Ruchhoeft, P.; Liu, D. Pool boiling heat transfer enhancement with electrowetting. Int. J. Heat Mass Transf. 2018, 120, 202–217. [Google Scholar] [CrossRef]
- Zhou, J.; Qi, B.; Wei, J. Critical heat flux on heterogeneous fractal surfaces with micro-pin-fins in pool boiling part I: The effects of distribution and subcooling. Int. J. Heat Mass Transf. 2019, 136, 1338–1348. [Google Scholar] [CrossRef]
- Milanova, D.; Kumar, R. Heat transfer behavior of silica nanoparticles in pool boiling. J. Heat Transf. 2018, 130, 042401. [Google Scholar] [CrossRef]
- Wang, W.; Wu, F.; Yu, Q.; Jin, H. Experimental investigation of titanium tetrachloride in pool boiling heat transfer. Int. J. Heat Mass Transf. 2018, 122, 1308–1312. [Google Scholar] [CrossRef]
- Hao, W.; Wang, T.; Jiang, Y.; Guo, C.; Guo, C. Pool boiling heat transfer on deformable structures made of shape-memory-alloys. Int. J. Heat Mass Transf. 2017, 112, 236–247. [Google Scholar] [CrossRef]
- Kwark, S.M.; Amaya, M.; Kumar, R.; Moreno, G.; You, S.M. Effects of pressure, orientation, and heater size on pool boiling of water with nanocoated heaters. Int. J. Heat Mass Transf. 2010, 53, 5199–5208. [Google Scholar] [CrossRef]
- Zhang, Y.; Zhou, J.; Zhou, W.; Qi, B.; Wei, J. CHF correlation of boiling in FC-72 with micro-pin-fins for electronics cooling. Appl. Therm. Eng. 2018, 138, 494–500. [Google Scholar] [CrossRef]
- Pranoto, I.; Leong, K.C.; Rofiq, A.A.; Arroisi, H.M.; Rahman, M.A. Study on the pool boiling bubble departure diameter and frequency from porous graphite foam structures. In Advances in Heat Transfer and Thermal Engineering; Wen, C., Yan, Y., Eds.; Springer: Singapore, 2021; pp. 217–223. [Google Scholar]
- Jin, L.W.; Leong, K.C.; Pranoto, I. Saturated pool boiling heat transfer from highly conductive graphite foams. Appl. Therm. Eng. 2011, 31, 2685–2693. [Google Scholar] [CrossRef]
- Bian, H.; Kurwitz, C.; Sun, Z.; Cheng, K.; Chen, K. Enhanced nucleate boiling on 3D-printed micro-porous structured surface. Appl. Therm. Eng. 2018, 141, 422–434. [Google Scholar] [CrossRef]
- Moita, A.S.; Teodori, E.; Moreira, A.L.N. Influence of surface topography in the boiling mechanisms. Int. J. Heat Mass Transf. 2015, 52, 50–63. [Google Scholar] [CrossRef]
- Ho, J.Y.; Leong, K.C.; Yang, C.; Pranoto, I. An experimental study of carbon nanotube coatings for pool boiling heat transfer enhancement. In Proceedings of the International Heat Transfer Conference 15, Kyoto, Japan, 10–15 August 2014. [Google Scholar]
- Wei, J.J.; Honda, H. Effects of fin geometry on boiling heat transfer from silicon chips with micro-pin-fins immersed in FC-72. Int. J. Heat Mass Transf. 2003, 46, 4059–4070. [Google Scholar] [CrossRef]
- Shojaeian, M.; Kosar, A. Pool boiling and flow boiling on micro- and nanostructured surfaces. Exp. Therm. Fluid Sci. 2015, 63, 45–73. [Google Scholar] [CrossRef]
- Pranoto, I.; Rahman, M.A.; Mahardika, P.A.P. Pool boiling heat transfer performance and bubble dynamics from pin fin-modified surfaces with geometrical shape variation. Energies 2022, 15, 1847. [Google Scholar] [CrossRef]
- Rainey, K.N.; You, S.M. Pool boiling heat transfer from plain and microporous, square pin-finned surfaces in saturated FC-72. J. Heat Transf. 2000, 122, 509–516. [Google Scholar] [CrossRef]
- Parker, J.; El-Genk, M.S. Saturation boiling of HFE-7100 dielectric liquid on copper surfaces with corner pins at different inclinations. J. Enhanc. Heat Transf. 2009, 16, 103–122. [Google Scholar] [CrossRef]
- Klein, G.; Westwater, J. Heat transfer from multiple spines to boiling liquids. AIChE J. 1971, 17, 1050–1056. [Google Scholar] [CrossRef]
- Yong, J.; Kim, M.; Kaviany, M.; Young, S. Bubble nucleation in microchannel flow boiling using single artificial cavity. Int. J. Heat Mass Transf. 2011, 54, 5139–5148. [Google Scholar]
- Nukiyama, S. The maximum and minimum values of the heat Q transmitted from metal to boiling water under atmospheric pressure. Int. J. Heat Mass Transf. 1966, 9, 1419–1433. [Google Scholar] [CrossRef]
- Pastuszko, R. Pool boiling for extended surfaces with narrow tunnels—Visualization and a simplified model. Exp. Therm. Fluid Sci. 2012, 38, 149–164. [Google Scholar] [CrossRef]
- Kandlikar, S.G. Controlling bubble motion over heated surface through evaporation momentum force to enhance pool boiling heat transfer. Appl. Phys. Lett. 2013, 102, 051611. [Google Scholar] [CrossRef] [Green Version]
- Mahardika, P.A.P. Studi Eksperimental Pengaruh Fins Gap Terhadap Performa Dan Fenomena Perpindahan Kalor Pool Boiling Pada Circular Pin Fin Dan Fluida Kerja HFE-7100. Undergraduate Thesis, Gadjah Mada University, Yogyakarta, Indonesia, 2021. [Google Scholar]
- Qi, H.; Fang, D.; Meng, X.; Wu, J. Liquid density of HFE-7000 and HFE-7100 from T = (283 to 363) K at pressures up to 100 MPa. J. Chem. Thermodyn. 2014, 77, 131–136. [Google Scholar] [CrossRef]
- An, B.; Duan, Y.; Yang, F.; Yang, Z. pvT property of HFE 7100 in the gaseous phase. J. Chem. Eng. Data 2015, 60, 3289–3295. [Google Scholar] [CrossRef]
- Rausch, M.H.; Kretschmer, L.; Will, S.; Leipertz, A.; Froba, A.P. Density, surface tension, and kinematic viscosity of hydrofluoroethers HFE-7000, HFE-7100, HFE-7200, HFE-7300, and HFE-7500. J. Chem. Eng. Data 2015, 60, 3759–3765. [Google Scholar] [CrossRef]
- Taylor, J.R. An Introduction to Error Analysis, 2nd ed.; University of Science Book: Sausalito, CA, USA, 1997. [Google Scholar]
- Dogan, M.; Dogan, D. Experimental investigation of natural convection heat transfer from fin arrays for different tip-to-base fin spacing ratios. J. Therm. Sci. Tech. 2017, 37, 147–157. [Google Scholar]
- Jones, C.D.; Smith, L.F. Optimum arrangement of rectangular fins on horizontal surfaces for free-convection heat transfer. J. Heat Transf. 1970, 92, 6–10. [Google Scholar] [CrossRef]
- Chyu, M.K. Heat transfer and pressure drop for short pin-fin arrays with pin-endwall fillet. In Proceedings of the Gas Turbine and Aeroengine Congress and Exposition, Toronto, ON, Canada, 4–8 June 1988. [Google Scholar]
Figure 1.
Experimental facility by (a) schematic diagram and (b) system configuration [27].
Figure 1.
Experimental facility by (a) schematic diagram and (b) system configuration [27].

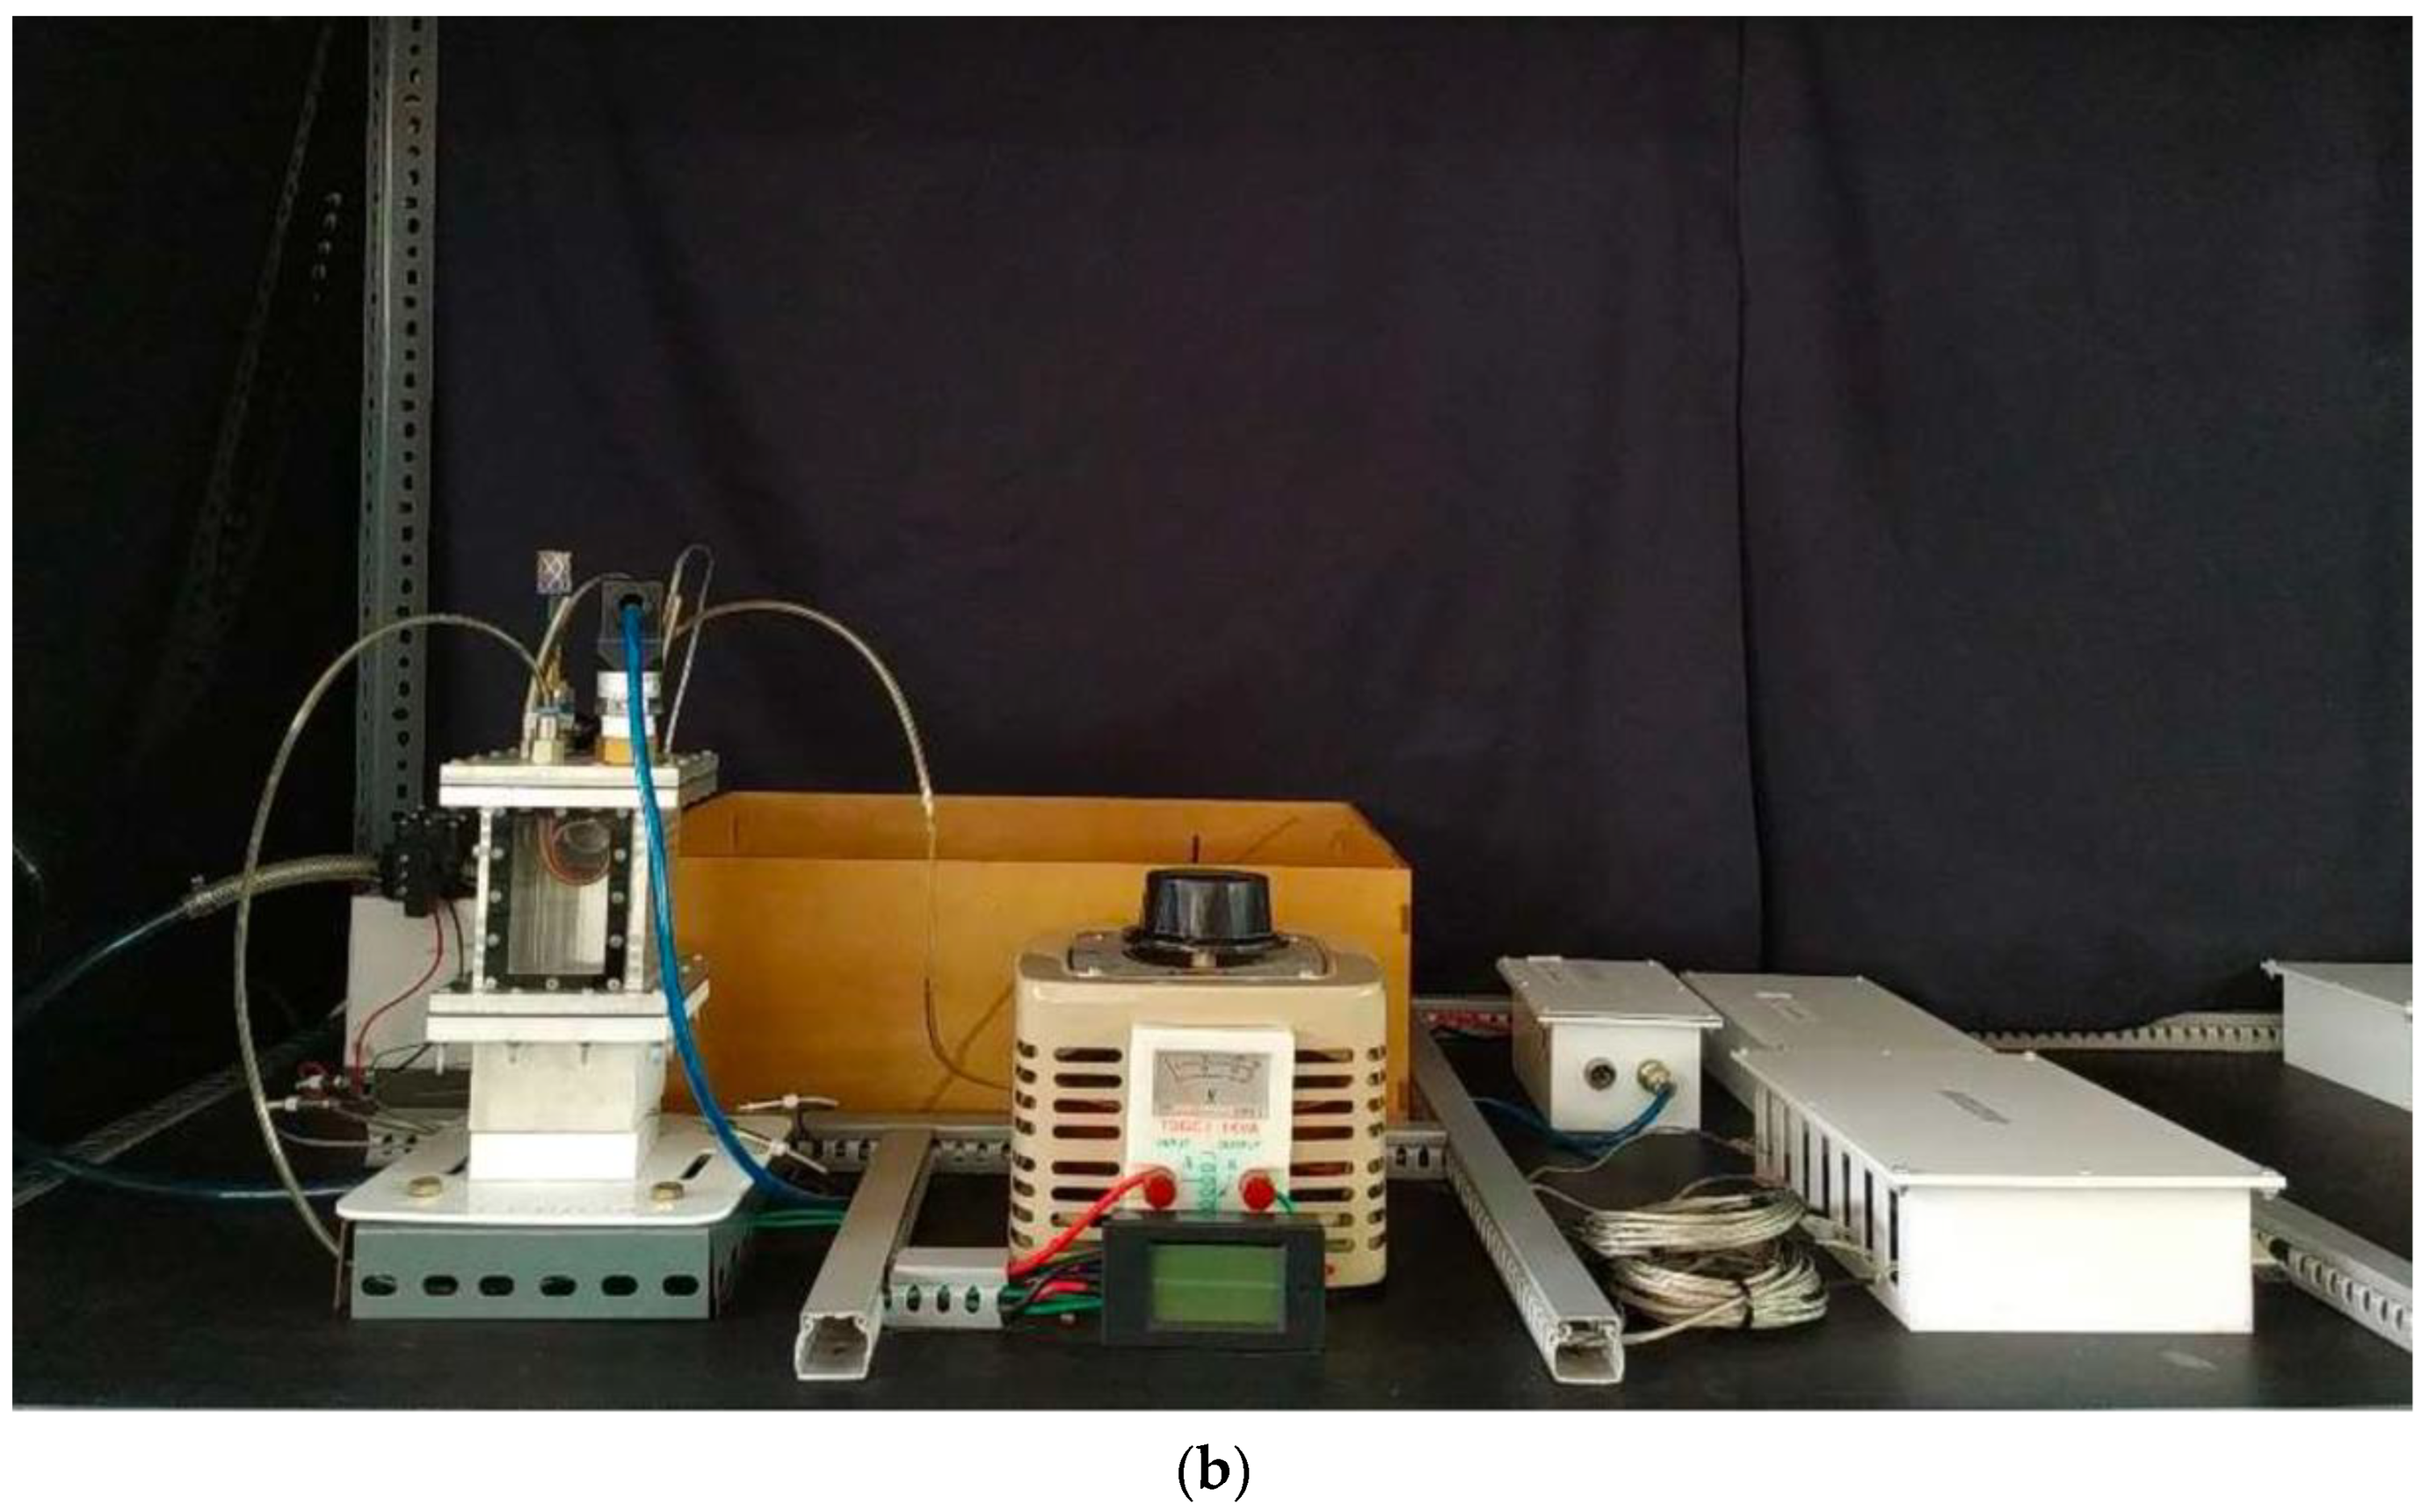
Figure 2.
Configuration and dimensions of (a) circular and (b) rectangular pin fin arrays.

Figure 3.
Boiling curve and regime from circular pin fin array.
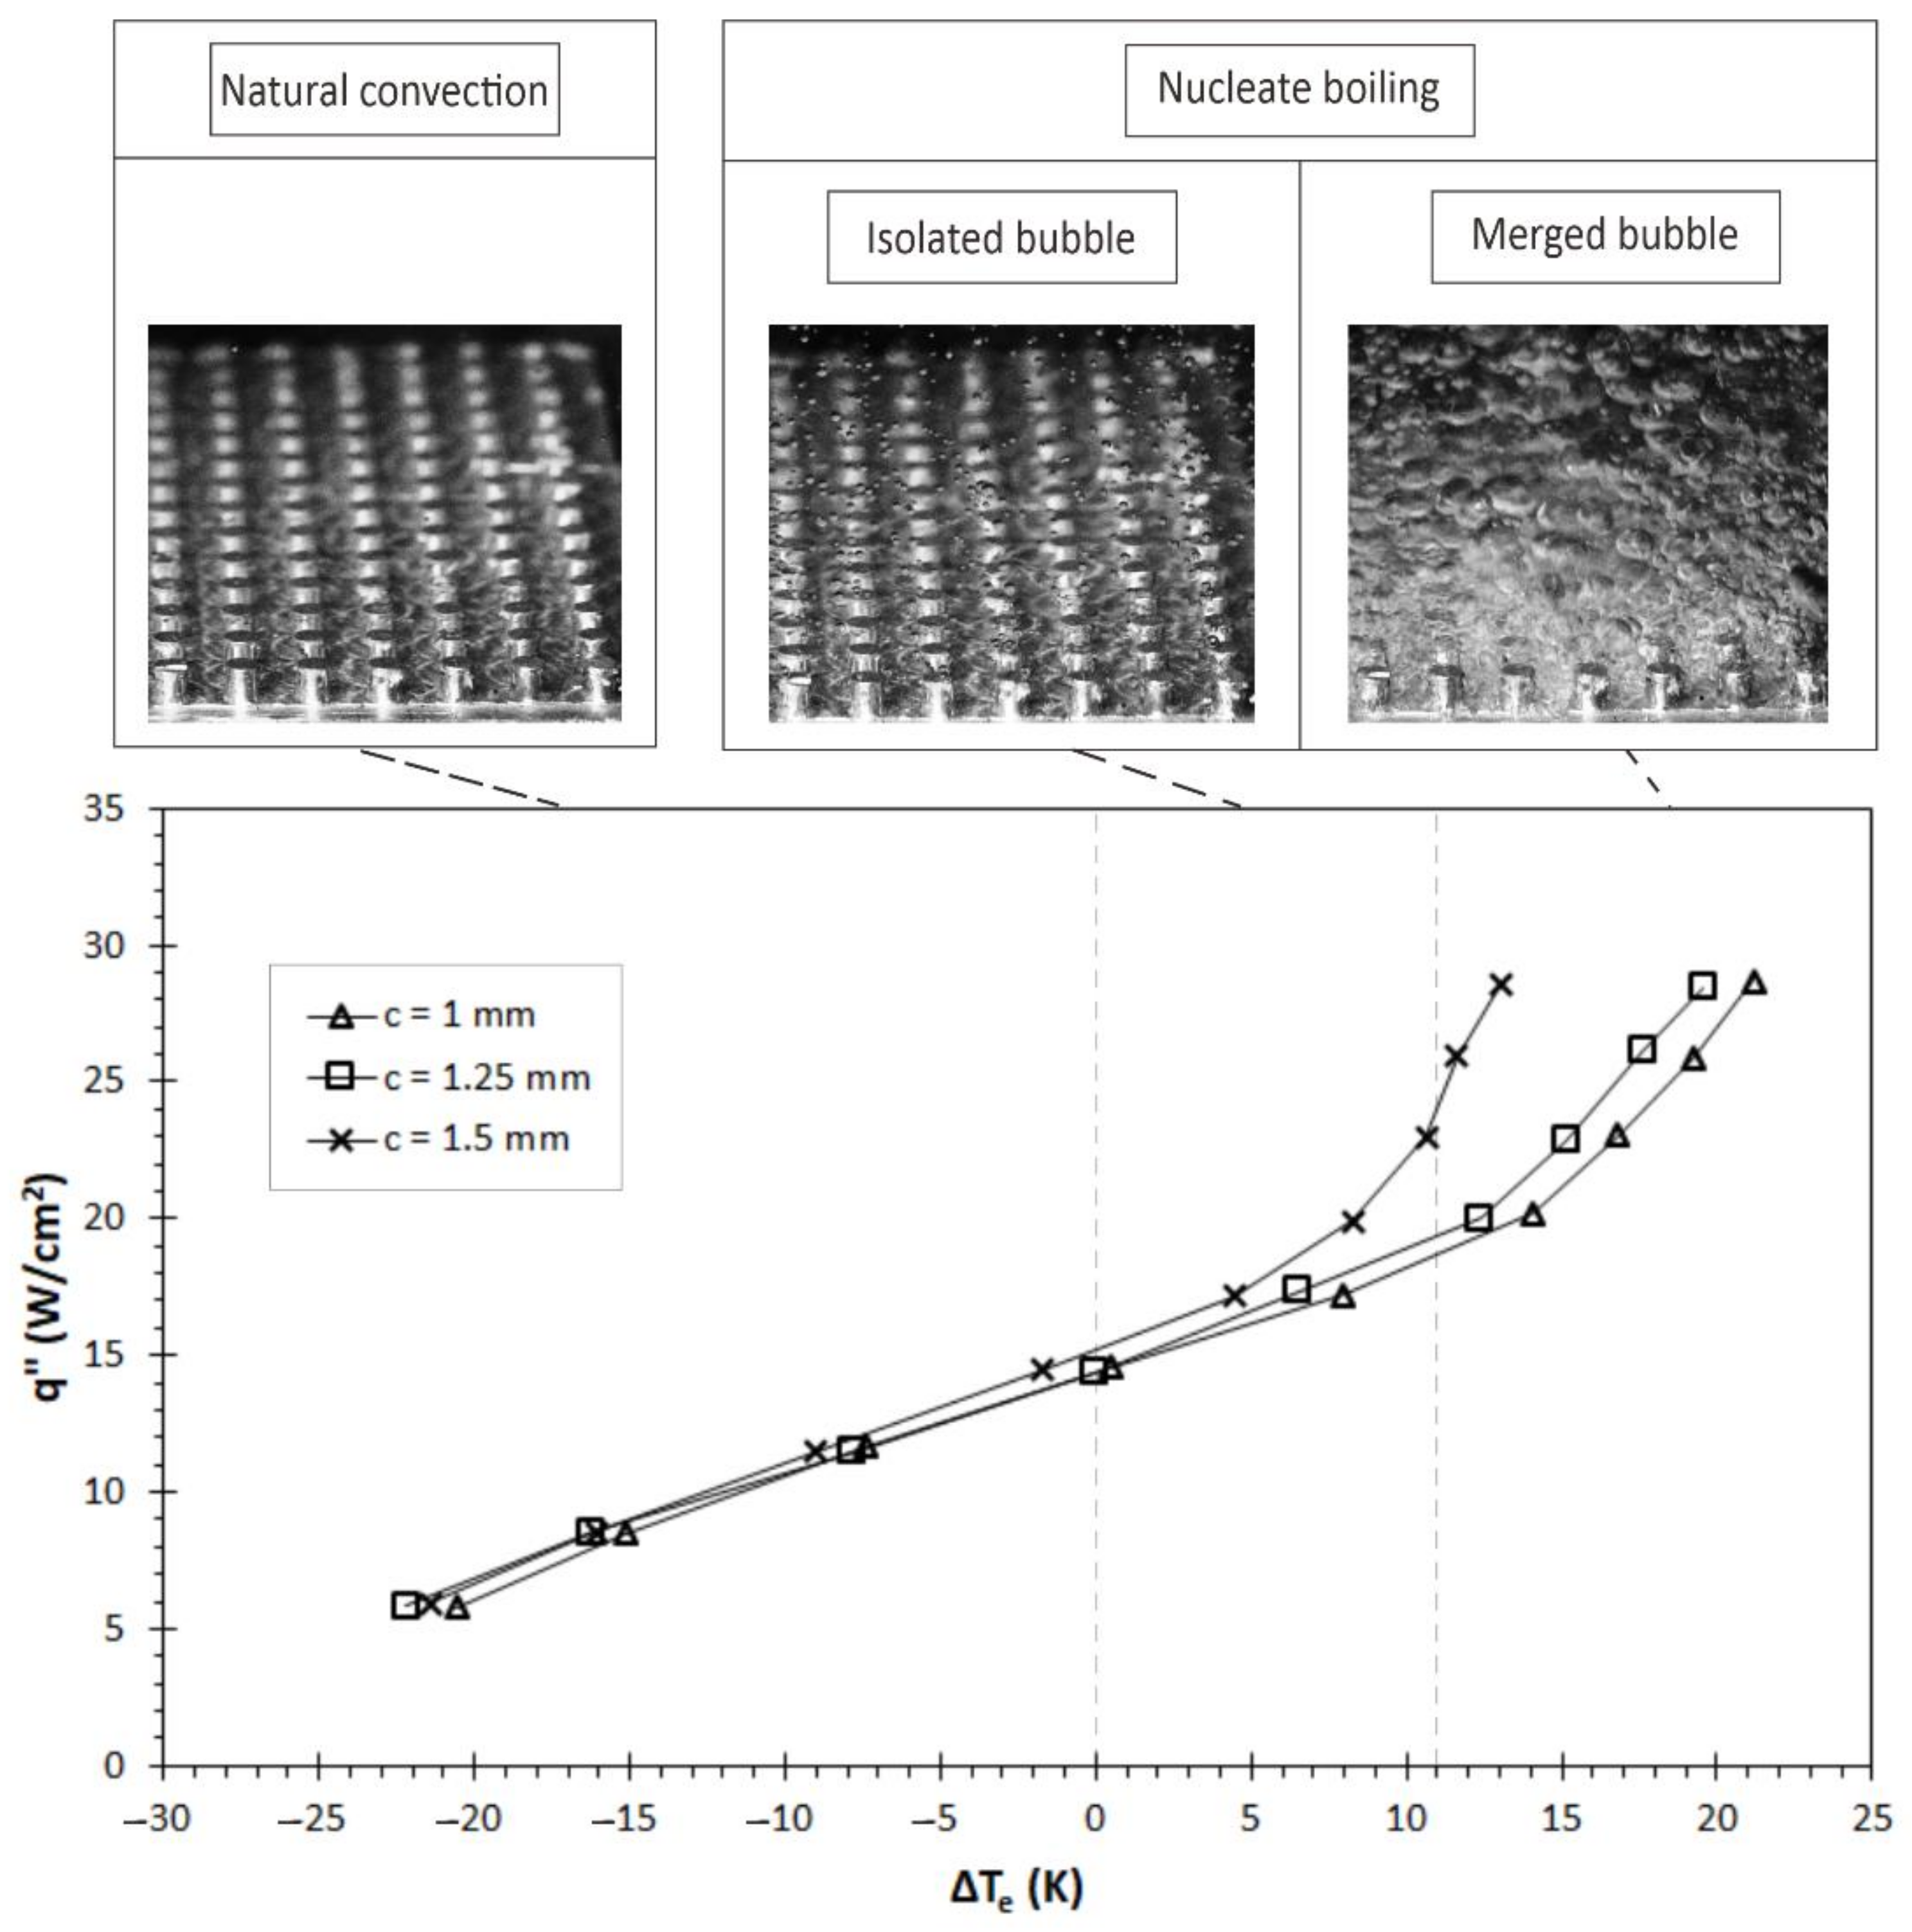
Figure 4.
Boiling curve and regime from rectangular pin fin array.
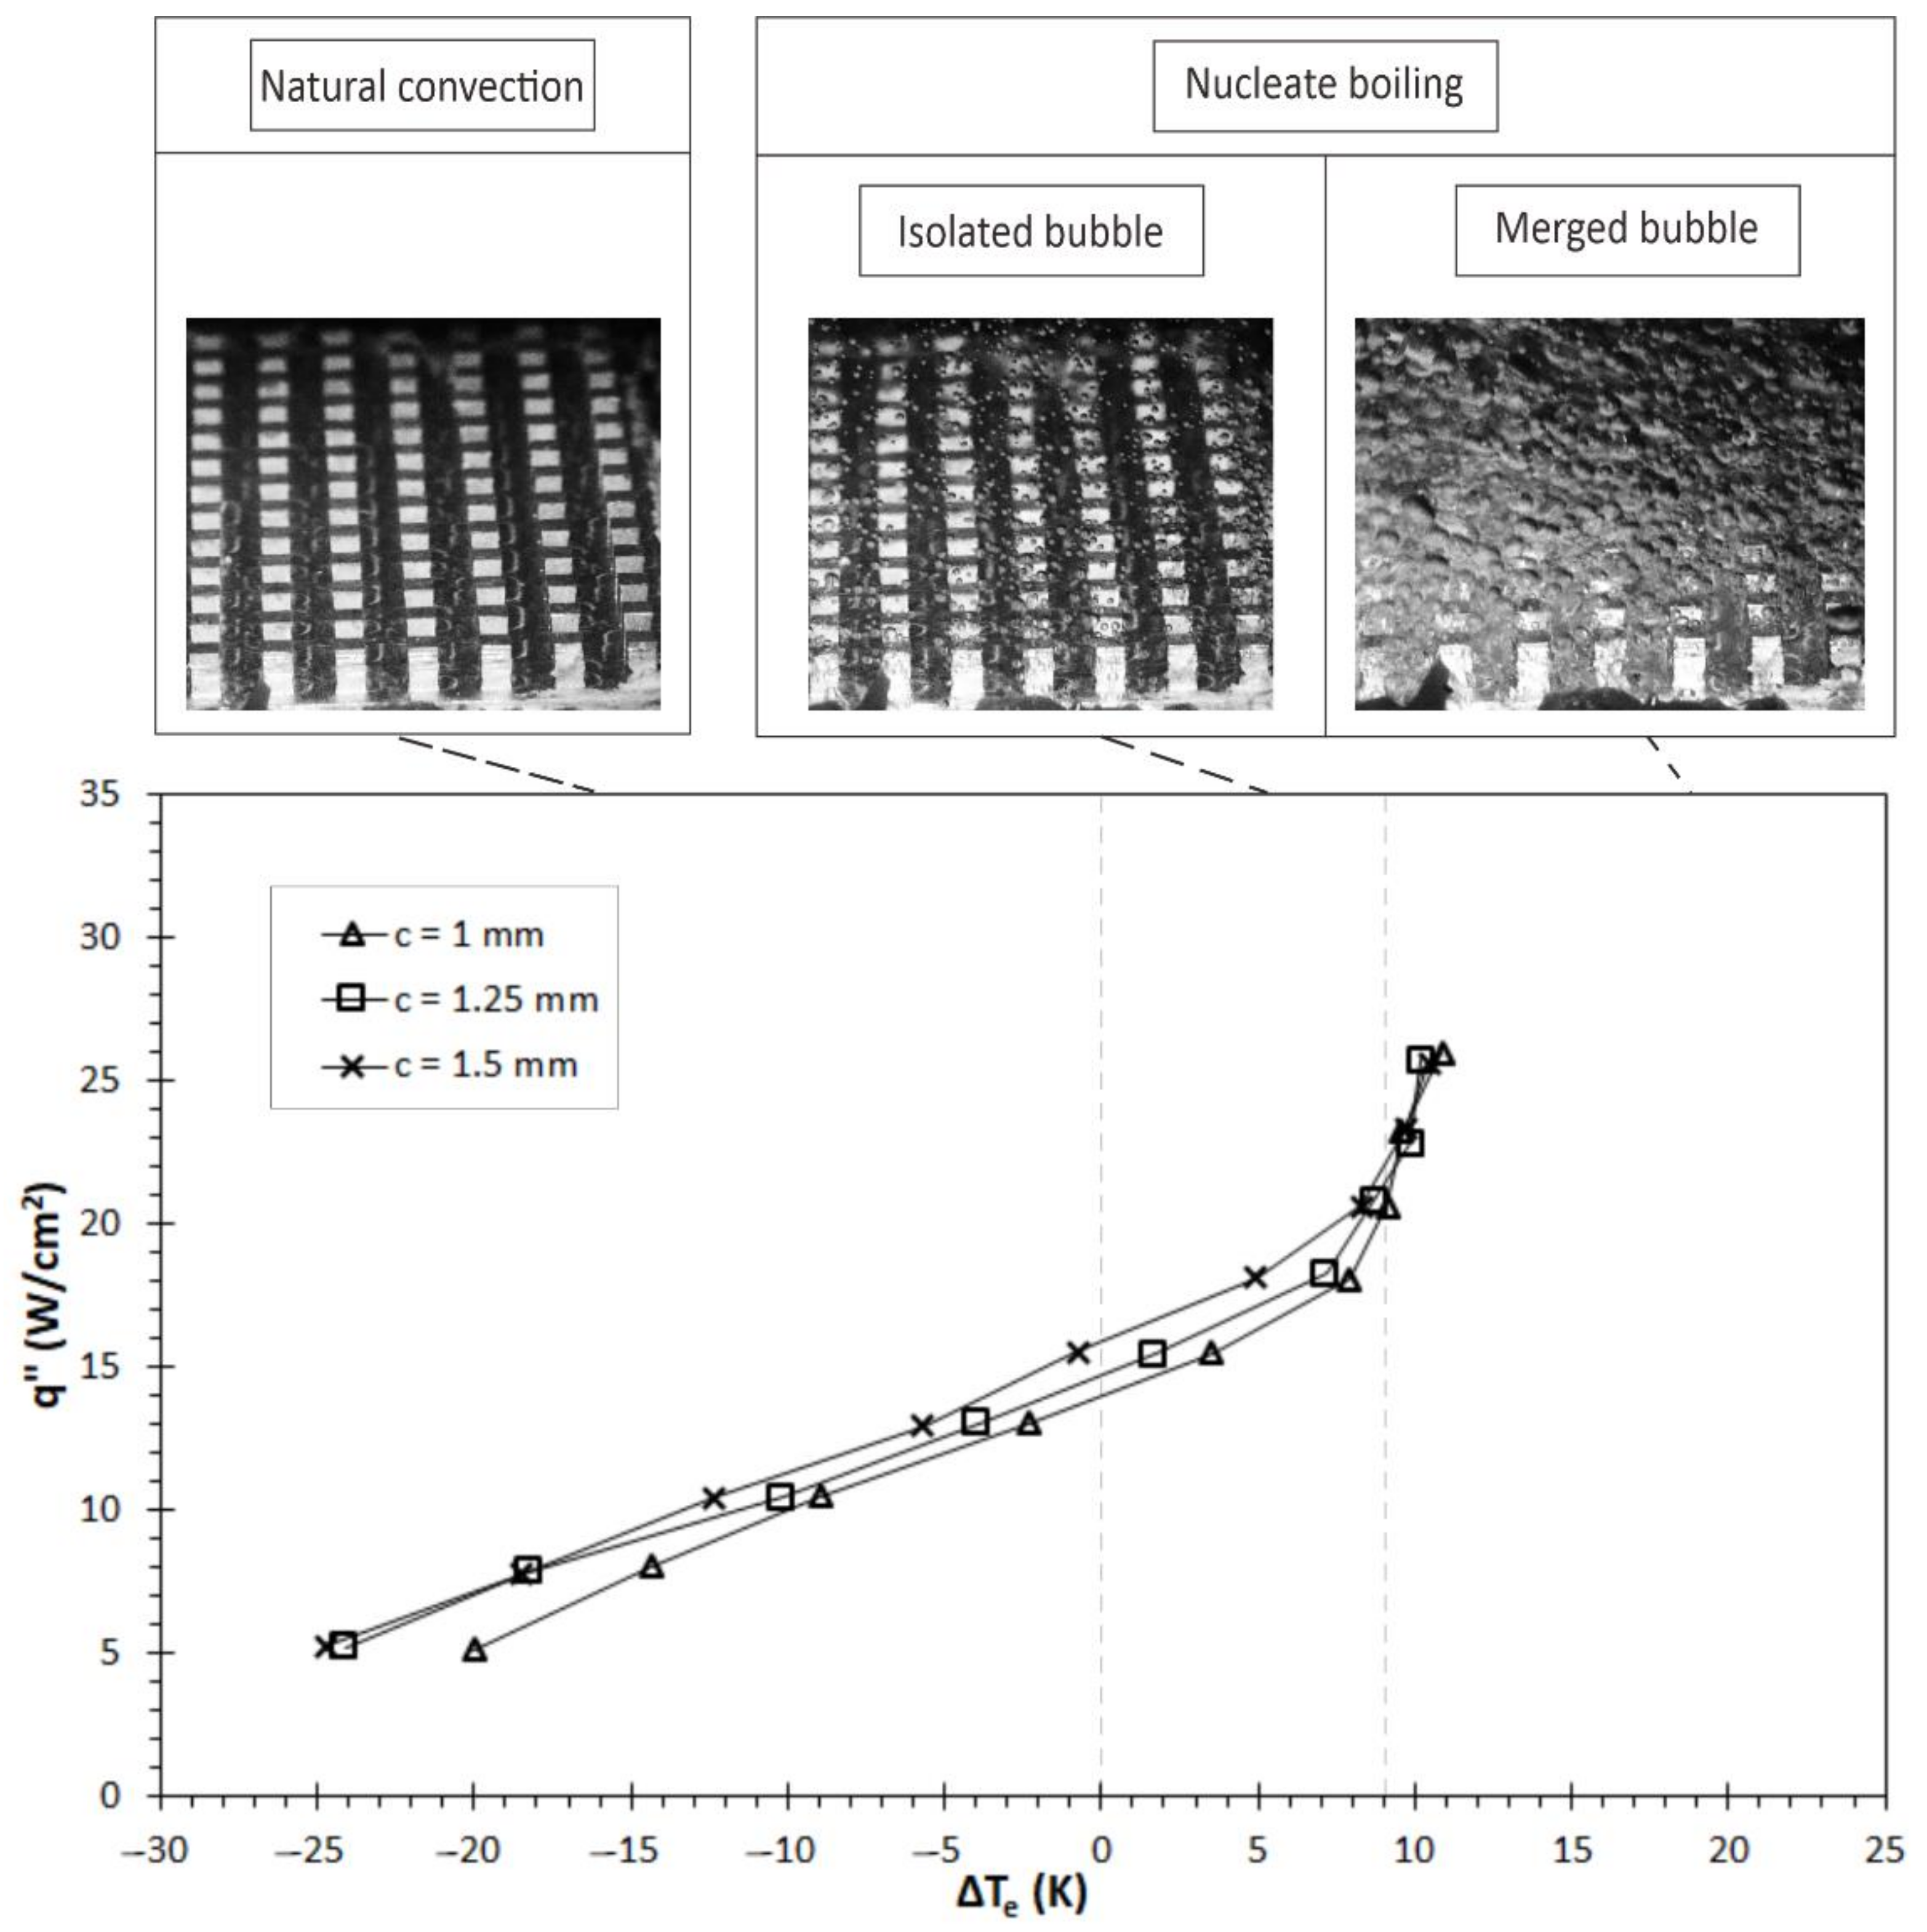
Figure 5.
Phenomenon of isolated bubble regime observed from: (a) 1 mm gap circular pin fin array at q″ = 5.8 W/cm2; (b) 1 mm gap rectangular pin fin array at q″ = 5.1 W/cm2.
Figure 5.
Phenomenon of isolated bubble regime observed from: (a) 1 mm gap circular pin fin array at q″ = 5.8 W/cm2; (b) 1 mm gap rectangular pin fin array at q″ = 5.1 W/cm2.

Figure 6.
Phenomenon of isolated bubble regime observed from: (a) 1 mm gap circular pin fin array at q″ = 14.5 W/cm2; (b) 1 mm gap rectangular pin fin array at q″ = 13.0 W/cm2.
Figure 6.
Phenomenon of isolated bubble regime observed from: (a) 1 mm gap circular pin fin array at q″ = 14.5 W/cm2; (b) 1 mm gap rectangular pin fin array at q″ = 13.0 W/cm2.
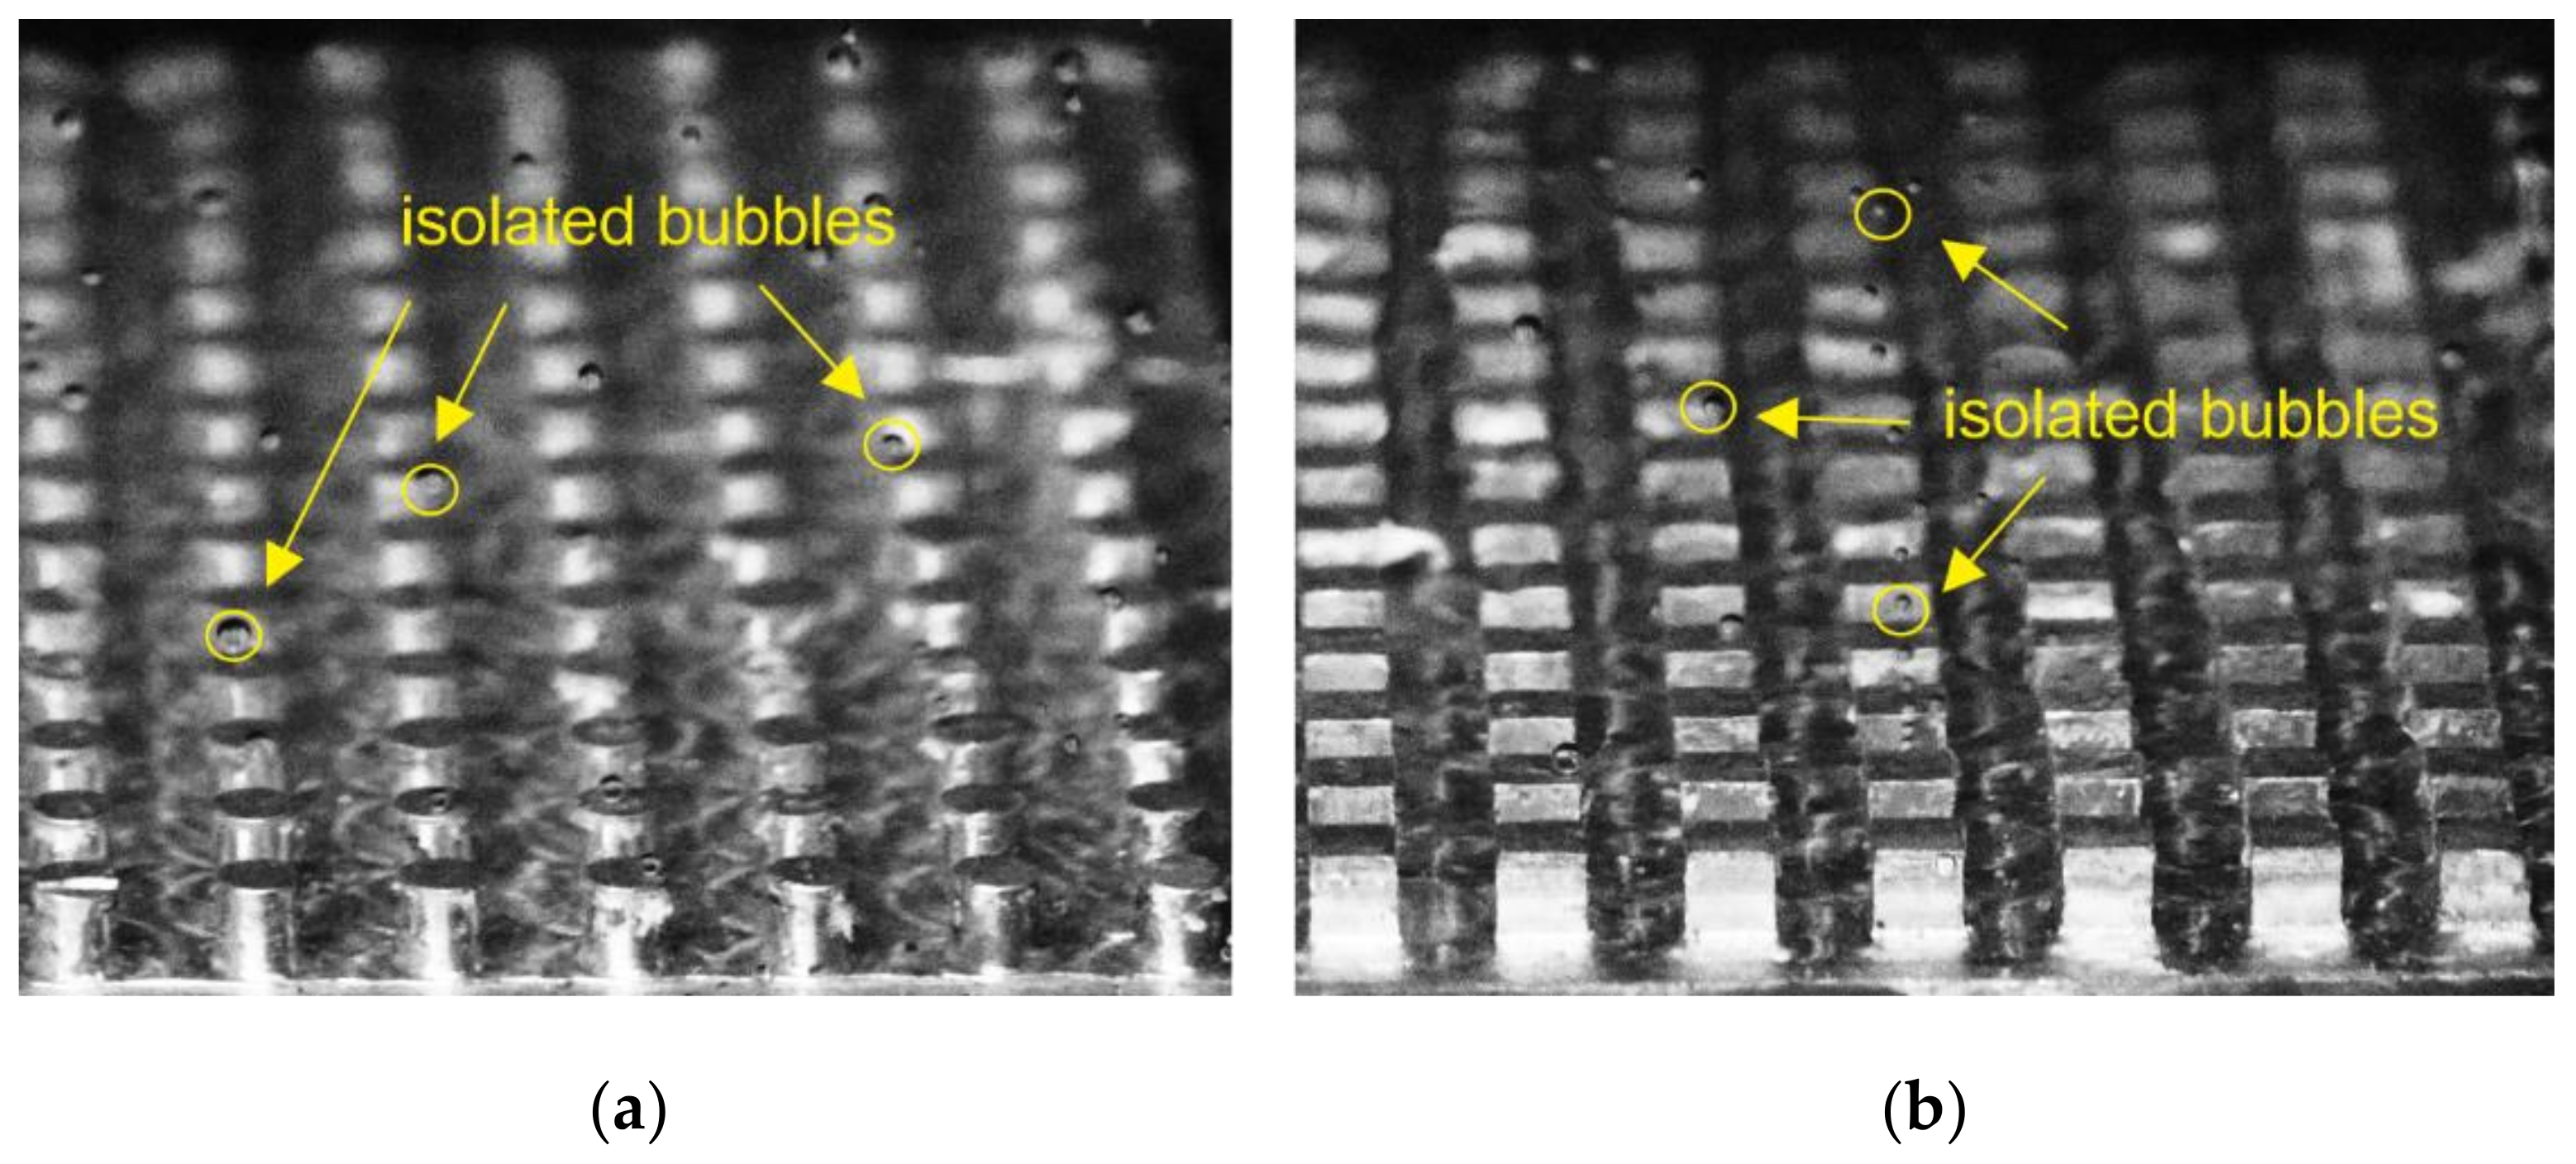
Figure 7.
Phenomenon of merged bubble regime observed from: (a) 1 mm gap circular pin fin array at q″ = 23.0 W/cm2; (b) 1 mm gap rectangular pin fin array at q″ = 23.6 W/cm2.
Figure 7.
Phenomenon of merged bubble regime observed from: (a) 1 mm gap circular pin fin array at q″ = 23.0 W/cm2; (b) 1 mm gap rectangular pin fin array at q″ = 23.6 W/cm2.

Figure 10.
The discrepancy of bubble generation observed from two different heat fluxes: (a) q″ = 14.5 W/cm2; (b) q″ = 20.2 W/cm2.
Figure 10.
The discrepancy of bubble generation observed from two different heat fluxes: (a) q″ = 14.5 W/cm2; (b) q″ = 20.2 W/cm2.
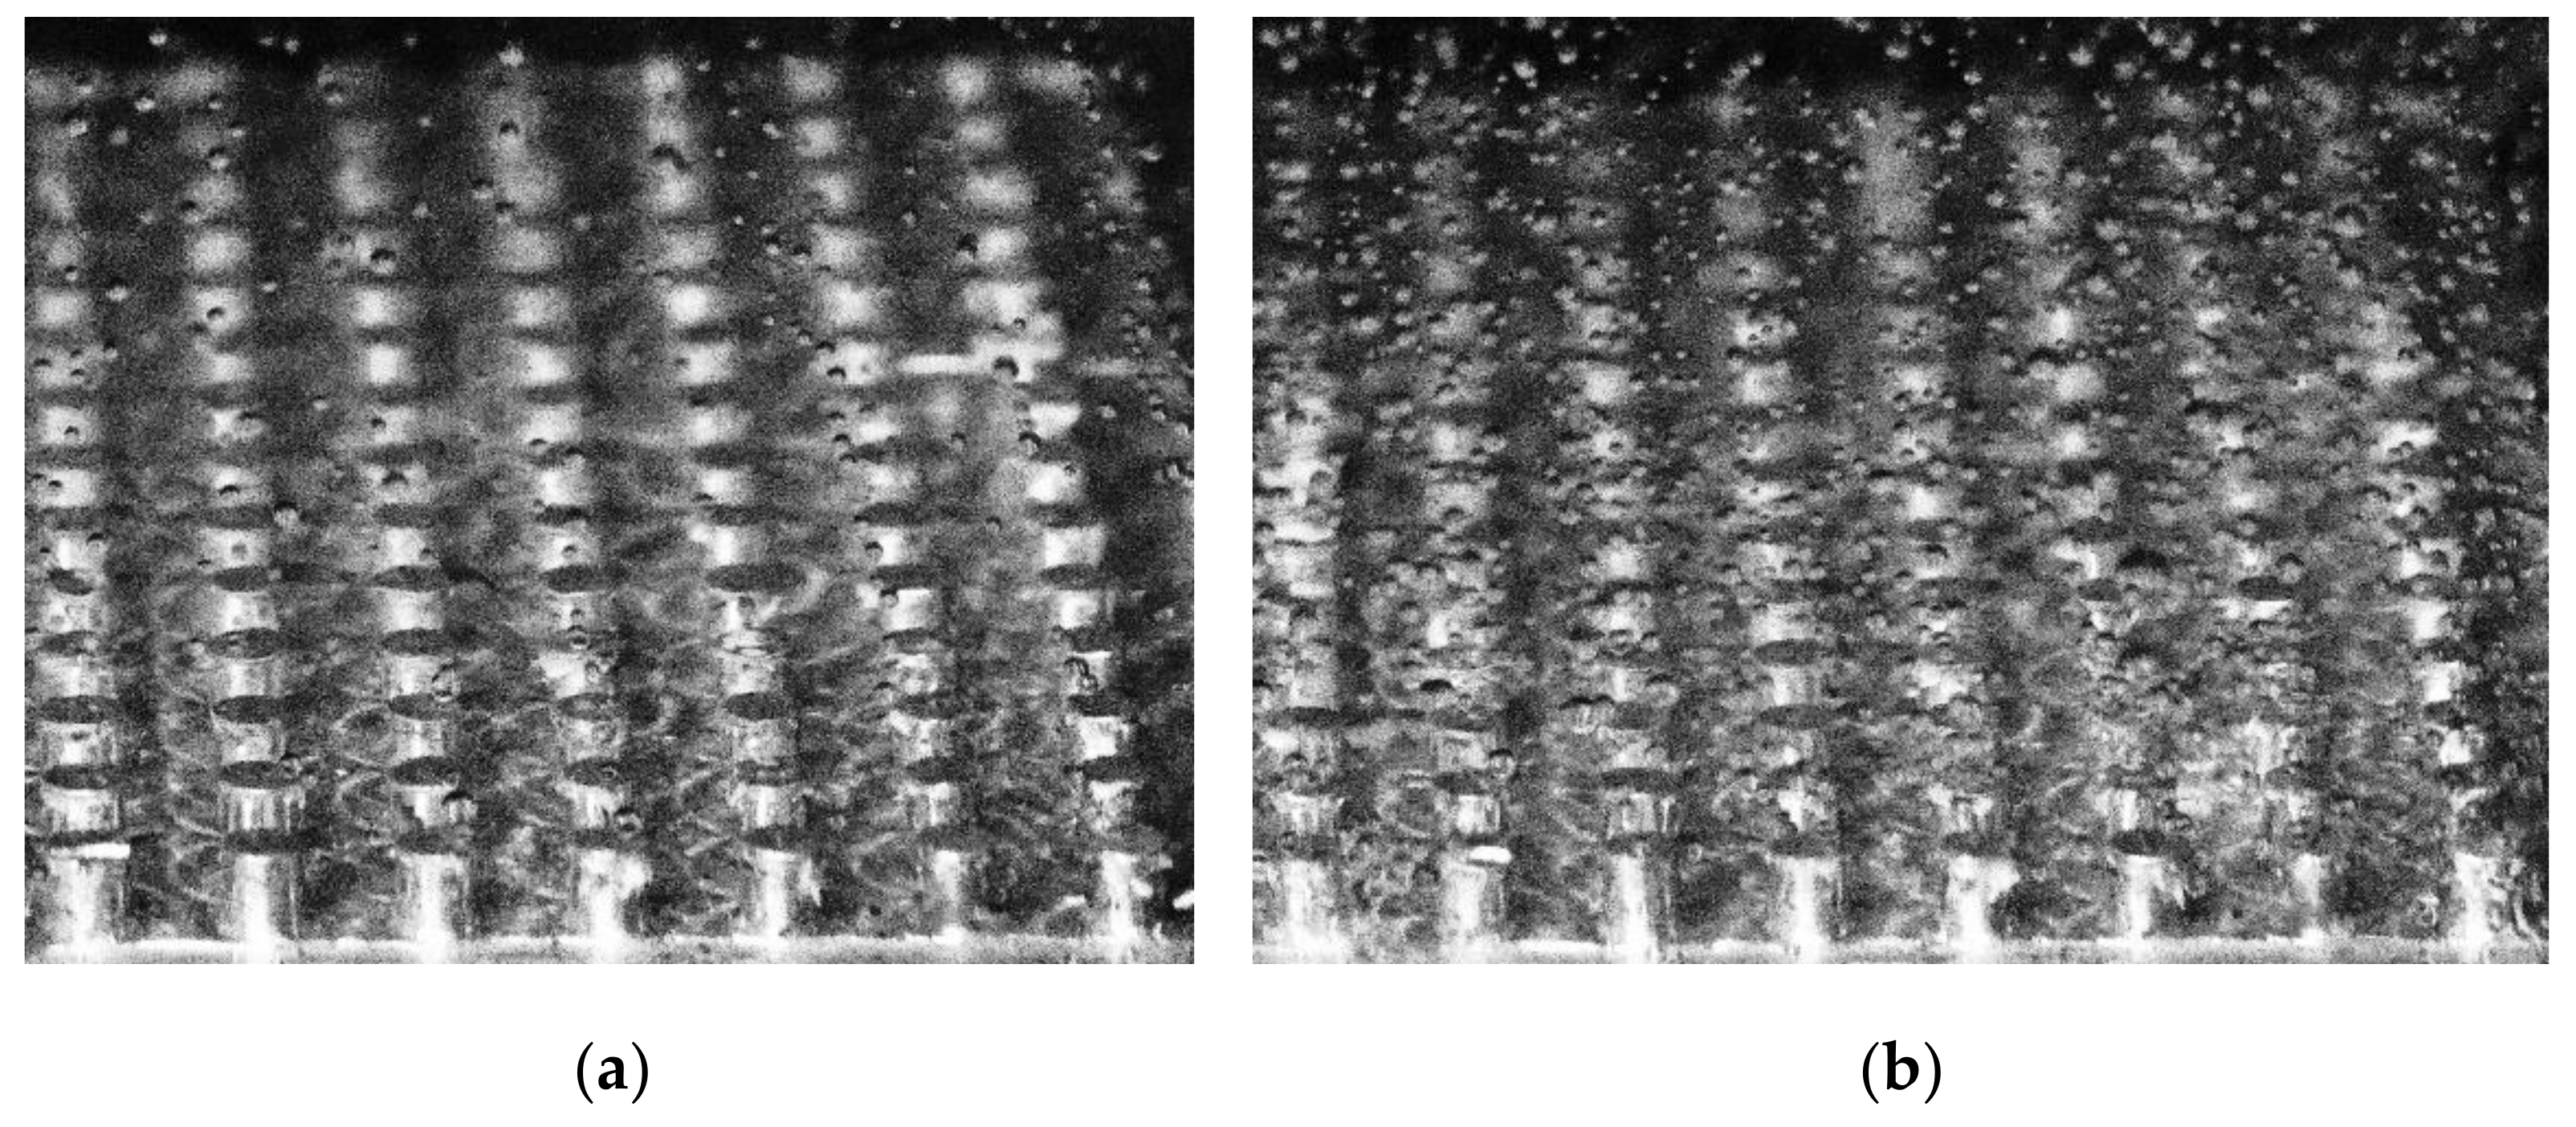
Figure 11.
Illustration of bubble growth and departure from the isolated bubble regime.
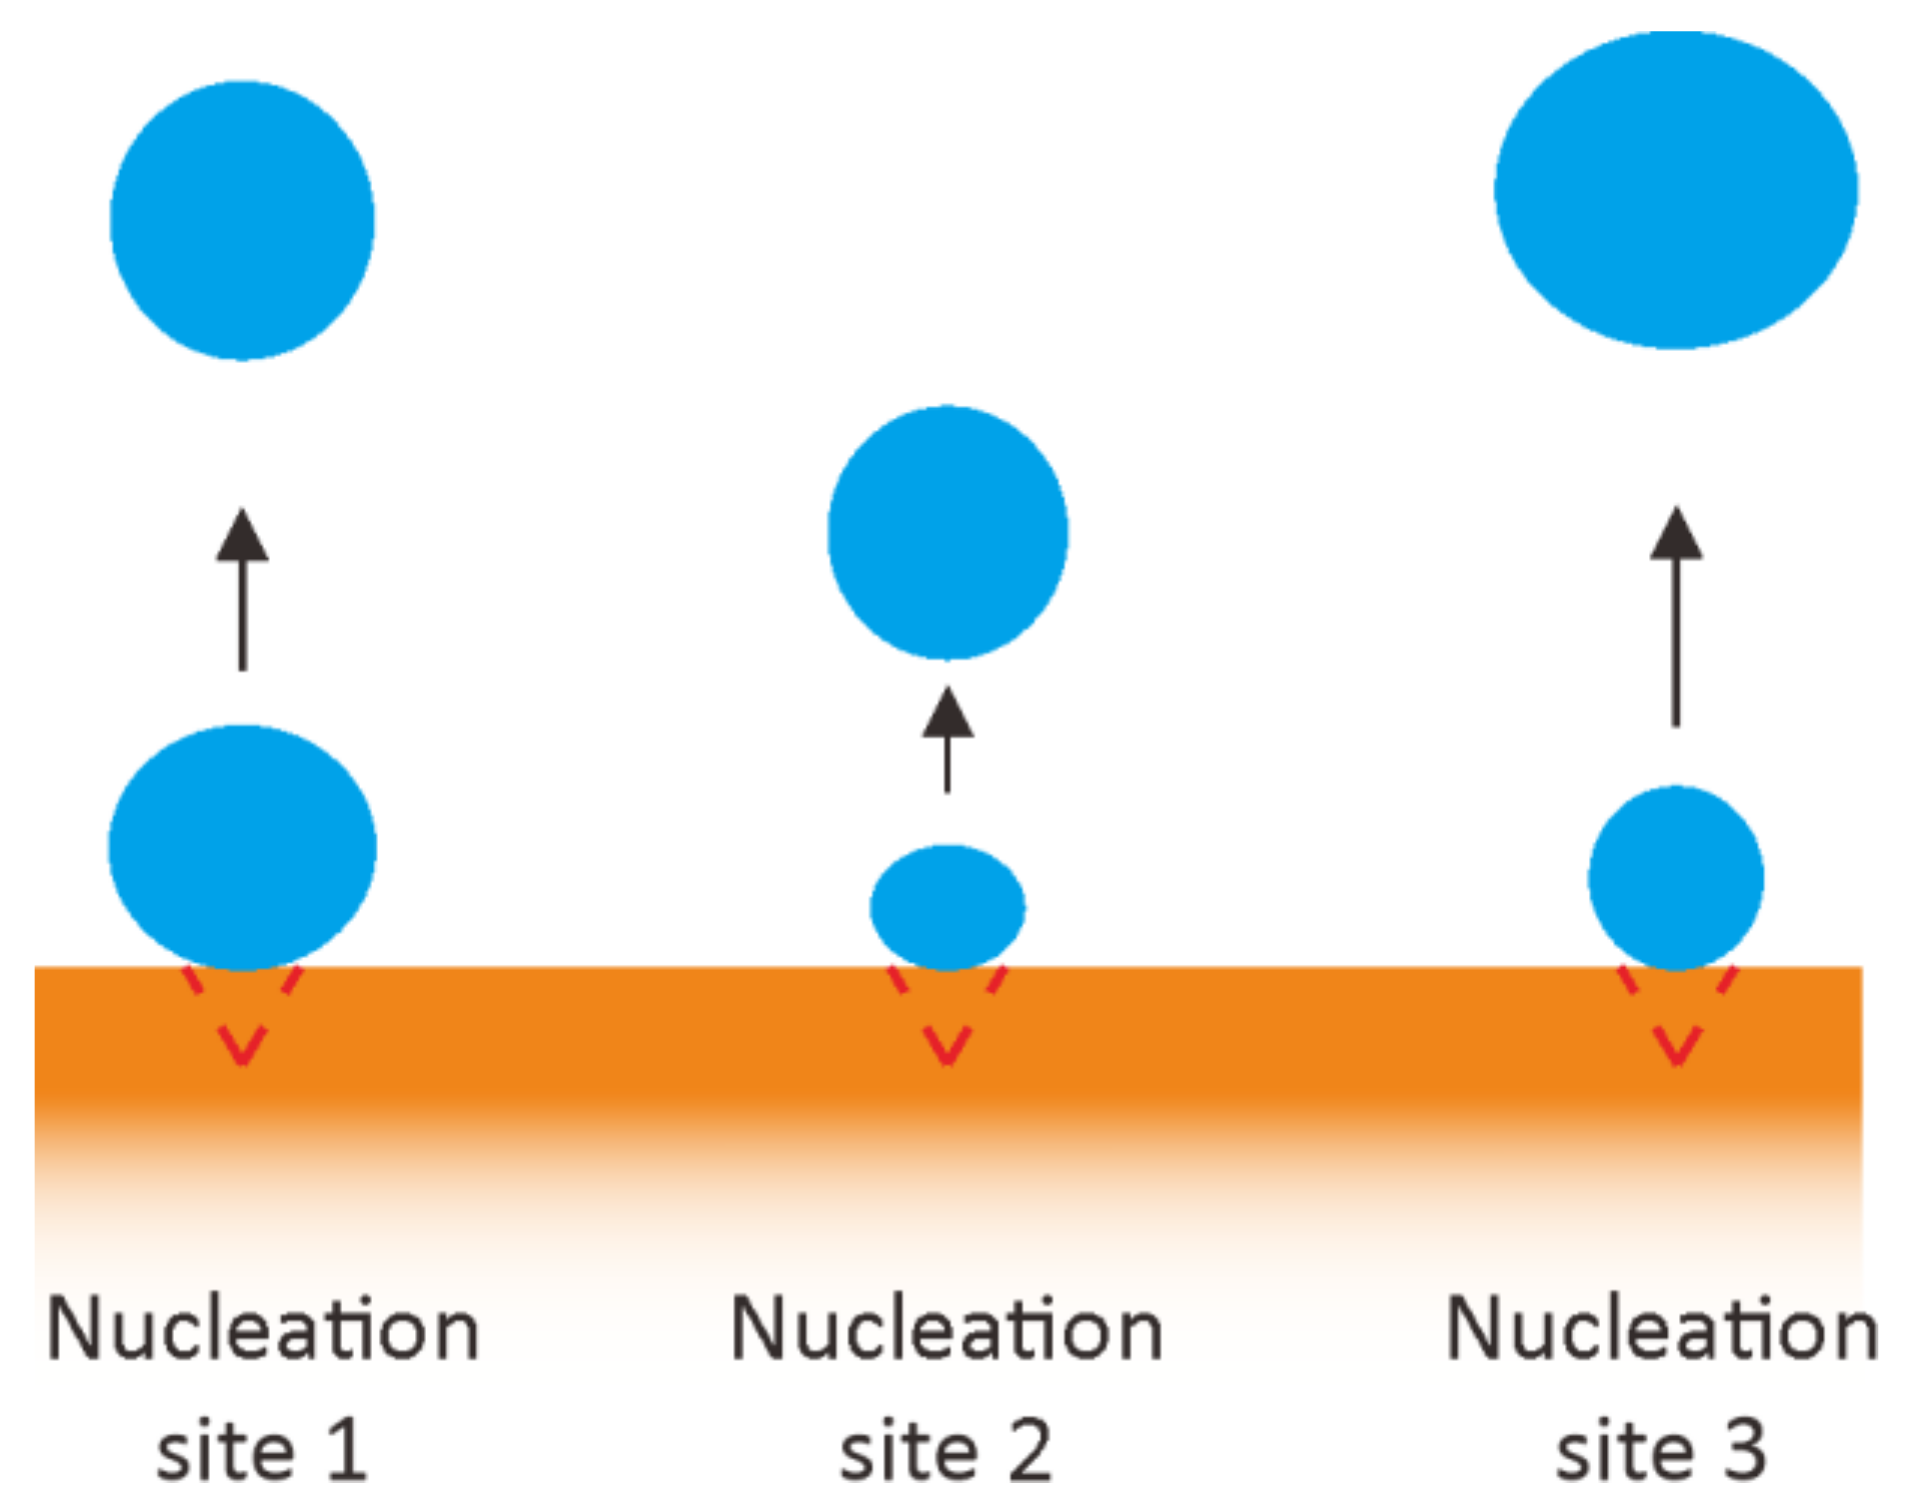
Figure 12.
Illustration of bubble growth and departure from the merged bubble regime.
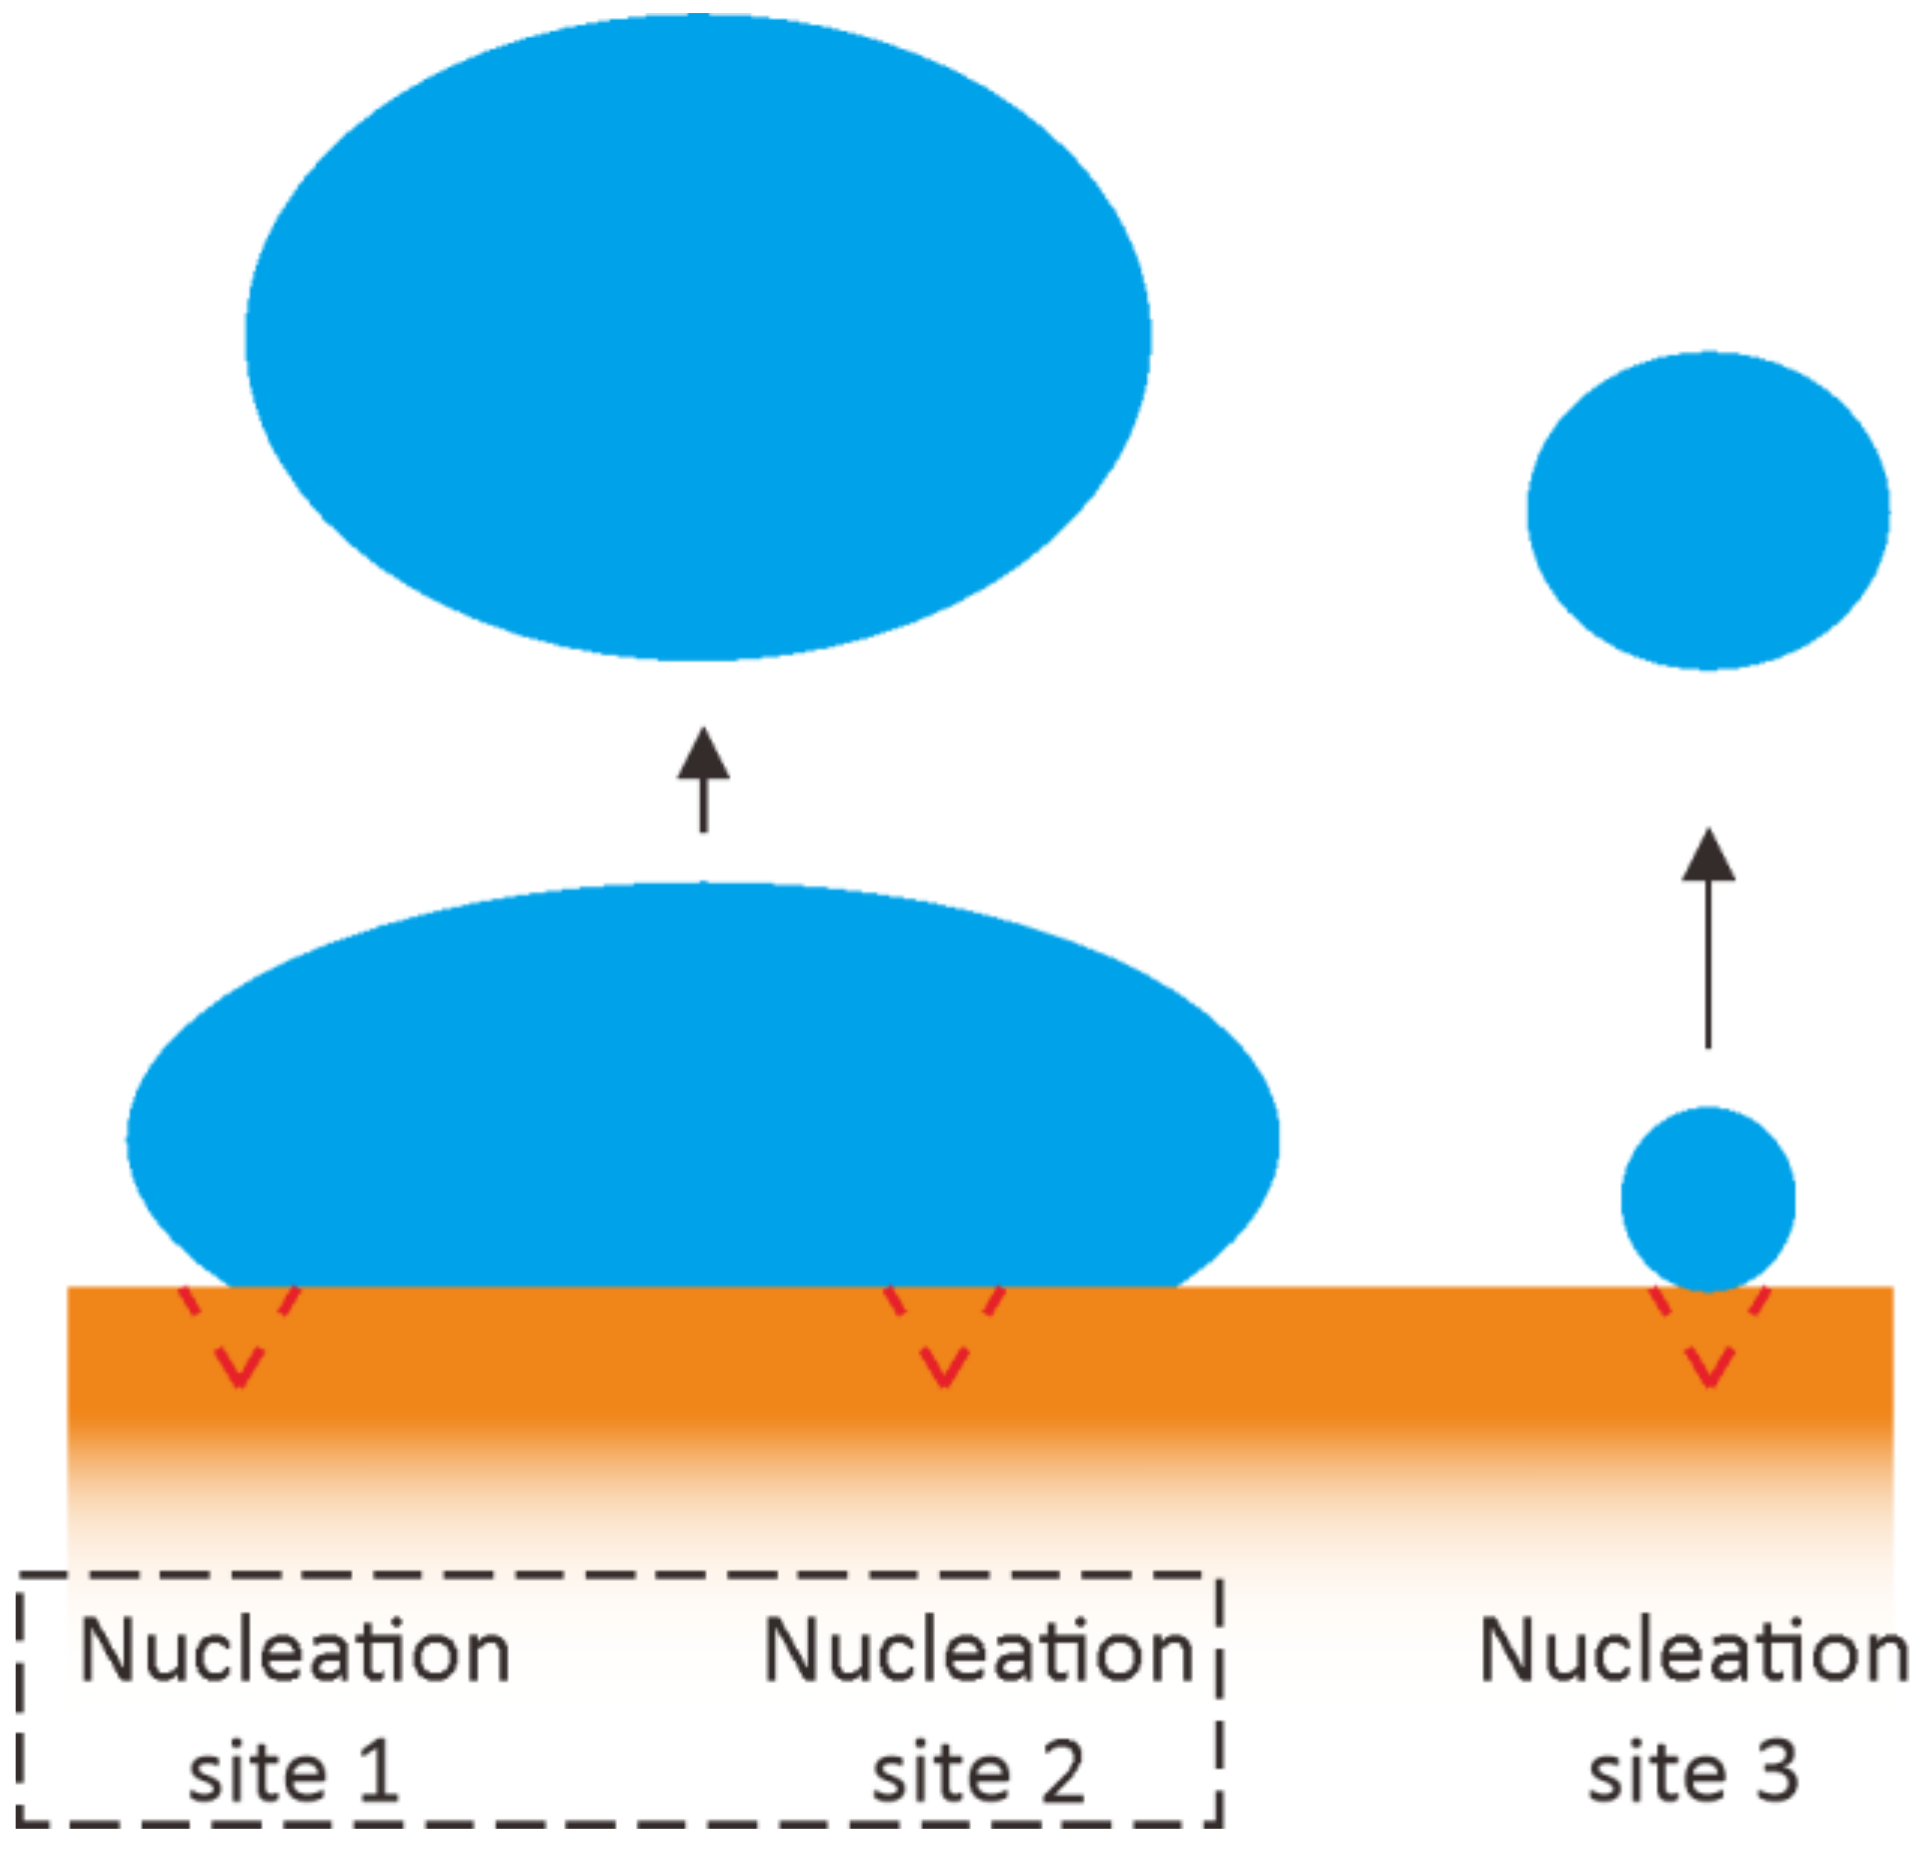
Figure 13.
The plot of Grashof number from different circular pin fin gaps.
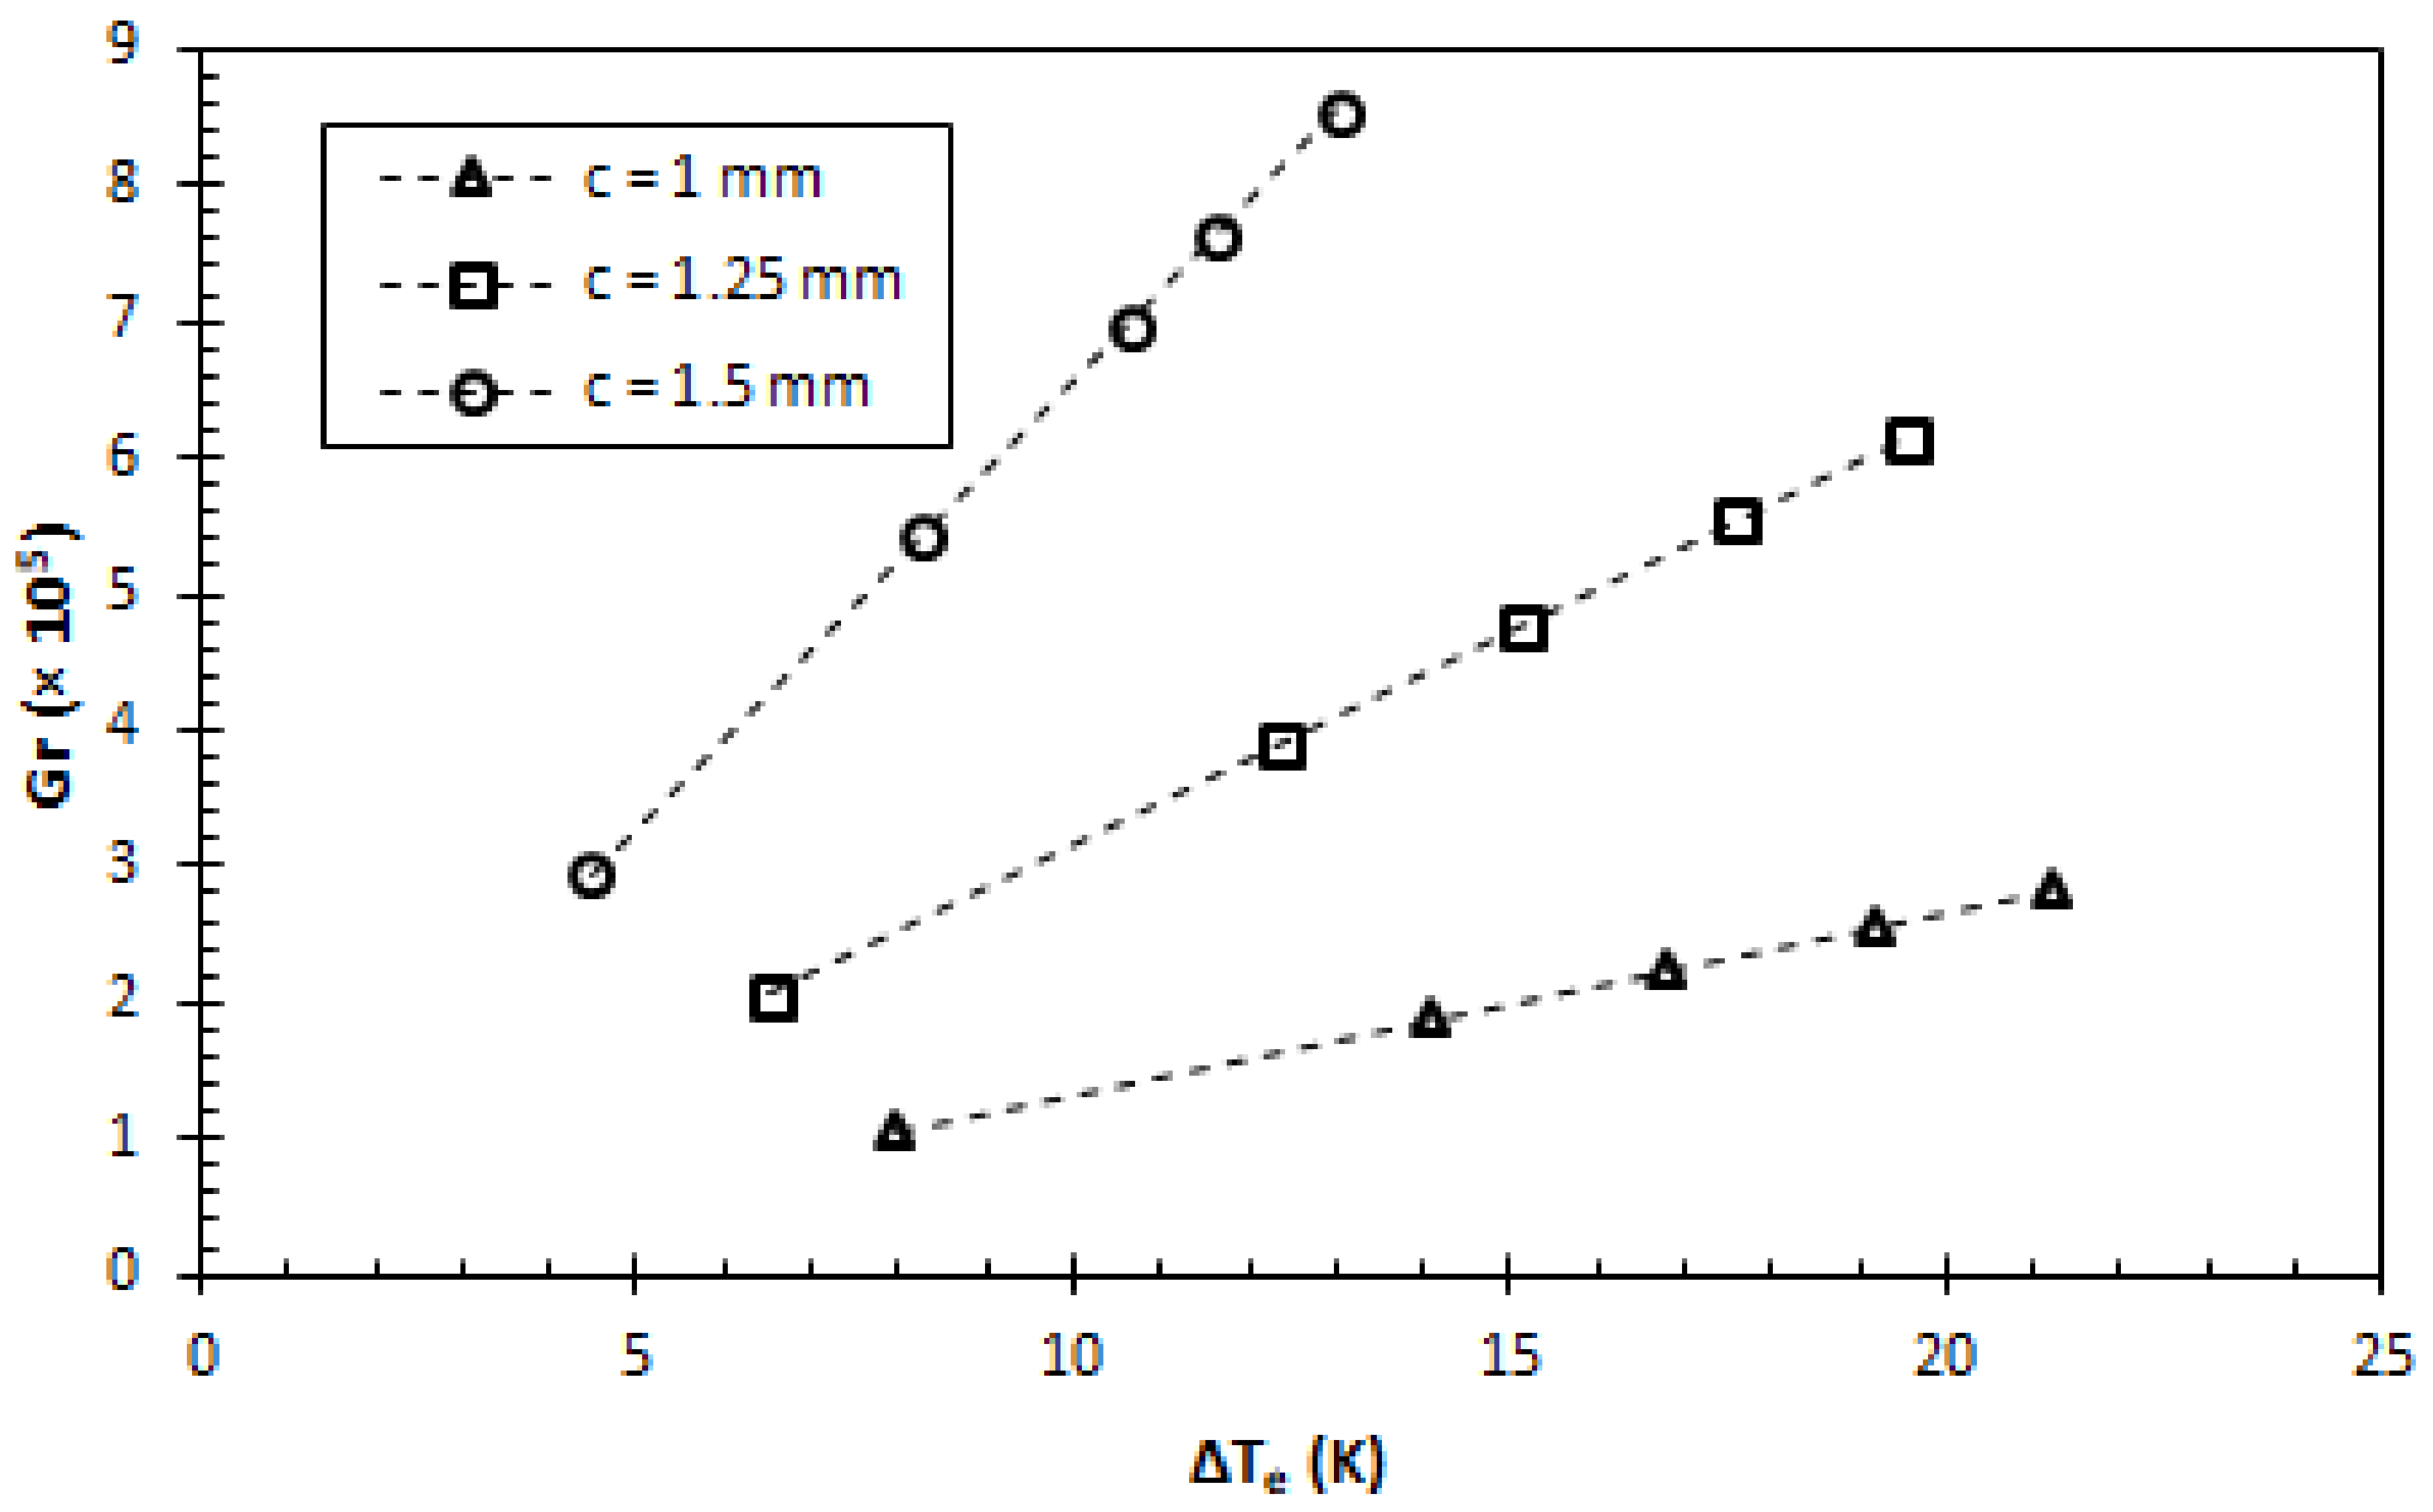
Figure 14.
The plot of Grashof number from different rectangular pin fin gaps.
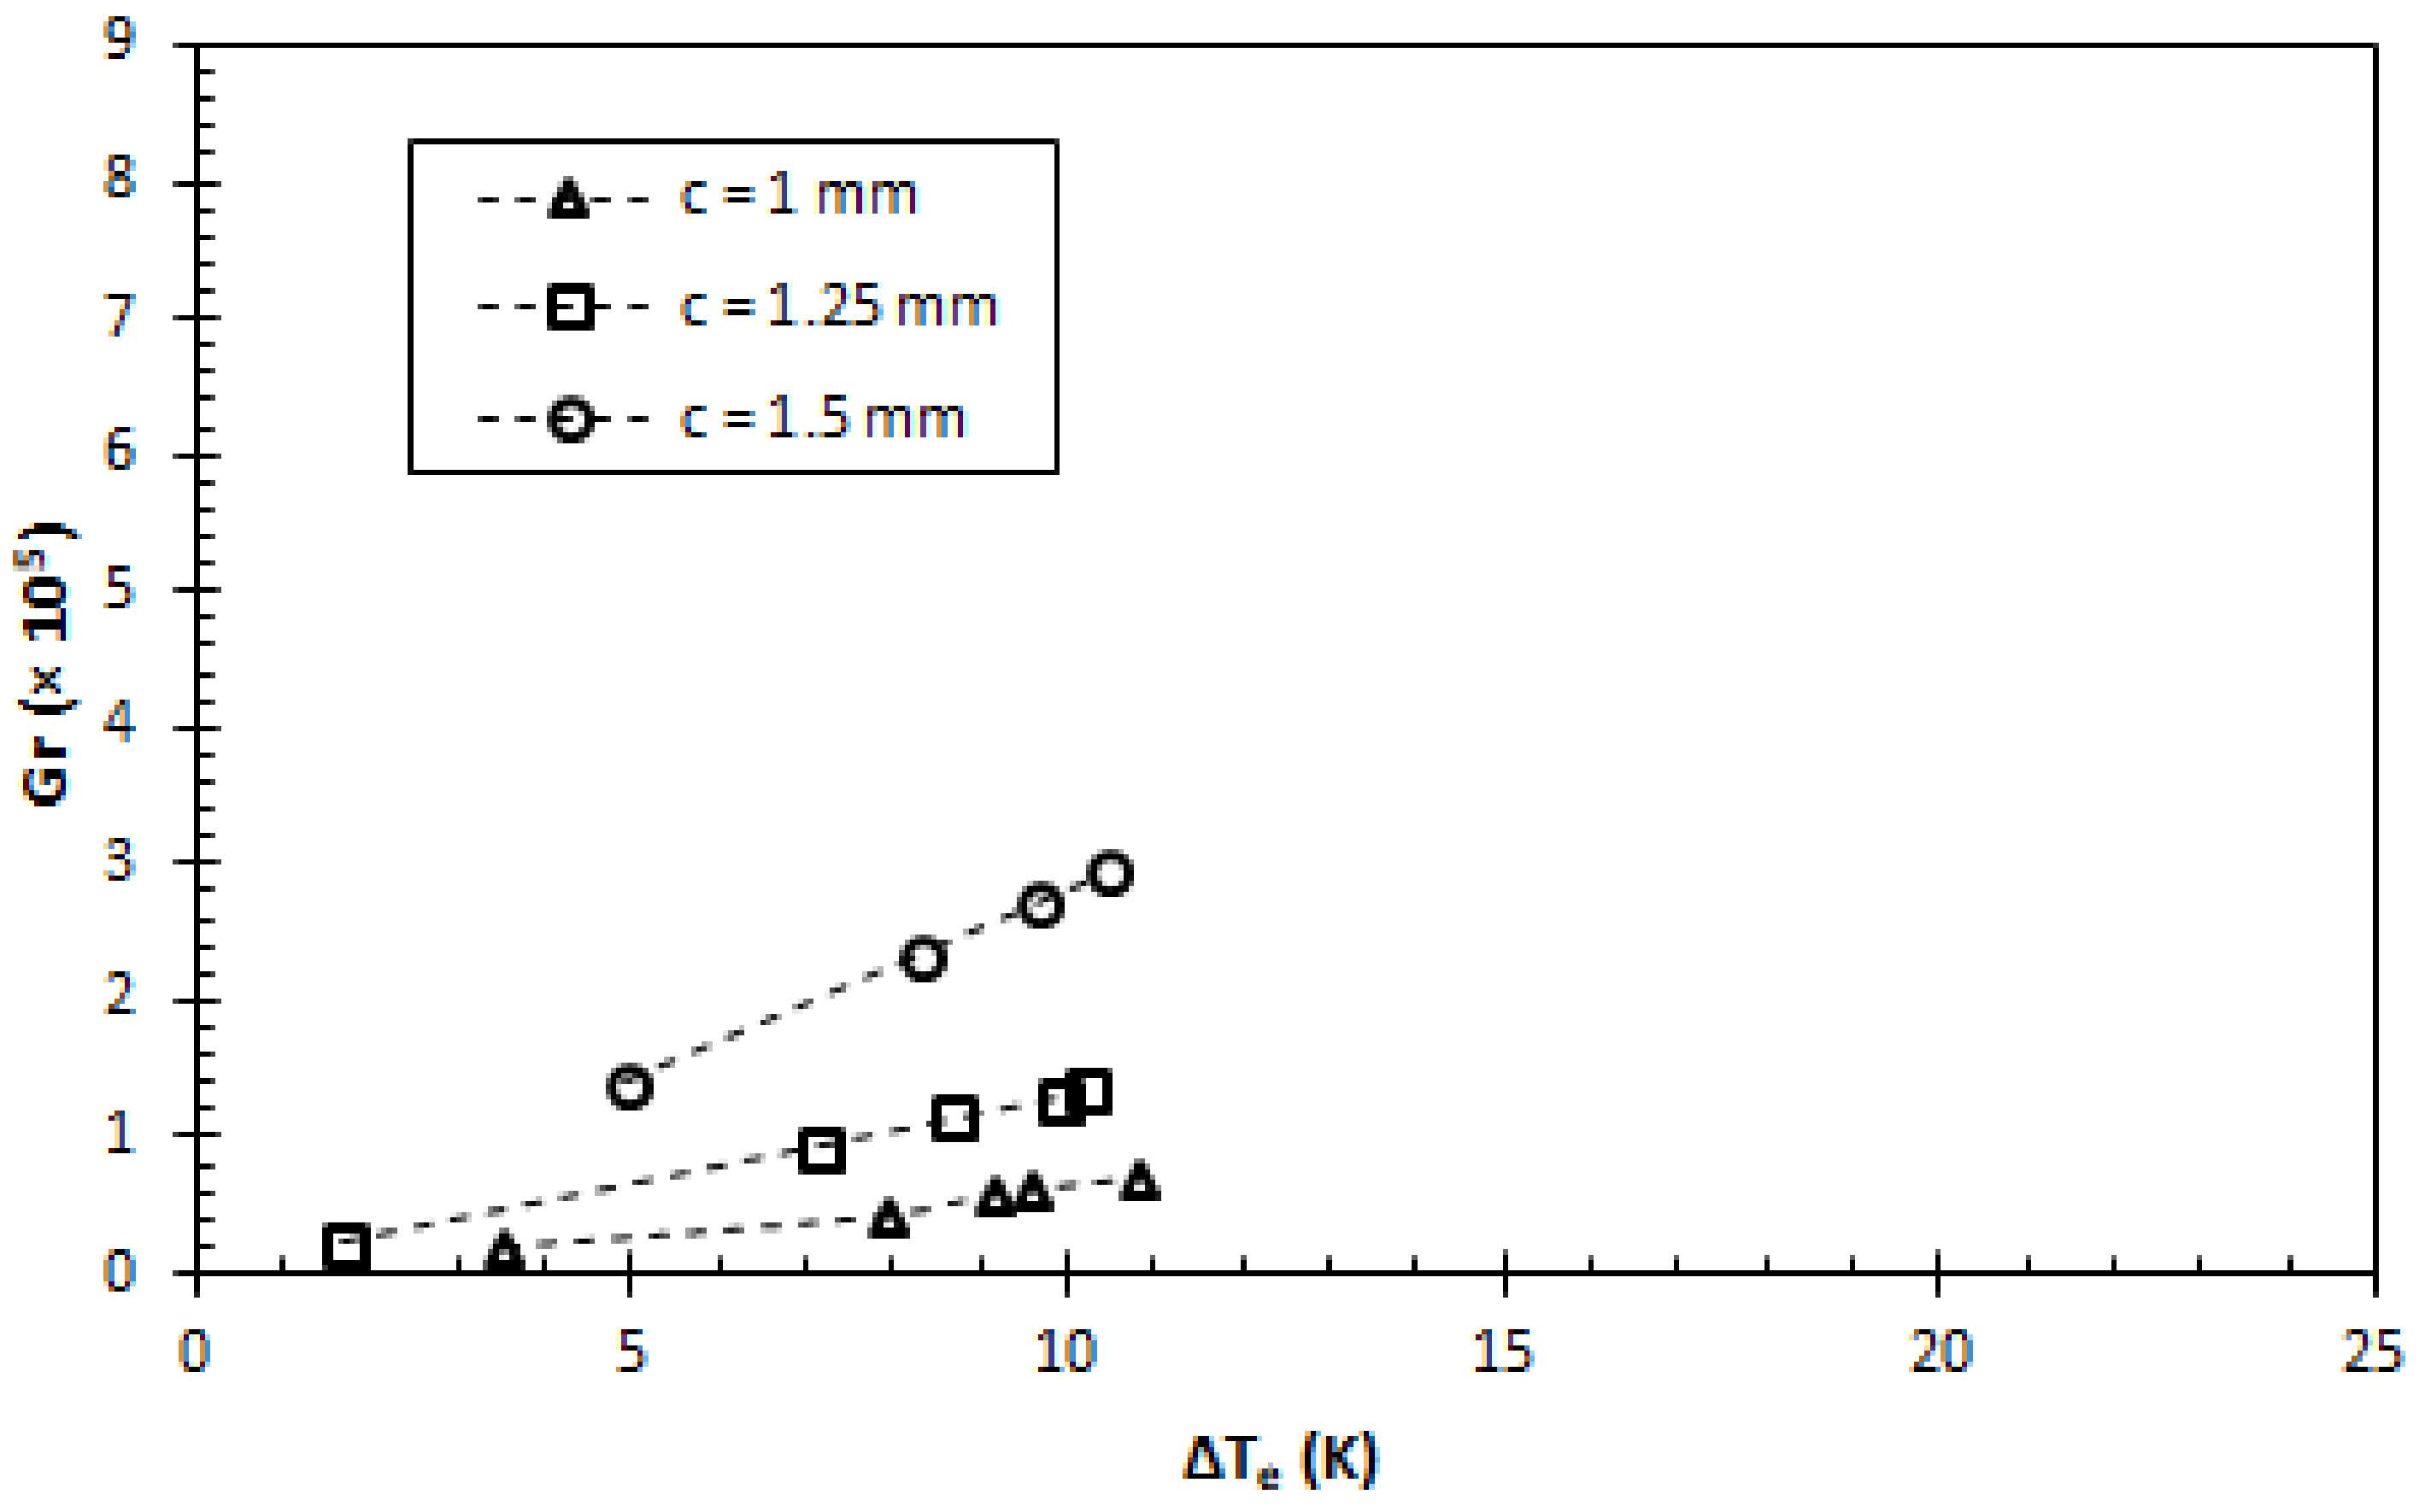
Figure 15.
The plot of Bond number from different circular pin fin gaps.
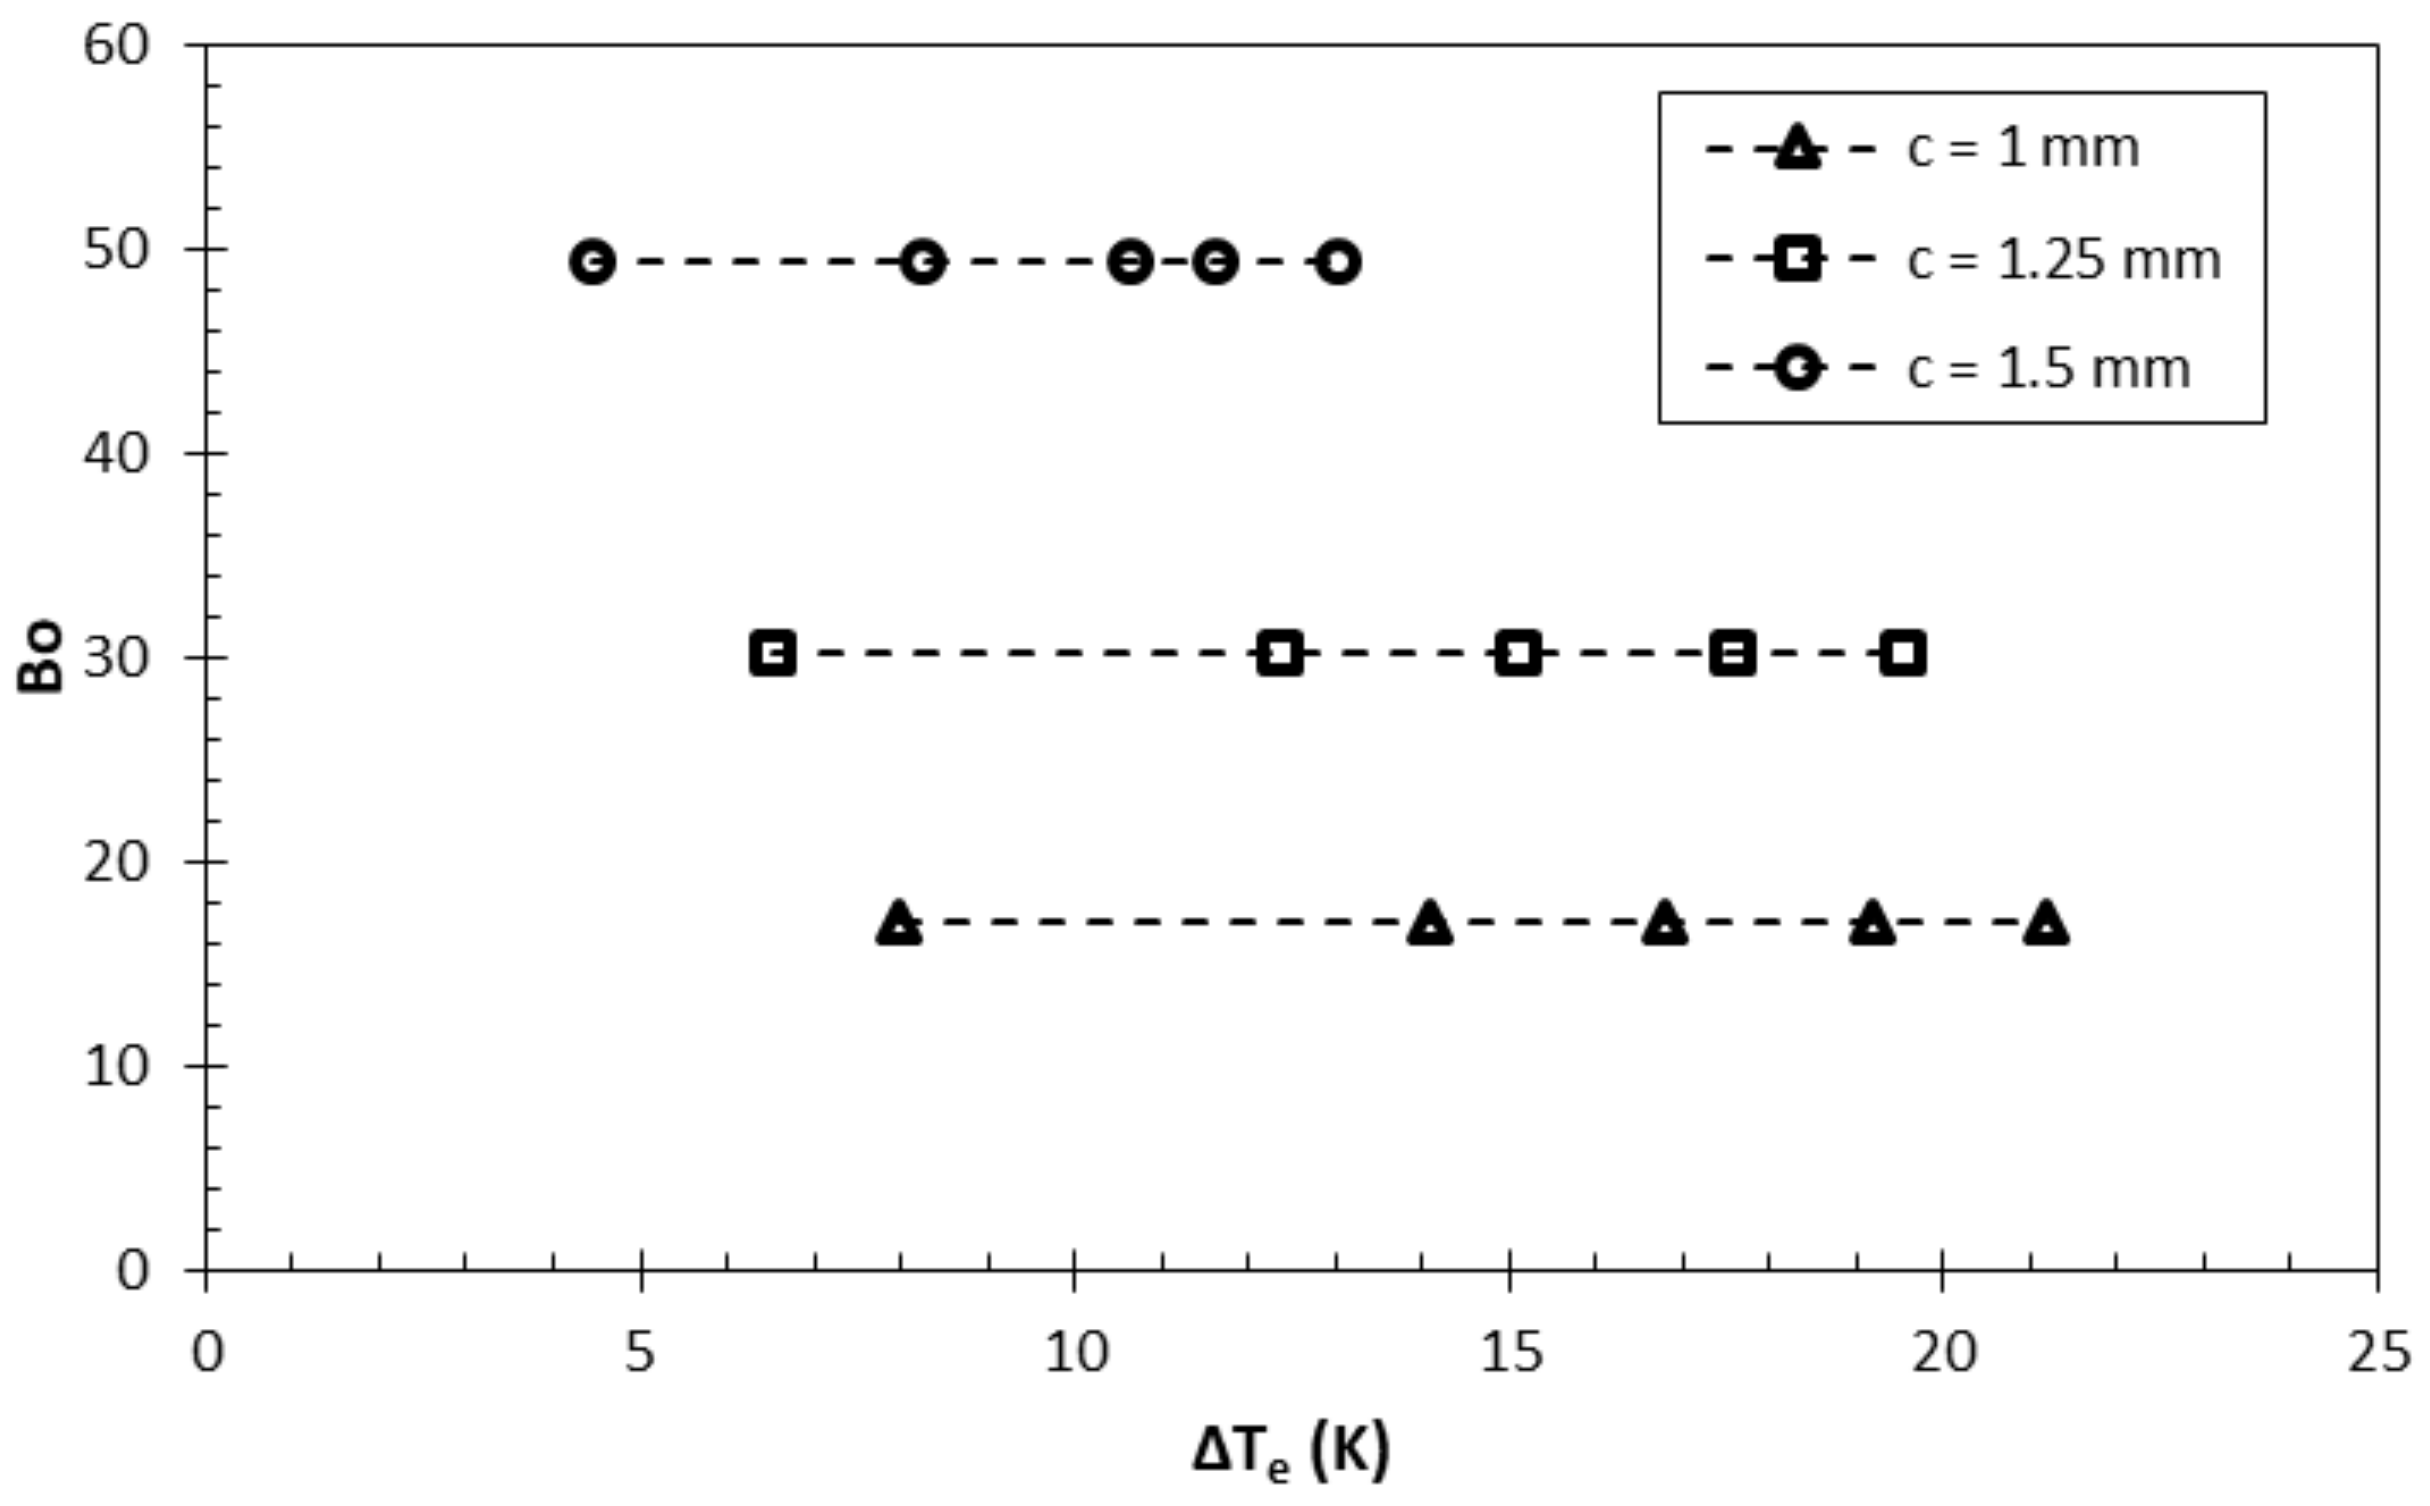
Figure 16.
The plot of Bond number from different rectangular pin fin gaps.


Table 1.
Configuration and dimensions of the test samples.
| Test Sample | Pin Fin Shape | Number of Fins | Fin Width (a), mm | Fin Height (b), mm | Fin Gap (c), mm | Dh, mm | Af, mm2 |
|---|---|---|---|---|---|---|---|
| C1 | Circular | 196 | 1 | 1 | 1 | 4.09 | 1516 |
| C2 | Circular | 169 | 1 | 1.16 | 1.25 | 5.45 | 1516 |
| C3 | Circular | 144 | 1 | 1.36 | 1.5 | 6.96 | 1516 |
| R1 | Rectangular | 196 | 1 | 1 | 1 | 3 | 1684 |
| R2 | Rectangular | 169 | 1 | 1.16 | 1.25 | 4.06 | 1684 |
| R3 | Rectangular | 144 | 1 | 1.36 | 1.5 | 5.25 | 1684 |
| Properties | Values |
|---|---|
| Boiling point (K) | 334.15 |
| Vapor pressure (kPa) | 27 |
| Specific heat (J/kg∙K) | 1170 |
| Latent heat vaporization (kJ/kg) | 112 |
| Thermal conductivity (W/m∙K) | 0.068 |
| Liquid density (kg/m3) | 1418.64 |
| Vapour density (kg/m3) | 0.98 |
| Kinematic viscosity (m2/s) | 3.008 × 10⁻⁷ |
| Surface tension (mN/m) | 13.6 |
| Thermal expansion coefficient (1/K) | 1.8 × 10⁻³ |
| Dielectric strength 0.1″ gap (kV) | 40 |
Table 3.
Summary of boiling heat transfer performance in various test samples from the experiment.
| Pin Fin Shape | Fin Gap (c), mm | Maximum Gr, ×105 | Maximum Bo | Average kW/m2·K | Average | hb Enhancement |
|---|---|---|---|---|---|---|
| Circular | 1 | 2.83 | 17.08 | 13.76 | 1408.55 | - |
| Circular | 1.25 | 6.16 | 30.24 | 15.18 | 1954.74 | 10.3% |
| Circular | 1.5 | 8.56 | 49.39 | 22.50 | 2819.55 | 63.4% |
| Rectangular | 1 | 0.70 | 9.18 | 23.40 | 607.26 | - |
| Rectangular | 1.25 | 1.34 | 16.84 | 24.41 | 906.71 | 4.3% |
| Rectangular | 1.5 | 2.95 | 28.12 | 27.56 | 1736.86 | 17.8% |
Publisher’s Note: MDPI stays neutral with regard to jurisdictional claims in published maps and institutional affiliations. |
© 2022 by the authors. Licensee MDPI, Basel, Switzerland. This article is an open access article distributed under the terms and conditions of the Creative Commons Attribution (CC BY) license (https://creativecommons.org/licenses/by/4.0/).
Share and Cite
MDPI and ACS Style
Pranoto, I.; Rahman, M.A.; Waluyo, J. The Role of Pin Fin Array Configurations and Bubble Characteristics on the Pool Boiling Heat Transfer Enhancement. Fluids 2022, 7, 232. https://doi.org/10.3390/fluids7070232
AMA Style
Pranoto I, Rahman MA, Waluyo J. The Role of Pin Fin Array Configurations and Bubble Characteristics on the Pool Boiling Heat Transfer Enhancement. Fluids. 2022; 7(7):232. https://doi.org/10.3390/fluids7070232
Chicago/Turabian StylePranoto, Indro, Muhammad Aulia Rahman, and Joko Waluyo. 2022. "The Role of Pin Fin Array Configurations and Bubble Characteristics on the Pool Boiling Heat Transfer Enhancement" Fluids 7, no. 7: 232. https://doi.org/10.3390/fluids7070232