
RANS Modelling of a NACA4412 Wake Using Wind Tunnel Measurements
by
 , , , and
Narges Tabatabaei
1, 
Majid Hajipour
2 ,
,
Fermin Mallor
1,
Ramis Örlü
1,*,
Ricardo Vinuesa
1 and
Philipp Schlatter
1 1
SimEx/FLOW, Department of Engineering Mechanics, KTH Royal Institute of Technology, 10044 Stockholm, Sweden
2
Department of Aerospace Engineering, Sharif University of Technology, Tehran 1458889694, Iran
*
Author to whom correspondence should be addressed.
Fluids 2022, 7(5), 153; https://doi.org/10.3390/fluids7050153
Submission received: 16 March 2022
/
Revised: 12 April 2022
/
Accepted: 23 April 2022
/
Published: 26 April 2022
(This article belongs to the Special Issue Turbulent Flow)
Abstract
:Wake analysis plays a significant role in wind-farm planning through the evaluation of losses and energy yield. Wind-tunnel tests for wake studies have high costs and are time-consuming. Therefore, computational fluid dynamics (CFD) emerges as an efficient alternative. An especially attractive approach is based on the solution of the Reynolds-averaged Navier–Stokes (RANS) equations with two-equation turbulence closure models. The validity of this approach and its inherent limitations, however, remain to be fully understood. To this end, detailed wind-tunnel experiments in the wake of a NACA4412 wing section profile are compared with CFD results. Two- and three-dimensional RANS simulations are carried out for a range of angles of attack up to stall conditions at a chord- and inflow-based Reynolds number of . Here, we aim to investigate the wake characteristics and self-similar behaviour, both from the experimental and numerical perspectives. The measurements are carried out by means of hot-wire anemometry capturing the wake pattern in several planes. The sensitivity of the CFD model to different configurations of the setup and the considerations required for reliable simulation are discussed. The agreement between CFD, experiments, and the literature is fairly good in many aspects, including the self-similar behaviour and wake parameters, as well as the flow field. Comparison of experiments with URANS/RANS data indicates that the latter is an adequate methodology to characterize wings and their wakes once the CFD setup is designed appropriately and the limitations due to discretization and turbulence modelling are considered.
1. Introduction
Turbulent wakes of slender and bluff bodies are complex flow fields that involve the interactions of three shear flows in the same problem, namely a boundary layer, a separating free shear layer, and a wake [1]. These interactions form a nonlinear dynamic system that governs the flow patterns and turbulent structures through the wake. Due to the interactions between the eddies from the free shear layers to the wake core, the kinetic energy cascades down from large to small eddies, providing an effective mixing mechanism, as well as the dissipation of the kinetic energy [2]. Turbulent mixing can be viewed as a three-stage process of entrainment, dispersion (or stirring), and diffusion, spanning the full spectrum of space–time scales of the flow [3]. As the flow proceeds downstream, there is a spreading of the wake, and the wake recovers towards the free stream conditions [2]. The most efficient mechanism for wake recovery is the vertical transfer of momentum from the surrounding free-stream, implying free-stream turbulence to be the decisive parameter governing wake recovery [4].
In order to explore the wake flow over an airfoil in a controllable condition, a wind-tunnel model is studied. Considering the costs of the experiments (including setup, facility, models, operation, etc.), simulations via computational fluid dynamics (CFD) tools can serve as an efficient and fast alternative, in particular during the preparation and design phase of a physical experiment. A typical challenge of traditional wind-tunnel tests is that they are performed very late in the design process and imply that any design changes require a lot of rework. New research has demonstrated how simulations could produce more detailed data quicker than physical wind tunnel experiments and with sufficient accuracy [5]. Furthermore, there are only a limited number of wind tunnels available for testing, which hinders flexibility and induces slower responses during the typical design process [6]. Accordingly, the idea of virtual wind-tunnels through which one can investigate the wake flow has been emerged.
CFD, and specifically Reynolds-averaged Navier-Stokes (RANS), models have indicated promising aerodynamic results during the last decades [7,8,9]. References [10,11] state that it will be difficult for RANS models to accurately replicate the flow physics around and downstream a wing even in an averaged sense. The spread and decay of a wake depends on both the wake meandering (advection of the wake as a whole) and wake diffusion (widening of the wake within its meandering frame of reference) [12]. The wake-developing region is frequently ignored when assessing the performance of RANS models, as the spreading rate in the self-similar region is usually emphasized. The types of homogeneous and isotropic benchmark cases used to calibrate the coefficients in RANS-based turbulence models are rather idealized and might, at best, resemble those observed in the self-similar region that exists far downstream an object [10,11]. The development region can be influenced by different parameters. It is unclear whether RANS methods can be made sensitive to all of the factors influencing the development region [13].
Considering the open questions regarding RANS potentials, and in order to evaluate RANS in the context of a virtual wind-tunnel, the current research project aims to characterise the turbulent flow around an airfoil using different methods, ranging from experiments and turbulence models to fully resolved direct numerical simulations [14]. As the experimental data help to validate the CFD simulations, the CFD results can also aid the experiments in different ways (e.g., the design of the experimental setup, error-source identification, and guiding the data acquisition parameters) and help to optimize the testing costs, time, and efforts. In this paper, we aim to investigate the wake characterisation downstream of the wing with two approaches: CFD and experiments (henceforth: EXP) on the same flow case of a wing inside a wind tunnel. All the chosen approaches have certain limitations, both related to the represented physics and turbulence modelling, the achievable resolution in the data, and, potentially, the quality of the setup and boundary conditions, and hence, they are here used complimentary. The employed numerical approach and, e.g., the tripping approach to achieve well-behaved turbulent boundary layers have already been validated in previous publications [8,9]. We would like to stress that, in particular the RANS approach introduces a range of errors, mostly based on the low-order discretization and the eddy-viscosity-based turbulence model. However, given the relevance of RANS as an engineering tool, our paper gives useful insights into the limitations of RANS in these types of flows, which can help to design and better understand future wind-tunnel experiments.
The main target of this study is firstly to evaluate the fidelity of CFD–RANS to model the wake characterisation of a NACA4412 wing at different angles-of-attack (AOAs), and secondly, to assess whether one can apply the numerical tool for a more detailed investigation of specific quantities. In the first part, i.e., Section 3, the results of the two approaches are compared. As a multiple-aspect validation, this investigation includes different flow properties and different locations within the wind tunnel, which are listed inin Section 4.1. Once close agreement is achieved and both setups show similar results through an overall wake analysis in Section 4.2 and Section 4.3, the main analysis is conducted in Section 5. Accordingly, the main research purposes are:
2. Numerical and Experimental Setups
A reinforced fiberglass model of a NACA 4412 wing profile is designed and set-up in the minimum-turbulence-level (MTL) wind-tunnel facility at KTH Royal Institute of Technology, see Figure 1. Additional information about the MTL wind tunnel can be found in [15], while the main characteristics are summarized as follows. The test section is 7 m long and has a cross-sectional area of m. The closed-loop configuration of the MTL provides stable velocity and temperature conditions, which are crucial for boundary layer (BL) measurements. This tunnel is capable of reaching a maximum speed of 70 m/s with a streamwise velocity (high-pass filtered) disturbance level of approximately 0.025% of the free-stream velocity at a test speed of 25 m/s and a non-filtered disturbance level still below 0.1% [15]. The wing model has a chord length (C) of 0.5 m and is vertically mounted in the middle of the test section. The blockage ratio is approximately at angle of attack. The airfoil horizontal plane at mid-span is the main measurement plane and is also denoted as mid-height, see also [8,9]. It should be noted that X denotes the streamwise direction, Y is defined as the transverse direction, and Z shows the spanwise axis. Post-processing of both experimental and numerical data is performed in MATLAB, and visualisations are created in Paraview [16], using the same interpolation method for both data sets. The setup for the simulations and the experiments is outlined in the following.
2.1. Simulation
The RANS simulations were carried out with finite volume discretization via the open-source OpenFOAM code with the semi-implicit method for pressure linked equations (SIMPLE) and merged PISO-SIMPLE (PIMPLE) algorithms, where PISO stands for pressure-implicit with splitting of operators [17]. Second-order Gaussian integration was selected for the gradient terms. Turbulence and wall-treatment were modelled based on the k- shear-stress transport (SST) model [18]. The SST model was considered appropriate because it does the best overall job in predicting the complex flows involving separation while giving results comparable with the best of the other models for simple flow [19], and so it was applied for the current study. The first grid point in the wall-normal direction is always located at a distance from the wall below one viscous unit (i.e., in terms of the viscous length scale , where and are the fluid kinematic viscosity and friction velocity, respectively). Appropriate wall functions were set over the walls for different properties. Zero-gradient boundary conditions were applied for the outflow, while the inflow conditions were defined with the fixed values according to the realistic turbulence intensity (Tu) for a high-quality wind tunnel (Tu = 0.1%).
In order to make a numerical model, the wind-tunnel test section was meshed using a multi-block, structured hexahedral mesh, and the geometry was created using ANSYS ICEM CFD [20]. The 2D domain with one layer of cells was built to represent the middle cross-section of the wind tunnel, i.e., the section at the wing mid-height, where the full-scale 3D computational domain was generated according to the wind-tunnel dimensions. The validity of the simulation setup was investigated in terms of computational mesh efficiency, and agreed with the results in Ref. [9].
2.2. Experiment
The experiments included surface pressure scans, wake characterisations, and boundary layer measurements by means of hot-wire anemometry at selected AOAs (from 0 up to stall condition). The measurements comprised the region upstream of the trailing-edge (TE) up to 3 chords downstream and included different spanwise sections. Additionally, tuft visualization was used to study the spanwise variation of the flow in order to assess the two-dimensionality across the wing span.
2.2.1. Pressure Scans
A Scanivalve MPS4264 digital pressure scanner was used to acquire the initial pressure readings. The scanner is able to simultaneously sample 64 pressure ports with a stated accuracy of 0.20% of its full scale range of ±1 kPa (corresponding to a measurement error of ±2 Pa). In order to measure ambient conditions, a Furness FCO510 was connected to an absolute pressure transducer (measuring the room pressure) and a thermocouple installed at the downstream end of the test section. The accuracy is within 0.25% of its full scale range of 0–200/2000 Pa; the lower range was used for the present experiments. The pressure scan results are reported in terms of the pressure coefficient , where the reference pressure is taken as the ambient pressure, and the denominator is the dynamic pressure of the free-stream. Although a pitot-static (Prandtl) tube was used to measure the flow velocity one meter downstream of the inlet (≈5C upstream of LE), the reported velocity was not representative of the local free-stream velocity in the vicinity of the airfoil, due to the growth of wall boundary layers and the presence of the airfoil. This measured velocity will henceforth be denoted as the reference velocity ). For this reason, as it is common in comparisons between experiments and simulations, the maximum pressure recorded on the airfoil was used to normalize the pressure data.
2.2.2. Tuft Visualization
Flow-visualization methods based on recording tuft deflections have been used in recent studies, such as Steinfurth et al. [21]. In the present research, arrays of tufts were placed at four different streamwise locations: , 0.7, 0.8, and 0.9, distributed throughout the whole span of the airfoil. The motion of the tufts was captured at 30 fps (frames per second) with a Canon DSLR camera, which was then used to visualise the separated region in order to assess its two-dimensionality. Post-processing of the recorded videos was carried out with a MATLAB image-processing script in which the swept area of each tuft was considered as the quantity to evaluate the tuft motion. In this work, the swept area is defined as the accumulated region covered by a tuft, from root to tip, during recording. Due to the low inertia of the tufts, they can capture large-scale, i.e., low-frequency, oscillations in the boundary-layer flow, which in this case are caused by the presence of separated flow near the trailing edge of the wing (for higher AOAs). In order to determine the swept area of the tufts, a sequence of 60 frames (corresponding to a 2 s video clip) was used, from which the absolute difference of consecutive snapshots was computed, and the position of the tufts was extracted. The positions were added together, essentially building a long-exposure image containing traces of the tufts. From this long-exposure image, the swept area of each tuft was determined, which is directly related to the tuft oscillation intensity. Contours of the tuft oscillation intensity, obtained based on the explained approach, are shown in Section 4.4.
2.2.3. Hot-Wire Measurements
The detailed measurements inside the boundary layer were performed using a boundary-layer type, single-wire hot-wire anemometry probe attached to the main traverse system of the MTL wind tunnel. The hot-wire itself is a platinum wire 0.7 mm long and with a nominal diameter of 2.5 μm. Calibration of the hot-wire was performed in situ in the potential flow, upstream the model surface, against a Prandtl tube (inserted into the test section for calibration purposes only), connected to a second FC0510 micromanometer with same range and accuracy as the first one, which yields a total uncertainty for the mean velocity measured with a hot-wire of 1.0% [22]. The hot-wire anemometer system used is a Dantec StreamLine 90N10 frame in conjunction with a 90C10 constant temperature anemometer module operated at a resistance overheat of 80%. Offset and gain were applied to the top of the bridge voltage in order to match the voltage range of the 16-bit A/D converter used. In order to avoid aliasing at higher velocities, an inbuilt analog low-pass filter was set up with 30 kHz cut-off frequency prior to the data acquisition, which was performed at 60 kHz. To account for the effects of slight variations in the incoming flow conditions over long measurement times due to the large measurement domain (see Figure 2), the velocity magnitude was normalized by the reference velocity ().
3. Setup Sensitivity
In order to tune the simulation setup, the comparative results were considered in different planes in the modelled 3D domain: (1) Surface chord-wise distribution and (2) the spanwise wake contour plot. The proper simulation setup was achieved based on this sensitivity analysis in order to match the exact experimental configuration. The chordwise pressure coefficient, , distribution at the mid-span section was plotted for different cases, comparing the CFD results with the reference, experimental, and large-eddy simulation (LES) data. Two AOAs are included in Figure 3a,b, and the plots for the near-stall AOA are available in Figure 4. The close agreement between CFD and EXP indicates the accuracy and the validity of the CFD simulations in predicting the wind-tunnel data.
The MTL wind tunnel is equipped with a streamwise slot through which the main traversing system is guided, see Figure 5. The modelled ceiling slot is visible in Figure 1 and is denoted slot in this paper. We investigated the effect of the narrow ceiling slot to determine whether it affects flow and if the effect is transmitted to the mid-height section. Therefore, different modelling setups were assessed for the ceiling wall at AOA . Different configurations/setups were investigated and are listed in Table 1.
The simulation results show that, except for configuration S4, the mid-height section is almost the same with all the configurations, as shown in Figure 4. The chordwise distribution is also in agreement with the experimental data for these cases. Flow-field analysis for S4 indicates that a large separation at the ceiling-wing intersection led to a different result at the mid-height section. In order to analyse the effect of the ceiling slot throughout the span, we use spanwise planes (YZ) that are normal to the streamwise flow at some selected X. The HW measurements are also carried out in 13 spanwise rows within a part of these planes and at two spanwise locations: and 1, see Figure 1. To assess the onset of the 2D region, different cases are compared in Figure 6 for two streamwise locations. HW data is plotted on the first row on the left, along with a line showing the onset of the 2D region. At both locations (), S2 and S5 predict the 2D zone similar to the experiments. Therefore, S1, S2, S3, and S5 are recognized to be valid for mid-span investigations, while only S2 and S5 deliver reliable data in the whole 3D domain. More validations are implemented in the next section.
4. Wake Analysis
This section includes the investigations of the velocity and turbulence flow-fields of both CFD and EXP. The investigated parameters include the mean flow velocity upstream and downstream of the TE as well as the root-mean-square of the streamwise velocity fluctuations inside the boundary layer and the wake region. Additionally to the time-averaged wake parameters, the wake unsteadiness will be discussed based on URANS results. More-detailed wake analysis is provided in Section 5, where we study the specific wake parameters.
4.1. Multiple Aspects Analysis
The numerical setup was developed to support the experimental measurements in order to investigate the flow field around the NACA4412 model. The measurements were implemented with different tools on the critical region/parameters, and the same flow properties were extracted from the simulated flow-field. The experimental and computational approaches work in parallel so as to develop a comprehensive investigation using virtual and physical test sections. For this purpose, we attempt to include all the details similarly. As an example, the effect of the narrow slot was investigated in Section 3, and the BL was also tripped at in the CFD to match the experimental conditions [8], and the validation results are shown in Figure 4. The simulation setup used in this research has already been investigated with respect to the chordwise distribution in previous studies [8,9] and also was discussed briefly in Section 3. Simulation reliability was assessed according to five criteria listed in Table 2, where the investigation outline is summarized. This included the mid-span (1, 2, and 3) and the spanwise directions (3 and 4). In this way we extended the adaptation to further regions in addition to the mid-height section, and multiple parameters were investigated.
4.2. Results at the Mid-Span Section
This section contains the analysis at the mid-height section of the wing, which is typically the main target of wind-tunnel experiments. With a similar distribution of the EXP and CFD data (Section 3), we investigated the wake flow according to rows 2–3 of Table 2. In the following, we focus on the region up to 3C downstream of the TE, which is the region assessed experimentally. For the wake analysis, we consider several downstream locations behind the TE in terms of velocity and pressure profiles extending from the high- to low-pressure side; cf. Figure 7. It is observed that just after the TE (e.g., X/C = 0.002), pressure is constant across the wake centre, i.e., . From the contour plot, it is observed that the separated flow from the suction side of the airfoil extends downstream of the TE and resembles a wedge-shaped area at the beginning of the wake core region. For AOA = 11, the zero-velocity wedge ends at . The incidence of top–bottom shear layers at leads to a local jump in pressure, i.e., at the wake centre. The CFD results show that at 1C downstream, the wake still slows down the pressure-drop process; i.e., (|dp/d) is smaller at the wake centre, while at the external flows at two sides (pressure and suction sides) are almost balanced in pressure, i.e., dp/dY = 0. Just after the TE (low values), the two extreme points at and are in different flow conditions, where at the top the flow is faster than at the bottom, but farther downstream ( for e.g.), the flow balances on two sides of the wake centre, and the two extremes reach the same velocity. This is how the effect of the airfoil, i.e., the transverse pressure drop, fades downstream towards the wind-tunnel outlet.
4.2.1. Mean Velocity Field
The mean flow velocity U is considered as the in-plane velocity magnitude: , since this is the measured velocity with a single-wire HW probe (so-called effective cooling velocity). In Figure 8, the measured velocity data are plotted along with the CFD-extracted contour lines for AOA of 5°, 8°, 11° and 14° from top to the bottom. The plots represent selected parts of the mid-height sections with velocity variations, as well as the separation region. The separation point on the airfoil suction side moves upwards over the suction side with increasing AOA, which results in a wider wake downstream of the TE. The wedge-shaped core of the wake, enlarges slowly when the AOA increases from 5° to 8°, while it grows substantially at the stall angle. The overall structure of the wake region is captured similarly for both the CFD and EXP approach, while the wake inclination is slightly different at higher AOAs. In addition to the wake, the circular flow patterns around the suction peak and the stagnation point are in agreement in CFD and EXP at both 5° and 11°. Differences can be observed outside the wake region, which can partially be related to the reduced resolution of the measurement matrix; cf. Figure 2. Additionally, a distinct effect was observed when comparing the simulation results in 2D and 3D simulations for every AOA. While the 3D simulations show a similar wake path as in the experiments, the wake inclination in the 2D simulations is less than it is expected to be. Furthermore, the TE wedge separation is overestimated in 2D simulations. The general aspects of the wake are predicted well in 2D simulations (not shown here); however, 3D simulations are required for a more accurate study.
Velocity distribution across the wake varies with the wake evolution downstream. In a simple classification, three zones are observed—Zone 1: = 0–0.1; Zone 2: = 0.2–0.5; and Zone 3: = 1–3. The maximum velocity deficit starts from in the vicinity of TE and decreases substantially within half a chord downstream of the TE, but it does not disappear even at . The downward movement of the wake slows down after one chord but is very fast at the second zone. The wake centre reaches the same position at in both CFD and EXP, while it is always located higher along the streamwise path. A smaller velocity deficit is captured by CFD in the first half-chord (), but at 3C downstream a smaller velocity deficit is observed in the measured data compared to CFD. This indicates that momentum diffusion is underestimated in RANS, which leads to slower propagation of the wake. These parameters will be further investigated in Section 5.1. Some selected streamwise lines are shown in Figure 9. The velocity deficit data at different streamwise locations () obtained from EXP and CFD agree well. The deviation between CFD and EXP increases with AOA. It should be noted that at the stall angle, the accuracy of the approaches decreased which leads to more deviations. At all AOAs, beyond half a chord downstream the remaining velocity deficit is larger in the measured data compared to the CFD; however, the wake path and width are similar.
As described in Section 2, the investigated test case is placed inside the MTL wind tunnel; however, the assessment shows that the confining walls have a negligible effect on the wake characteristics. Figure 9a compares the velocity distribution between the wind-tunnel data (CFD and EXP) and the reference data obtained with LES in [23]. The consistency between the data indicates that the current assessment can be assumed to be a general representation of a NACA4412.
4.2.2. Velocity Fluctuation Field
In a wake development region, the turbulence is in a non-equilibrium state and could even be transitioning from laminar to turbulent. The mean and turbulence profiles vary spatially, but, unlike the downstream region, are not self-similar [13]. The data for the turbulence field, in both the simulations and the experiments, demonstrate that the turbulence content can be used to recognize the wake region, since root-mean-square (RMS) velocity fluctuations are high inside the shear flow but almost zero out of the wake. Therefore, in particular in experiments with single-component measurements, the RMS can be used as a criterion to identify the wake width as well as the streamwise wake border. As an example, TKE decreases to 10% of its initial value when the wake travels downstream from the TE. With the dimensions of our test section, the wake still contains 5% of TKE when leaving the test section.
Since we use a two-equation eddy-viscosity model (EVM), Boussinesq approximation is applied, and RMS fluctuations, , are approximated with Equation (1), where is the Kronecker delta, k is TKE, and denotes strain-rate tensor of the mean velocity field:
Without using algebraic models [24], k- SST results in semi-isotropic turbulence fluctuations, which does not provide proper directional parameters. With the HW measurement, RMS velocity fluctuations are measured in the XY plane, denoted as [25]. To simplify, turbulence fluctuations are assumed isotropic in the plane of measurement; the TKE can then be approximated from the HW-measured RMS Equation (2). It should be noted that the estimation of TKE using the following formulation gets less accurate in the regions close to the airfoil trailing edge due to the anisotropic nature of the wake.
The contour plot of TKE is shown in Figure 10, where the EXP box is plotted inside the CFD domain just below the airfoil, and the equivalent area is marked in the CFD data. The CFD data are for the mid-height section of a 3D simulation. There are two branches of shear-flow shedding into the wake from the suction sides and the TE on top and bottom. Although the two shedding branches combine, the blending needs a longer distance such that the trace of two shear layers remains within almost 3C. The wake centre is located at a similar point along the wake in both CFD and EXP, but the wake is wider according to the EXP. The turbulence is observed to be underestimated in CFD compared to the Exp, which explains the slower wake propagation observed in the velocity-field comparison. Although there is a difference in near-wake turbulence between CFD and EXP, at one and two chords downstream the data is in fair agreement and the general pattern is similar in both.
4.2.3. Instantaneous Wake
In wakes near field of bluff bodies (e.g., cylinders and spheres), there are large-scale motions with preferred frequencies, the clearest example being vortex shedding from a cylinder. These motions depend, of course, on the geometry of the body—they are different for screens, spheres, and disks. The differences in the large-scale motions persist into the far wake [13]. At AOA = 14, wake unsteadiness is considerable, as apparent from the URANS results shown in Figure 11. Data assessment in the other sections of this paper is according to the time-averaged data in both CFD and the EXP. However, we briefly discuss time variations, though the used numerical tool, URANS, can partially capture the various dynamic phenomena.
A fast Fourier transform (FFT) was used to extract the frequency of vortex shedding in the URANS results. Strouhal numbers () are calculated with respect to different length scales, from which we use two well-known definitions, and . They are defined according to the maximum thickness of exposed bluntness of the airfoil (d) and the chord length (C), respectively. The frequency of vortex shedding at AOA = 14 corresponds to and according to CFD. The frequency was also identified from the wind tunnel measurements at AOA = 14. At each HW probe position, the velocity signal was acquired with a sampling rate of 60 kHz for a time-interval of 5 s, yielding a frequency resolution of the PSD results of 0.2 Hz. The corresponding values of and were 0.22 and 0.78, respectively, which is in agreement with the CFD results.
Assuming an airfoil to be a rectangle with a semicircular leading edge, the early measurement in 1983 found to be for a similar magnitude [26,27]. Experimental investigation on a NACA0012 measured the vortex shedding frequency at = 150 k and reported = 0.19–0.21 [28]. This agreed with previous experiments in Ref. [29], which measured the stall-angle frequency to be . Note that in the inertia-effect dominated regime, the vortex shedding frequency remains constant with variations of Reynolds number. For an airfoil, this regime starts from 6 k, which corresponds to 20 k for a NACA4412 [30]. In the lower , the frequency decreases substantially [31]. For our test case, NACA4412, we predicted the vortex shedding frequency at higher angles of attack as based on [32,33], which is in fair agreement with the captured by URANS. Table 3 summarizes values according to different references.
4.3. Spanwise Variation
Usually, wind-tunnel measurements on wings are focused on the mid-span section, where the flow is expected to be 2D and so the data represent an infinite span. However, the configuration of the confining walls (ceiling, floor, and sidewalls) may affect the nearby flow field (at intersections), and the consequences transfer to the mid-height section. Hence, an ideal wind-tunnel design aims for no wall effects on the test object. Indeed, the primary necessity in wind-tunnel modelling, whether in experiment or simulation, is to make sure that the 3D effects emanating from the top and bottom vanish before reaching the mid-span section. Once the spanwise distribution is uniform, the flow-field can be considered 2D.
To do a more comprehensive study and a detailed assessment of the flow field, in this section we look at the spanwise variations in addition to the mid-height section. For this purpose, the measurements were also carried out through the spanwise direction to provide data for a more extensive validation of the CFD simulations (see Table 2). We analysed the streamline patterns and the separation line along the spanwise direction. Additionally, we intended to find the region at which the ceiling/floor effects do not appear (see also Section 3). This region can be denoted as a 2D region, since the 3D effects are not considerable. All investigations in this section are presented for AOA = 11, while the other AOAs were assessed and similar results were observed. We discuss the wind tunnel effects which correspond to the last two rows of Table 2.
In Figure 12, four selected vertical planes are shown normal to the flow and aligned to the wing span (see Figure 1). The planes are contoured with the pressure values, where negative values denote pressures lower than the tunnel exit pressure (=0 Pa). There is no trace of the ceiling/floor upstream of the wing, while at , a distinct effect is observed at the suction side (left side of the shown panel). This effect substantially decays after , and at it almost disappears. The outflow from the wind tunnel can be assumed to be 2D. At the sections with 3D effects (e.g., ), some large circular patterns that propagate from the ceiling/floor are observed. In order to see the source of such large vortices, the airfoil section (XY plane) was investigated near the ceiling, not shown here. The flow separates extensively over the suction side at that area as a result of the interaction between the wing and the perpendicular wall (i.e., the ceiling). Similar behaviour is also seen near the floor. Therefore, there are two main wake regions: (1) the wake originating from the ceiling/floor intersection with the wing, and (2) the wake downstream of the wing TE. The latter moves towards the high-pressure side-wall as the planes approach the tunnel outlet. We call them the intersection vortex and the wake, respectively, for simplicity. Mixing the intersection vortex and the wake causes a spanwise non-uniformity that can be counted as a 3D effect.
Figure 13 shows spanwise planes normal to the flow path at the selected streamwise locations. They are contoured with velocity distribution and the spreading of the wake is visible via four selected planes, along with the asymmetrical flow field on each plane. Wake spreading reduces the velocity and hence the pressure gap between the suction and pressure sides (left and right sides of the wake column) such that at there is no distinct difference in velocity. However, the wake effect at the centre persists up to the test section outlet ().
4.4. Spanwise Blockage
Comparing the experiments in the free-flight/site condition, wind-tunnel walls may affect the measurements in several ways, including the wall interference in the airfoil plane, i.e., the horizontal plane for a vertical wing (see e.g., [9]). In addition to airfoil confinement by sidewalls in the main plane, the ceiling and the floor of the wind tunnel are trivial limitations to model an infinite span, as they lead to the intersection vortex. In order to have a more detailed view of the referred 2D-deviated regions in Figure 12, the contour lines were extracted according to the turbulence content of the flow, i.e., TKE, as shown in Figure 14-mid. The central part of the span can be assumed to be a 2D region since the vortices do not transmit to the mid region, and the the flow is aligned with the wing span.
In addition to the downstream wake plane, the surface streamlines are also visualized and plotted in Figure 14-left. Similar separation is observed over the wing. The 2D-deviation starts from the same spanwise locations on both the wing and the downstream wake. Since the large vortices do not decay over such a small streamwise distance, these two representations (wing surface and the downstream normal plane) can be used instead of each other according to the availability of the experiments. At the discussed AOA, flow separates near the TE over the suction side of the airfoil. The resulting vortex in the separation region seems to be the same in the different sections around mid-height; i.e., it forms a column of separated flow with an almost fixed width. Near the ceiling/floor, the separation vortex expands sharply so that it covers almost the whole suction side at the ceiling/floor. In order to find the exact separation line over the surface, the velocity gradient is used as the criterion and is calculated normal to the surface. The zero-velocity gradient is considered to distinguish the separation line, and it is plotted beside the flow streamlines. It should be noted that the curved wing surface is projected over the XZ plane, so the suction peak is visible on the LE line.
In order to make a comparison with the experiments, tuft visualization was used, and was measured and post-processed with the method mentioned in Section 2.2. The tuft vibration is plotted in Figure 14-right with a superimposed plot consisting of the EXP results, the CFD streamlines, and the velocity gradient pattern. The tuft-oscillation-intensity contour is shown for AOA = and . The contour values were normalized by the maximum swept area observed among the tufts for that specific case. In order to extrapolate the contour over the entire surface of the airfoil (for visualization purposes), values of 0 and 1 were assigned to the leading- and trailing-edge locations, respectively. This assumption was made considering the fact that at the aforementioned and AOA, the flow is fully attached on the leading edge (LE) and separated on the trailing edge. The contour is superimposed over the surface streamlines and separation line obtained from the RANS simulation at the same AOA and .
The flow is clearly affected by the interaction of the wing model with the test-section sidewalls in the regions close to them (). This interaction creates three-dimensional flow manifested by earlier and varying flow separation. Both the experimental and the RANS results show the existence of a 2D region of approximately one chord-length () around the mid-span, at which the location of the separation point remains constant along the span. The pressure-tap probes were placed in this region, thus enabling the acquisition of 2D data using the available wind-tunnel setup. The comparison shows the close qualitative agreement between CFD and EXP, though the resolution of the tuft visualization does not allow further detailed investigations. The experiments confirm that there is an intersection vortex, and it forms at a spanwise location similar to that in the CFD. Additionally, the visualized tufts indicate the asymmetry in the flow such that the separation near the ceiling and floor are different. This refers to the non-identical configurations of ceiling and floor, which is discussed in Section 3.
5. Wake Characteristics and Similarity Analysis
In Section 4, CFD in-plane wake profiles were compared with HW-measured data on the same plane. Velocity characteristics and the turbulence fields were investigated, and the results showed that the major features captured were similar in CFD and EXP. In this section, we assess the wake with respect to the wake parameters so that it can be comparable with other wake studies, e.g., [13,34,35]. As remarked in Section 4, the NACA4412 wake in the MTL is comparable with the unconfined wake, and the wall effects are not significant. To see the slight deviations, an unconfined wake, denoted as LES*, is also shown according to the reference data in [23]. First, the wake characteristics are analysed in Section 5.1, and the wake’s spatial development is examined with increasing angles of attack. Then, various definitions of wake self-similarity are investigated in Section 5.2, and the regions in which the wake demonstrates self-similar patterns are identified.
5.1. Wake Characteristics
Various methods exist to characterise turbulent wake based on streamwise velocity [36]. In this study, to examine the wake characteristics in more detail, three standard wake parameters were used, including the wake centre position (), maximum wake defect (), and wake half-width (b). These parameters help to quantify wake development and can be applied to various geometries, such as cylinders [37], airfoils [34,38], and wind turbines [39,40]. The definitions of the wake parameters are indicated on a sample asymmetric velocity profile in Figure 15. The Y location of the minimum velocity across the wake profile is known as the wake centre. The vertical position of the wake centre with respect to the origin (here considered at TE), , indicates the vertical evolution of the wake profile. Hence, variation of in the stream-wise direction shows the wake path downstream. Another parameter is the wake defect, w, which is the velocity defect at any Y with respect to the velocity at the edge of the profile, i.e., -. The maximum velocity defect, i.e., -) is know as the maximum wake defect and is an indication of the mixing intensity across the wake [35]. For example, rapid relaxation of through the stream-wise direction shows a high rate of mixing in the wake region. The third wake parameter is the half-width of the wake (b), which is also known as shear layer width. It is defined as the Y value at which the wake defect has reached half of its maximum value. Therefore, with an asymmetric wake profile two different half-widths exist: one for the upper part of the profile () and the other for the lower part (). The overall half-width is defined as the average of the upper and the lower half-widths. Streamwise variation of the wake half-width indicates the spreading rate of the wake, similar to the w parameter that shows the mixing rate through the wake. It should be noted that in all figures of this section, zero coordinate corresponds to the TE location at each AOA.
The overall wake flow route was discussed in Section 4 via the flow-field contours. In this section we analyse the wake direction according to the location of the wake centre through the streamwise direction, . Figure 16a shows the wake path for the cases at different AOAs according to EXP, CFD, and LES* data. The wake path is similar in all approaches, specifically in terms of the flow curvature, i.e., . In the vicinity of the TE, i.e., , the wake does not incline downward, and is consistent for all AOAs (see the enlarged panel of this region). The downslope initiates when mixing starts, and the incline decreases as the wake spreads out. It is noticeable that the wake slope at far wake does not differ for different AOAs, while the wake positions lower at a higher AOA. This is due to a larger separation upstream of the TE at AOA = 11 that pushes the wake region down. It can be observed that confinement does not change the wake path at almost one-chord downstream, while at , the unconfined wake reaches the position of the MTL wake at a higher () AOA. However, this deviation could also be related to the difference between the simulation setups (LES/RANS).
The streamwise variation of the maximum wake deficit is plotted in Figure 16b. All AOAs are almost similar for both CFD and EXP, though the data are scattered very close to the TE (up to ). This indicates that the AOA does not affect the parameter, in spite of the fact that the origin vortex at the TE is of a different size. It is noticeable that confinement does not affect the parameter either at the near wake or the far wake. Regardless of the AOA, of the velocity deficit is recovered within , while wake spreading becomes drastically slow after . The recovered wake deficit at is only .
Unlike the flat-plate or cylinder wake, the wake of a NACA-4412 is not symmetrical. Due to the asymmetric shape of the airfoil, the downstream wake exhibits an asymmetric pressure (and hence velocity) distribution. Therefore, the extremes of the wake profile (along Y) are not in the same condition, specifically at the near-wake region. Consequently, the half-width parameter varies for the upper and lower sides (defined as and , respectively). The experimental results (not shown here) indicate that the wake becomes symmetrical at approximately one chord downstream, while asymmetry persists to downstream according to CFD.
The primary wake width , i.e., b value just after the TE, shows the extent of the generated shear flow. A larger separation at higher AOA leads to a larger , which is seen in both the EXP and CFD data. The streamwise evolution of the b indicates the spreading rate of the wake downstream. The minimum in b, i.e., , in the region , is located in the reverse-flow region (wedge region) just downstream from the TE. Although the origin wake width is different, the CFD results at AOA and show a similar slope , hence the wake recovery is similar. Despite the small differences, all AOAs spread out similarly, which indicates the slight effect of the origin vortex. This shows the significant role of free-stream turbulence in the recovery process regardless of the original extent of the wake. The half-width of the unconfined wake is in close agreement with the CFD data at AOA = 5, while the curve slope is more similar to the EXP data. It should be noted that has an important role in the self-similar feature of the wake, which will be discussed in the next section.
5.2. Self-Similarity
It is believed that a wake flow develops with self-similar patterns far enough downstream of the body. The shape of the velocity profile, also called the wind shadow, in the far wake is according to classical theory [41], independent of the shape of the body, i.e., of the initial conditions. Pope [13], instead, argues that the flow cannot be exactly self-similar because the ratio between w and is dependent on X, and it evolves as decays. However, he also reported an observation of self-similar behaviour when this velocity ratio is less than about 0.1: “The flow does become asymptotically self-similar in the far wake as tends to zero”. Consequently, only over a limited range of X can self-similarity be observed independent of [13]. Self-similarity in wake flows has been investigated in many theoretical, numerical, and experimental studies [39,40,42,43]. The self-similar state is also not limited to the wake of bodies with simple geometries. For example, there are some studies on the wake of wind turbine rotors that have identified self-similar patterns after a transition stage [39,40].
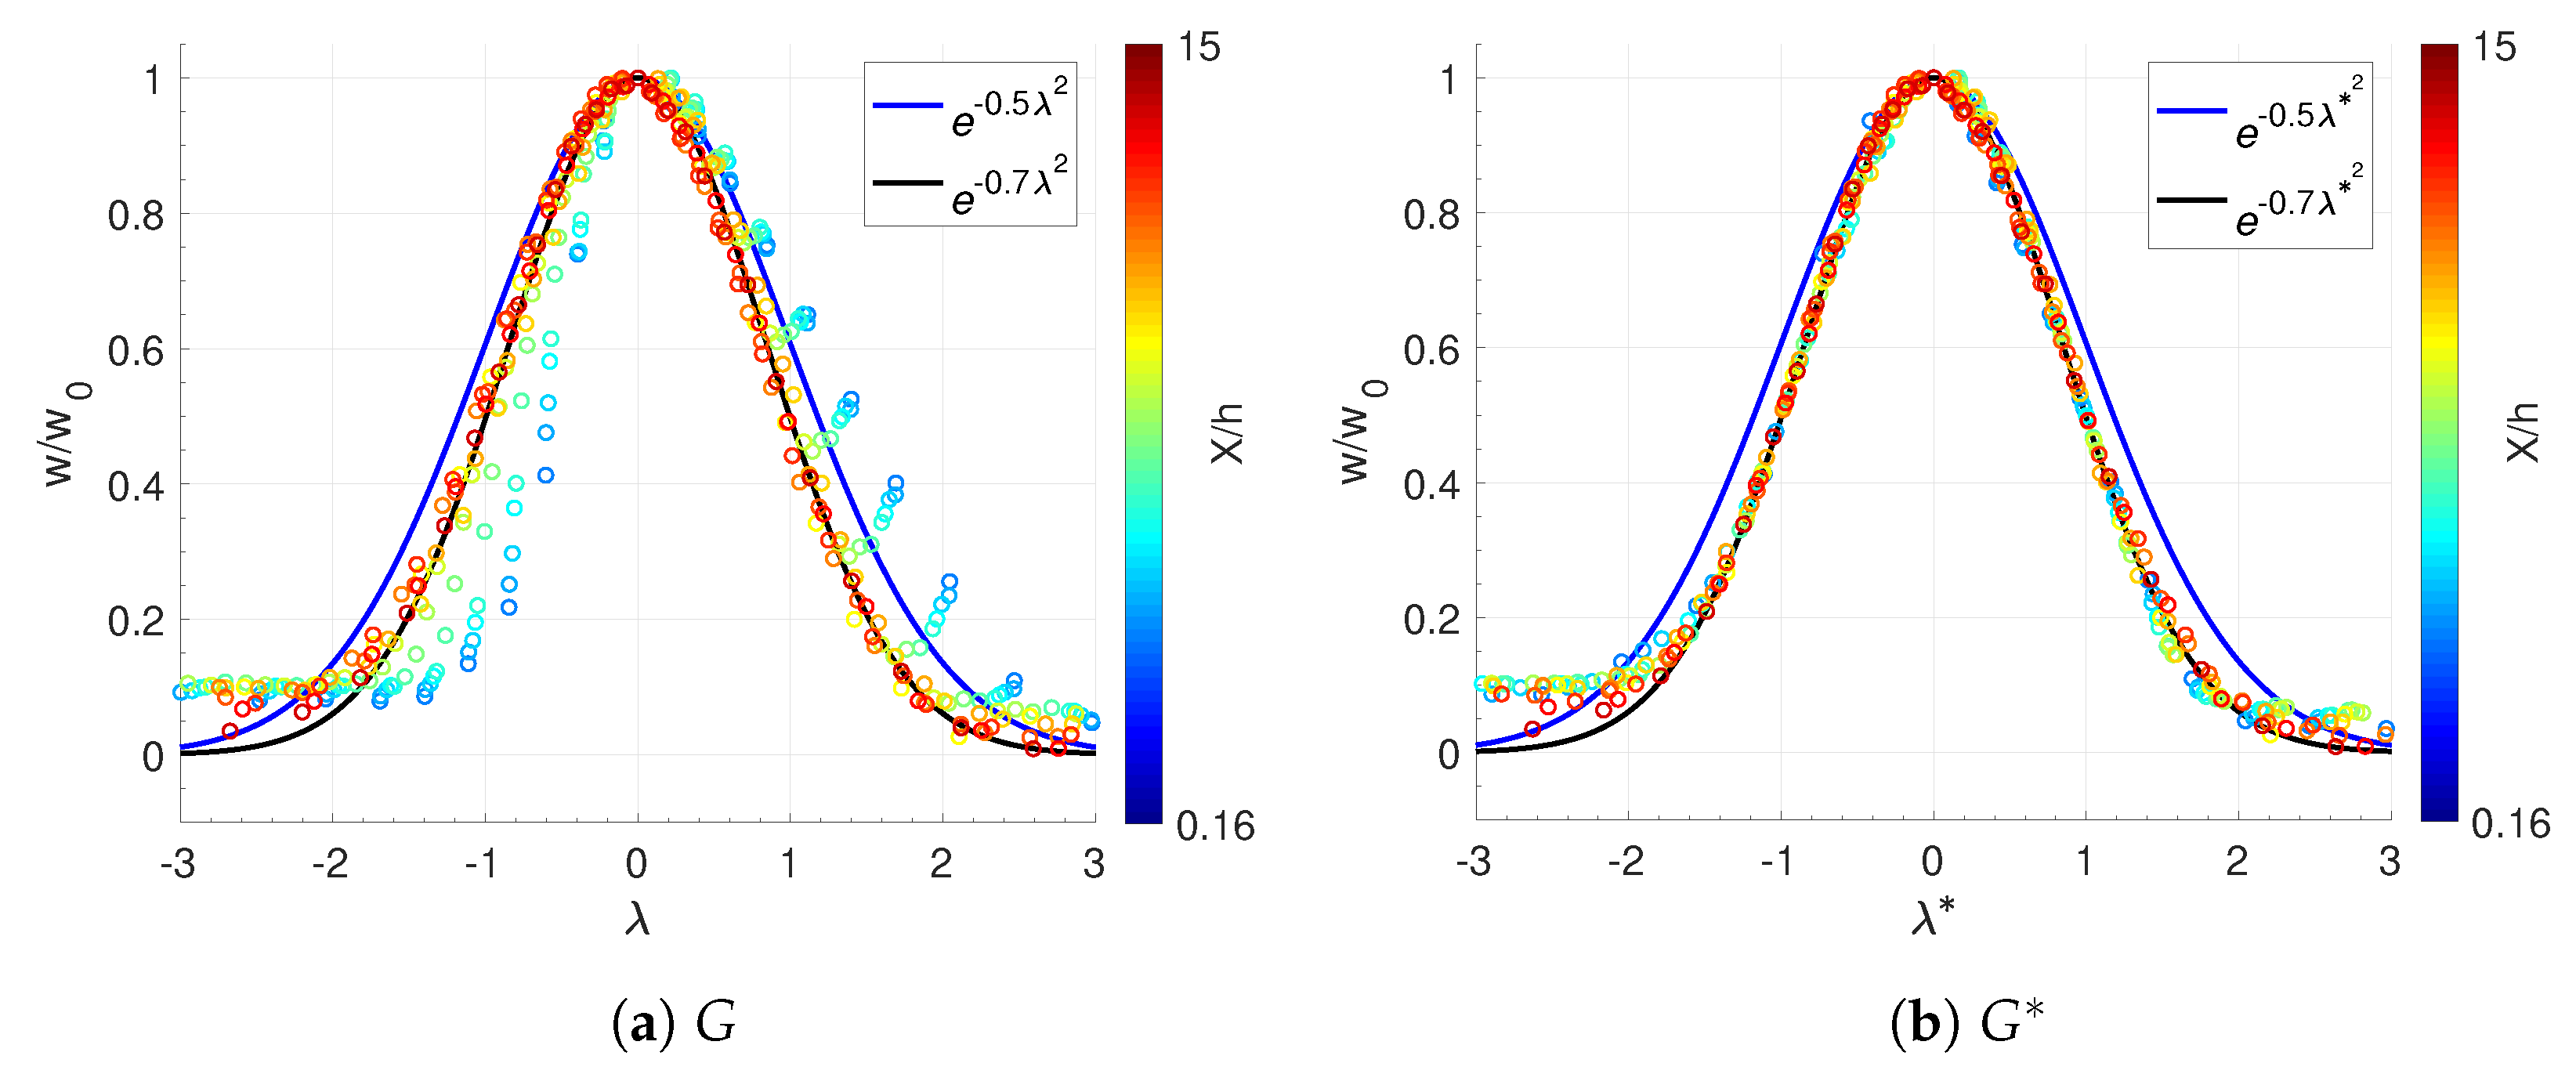
Self-similarity is addressed with different definitions and notations. In [41], self-similarity is defined with respect to a similarity coordinate, which is defined as , where is the kinematic viscosity. A similarity variable () is defined to address self-similarity according to the equations in Table 4, where D is the drag of the body per unit width [10,11,19,44,45]. A spreading parameter (S) is defined as in Table 4 and is constant in the self-similar region. Gaussian (G) self-similarity has been discussed in many references [38,39,40,46,47], where a Gaussian function fits . It is shown that a Gaussian constant of fits the profiles of turbulent wakes very well [43]. Note that is defined as . According to wake data for the NACA4412, Gaussian and self similarities are observed only at symmetrical parts of the wake, i.e., at far wake. Since the wake investigated in this study is asymmetrical in a wide region, we defined a new parameter, , in which is calculated with local b values, i.e., and . It is denoted as . In other words, is the Gaussian function , where is a piecewise function defined as for the lower part of the velocity profile and as for the upper part.
Selected data are plotted in Figure 17a,b to show self-similarity according to G and , respectively. Note that we use the projected height h to scale the downstream region X in order to make a comparable parameter between the different AOAs. In spite of the variations in the near-wake region, S stays constant after according to EXP, CFD, and LES*. The self-similarity onset is similar in all approaches; however, the spreading parameter is underestimated in CFD and the unconfined wake in LES* compared to the EXP. It was also discussed in Section 4 that the EXP wake spreads out faster than the CFD wake. It is noticeable that is similar in CFD and EXP (see Figure 16), but is smaller with a faster recovery, which results in a higher-spreading S in the EXP. To asses the Gaussian similarity, a Gaussian function is plotted with two constants. The curve with yields the best fit to the data. The plots show that is a more-relevant function to represent the asymmetrical wake of a NACA4412 in a wider range compared to G. At far wake regions (larger ), the wake profile is self-similar and can be represented by a Gaussian function.
It has been observed that the wakes from the different generators do not tend to precisely present the same self-similar state [13]. All self-similarity data, including &S, are presented in Table 4 for the cylinder and the airfoil at different AOAs according to the literature and the current study. The increases with the AOA, while no significant difference is observed between the different wake generators. The CFD data underestimate compared to the EXP, but they are still consistent with the literature range. The S value in the simulations are lower than the EXP, which is mainly related to a different b slope in Figure 16 i.e., the streamwise spreading of the wake. The S parameter does not correlate with the AOA. The EXP data are in agreement with the reported S in the literature both for the airfoil and the cylinder. The confinement effect on self-similarity is negligible since the LES* data are in agreement with the CFD data.
Table 5 summarizes the onset location of self-similarity for various cases according to the current study and in comparison with the unconfined wake as LES*. Three self-similarity criteria are considered for each AOA, and the onset location is reported in addition to at the beginning of the self-similar region. Self-similar behaviour initiates after a short length downstream according to because it does not demand a symmetrical wake profile, while symmetry is a necessary requisition for and G. According to S, the self-similarity onset depends slightly on the AOA, unlike , which is very sensitive to both the method and the AOA. The results show that for all cases and with all the criteria, while the observation by Pope [13] was different: “In experiments, self-similar behavior is observed when the velocity ratio is less than 0.1”. This increases to 0.9 with the criteria, as the self-similar behavior is observed early downstream.
Table 4 and Table 5 indicate that the similarity variable and the spreading parameter S are nearly case-independent, as they vary slightly between the different cases. However, this may change for streamlined bodies, as Pope observed a lower S for the streamlined bodies compared to the bluff bodies [13]. Both parameters are underestimated by CFD compared to the EXP. The earliest self-similar behaviour is observed with respect to , while the latest is observed in and G for the CFD and the EXP, respectively. The initiation of self-similarity depends on the geometry (bluff-body) type as well as the AOA. The self-similar region can be well-calculated by CFD with respect to S. Considering , the CFD calculations of self-similar regions are not accurate. The confinement effect on S is not significant, as the unconfined data, LES*, is in agreement with both the CFD and the EXP. However, the wind-tunnel data may deviate from the LES* according to the other self-similar criteria, specifically with the CFD method.
6. Conclusions and Future Work
As an attempt to develop a numerical model of a wind-tunnel experiment, we present an analysis of the wake behind a NACA 4412 wing, which is well-validated with experimental data. The CFD RANS results are investigated and compared to the experiments in order to evaluate the accuracy and fidelity of the numerical setup for the wake-flow studies. This also results in an efficient, robust, and yet low-cost approach to allow for improved experimental design; taking into consideration the limitations of the RANS approach related to modelling and discretization. Additionally, with the two applied methods, experimental and numerical, one can explore the flow field over the wing from different aspects and achieve a deeper understanding of the flow behaviour. The investigations comprise a wide range of AOAs at a chord-based Reynolds number of , where the whole flow-field around the airfoil is studied in detail, as well as the wake downstream.
The experimental setup includes hot-wire measurements, pressure scans, and tuft visualizations, while the numerical setup is based on CFD RANS/URANS using k- SST as the turbulence model. First, the experimental data are used to tune the simulation setup with the proper configuration so that the modelled flow-field represents the real flow in the wind-tunnel under various conditions. The equivalent numerical techniques are used to replicate the details of the wind-tunnel, including boundary layer tripping and the ceiling configuration. Once the setup is defined, wake analysis is carried out. Several downstream locations are considered as well as various parameters, which are selected according to the available experimental data. Over the mid-span section, the velocity and turbulence fields are analysed along the wake. Furthermore, vortex shedding in the instantaneous flow field is studied, and the shedding frequency is compared with values reported in the literature. Over the spanwise planes, the extent of the sidewall interference is investigated, and the 3D effect region is investigated as a further step in making a virtual twin of a wing model. In the next phase, the wake analysis is extended to the typical wake parameters. Additionally, self-similarity is studied, considering three different criteria for each AOA, and the detailed specifications are reported.
It is shown that a full three-dimensional test section needs to be represented in the RANS for the best results in the near wake and far wake. Based on our results, very good agreement is observed between the CFD and the experimental data, both in the mid-plane (relevant region for the flow analysis) as well as in the complete span of the wing (relevant region for experimental design). The mid-span is less sensitive to the simulation setup, while the spanwise distribution of the flow-field is strongly dependent on the setup configuration. The dominant frequency of the wake oscillations matches well with the reported values in the literature and the EXP. The main wake characteristics are well-captured in the simulation, specifically at lower AOAs, since the wake characteristics at a high AOA are challenging to capture, whether with CFD or in the experiment. Further, the simulated wake shows self-similar behaviour, which is consistent with similar cases in the literature. It was shown that the extent of the self-similar region for an asymmetric airfoil wake can be extended if the half-width for the upper and lower sides are considered for normalization rather than the averaged half-width. The selection of self-similarity criteria is critical when using RANS-CFD, as well as in the wind-tunnel studies. Its selection depends on the aim of the study, whether the self-similar region or the value of the self-similar parameter is of interest.
To conclude, the output of the work includes a physical model of the experiment and a numerical model of the same experiment. This research shows that RANS modelling may be used for simulating the complete test section and to evaluate the flow development both along the wind and in the wake region. RANS modelling in OpenFOAM introduces clear fidelity limitations due to turbulence modelling, discretization, and wind-tunnel setup; however, given the relevance of RANS as an engineering tool, the presented results show the usability for wind-tunnel predictions at controllable computational cost. Higher-fidelity results, perhaps even transient data, could be obtained using refined simulation strategies such as LES, but at a cost preventing modelling of a whole wind-tunnel setup. Besides, the simulation results provide insight into the flow field that were used interactively during the HW measurements to choose the effective span (or grid) of data acquisition inside the BL and through the wake. The close agreement between the experiments and the simulations motivates further numerical investigations, e.g., at non-measured AOAs and planes to analyse the wake size and development in more detail, and more advanced topics such as multi-fidelity simulations where different methods are combined in one result.
Author Contributions
Conceptualization, N.T., M.H., R.V. and P.S.; Data curation, N.T. and M.H.; Formal analysis, N.T., F.M., R.Ö., R.V. and P.S.; Funding acquisition, P.S.; Investigation, N.T., M.H. and F.M.; Methodology, N.T., M.H. and P.S.; Project administration, N.T.; Resources, R.Ö. and P.S.; Software, R.Ö.; Supervision, P.S.; Validation, N.T., M.H., F.M., R.Ö. and R.V.; Visualization, N.T. and M.H.; Writing—original draft, N.T., M.H. and R.Ö.; Writing—review and editing, N.T., R.Ö., R.V. and P.S. All authors have read and agreed to the published version of the manuscript.
Funding
Financial support provided by the Knut and Alice Wallenberg Foundation is gratefully acknowledged. The computations/data handling/(SIMILAR)were enabled by resources provided by the Swedish National Infrastructure for Computing (SNIC), partially funded by the Swedish Research Council through grant agreement no. 2018-05973.
Data Availability Statement
Data will be made available under www.flow.kth.se/flow-database (accessed on 15 March 2022).
Acknowledgments
The authors are grateful for all the data made available by the other researchers referenced in the text.
Conflicts of Interest
The authors declare no conflict of interest.
References
- Williamson, C.H.K. Vortex Dynamics in the Wake of a Cylinder. In Fluid Vortices; Springer: Dordrecht, The Netherlands, 1995; pp. 155–234. [Google Scholar] [CrossRef]
- Rossow, V.; Hardy, G.; Meyn, L. Models of Wake-Vortex Spreading Mechanisms and Their Estimated Uncertainties. In Proceedings of the AIAA 5th ATIO and 16th Lighter-Than-Air Sys Technology and Balloon Systems Conferences, Arlington, VA, USA, 26–28 September 2005; p. 7353. [Google Scholar] [CrossRef]
- Dimotakis, P.E. Turbulent Mixing. Annu. Rev. Fluid Mech. 2005, 37, 329–356. [Google Scholar] [CrossRef]
- Davidson, L. An Introduction to Turbulence Models; Chalmers University of Technology: Goteborg, Sweden, 2018. [Google Scholar]
- Creese, T.; Brogan, C. Digital wind Tunnels Could Help Develop More Fuel Efficient Aeroplanes; Imperial College London: London, UK, 2021. [Google Scholar]
- Bennetsen, J.C. Know Which Way the Wind Blows. Ramboll Group A/S. 2021. Available online: https://ramboll.com/digital-solutions/buildings/cfd-technology/digital-wind-tunnel (accessed on 15 March 2022).
- Tabatabaei, N. Impact of Icing on Wind Turbines Aerodynamic. Ph.D. Thesis, Luleå University of Technology, Fluid and Experimental Mechanics, Luleå, Sweden, 2018. [Google Scholar]
- Tabatabaei, N.; Vinuesa, R.; Örlü, R.; Schlatter, P. Techniques for turbulence tripping of boundary layers in RANS simulations. Flow Turbul. Combust. 2021. [Google Scholar] [CrossRef]
- Tabatabaei, N.; Örlü, R.; Vinuesa, R.; Schlatter, P. Aerodynamic Free-Flight Conditions in Wind Tunnel Modelling through Reduced-Order Wall Inserts. Fluids 2021, 6, 265. [Google Scholar] [CrossRef]
- Yoder, D.A.; DeBonis, J.R.; Georgiadis, N.J. Modeling of Turbulent Free Shear Flows. In Proceedings of the 21st AIAA Computational Fluid Dynamics Conference, San Diego, CA, USA, 24–27 June 2013; pp. 1–30. [Google Scholar] [CrossRef] [Green Version]
- Yoder, D.; DeBonis, J.; Georgiadis, N. Modeling of turbulent free shear flows. Comput. Fluids 2015, 117, 212–232. [Google Scholar] [CrossRef] [Green Version]
- Johnson, P.B.; Jonsson, C.; Achilleos, S.; Eames, I. On the spread and decay of wind turbine wakes in ambient turbulence. J. Phys. Conf. Ser. 2014, 555, 012055. [Google Scholar] [CrossRef]
- Pope, S.B. Turbulent Flows; Cambridge University Press: Cambridge, UK, 2000. [Google Scholar] [CrossRef]
- Schlatter, P.; Örlü, R. Assessment of direct numerical simulation data of turbulent boundary layers. J. Fluid Mech. 2010, 659, 116–126. [Google Scholar] [CrossRef]
- Lindgren, B.; Johansson, A.V. Evaluation of the Flow Quality in the MTL Wind-Tunnel; Technical Report TRITA-MEK 2002:13; Deparment of Mechanics, KTH: Stockholm, Sweden, 2002. [Google Scholar]
- Ayachit, U. The ParaView Guide: A Parallel Visualization Application; Kitware, Inc.: Clifton Park, NY, USA, 2015. [Google Scholar]
- Greenshields, C.J. OpenFOAM User Guide; Version 7; Foundation Ltd.: Tokyo, Japan, 2019. [Google Scholar]
- Menter, F.R. Two-equation eddy-viscosity turbulence models for engineering applications. AIAA J. 1994, 32, 1598–1605. [Google Scholar] [CrossRef] [Green Version]
- Bardina, J.; Huang, P.; Coakley, T. Turbulence Modeling Validation, Testing, and Development. NASA Tech. Memo. 1997, 110446, 147. [Google Scholar]
- Ansys, I. ICEM CFD User Manual; Release 14.0; Ansys Inc.: Pune, India, 2011. [Google Scholar]
- Steinfurth, B.; Cura, C.; Gehring, J.; Weiss, J. Tuft deflection velocimetry: A simple method to extract quantitative flow field information. Exp. Fluids 2020, 61, 146. [Google Scholar] [CrossRef]
- Bailey, S.C.C.; Hultmark, M.; Monty, J.P.; Alfredsson, P.H.; Chong, M.S.; Duncan, R.D.; Fransson, J.H.M.; Hutchins, N.; Marusic, I.; McKeon, B.J.; et al. Obtaining accurate mean velocity measurements in high Reynolds number turbulent boundary layers using Pitot tubes. J. Fluid Mech. 2013, 715, 642–670. [Google Scholar] [CrossRef] [Green Version]
- Vinuesa, R.; Negi, P.; Atzori, M.; Hanifi, A.; Henningson, D.; Schlatter, P. Turbulent boundary layers around wing sections up to Rec=1,000,000. Int. J. Heat Fluid Flow 2018, 72, 86–99. [Google Scholar] [CrossRef] [Green Version]
- Wallin, S.; Johansson, A.V. An explicit algebraic Reynolds stress model for incompressible and compressible turbulent flows. J. Fluid Mech. 2000, 403, 89–132. [Google Scholar] [CrossRef]
- Kalpakli Vester, A.; Sattarzadeh, S.S.; Örlü, R. Combined hot-wire and PIV measurements of a swirling turbulent flow at the exit of a 90 degree pipe bend. J. Vis. 2016, 19, 261–273. [Google Scholar] [CrossRef]
- Parker, R.; Welsh, M. Effects of sound on flow separation from blunt flat plates. Int. J. Heat Fluid Flow 1983, 4, 113–127. [Google Scholar] [CrossRef]
- Morgenthal, G. Fluid-Structure Interaction in Bluff-Body Aerodynamics and Long-Span Bridge Design: Phenomena and Methods; University of Cambridge: Cambridge, UK, 2001. [Google Scholar]
- Nedić, J.; Vassilicos, J.C. Vortex Shedding and Aerodynamic Performance of Airfoil with Multiscale Trailing-Edge Modifications. AIAA J. 2015, 53, 3240–3250. [Google Scholar] [CrossRef]
- Yarusevych, S.; Sullivan, P.E.; Kawall, J.G. On vortex shedding from an airfoil in low-Reynolds-number flows. J. Fluid Mech. 2009, 632, 245–271. [Google Scholar] [CrossRef]
- Lee, H.W.; Huang, R.F. frequency Selection of Wake Flow Behind a NACA 0012 Wing. J. Mar. Sci. Technol. 1998, 6, 29–37. [Google Scholar] [CrossRef]
- Kurtulus, D. On the wake pattern of symmetric airfoils for different incidence angles at Re = 1000. Int. J. Micro Air Veh. 2016, 8, 109–139. [Google Scholar] [CrossRef] [Green Version]
- Koca, K.; Genç, M.S.; Açıkel, H.H.; Çağdaş, M.; Bodur, T.M. Identification of flow phenomena over NACA 4412 wind turbine airfoil at low Reynolds numbers and role of laminar separation bubble on flow evolution. Energy 2018, 144, 750–764. [Google Scholar] [CrossRef]
- Rojratsirikul, P.; Genc, M.; Wang, Z.; Gursul, I. Flow-induced vibrations of low aspect ratio rectangular membrane wings. J. Fluids Struct. 2011, 27, 1296–1309. [Google Scholar] [CrossRef] [Green Version]
- Ramjee, V.; Neelakandan, D. Curvature effects on the wake of an airfoil and other bodies. Fluid Dyn. Res. 1990, 6, 1. [Google Scholar] [CrossRef]
- Yao, C.; Paschal, K. PIV measurements of airfoil wake-flow turbulence statistics and turbulent structures. In Proceedings of the 32nd Aerospace Sciences Meeting and Exhibit, Reno, NV, USA, 10–13 January 1994; p. 85. [Google Scholar]
- Duda, D.; Uruba, V.; Yanovych, V. Wake Width: Discussion of Several Methods How to Estimate It by Using Measured Experimental Data. Energies 2021, 14, 4712. [Google Scholar] [CrossRef]
- Marble, E.; Morton, C.; Yarusevych, S. Spanwise wake development of a pivoted cylinder undergoing vortex-induced vibrations with elliptic trajectories. Exp. Fluids 2019, 60, 81. [Google Scholar] [CrossRef]
- Abdalla, H.A. Boundary layer-tripping studies on characteristics of near-wake behind a cambered airfoil. ERJ. Eng. Res. J. 1999, 22, 115–133. [Google Scholar] [CrossRef]
- Abkar, M.; Dabiri, J.O. Self-similarity and flow characteristics of vertical-axis wind turbine wakes: An LES study. J. Turbul. 2017, 18, 373–389. [Google Scholar] [CrossRef]
- Lyu, P.; Chen, W.L.; Li, H.; Shen, L. A Numerical Study on the Development of Self-Similarity in a Wind Turbine Wake Using an Improved Pseudo-Spectral Large-Eddy Simulation Solver. Energies 2019, 12, 643. [Google Scholar] [CrossRef] [Green Version]
- Mayes, C.; Schlichting, H.; Krause, E.; Oertel, H.; Gersten, K. Boundary-Layer Theory; Physic and Astronomy; Springer: Berlin/Heidelberg, Germany, 2003. [Google Scholar]
- Johansson, P.B.V.; George, W.K.; Gourlay, M.J. Equilibrium similarity, effects of initial conditions and local Reynolds number on the axisymmetric wake. Phys. Fluids 2003, 15, 603–617. [Google Scholar] [CrossRef] [Green Version]
- Wei, T. Self-Similarity Analysis of Turbulent Wake Flows. J. Fluids Eng. 2017, 139, 051203. [Google Scholar] [CrossRef]
- Wilcox, D. Turbulence Modeling for CFD; Number v. 1 in Turbulence Modeling for CFD; DCW Industries: La Canada, CA, USA, 2006. [Google Scholar]
- Fage, A.; Falkner, V.M.; Taylor, G.I. Note an experiments on the temperature and velocity in the wake of a heated cylindrical obstacle. Proc. R. Soc. Lond. Ser. A Contain. Pap. Math. Phys. Character 1932, 135, 702–705. [Google Scholar]
- Qian, J. Non-Gaussian self-similarity in the inertial range of turbulence. J. Hydrodyn. Ser. B 2006, 18, 232–236. [Google Scholar] [CrossRef]
- Xie, S.; Archer, C. Self-similarity and turbulence characteristics of wind turbine wakes via large-eddy simulation. Wind Energy 2014, 18, 1815–1838. [Google Scholar] [CrossRef]
Figure 1.
Computational domain according to the test section of MTL. X, Y, and Z refer to the streamwise, transverse, and spanwise direction, where the airfoil is located on the plane. The origin of the coordinate system is on the TE and at the mid-height section. Selected normal planes are shown at certain streamwise locations: X = −4C, 0.01C, 1C, 3C, 6C. The airfoil chord length C is 0.5 m.

Figure 2.
Measurement grid at airfoil plane (). AOA =11 is shown; it is similar for the other AOAs depending on their wake path.
Figure 2.
Measurement grid at airfoil plane (). AOA =11 is shown; it is similar for the other AOAs depending on their wake path.
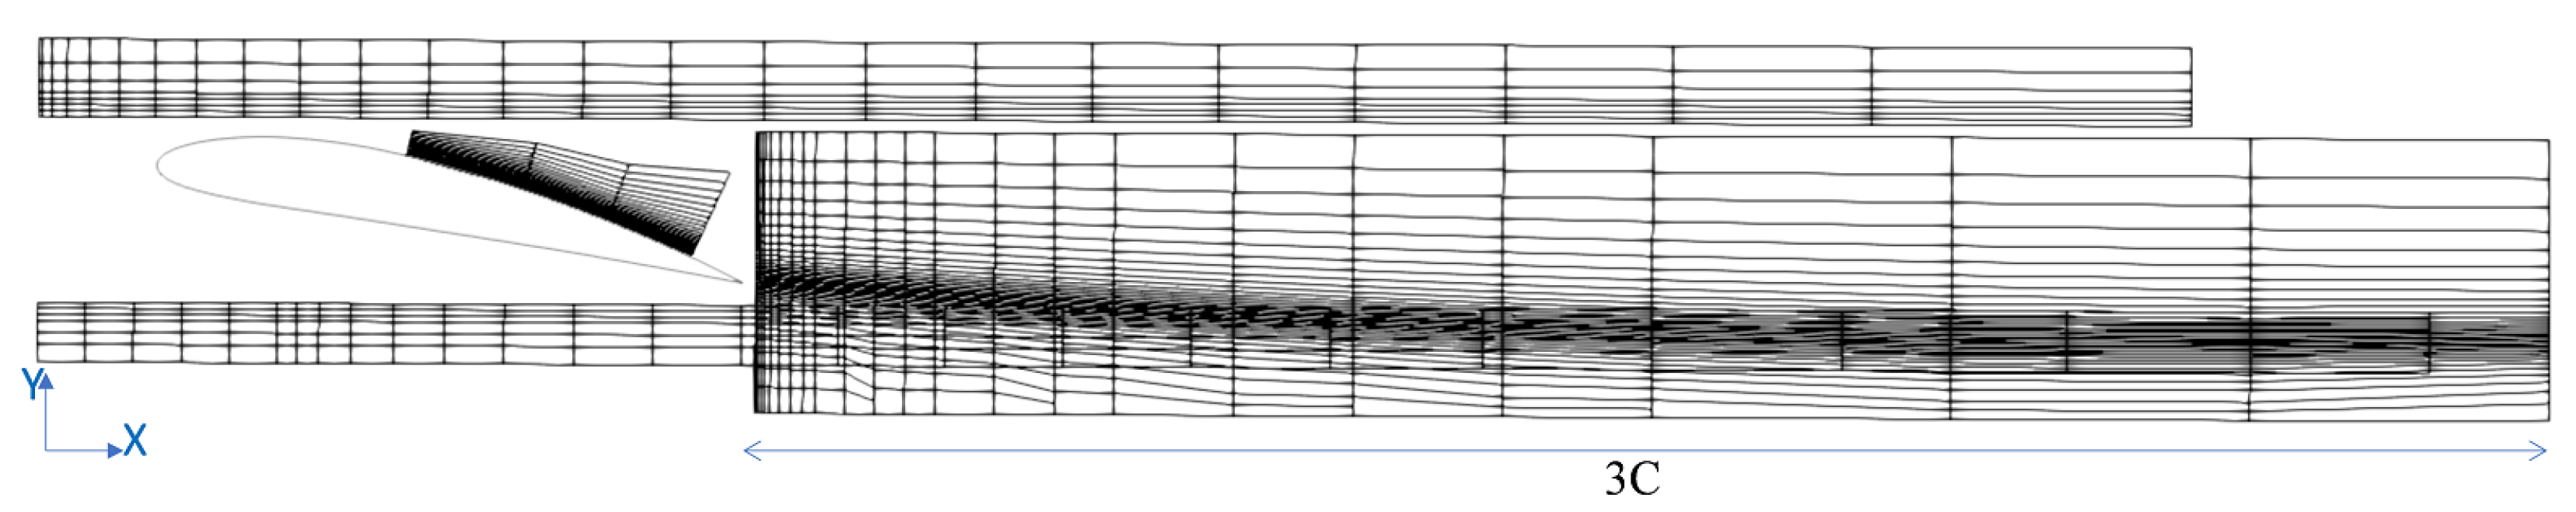
Figure 3.
Chordwise distribution: LES, CFD, and EXP. The airfoil is tripped, except for cases marked with prime symbol in the legend. The airfoil is in the wind tunnel except for cases marked with ‘*’, which are in free-flight (unconfined) condition. Further details are found in [8,9].
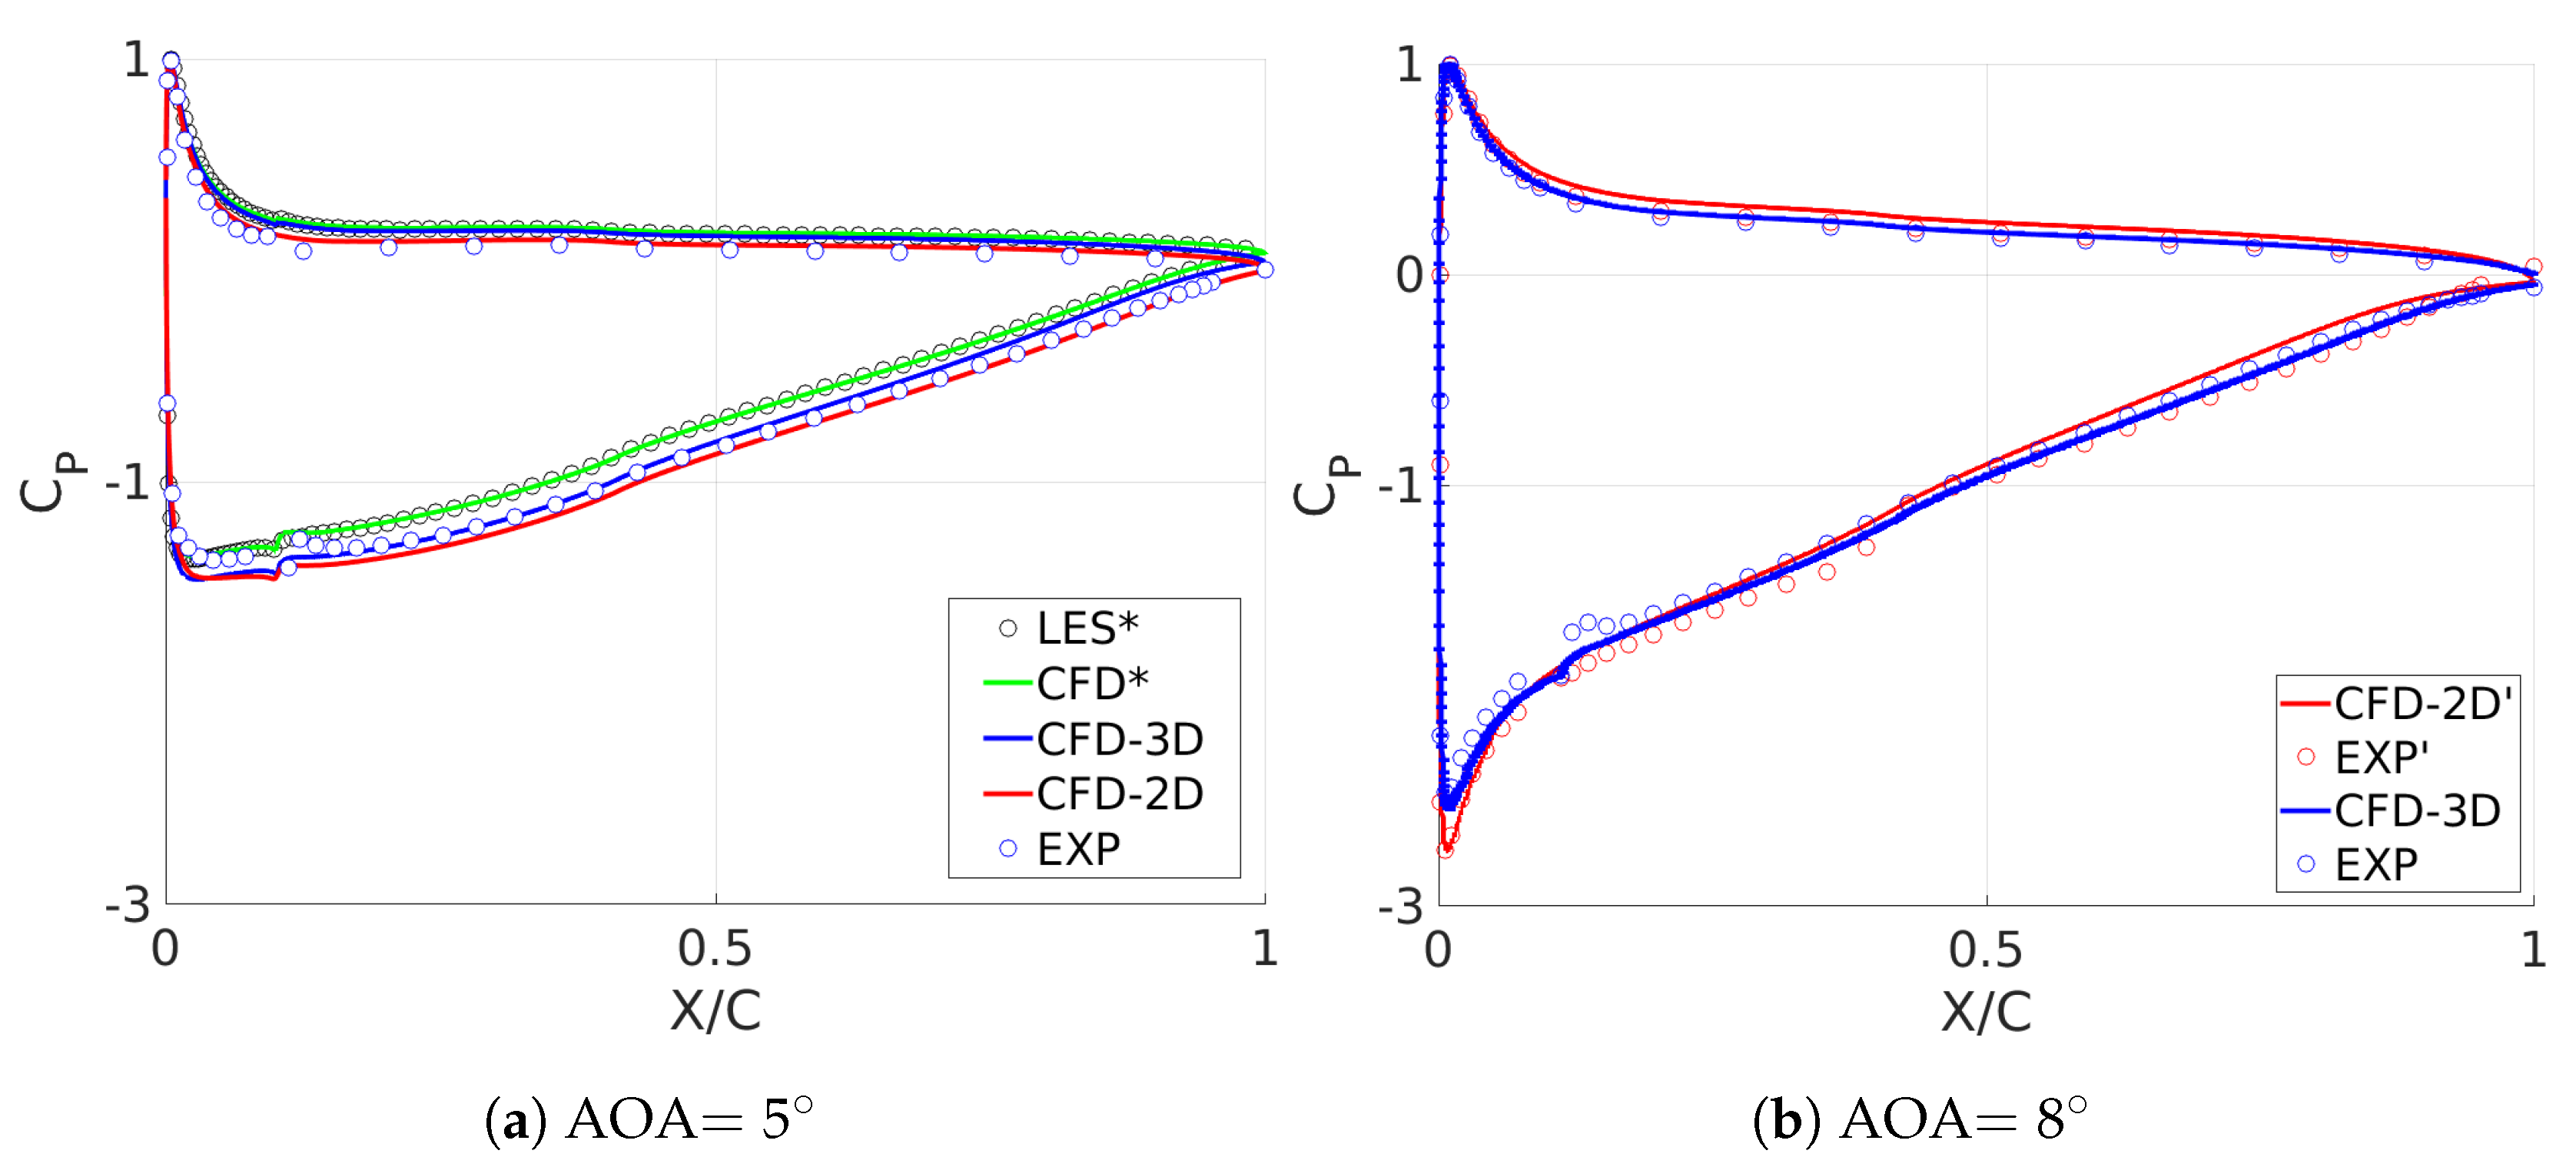
Figure 4.
Chordwise distribution at mid-height section of the wing for the simulations with the different spanwise setup (Table 1), as well as the experiments; AOA .
Figure 4.
Chordwise distribution at mid-height section of the wing for the simulations with the different spanwise setup (Table 1), as well as the experiments; AOA .
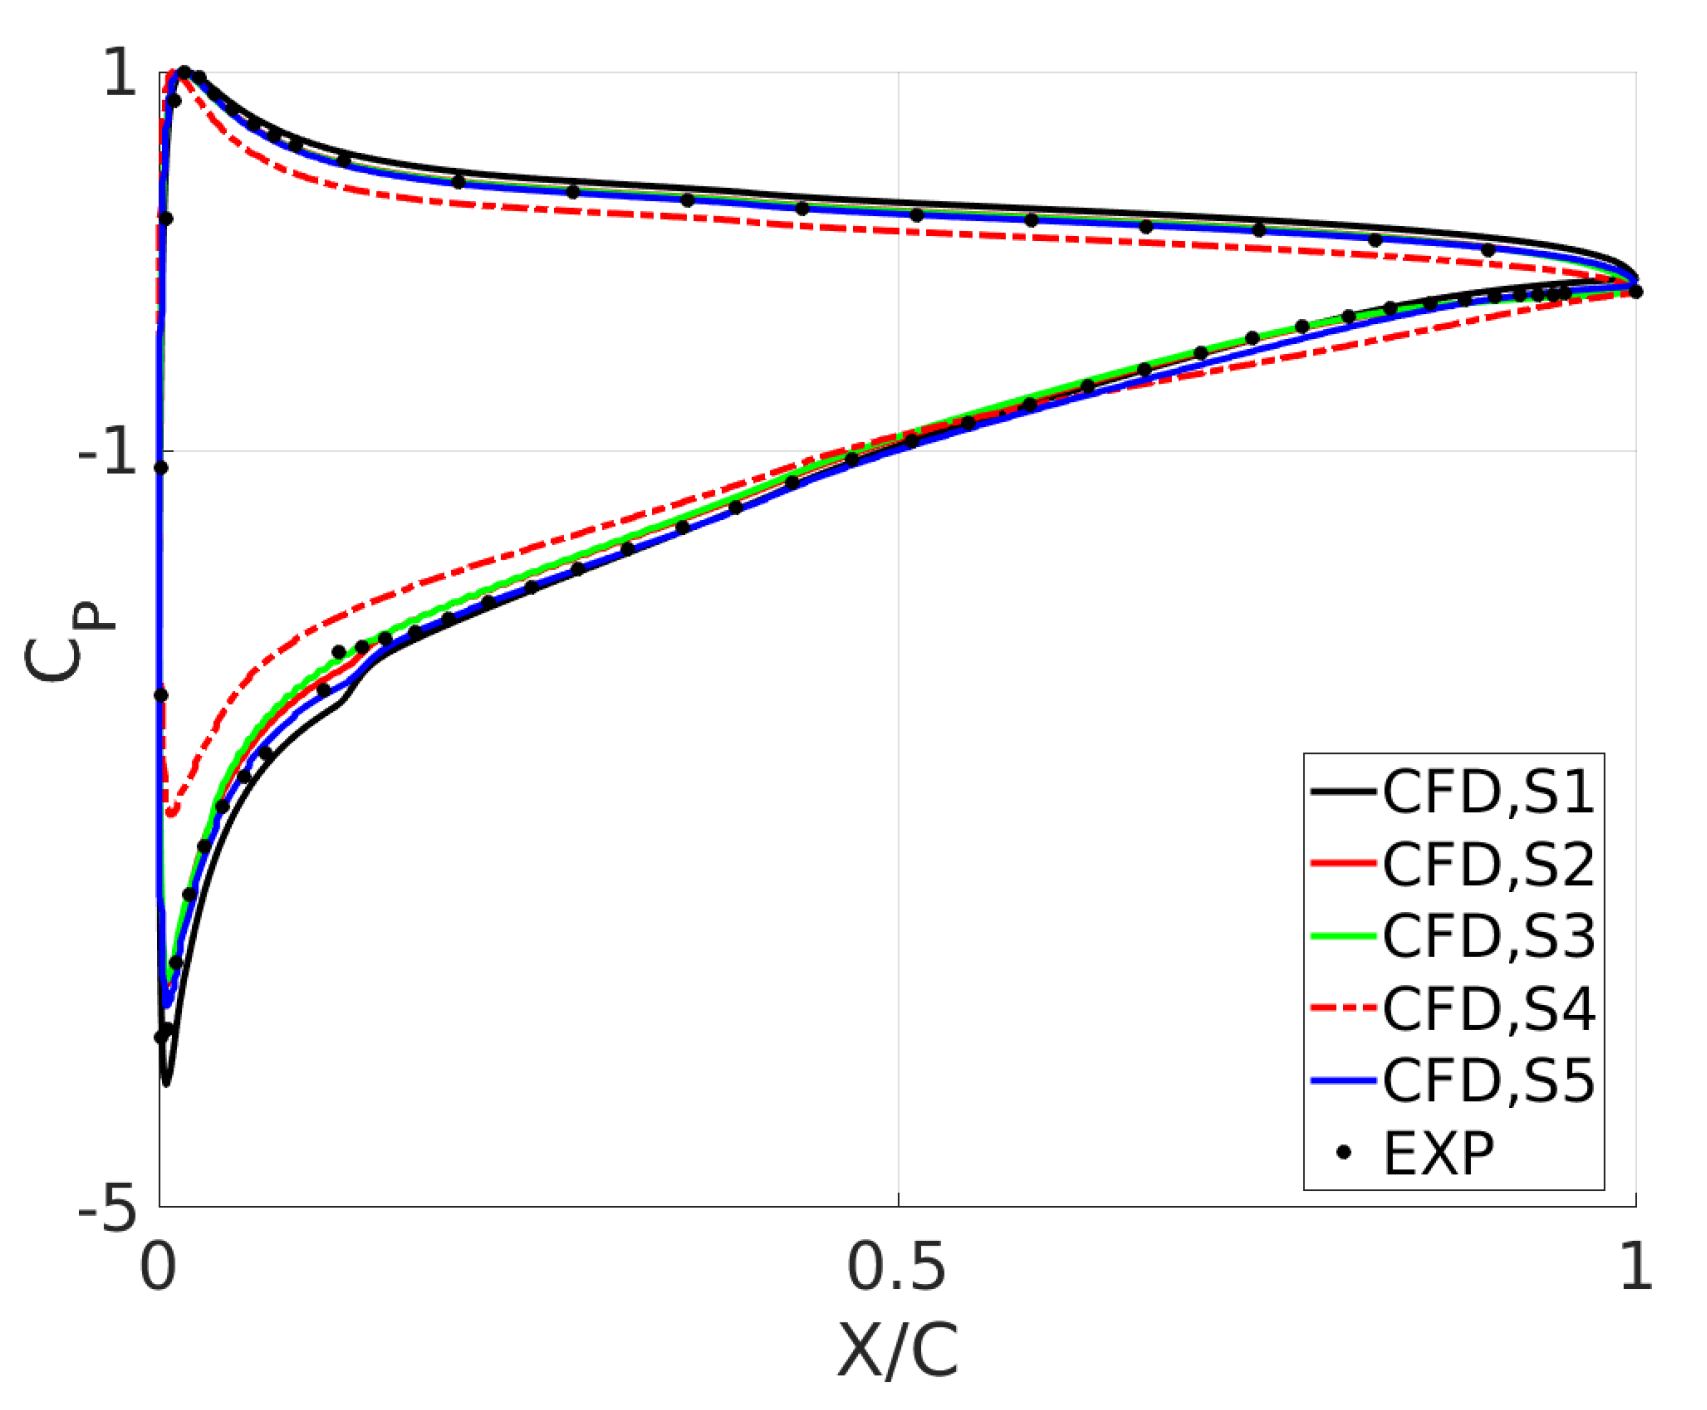
Figure 5.
External hot-wire traverse mechanism.
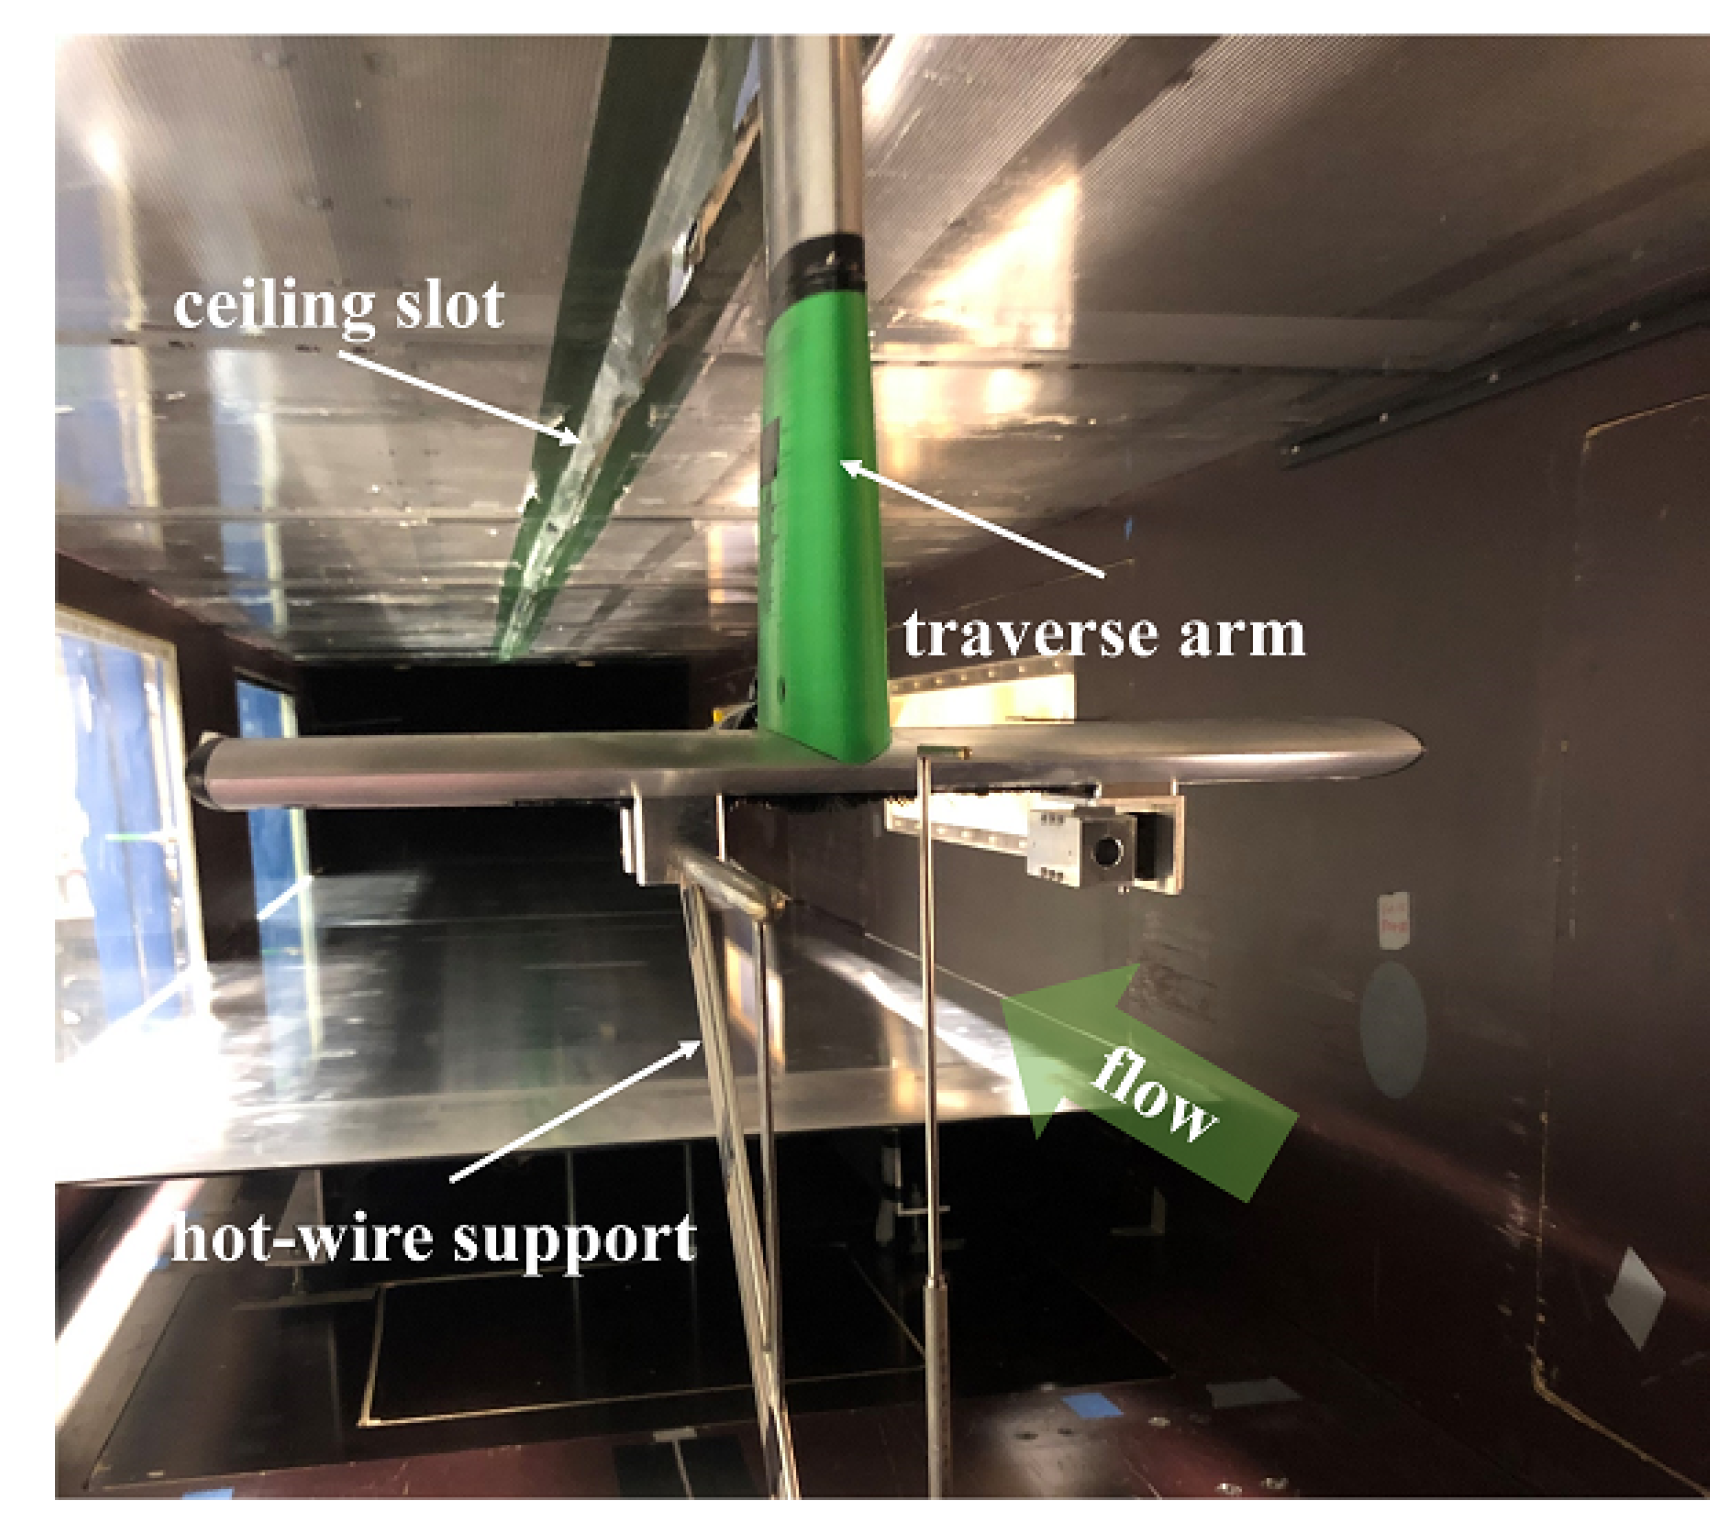
Figure 6.
Spanwise development of the wakes at the planes normal to the flow: CFD vs. HW. Contours represent the mean flow velocity. The dashed lines show the separation height at HW. The panels are the YZ planes shown in Figure 1.
Figure 6.
Spanwise development of the wakes at the planes normal to the flow: CFD vs. HW. Contours represent the mean flow velocity. The dashed lines show the separation height at HW. The panels are the YZ planes shown in Figure 1.
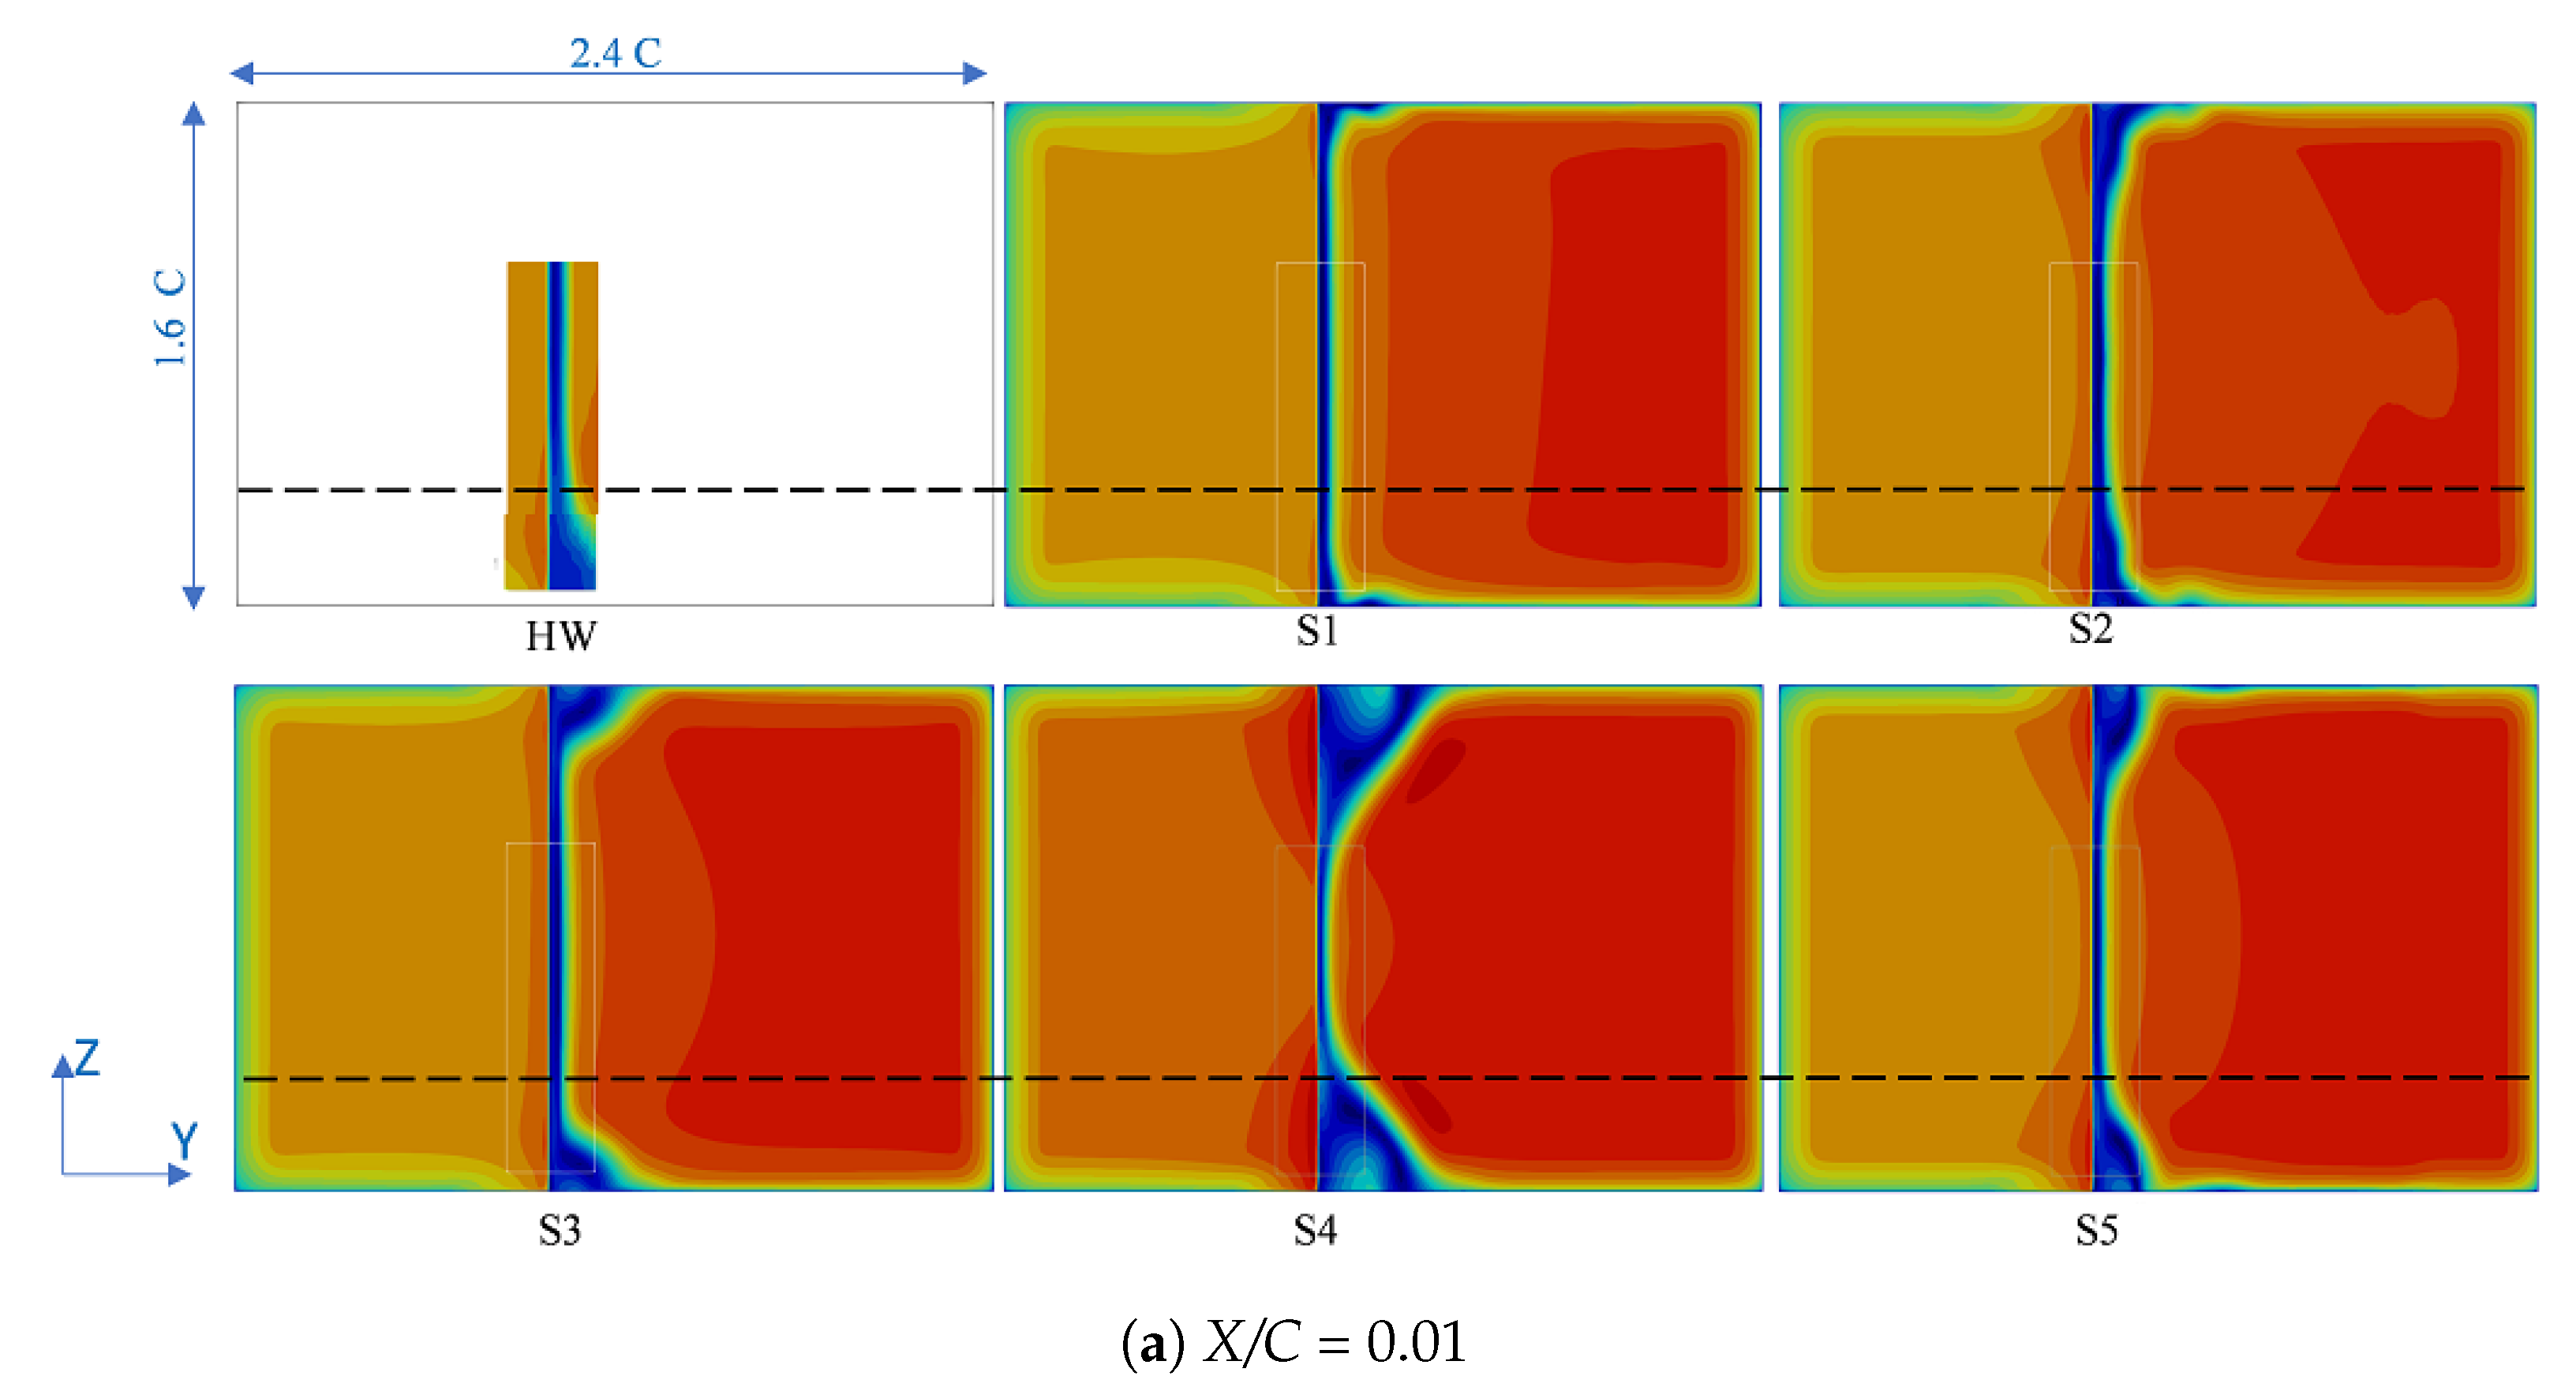
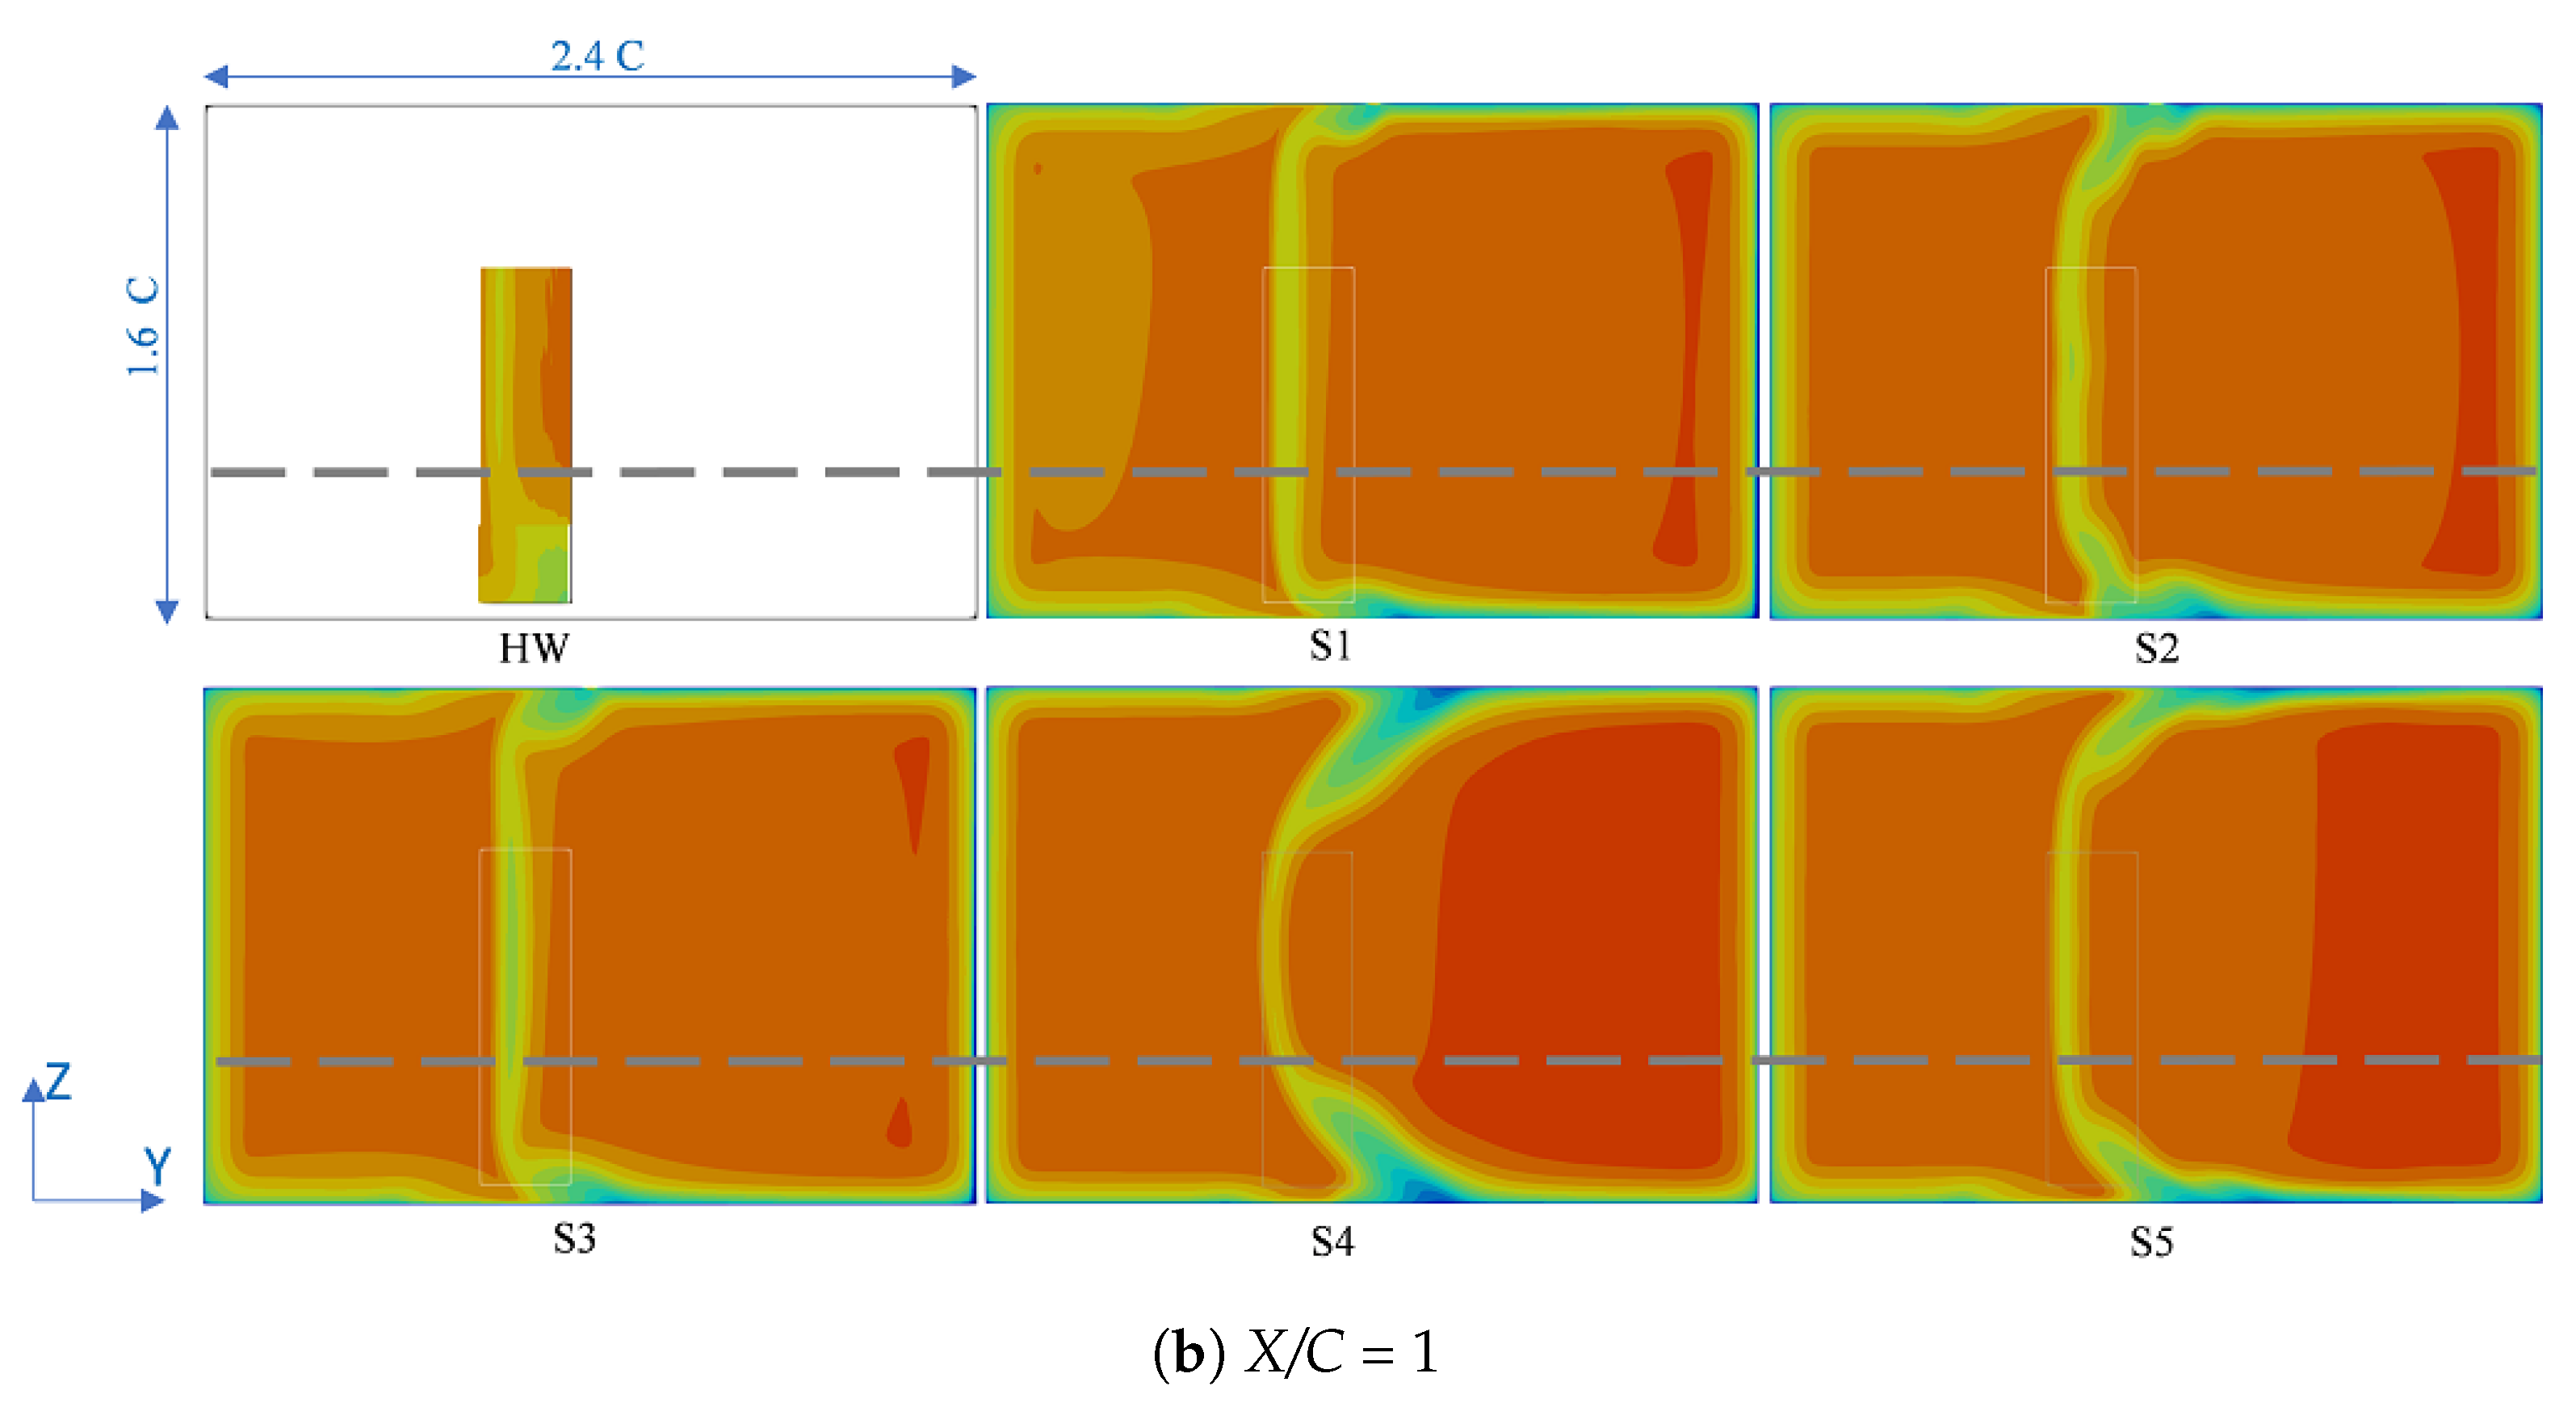
Figure 7.
Flow variations across the wake at different streamwise locations from X/C = 0.002 up to X/C = 3. The corresponding box is marked on the velocity contour plot around the airfoil. At each chart, Y-axis on right-hand side shows the pressure ratio and on left-hand side shows the velocity ratio.

Figure 8.
Velocity field for AOAs of 5°, 8°, 11°, and 14°: CFD contour lines along with EXP colour map. Part of the CFD domain is shown, and the EXP domain is according to Figure 2.
Figure 8.
Velocity field for AOAs of 5°, 8°, 11°, and 14°: CFD contour lines along with EXP colour map. Part of the CFD domain is shown, and the EXP domain is according to Figure 2.
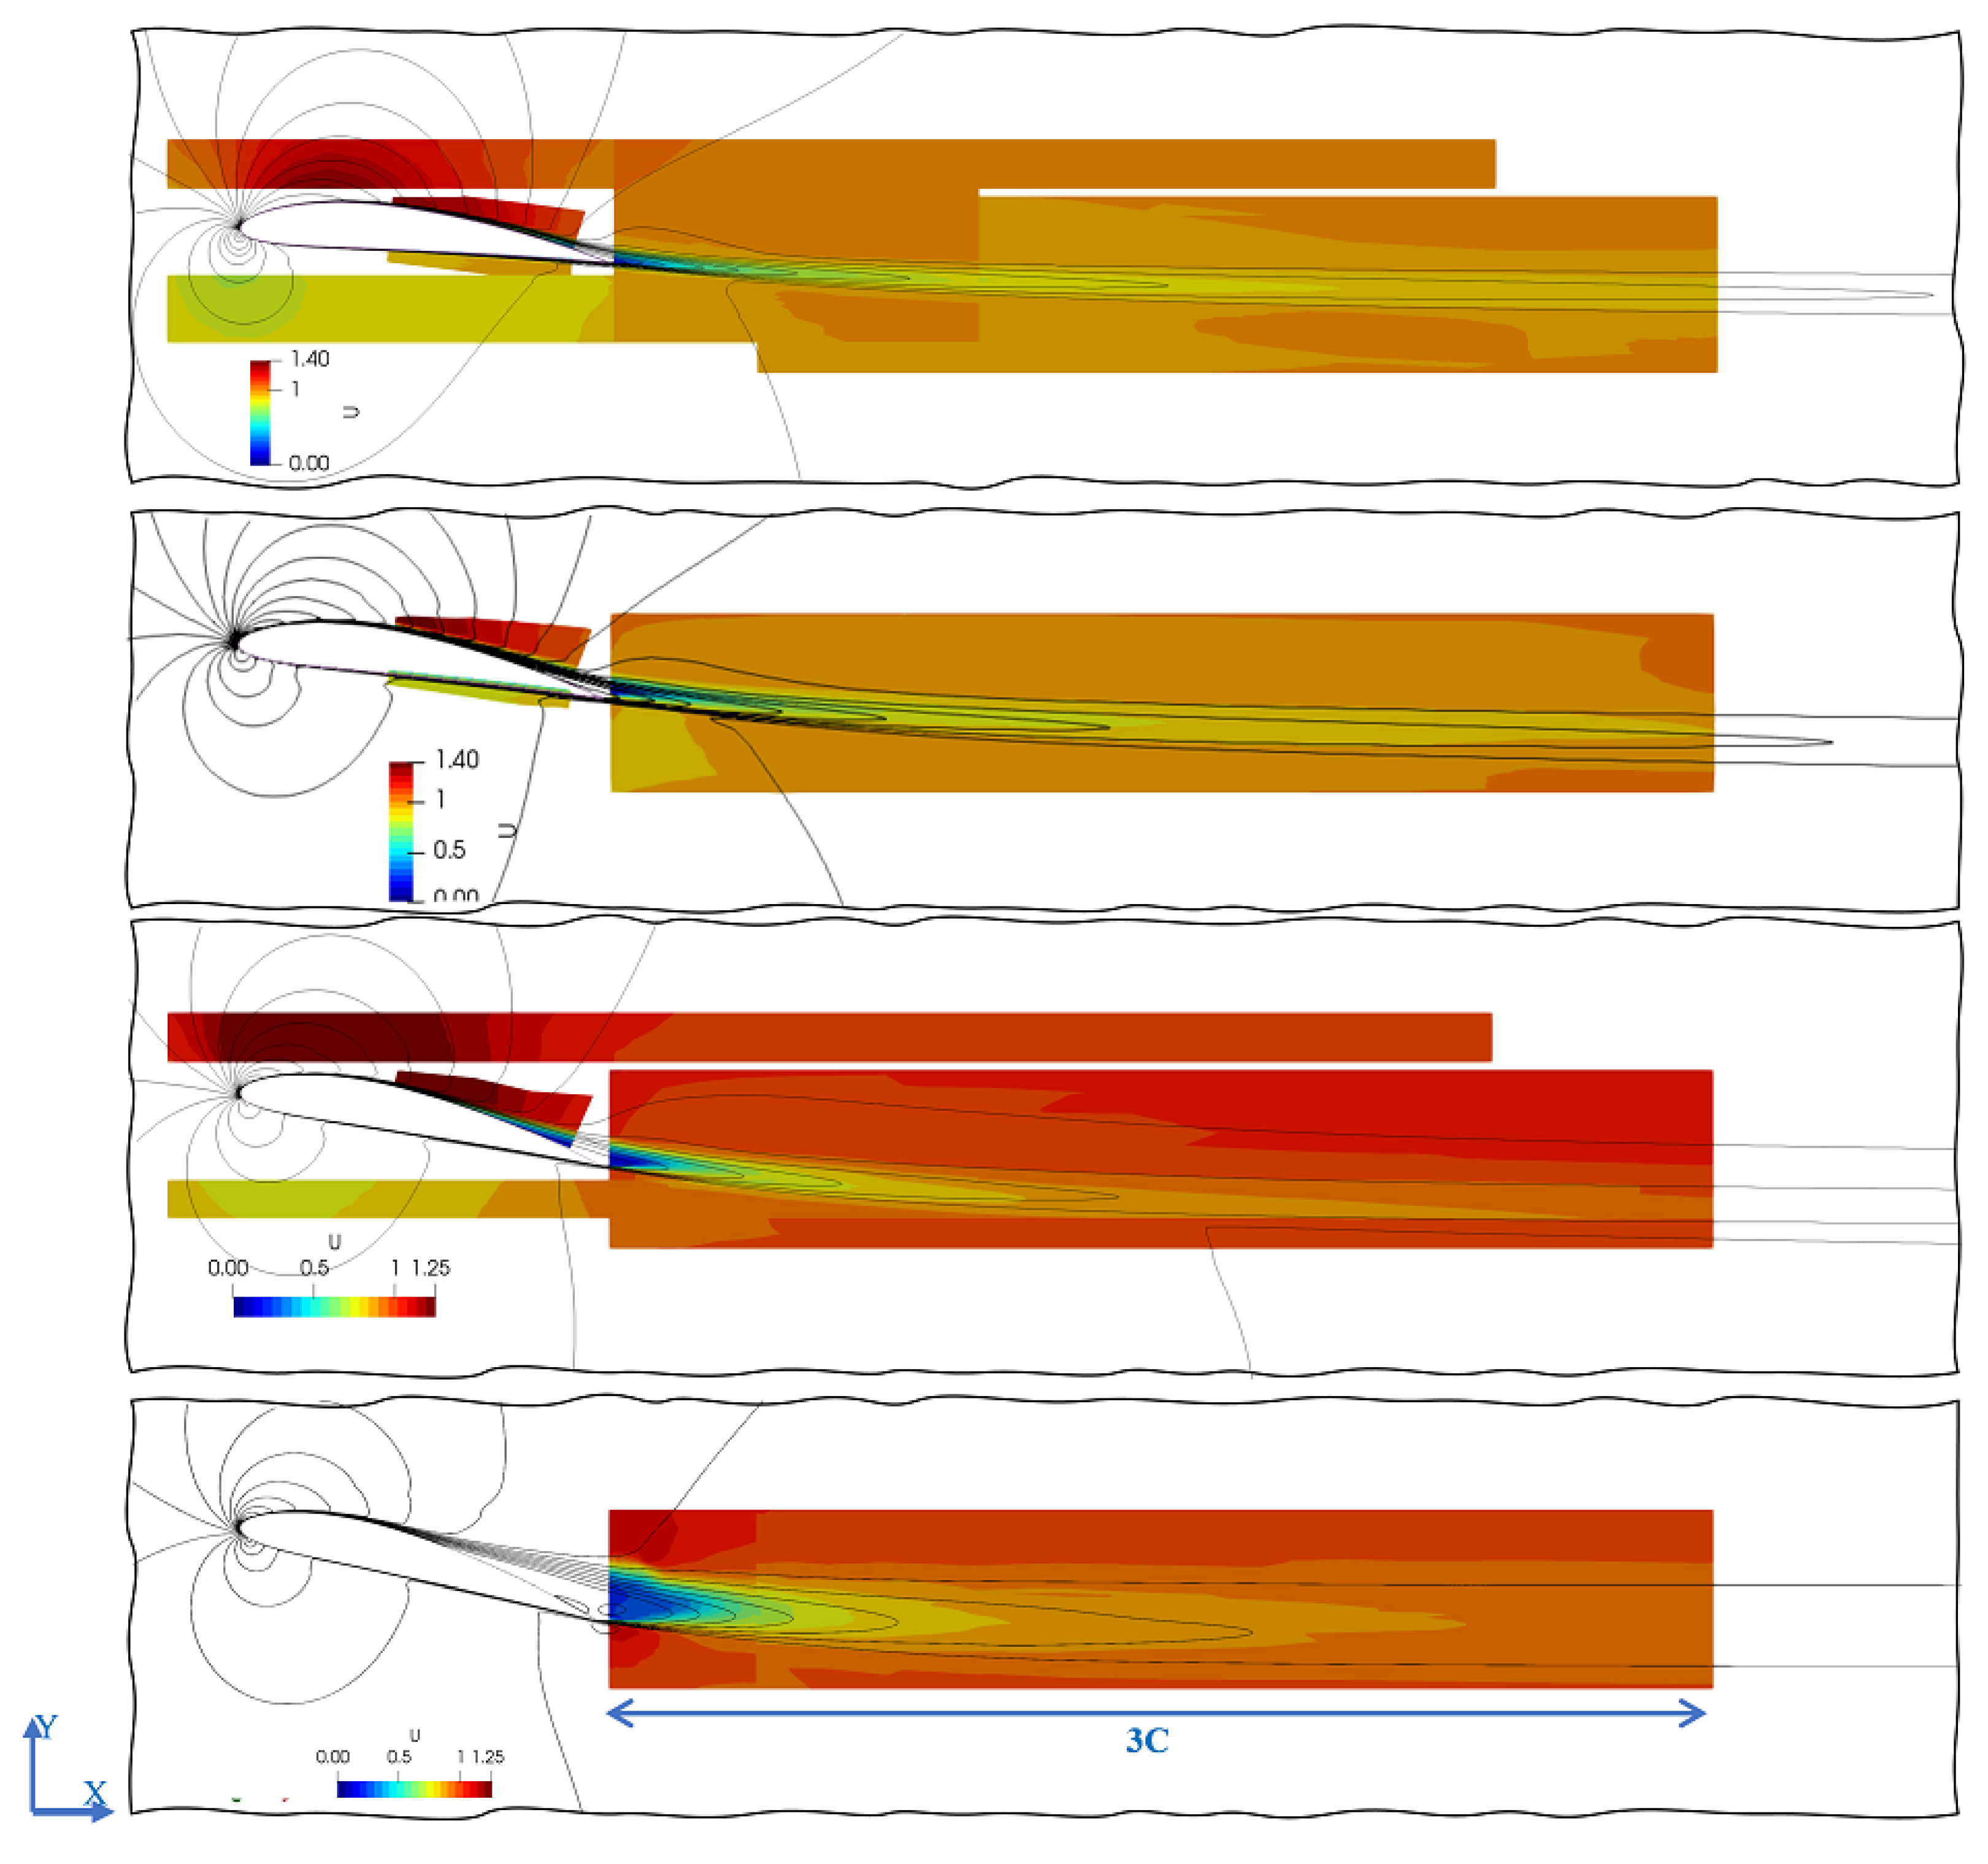
Figure 9.
Velocity characteristics at selected AOA: CFD 3D vs. HW. CFD and LES corroborate the wind-tunnel data, and LES* shows NACA4412 in an unconfined domain at AOA [23].
Figure 9.
Velocity characteristics at selected AOA: CFD 3D vs. HW. CFD and LES corroborate the wind-tunnel data, and LES* shows NACA4412 in an unconfined domain at AOA [23].
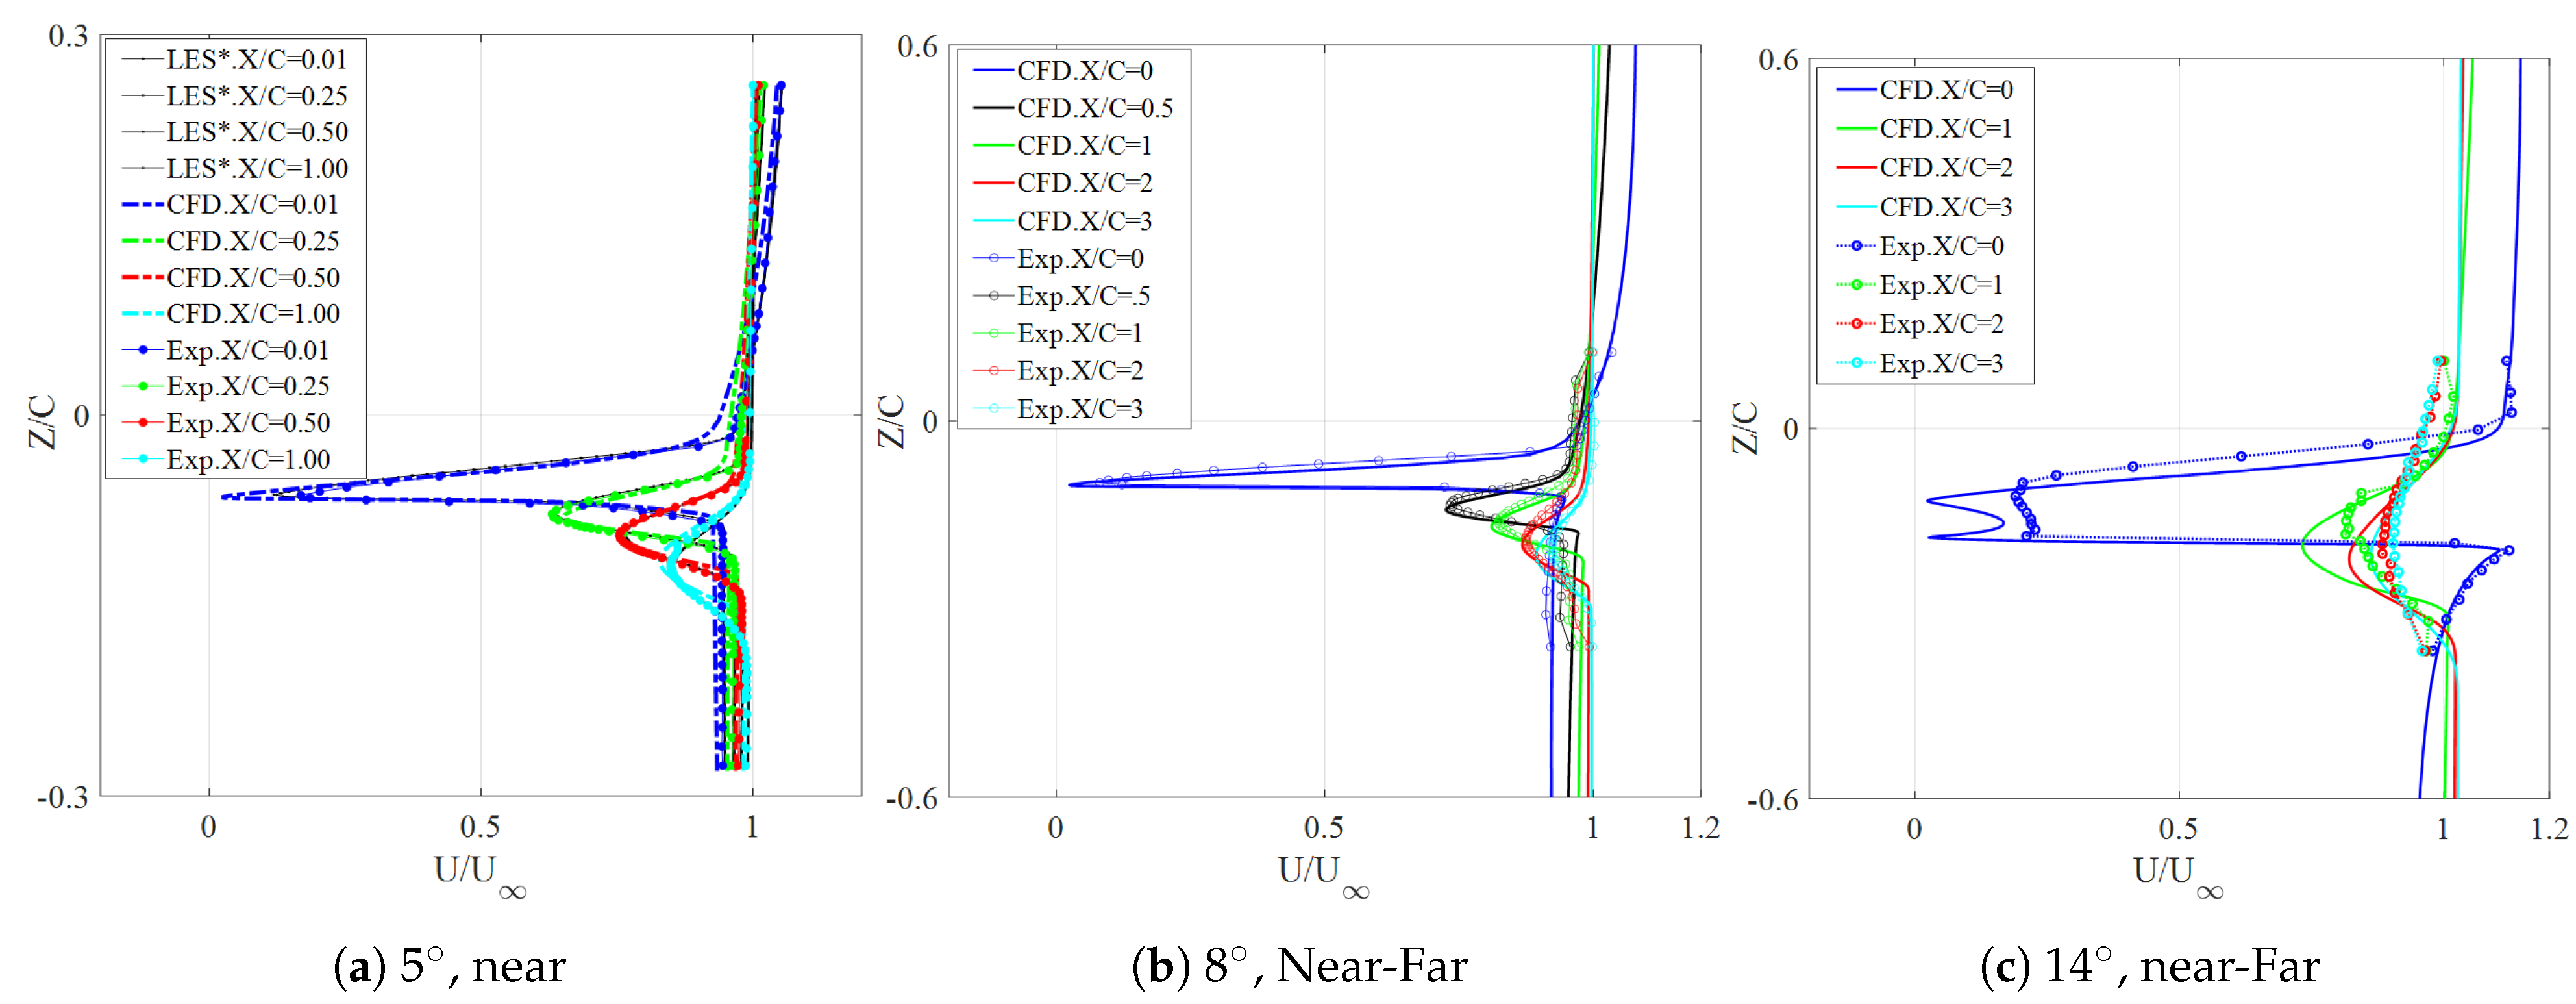
Figure 10.
Contour plot of TKE at AOA : CFD (RANS) vs. EXP (HW). The data is scaled with .
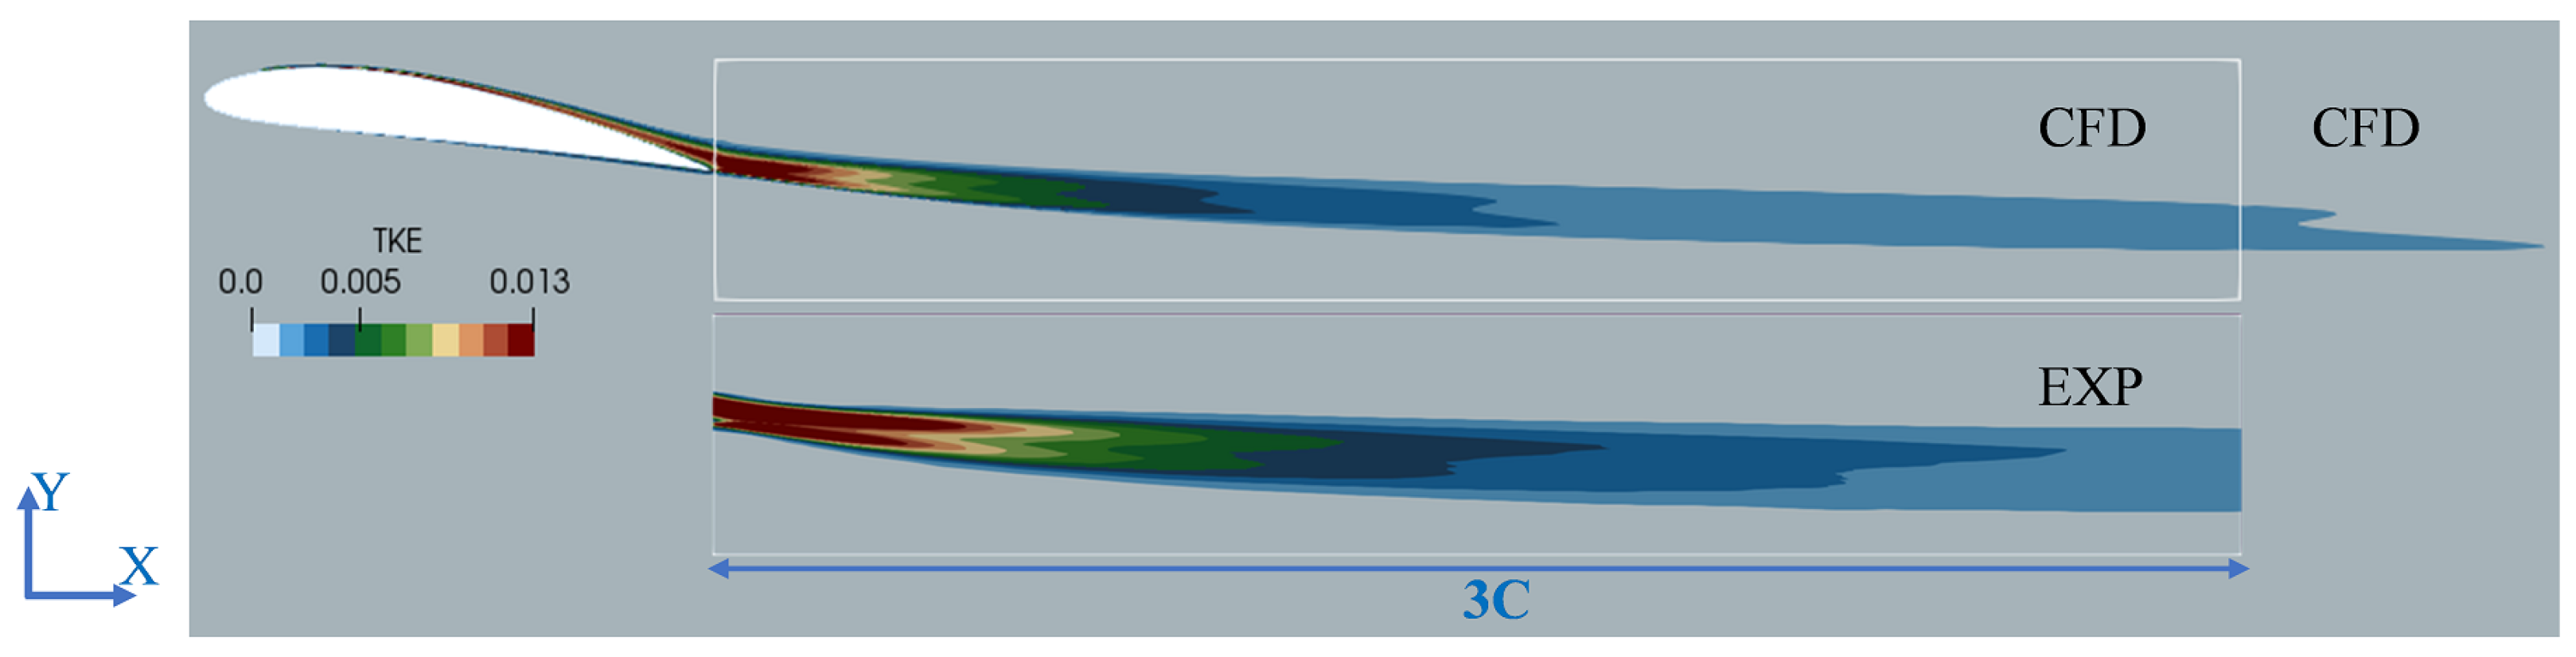
Figure 11.
CFD instantaneous wake at two selected times: t1 and t2 with interval of one period. Airfoil is at AOA , and the flow field is contoured with the normalized streamwise velocity.
Figure 11.
CFD instantaneous wake at two selected times: t1 and t2 with interval of one period. Airfoil is at AOA , and the flow field is contoured with the normalized streamwise velocity.

Figure 12.
Spanwise confinement effect and its variation along the streamwise direction: P contour. The YZ planes are shown at the selected X location (see Figure 1). denotes the TE location. denotes the upstream pressure, where the outlet static pressure is set to zero.
Figure 12.
Spanwise confinement effect and its variation along the streamwise direction: P contour. The YZ planes are shown at the selected X location (see Figure 1). denotes the TE location. denotes the upstream pressure, where the outlet static pressure is set to zero.
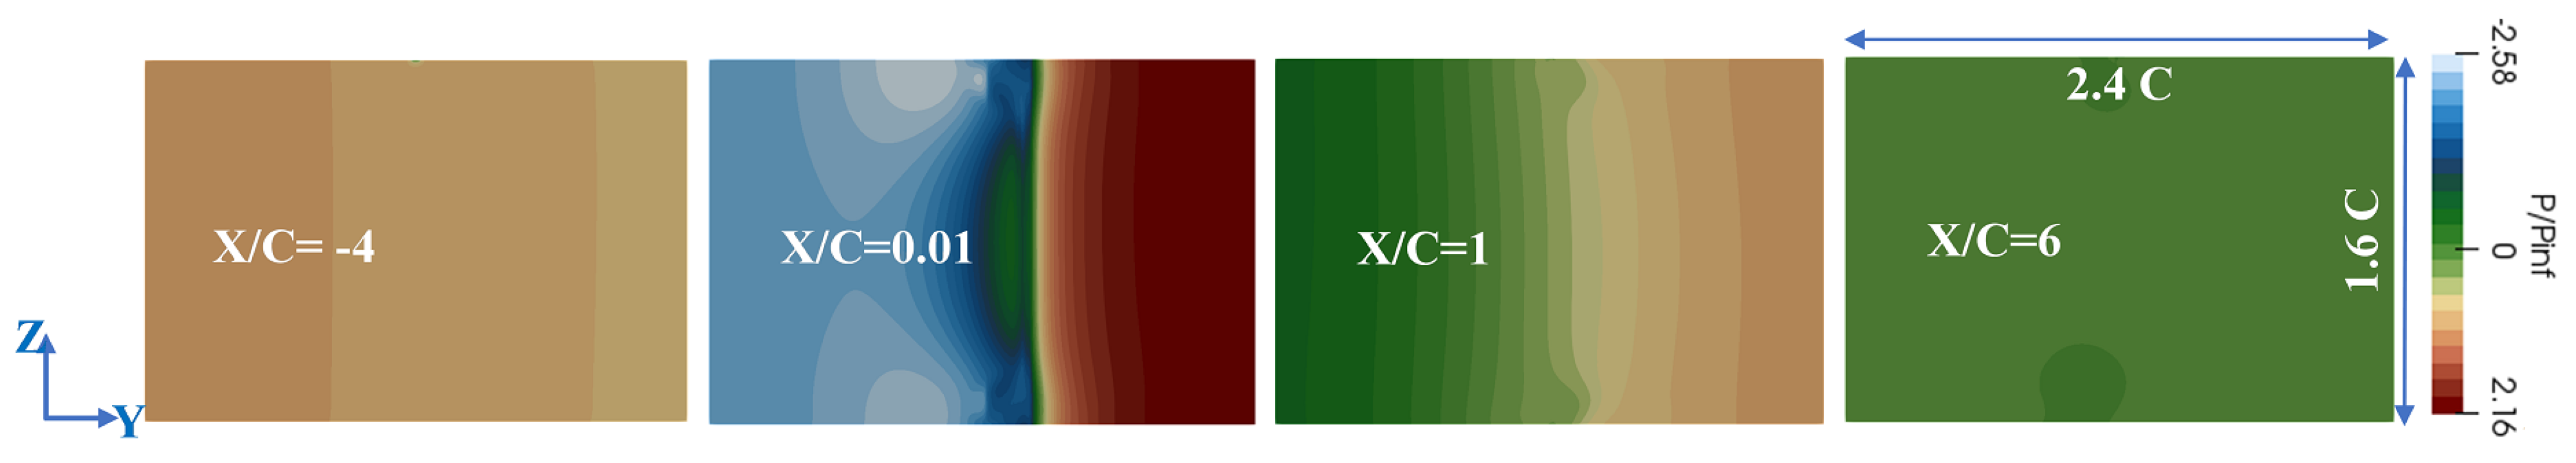
Figure 13.
Wake diffusion along the streamwise direction, plus the spanwise confinement effect with respect to the velocity contour. The YZ planes are shown at the selected X locations, see Figure 1.
Figure 13.
Wake diffusion along the streamwise direction, plus the spanwise confinement effect with respect to the velocity contour. The YZ planes are shown at the selected X locations, see Figure 1.
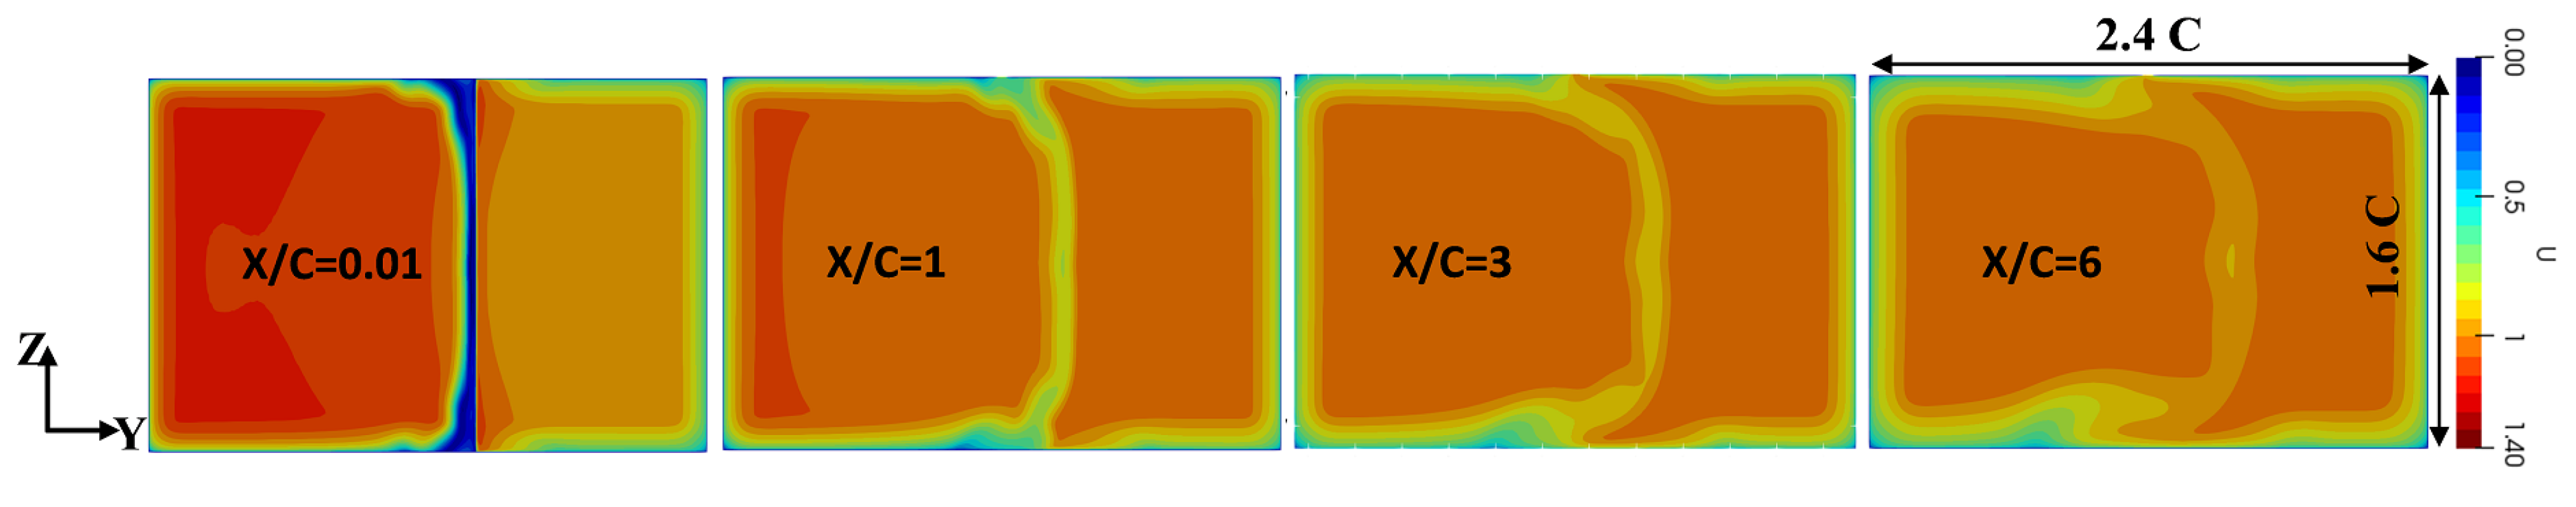
Figure 14.
Three-dimensional effects due to the floor and ceiling via CFD contour lines and tuft visualization at AOA ; (left) (XZ): Suction surface of the wing; (middle) (YZ): wake-plane normal to the streamwise flow at (similar plane as in Figure 12); (right) (XZ): Suction surface of the wing with tuft visualization with the CFD plots in the background. The continuous dashed line shows the same location of the vortex in the three shown panels.

Figure 15.
Wake half-width and velocity deficit nomenclature.
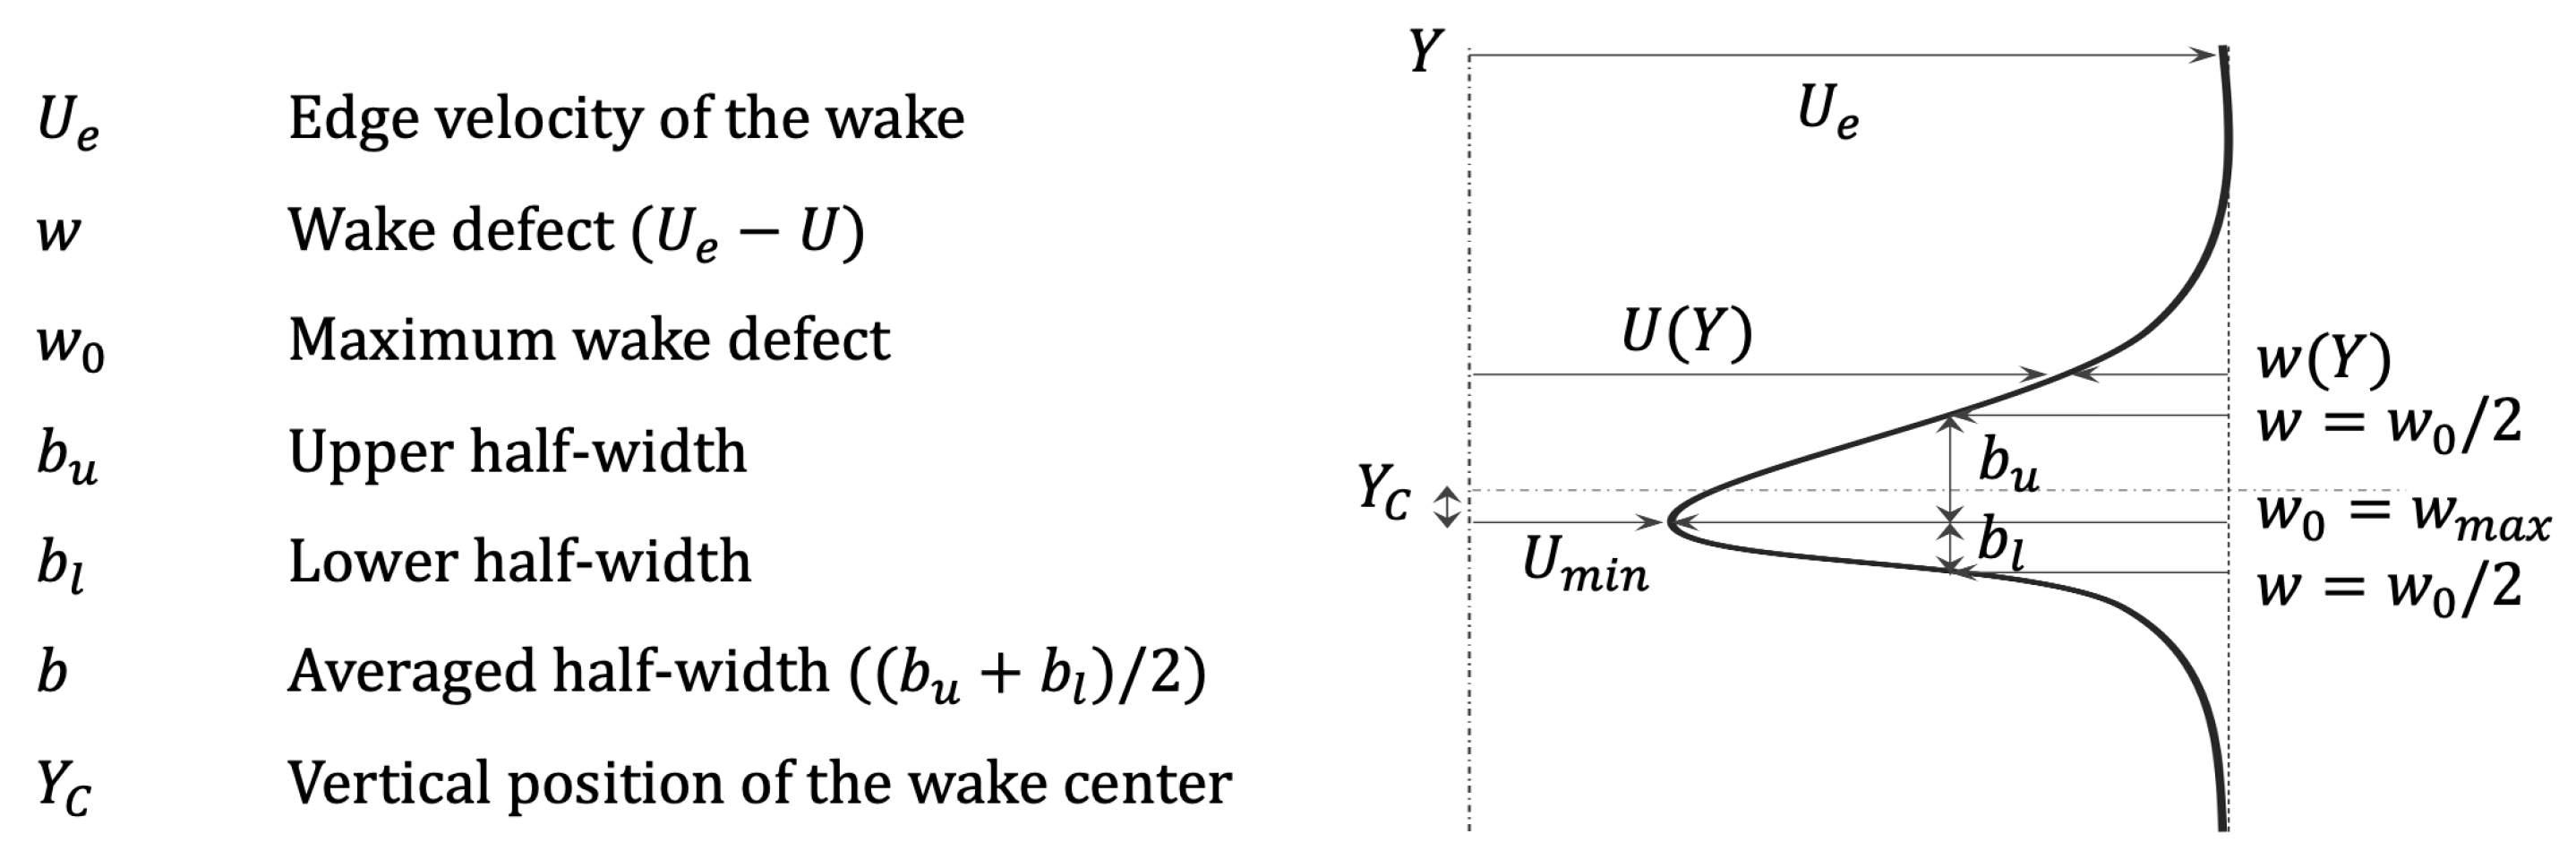
Figure 16.
(a) Normal position (Y) of the wake centre at different AOAs for EXP and CFD data, scaled with the chord length C. (b) Maximum wake deficit for different AOAs according to CFD and EXP. (c) Averaged half-width b for different AOAs according to CFD and EXP.
Figure 16.
(a) Normal position (Y) of the wake centre at different AOAs for EXP and CFD data, scaled with the chord length C. (b) Maximum wake deficit for different AOAs according to CFD and EXP. (c) Averaged half-width b for different AOAs according to CFD and EXP.
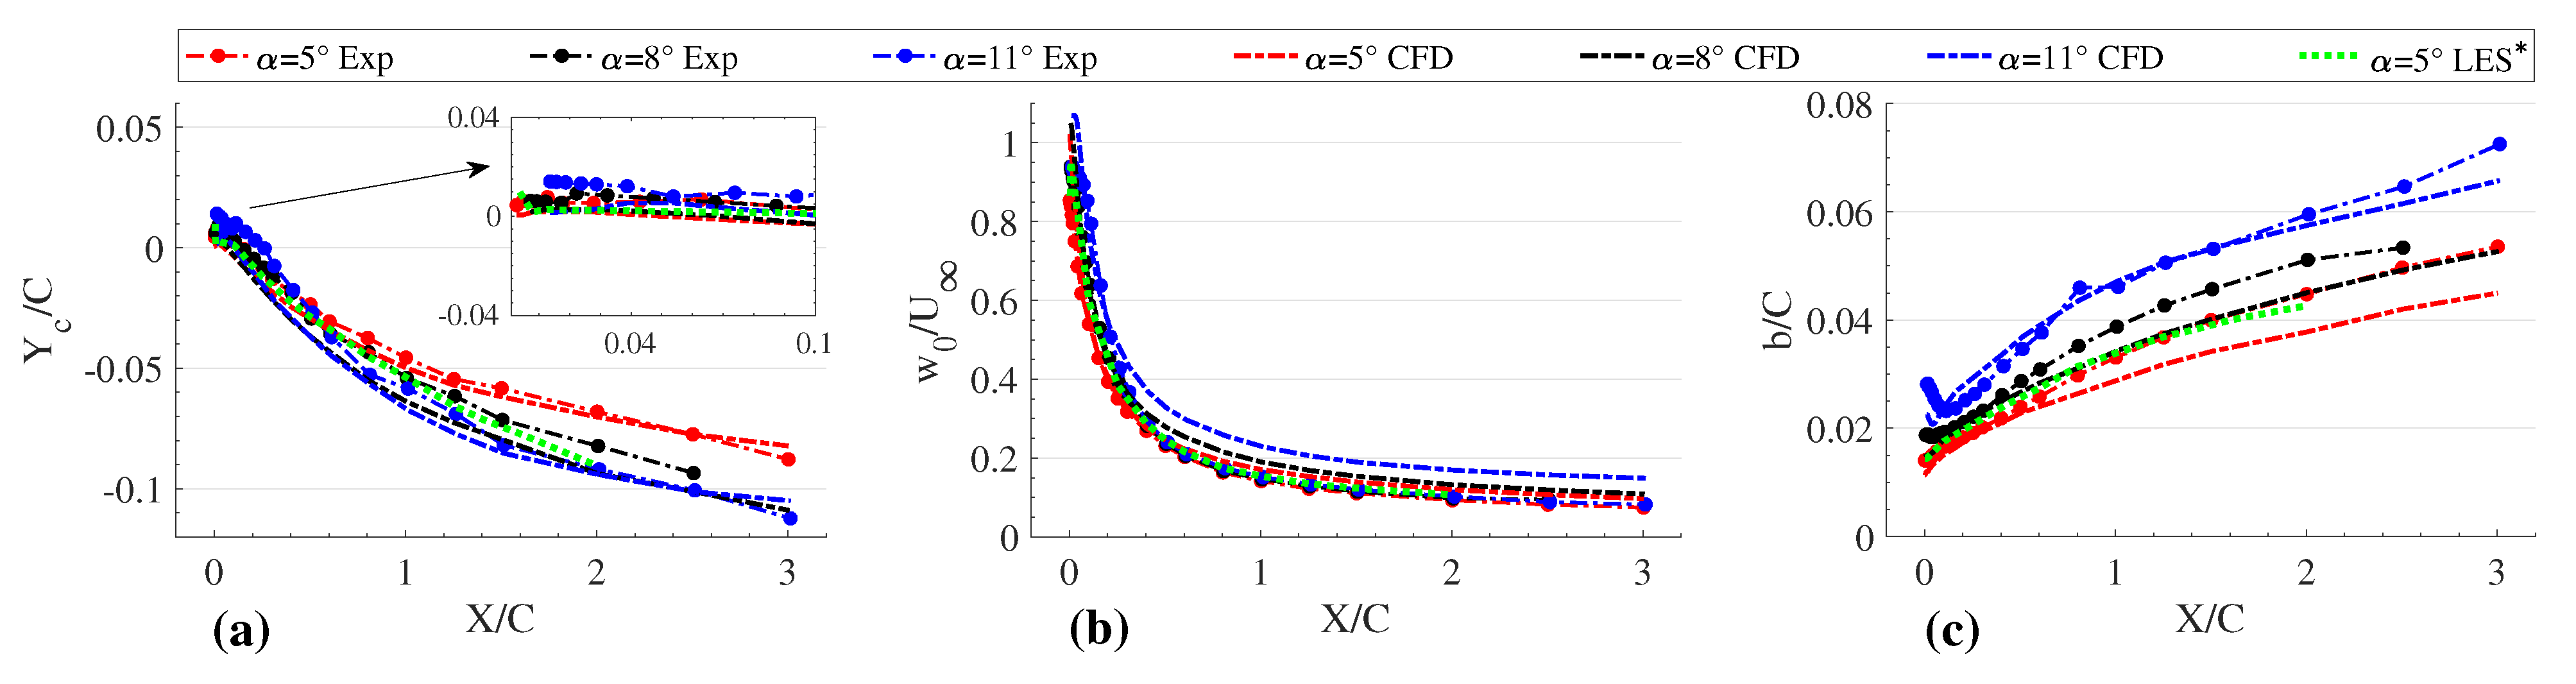
Figure 17.
Gaussian self-similarity of the wake profiles at AOA according to EXP data.

Table 1.
Simulation setups. The ceiling slots are considered to be open and closed. Opening the slot prevents the formation of the BL since there is no wall. The BL control refers to tripping and BL transition, which are discussed in [8].
Table 1.
Simulation setups. The ceiling slots are considered to be open and closed. Opening the slot prevents the formation of the BL since there is no wall. The BL control refers to tripping and BL transition, which are discussed in [8].
| Configuration | Description |
|---|---|
| S1 | Open slot, BL control (2-cm away from the walls) |
| S2 | Open slot, BL control (10-cm away from the walls) |
| S3 | Open slot, No BL control |
| S4 | Closed slot, No BL control |
| S5 | Closed slot, BL control (all through) |
Table 2.
Investigation levels.
| Parameter | Region | Technique | Section in the Paper | |
|---|---|---|---|---|
| 1 | Chordwise distribution | Wing surface at mid-height section | Scanivalve | Section 3 |
| 2 | Wake velocity profile | Mid-height plane (XY) | HW | Section 4 |
| 3 | Instantaneous wake | Mid-height plane (XY) | HW | Section 4.2.1 |
| 4 | Spanwise wake velocity profile | Normal plane (YZ) at different X | HW | Section 3 and Section 4.3 |
| 5 | Surface streamlines | Over the wing upstream of TE | Tuft | Section 4.3 |
Table 3.
Strouhal numbers for vortex shedding.
| Reference | ||
|---|---|---|
| CFD | 0.20 | 0.73 |
| EXP | 0.22 | 0.78 |
| Ref. [26,27] | 0.22 | - |
| Ref. [28] | 0.19–0.21 | - |
| Ref. [29] | 0.20 | - |
| Ref. [32,33] | - | 0.71 |
Table 4.
Spreading rate: different formulations, and S, and different test cases. The D in formula is defined as .
Table 4.
Spreading rate: different formulations, and S, and different test cases. The D in formula is defined as .
| Spreading Rate Criteria | Cylinder | Airfoil | ||||||
|---|---|---|---|---|---|---|---|---|
| Formulation | Method | Pope [13] | Bardina [19] | Fage [45] | Pope [13] | |||
| = | EXP | - | - | 0.37 | 0.28 | 0.30 | 0.33 | - |
| CFD | - | 0.26 | - | 0.25 | 0.25 | 0.26 | - | |
| EXP | 0.08 | - | - | 0.11 | 0.10 | 0.12 | 0.10 | |
| CFD | - | - | - | 0.07 | 0.07 | 0.05 | - | |
| LES | - | - | - | 0.07 | - | - | - | |
Table 5.
Similarity onset according to different variables.
| Self-Similarity Criteria | Onset | Onset | |||||
|---|---|---|---|---|---|---|---|
| Formulation | Method | AOA = | AOA = | AOA = | AOA = | AOA = | AOA = |
| EXP | 0.1 | 0.2 | 0.2 | 0.8 | 0.9 | 0.9 | |
| CFD | 0.3 | 0.2 | 0.2 | 0.9 | 0.9 | 1.0 | |
| LES* | 0.1 | - | - | 0.9 | - | - | |
| () | EXP | 2.5 | 1.6 | 0.9 | 0.3 | 0.3 | 0.5 |
| CFD | 9.5 | 15.2 | 23.0 | 0.1 | 0.1 | 0.1 | |
| LES* | 3.2 | - | - | 0.3 | - | - | |
| S | EXP | 5.1 | 5.1 | 5.3 | 0.2 | 0.1 | 0.1 |
| CFD | 6.3 | 6.3 | 6.3 | 0.2 | 0.2 | 0.2 | |
| LES* | 7.9 | - | - | 0.1 | - | - | |
Publisher’s Note: MDPI stays neutral with regard to jurisdictional claims in published maps and institutional affiliations. |
© 2022 by the authors. Licensee MDPI, Basel, Switzerland. This article is an open access article distributed under the terms and conditions of the Creative Commons Attribution (CC BY) license (https://creativecommons.org/licenses/by/4.0/).
Share and Cite
MDPI and ACS Style
Tabatabaei, N.; Hajipour, M.; Mallor, F.; Örlü, R.; Vinuesa, R.; Schlatter, P. RANS Modelling of a NACA4412 Wake Using Wind Tunnel Measurements. Fluids 2022, 7, 153. https://doi.org/10.3390/fluids7050153
AMA Style
Tabatabaei N, Hajipour M, Mallor F, Örlü R, Vinuesa R, Schlatter P. RANS Modelling of a NACA4412 Wake Using Wind Tunnel Measurements. Fluids. 2022; 7(5):153. https://doi.org/10.3390/fluids7050153
Chicago/Turabian StyleTabatabaei, Narges, Majid Hajipour, Fermin Mallor, Ramis Örlü, Ricardo Vinuesa, and Philipp Schlatter. 2022. "RANS Modelling of a NACA4412 Wake Using Wind Tunnel Measurements" Fluids 7, no. 5: 153. https://doi.org/10.3390/fluids7050153