
On the Application of Wavelet Transform in Jet Aeroacoustics


Dipartimento di Ingegneria, Università Roma Tre, Via della Vasca Navale 79, 00146 Rome, Italy
*
Author to whom correspondence should be addressed.
Fluids 2021, 6(8), 299; https://doi.org/10.3390/fluids6080299
Submission received: 13 July 2021
/
Revised: 17 August 2021
/
Accepted: 18 August 2021
/
Published: 23 August 2021
(This article belongs to the Special Issue Wavelets and Fluid Dynamics)
Abstract
:Wavelet transform has become a common tool for processing non-stationary signals in many different fields. The present paper reports a review of some applications of wavelet in aeroacoustics with a special emphasis on the analysis of experimental data taken in compressible jets. The focus is on three classes of wavelet-based signal processing procedures: (i) conditional statistics; (ii) acoustic and hydrodynamic pressure separation; (iii) stochastic modeling. The three approaches are applied to an experimental database consisting of pressure time series measured in the near field of a turbulent jet. Future developments and possible generalization to other applications, e.g., airframe or propeller noise, are also discussed.
1. Introduction
Wavelet transform is widely used as an efficient tool to extract localized features from random signals, whatever the nature of the analyzed quantity. Indeed, since their introduction in the scientific community, the fields of applications of wavelets have multiplied and include, for example, fluid dynamics, finance, medicine, meteorology, and electronic engineering, to cite just a few. Comprehensive reviews about the wavelet theory and its applications can be found in many reference papers or books, and we refer to the literature for the details (e.g., [1,2]).
During recent decades, wavelet transform has been extensively applied in turbulence to process both experimental and numerical data. The objectives were, for example, the identification of localized intermittent events and their separation from the background (see, e.g., [3,4]), the eduction of coherent structures [5,6,7], the computation of time–frequency correlations [8,9], and the statistical characterization of relevant energetic events (see, among many, [10,11]).
To the extent of jet aeroacoustics, many studies on jet noise carried out in the last 50 years demonstrated that large-scale vortices formed in the shear layer close to the jet exit contribute to the generation of sound radiated to the far field, in particular at low emission angles (see among many, the early paper by Mollo-Christensen [12] and the review given in [13]). The correlation between the intermittent and localized nature of those flow structures and the noise production mechanism has been verified by several authors [14,15,16,17], and it is nowadays recognized that a correct prediction of the jet far-field noise can only be accomplished if such an intermittent dynamic is considered (e.g., [18]).
Within this context, due to their temporally localized nature, wavelet analysis has been applied successfully to extract intermittent sound sources in jet flows. These investigations contributed to the understanding of the physical mechanisms underlying the generation of noise and to the development of reliable predictive models [19,20,21]. Several wavelet-based procedures have been proposed in the past, and the scope of the present paper is to review some of them, focusing on those methods introduced recently by the Fluid Dynamics research group of the University Roma Tre of Rome. The main features of the selected methodologies are briefly worked out in the next section, along with a review of the relevant literature. To better exploit their properties, examples of applications will be given by considering an experimental database consisting of pressure data taken in the near field of a single stream-compressible sub-sonic jet. The experimental set-up is briefly described in Section 3, and explanatory results are presented in Section 4. Conclusions and final remarks are eventually given in Section 5.
2. The Post-Processing Procedures
The wavelet decomposition allows for the simultaneous representation of a temporal signal in terms of a time shift (t) and a resolution time scale (s) whose inverse corresponds to the frequency (f).
Formally, the wavelet transform w(s, t) of a signal p(t) at the resolution time scale s is given by the following expression:
where CΨ denotes a coefficient that accounts for the mean value of Ψ(t), the so-called Mother Wavelet. The integral represents a convolution between p(t) and the dilated and translated complex conjugate counterpart of Ψ(t). The wavelet transform thus amounts to an ensemble of coefficients resulting from the projection of the original signal onto a basis composed of functions which are the translated and stretched version of the Mother Wavelet.
Conceptually, the procedure is analogous to the Fourier transform, whose basis is represented by trigonometric functions. A common feature among Wavelet and Fourier transform can be found in the so-called wavelet scalogram that is given by the square of the wavelet coefficients. It provides a decomposition of the energy, or Fourier modes, onto the (s, t) plane and, as reported in [4], represents a localized counterpart of the standard Fourier spectrum that can be recovered by a simple integration in time.
A normalized version of the scalogram is given by the so-called Local Intermittency Measure (LIM) (see, e.g., [4,10]) that is defined as follows:
where the symbol <●> denotes a time average. Peaks of the LIM higher than 1 represent events with energy larger than the mean. Therefore, the LIM amplitude at a selected scale s, can be thresholded in order to select events associated with large energy.
Several wavelet-based approaches based on the computation of the scalogram and the LIM have been introduced in literature with the scope of analyzing pressure data obtained in jet flows. Among different techniques, we shall focalize on three classes of processing procedures: (i) conditional sampling; (ii) acoustic–hydrodynamic pressure separation; (iii) stochastic modeling. Their main features are briefly worked out in the following, along with the relevant literature, where more details about the methodologies and their validation can be found.
It should be pointed out the results achieved from these methods are not dependent upon the choice of the wavelet type. The techniques are based on the selection of events on the basis of energetic criteria determined from the computation of the scalogram or of the LIM. Therefore, no correlation exists between the choice of the wavelet type (and thus of its shape) and the events to be identified.
2.1. Conditional Sampling
Camussi and Guj [10] introduced a coherent structures identification procedure based on the idea that the passage of a flow structure of a characteristic size ri at the instant tk should induce a burst in the LIM at the corresponding time-scale location. The LIM can be thresholded by fixing a proper trigger level T, and the relative maxima which satisfy the condition LIM(ri, tk) > T can be selected.
The selected time instants tk corresponding to the occurrence of the energetic events can be used to perform a conditional averaging of the original signal used to compute the LIM. For a generic signal a(t), the ensemble average can be formalized as follows:
where Ne is the number of events corresponding to the condition LIM(ri, tk) > T. Δt is a proper time window dependent on the estimated persistence of the effect of the detected event while is the time instant where the ensemble average of the signal segments is centered. The order of magnitude of Δt should be selected greater than the integral time scale of the signal.
If the signal analyzed is the pressure, the ensemble-averaged signature can be associated with noise-generation events. In the present work, the conditioning procedure is applied to near-field pressure signals, showing how relevant the dependence of the shape of the averaged pressure signatures is upon the distance from the jet exit as an effect of the different flow physics related to the jet flow evolution. Indeed, close to the jet exit, the flow physics is dominated by the Kelvin–Helmholtz instability mode, inducing quasi-periodic pressure oscillations, whereas in the region far downstream, a fully turbulent state is reached.
2.2. Acoustic–Hydrodynamic Pressure Separation
The procedure applied therein has been proposed for the first time by Grizzi and Camussi [21] and then successively developed by Mancinelli et al. [22]. They assumed that the hydrodynamic contribution related to localized eddy structures compresses well onto a wavelet basis so that it can be described by a few but with large amplitude wavelet coefficients. Thus, the so-called pseudo-sound (i.e., the hydrodynamic component of pressure fluctuations) can be extracted by selecting the wavelet coefficients exceeding a proper threshold. The acoustic counterpart associated with more homogeneous and low-energy fluctuations is represented by those coefficients having an amplitude lower than the threshold. A crucial role in the procedure is thus played by choice of the threshold that has to be identified on the basis of proper physical assumptions. The methods proposed so far actually differ in the way the threshold is selected.
The two wavelet sets, once selected, are inverse-transformed, allowing for the reconstruction of acoustic and hydrodynamic pressure time series. This is the main advantage in using a wavelet-based procedure rather than more standard Fourier-based separation approaches.
Grizzi and Camussi [21] proposed to select the threshold level based on the computation of a cross-correlation and the estimation of a phase. The signals to be correlated are taken from two microphones positioned in the near field of the jet and aligned with the flow direction. An iterative process is applied to determine a proper threshold that provides the correct phase between the acoustic and the hydrodynamic pressure components. The advantage of this method with respect to previous approaches was mainly in the simplicity of the required set-up. Indeed, only two microphone signals (or pressure time series from numerical simulations) are needed in the near field, acquired (or computed) simultaneously in two positions sufficiently close to each other.
If the near-field pressure is measured from a single probe or/and the far-field pressure is taken simultaneously, other wavelet-based separation methods can be applied, as detailed in [22].
The first of those procedures (denoted as WT1) accomplishes the separation through the estimation of the cross-correlation between near and far-field pressures measured (or computed) simultaneously. It is expected that the near-field acoustic pressure correlates well with the far-field noise, whereas the hydrodynamic counterpart does not. This technique is potentially quite robust because no assumptions are made on the statistics of the acoustic field. However, it requires the use of a transducer in the far field that is not always possible (this is the case, for example, of applications in water).
In the second method (WT2), the near-field acoustic pressure is extracted through an iterative process based on the degree of similarity between the probability density functions of the far-field pressure fluctuations with a Gaussian distribution. The application of such a procedure requires only one microphone in the near field, but it is based on the aprioristic assumption of the Gaussianity of the acoustic pressure that has not yet been fully demonstrated.
The third method (denoted as WT3) also requires only one pressure signal in the near field. In this approach, the hydrodynamic pressure is filtered through the application of the technique proposed by [23] for the extraction of coherent structures in a vorticity field. The separation process is again performed by selecting wavelet coefficients overcoming a threshold that is selected according to statistical conjectures usually adopted in de-noising procedures. More specifically, the threshold level, starting from an initial guess, is iteratively evaluated according to the following formula:
where is the variance of the (presumed) acoustic pressure at iteration I and N is the number of samples. The iterative process stops when, at each iteration, the number of selected acoustic wavelet coefficients remains constant.
2.3. Stochastic Modeling
The results reported by Kearney-Fischer et al. [24,25] support the idea that intermittent events are the dominant feature of jet noise. They applied a method to extract the events relevant for jet noise and developed stochastic models to reproduce their statistics in both the physical and Fourier domains.
A similar approach was adopted by Camussi et al. [26,27], who used wavelet transform to select intermittent events from experimental data and proposed stochastic models to reproduce their relevant statistics. Those wavelet-based procedures are based on the identification of traces of highly energetic events that appear intermittently in time and have variable strength. These approaches are included in the investigations presented therein.
The main ingredient is the computation of the LIM at a reference frequency or scale. In jets, in the region close to the nozzle exit, a bump in the pressure Fourier spectra can be clearly identified, especially for laminar exit conditions. It is the trace of the Kelvin–Helmholtz instability mode, and the corresponding frequency is hereinafter denoted as fKH. In the proposed procedure, the LIM is computed at the wavelet scale corresponding to fKH, and the condition LIM > 1 is used to identify intermittent events having a local energy greater than the average.
From the set of selected events, two relevant indicators are computed: the so-called intermittent time, Δt, representing the waiting time between successive events, and the amplitude A, representing the event energy amplitude and retrieved from the square of the corresponding wavelet coefficient.
The papers by Camussi et al. [26,27] report a detailed characterization of the statistics of these two indicators and propose stochastic models to reproduce their Probability Distribution Functions (PDFs). The models provide analytical approximations of the PDFs using a hyperbolic secant for the intermittent time and a pure decaying exponential function for the amplitude. The adopted functional forms are detailed below:
where and are the random variables normalized with respect to their standard deviations. The amplitudes of the coefficients a and b are given in [27].
The models have been demonstrated to also apply to numerical data and to predict the statistics correctly in different flow conditions [28]. In the present paper, we present further examples of the application of this procedure.
3. Experimental Set-Up
The experimental data analyzed therein have been acquired in the near field of a compressible jet installed in the semi-anechoic chamber available at the Laboratory of Fluid Dynamics “G. Guj” of the Department of Engineering of the University Roma Tre of Rome. Details about the facility and the instrumentation can be found in [21,26]; here, we briefly report the main features.
The single-stream jet has an exit diameter D of 0.012 m, and the Mach number M is varied from 0.5 to 0.9. Near-field pressure measurements have been carried out using one 1/4” 4135 Bruel and Kjaer microphone installed close to the jet axis and connected to a B&K Nexus 2690 signal conditioner. Signals were acquired through a Yokogawa Digital Scope DL708E, setting the sampling frequency to 500 kHz for a number of samples (per each position) of 4 × 10⁶. The microphone is positioned in several locations in the near field of the jet flow. The axial distance (x) from the jet exit is varied from 0 to 20D with a step of 1D and the radial distance (r) from 1D to 3D with a step of 0.5D. Only a few of those positions will be analyzed therein with the scope of demonstrating the validity of the wavelet-based procedures presented above and addressing physical outcomes related to the noise sources.
4. Results
Figure 1 shows an example of the LIM distribution computed from a portion of a pressure signal recorded in the vicinity of the turbulent jet. It is evident that energy is unevenly distributed, and spots corresponding to very large LIM amplitudes can be readily identified at different frequencies, corresponding to different scales.
The Fourier spectrum obtained by the standard PWelch procedure and the one reconstructed through the integration of the wavelet scalogram are compared in Figure 2. The symbol St denotes the Strouhal number representing the non-dimensional frequency (obtained using D, the jet diameter, and U, the mean jet exit velocity, as reference length and velocity scales, respectively).
The agreement is very good, and, according to [4], the wavelet spectrum shows an even better statistical convergence at high frequencies, whereas at low frequencies, due to the compactness of the wavelet base, the Fourier transform applies better.
The conditional sampling procedure outlined in Section 2.1 has been applied to the pressure data, and examples are reported in Figure 3. The plots refer to M = 0.5, r/D = 1 and different x/D. It can be observed that for small x/D the pressure averaged signature exhibit an oscillatory trend as a trace of the Kelvin–Helmholtz instability that dominates the flow behavior in the vicinity of the jet exit. To this extent, it has been checked that the period of oscillations corresponds to the inverse of fKH. For increasing x/D, the oscillations amplitude decreases and, in the transitional region, the averaged pressure has a positive peak that can be ascribed to the effect of vortex pairing and braid formation, which may induce a velocity defect and thus a pressure increase (see [29,30]). At x/D larger than about 10, a fully developed turbulent state is reached, and a clear averaged pressure signature is no longer observed.
The results reported in Figure 4 replicate those of Figure 3 but at higher M (M = 0.9). It is shown that the overall evolution changes significantly. At low x/D, the averaged pressure does not show any oscillations but rather a concentrated spike. This result seems to suggest that, in terms of pressure energy, at high M, the Kelvin–Helmholtz mode does not significantly influence the near field pressure, even in the region very close to the jet exit. For increasing x/D, the peak intensity decreases, but a positive bump is present even in the fully turbulent region.
The physical reasons behind the relevant differences observed at low and high M are not apparent, and further investigations are surely needed to clarify this interesting point.
As pointed out in [21,31], in the region close to the jet exit, the energy associated with the hydrodynamic pressure fluctuations, the so-called pseudo-sound, dominates the low-frequency range of the pressure Fourier spectra, whereas the acoustic counterpart is relevant only at high frequencies. The wavelet-based techniques described in Section 2.2 can separate the acoustic pressure from the hydrodynamic one even though its energy is very low and concentrated at high frequencies.
Examples are reported in Figure 5 for M = 0.5, r/D = 1 and two different x/D. The results are obtained by applying the method WT3 that provides efficient separation of the sound and pseudo-sound contributions, considering only one signal. It can be observed that, according to [22], the energy hump of the hydrodynamic contribution moves to low frequencies as the axial distance from the nozzle exhaust increases, such behavior being ascribed to the development of larger and larger turbulent structures in the jet plume. On the other hand, the energy level of the acoustic component, concentrated at high frequencies, decreases for increasing x/D according to the results reported in [21,22].
The effect of Mach number is investigated in Figure 6, where two cases at M = 0.9 are reported. It is confirmed that the jet separation technique applies well also at high subsonic M, and a weaker dependence of both the hydrodynamic and acoustic spectra shape upon the axial position is observed. By comparing Figure 6 with Figure 5, it is also observed that the increase of the Mach number does not considerably affect the amplitude of the pseudo-sound spectra, whereas the amplitude of the acoustic spectra increases significantly, demonstrating that the acoustic pressure is much more sensitive to the Mach number variations than the hydrodynamic one.
The spectra reported above clearly show that at low x/D, a bump in the power spectra is present at a frequency that corresponds to low St (around 0.1). This is the trace of the Kelvin–Helmholtz instability, and, as pointed out in Section 2.3, the corresponding wavelet scale is selected for the computation of the LIM. From the set of selected events, the intermittent time Δt and the amplitude A are extracted, and their PDFs are predicted by the stochastic models proposed in [26]. Examples of the predictive capability of the models are reported in Figure 7 and Figure 8 for the intermittency time and the amplitude, respectively. The analytical forms of the PDFs (the continuous red lines) are the ones proposed in [26], and the agreement with the experimental data is very good. It can be concluded that the proposed stochastic models can accurately reproduce the dynamics of the flow structures responsible for the bump in the Fourier pressure spectra at the Kelvin–Helmholtz frequency, those structures being directly correlated with the noise-generation mechanism.
5. Conclusions
This paper presents examples of the successful application of wavelet transform in the study of jet noise. Among different approaches proposed in the literature, the present investigation is focalized on procedures proposed recently by Camussi and co-workers (the main reference papers are [10,21,26]). The effectiveness of the methods is demonstrated by their application to an experimental database consisting of pressure time series acquired in the vicinity of a single-stream compressible jet.
The first technique discussed therein consists of a conditional sampling procedure that provides the identification of averaged signatures of the events responsible for the generation of pressure fluctuations that are the most relevant in terms of their energy content. The averaged shape of those highly energetic events is shown to depend greatly upon the distance from the jet exit and on the Mach number as an effect of the different flow physics occurring in the jet flow during its evolution from the jet exit to the fully turbulent conditions at large x/D.
The second method provides a separation between the hydrodynamic and acoustic pressure from signals taken close to the jet flow. In these cases, the two components, often denoted as sound and pseudo-sound, are mixed and cannot be extracted using standard Fourier-based procedures. It is shown that the separation technique also successfully applies in regions where the hydrodynamic contribution is dominant.
The selection of events based on energetic criteria is also the origin of the third technique that provides stochastic modeling of the intermittent time and of the events’ amplitude. The analytical models proposed in the literature are shown to apply well and to provide reliable predictions of the PDFs of these quantities.
Some of the techniques reported above have been applied in other configurations out of jet aeroacoustics. Worth to be mentioned are, for instance, the analysis of the pressure field in the vicinity of a cylinder [32], the investigation of thermo-acoustic instabilities in burners [33], or the extraction of intermittent features in flames [34]. Additionally, of interest is the application of the methods in the field of airframe noise, where the techniques presented in [22] are applied in [35] for characterizing the noise emitted by landing gears. In this framework, the methods denoted as WT1 and WT3 are demonstrated to be very efficient.
Future applications may include the study of propeller noise where wavelets can be very useful for separating the tonal components, identified at the Blade Passing Frequencies (BPF), from the broadband component associated, for example, to turbulence or local flow separations. The use of wavelets for these purposes is currently underway by the authors and, hopefully, will be the subject of future publications.
Author Contributions
Conceptualization, R.C. and S.M.; methodology, R.C. and S.M.; software, S.M.; validation, S.M.; data analysis, S.M.; figures production, S.M.; writing—original draft preparation, R.C.; writing—review and editing, R.C. All authors have read and agreed to the published version of the manuscript.
Funding
This research received no external funding.
Data Availability Statement
The data presented in this study are available on request from the authors.
Conflicts of Interest
The authors declare no conflict of interest.
References
- Mallat, S. A theory for multiresolution signal decomposition: The wavelet representation. IEEE Trans. Pattern Anal. Mach. Intell. 1989, 11, 674–693. [Google Scholar] [CrossRef] [Green Version]
- Daubechies, I. Ten Lectures on Wavelets; SIAM: Philadelphia, PA, USA, 1992. [Google Scholar]
- Meneveau, C. Analysis of turbulence in the orthonormal wavelet representation. J. Fluid Mech. 1991, 232, 469–520. [Google Scholar] [CrossRef]
- Farge, M. Wavelet transforms and their applications to turbulence. Ann. Rev. Fluid Mech. 1992, 24, 395–457. [Google Scholar] [CrossRef]
- Camussi, R.; Di Felice, F. Statistical properties of vortical structures with spanwise vorticity in zero pressure gradient turbulent boundary layers. Phys. Fluids 2006, 18, 035108. [Google Scholar] [CrossRef]
- Bonnet, J.P.; Delville, J.; Glauser, M.N.; Antonia, R.A.; Bisset, D.K.; Cole, D.R.; Fiedler, H.E.; Garem, J.H.; Hilberg, D.; Jeong, J.; et al. Collaborative testing of eddy structure identification methods in free turbulent shear flows. Exp. Fluids 1998, 25, 197–225. [Google Scholar] [CrossRef]
- Farge, M.; Schneider, K. Coherent Vortex Simulation (CVS), A Semi-Deterministic Turbulence Model Using Wavelets. Flow Turbul. Combust. 2001, 66, 393–426. [Google Scholar] [CrossRef]
- Camussi, R.; Robert, G.; Jacob, M.C.; Camussi, R.; Robert, G.; Jacob, M.C. Cross-wavelet analysis of wall pressure fluctuations beneath incompressible turbulent boundary layers. J. Fluid Mech. 2008, 617, 11–30. [Google Scholar] [CrossRef] [Green Version]
- Mancinelli, M.; Di Marco, A.; Camussi, R. Multivariate and conditioned statistics of velocity and wall pressure fluctuations induced by a jet interacting with a flat plate. J. Fluid Mech. 2017, 823, 134–165. [Google Scholar] [CrossRef]
- Camussi, R.; Guj, G. Orthonormal wavelet decomposition of turbulent flows: Intermittency and coherent structures. J. Fluid Mech. 1997, 348, 177–199. [Google Scholar] [CrossRef]
- Guj, G.; Camussi, R. Statistical analysis of local turbulent energy fluctuations. J. Fluid Mech. 1999, 382, 1–26. [Google Scholar] [CrossRef]
- Mollo-Christensen, E. Jet noise and shear flow instability seen from an experimenter’s viewpoint. J. Appl. Mech. 1967, 34, 1–7. [Google Scholar] [CrossRef]
- Jordan, P.; Gervais, Y. Subsonic jet aeroacoustics: Associating experiment, modelling and simulation. Exp. Fluids 2008, 44, 1–21. [Google Scholar] [CrossRef]
- Ffowcs Williams, J.E.; Kempton, A.J. The noise from the large-scale structure of a jet. J. Fluid Mech. 1978, 84, 673–694. [Google Scholar] [CrossRef]
- Juvé, D.; Sunyach, M.; Comte-Bellot, G. Intermittency of the noise emission in subsonic cold jets. J. Sound Vib. 1980, 71, 319–332. [Google Scholar] [CrossRef]
- Guj, G.; Carley, M.; Camussi, R.; Ragni, A. Acoustic identification of coherent structures in a turbulent jet. J. Sound Vib. 2003, 259, 1037–1065. [Google Scholar] [CrossRef]
- Hileman, J.I.; Thurow, B.S.; Caraballo, E.J.; Samimy, M. Large-scale structure evolution and sound emission in high-speed jets: Real-time visualization with simultaneous acoustic measurements. J. Fluid Mech. 2005, 544, 277–307. [Google Scholar] [CrossRef] [Green Version]
- Cavalieri, A.V.G.; Jordan, P.; Agarwal, A.; Gervais, Y. Jittering wave-packet models for subsonic jet noise. J. Sound Vib. 2011, 330, 4474–4492. [Google Scholar] [CrossRef]
- Lewalle, J. Wavelet analysis of experimental data: Some methods and the underlying physics. AIAA Pap. 1994, 94, 2281. [Google Scholar]
- Koenig, M.; Cavalieri, A.V.G.; Jordan, P.; Delville, J.; Gervais, Y.; Papamoschou, D. Farfield filtering and source imaging of subsonic jet noise. J. Sound Vib. 2012, 332, 4067–4088. [Google Scholar] [CrossRef]
- Grizzi, S.; Camussi, R. Wavelet analysis of near-field pressure fluctuations generated by a subsonic jet. J. Fluid Mech. 2012, 698, 93–124. [Google Scholar] [CrossRef]
- Mancinelli, M.; Pagliaroli, T.; Di Marco, A.; Camussi, R.; Castelain, T. Wavelet decomposition of hydrodynamic and acoustic pressures in the near field of the jet. J. Fluid Mech. 2017, 813, 716–749. [Google Scholar] [CrossRef] [Green Version]
- Ruppert-Felsot, J.; Farge, M.; Petitjeans, P. Wavelet tools to study intermittency: Application to vortex bursting. J. Fluid Mech. 2009, 427, 427–453. [Google Scholar] [CrossRef] [Green Version]
- Kearney-Fischer, M.; Sinha, A.; Samimy, M. Intermittent nature of subsonic jet noise. AIAA J. 2013, 51, 1142–1155. [Google Scholar] [CrossRef] [Green Version]
- Kearney-Fischer, M. A model function for jet noise events at aft angles and what it says about the statistical relationships of the events. J. Sound Vib. 2015, 338, 217–236. [Google Scholar] [CrossRef]
- Camussi, R.; Mancinelli, M.; Di Marco, A. Intermittency and stochastic modeling of hydrodynamic pressure fluctuations in the near field of compressible jets. Int. J. Heat Fluid Flow 2017, 68, 180–188. [Google Scholar] [CrossRef]
- Camussi, R.; Di Marco, A.; Castelain, T. Statistical analysis of the hydrodynamic pressure in the near field of compressible jets. Int. J. Heat Fluid Flow 2017, 64, 1–9. [Google Scholar] [CrossRef]
- Camussi, R.; Bogey, C. Intermittent statistics of the 0-mode pressure fluctuations in the near field of Mach 0.9 circular jets at low and high Reynolds numbers. Theor. Comp. Fluid Dyn. 2021, 35, 229–247. [Google Scholar] [CrossRef]
- Moser, R.D.; Rogers, M.M. The three-dimensional evolution of a plane mixing layer: Pairing and transition to turbulence. J. Fluid Mech. 1992, 247, 275–320. [Google Scholar] [CrossRef]
- Camussi, R.; Guj, G. Experimental analysis of intermittent coherent structures in the near field of a high Re turbulent jet flow. Phys. Fluids 1999, 11, 423–431. [Google Scholar] [CrossRef]
- Arndt, R.E.A.; Long, D.F.; Glauser, M.N. The proper orthogonal decomposition of pressure fluctuations surrounding a turbulent jet. J. Fluid Mech. 1997, 340, 1–33. [Google Scholar] [CrossRef]
- Li, S.; Rival, D.E.; Wu, X. Sound source and pseudo-sound in the near field of a circular cylinder in subsonic conditions. J. Fluid Mech. 2021, 919, A43. [Google Scholar] [CrossRef]
- Pagliaroli, T.; Troiani, G. Wavelet and recurrence analysis for lean blowout detection: An application to a trapped vortex combustor in thermoacoustic instability. Phys. Rev. Fluids 2021, 5, 073201. [Google Scholar] [CrossRef]
- Yin, Z.; Stohr, M. Time-frequency localisation of intermittent dynamics in a bistable turbulent swirl flame. J. Fluid Mech. 2020, 882, A301–A304. [Google Scholar] [CrossRef] [Green Version]
- Hajczak, A.; Sanders, L.; Vuillot, F.; Druault, P. Wavelet-based separation methods assessment on the near pressure field of a landing gear subcomponent. In Proceedings of the 25th AIAA/CEAS Aeroacoustics Conference, Delft, The Netherlands, 20–23 May 2019. [Google Scholar]
Figure 1.
An example of LIM computed from a segment of a pressure signal taken at x/D = 10, r/D = 1 and M = 0.7.
Figure 1.
An example of LIM computed from a segment of a pressure signal taken at x/D = 10, r/D = 1 and M = 0.7.

Figure 2.
Power spectral density obtained from the Fourier decomposition (blue line) and from the wavelet scalogram (red line). Data refer to the same condition of Figure 1.
Figure 2.
Power spectral density obtained from the Fourier decomposition (blue line) and from the wavelet scalogram (red line). Data refer to the same condition of Figure 1.
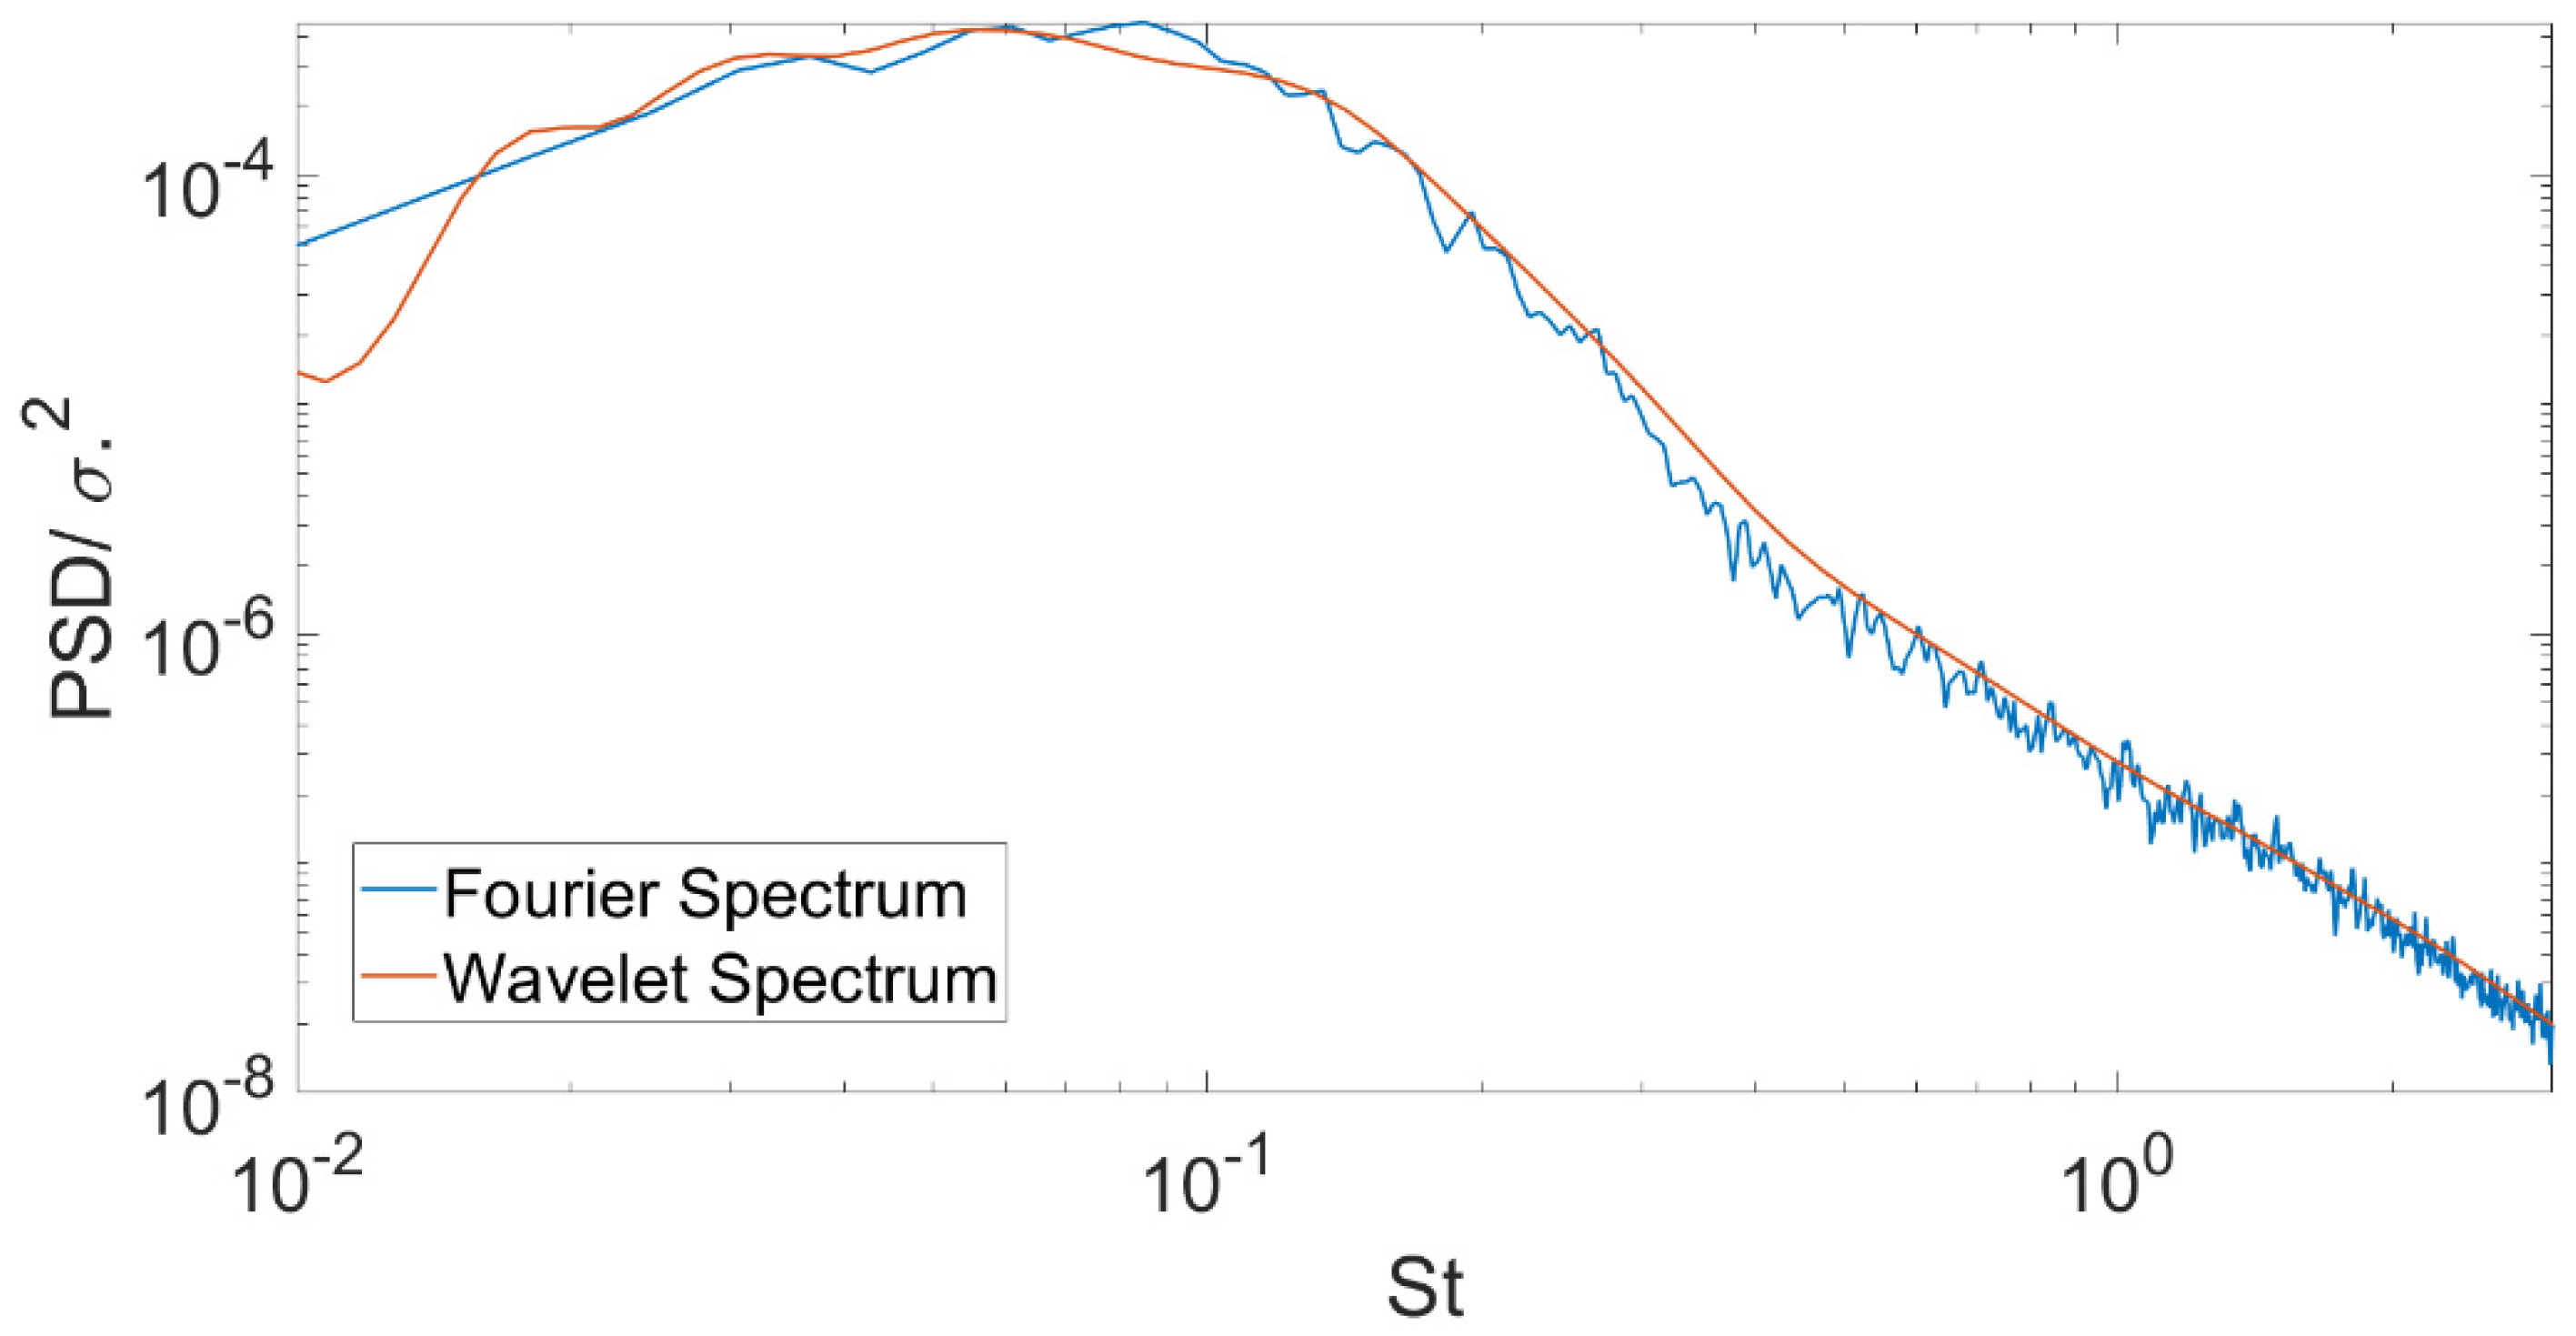
Figure 3.
Examples of averaged pressure obtained from the conditional sampling procedure carried out at r/D = 1 and M = 0.5.
Figure 3.
Examples of averaged pressure obtained from the conditional sampling procedure carried out at r/D = 1 and M = 0.5.
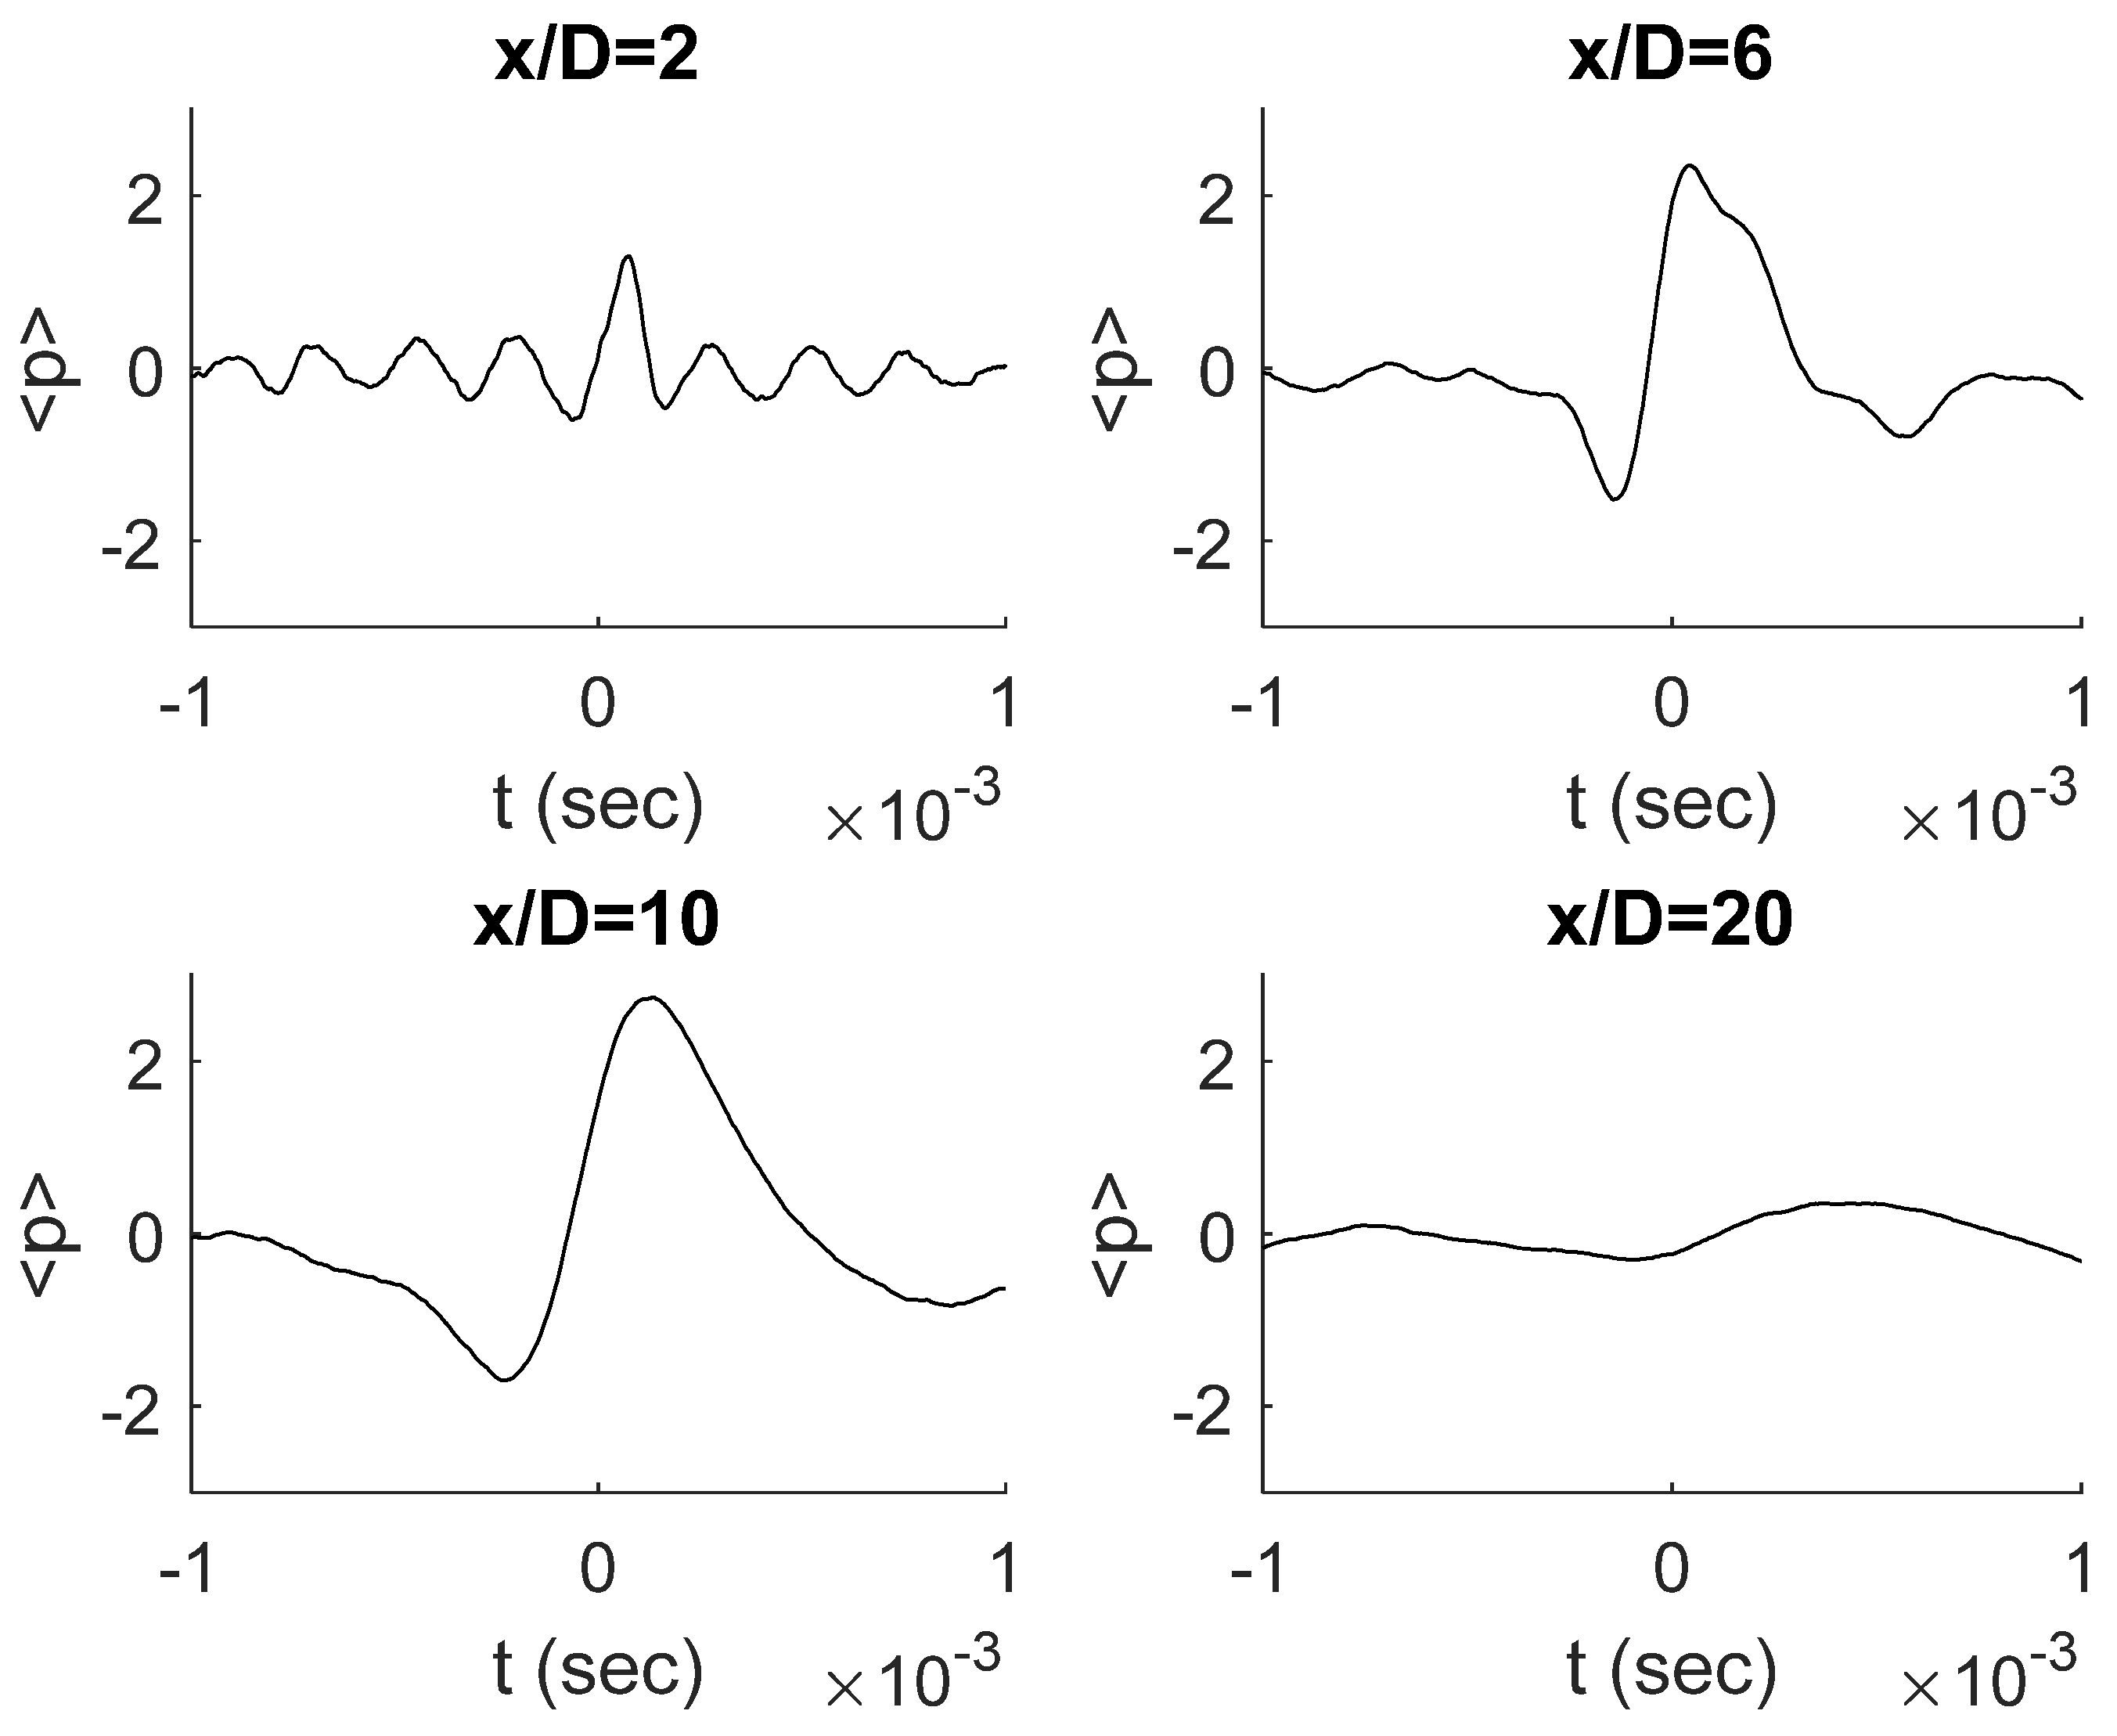
Figure 4.
Same as previous plot but at M = 0.9.
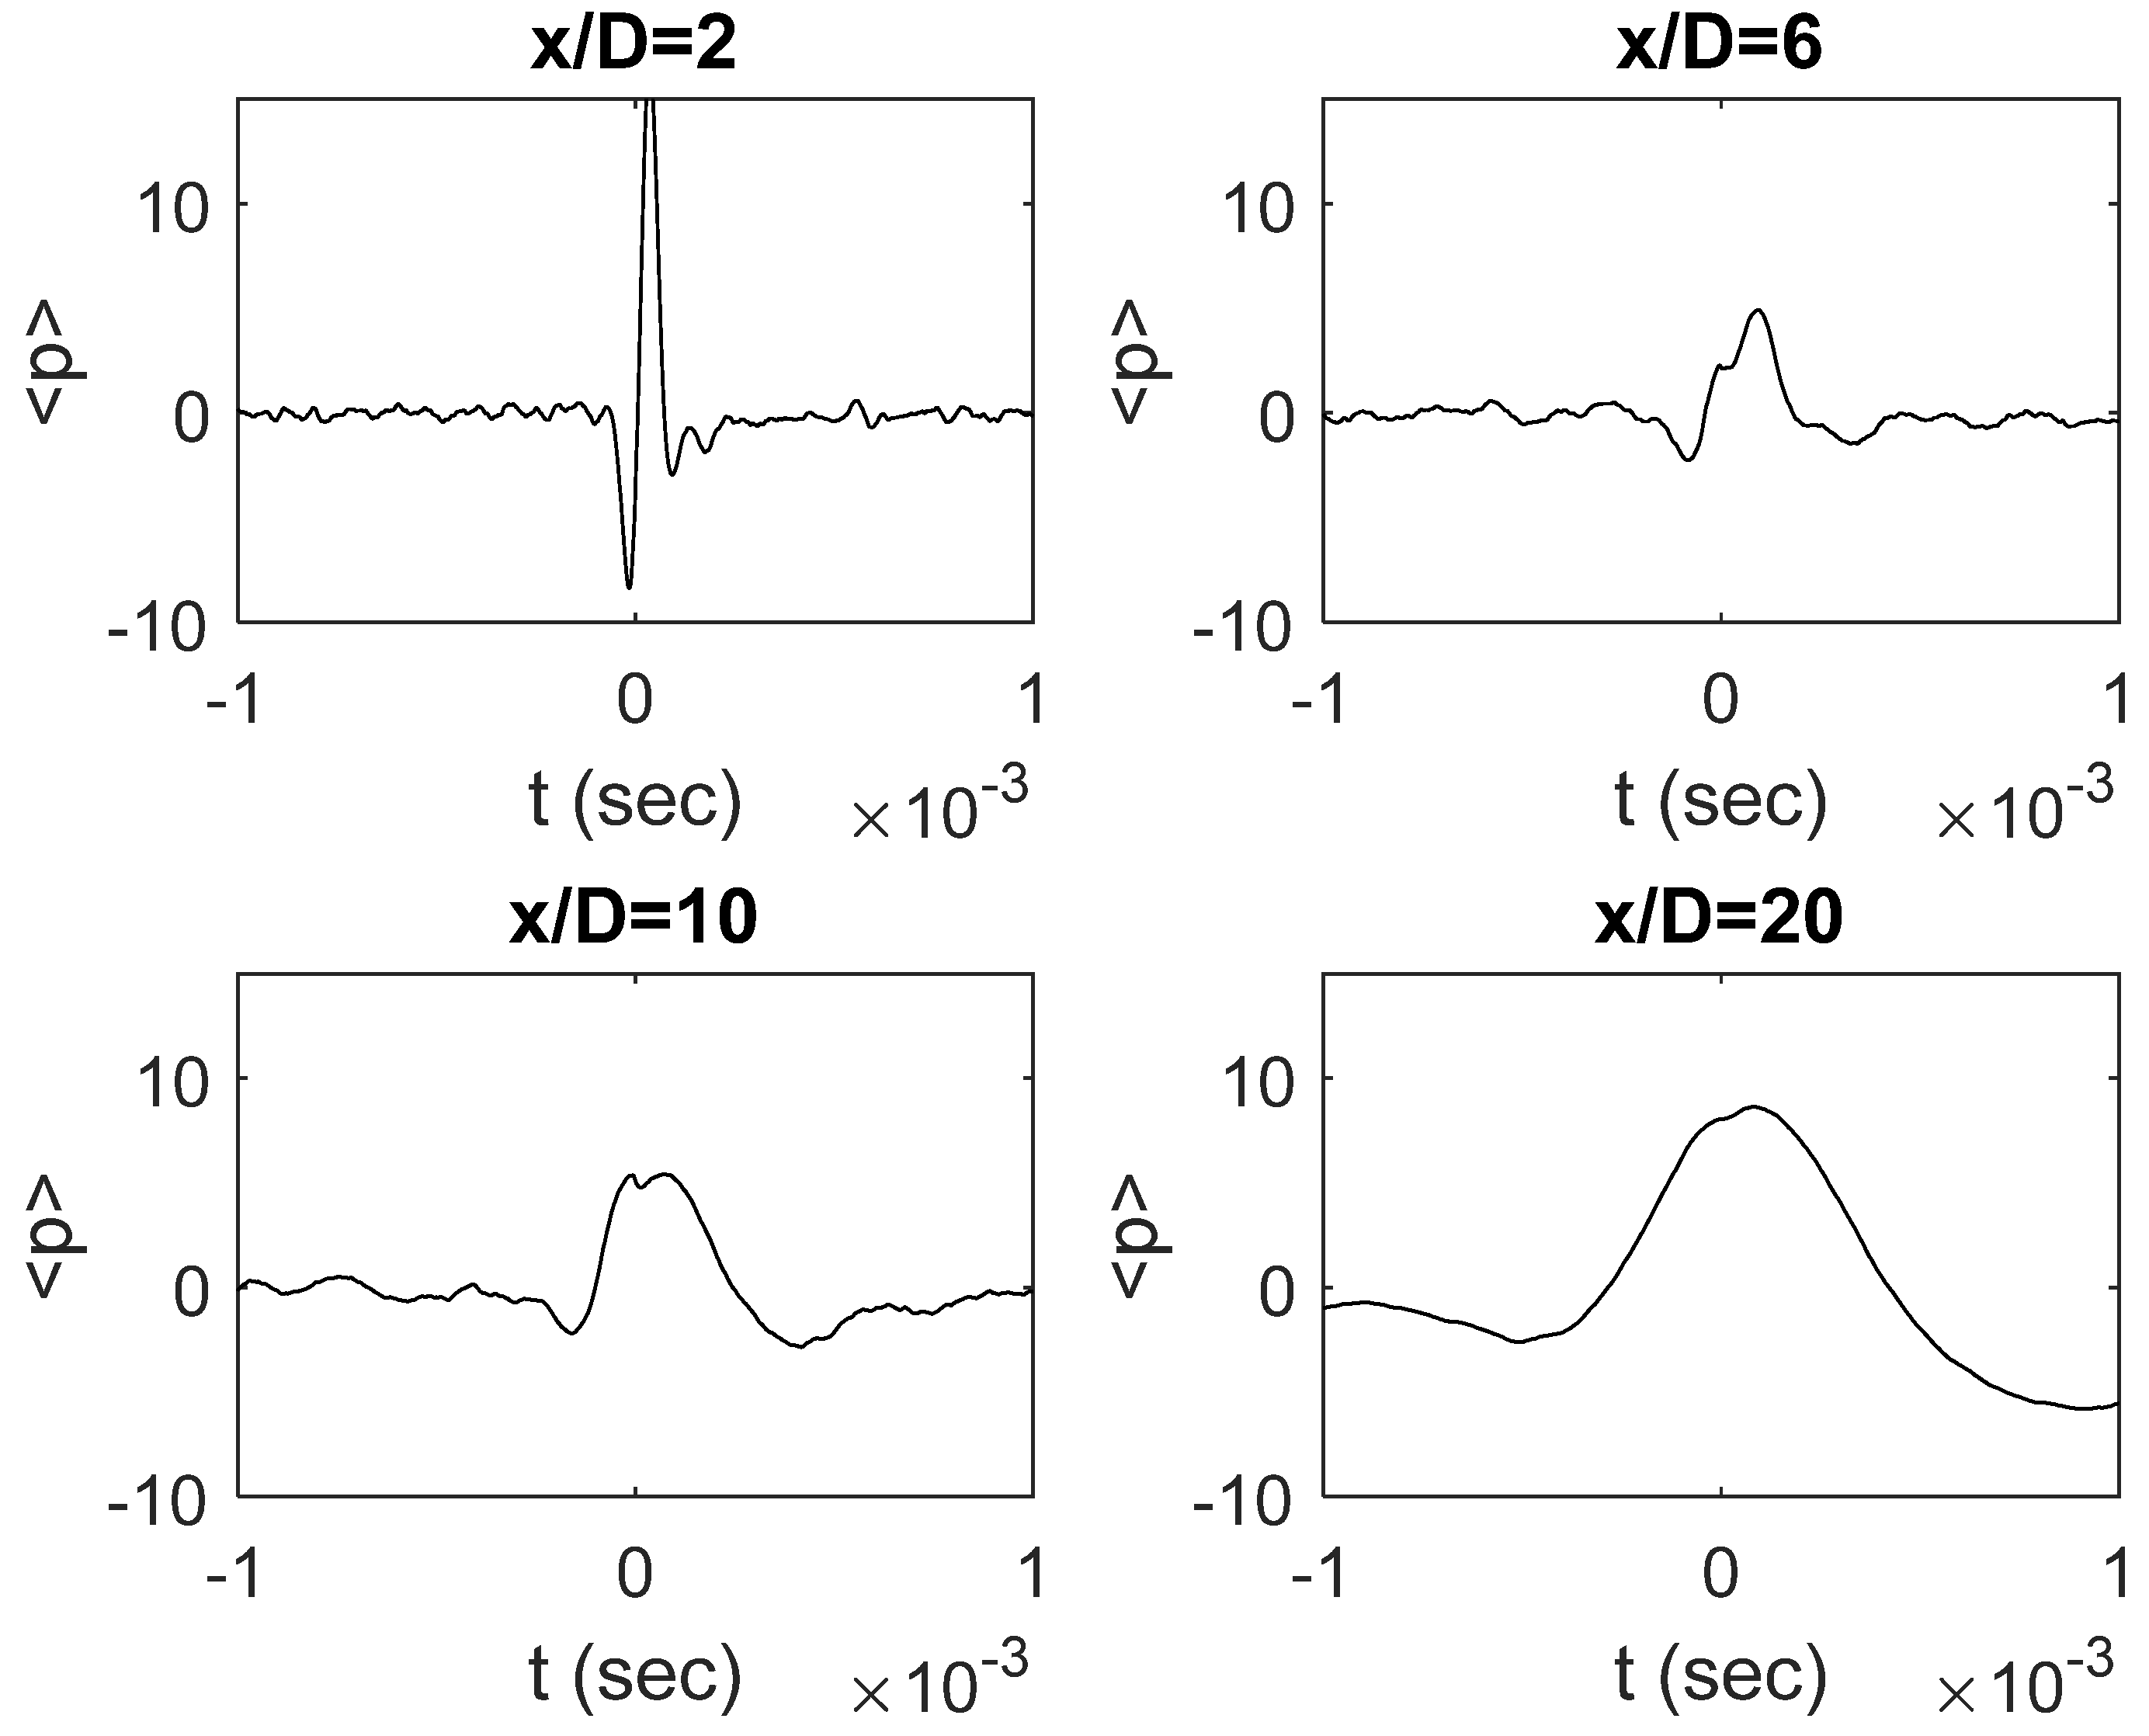
Figure 5.
Examples of acoustic–hydrodynamic pressure separation achieved by applying the method WT3 of [22]: (a) x/D = 3, r/D = 1, M = 0.5; (b) x/D = 8, r/D = 1, M = 0.5.
Figure 5.
Examples of acoustic–hydrodynamic pressure separation achieved by applying the method WT3 of [22]: (a) x/D = 3, r/D = 1, M = 0.5; (b) x/D = 8, r/D = 1, M = 0.5.
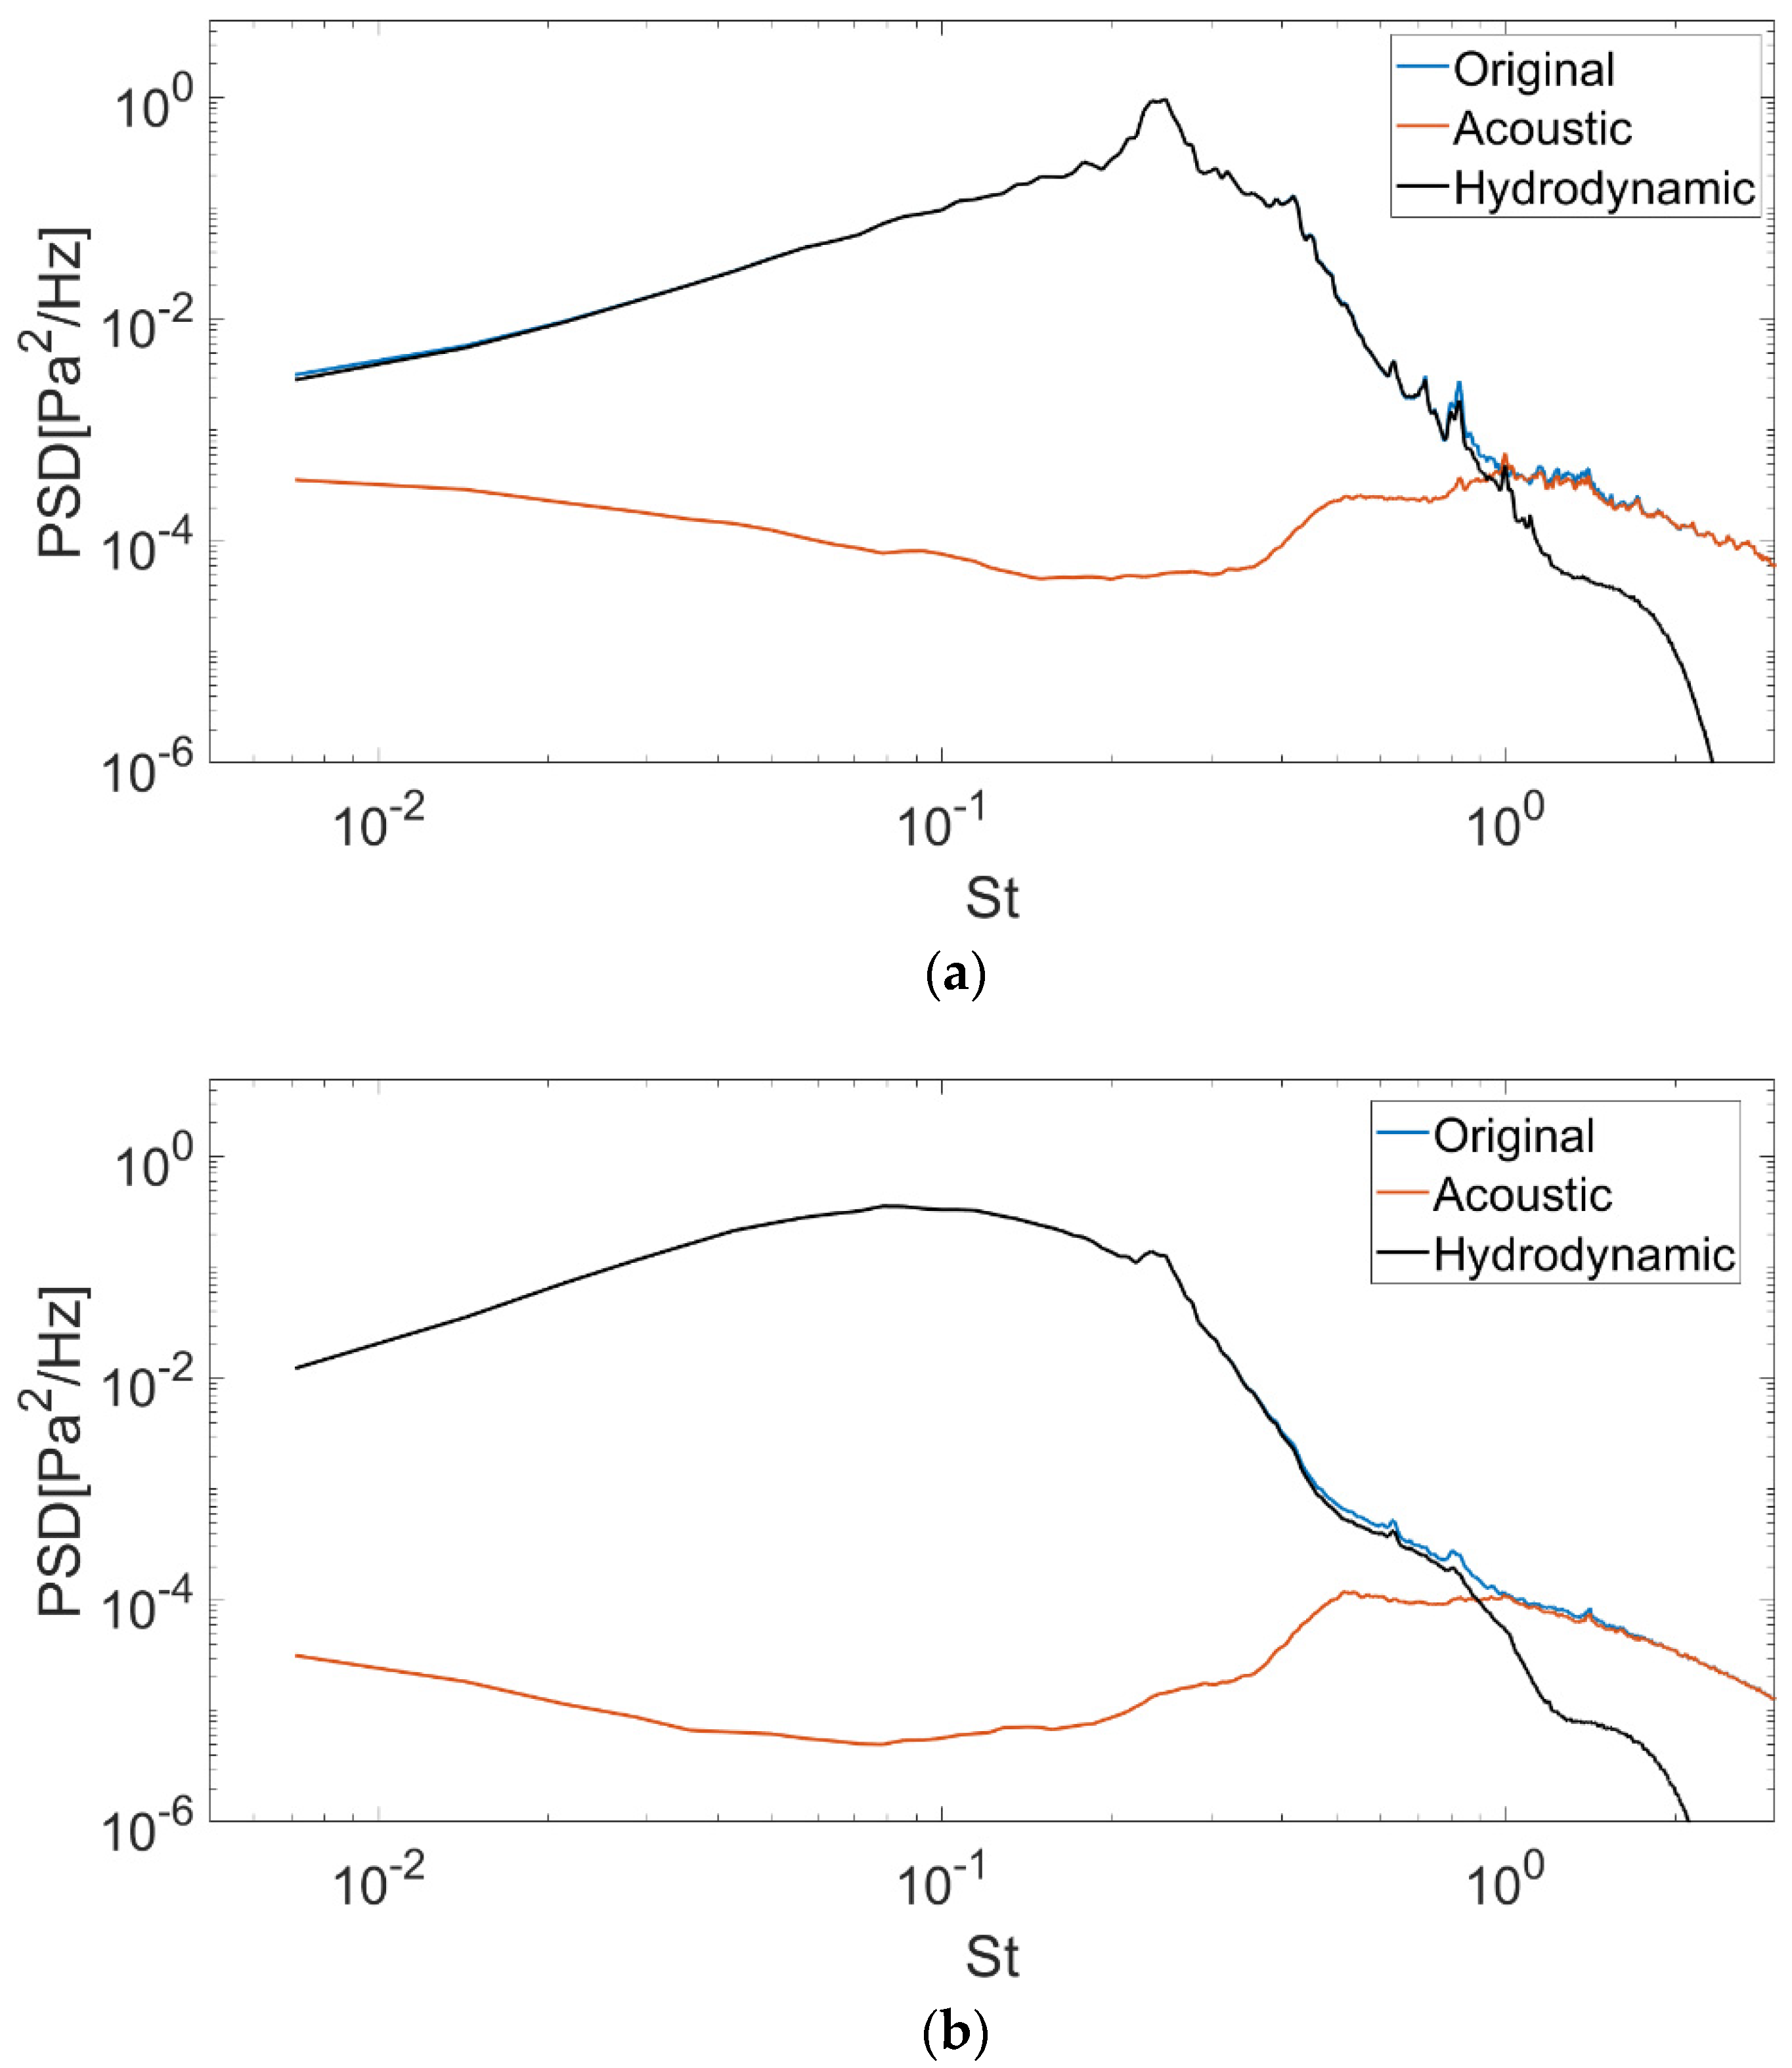
Figure 6.
Same as previous plot but at higher M: (a) x/D = 3, r/D = 1, M = 0.9; (b) x/D = 8, r/D = 1, M = 0.9.
Figure 6.
Same as previous plot but at higher M: (a) x/D = 3, r/D = 1, M = 0.9; (b) x/D = 8, r/D = 1, M = 0.9.

Figure 7.
PDF of the intermittency time Δt computed from a signal extracted randomly from the entire database (circles) and the analytical prediction provided in [26] (red line).
Figure 7.
PDF of the intermittency time Δt computed from a signal extracted randomly from the entire database (circles) and the analytical prediction provided in [26] (red line).
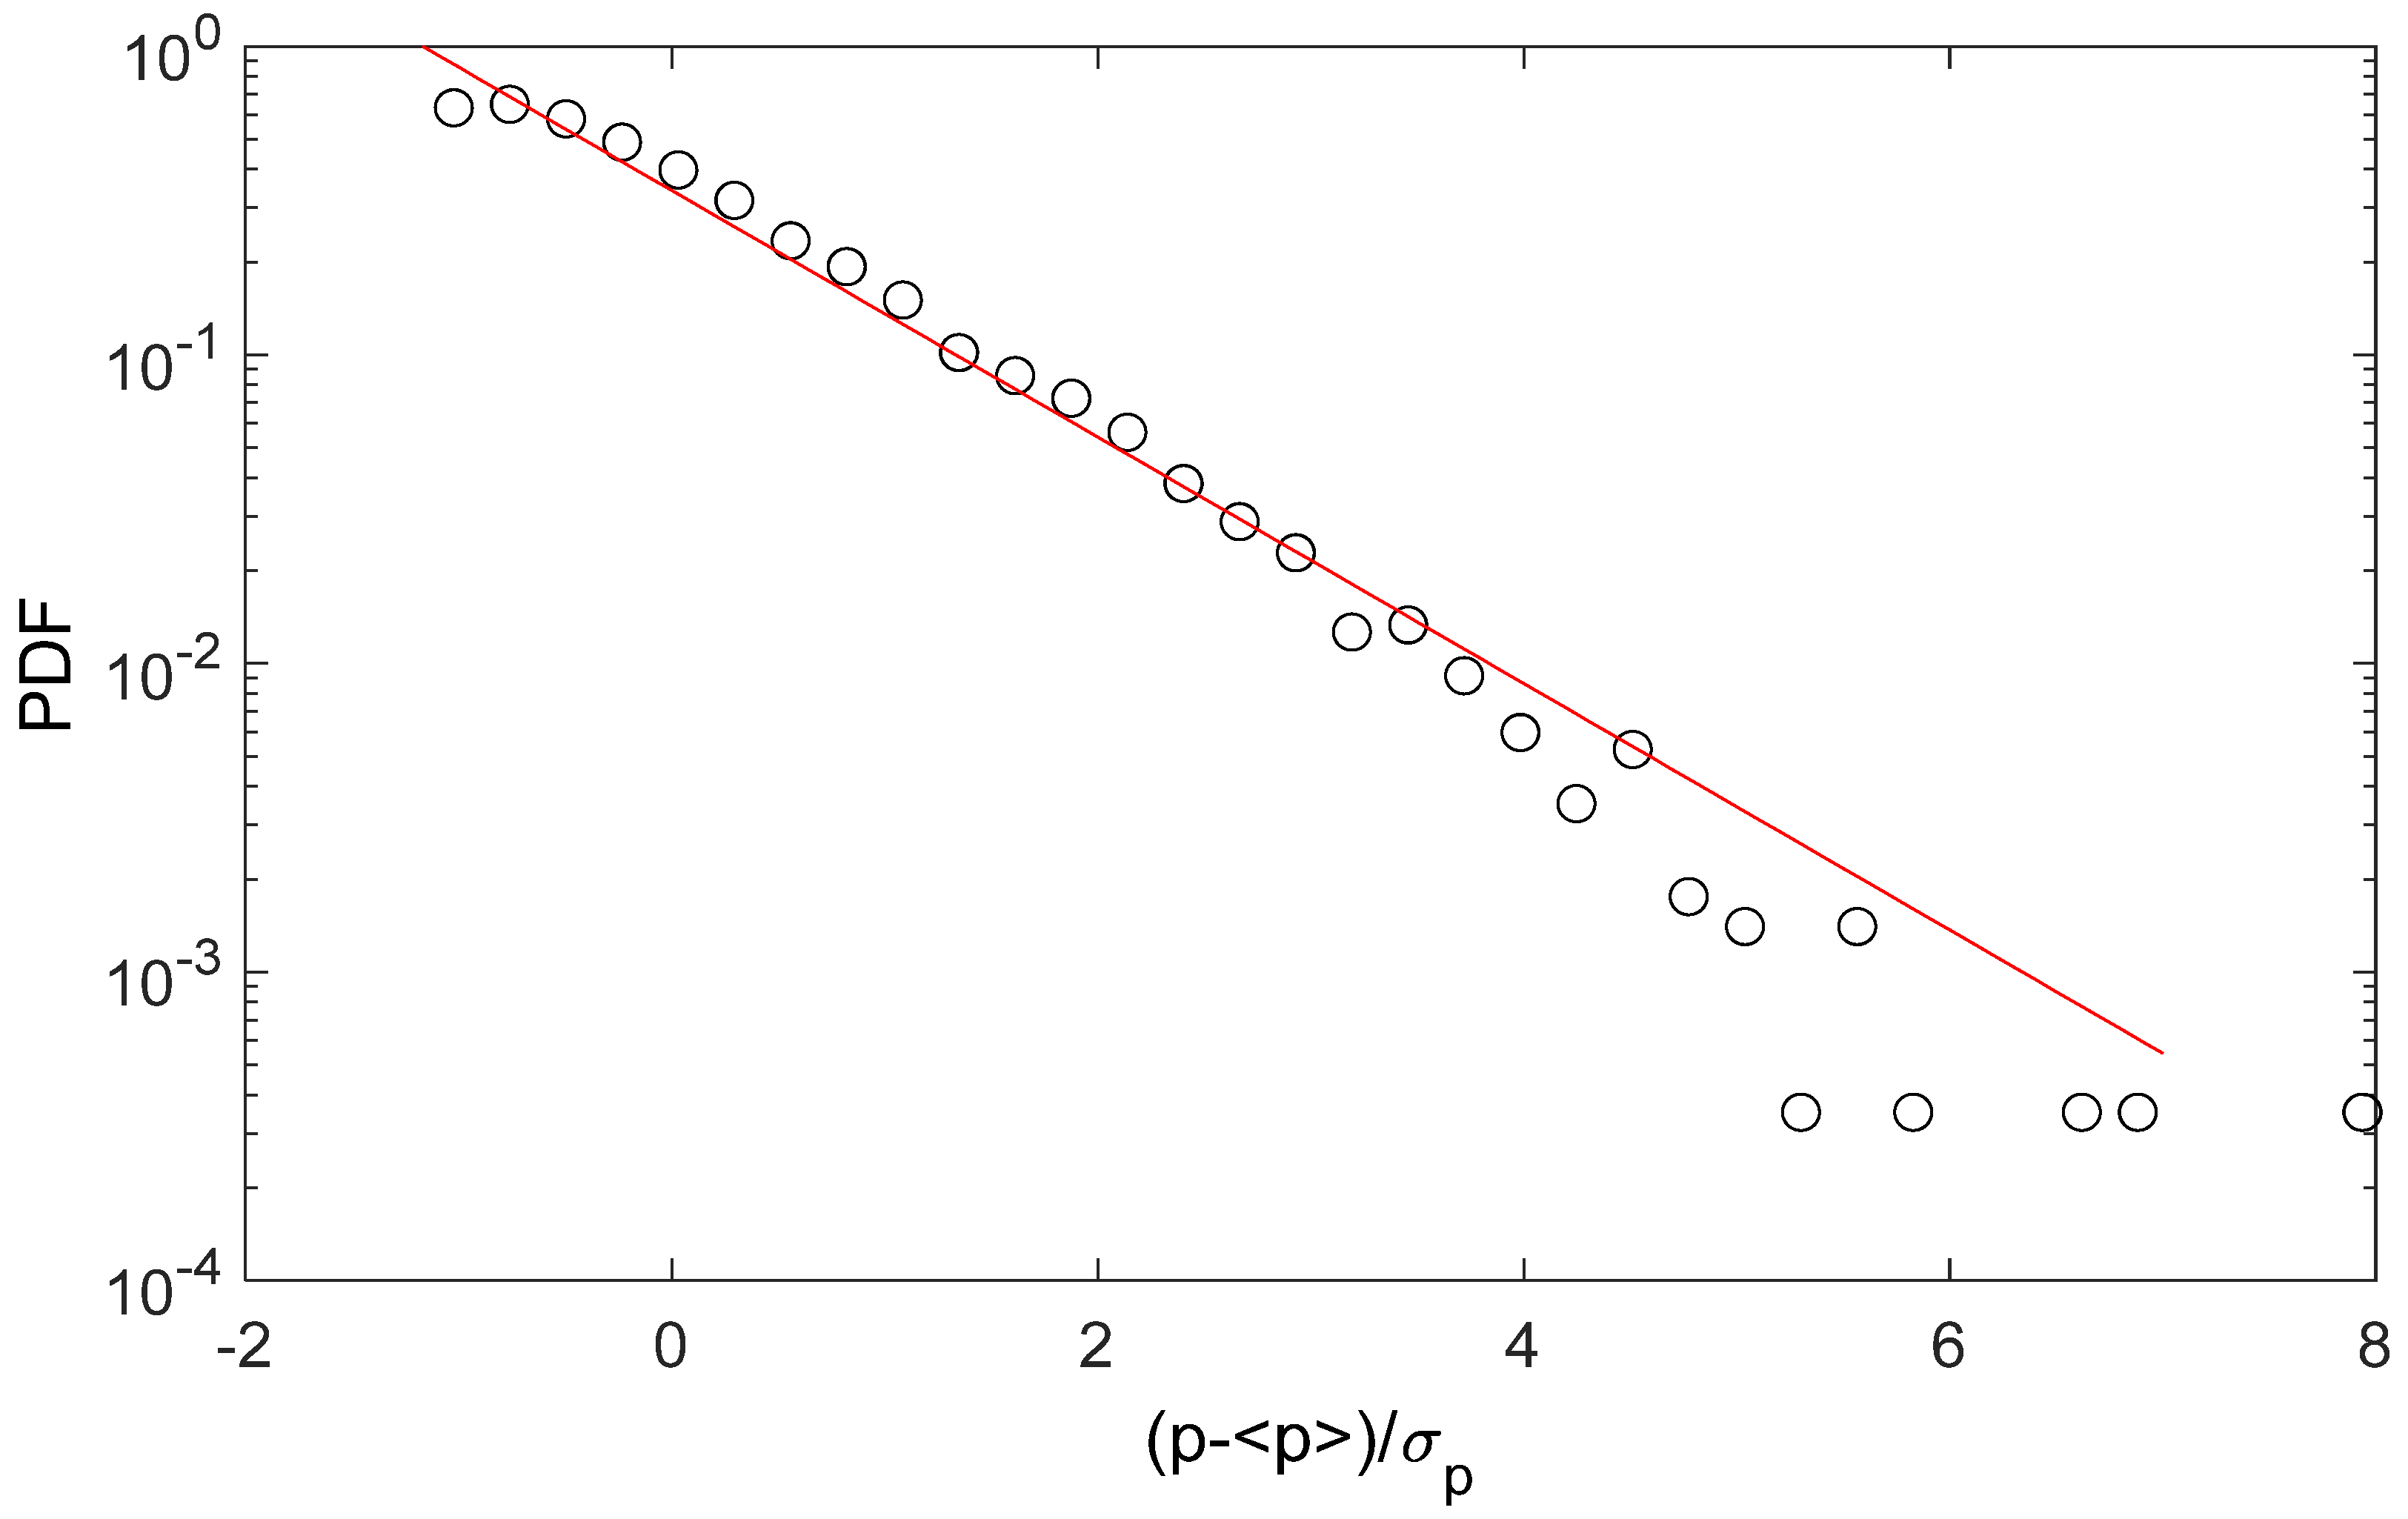
Figure 8.
Same as previous plot but for the amplitude A.

Publisher’s Note: MDPI stays neutral with regard to jurisdictional claims in published maps and institutional affiliations. |
© 2021 by the authors. Licensee MDPI, Basel, Switzerland. This article is an open access article distributed under the terms and conditions of the Creative Commons Attribution (CC BY) license (https://creativecommons.org/licenses/by/4.0/).
Share and Cite
MDPI and ACS Style
Camussi, R.; Meloni, S. On the Application of Wavelet Transform in Jet Aeroacoustics. Fluids 2021, 6, 299. https://doi.org/10.3390/fluids6080299
AMA Style
Camussi R, Meloni S. On the Application of Wavelet Transform in Jet Aeroacoustics. Fluids. 2021; 6(8):299. https://doi.org/10.3390/fluids6080299
Chicago/Turabian StyleCamussi, Roberto, and Stefano Meloni. 2021. "On the Application of Wavelet Transform in Jet Aeroacoustics" Fluids 6, no. 8: 299. https://doi.org/10.3390/fluids6080299