
Investigation of a Light Boxplane Model Using Tuft Flow Visualization and CFD

Moscow Aviation Institute, 125993 Moscow, Russia
*
Authors to whom correspondence should be addressed.
Fluids 2021, 6(12), 451; https://doi.org/10.3390/fluids6120451
Submission received: 8 October 2021
/
Revised: 5 December 2021
/
Accepted: 7 December 2021
/
Published: 11 December 2021
(This article belongs to the Collection Feature Paper for Mathematical and Computational Fluid Mechanics)
Abstract
:In this paper, we addressed the flow patterns over a light boxplane scale model to explain the previously discovered disagreement between its predicted and experimental aerodynamic characteristics. By tuft flow and CFD visualization, we explored the causes yielding a large zero lift pitching moment coefficient, lateral divergence, difference in fore and aft elevator lift, and poor high lift performance of the aircraft. The investigation revealed that the discrepancy in the pitching moment coefficient and lateral stability derivatives can be attributed to insufficient accuracy of the used predictive methods. The difference in fore and aft elevator lift and poor high lift performance of the aircraft may occur due to the low local Reynolds number, which causes the early flow separation over the elevators and flaperons when deflected downward at angles exceeding 10°. Additionally, some airframe changes are suggested to alleviate the lateral divergence of the model.
1. Introduction
With a given take-off weight, an aircraft lift-to-drag ratio can be improved by reducing its drag. In cruise, the induced drag comprises about 40% of the aircraft total drag. Under high lift conditions, the shear of induced drag can reach up to 90% [1]. Therefore, the reduction of this component is an efficient way to enhance aircraft performance, particularly of a general aviation type.
Among various wing layouts, the boxwing is considered to be “the best wing system” with respect to its induced drag according to Prandtl [2]. From a structural viewpoint, the boxwing is a statically indeterminate system of lifting surfaces with a larger structural depth; therefore, its structure could be lighter if compared to an equivalent monoplane, designed from the same requirements specification. The structural strength and weight of a boxwing were studied in [3,4]. Stability and aerodynamic issues arising due to the interference of the two lifting surfaces were analyzed by Schiktanz et al. and Van G. et al. [5,6]. Some patents of this concept date back to the early 1970s and up into the 2000s [7,8]. Boxplane conceptual design options were investigated in a study by Andrews [9] and Frediani [10]. Projects employing a boxwing layout include commercial airliner concepts such as the “PrandtlPlane” and ultralight aircraft designed by Aldo Frediani [11,12], as well as projects by Parsifal [13] and Idintos [14]. Among operational aircraft with a boxwing layout that were successfully built and tested, those worth mentioning are the ultralights “Sunny” designed by Dieter Shulz [15] and “Ligeti Stratos” designed by Cristofer Ligeti [16].
The conceptual design of a light boxplane was conducted at the Moscow Aviation Institute to investigate both advantages and disadvantages of a boxwing layout for general aviation applications, as compared to an equivalent monoplane [17,18].
Concept studies of this light boxplane included configuration layout, sizing, performance analysis, and trade studies. The performance of this aircraft is compared with that of an equivalent monoplane, which has led to a better understanding of both the benefits and drawbacks of boxplane configurations. This investigation represents a further iteration of the previous research with a focus on flow field visualization and local aerodynamics analysis. Whereas the previous experiments were aimed at obtaining total aerodynamic forces and moment data of the model, the current paper is aimed at optimizing the geometry. For this reason, an explanation of the obtained results should be performed through careful analysis and comparison of the local flow fields near both lifting surfaces, on the fuselage and at the wing-fuselage junction areas. This has allowed for identification of sources of the wing root separation bubbles and interference drag, elevator inefficiency, and lateral stability issues. Additionally, the true extent of the fuselage contribution in total lift is clarified.
The novelty of this investigation lies in using the results of a physical (wind tunnel) experiment supported with the results of computational modelling of the local flow field to qualitatively reveal the sources of lift, drag, and stability of this aircraft configuration. This is a relatively new approach that would allow refining the geometry of an aircraft, including the multiple lifting surfaces type. This will allow for better and fully using the potential that this concept provides for general aviation. Additionally, among recent papers dealing with boxwings and joined wing configurations, there are very few papers focusing on issues of their local aerodynamics and their remedies, as opposed to “feasibility studies” of the concept by comparing its totally integrated forces and moments to conventional monoplanes. Without local analysis, drag onset and/or lift deficiency might be attributed to the wrong reasons; having multiple lifting surfaces, it is especially important to identify which of them separates first, the reasons for stall, and its immediate results on longitudinal stability. In this investigation, through analysis of tuft patterns and the computed pressure and velocity fields, the stalling patterns of both wings of a boxplane aircraft configuration at different angles of attack are revealed and explained. Among other sources contributing to the stall behavior of the upper and lower wings, and hence the different elevator efficiency observed in wind tunnel tests, the fuselage geometry is identified, the shape of which induces regions of pressure gradients that do affect the pressure field of the wing surface adjacent to it. Based on these results, a few recommendations towards improving the fuselage geometry are formulated. Wing root separation was also found to be likely linked to the wing-fuselage shading effect; hence, optimal locations of the wings with respect to the optimized fuselage geometry are identified.
2. Materials and Methods
2.1. Wind Tunnel Experiment
2.1.1. Geometry
For verification of the predicted earlier aerodynamic characteristics, as well as for a deeper understanding of the boxplane local aerodynamics, we designed and built a wind tunnel model of this aircraft (Figure 1) and then fitted it with tufts for flow visualization. This is a model representing a very light two-seater piston engine pusher airplane with a boxwing and non-retractable tricycle landing gear. It does not possess a classical tail empennage. Rudders are located on the vertical fins at wing tips, while elevators and flaperons were mounted on the main wings (Figure 2).
Detailed description of the main geometry of the wind tunnel model can be found in [19], including the following:
- ‑
- Dimensions (fuselage length x wingspan x fuselage height): 0.709 × 1.1 × 0.207 m;
- ‑
- Wing aspect ratio: 12 (both wings);
- ‑
- Fuselage aspect ratio: 3.42;
- ‑
- Wing sweep angle at ¼ chord: 1.6° (fore wing), 3.2° (aft wing);
- ‑
- Airfoil: NACA 3413 (fore wing), NACA 4415 (aft wing);
- ‑
- Airfoil relative thickness: 15% (both wings);
- ‑
- Wing incidence angle: 2.5° (fore wing), 2° (aft wing);
- ‑
- Elevator-to-wing area ratio: 0.17 (both wings);
- ‑
- Flaperon-to-wing area ratio: 0.03 (both wings).
Wind tunnel tests of this aircraft model revealed some interesting features of the model [19]. Among the conclusions outlined are sufficient longitudinal static stability (CmCl = −0.07), excessively high zero lift pitching moment (Cm0 = 0.16), high efficiency of rudders and elevators (with aft and fore elevators being non-equally efficient), high lateral instability, and poor flaperon efficiency.
To explore the causes of these peculiarities, we selected the tuft flow visualization technique, allowing the instantaneous flow direction to be identified and the unsteady regions of reverse flows to be detected. The tuft flow visualization was supported with results obtained from a high fidelity ANSYS Fluent computational model, consisting of 25 mln cells and replicating the clean geometry in cruise configuration and experimental flow conditions of the wind tunnel experiment. In combination, experimental and computational visualization techniques complete each other, where the experiment is used to validate the computational model and enhance grid convergence, while results of CFD visualizations in return provide extended colorful information about local flow variables and gradients, hence explaining local flow instabilities.
In the literature, some techniques combining the traditional tuft flow visualization with digital imaging and processing to extract quantitative data are described [20,21,22,23]. Digital processing of tuft patterns provides information about the local flow state through the single-tuft statistics, or polar histograms. For this study, digital processing was not applied.
From previous tests, we defined the characteristic angles of attack for tuft studies:
- α = 15° (aircraft stall angle in cruise configuration, non-linearity in dependence Cm = f(α));
- α = 10° (local stall, bend in Cnβ (α) and Cyβ (α), reduced elevator efficiency);
- Additionally, we set α = 0°, 5°, 20°, 25°.
The following objectives are defined for this study:
- ‑
- Investigate why the model has a large value of Cm0;
- ‑
- Evaluate the fuselage contribution to lateral divergence of the aircraft;
- ‑
- Determine why the rear elevators generate lift twice as large as that of the front elevators;
- ‑
- Explore why the flaperons do not perform as expected.
2.1.2. Wind Tunnel Test Conditions
The main geometry of the test model is presented in [19]. For flow observations, the model was equipped with fine thin silk tufts glued to its surface. The length and spacing of the tufts were about 10 mm, as a compromise between reducing the influence on the flow field and sustaining a good visibility of tufts. The initial tuft orientation was parallel to the X-axis. Tests were conducted in the T-1 open jet type wind tunnel at Moscow Aviation Institute, with an average relative measurement error not exceeding 3% … 5%. The test conditions in the T-1 wind tunnel are presented in Table 1.
Observations were made at fixed angles of attack to obtain flow patterns for steady conditions. Additionally, we recorded a video with the angle of attack and angle of sideslip gradually varying to identify any time-dependency in the flow patterns. The range of angles of attack was 0° … 25°, while the range of angles of sideslip was 0° … 20°.
In tuft visualization analysis, different approaches are used to describe and distinguish the flow phenomena. In [22], a set of quantitative definitions on the detachment state near the wall has been proposed, with definitions based on the fraction of time that the flow moves downstream:
- Incipient detachment (ID) occurring with instantaneous backflow 1% of the time;
- Intermittent transitory detachment (ITD) occurring with instantaneous backflow 20% of the time;
- Transitory detachment (TD) occurring with instantaneous backflow 50% of the time;
- Detachment (D) occurring where the time-averaged wall shearing stress is zero.
To use this approach, the fraction of time that the flow moves downstream is required. Alternatively, in [22], the following set of terms to describe the tuft observations is proposed:
- Unseparated flow;
- Separated flow;
- “Momentarily separated”;
- “Intermittently separated”.
The type of separation is governed by both airfoil section and Reynolds number. In [22], the terms “momentarily separated” and “intermittently separated” are used to describe a time-dependent flow over symmetric and relatively thin NACA 0009 and NACA 0012 airfoils (at the specified Reynolds number). The leading-edge laminar separation, followed by transition and reattachment, was captured by tuft patterns. During tuft flow visualization over the light boxplane model, the unsteady phenomena and leading-edge laminar flow separation were not observed. Hence, the terms “momentarily separated” and “intermittently separated” are not used in this paper.
2.2. CFD Model
2.2.1. Meshing
For RANS CFD simulations of the cruise configuration of this aircraft model, ANSYS Fluent is used. In ANSYS meshing, a mesh is generated with 25–50 million unstructured tetrahedron cells with a prismatic layer (12 layers total) for boundary layer resolution. Proximity and curvature automatic refinement algorithm is set to capture local geometric features of the wings and fuselage. Extensive refinement is performed using face sizing and local size controls on the wings’ surfaces with the aim of better resolving local flow patterns on the wings (Figure 3). A coarser mesh without face sizing is built around the fuselage for computational and meshing time economy. For this purpose, a half-span of the model is also calculated with a “symmetry” condition set at the aircraft plane of symmetry. The CFD model has been validated using the obtained experimental data of aerodynamic forces and moment coefficients. In Figure 4, the wall Y+ function distribution is provided.
2.2.2. Governing Equations and CFD Setup
For the studied case of a steady flow external aerodynamics, conservation equations are solved, including the continuity equation for mass, which can be expressed in a general form as follows:
as well as for momentum conservation:
Given that the flow over the three-dimensional boxplane configuration is at a low subsonic velocity, the flow is considered incompressible (M ≤ 0.3). Therefore, the energy conservation equation has not been included in the final settings and was only tested during the validation stage to check whether drag prediction accuracy could be improved at near-stall and maximum lift conditions, using an ideal gas law. As no significant improvements were noted, this setting was dropped. For reference, the energy conservation equation and the ideal gas law can be expressed as follows:
Given the incompressible flow field and constant temperature of T~293 K, viscosity is set as a constant, and its value calculated by the software based on parameters of the chosen fluid material “air”: .
With a pressure-based solver, a coupled scheme was used for pressure–velocity coupling. Spatial discretization methods include a Green–Gauss node-based gradient evaluation algorithm and a second-order upwind convective scheme for flow variables including pressure, density, and momentum. For the studied cruise configuration, quasi-fully converged solutions were observed after approximately 700 iterations at small to moderate angles of attack and up to 3500 iterations at near stall and beyond.
Turbulence Modelling
Based on numerous validation studies of turbulence modelling and external flow problems—for instance [25,26,27,28]—the shear stress transport (SST) k-ϖ turbulence model was chosen for this study, providing the best accuracy to computational cost for the studied case. Bardina et al. [25] demonstrated the advantages of SST k-ϖ for flow separation prediction, both its onset and the size of separated area. This is most important for local flow fields and aircraft aerodynamics problems, including the studied model. Wilox [29] developed the standard k-ϖ turbulence model based on modifications for effects of low Reynold’s number, compressibility, and shear flow spreading, where the turbulence kinetic energy, k, can be approximated through the following transport equations:
and the specific dissipation rate, ϖ:
2.2.3. Validation of the CFD Model against Wind Tunnel Data
Shown in Figure 5 and Figure 6 below is a comparison of values of lift and drag coefficients obtained from the wind tunnel experiment and the computed values. As can be deduced, the linear part of the lift curve is well captured by the CFD model, with the lift being slightly underestimated, and the drag coefficient slightly over predicted. At near stall conditions, the CFD fails to capture the little “bend” observed during the experiment for both lift and drag dependencies at around the 17° critical angle of attack, probably due to transition effects and unsteady flow behavior. Beyond stall, the predicted growth rate of drag with further increasing alpha is close to the wind tunnel observed growth rate. Post-stall lift coefficient is, however, poorly predicted given that the computed flow becomes fully separated against the occasionally captured-by-tufts reattachment near the wings’ trailing edges.
Figure 7 below demonstrates the CFD model prediction accuracy of flow separation and the extent of the separated area at the aft fuselage section, where the computed velocity field and wind tunnel tuft-visualized patterns are very similar. In the drag prediction study by Sclafani et al. [28], the authors examined the impact of turbulence modeling, including that of SST k-ϖ, on accurate prediction of the tail root separation bubble size, the angle of attack at which it onsets, and its overall impact on drag prediction accuracy.
3. Results
3.1. General Overview
Before interpreting the test results, it is important to recognize the limitations associated with the selected visualization technique [22]:
- The possibility that tufts’ presence may change the flow nature. This effect is believed to be small enough.
- The flow pattern resolution dependency on the size of tufts. Relatively long tufts fail to show local separations, indicating a shallow reversed flow instead.
- The low reproducibility of tuft visualization due to the fact that geometry, bending stiffness, and spacing of the tufts are not identical.
- In some cases, the interpretation of tuft patterns is doubtful.
- Characteristic deflection behavior of the tufts changes over time as irreversible deformation of the tufts occurs after being exposed to air flow.
- Development of turbulent boundary layer and separated flow on the scale model (CFD and wind tunnel visualizations).
The flow on the aft bottom fuselage is separated in all conditions tested (a strong crossflow with a tuft deviation of ±45° is observed). At α = 5°, a turbulent attached flow is observed over the root of the aft wing (under the influence of the aft bottom fuselage, the tuft deviation is about ±30°). A slight inboard inclination of tufts is observed at the aft wing trailing edge. At α = 10°, the region of the turbulent flow on the inner aft wing grows and eventually separates, and the angular deviation of tufts increases. The stalling angle of attack where the flow over the trailing edge of the aft wing is separated is α = 15° (the deviation is roughly ±90°, Figure 7). The tuft patterns reveal an attached turbulent boundary layer at the root of the fore wing (the tuft deviation is of the order of ±30°). At the trailing edge of the fore wing, a strong stable crossflow towards the root is observed. Additionally, a crossflow is observed on the fore portion of the side wing.
The lift distribution and separation onset patterns as a function of angles of attack at a zero-sideslip angle are presented in Table 3 and Table 4 below.
At moderate flight angles of attack, the fore wing maintains a lift advantage due to its aerodynamic design, a cleaner undisturbed flow, and a beneficial interaction with the fuselage, whereas the aft wing is slightly in the downwash from the fore wing and the disturbed flow behind the body. Lift advantage, however, shifts progressively from the fore to aft wing at a high α, due to the onset of separation on the fore wing. Hence, this back-shift in the aircraft AC due to large αs also contributes to the observed large values of pitch-down moment and the lower efficiency of control surfaces experienced by the fore wing as compared to the aft wing.
An insight into the wing–fuselage interference can be provided by CFD pressure coefficient distribution (Figure 8: velocity vectors below indicate flow directions; vector lengths are normalized to show the flow direction). Low pressure on the suction side of the wing is extended towards the body, leading to a strong adverse pressure gradient on the fuselage part adjacent to the wing root.
Pressure and velocity data on the aft body indicate a similar pattern (Figure 9), where the origin of adverse gradients can be traced to a low-pressure area just beneath the low wing trailing edge. The reason why this low-pressure area formed beneath the wing (where a higher pressure is expected instead) is due to the abrupt change in the aft body line, where a sharp angle leads to accelerating the flow. In this regard, streamlining the aft body is done either by increasing its aspect ratio and/or relocating the lower wing closer to its bottom for achieving a positive interference where a higher pressure beneath the airfoil will be shifted towards the adjacent body surface.
Further analysis of the fore body using true-scale velocity vectors reveals a flow acceleration well upstream of the upper wing, probably due the streamlined, airfoil-like shape of this part of the fuselage with a significant contribution to lift (Figure 10).
The observed above flow is overall beneficial given the fuselage contribution in generating lift; however, minor improvements in the wing–body junction area are required to soften or delay the wing root separation. For instance, raising the upper wing a little will make its airfoil benefit from the flow acceleration and maintain an attached flow therein. Additionally, a junction-area separation bubble could be well mitigated through enhanced fairings and gradually blending the wing geometry with the upper fore body.
Presented below is a hypothetically optimized fuselage cross section and slightly relocated wings (upper wing raised to benefit from the flow acceleration on the fuselage as well as to reduce its shading at high angles of side slip, and aft wing was lowered to improve interference with the fuselage and similarly reduce its shading during side slip) (Figure 11).
The stall occurs by progressive separation from near the trailing edge of both wings and moves from root to tip. There are no sudden changes in the character of the flow in the region of the stall. Even at the stalling angle of attack, the fore portion of the aft wing maintains the unseparated flow.
At α = 20°, a strong crossflow occurs at the fore wing, middle upper and aft fuselage, and aft portion of the aft wing.
At an angle of sideslip, the angle of deviation of tufts on the downwind surfaces of the scale model is greater than that on the upwind side. As the angle of sideslip increases, the flow separation region over the aft bottom upwind fuselage decreases.
3.2. Large Value of Cm0
The AC location identified in the experiment is 23.5% of the equivalent MAC, which is 10% forward of the predicted value. With the center of gravity location corresponding to a static longitudinal stability margin of 7% of the equivalent MAC, the aft elevator deflection angle required to trim the aircraft in cruise is approximately 10° (see the trim crossplot, Figure 12).
The observation of tuft patterns does not reveal any peculiarities of the flow responsible for the discrepancy between predicted and test values for the AC location. Hence, future efforts must be primarily aimed at improving the prediction accuracy of the AC location of boxwing configurations. For the current configuration, geometry optimization may be performed to reduce the zero-lift moment coefficient at a fixed stability margin and aircraft lift coefficient. As optimization variables, the following can be used: the wings’ angle of incidence, camber, and point of maximum camber chordwise. An optimization of this sort, however, may lead to no feasible design or to a design with an unfavorable stall behavior.
3.3. Fuselage Contribution to the Lateral Instability of the Aircraft
The tuft patterns and CFD visualizations reveal a crossflow on the bottom aft fuselage in all test conditions, even at a zero angle of attack and sideslip (Figure 13). We believe that with a propeller rotating, this effect would be relieved [23]. At an angle of sideslip, the crossflow area reduces on the upwind side of the fuselage and increases downstream of the fuselage. As the angle of attack increases, a turbulent boundary layer followed by flow separation develops on the fuselage over the aft wing. At α = 20°, the same tuft pattern shows signs of increased turbulence and flow separation on the top fuselage between the front wings.
The vertical fins, located far enough from the fuselage wake, maintain attached flow in the whole range of angles of attack. Therefore, the results of the tests imply that the analytical procedure used to predict the lateral stability characteristics of the model was not as precise as expected and should be refined.
To shift the lateral aerodynamic center backward, some modifications to the airframe can be considered:
- Increased area of the fairing covering the aft wing–fuselage junction area (at the cost of increased wetted area and viscous drag).
- Giving the fuselage shape a flattened top line for a reduced flow acceleration on its front upper surface.
- Increased length of the fuselage (at the cost of a significantly increased wetted area, increased aircraft weight, and reduced performance).
- Increased sidewing area.
- Increased sidewing arm through aft and fore wing planform modifications.
- Additional small stabilizers mounted on the aft fuselage.
- Wing vertical arrangement modification with low front wings and high aft wings mounted on a vertical stabilizer (as proposed in several large boxwing transport aircraft concepts).
- Distributed electric propulsion system with a differential thrust control of the propellers.
We believe that among the proposed measures, (7) and (8) would be the most effective. The seventh option brings about the penalty of a deteriorated wing performance due to sweep and the vertical stabilizer shaded by the fuselage at moderate angles of attack. The eighth option looks promising but requires a reliable electric propulsion system.
3.4. Elevators
The elevators demonstrate a high degree of efficiency (in terms of the derivative of the pitching moment coefficient with respect to the elevator deflection angle), as seen in Figure 14.
To ensure the given static stability margin, the aft wing was designed to generate a lift 10% higher than the fore wing (NACA 3413 for the fore wing and NACA 4415 for the aft wing, with a 0.5° difference in incidence angle). Additionally, with the current center of gravity location (16.5% MAC equivalent), the moment arm of the aft elevators is greater than that of the fore elevators (the arm of the front elevators is 0.56 m, and the arm of the rear elevators is 1.291 m). When deflecting the elevators down at 10°, 20°, and 30°, the tuft patterns reveal increased turbulence and eventually flow separation (Figure 15). The difference in lift generated by fore and aft elevators demonstrated in Figure 16 might be due to an increased aft wing loading, but as can be seen on the graph, the aft and fore elevators deflected upward cause approximately the same lift decrement. Additionally, the fore elevators deflected upward and downward cause different lift increments for the aircraft. The tuft patterns on the front elevator deflected downward reveal signs of flow separation, in contrast with tuft patterns on the aft elevator deflected upward at the same angle. Hence, non-equal efficiency of the fore and aft elevators deflected to pitch the aircraft up or down can be attributed to the flow separation at the upper surface of the elevators. When aft and fore elevators operate simultaneously, the downward and upward pitching moment increment is roughly identical (Figure 12).
3.5. Flaperon Performance
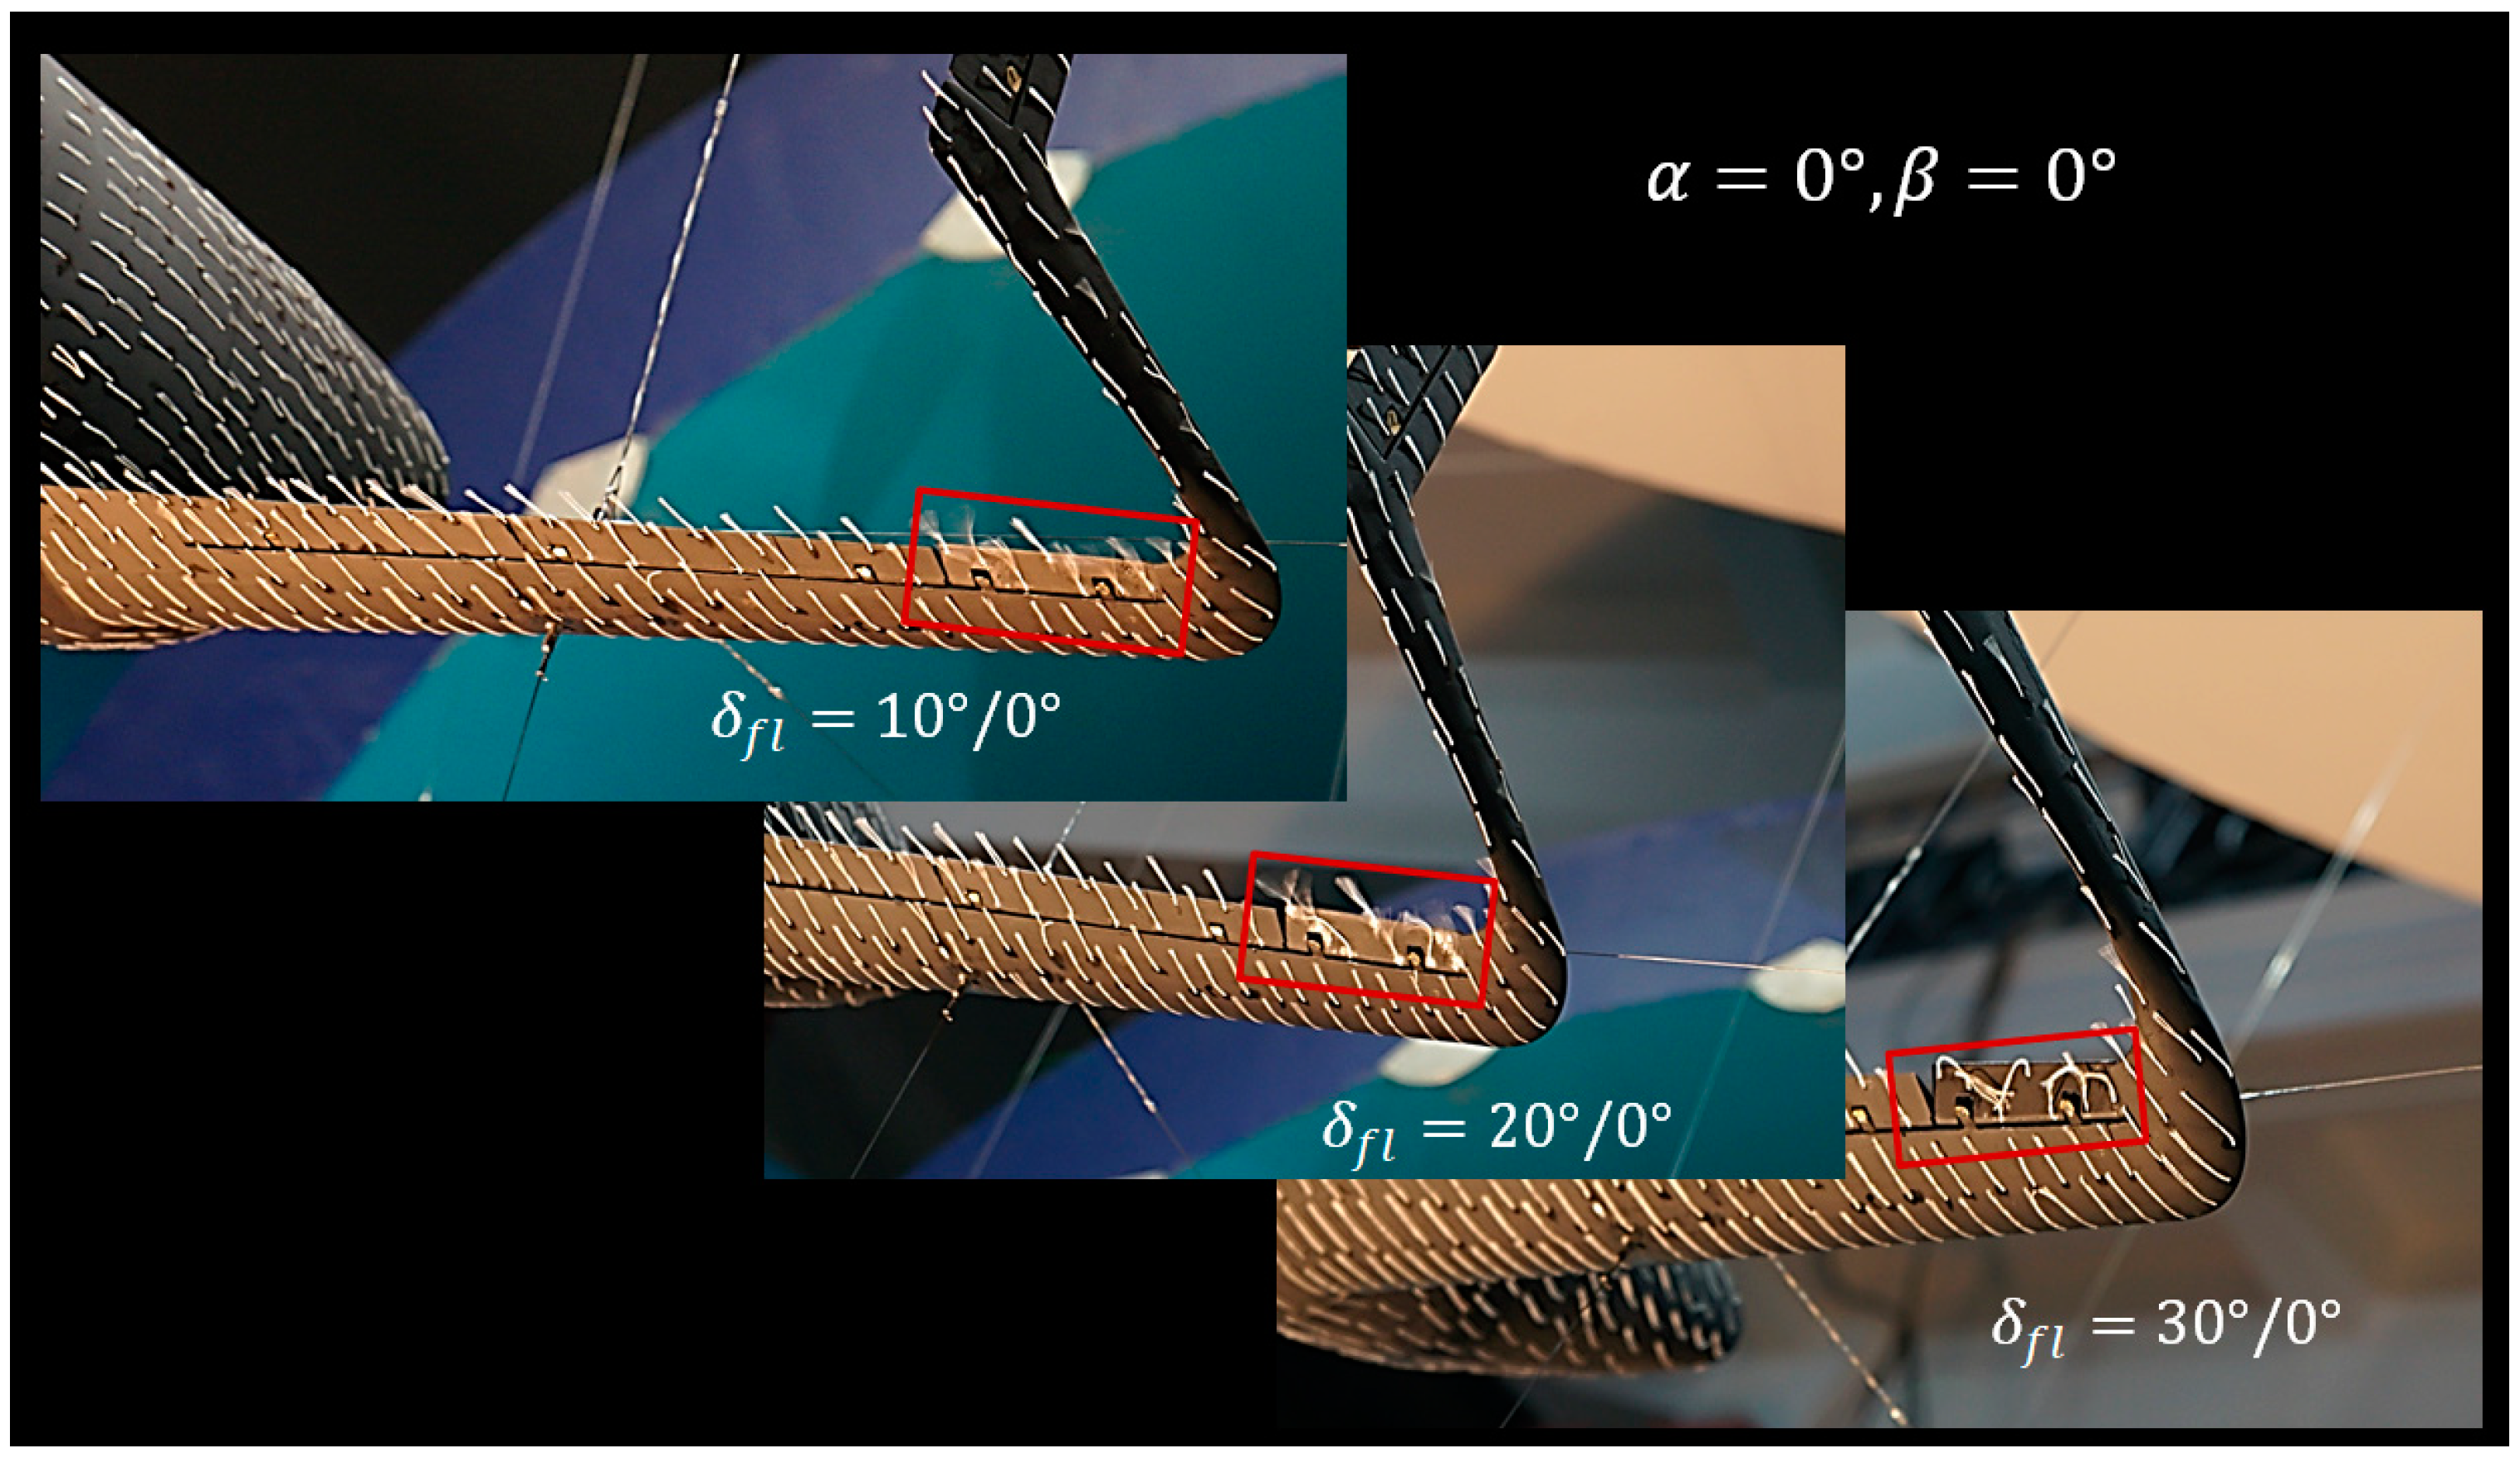
The flaperons deflected downward do not increase the aircraft lift as was expected (Figure 17). In fact, the use of flaperons reduces the aircraft lift, which means that the lift-generating surface of the wing decreases. This conclusion is supported by the tuft patterns shown in Figure 18. The tuft patterns reveal a turbulent boundary layer at δfl = 10° and separation starting from δfl = 20°.
At the wingtip Reynolds number (test conditions Re = 155,000) the trailing edge boundary layer fails to resist the high adverse pressure gradient due to the flaperon deflection. The gap between the wing trailing edge and the leading edge of the flaperons (located at 70% of the chord) may cause the laminar boundary layer to transit to turbulent and/or to separate.
Additional tests with a larger model, along with a full CFD model of the aircraft high-lift configuration, would enhance our understanding of the aircraft high lift performance in more realistic conditions.
4. Discussion
In this paper, we addressed some peculiarities of the flow over a light boxplane. By tuft flow visualization and CFD visualization, we explored the causes of a large zero lift pitching moment coefficient, lateral instability, difference in fore and aft elevator lift, and poor high lift performance of the aircraft. The investigation revealed that we should refine the methods for predicting the boxplane pitching moment coefficient and lateral stability derivatives. The low local Reynolds number causes an early flow separation from the elevators and flaperons when deflected downward at angles exceeding 10°.
Wind tunnel experiments provide an objective truth about values of the integrated aerodynamic coefficients of lift, drag, and moments. CFD codes, although generally failing to capture the correct values of total coefficients beyond the linear portion of the lift curve and near-stall conditions, still provide unmatched visualization insights into local flow fields. Particularly useful is the pressure field analysis adjacent and away from the test model surface, which is either impossible or very expensive to achieve in wind tunnels, and it reveals the true scale of both pressure drag and lift sources. Similarly, tufts in a turbulent flow do reveal separation onsets yet fail to show local directions of a turbulent flow, which is much better demonstrated by the computed velocity vectors, duplicating and supplementing pressure gradients and pointing towards the right directions where geometry should be improved.
Future work will include:
- Refinement of the analytical predictive models for a light boxplane;
- Trade studies and optimization of the aircraft geometry to better meet the performance requirements;
- Development of a code, specifically designing a light boxplane;
- Investigation of the effect of the airframe on the efficiency of the pusher propeller for this layout;
- Flight tests of the boxplane model.
Author Contributions
Conceptualization, E.K., D.G. and A.K.; methodology, A.K.; software, E.K. and D.G.; validation, D.G.; formal analysis, E.K.; investigation, E.K. and D.G.; data curation, E.K.; writing—original draft preparation, E.K.; writing—review and editing, D.G.; visualization, D.G.; wind tunnel testing, E.K., A.K. and N.S.; funding acquisition, A.K. All authors have read and agreed to the published version of the manuscript.
Funding
This work was financially supported by the Ministry of Education and Science of the Russian Federation, project No. FSFF-2020-0013.
Conflicts of Interest
The authors declare no conflict of interest.
References
- Lange, R.H.; Cahill, J.F.; Bradley, E.S.; Eudaily, R.R.; Jenness, C.M.; Macwilkinson, D.G. Feasibility Study of the Transonic Biplane Concept for Transport Aircraft Application. 1974. Available online: https://archive.org/details/NASA_NTRS_Archive_19740026364/mode/2up (accessed on 6 September 2021).
- Prandtl, L. Induced Drag of Multiplanes. Available online: https://archive.org/details/nasa_techdoc_19930080964/mode/2upttps://archive.org/details/nasa_techdoc_19930080964/mode/2up (accessed on 6 September 2021).
- Spohr, A.; Schirra, J.C.; Hoefling, J.; Schedl, A. Wing Weight estimation methodology for highly non-planar lifting systems during conceptual design. Dtsch. Luft-Und Raumfahrtkongress 2013. [Google Scholar] [CrossRef]
- Kalinovwski, M.J. Structural optimization of box wing aircraft. Arch. Mech. Eng. 2015, LXII, 45–60. [Google Scholar] [CrossRef] [Green Version]
- Schiktanz, D.; Scholts, D. Maximum Glide Ratio of Box Wing Aircraft—Fundamental Considerations. J. Hambg. Univ. Appl. Sci. 2001, 18. Available online: https://www.fzt.haw-hamburg.de/pers/Scholz/Airport2030/Airport2030_M_BoxWing_E_max_12-06-14.pdf (accessed on 6 September 2021).
- van Ginneken, D.; Voskuijl, M.; van Tooren, M.; Frediani, A. Automated Control Surface Design and Sizing for the Prandtl Plane. In Proceedings of the 51st AIAA/ASME/ASCE/AHS/ASC Structures, Structural Dynamics, and Materials Conference 18th AIAA/ASME/AHS Adaptive Structures Conference, Orlando, FL, USA, 12–15 April 2010. [Google Scholar]
- Miranda, L. Boxplane Wing and Aircraft. U.S. Patent Application No. US3834654A, 10 September 1974. Available online: https://patents.google.com/patent/US3834654A/ (accessed on 6 September 2021).
- Peters, S.E. Aircraft Structure to Improve Directional Stability. U.S. Patent Application No. US6098923A, 8 August 2008. Available online: https://patents.google.com/patent/US6098923A/ (accessed on 6 September 2021).
- Frediani, A.; Gasperini, M.; Saporito, G.; Rimondi, A. The development of a PrandtlPlane aircraft configuration. In Proceedings of the 17th AIDAA Congress, Roma, Italy, 15–19 September 2003. [Google Scholar]
- Frediani, A.; Rizzo, E.; Cipolla, V.; Chiavacci, L.; Bottoni, C.; Scanu, J.; Iezzi, G. Development of ULM PrandtlPlane aircraft and flight tests on scaled models. In Proceedings of the Xix Aidaa Congress, XIX CONGRESSO NAZIONALE AIDAA, Milan, Italy, 17–21 September 2007. [Google Scholar]
- Airkraft Sunny–Wikipedia. Available online: https://en.wikipedia.org/wiki/Airkraft_Sunny (accessed on 6 September 2021).
- Ligeti Stratos—Nest of Dragons. Available online: https://www.nestofdragons.net/weird-airplanes/tandemwings/ligeti-stratos/ (accessed on 6 September 2021).
- Andrews, S.A.; Perez, R.E. Analytic Study of the Conditions Required for Longitudinal Stability of Dual-Wing Aircraft. Proc. Inst. Mech. Eng. Part G J. Aerosp. Eng. 2017, 232, 958–972. [Google Scholar] [CrossRef]
- Frediani, A. The Prandtl Wing: Innovative Configurations and Advanced Concepts for Future Civil Transport Aircraft; Von Karman Institute for Fluid Dynamics: Sint-Genesius-Rode, Belgium, 2005. [Google Scholar]
- Parsifal Project. Available online: https://parsifalproject.eu/ (accessed on 6 September 2021).
- IDINTOS: Light Amphibious PrandtlPlane. Available online: http://www.idintos.eu/eng/ (accessed on 6 September 2021).
- Karpovich, E.A.; Liseitsev, N.K. Analytical Evaluation of Box Wing Aircraft Aerodynamic Characteristics at Early Design Stages. Russ. Aeronaut. 2019, 62, 417–422. [Google Scholar] [CrossRef]
- Karpovich, E.; Liseitsev, N. Revisiting the Longitudinal Stability and Balance of a Boxwing Aircraft. PNRPU Aerosp. Eng. Bull. 2019, 56, 29–44. [Google Scholar] [CrossRef]
- Karpovich, E.A.; Kochurova, N.I.; Kuznetsov, A.V. Experimental Study of Aerodynamic Characteristics of a Boxplane Wind-Tunnel Model. Russ. Aeronaut. 2020, 63, 659–668. [Google Scholar] [CrossRef]
- Steinfurth, B.; Cura, C.; Gehring, J.; Weiss, J. Tuft deflection velocimetry: A simple method to extract quantitative flow field information. Exp. Fluids 2020, 61, 1–11. [Google Scholar] [CrossRef]
- Simpson, R.L. Aspects of turbulent boundary-layer separation. Prog. Aerosp. Sci. 1996, 32, 457–521. [Google Scholar] [CrossRef]
- Abbott, I.; Sherman, A. Flow Observations with Tufts and Lampblack of the Stalling of Four Typical Airfoil Sections in the N.A.C.A. Variable-Density Tunnel; Technical Note No. 672; National Advisory Committee for Aeronautics: Washington, DC, USA, 1938. [Google Scholar]
- Ruchała, P. Aerodynamic Interference between Pusher Propeller Slipstream and An Airframe: Literature Review. J. KONES Powertrain Transp. 2017, 24, 237–244. [Google Scholar] [CrossRef]
- Vey, S.; Lang, H.M.; Nayeri, C.N.; Paschereit, C.O.; Pechlivanoglou, G. Extracting quantitative data from tuft flow visualizations on utility scale wind turbines. J. Phys. Conf. Ser. 2014, 524, 012011. [Google Scholar] [CrossRef] [Green Version]
- Bardina, J.; Huang, P.; Coakley, T. Turbulence modeling validation. In Proceedings of the 28th AIAA Fluid Dynamics Conference, Snowmass Village, CO, USA, 29 June–2 July 1997. [Google Scholar] [CrossRef]
- Zhang, C.; Bounds, C.P.; Foster, L.; Uddin, M. Turbulence Modeling Effects on the CFD Predictions of Flow over a Detailed Full-Scale Sedan Vehicle. Fluids 2019, 4, 148. [Google Scholar] [CrossRef] [Green Version]
- Gueraiche, D.; Popov, S. Winglet Geometry Impact on DLR-F4 Aerodynamics and an Analysis of a Hyperbolic Winglet Concept. Aerospace 2017, 4, 60. [Google Scholar] [CrossRef] [Green Version]
- Sclafani, A.; DeHaan, M.; Vassberg, J.; Rumsey, C.; Pulliam, T. Drag Prediction for the NASA CRM Wing-Body-Tail Using CFL3D and OVERFLOW on an Overset Mesh. In Proceedings of the 28th AIAA Applied Aerodynamics Conference, Chicago, IL, USA, 28 June–1 July 2010. [Google Scholar]
- Wilcox, D.C. Multiscale model for turbulent flows. AIAA J. 1988, 26, 1311–1320. [Google Scholar] [CrossRef]
Figure 1.
General view of the light boxplane model, geometry taken from [19].
Figure 1.
General view of the light boxplane model, geometry taken from [19].
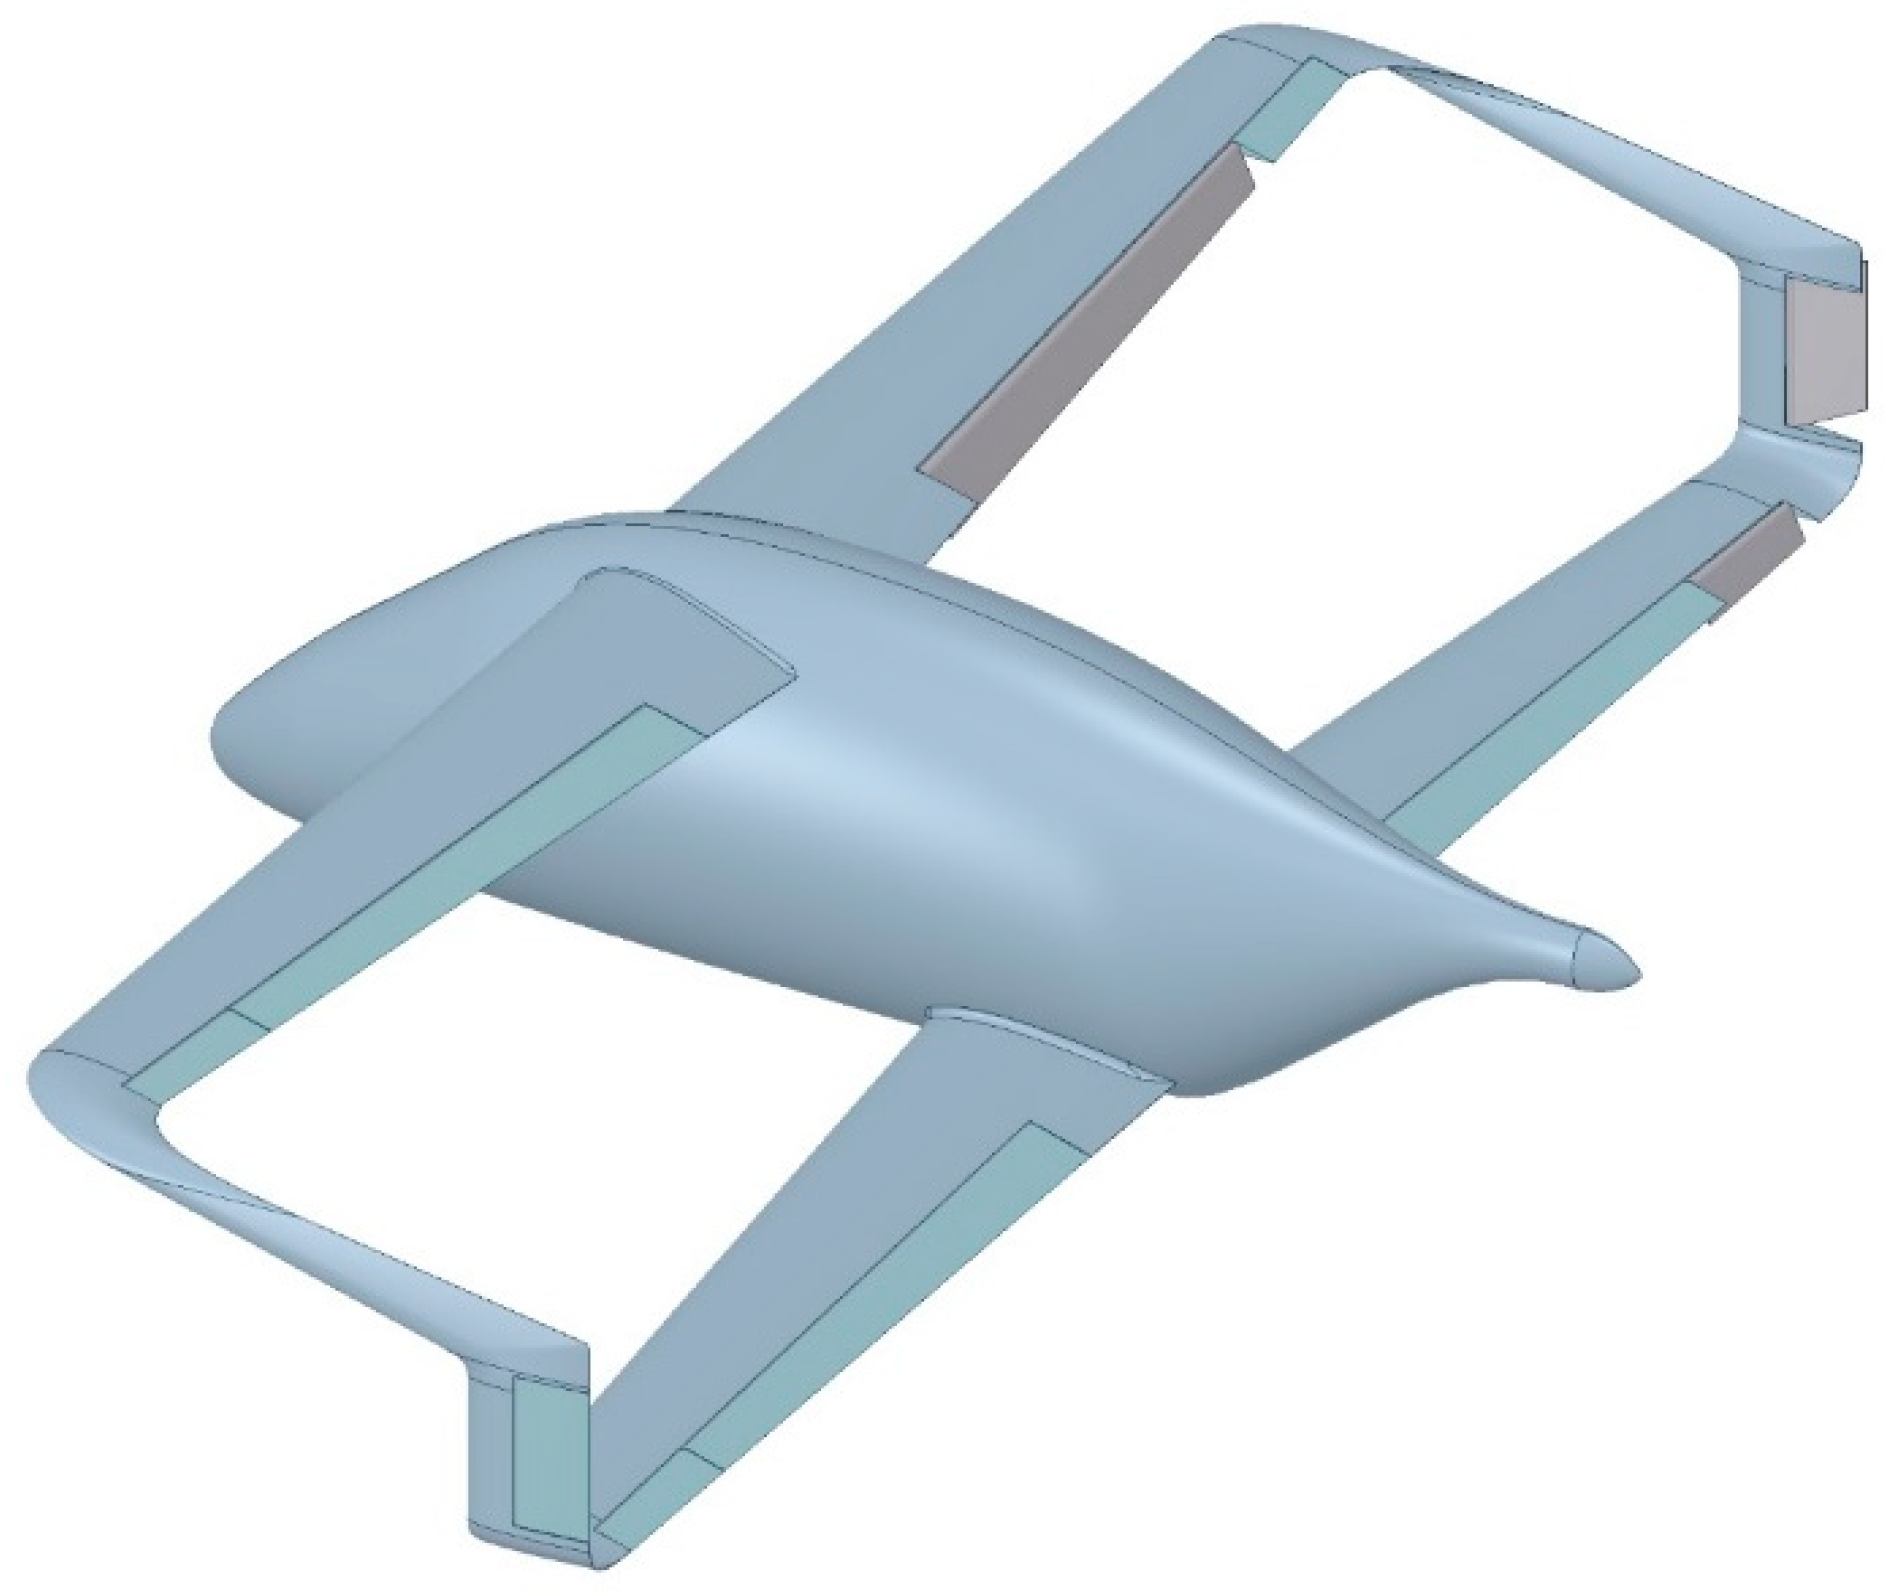
Figure 2.
Arrangement of control surfaces on the boxplane wings, geometry taken from [19].
Figure 2.
Arrangement of control surfaces on the boxplane wings, geometry taken from [19].
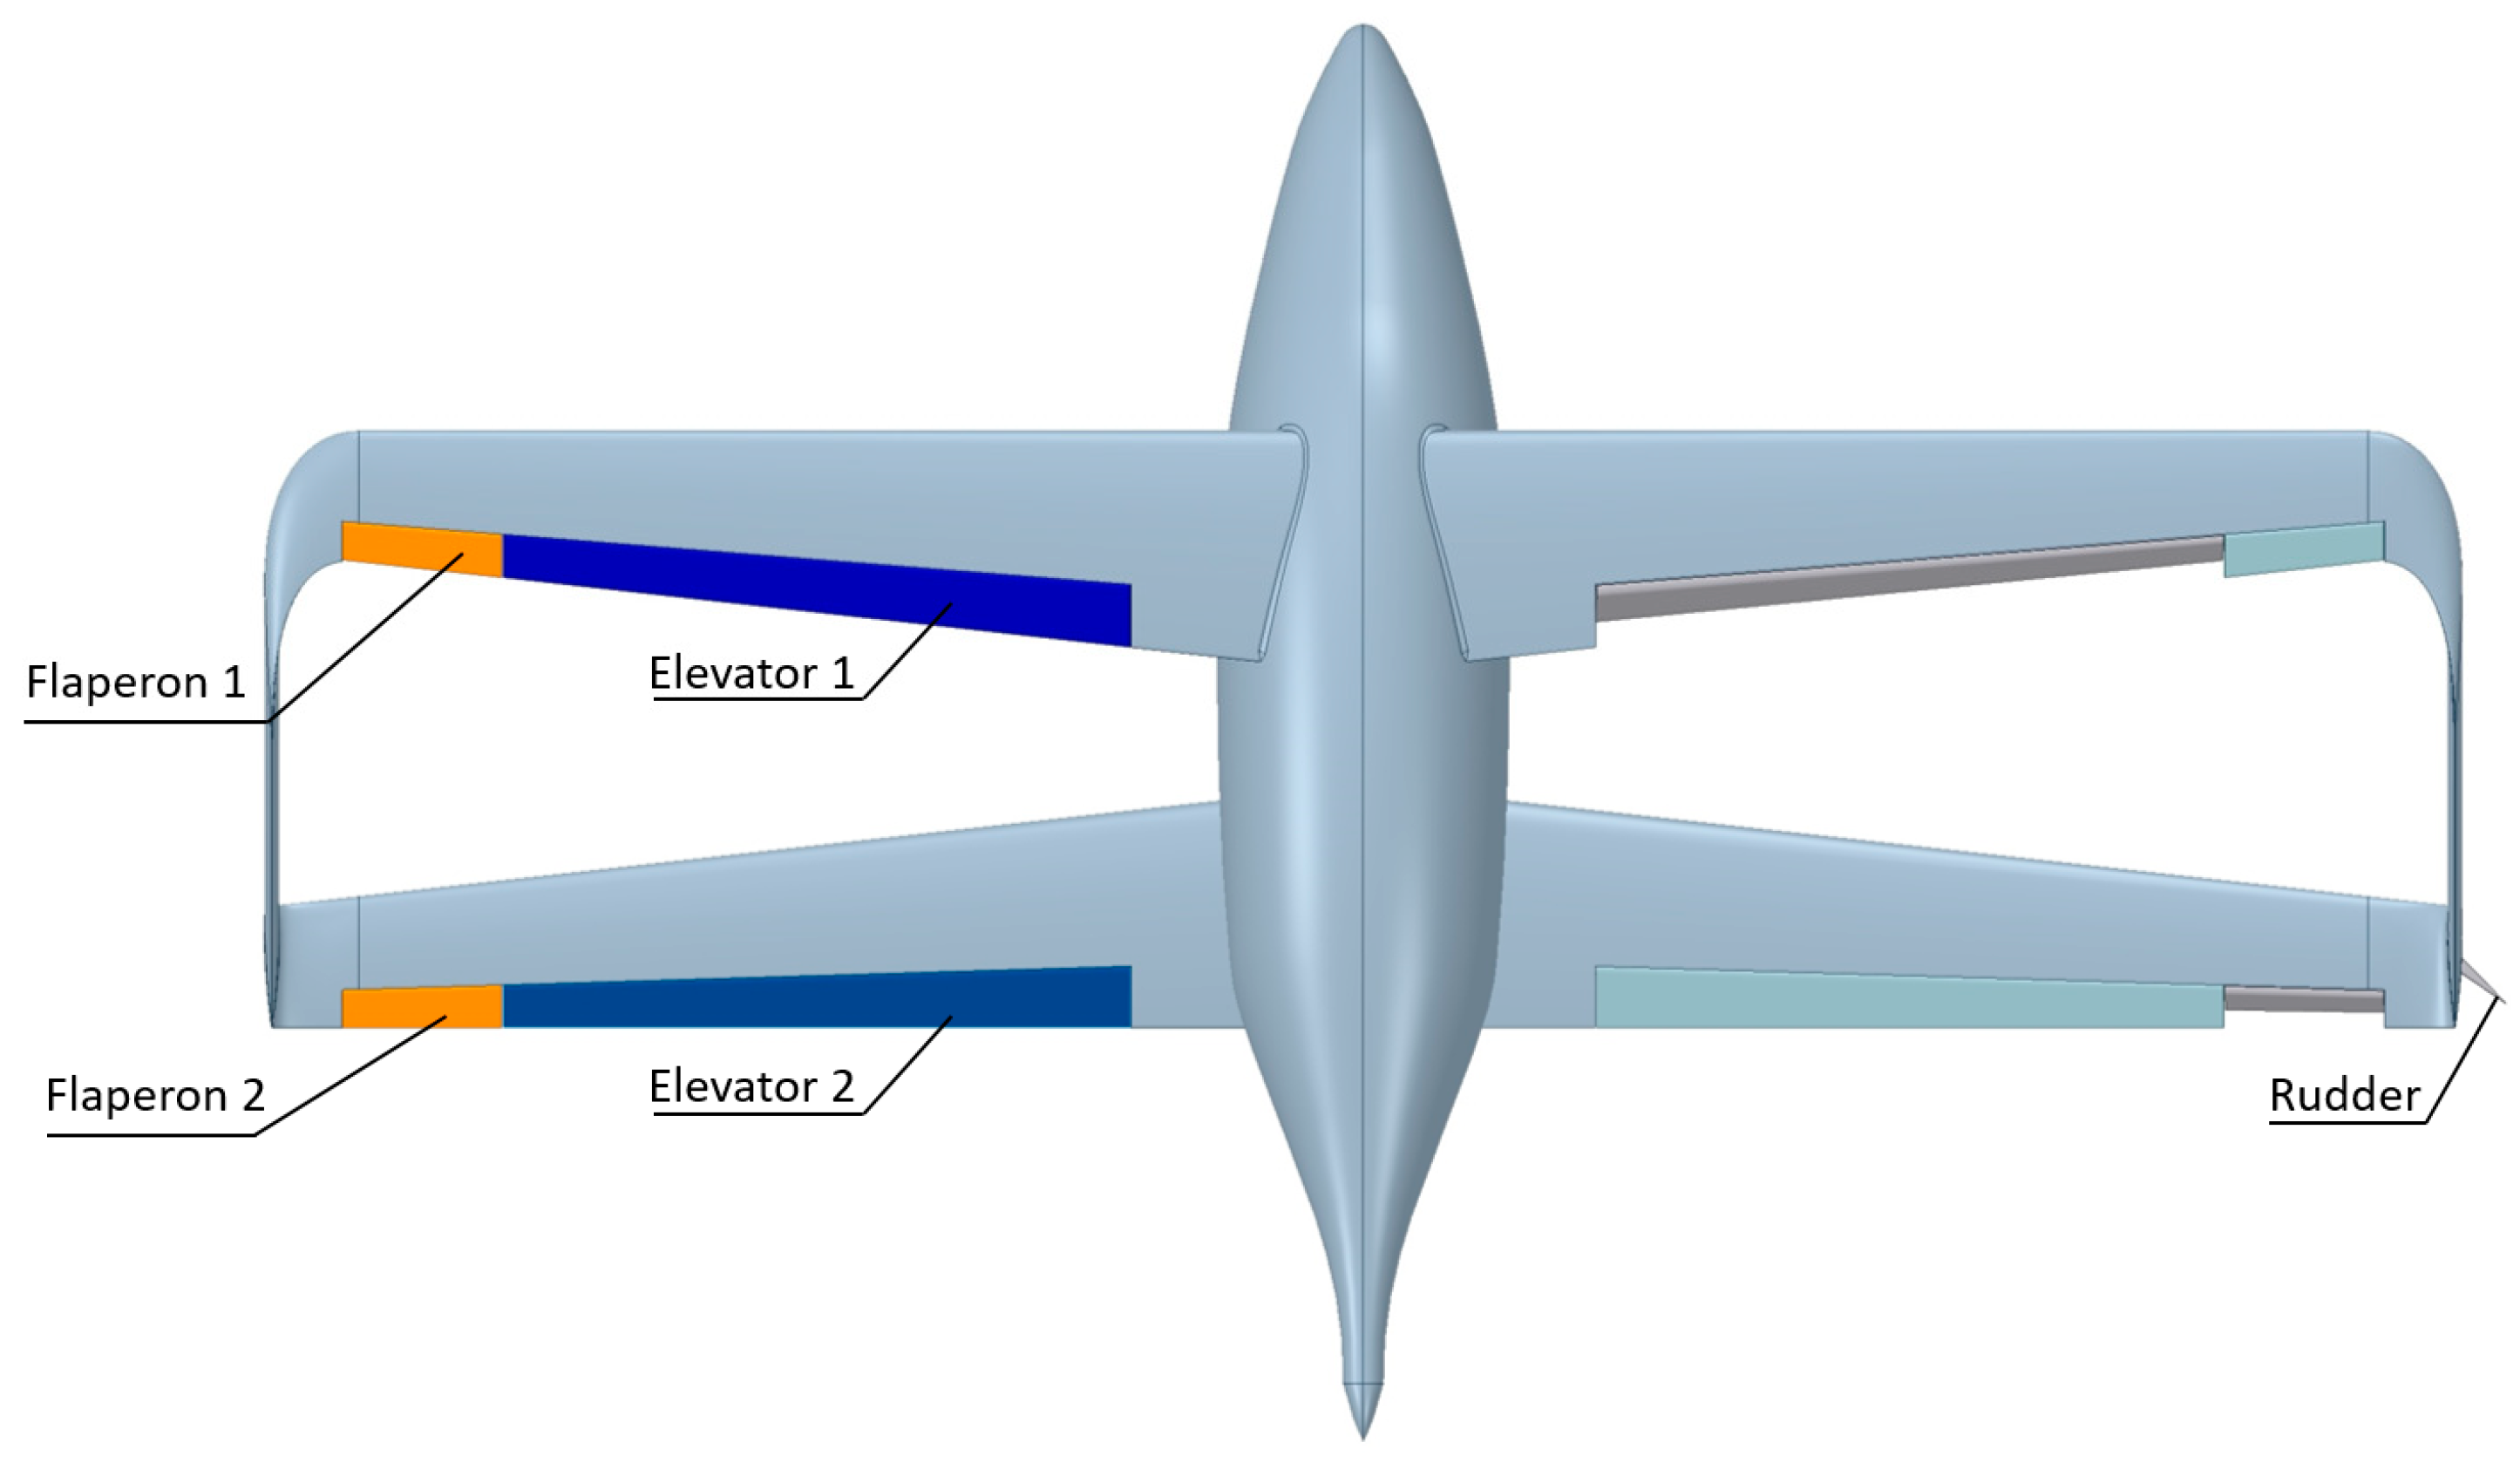
Figure 3.
Fragments of the computational domain and local mesh.
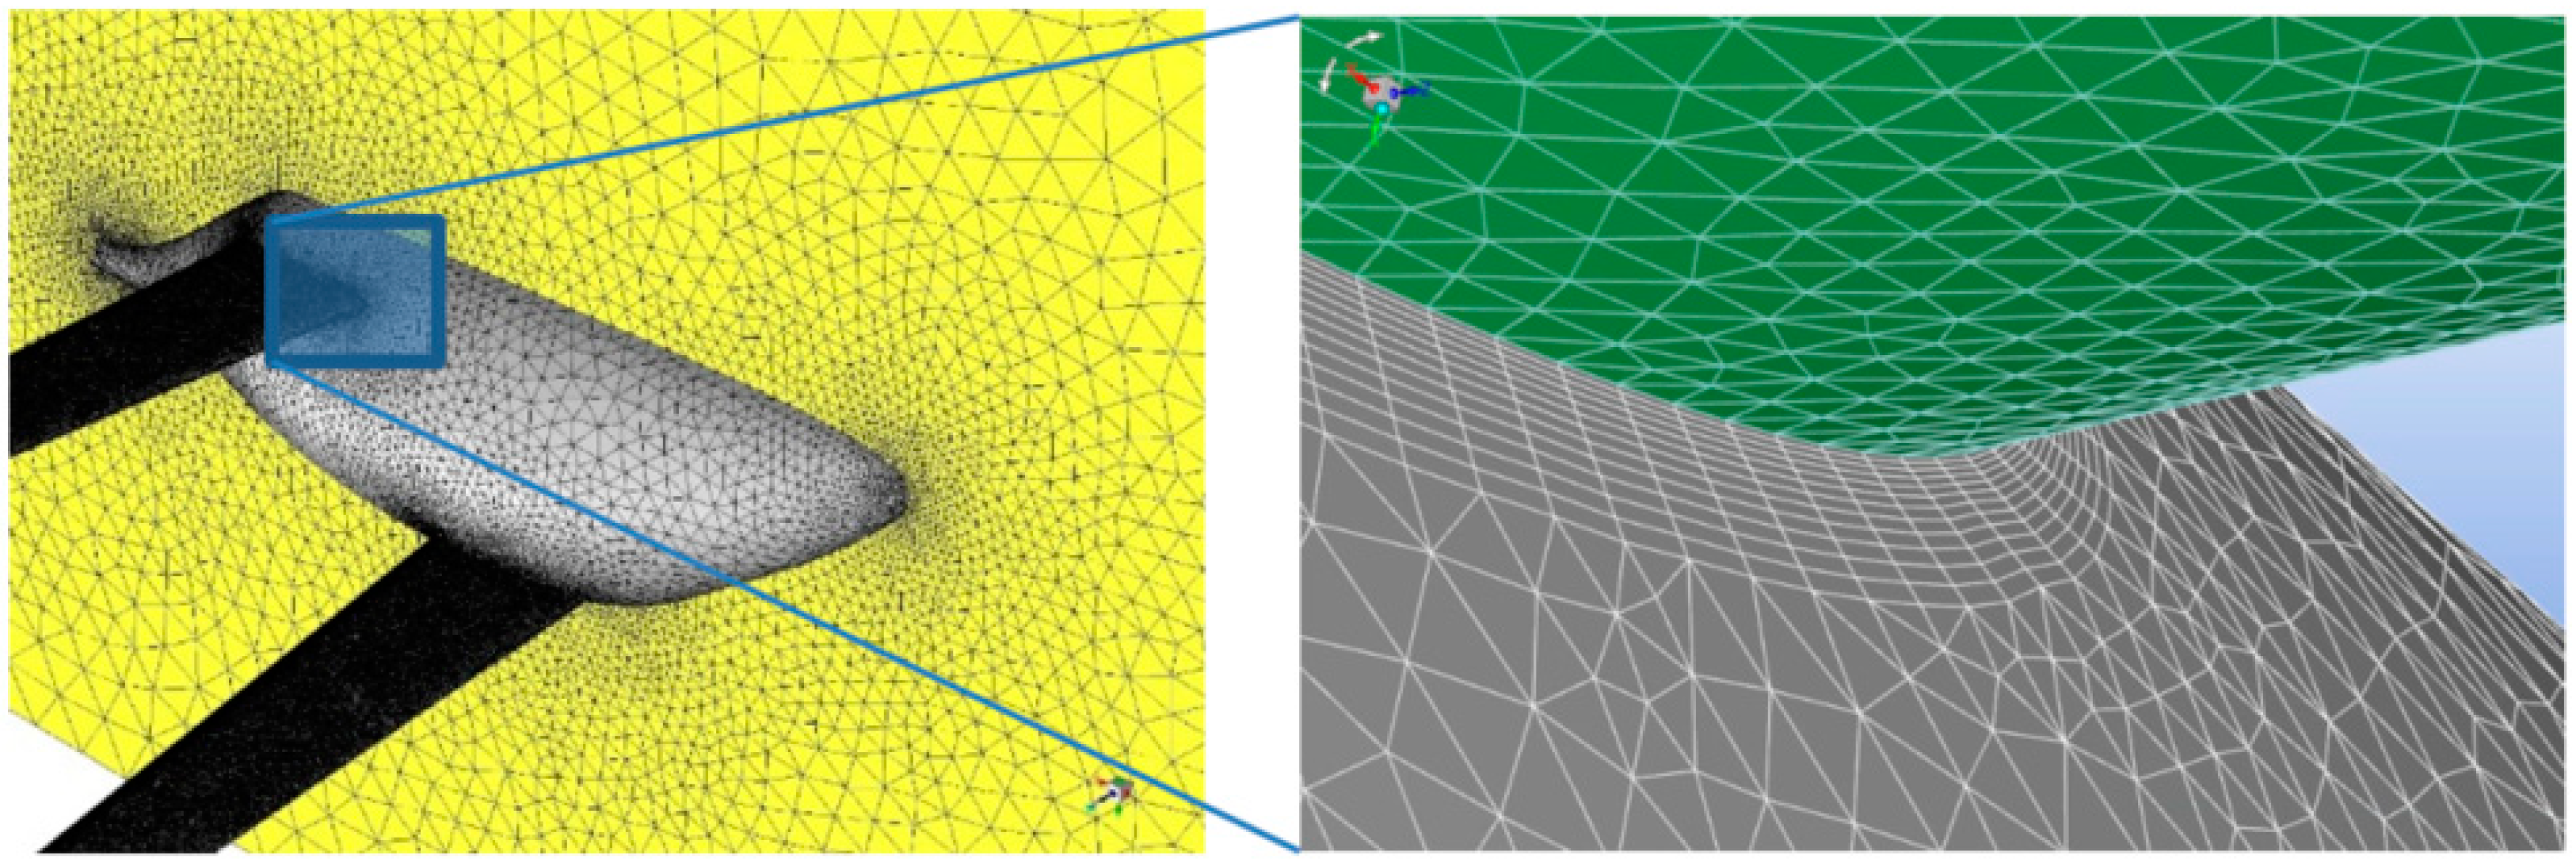
Figure 4.
Distribution of wall Y+ values on the wings and fuselage surface.

Figure 5.
Computed lift coefficient values versus those obtained in wind tunnel experiment.
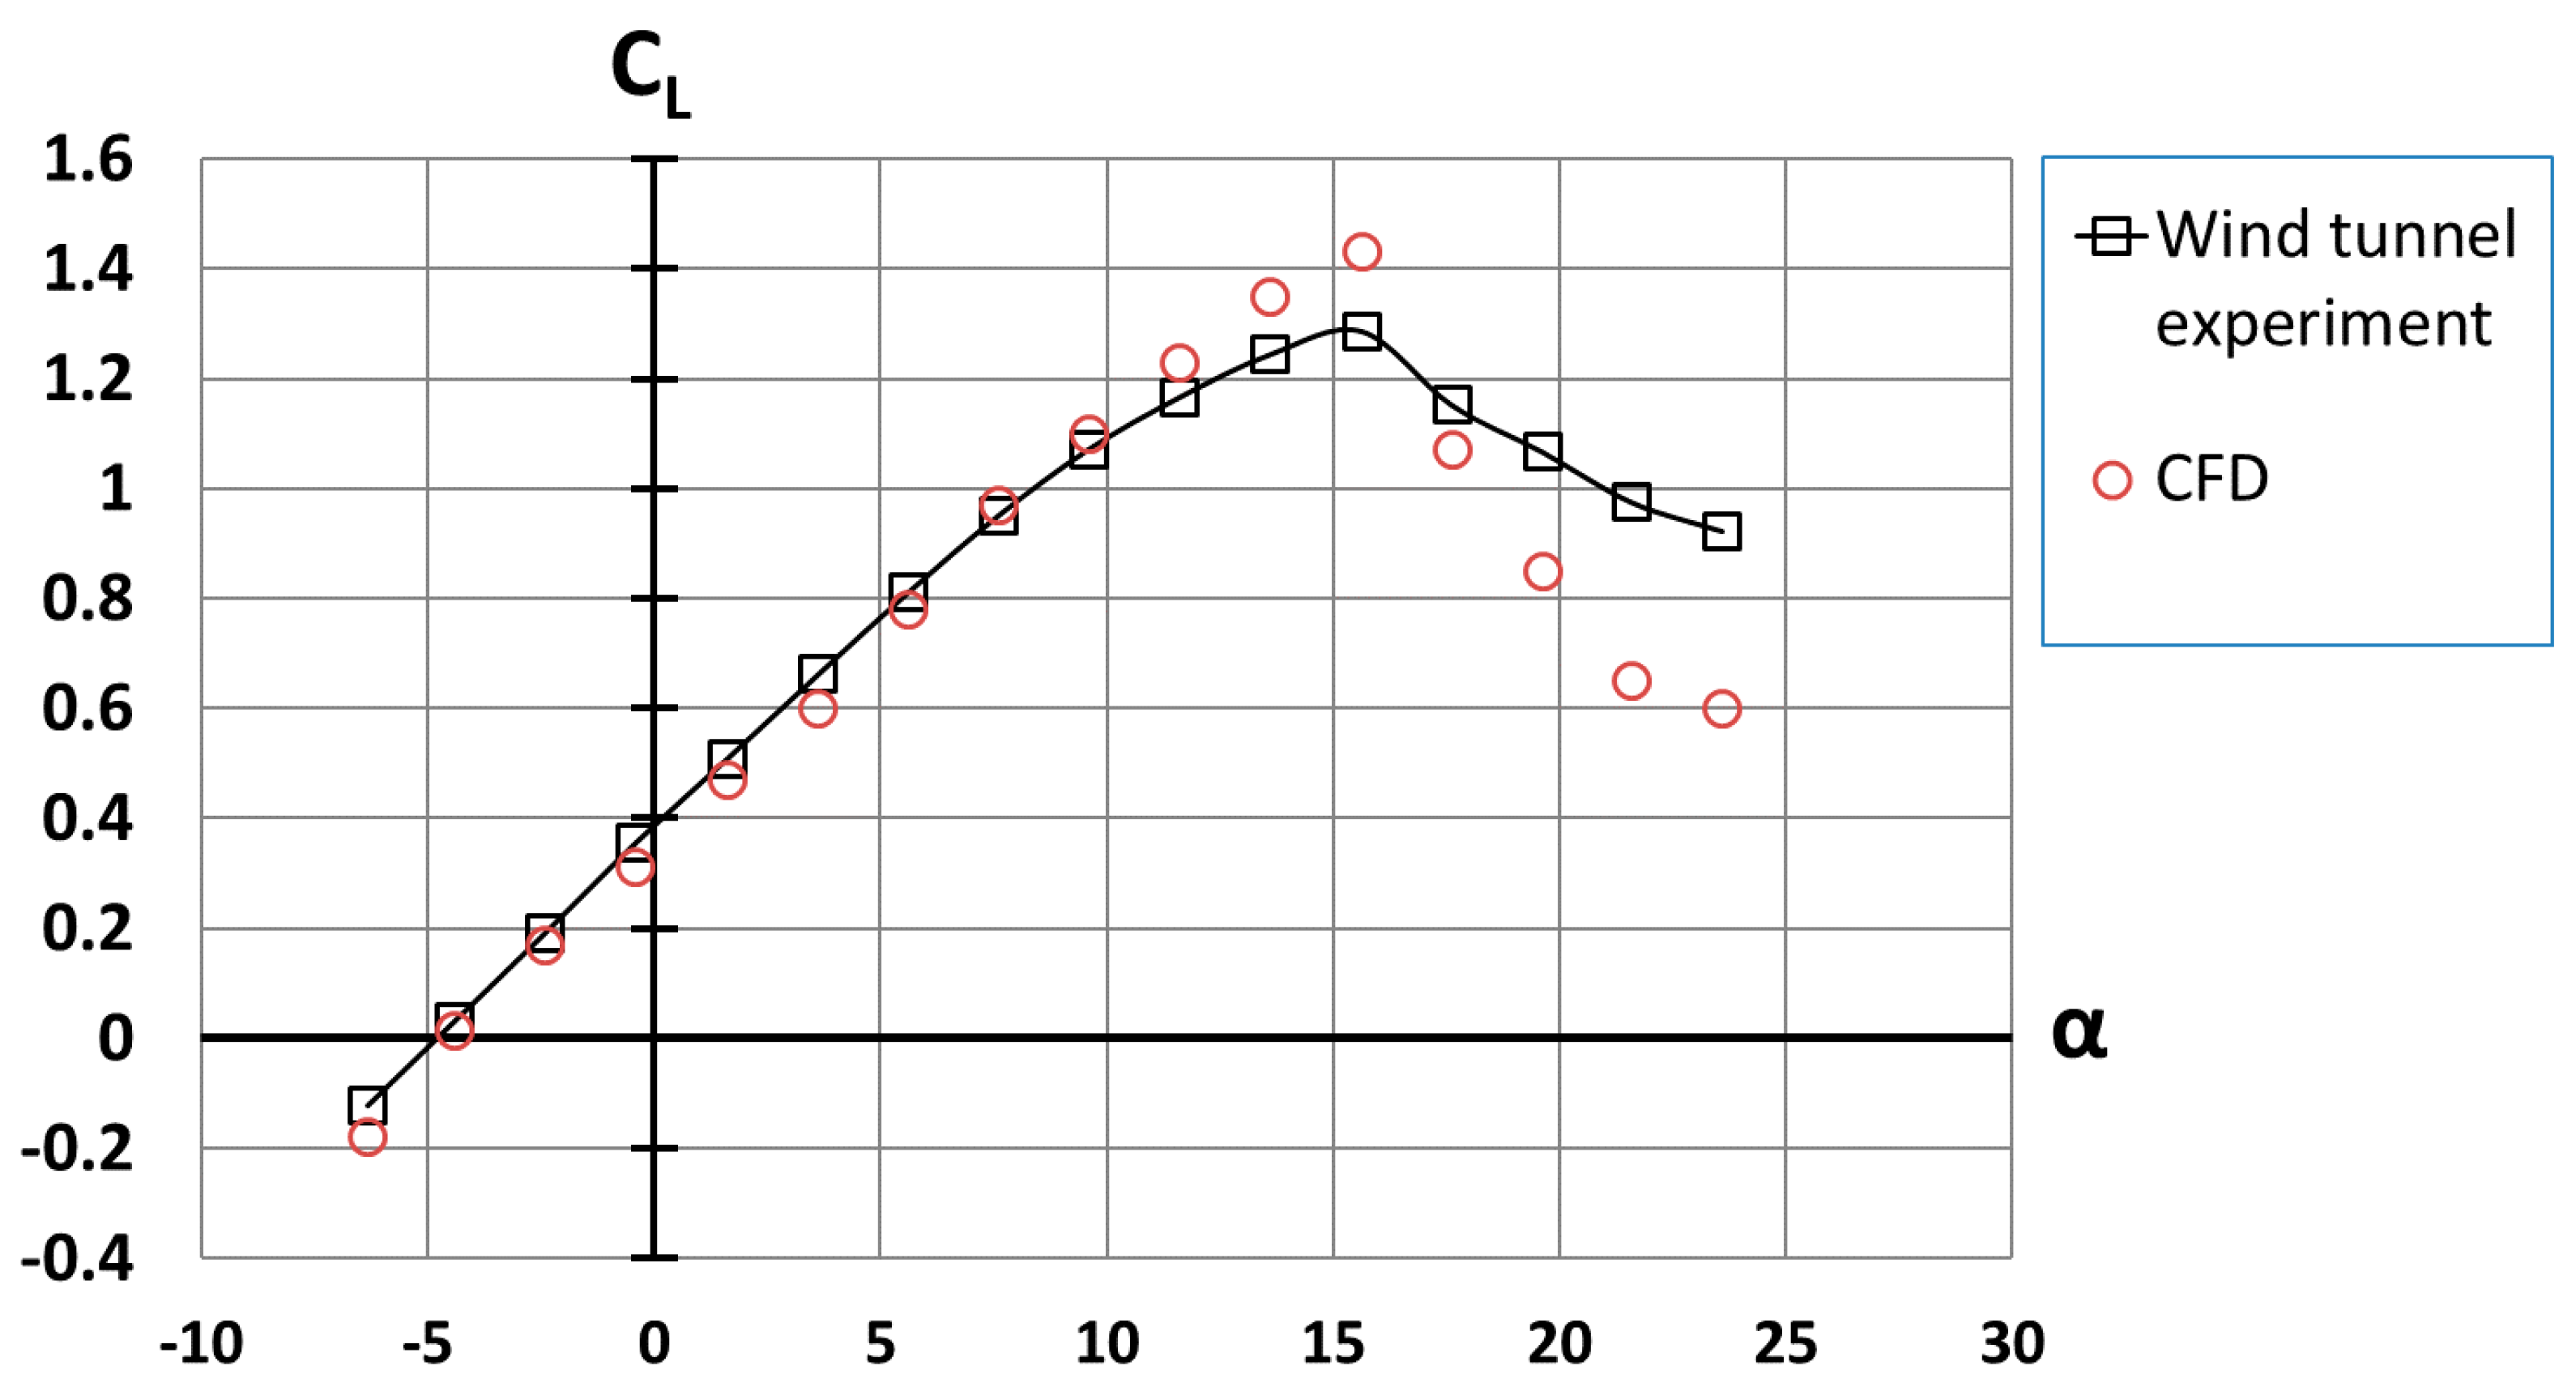
Figure 6.
Computed drag coefficient CD versus wind tunnel data.
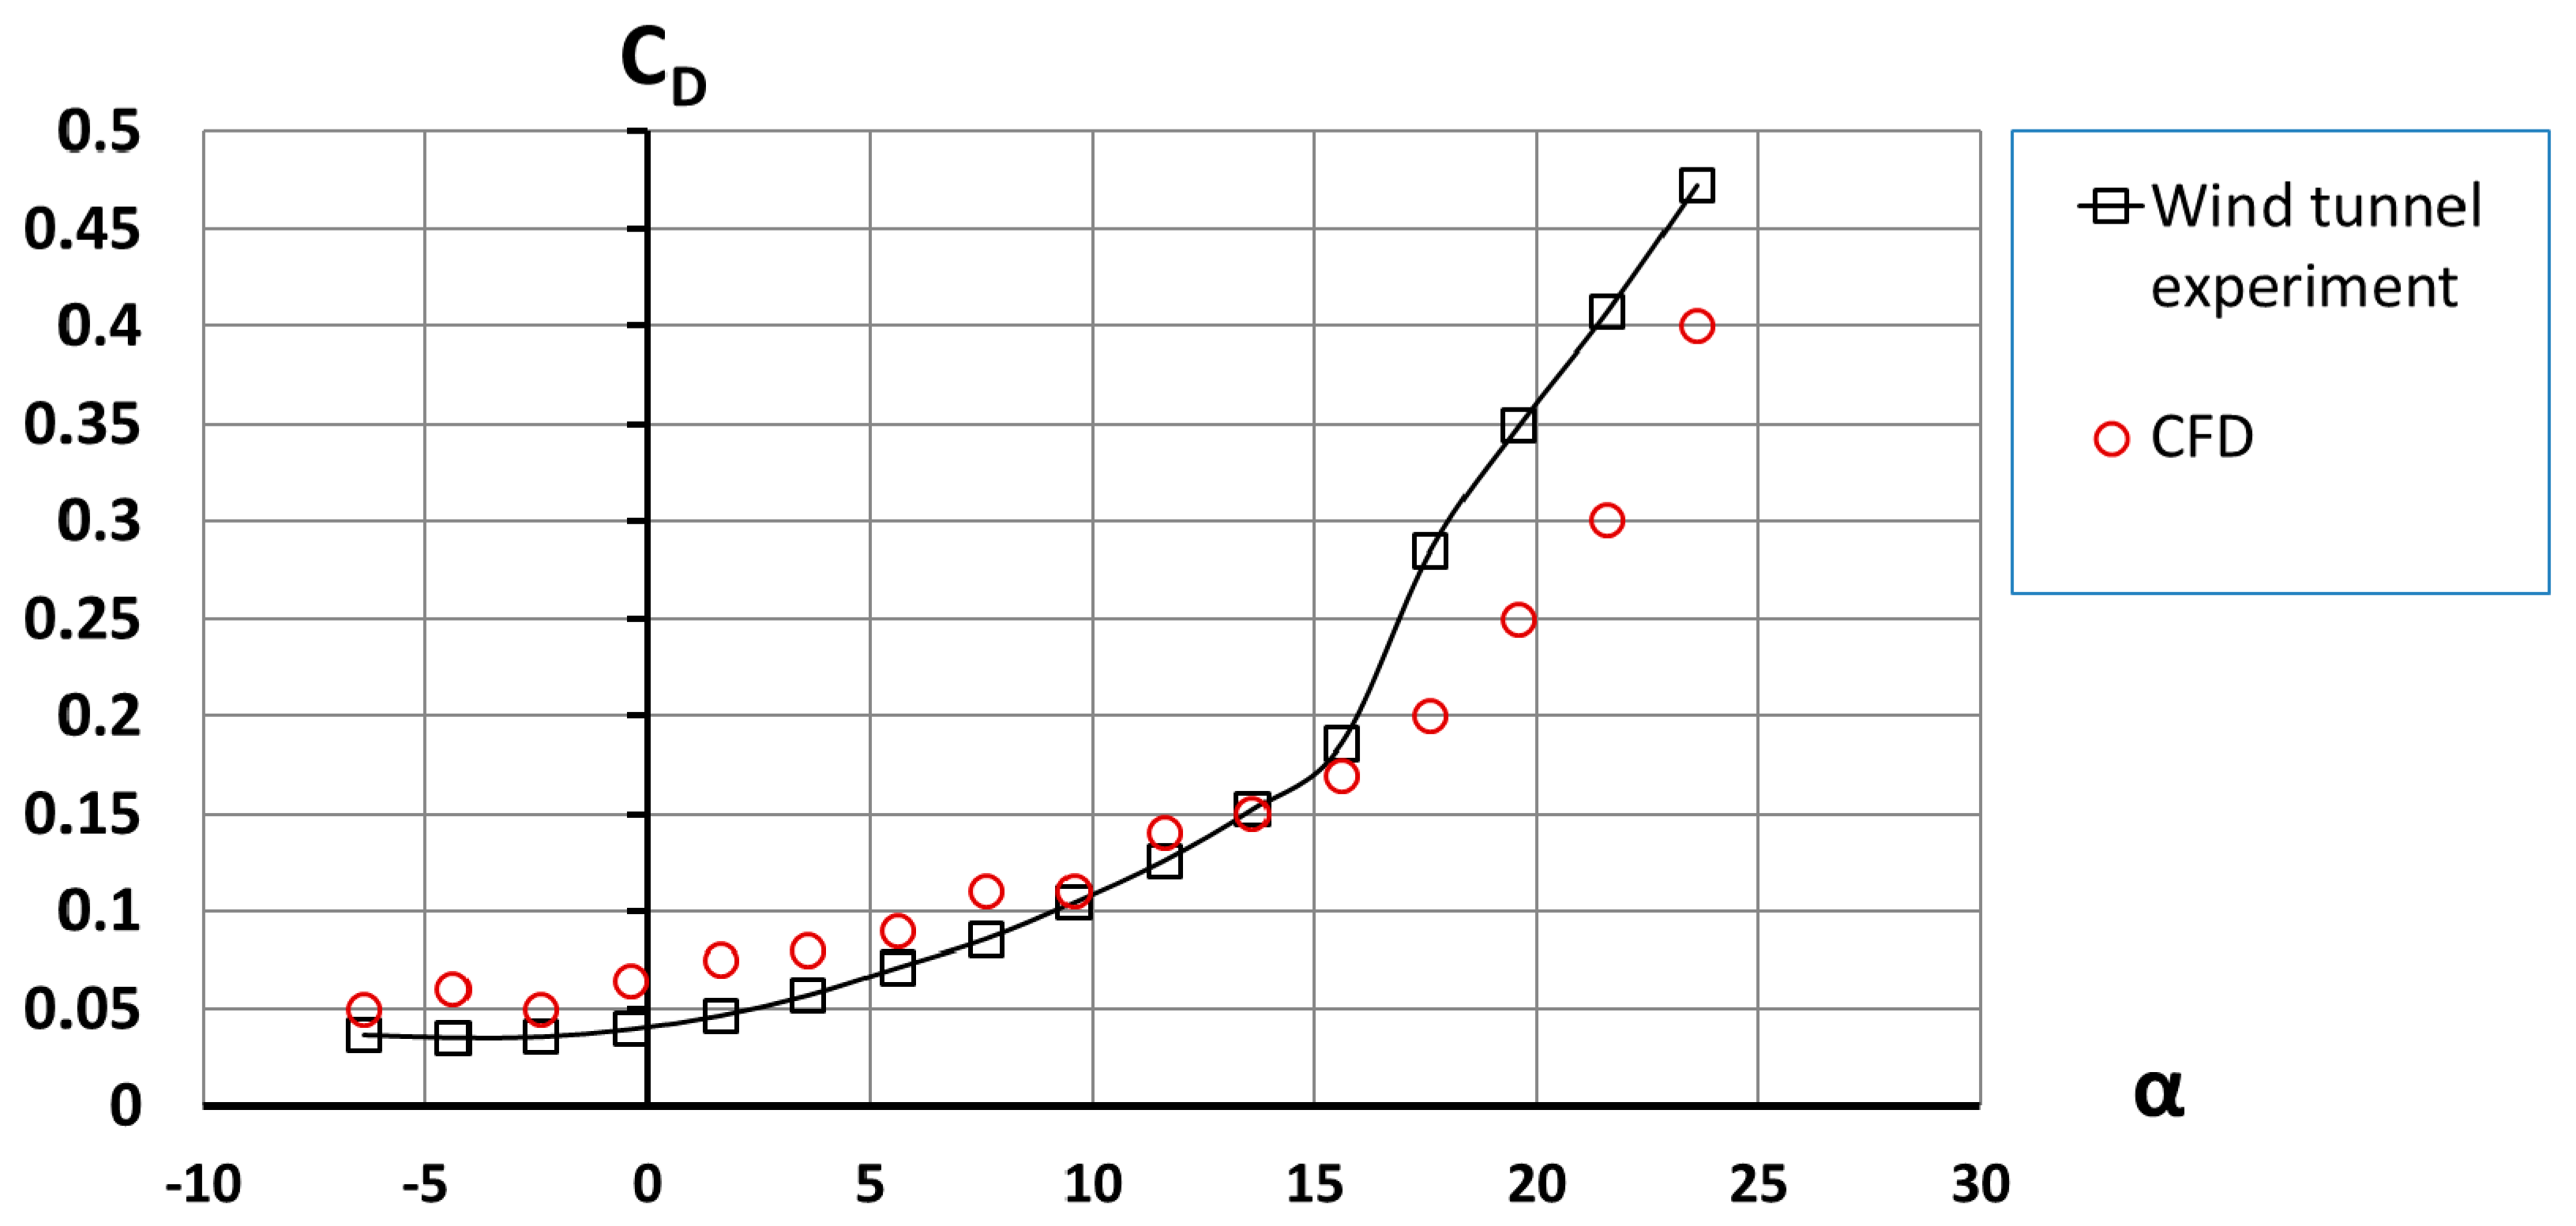
Figure 7.
Test conditions: α = 15°, β = 0°, cruise configuration (high-lift devices retracted).

Figure 8.
Front wing–body junction area flow field visualization and directions of reverse flow from beneath the wing to the fuselage and into the wing upper surface.
Figure 8.
Front wing–body junction area flow field visualization and directions of reverse flow from beneath the wing to the fuselage and into the wing upper surface.
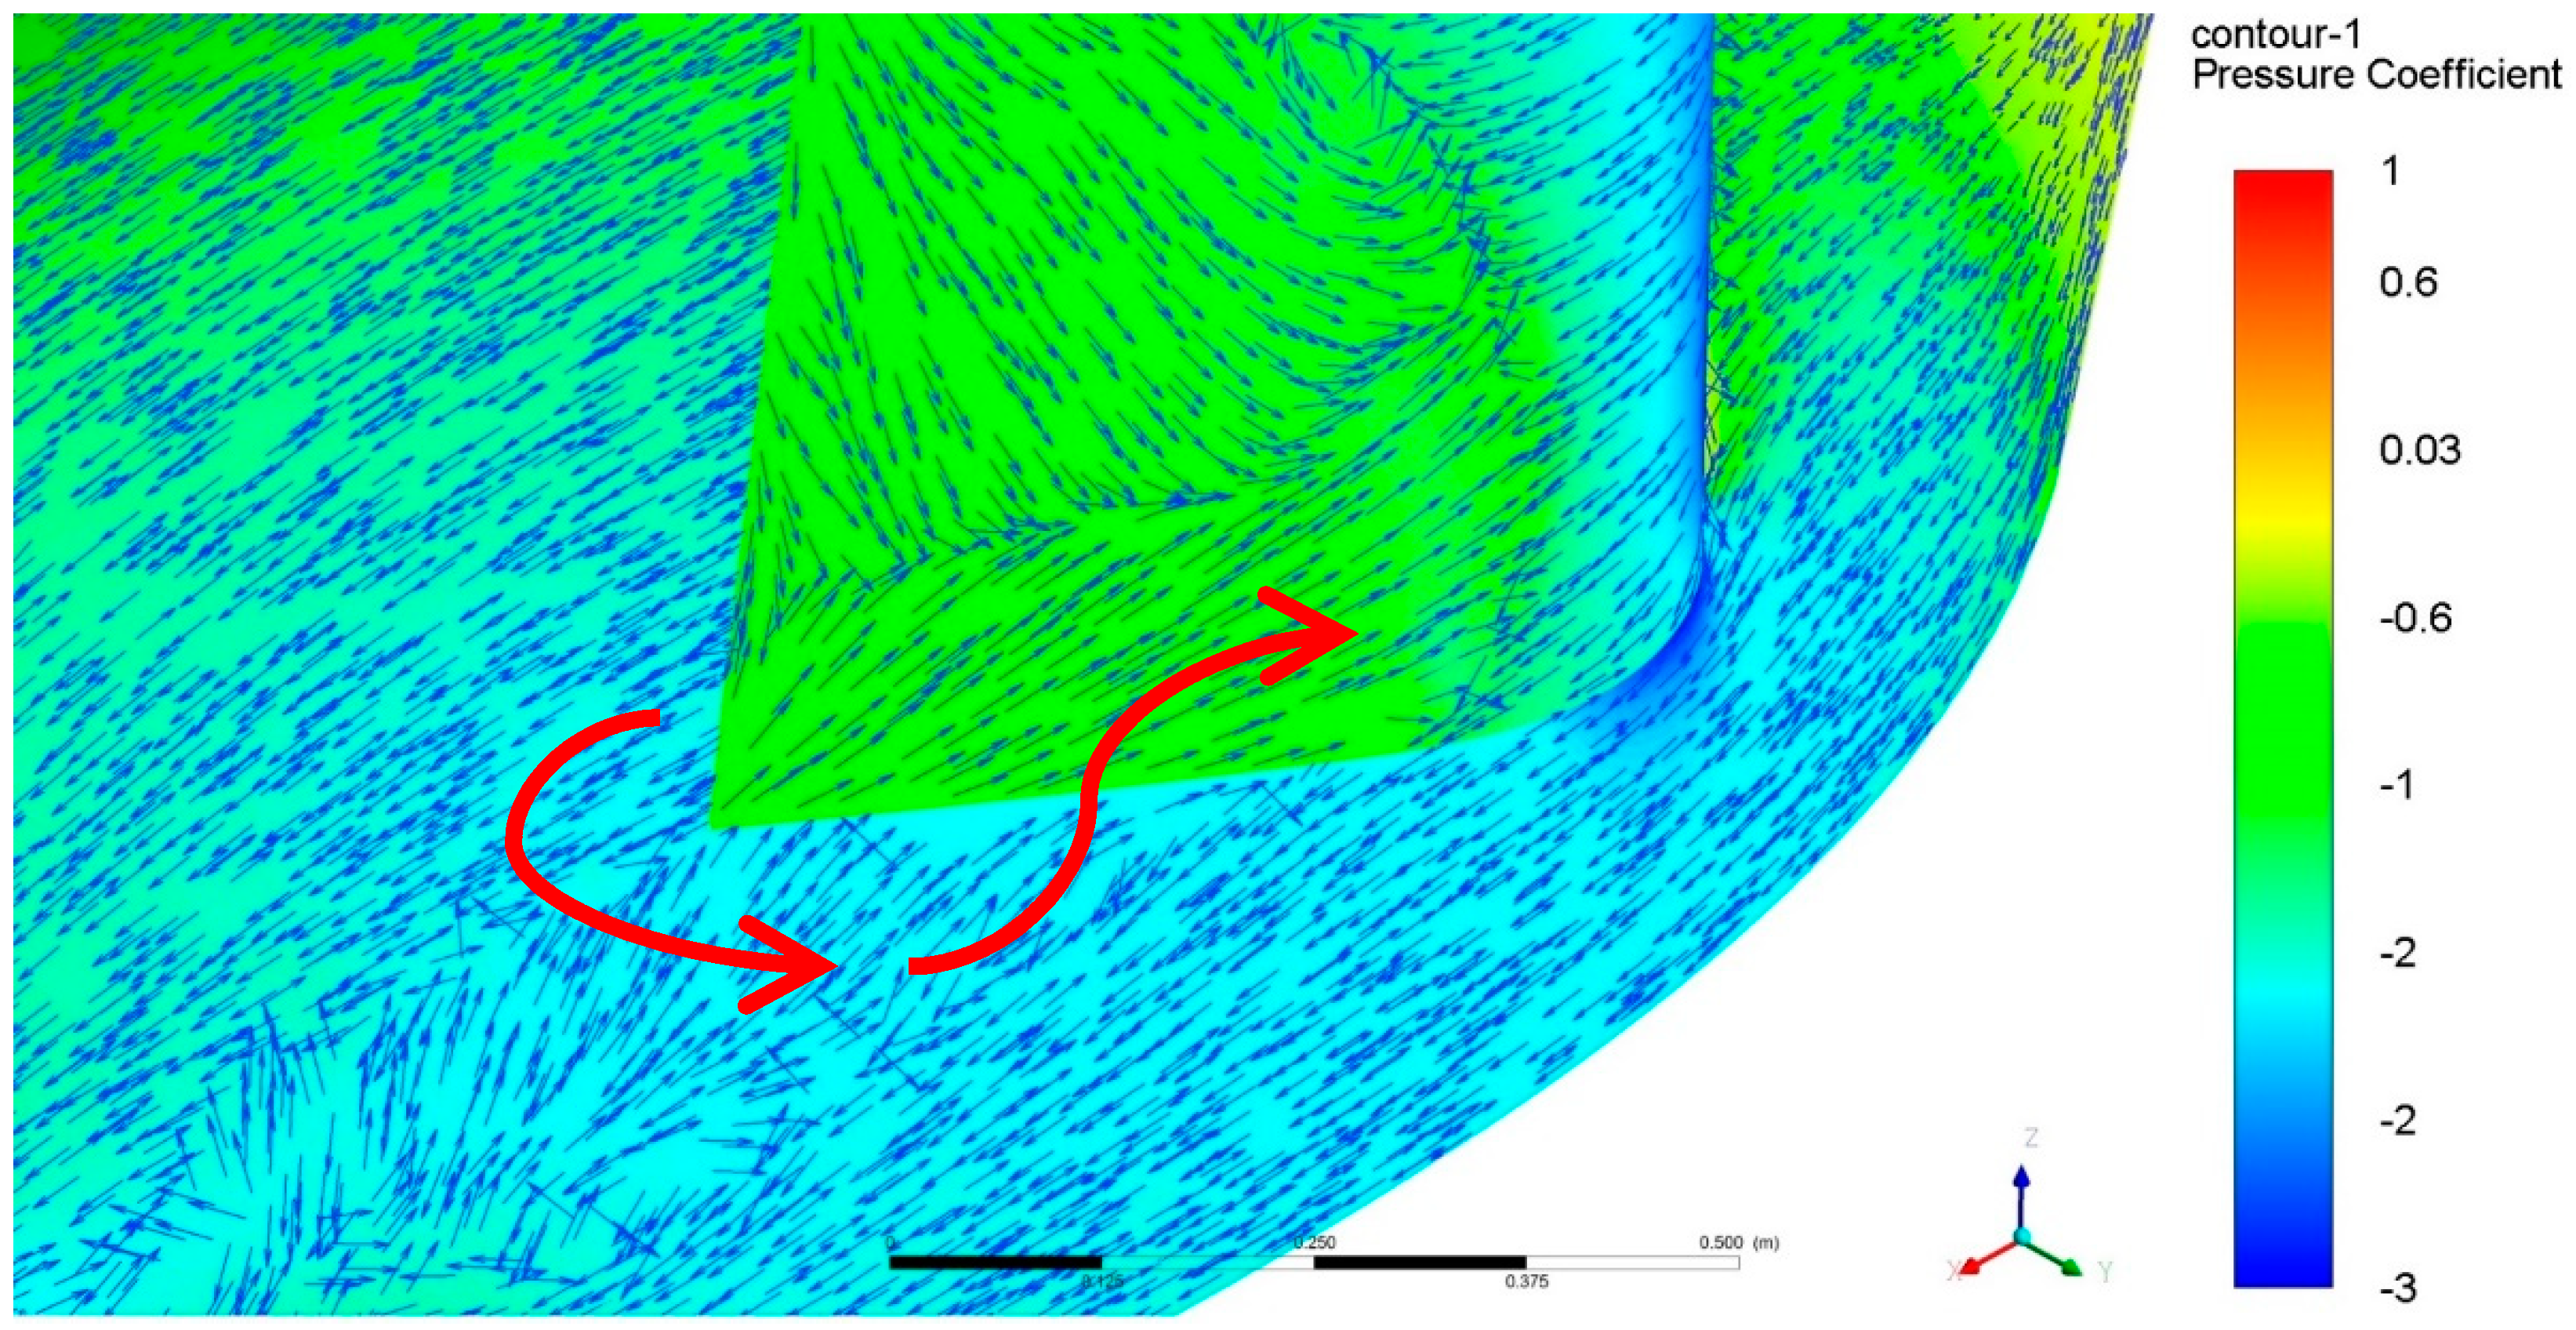
Figure 9.
Aft–wing–body flow field visualization and direction of reverse flow on the aft body.

Figure 10.
Pressure and velocity in a section plane near the fore–wing–body junction area showing the fuselage lift contribution.
Figure 10.
Pressure and velocity in a section plane near the fore–wing–body junction area showing the fuselage lift contribution.
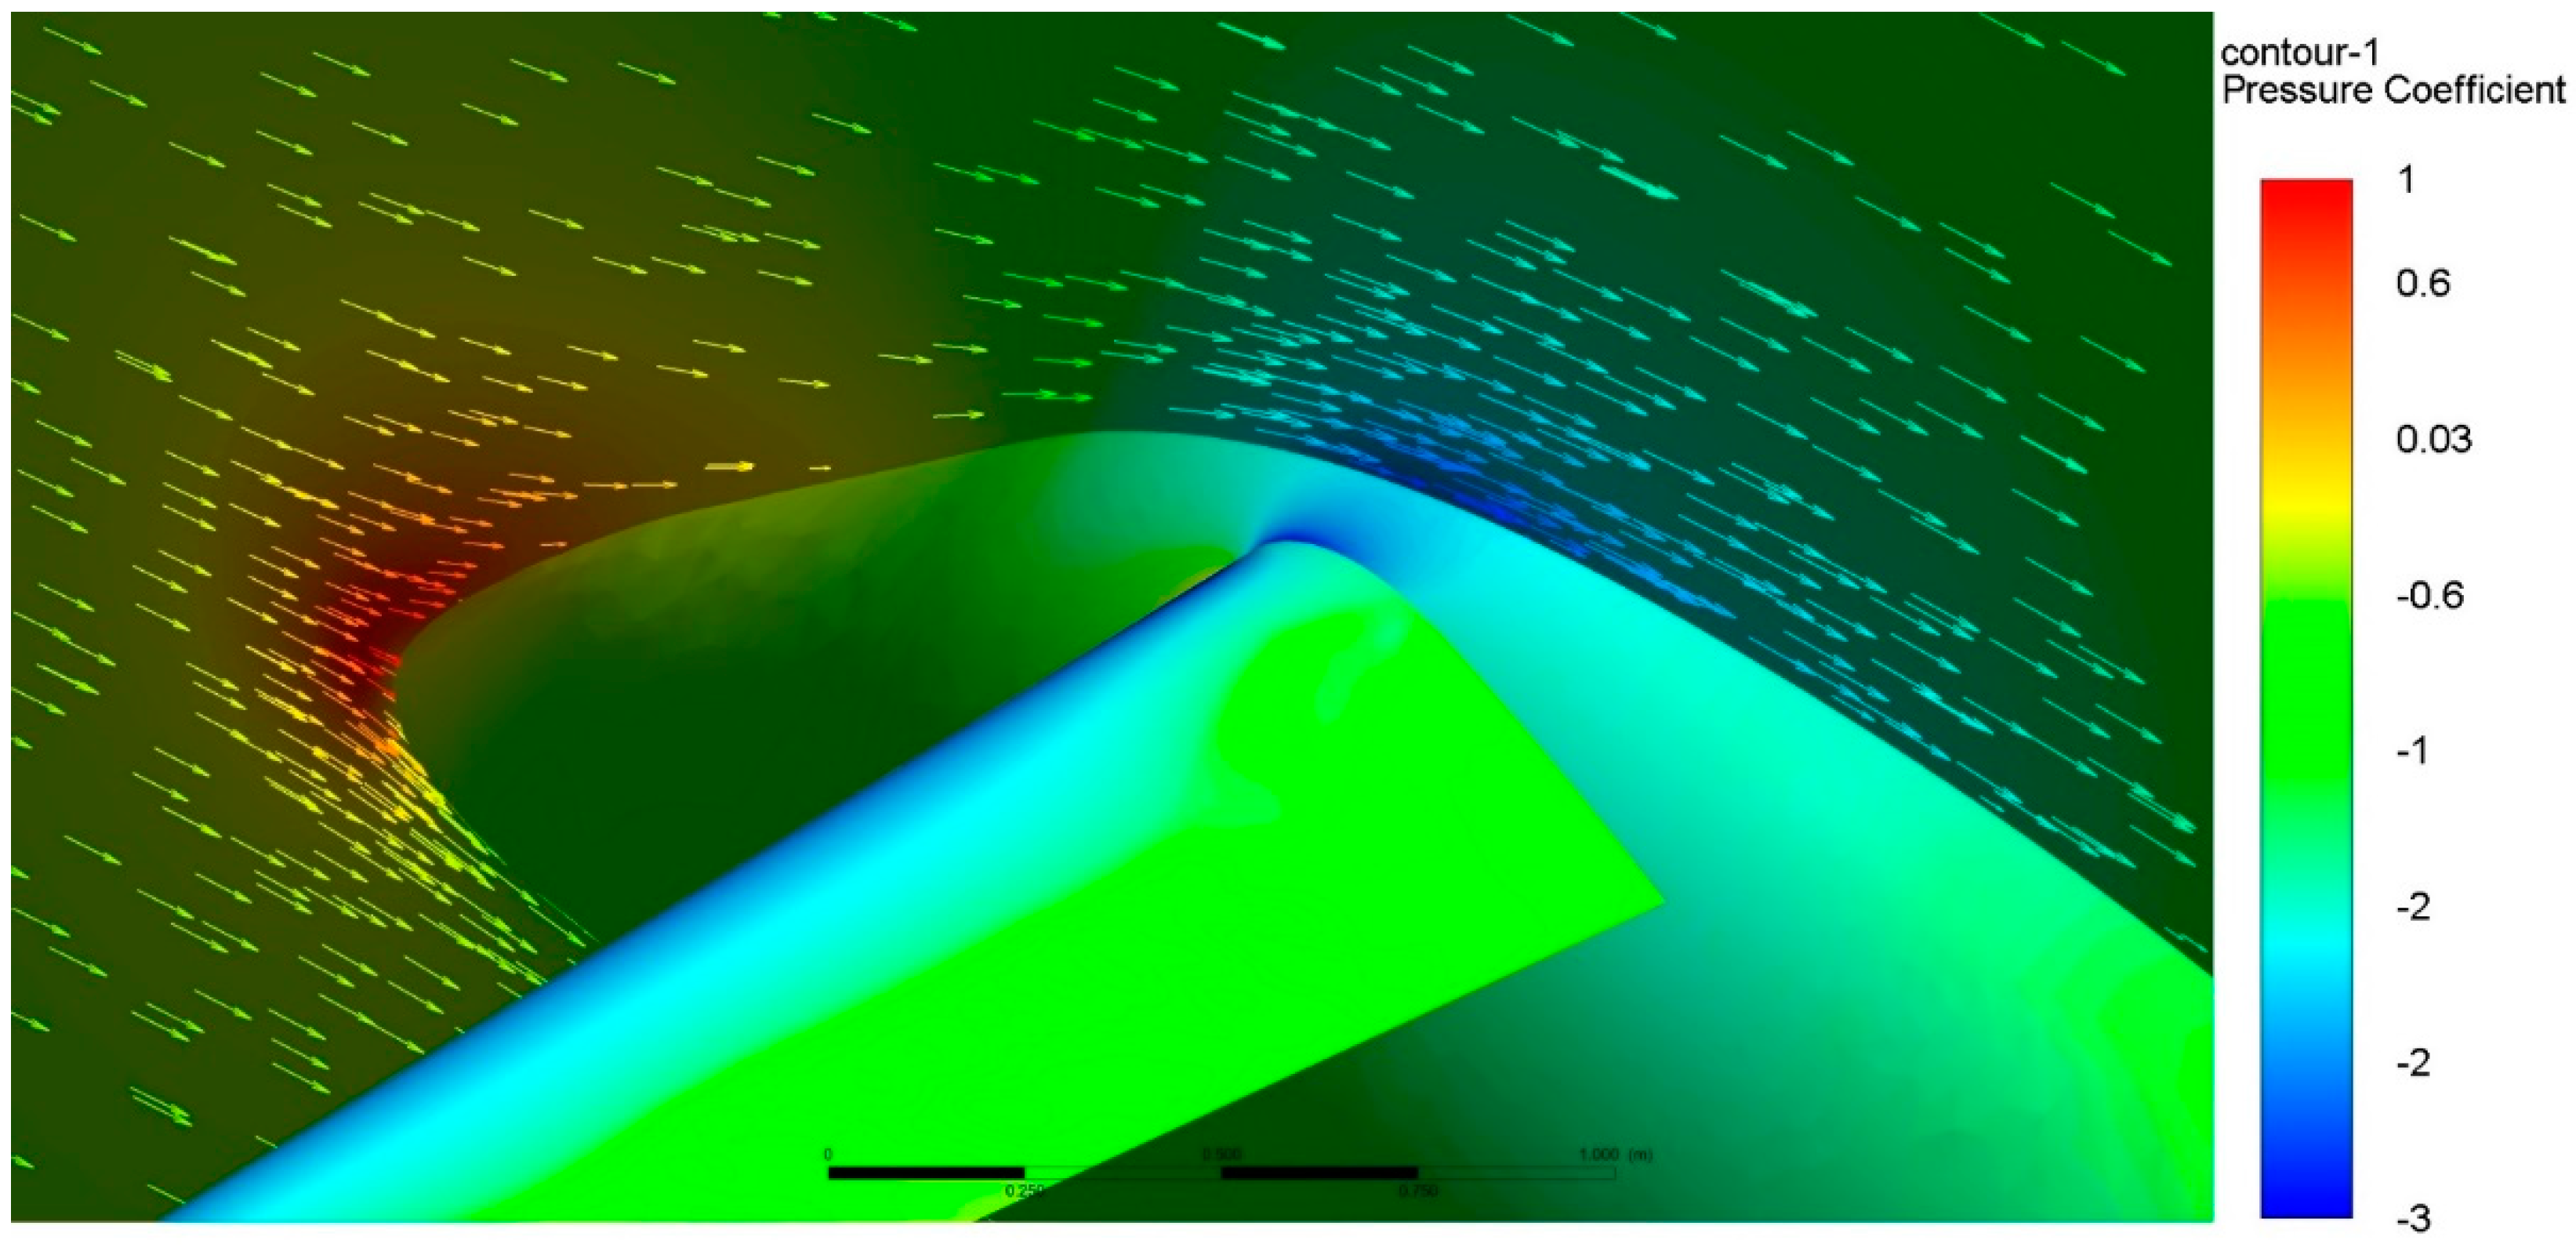
Figure 11.
Hypothetical optimized fuselage geometry (nose and aft sections) and airfoil locations based on the flow field at the symmetry section plane.
Figure 11.
Hypothetical optimized fuselage geometry (nose and aft sections) and airfoil locations based on the flow field at the symmetry section plane.
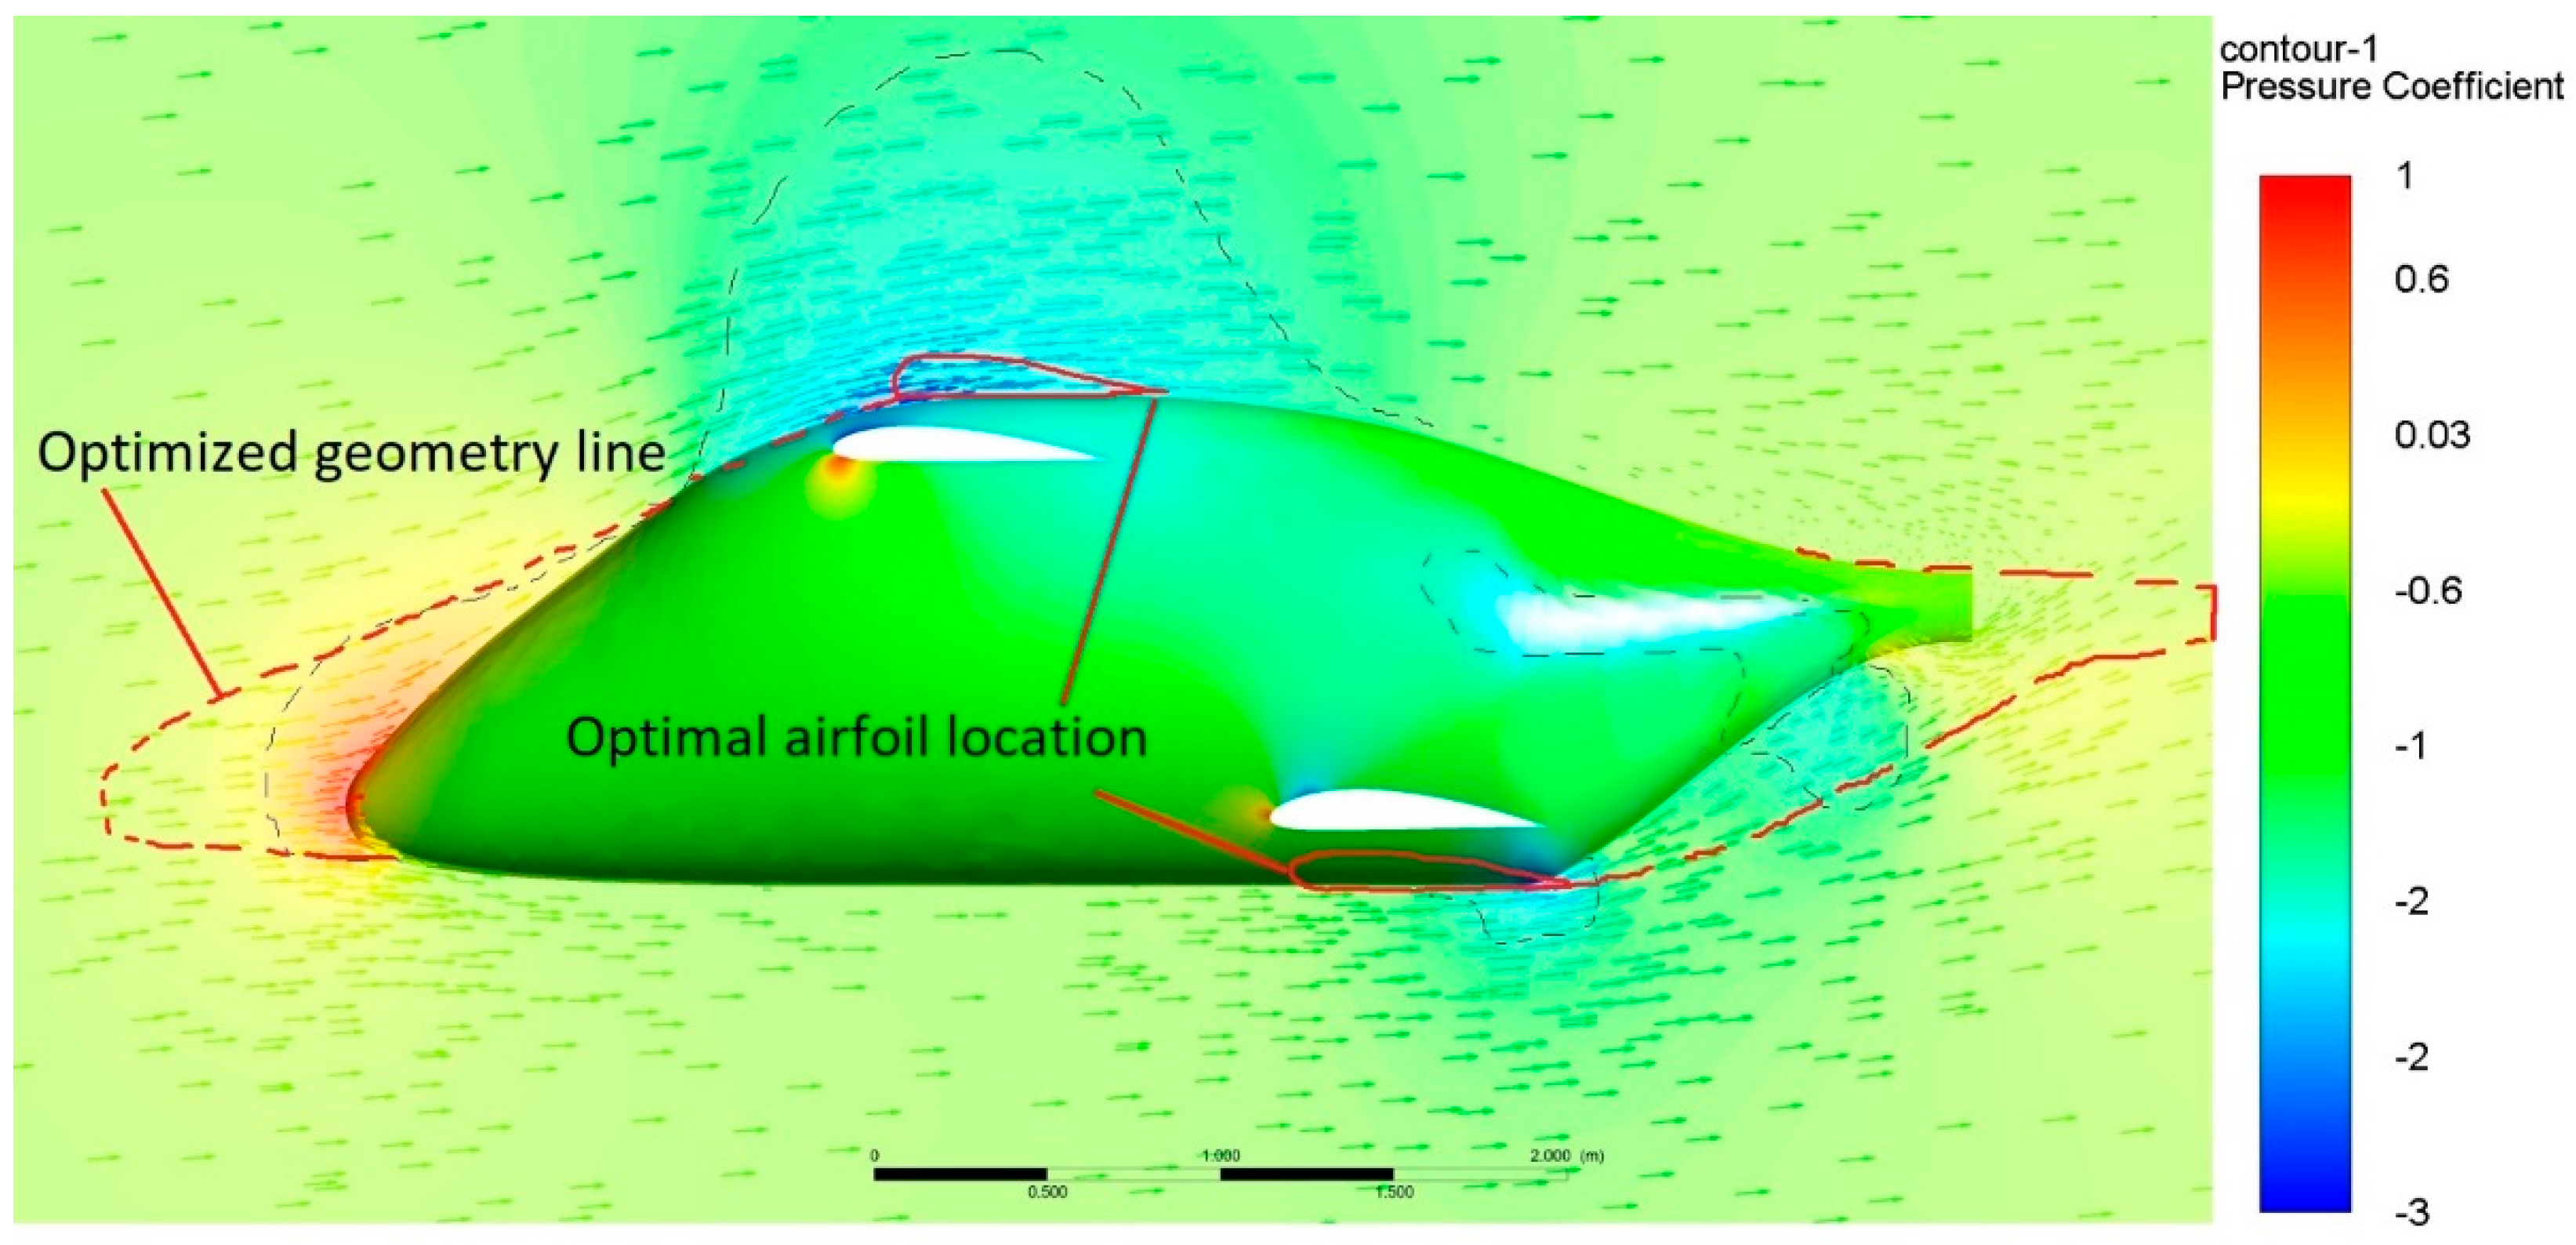
Figure 12.
The trim crossplot.
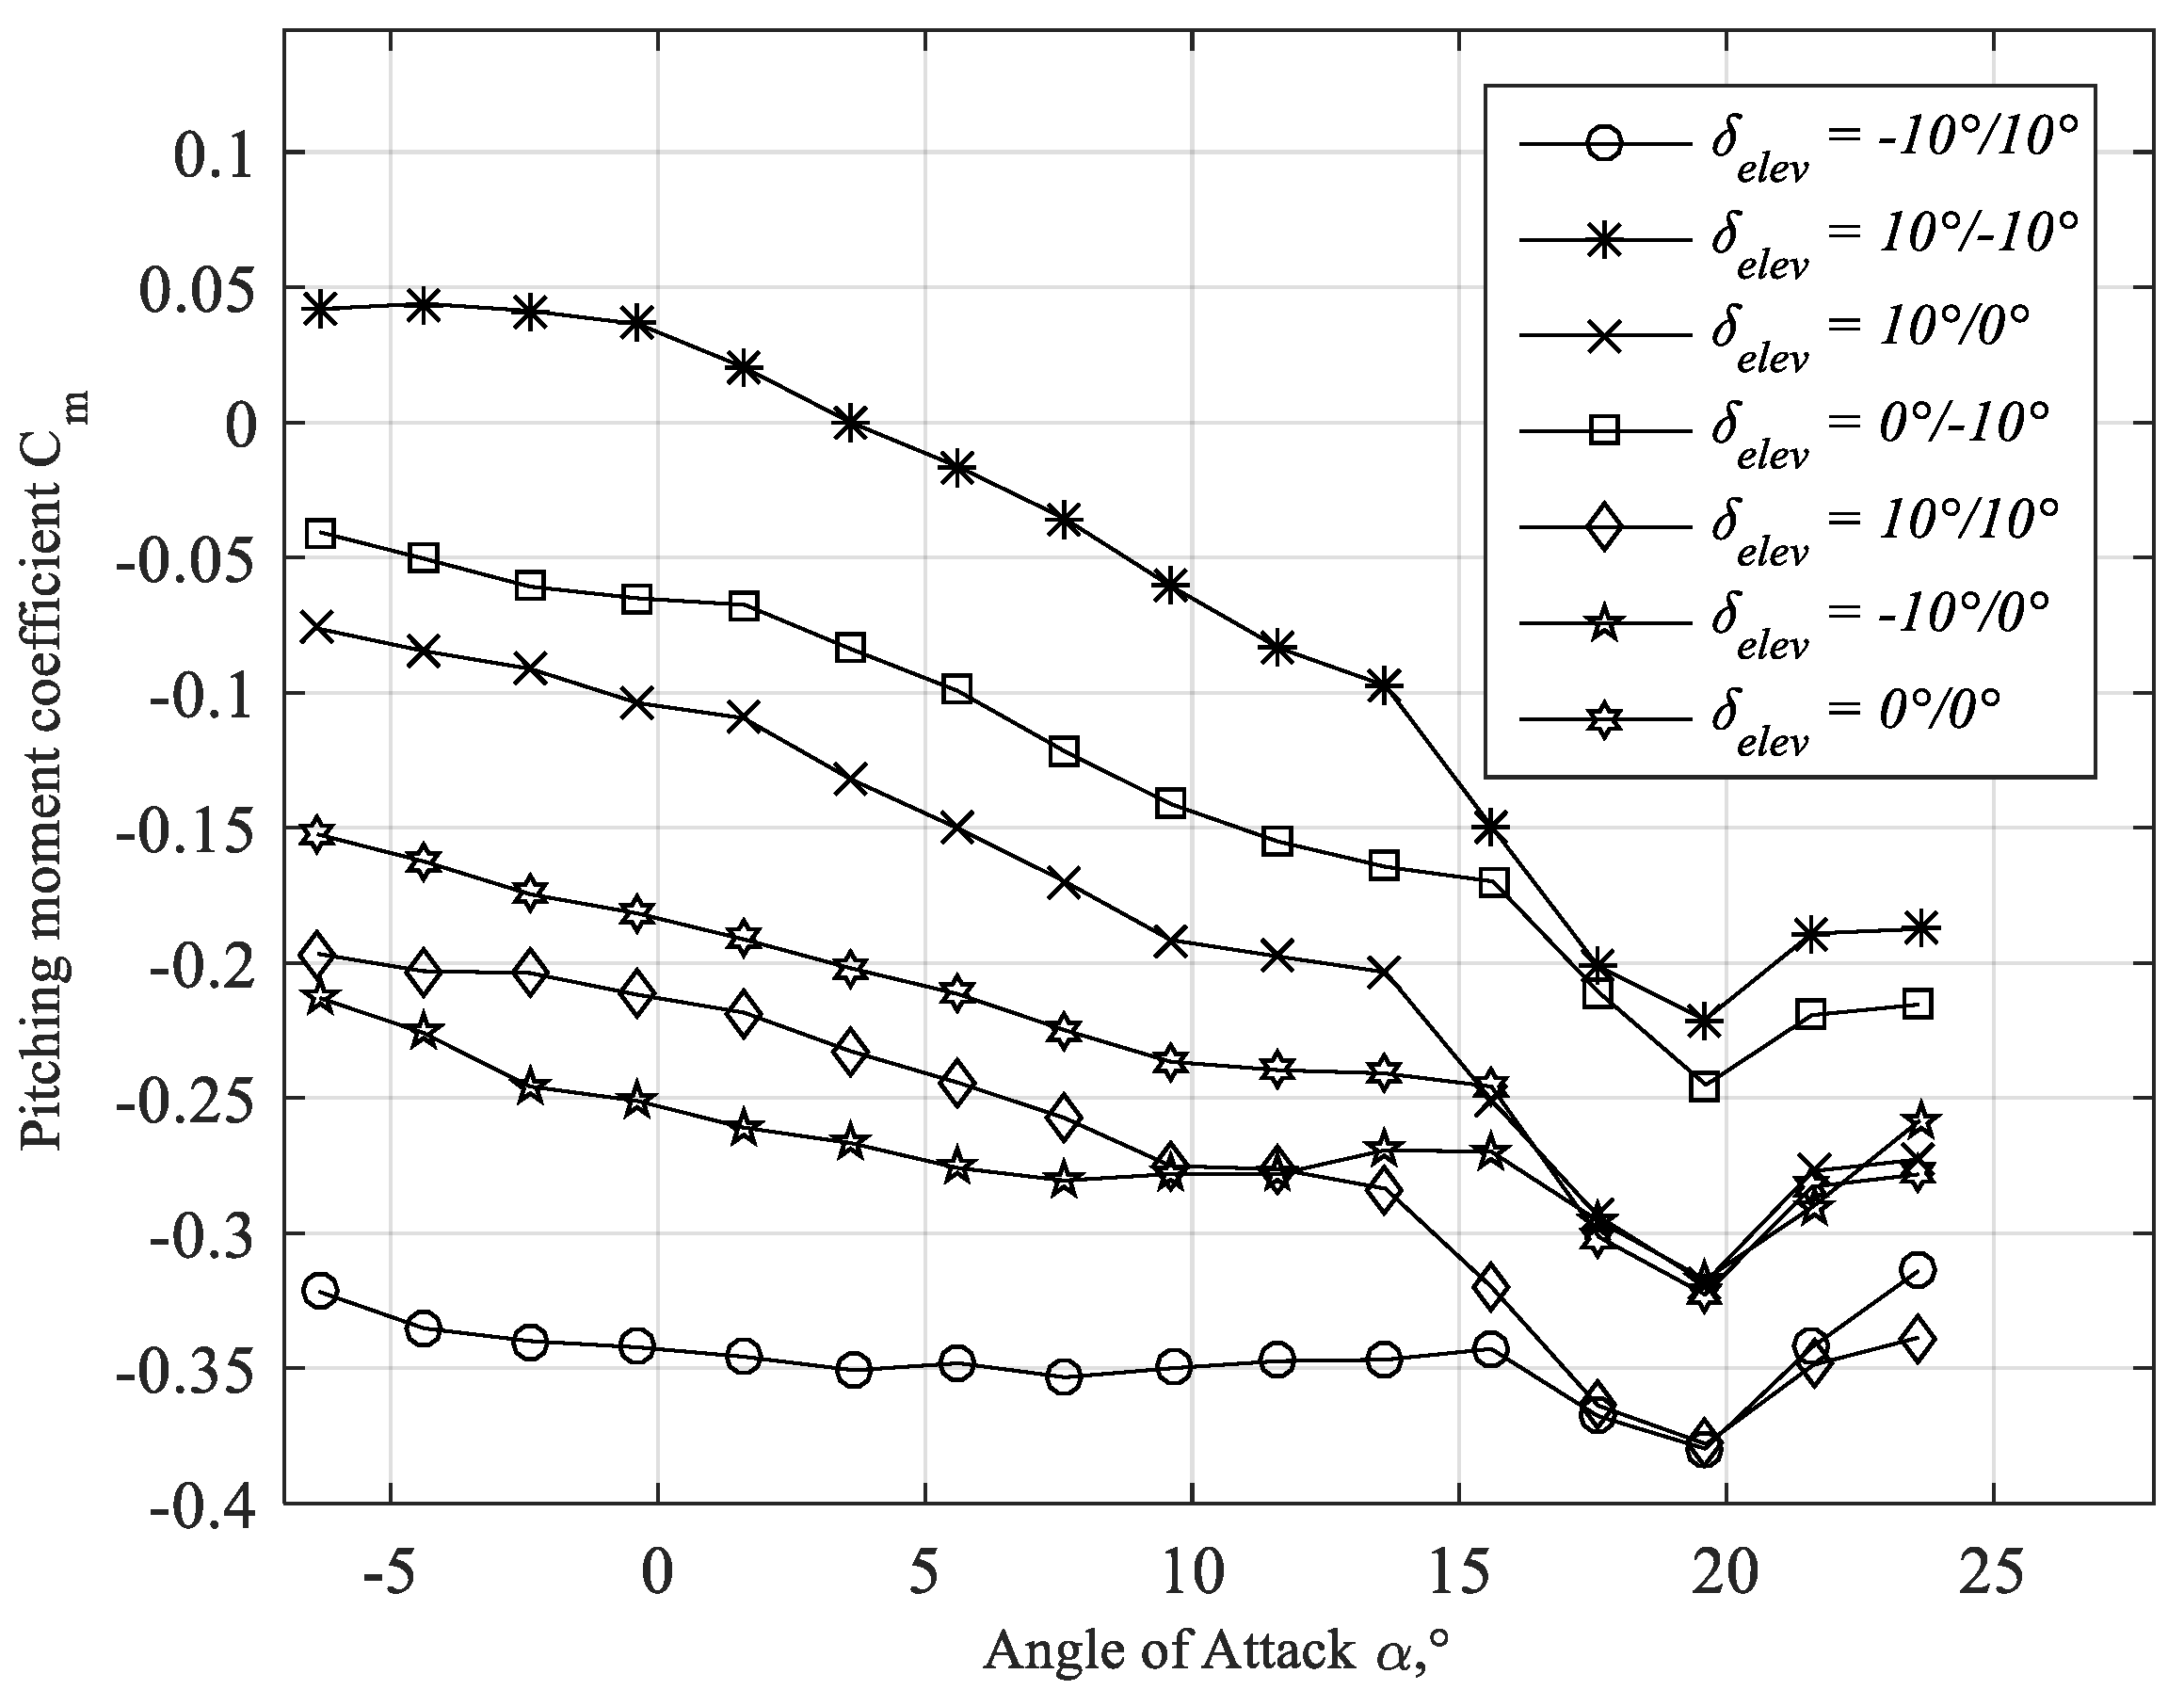
Figure 13.
The scale model of a light boxplane in T-1 wind tunnel and the CFD visualization. Test conditions: α = 0°, β = 0°. Red oval indicates the crossflow on the bottom aft fuselage.
Figure 13.
The scale model of a light boxplane in T-1 wind tunnel and the CFD visualization. Test conditions: α = 0°, β = 0°. Red oval indicates the crossflow on the bottom aft fuselage.
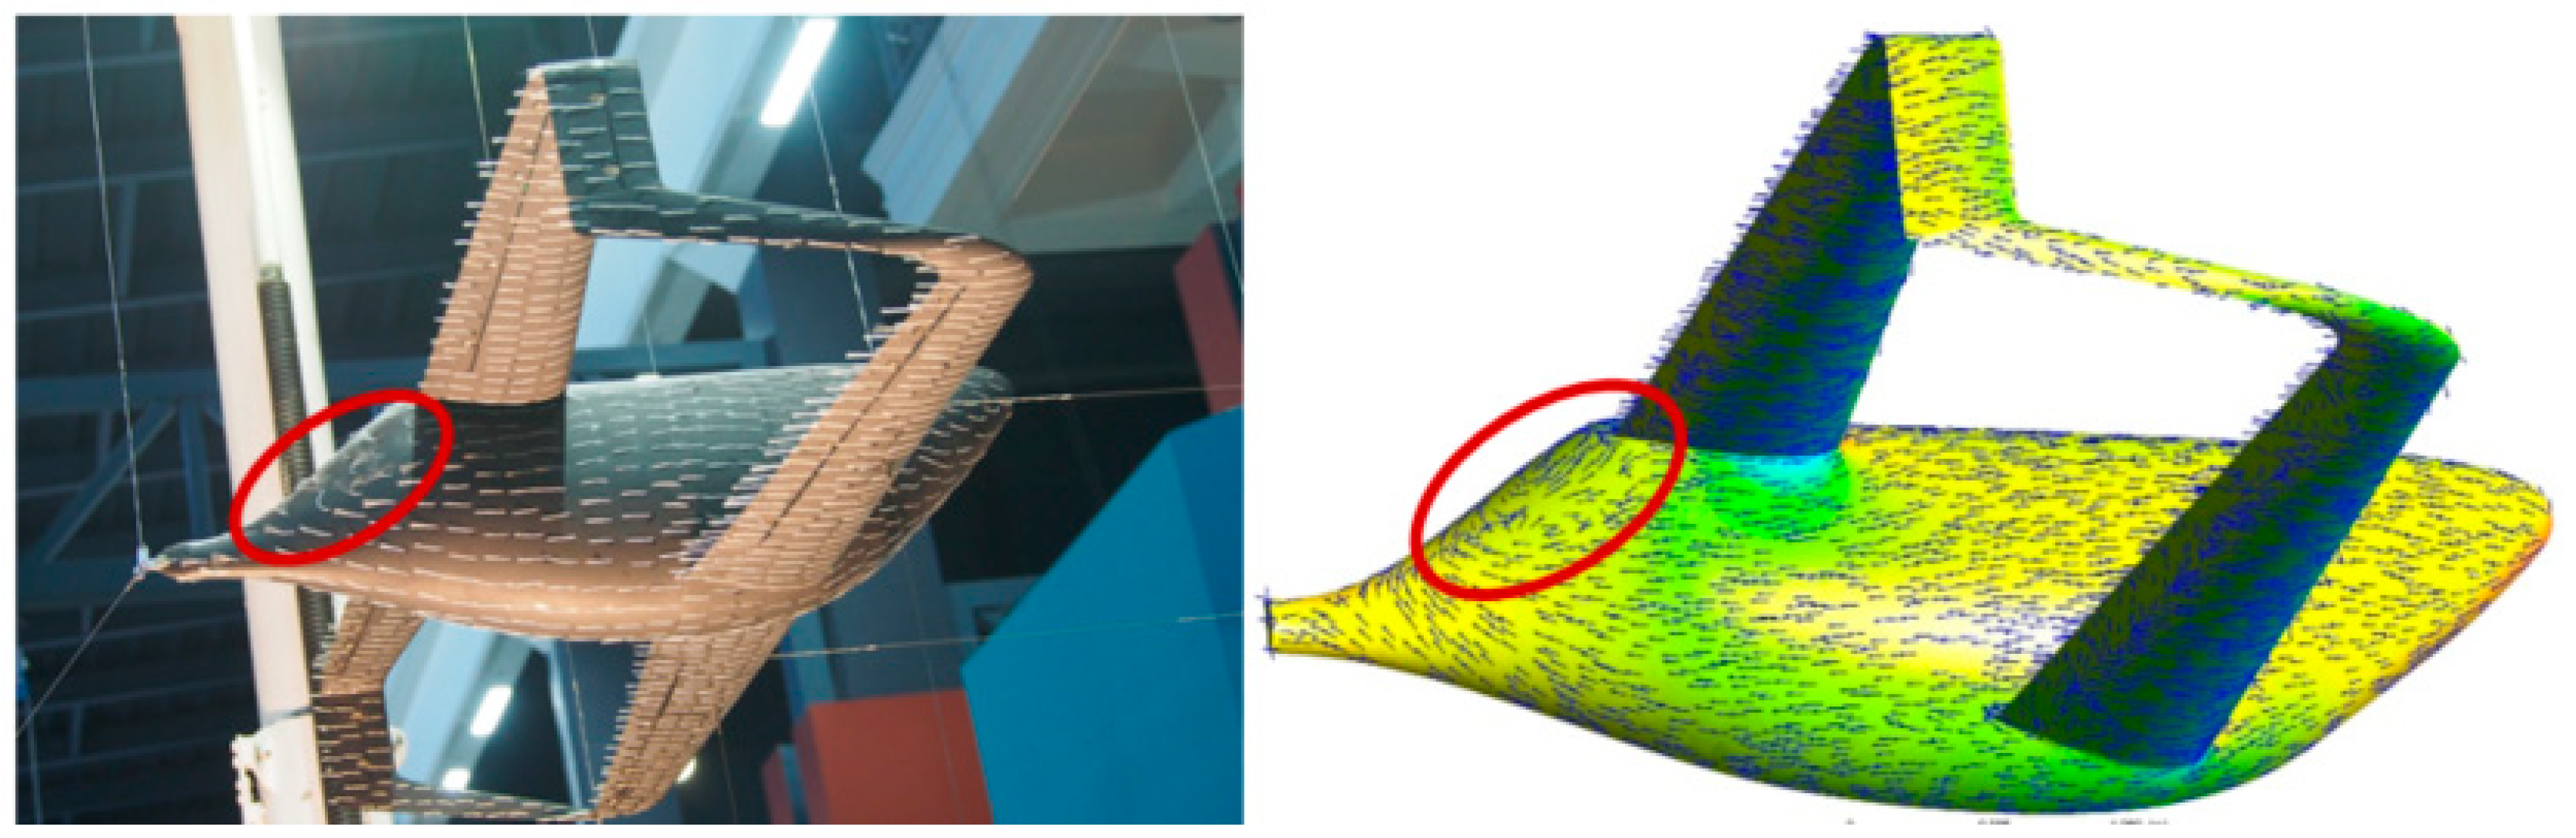
Figure 14.
Elevators’ efficiency (fore and aft elevators are deflected simultaneously). Data taken from [19].
Figure 14.
Elevators’ efficiency (fore and aft elevators are deflected simultaneously). Data taken from [19].
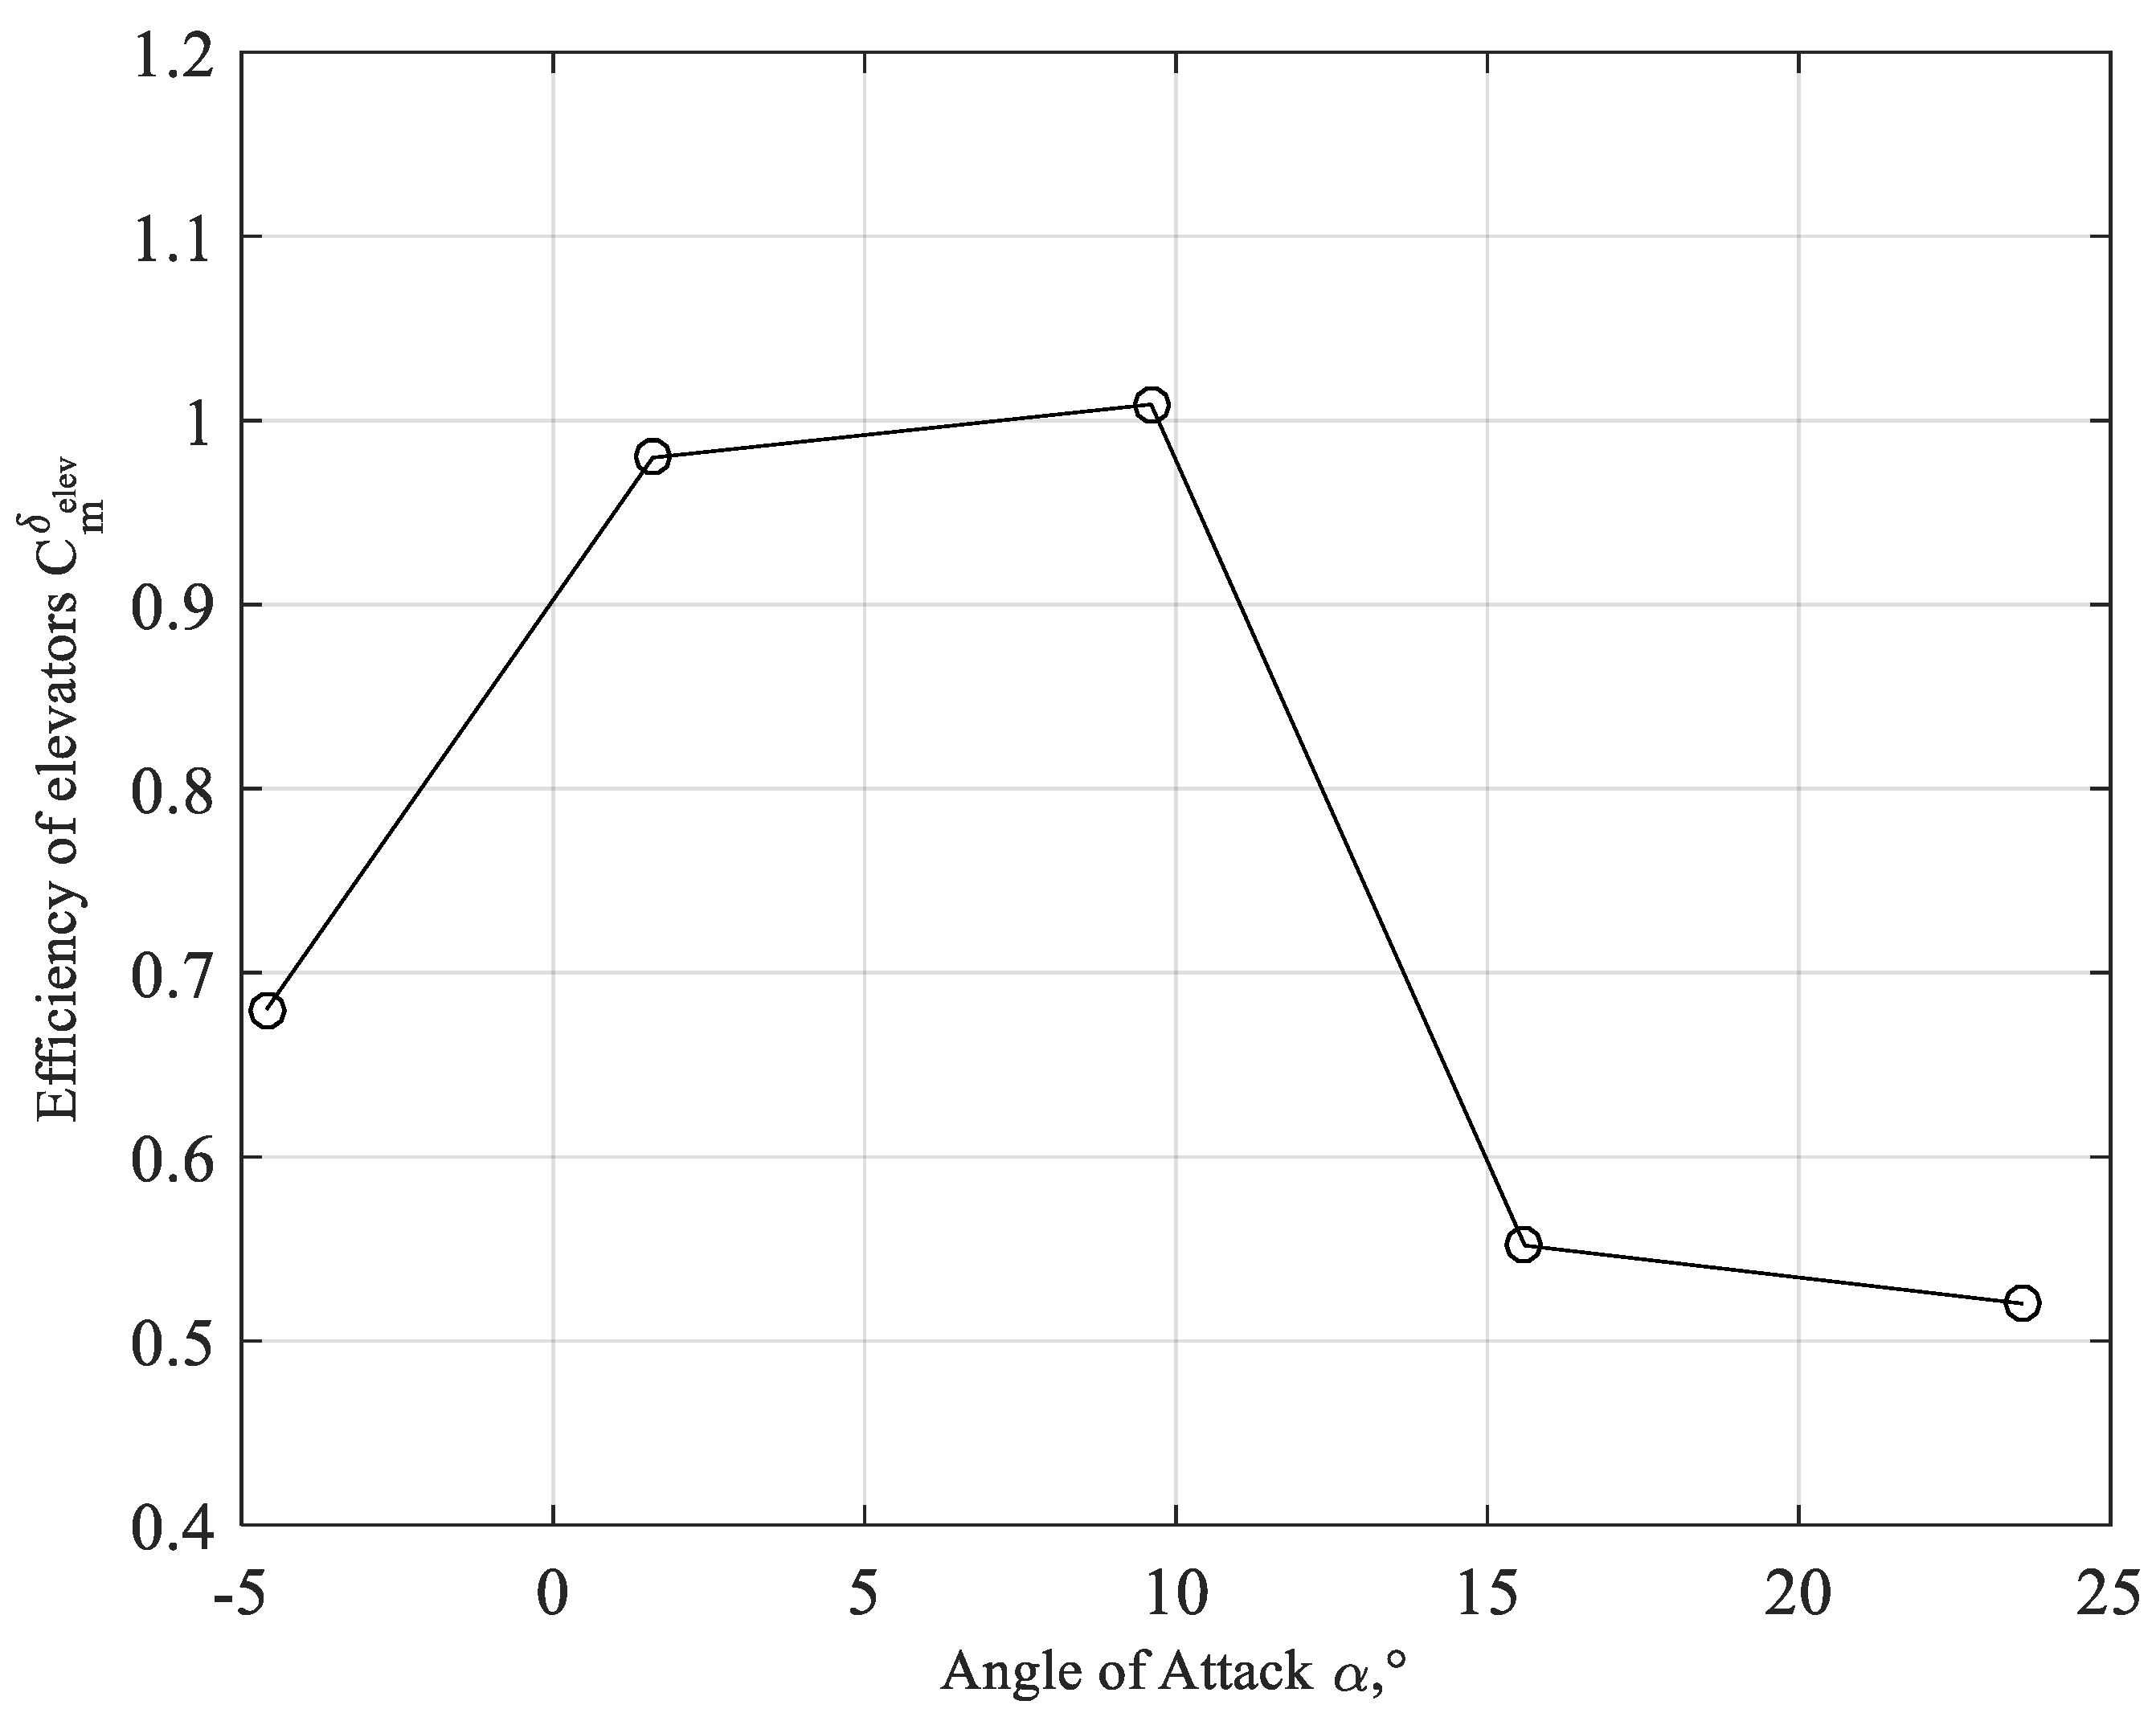
Figure 15.
Tuft patterns over the fore right elevator at various deflection angles.
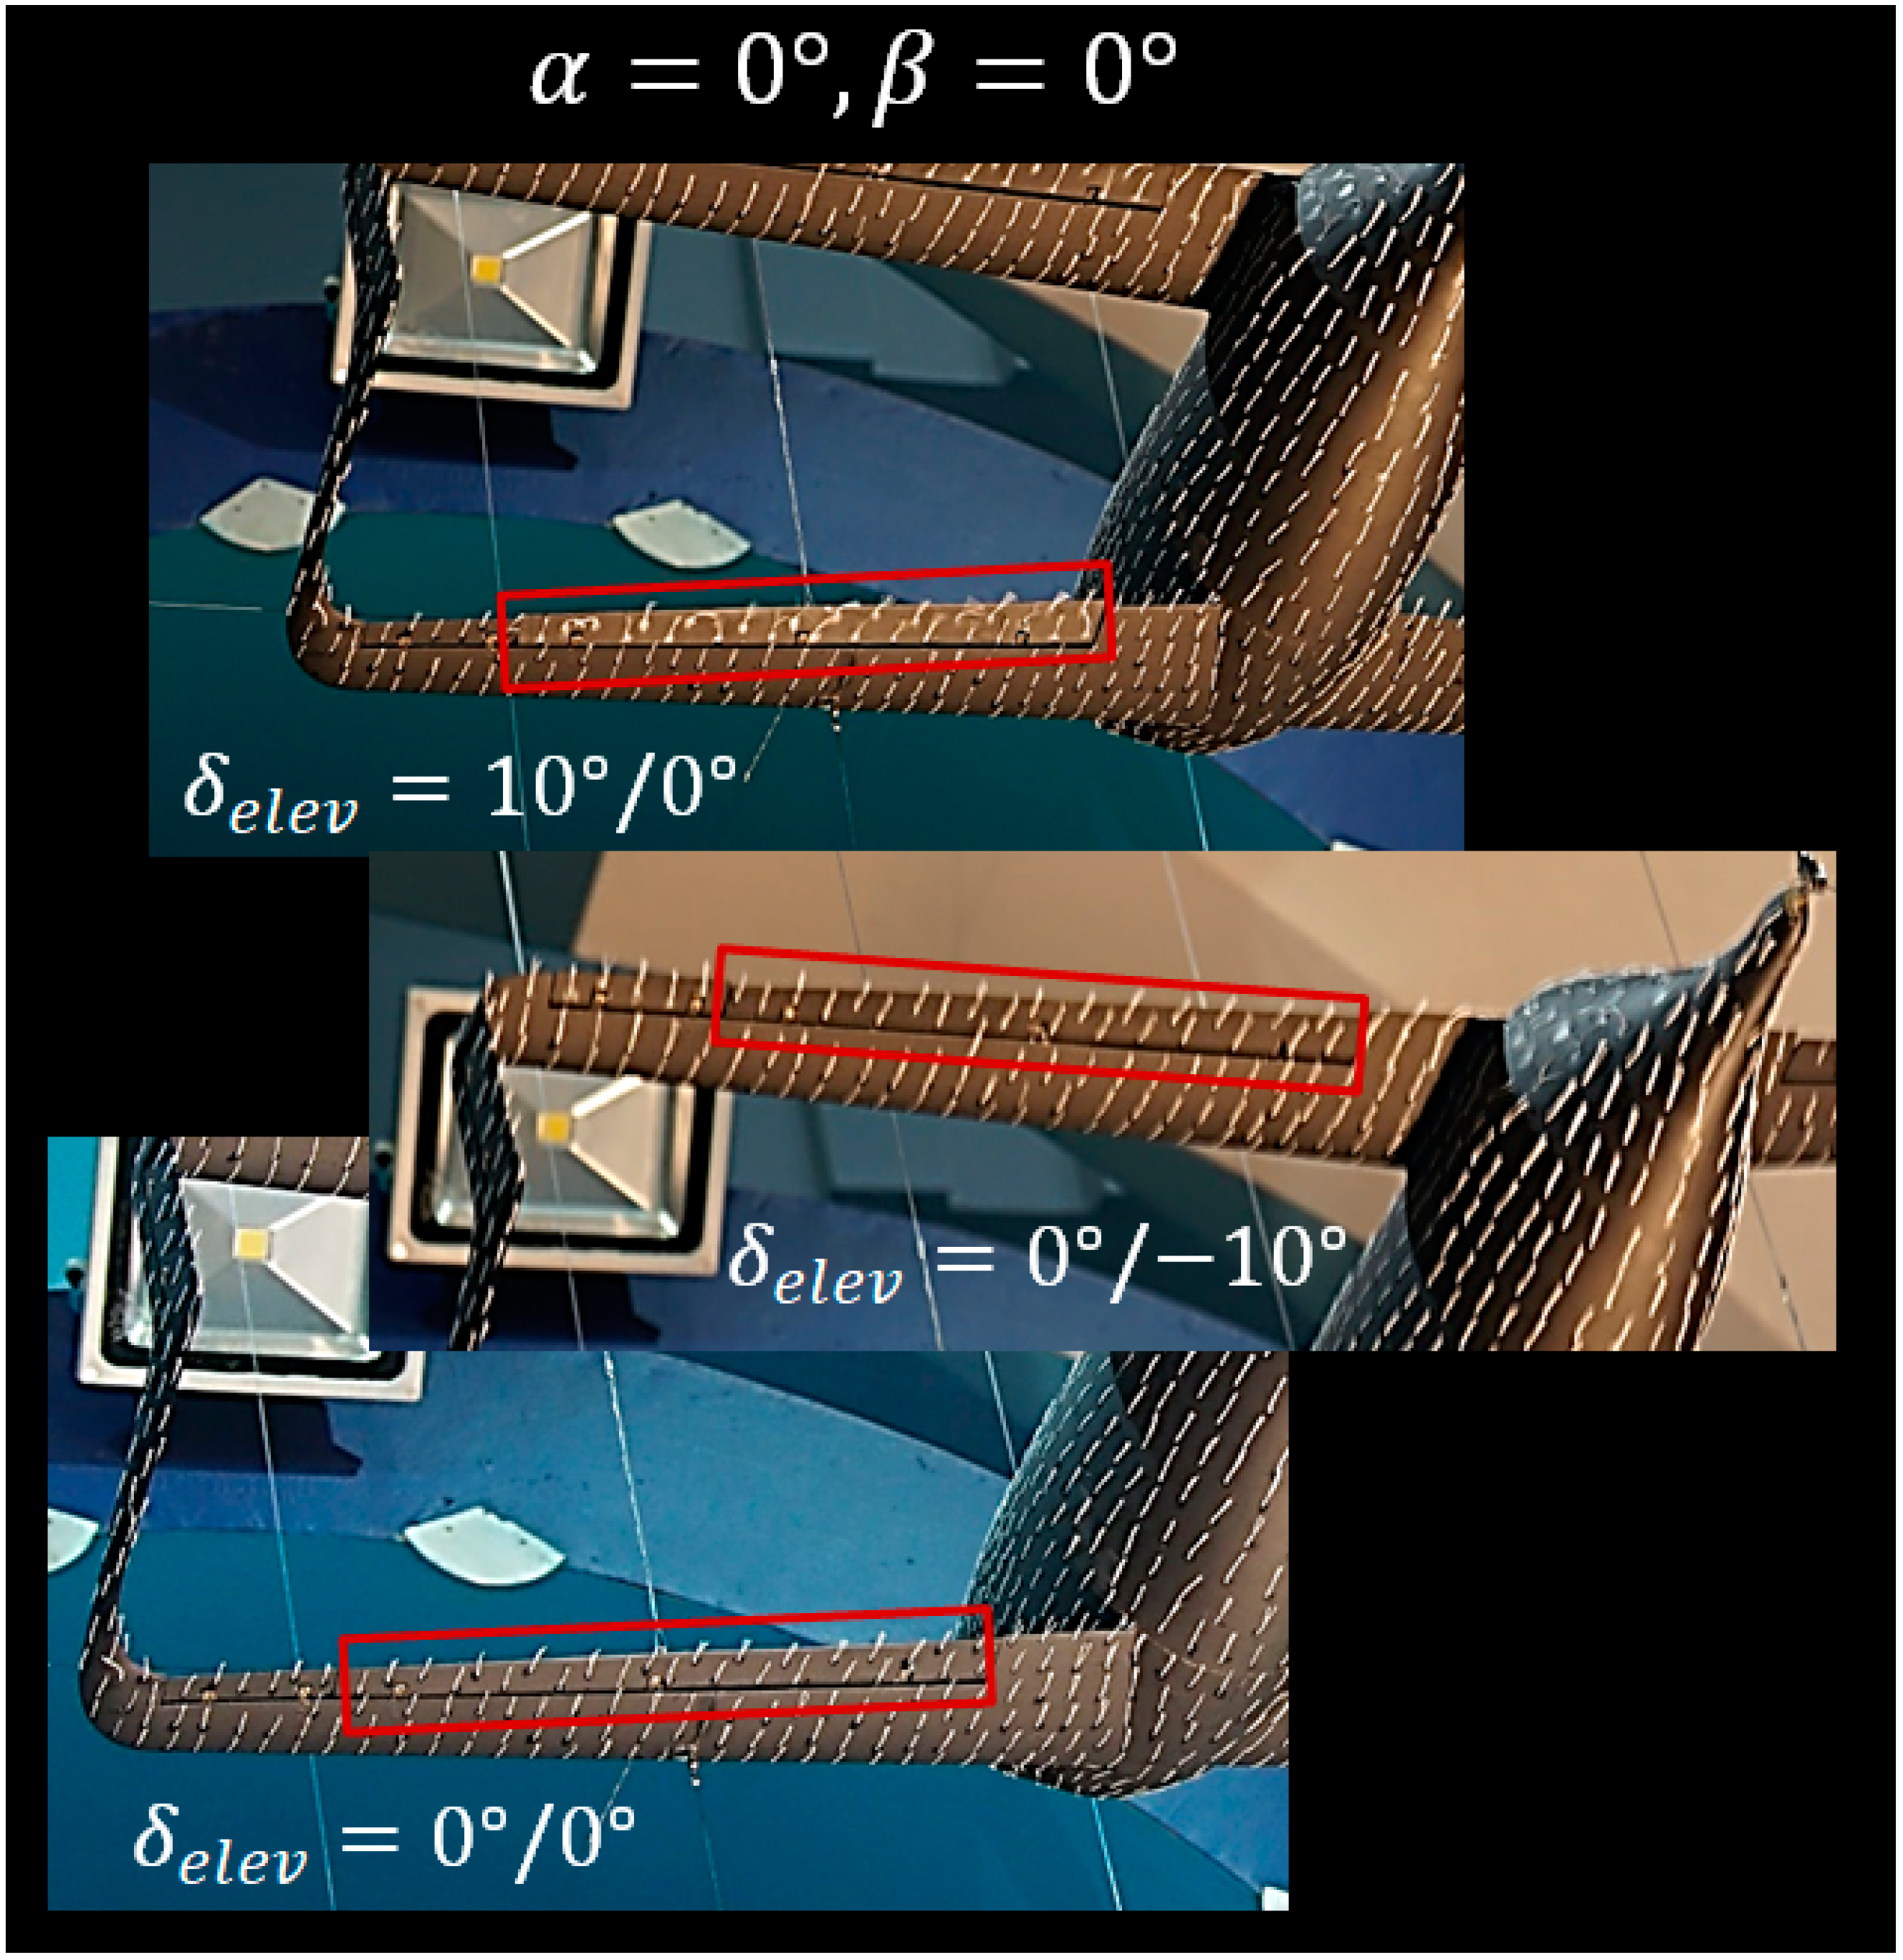
Figure 16.
Lift curves for a clean (cruise) configuration compared to the configuration with elevators deflected. Data taken from [19].
Figure 16.
Lift curves for a clean (cruise) configuration compared to the configuration with elevators deflected. Data taken from [19].
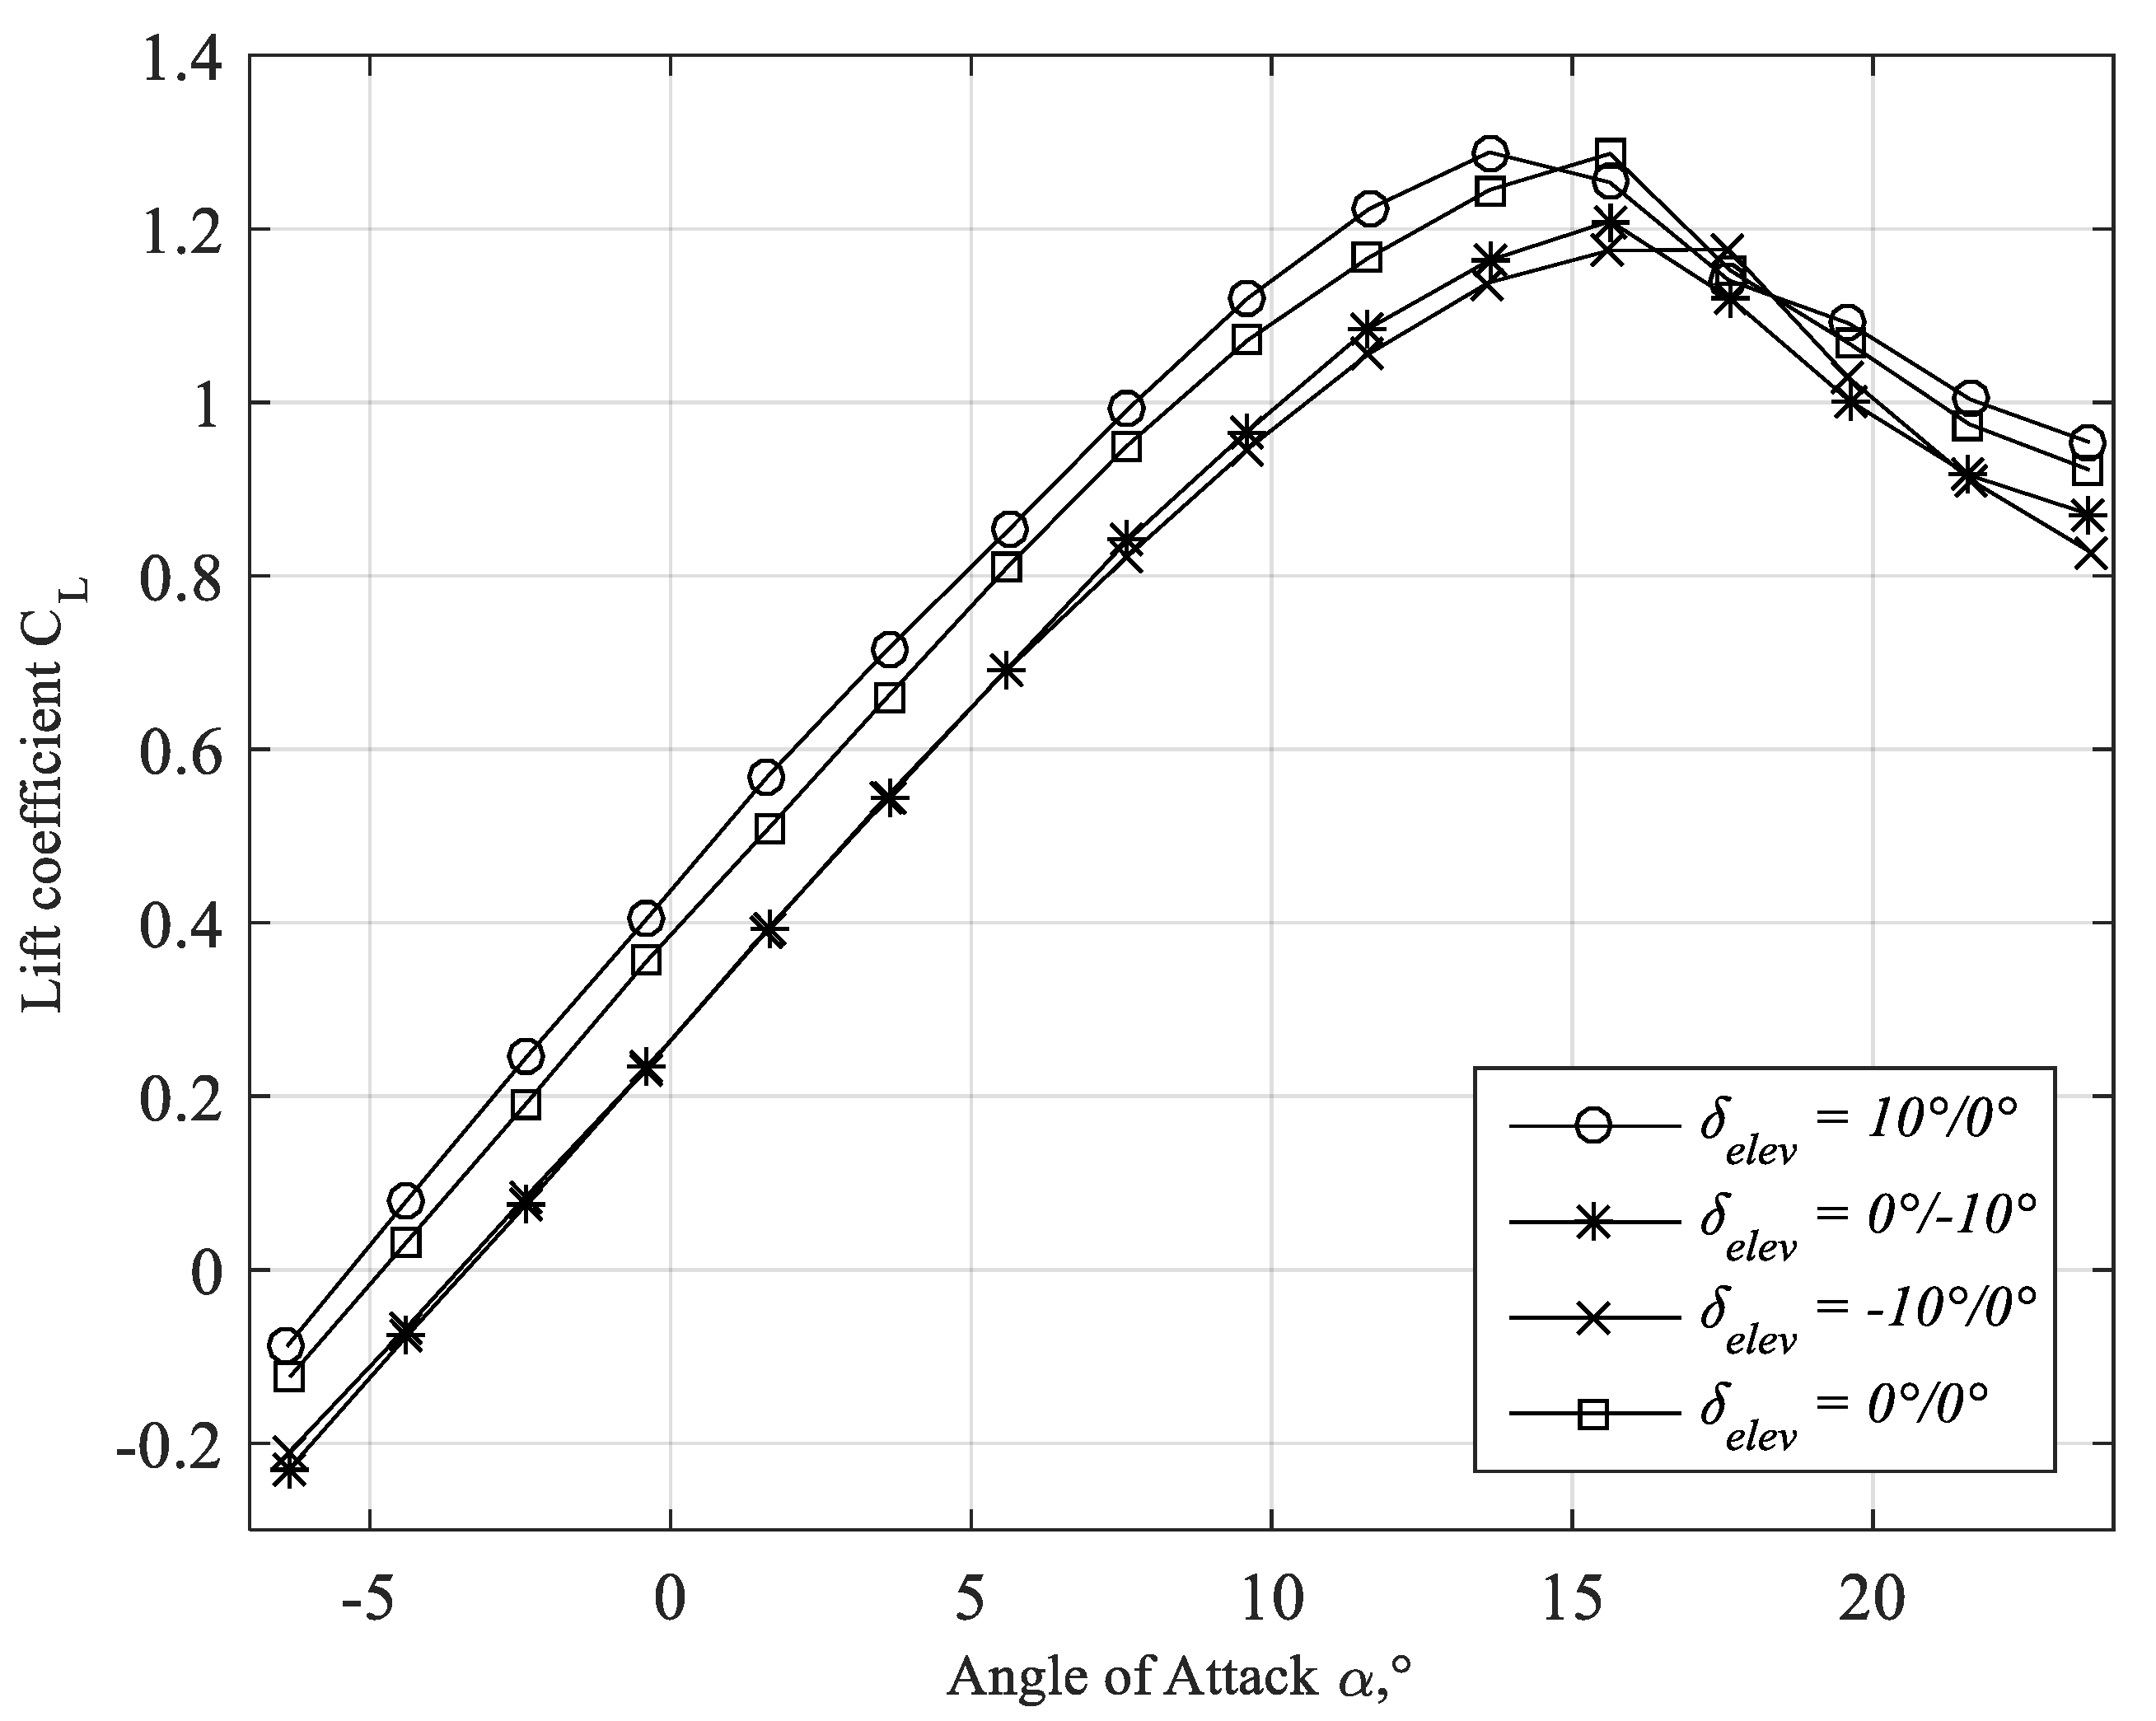
Figure 17.
Lift curve for cruise, take-off, and landing configuration. Data taken from [19].
Figure 17.
Lift curve for cruise, take-off, and landing configuration. Data taken from [19].
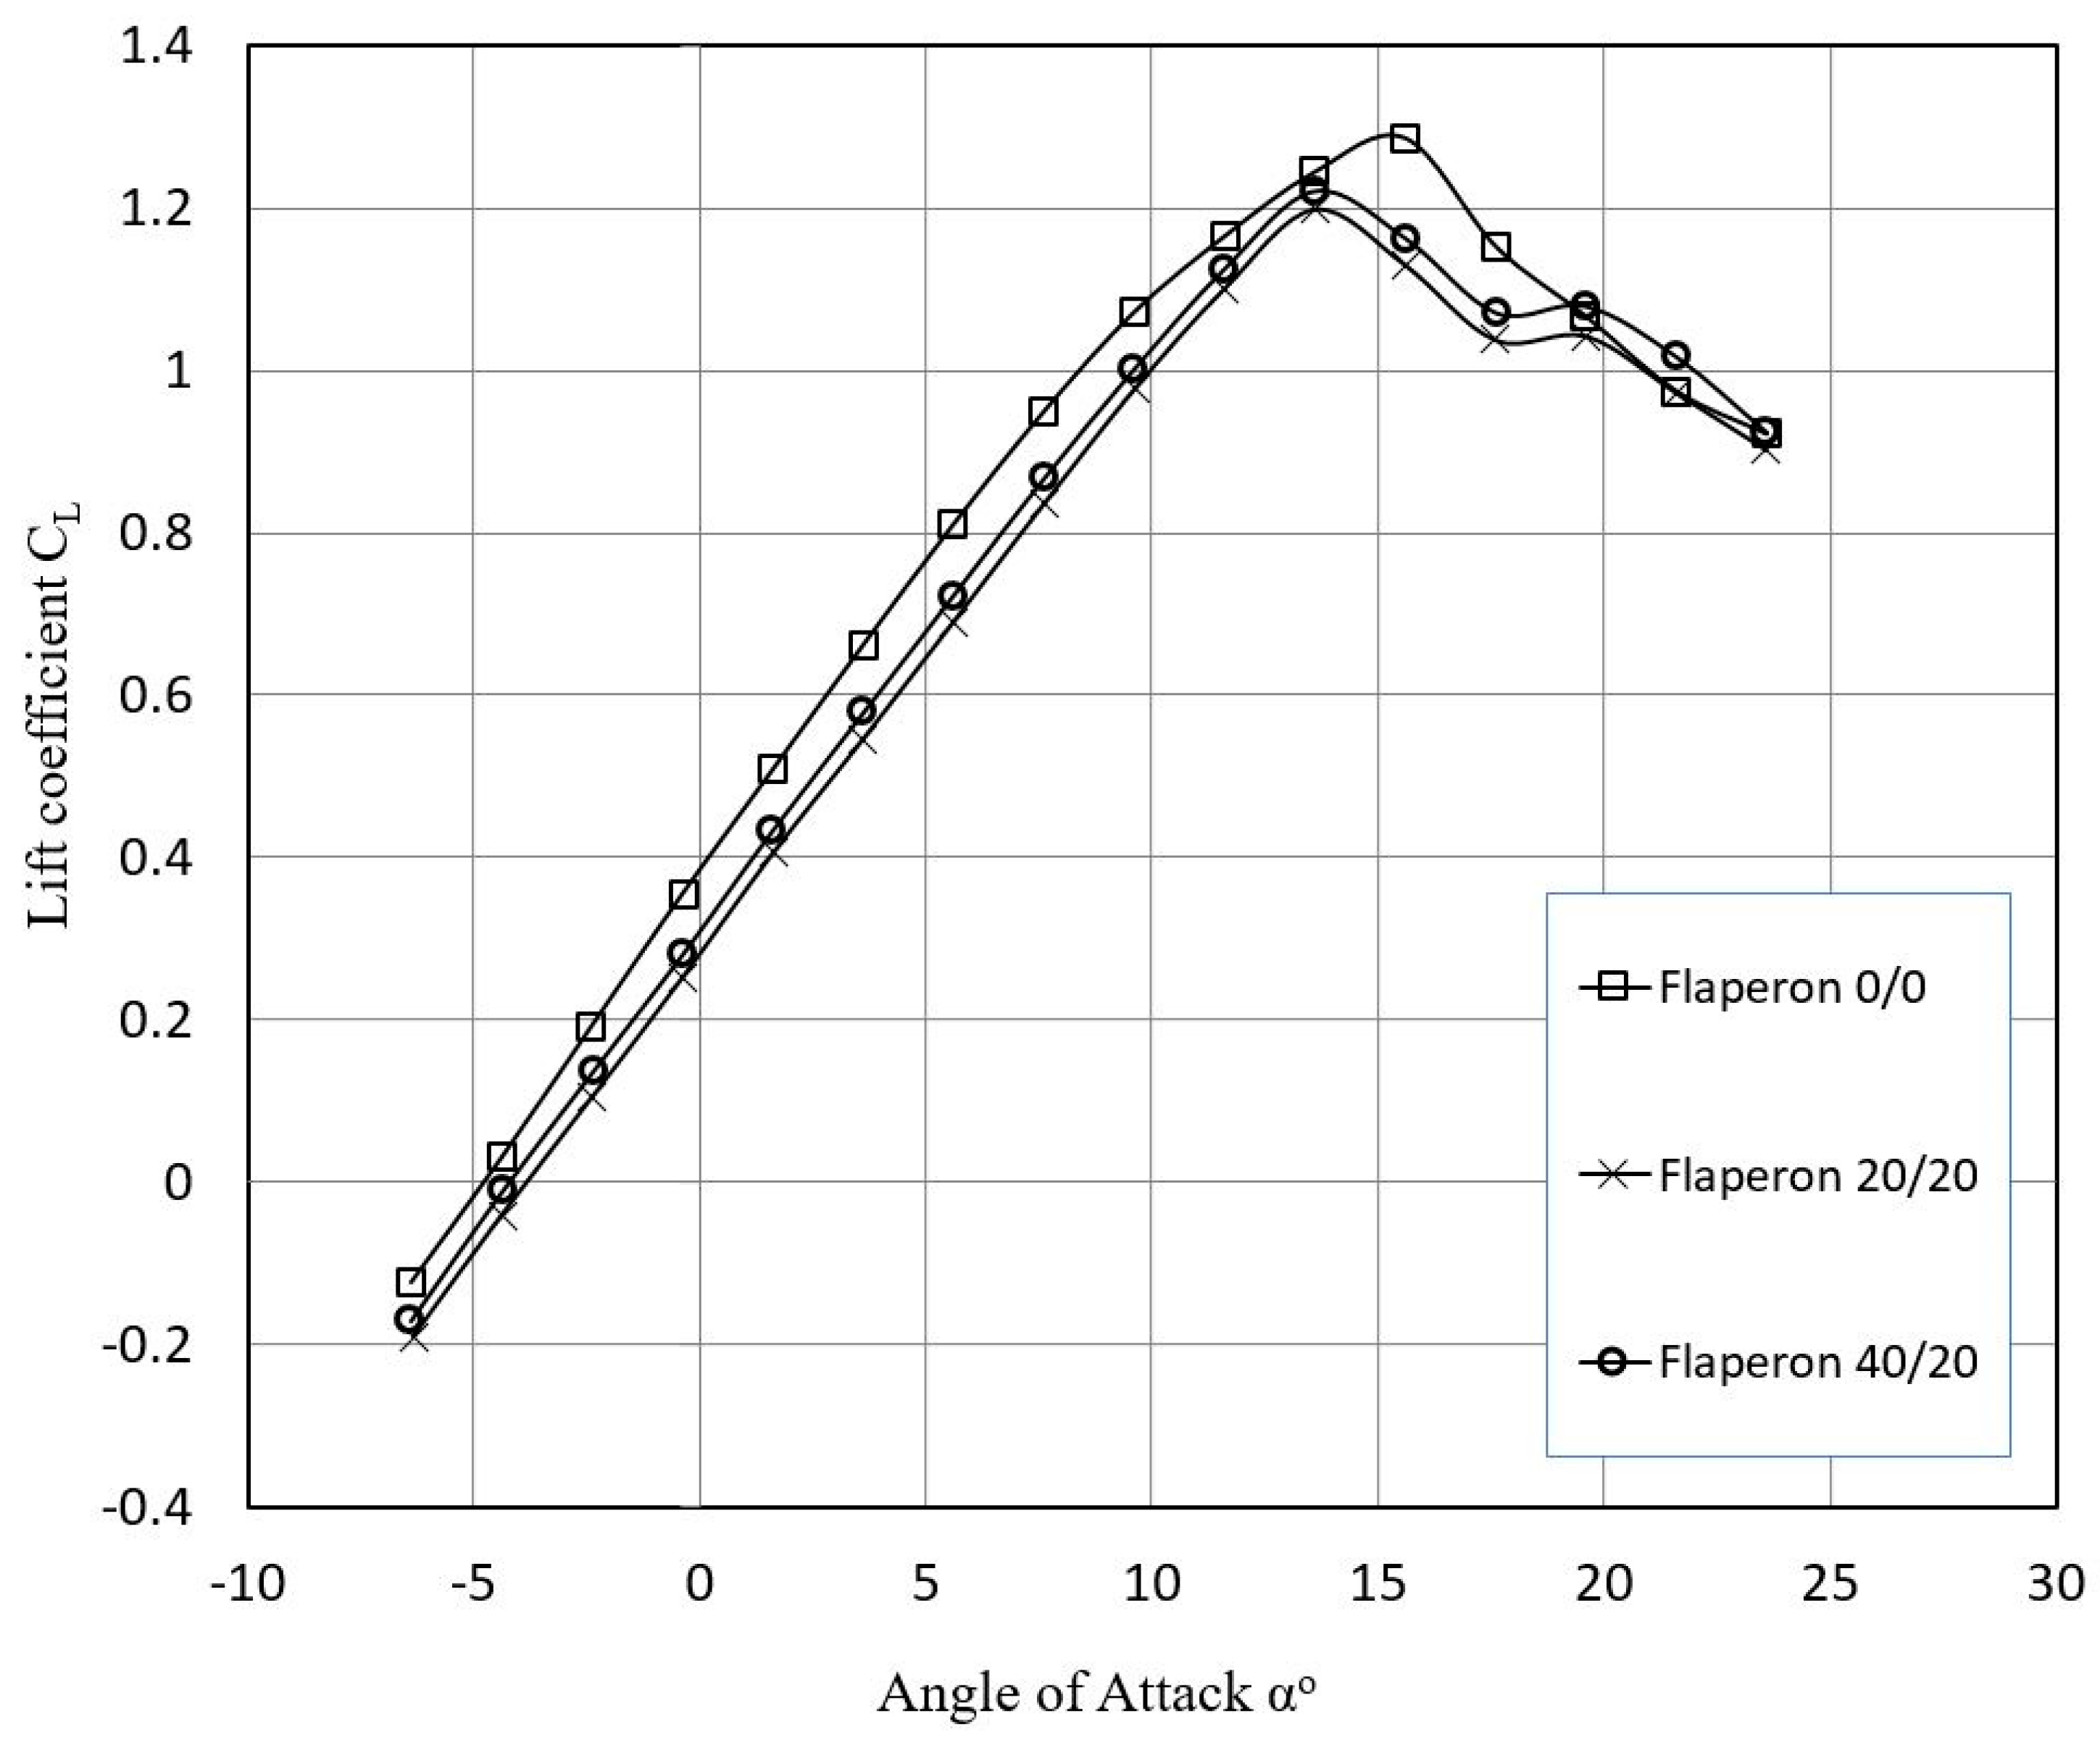
Figure 18.
Tuft patterns at various deflection angles of the left fore flaperon.

Table 1.
Experimental conditions in MAI T-1 wind tunnel.
| Parameter | Value |
|---|---|
| Velocity, V∞ | 37 m/s |
| Pressure, p∞ | 100,500 Pa |
| Temperature, T∞ | 293 K |
| Turbulence intensity, ε | 0.35% |
| Reynolds number, Re | 328,433 |
Table 2.
Angular deviation of tufts as a flow state indicator 1.
| Average Angular Deviation of the Tufts, ° | Flow State |
|---|---|
| 180° ± 5° | Attached turbulent or laminar |
| 180° ± 40° | Attached flow, increased turbulence |
| 270° ± 40° 90° ± 40° | Turbulent crossflow |
| The separation line is where the chordwise velocity component is zero. | |
1 Attached flow direction: 180 deg. Adapted from [24].
Table 3.
Top surface pressure coefficient visualization at different angles of attack and conclusions about flow separation within the linear part of the lift curve (up to αo = 15°).
Table 3.
Top surface pressure coefficient visualization at different angles of attack and conclusions about flow separation within the linear part of the lift curve (up to αo = 15°).
| α° | 5° | 10° | 15° |
|---|---|---|---|
| Cp scale |  | ||
| Top surface pressure coefficient visualization |  |  | 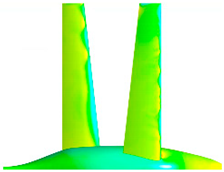 |
| Remarks | Front wing lift advantage; both wings attached; important fuselage lift contribution. | Equal lift generated with a slight fore wing advantage. Both wings attached. | Fore wing partially separated; aft wing lift advantage despite separation onset spots. |
| Conclusion | Fore wing maintains lift advantage until α° = 10–15°, where it begins to separate. | ||
Table 4.
Top surface pressure coefficient visualization at different angles of attack and conclusions about flow separation beyond the stalled region of the lift curve.
Table 4.
Top surface pressure coefficient visualization at different angles of attack and conclusions about flow separation beyond the stalled region of the lift curve.
| α° | 20° | 25° |
|---|---|---|
| Cp scale |  | |
| Top surface pressure coefficient visualization | 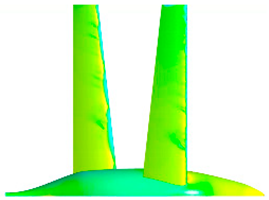 | 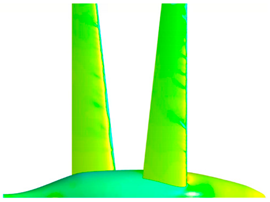 |
| Remarks | Fore wing fully separated; aft wing almost fully separated. | Both wings fully separated. |
| Conclusion | Further increasing α shifts lift contribution towards the aft wing, which maintains unseparated flow up until 17.5°. Above 20°, both wings are separated. | |
Publisher’s Note: MDPI stays neutral with regard to jurisdictional claims in published maps and institutional affiliations. |
© 2021 by the authors. Licensee MDPI, Basel, Switzerland. This article is an open access article distributed under the terms and conditions of the Creative Commons Attribution (CC BY) license (https://creativecommons.org/licenses/by/4.0/).
Share and Cite
MDPI and ACS Style
Karpovich, E.; Gueraiche, D.; Sergeeva, N.; Kuznetsov, A. Investigation of a Light Boxplane Model Using Tuft Flow Visualization and CFD. Fluids 2021, 6, 451. https://doi.org/10.3390/fluids6120451
AMA Style
Karpovich E, Gueraiche D, Sergeeva N, Kuznetsov A. Investigation of a Light Boxplane Model Using Tuft Flow Visualization and CFD. Fluids. 2021; 6(12):451. https://doi.org/10.3390/fluids6120451
Chicago/Turabian StyleKarpovich, Elena, Djahid Gueraiche, Natalya Sergeeva, and Alexander Kuznetsov. 2021. "Investigation of a Light Boxplane Model Using Tuft Flow Visualization and CFD" Fluids 6, no. 12: 451. https://doi.org/10.3390/fluids6120451