1. Introduction
The most common problem in the operation of oil-producing wells is the formation of asphaltene–resin–paraffin deposits (ARPDs) on the inner surface of lift pipes. The formation of organic deposits leads to a decrease in the hydraulic radius and, consequently, to an increase in pressure in the lift pipe, which entails the need for cleaning measures in order to remove the formed deposits. The time interval between such measures to remove the formed deposits is called the inter-treatment period. This value is an important technological parameter of well operation. A large percentage of the spread of the considered technological problem (more than 70%) from the total oil production fund of Russian enterprises of subsoil users has led to the need to study the mechanisms of ARPD formation and develop methods for predicting the formation of organic deposits.
Various scientific works aimed at studying and describing the processes of formation of asphaltene–resin–paraffin deposits in world literature have been published since 1955. The authors of [
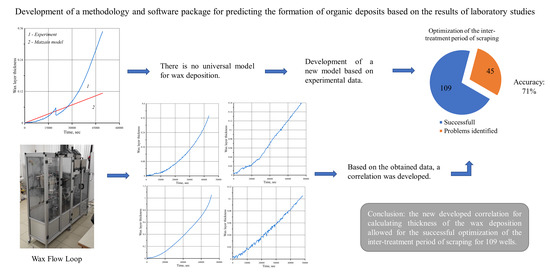
1] provide a detailed description of the chronology and results of studies of the mechanisms of formation of organic deposits. The authors note that the existing models are not universal and can be used to consider only specific cases, and that the study of wax-aging mechanisms is an urgent task when choosing technologies to combat this phenomenon.
The published results of laboratory studies show that the intensity of ARPD formation is influenced by many factors, such as the composition of oil, the temperature and pressure conditions of production, the characteristics of the multiphase flow and its velocity, the physical properties of the produced fluids, the properties of the wall of tubing strings and pipelines through which hydrocarbon production is carried out, etc. [
2]. However, at the moment there is no universal physical and mathematical model that enables the reliable description of the mechanisms of APRD formation for all developed fields, even within the same oil and gas province [
3].
The following models of the formation of asphaltene–resin–paraffin deposits are found in commercial software products: the RRR (Rygg, Rydahl, and Rønningsen) model [
4], the Matzain model [
5], the heat analogy [
6], LedaFlow’s wax deposition model [
7], etc. The first three models are implemented in the OLGA by Schlumberger, and the latest model is presented in the LedaFlow multiphase flow simulator by Kongsberg. There are also results of numerical modeling of organic sediment deposition by specialists from the University of Michigan, Tulsa University, and the Norwegian University of Science and Technology. On the basis of the numerical modeling carried out using the indicated commercial software products, it was concluded that it is possible to use these tools while increasing the accuracy of predicting the formation of APRDs and planning treatment measures at operational oil-producing wells [
8,
9]. However, before the practical application of modeling the processes of ARPD formation, it is necessary to adjust the digital model (a recreated copy of an oil field in a software product) to actual data, which is a difficult process. Thus, as a result of the studies carried out in [
10], it should be noted that today the method of predicting the formation of ARPDs based on empirical data (laboratory research results for a specific oil) is the most accurate and preferable in industrial use.
At the moment, various methods and technical means are known for conducting laboratory studies to study the mechanisms of APRD formation as well as the formation of correlation dependences of the deposition process. The author of [
11] presented experimental laboratory equipment for automatic non-contact measurement of wax deposits on pipeline walls, based on a radioisotope measuring system. This installation allows one to measure the thickness of organic deposits by acting on the oil flow with a narrow beam of radiation. After passing through the pumped medium, radiation is registered.
In [
12,
13], in order to study the mechanisms of APRD formation, a laboratory installation called “ColdFinger” was used. This equipment allows one to simulate the process of formation of organic deposits in a simplified manner, but the main purpose of its use is to conduct comparative laboratory tests to identify the most effective APRD inhibitors.
The most accurate descriptors of the process of APRD formation are the obtained correlations when conducting research on specialized flow loops. Such equipment was used in the studies published in [
14,
15]. Modeling the formation of APRDs in a hydraulic circuit is the preferred research approach, because reproduction of the process can be characterized as the closest to field conditions.
The results of this work demonstrate that modern physical models used in advanced software do not provide the necessary accuracy of wax deposition calculations. It is shown that in order to obtain accurate solutions, an empirical database of the studied liquids is necessary.
2. Materials and Methods
To determine the correct correlation dependence of the paraffin precipitation rate, it is necessary to develop a database of experimental data for oils characteristic of the Perm region. Our research was carried out in the laboratory of “Oilfield Chemistry” of the Scientific and Educational Center of Geology and Development of Oil and Gas Fields at Perm National Research Polytechnic University, using a Wax Flow Loop (Joint development with LLC “Dius Lab”, Skolkovo, Moscow, Russia) high-pressure stand, which enables the reproduction of the movement of oil in tubing. This installation is a closed loop through which the investigated oil sample circulates under the given temperature and pressure conditions and speed modes; its use allows one to repeat the conditions close to those in the field, and to correctly determine the rate and thickness of the deposition of asphaltene–resin–paraffin substances.
Figure 1 shows an image of the Wax Flow Loop and the software interface that allows one to monitor the process performance during the study.
Functionally, the hydraulic stand contains a feed tank, in which the oil is heated and maintained at a predetermined temperature, along with a gear circulating pump, a test section with the ability to maintain a constant wall temperature, two thermostats, a differential pressure indicator, a device for adding APRD inhibitors, auxiliary technical tanks for cleaning operations, and measuring instruments to monitor the progress of the study. The design features of the Wax Flow Loop used make it possible to control the operation of the circulation pump in two modes: with the maintenance of a constant set oil flow rate along the hydraulic circuit, or with the maintenance of a constant frequency of the circulation pump.
The following is a description of the experimental procedure: Initially, the test sample is prepared by removing free water from it, since the installation allows the study of only a single-phase fluid. Then, the sample is placed in a raw material container, where it is heated using circulating thermostats to a predetermined temperature
Tf. Next, the sample is pumped into the test section, which is a model of the pipeline with diameter
d = 4.5 mm and length
l = 1 m, the walls of which are pre-cooled to the temperature
Tw (
Tf >
Tw). As a result of the appearance of a radial temperature gradient, organic deposits fall out. This, in turn, leads to a narrowing of the diameter of the test section, which affects the pressure difference between its inlet and outlet, which is recorded using a differential pressure gauge. Subsequently, the fluid through the filter enters the density meter, which registers the current mass flow rate and density, after which it again appears in the feed tank and the process repeats. In this case, during the entire experiment, a set of parameters characterizing the process were recorded, which were subsequently used to determine the thickness of the deposits using the Poiseuille equation:
where
h is the thickness of the precipitated paraffin (m); Δ
P is the pressure drop in the test section (MPa);
Q is the volumetric flow rate of the test fluid (m
3/s);
η is the oil viscosity (m
2/s),
l is the length of the test section (m); and
d is the test section diameter (m).
Thus, a series of experiments was carried out for 20 different oil samples from different oil reservoirs, taken from the outlet of a submersible electric centrifugal pump, in order to study the dependence of the wax deposition rate over time depending on the applied temperature gradient.
Figure 2 shows an example of results from one of the considered oil samples obtained using this installation, representing the change in the thickness of the organic sediment layer over time.
Before developing the correlation model, the experimental data obtained and the results of numerical modeling using the Matzain and RRR models were compared. As can be seen from
Figure 3, these models have very low accuracy and cannot describe the behavior of paraffin deposition for oils of the Perm region.
As the results of the studies show, the shape of the curve characterizing the change in the thickness of the APRD layer over time can be described by three functions: a polynomial, a power function, and an exponential (
Figure 4).
The power-law function has good convergence with the experimental data at the initial time interval; however, with increasing time, it can be seen that the growth rate of the power-law function slows down, which can lead to overestimated values when calculating the inter-treatment period between cleaning the inner cavity of the lift pipes or ground pipelines. The opposite situation is observed for the exponential function; with increasing time, a very rapid increase in the thickness of wax deposition is observed which, in turn, leads to underestimated values of the calculated inter-treatment period. The polynomial function describes the growth of complications with the greatest accuracy of approximation. Thus, as a basis for describing the APRD deposition growth rate, we take a polynomial function, which in general has the following form:
where
C1,
C2, and
C3 are empirical constants determined for each sample from the experimental data, and
t is time.
The main influence on the rate of wax deposition is exerted by the temperature gradient between the fluid flow and the wall, and by the water content in the produced and transported products (water cut). To account for these mechanisms, Equation (2) was modified as follows:
where
Tf is the fluid temperature (K);
Tw is the wall temperature (K); Δ
T is the temperature difference between the flow and the wall, corresponding the experiment (K); and
wc is the water cut. Thus, we make the assumption that the wax growth rate is linearly dependent on the temperature difference and the water cut. The values of the empirical coefficients are constant for each oil sample.
Let us check this equation for the limiting cases. If the water cut is maximum (wc processed = 1), then in this case the fluid is water and the sediments do not fall out, which follows from Equation (3). If the wall temperature is equal to the fluid temperature, this indicates the absence of a temperature gradient and, therefore, the absence of organic deposits on the stacks; this condition is also fulfilled in Equation (3). If the temperature gradient corresponds to the temperature gradient of the experiment, then the formula will reproduce the results obtained at the facility. It should be noted that another factor influencing the rate of wax growth is the fluid flow rate. This was taken into account during the experiment, because for each sample, the corresponding thermobaric and velocity conditions were selected.
It should also be noted that the maximum value of the wax layer thickness is limited by the size of the test section diameter, which is 4.5 mm. However, the critical value of the thickness at which the well treatment is carried out is assumed to be 0.2 mm. Thus, the use of a polynomial of the second degree allows us to correctly determine the time at which the critical thickness is reached.
The next step was the development of a module for the software “Engineering Simulator of Technological Processes”, which allows calculation of the thickness of the APRD formation, as well as determining the optimal inter-treatment period for cleaning the tubing using a scraper. The main feature of the developed module is its ability to carry out calculations using a correlation model built on the basis of experimental data for calculations using Equation (3). The Engineering Simulator of Technological Processes software is a dynamic simulator of the movement of multiphase systems along the production strings of oil wells and surface pipelines. The development of this software product was carried out by specialists of the Scientific and Educational Center of Geology and Development of Oil and Gas Fields at Perm National Research Polytechnic University, under the requirements of the oil production company LLC “LUKOIL-PERM”. The developed functionality allows the following tasks to be solved: performing static and dynamic calculations of the movement of a gas–liquid mixture in wells and onshore pipelines; selecting the optimal downhole pumping equipment; performing hydraulic calculations of the maximum throughput of oil collection and transportation systems, reservoir pressure maintenance systems, and gas transport systems; and modeling and predicting APRD formation, hydrate formation, salt formation, and sludge formation. “Engineering Simulator of Technological Processes” allows the virtual simulation of the process of oil and gas production in the field, with reproduction of the real spatial locations of wells and pipelines, their geometry, and the standard sizes and characteristics of the equipment used.
Figure 5 shows the interface of the software product “Engineering Simulator of Technological Processes”.
Thus, digital models of the oil-producing wells under consideration were initially created using actual data on the structure and their spatial position, information on the actual flow rate of the wells, water cut, GOR values, and information on the downhole pumping equipment used. Then, the characteristics in the tubing were calculated using the Unified model [
16,
17], whereby both the flow temperature and the wall temperature were determined. The empirical coefficients
C1,
C2, and
C3 were determined from the experimental data file using the least squares method, and the thickness of the APRD layer formed, as well as the inter-treatment period, were calculated.
3. Results and Discussion
The initial application of the developed methodology was carried out on 20 different oil reservoirs of the Perm Territory fields, the oils of which differ greatly in their properties. Initially, modeling of the formation of APRDs was carried out using the developed software module “Engineering Simulator of Technological Processes”, and the 20 selected samples were compared with the actual values of routine maintenance on these wells (
Table 1), on the basis of which the optimization of the inter-treatment period for well treatment was achieved.
As can be seen from the comparison of the actual values and the results of numerical modeling, the actual inter-treatment period is underestimated in almost all wells, which leads to excessively frequent treatments and additional economic costs. In this regard, on the basis of the obtained values, the actual inter-treatment period was gradually corrected, approaching the calculated values. Thus, it was possible to achieve an increase in the average value of the actual inter-treatment period from 0.8 days to 2.9 days.
Due to the positive effect of the use of our method, its application was further extended to other wells of the considered fields. At the same time, it was assumed that the properties of oil within one field were similar, and that the main influence on the rate of APRD formation was exerted by the temperature gradient and water cut, i.e., the samples taken from the discharge of deep electric centrifugal pumps would act as a model analogue for the rest of the wells of the same oil reservoir. Thus, a calculation was carried out, based on the results of which an adjustment was made for 154 wells in the fields of the Perm Krai; of these, in 71% of cases, corresponding to 109 wells, it was possible to optimize the actual value of the inter-treatment period, while in 26% (40 wells) there were problems with landings and scraper failures as a result of adjusting the inter-treatment period, and for the remaining 3% (5 wells) the calculated parameters turned out to be less than the actual value, indicating that the current value did not need to be adjusted. Most likely, this deviation of 26% can be explained by the discrepancy between the properties of actually produced hydrocarbons and the model oil breakdown; that is, we can say that on average there are ~7–8 wells per sample. Nevertheless, despite the small number of samples, it was possible to optimize the work of cleaning the tubing for a large number of wells.
4. Conclusions
From the results of our research, the following conclusions can be drawn:
1. A new correlation model has been developed and implemented for predicting the formation of APRDs using the software product “Engineering Simulator of Technological Processes” in order to further optimize the measures to remove APRDs;
2. The developed method, which consists of obtaining empirical coefficients based on the experimental data obtained at the Wax Flow Loop installation for the field sample, allows the calculation the inter-treatment period for all wells of the field, with good accuracy;
3. The model was applied to calculate wax deposition for 154 wells. The results of numerical modeling of the paraffin precipitation process made it possible to correct the inter-treatment period of scraping for 109 wells (71%) out of 154, from a total of 20 samples taken, which indicates high accuracy of the developed approach for calculating the formation of APRDs, even with a small amount of experimental data;
4. The use of a larger number of samples will increase the accuracy of this calculation method, which will, in turn, reduce the number of well treatment activities, and will have a beneficial effect on reducing operating costs.


