Article

Numerical Simulation of Fountain Formation due to Normal and Inclined Twin-Jet Impingement on Ground

Department of Mechanical Engineering and Materials Science, Washington University in St. Louis, St. Louis, MO 63131, USA
*
Author to whom correspondence should be addressed.
Fluids 2020, 5(3), 132; https://doi.org/10.3390/fluids5030132
Submission received: 29 June 2020 / Revised: 3 August 2020 / Accepted: 6 August 2020 / Published: 8 August 2020
(This article belongs to the Special Issue Recent Advances in Fluid Mechanics: Feature Papers)

Abstract

:
The goal of this paper is to study numerically the flow physics of a fountain formed by twin-jet impingement on ground. The incompressible Reynolds-Averaged Navier-Stokes (RANS) equations with realizable k-ε and WA (Wray-Agarwal) turbulence model are employed in the numerical simulations with ANSYS Fluent. A series of numerical simulations for straight and inclined fountain formations are conducted by changing the geometric and flow parameters of twin jets and distance between them. The changes in parameters include variations in the jet Reynolds number from 2 × 10⁴ to 8 × 10⁴, impingement height, distance between the centerlines of the two jets from 1.4D to 16D where D is the jet diameter, and ratio of the Reynolds number of the two jets from 1 to 4. It is shown that different Reynolds numbers of the two jets can result in a fountain that inclines towards the jet with smaller Reynolds number. Detailed flow field simulations for a large number of cases are presented, and the flow physics of fountain formation is analyzed for the first time in the literature.

1. Introduction

Impinging jets have been widely studied because of their significance in many fluid mechanics and engineering applications. For example, impinging jets are applied for industrial cleaning, metal cutting and cooling systems of high pressure turbine blades that face extremely high temperatures in gas turbine engine [1,2,3]. In another important fighter aircraft application related to the propulsion system of a Short-Takeoff and Vertical Landing (STOVL) or Vertical Take-off and Landing (VTOL) aircraft, multiple jets from the jet engine can impinge in the close vicinity of the ground during landing and take-off.
Several numerical and experimental studies have been conducted for twinjet impingement on ground resulting in fountain formation. Saripalli [4] conducted a flow visualization experiment of twin-jet impingement and studied the basic flow patterns near the stagnation lines and the effect of the ratio of jet momentum on the flow field. Ozmen [5] carried out the experimental investigation of flow characteristics of confined twin air jets at high Reynolds number where downwash fountain was formed. The Reynolds number of the air jet ranged from 30,000 to 50,000, nozzle to plate spacing was in the range 0.5D–4D, and the spacing between the jets was in the range 0.5D–2D. Barata et al. [6] measured the velocities in the flow field resulting from single and twin jets impingement against a wall in the presence of cross-flow by laser-dropper velocimetry. They also performed the RANS computations using a two-equation turbulence model and compared the computed results against the experimental data. Greco et al. [7] investigated the flow features in the near field region of single and twin synthetic jets to evaluate influence of the jet interactions by varying the distance between the axis of two jets by 1.1, 3 and 5 times the nozzle diameters. Abdel-Fattah [8] studied the impinging twin-jet flow without cross flow by both the experimental and numerical methods. The parameters in his study considered jet Reynolds number from 9.5 × 10⁴ to 22.4 × 10⁴; nozzles to plate spacing of 3D to 12D; nozzle to nozzle spacing of 3D, 5D and 8D; and jet angles from 0 to 20 degrees. Wang et al. [9] conducted an experimental investigation of a single water jet impingement at various impingement angles and Reynolds numbers. Taghinia et al. [10] investigated twin-jet impingement numerically with Reynolds-Averaged Navier–Stokes (RANS)—Large Eddy Simulation (LES) hybrid turbulence model and showed that Shear Stress Transport (SST)—Scale Adaptive Simulation (SAS) model can produce more accurate predictions. Attalla et al. [11] performed an experiment with a pair of inclined circular air jets and studied their impact on heat transfer characteristics of the impingement plate. Sharif [12] investigated inclined twin slot-jet impingement numerically and studied the influence of impingement angle on heat transfer distribution on the impingement surface. Faris et al. [13] conducted both an experimental and numerical study of twin jet impingement and studied the mechanism of heat transfer enhancement.
Although several numerical simulations have been reported in the literature, twin jet impingement has been studied only for a very small range of parameters. Also, there is paucity of results for parameters that result in inclined fountain flow in contrast to symmetrical fountain flow. Inclined fountain flow has more engineering importance since impinging jets are difficult to be controlled as completely identical.
In this study, RANS equations with realizable k-ε [14] and Wray-Agarwal (WA) [15] turbulence models are used to conduct numerical simulations of twin impinging jets. The range of parameters considered include the inlet jet Reynolds number from 2 × 10⁴ to 8 × 10⁴, distance between centerlines of twinjet from 1.4D to 16D, and ratio of Reynolds number between the two jets from 1 to 4. Velocity and pressure fields are computed and analyzed.

2. Numerical Method and Validation

2.1. Physical Model

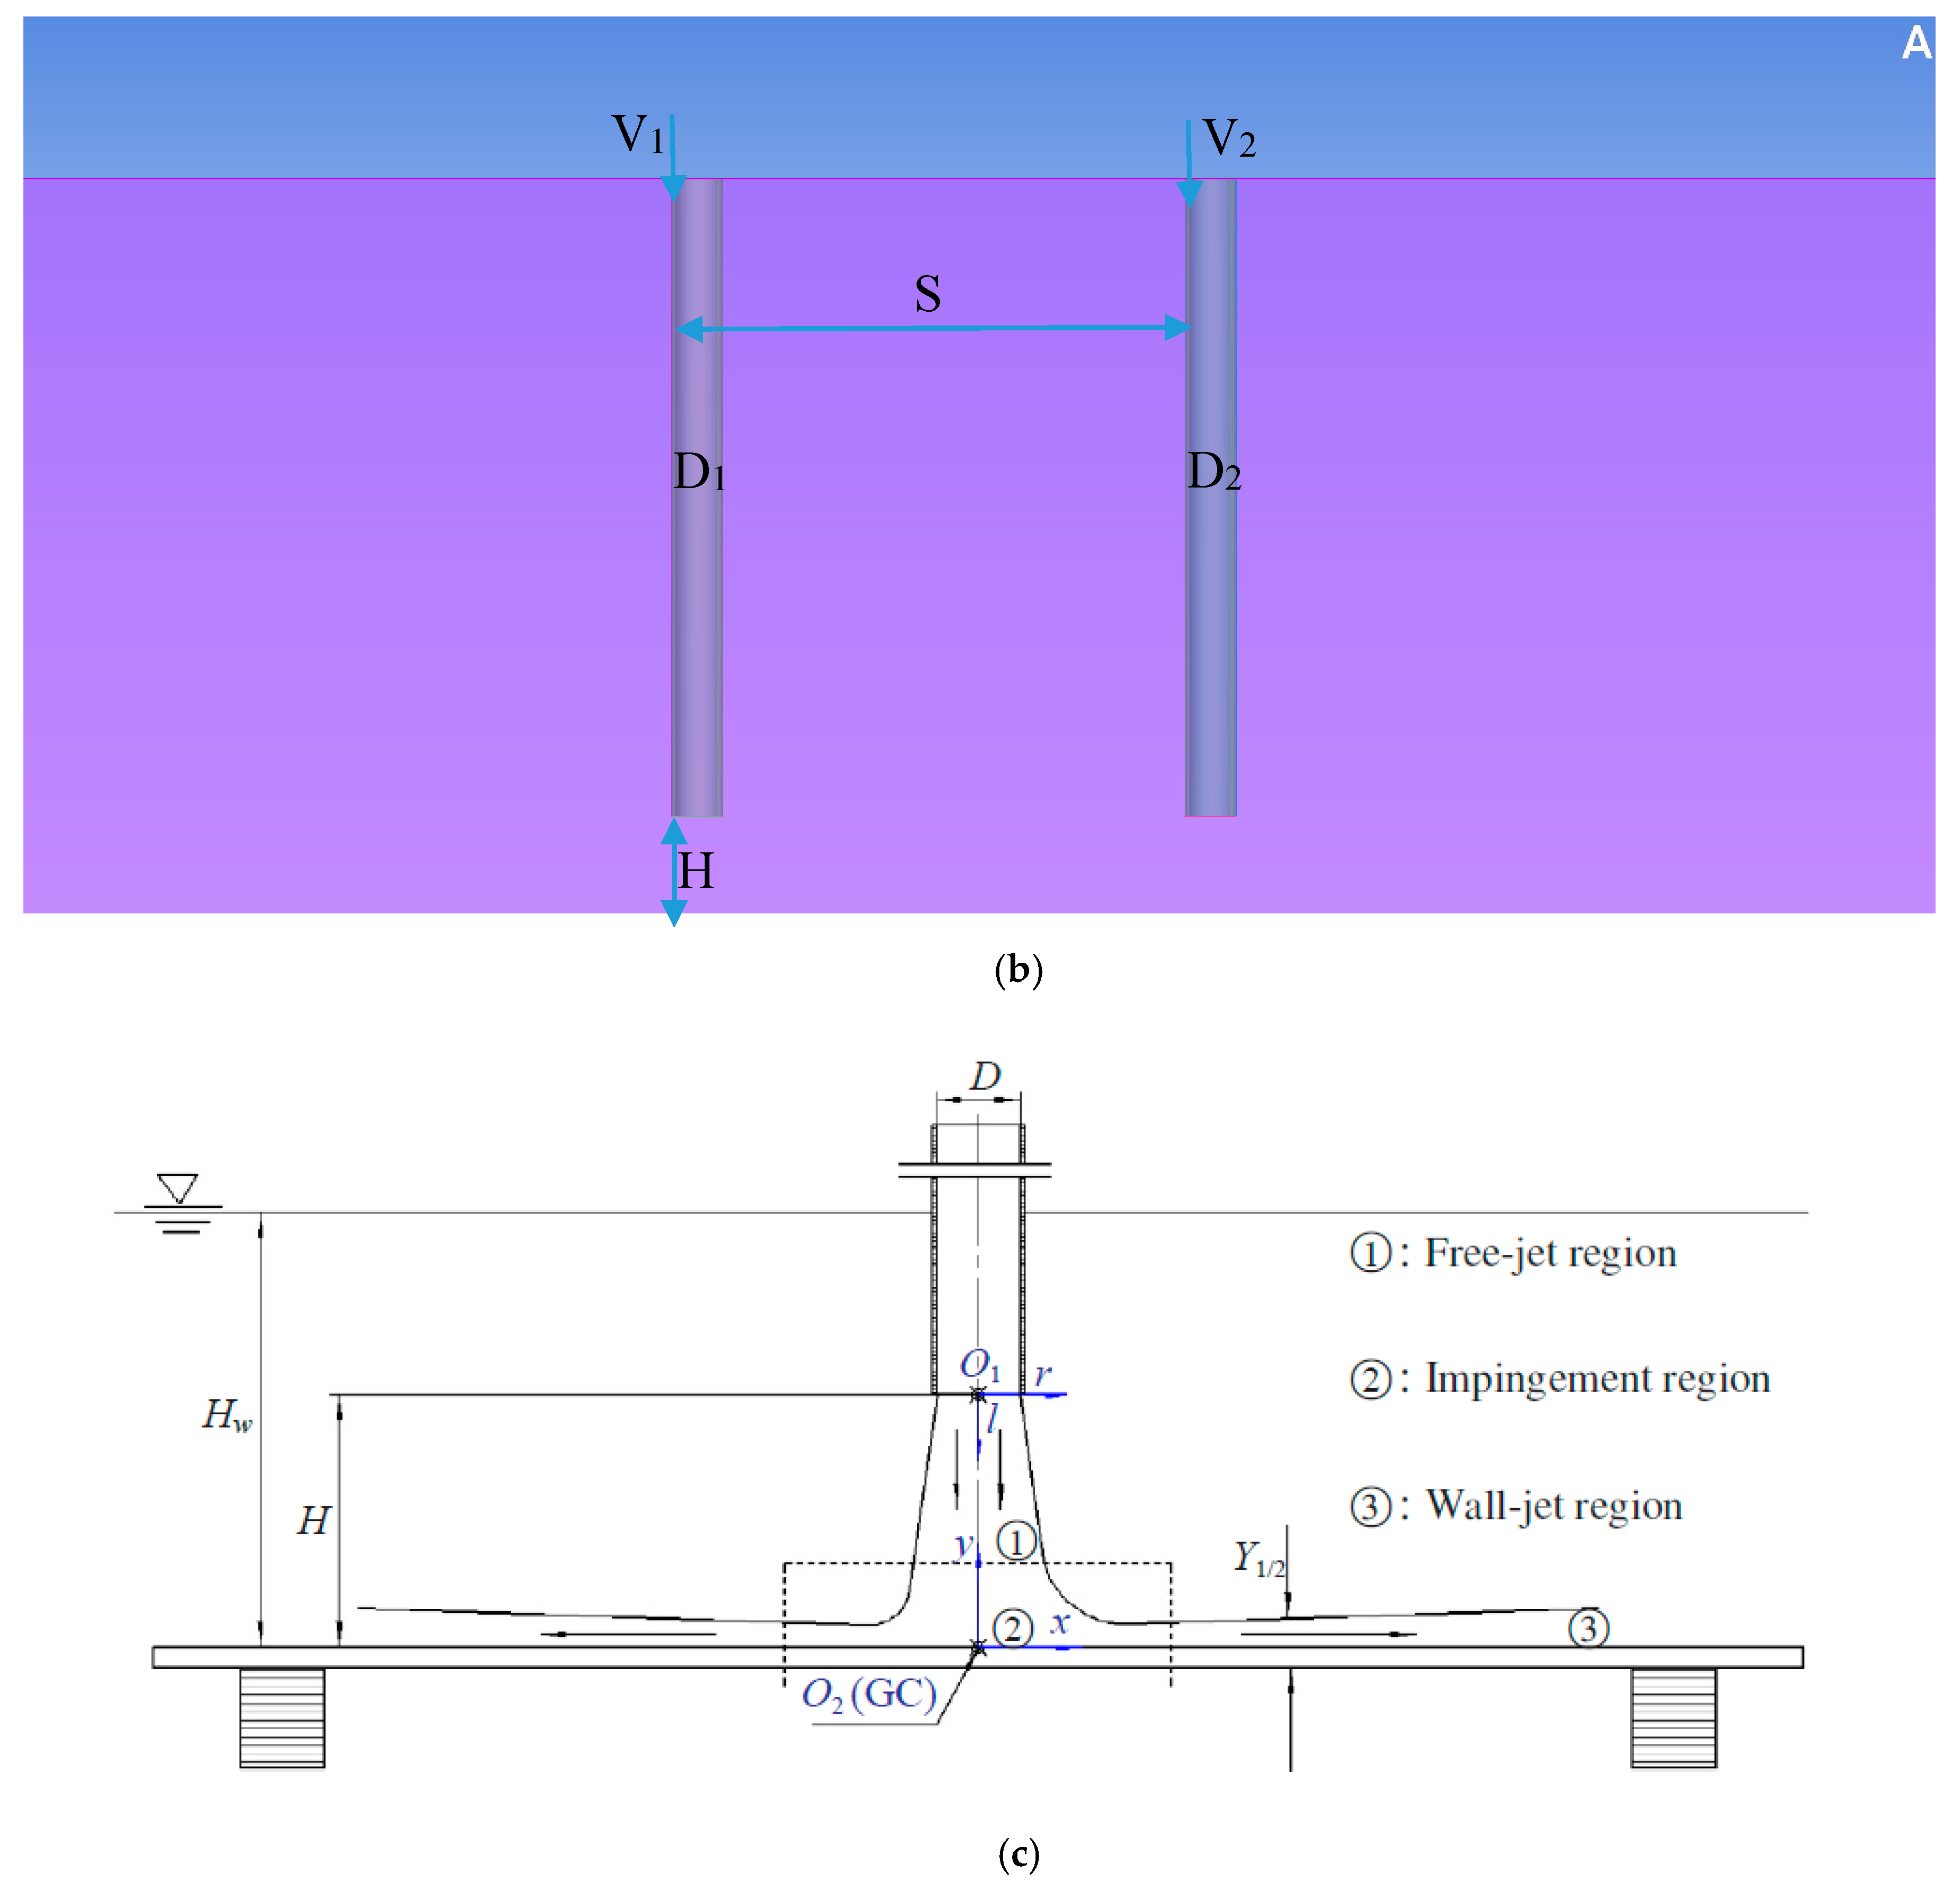
The computational domain is a cuboid with length × width × height = 5000 mm × 1000 mm × 400 mm as shown in Figure 1a. The physical model is very similar in all cases computed, except there are changes in some parameters. In most cases, D, diameter of the jet, is fixed at 0.02 m and impingement height H from jets exit to the ground is fixed at a distance of 3D. The distance between the centerline of jets, S is changed between various cases.
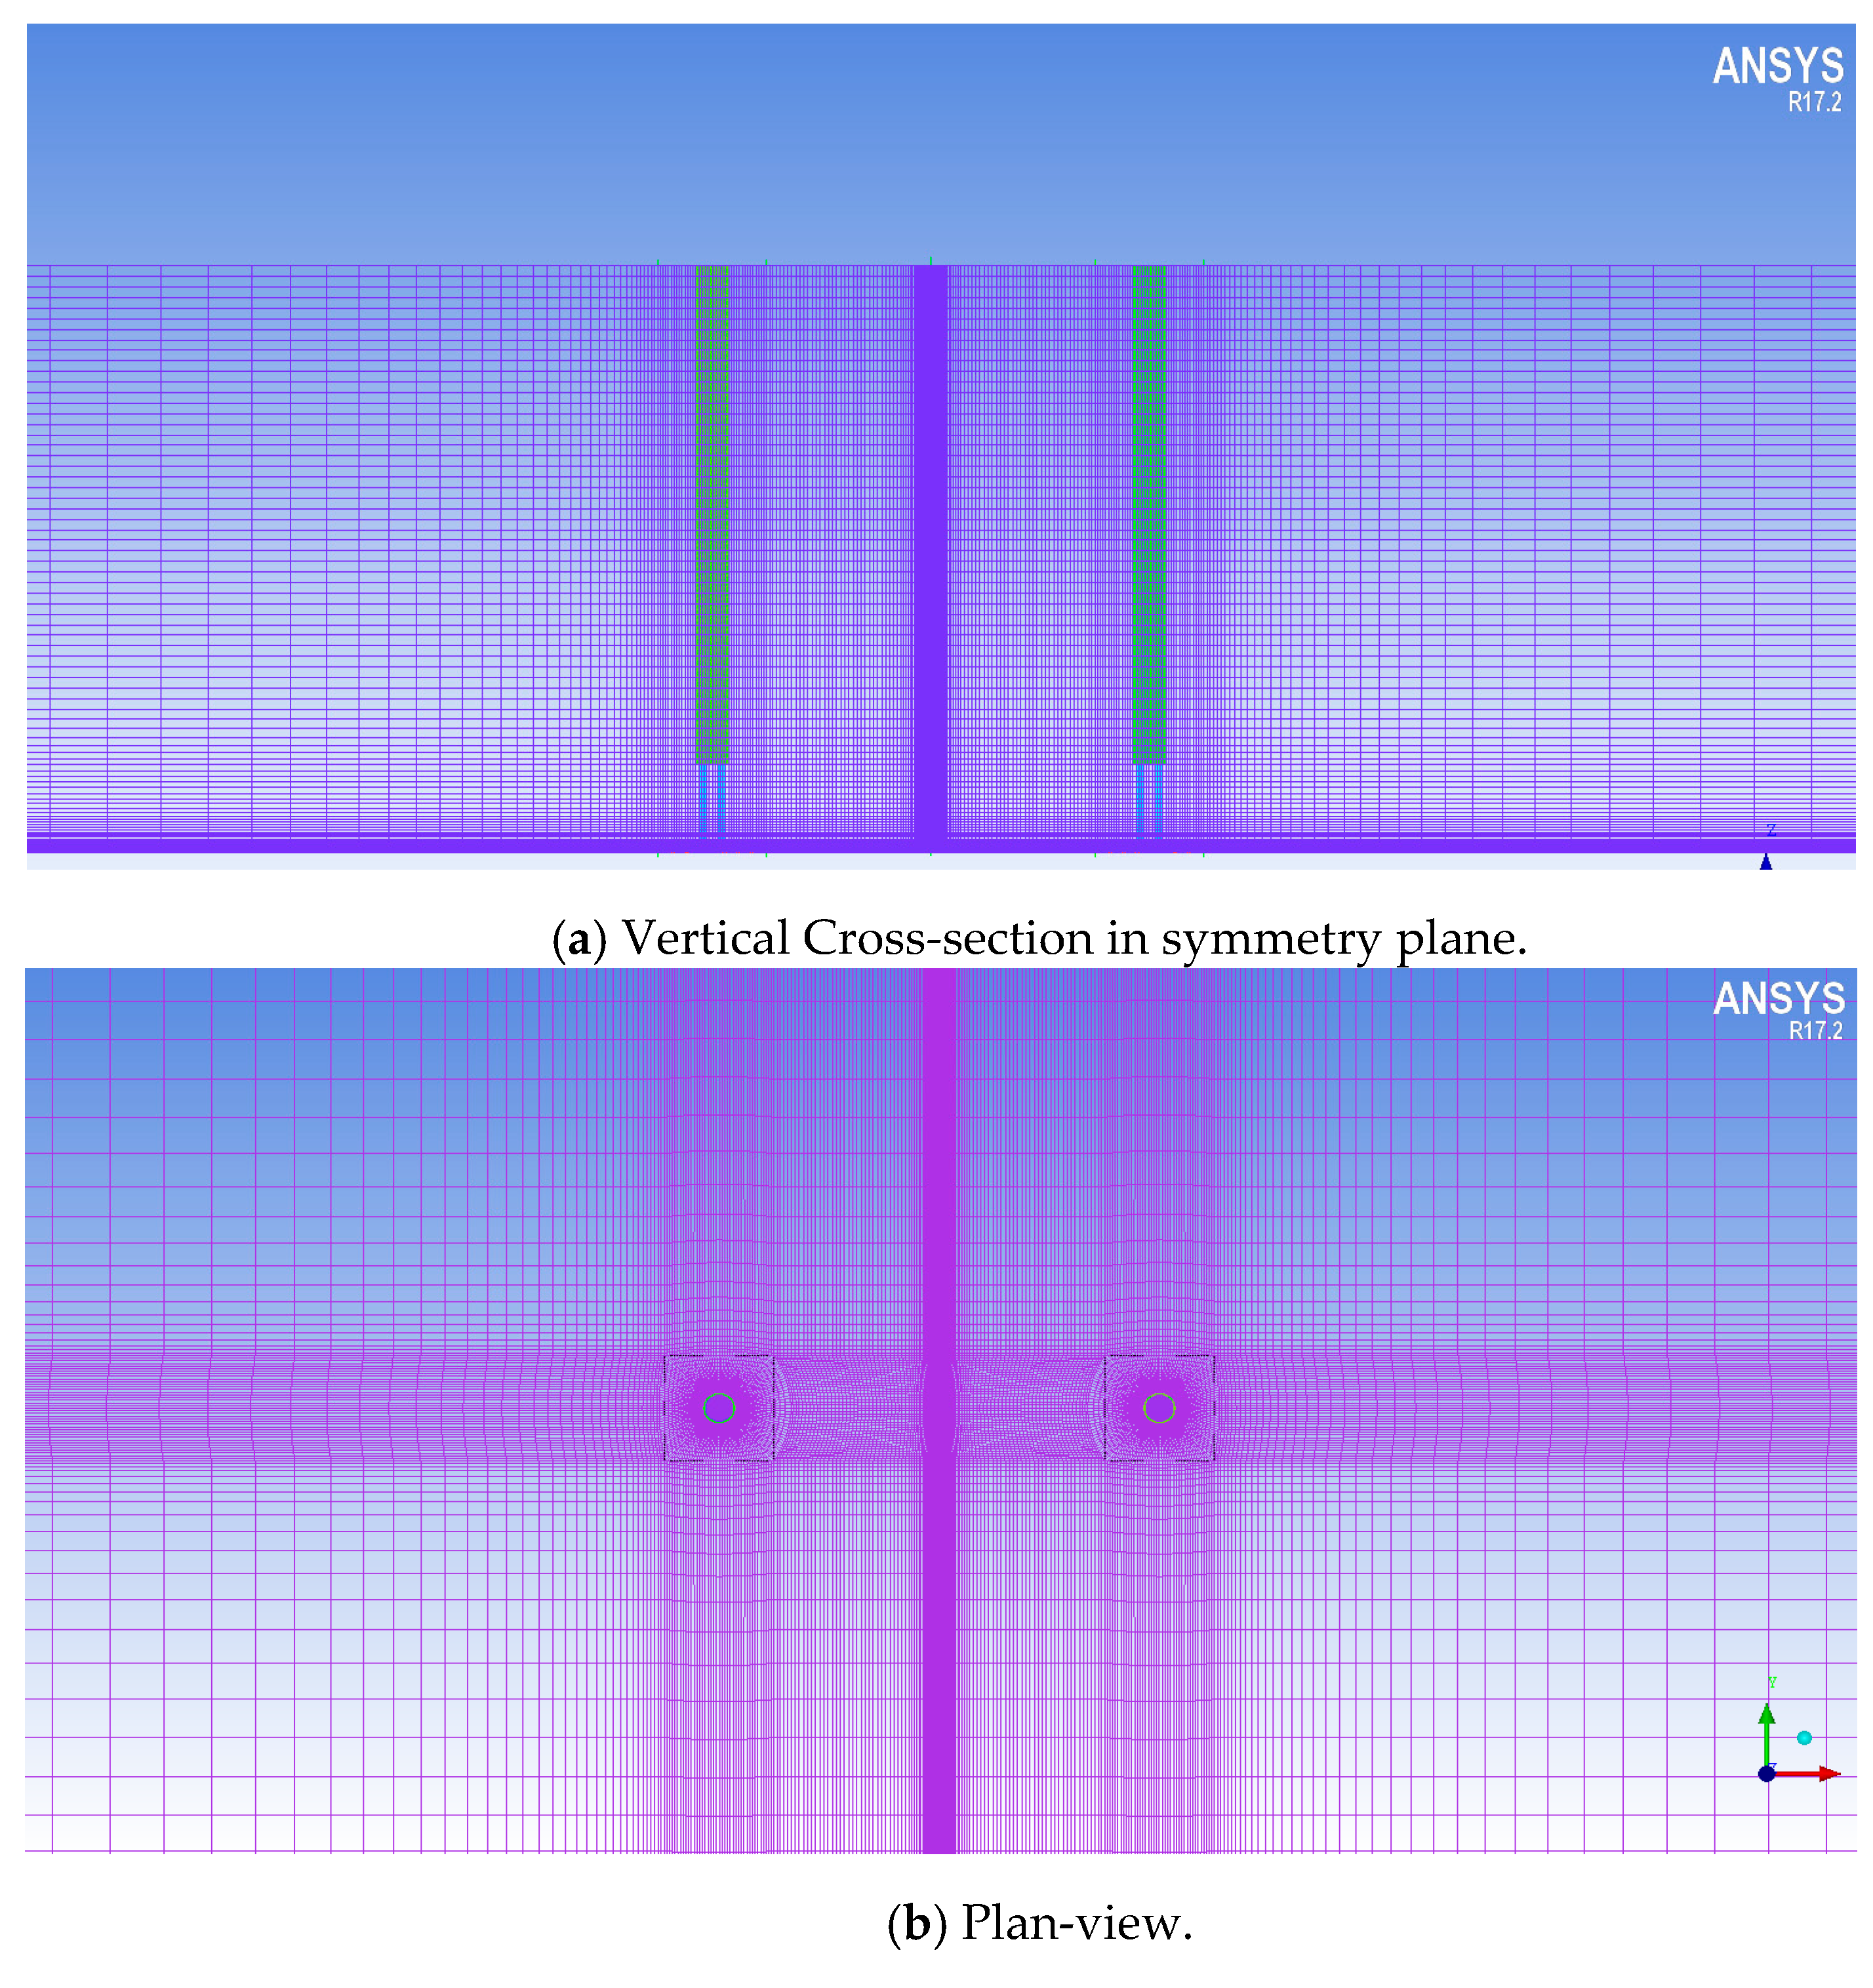
Since the physical model is not complex, a structured grid was generated by ICEM CFD, which is part of ANSYS 18.2 software, Canonsburg, PA, USA. The mesh was refined in regions with large velocity gradients including the areas near the impingement plane, near the interior surface of the pipe from which the jet exits, and in the fountain region resulting from the twin-jet interaction. The size of the first mesh layer is 1 × 10 4 m from the interior surface of the pipe and is 1 × 10 5 m from the impingement plane in order to ensure that y+ <1. Around a pipe, a cuboid block with square cross-section is created. In this block, three layers of O-grid are generated: The edge of the first layer of O-grid is associated with the exterior surface of the pipe; the second layer of O-grid is associated with the interior surface of the pipe; and the grids inside the third O-grid are adapted to the flow in the pipe. Figure 2 shows the grid refinement regions when the distance between the jets is 16D. Figure 3 shows the grid quality distribution. The mesh independence of the solution study was performed for 90 degree single jet impingement case and a fountain formation case with twin-jet impingement at 90 degree by computing the solution on a coarse, medium and fine mesh. Medium mesh was found to be accurate and efficient and was selected in all single and twin-jet computations reported in this paper.

2.2. Governing Equations and Numerical Method

Since the fluid medium is water, the governing equations are incompressible Navier–Stokes (NS) equations including continuity and momentum Equations as shown below:
ρ t + · ( ρ u ) = 0
t ( ρ u ) + · ( ρ u u ) = P + μ · ( u + u T )
where density ρ = constant, u is the velocity vector, P is pressure, and μ is dynamic viscosity. However, it is not possible to solve NS equations by Direct Numerical Simulation (DNS) or even by Large Eddy Simulation (LES) for 3D flows because of current unavailability of computational resources required. Currently, Reynolds-Averaged Navier-Stokes (RANS) equations are widely used in majority of industrial applications. RANS equations are time-averaged NS equations and produce an extra term in momentum equation called the Reynolds Stress tensor, which leads to the closure problem for RANS equations. The closure is achieved by modeling the Reynolds stresses by employing a turbulence model. In this paper, we employ the two-equation realizable k-ε and one-equation Wray-Agarwal (WA) turbulence models, which are eddy/turbulent viscosity models based on Boussinesq assumption. With Boussinesq assumption, the momentum equations in RANS Equations can be written as:
t ( ρ u ) + · ( ρ u u ) = P + ( μ + μ t ) · ( u + u T )
where μ t is the turbulent eddy viscosity obtained by the turbulence model.
Realizable k-ε model consists of a transport equation for turbulent kinetic energy k and its dissipation rate ε, which can be expressed as follows; the details are provided in Ref. [14].
t ( ρ k ) + x j ( ρ k u j ) = x j [ ( μ + μ t σ ε ) k x j ] + G κ + G b ρ ε Y M + S k
t ( ρ ε ) + x j ( ρ ε u j ) = x j [ ( μ + μ t σ ε ) ε x j ] + ρ C 1 S ε ρ C 2 ϵ 2 k + ϵ ν + C 1 ϵ ϵ κ C 3 ϵ + S ε
μ t = ρ C μ k 2 ϵ
One-equation WA model is also used in this study and is governed by the transport equation for R = k/ω, the details are provided in Refs. [15,16]:
t ( R ) + x j ( R u j ) = x j [ ( σ R R + ν ) R x j ] + C 1 R S + f 1 C 2 κ ω R S R x j S x j ( 1 f 1 ) C 2 κ ϵ R 2 ( S x j S x j S 2 )
The eddy viscosity is given by:
μ t = ρ f μ R
Realizable k-ε model can be selected directly from the viscosity model page in ANSYS Fluent, while Wray-Agarwal (WA) model is loaded in Fluent as UDF [17]. SIMPLE algorithm is used for pressure-velocity coupling. Second order scheme is used for discretization of pressure equation in SIMPLE and second order upwind discretization scheme is used for the momentum and turbulence model equations. The material for the entire domain is water, whose density is 998.2 kg/m3 and dynamic viscosity is 0.001003 kg/(m·s). The solution is considered as converged when residuals of monitored equations and parameters are <10−5.
For boundary conditions, the upper surfaces of pipes are set as velocity inlets where the velocity is normal to the surface. The lower surfaces of the pipes are set is pressure outlet where the gauge pressure is 0. All other surfaces are set as static walls without slip. In the validation case of a single jet impingement, inlet velocity at the pipe is 1.16 m/s with Reynolds number of ~23,400. In the fountain cases, inlet velocity varies from 1 m/s to 4 m/s with Reynolds number varying from 20,000 to 80,000.

2.3. Validation with Experiment of Single Jet Impingement

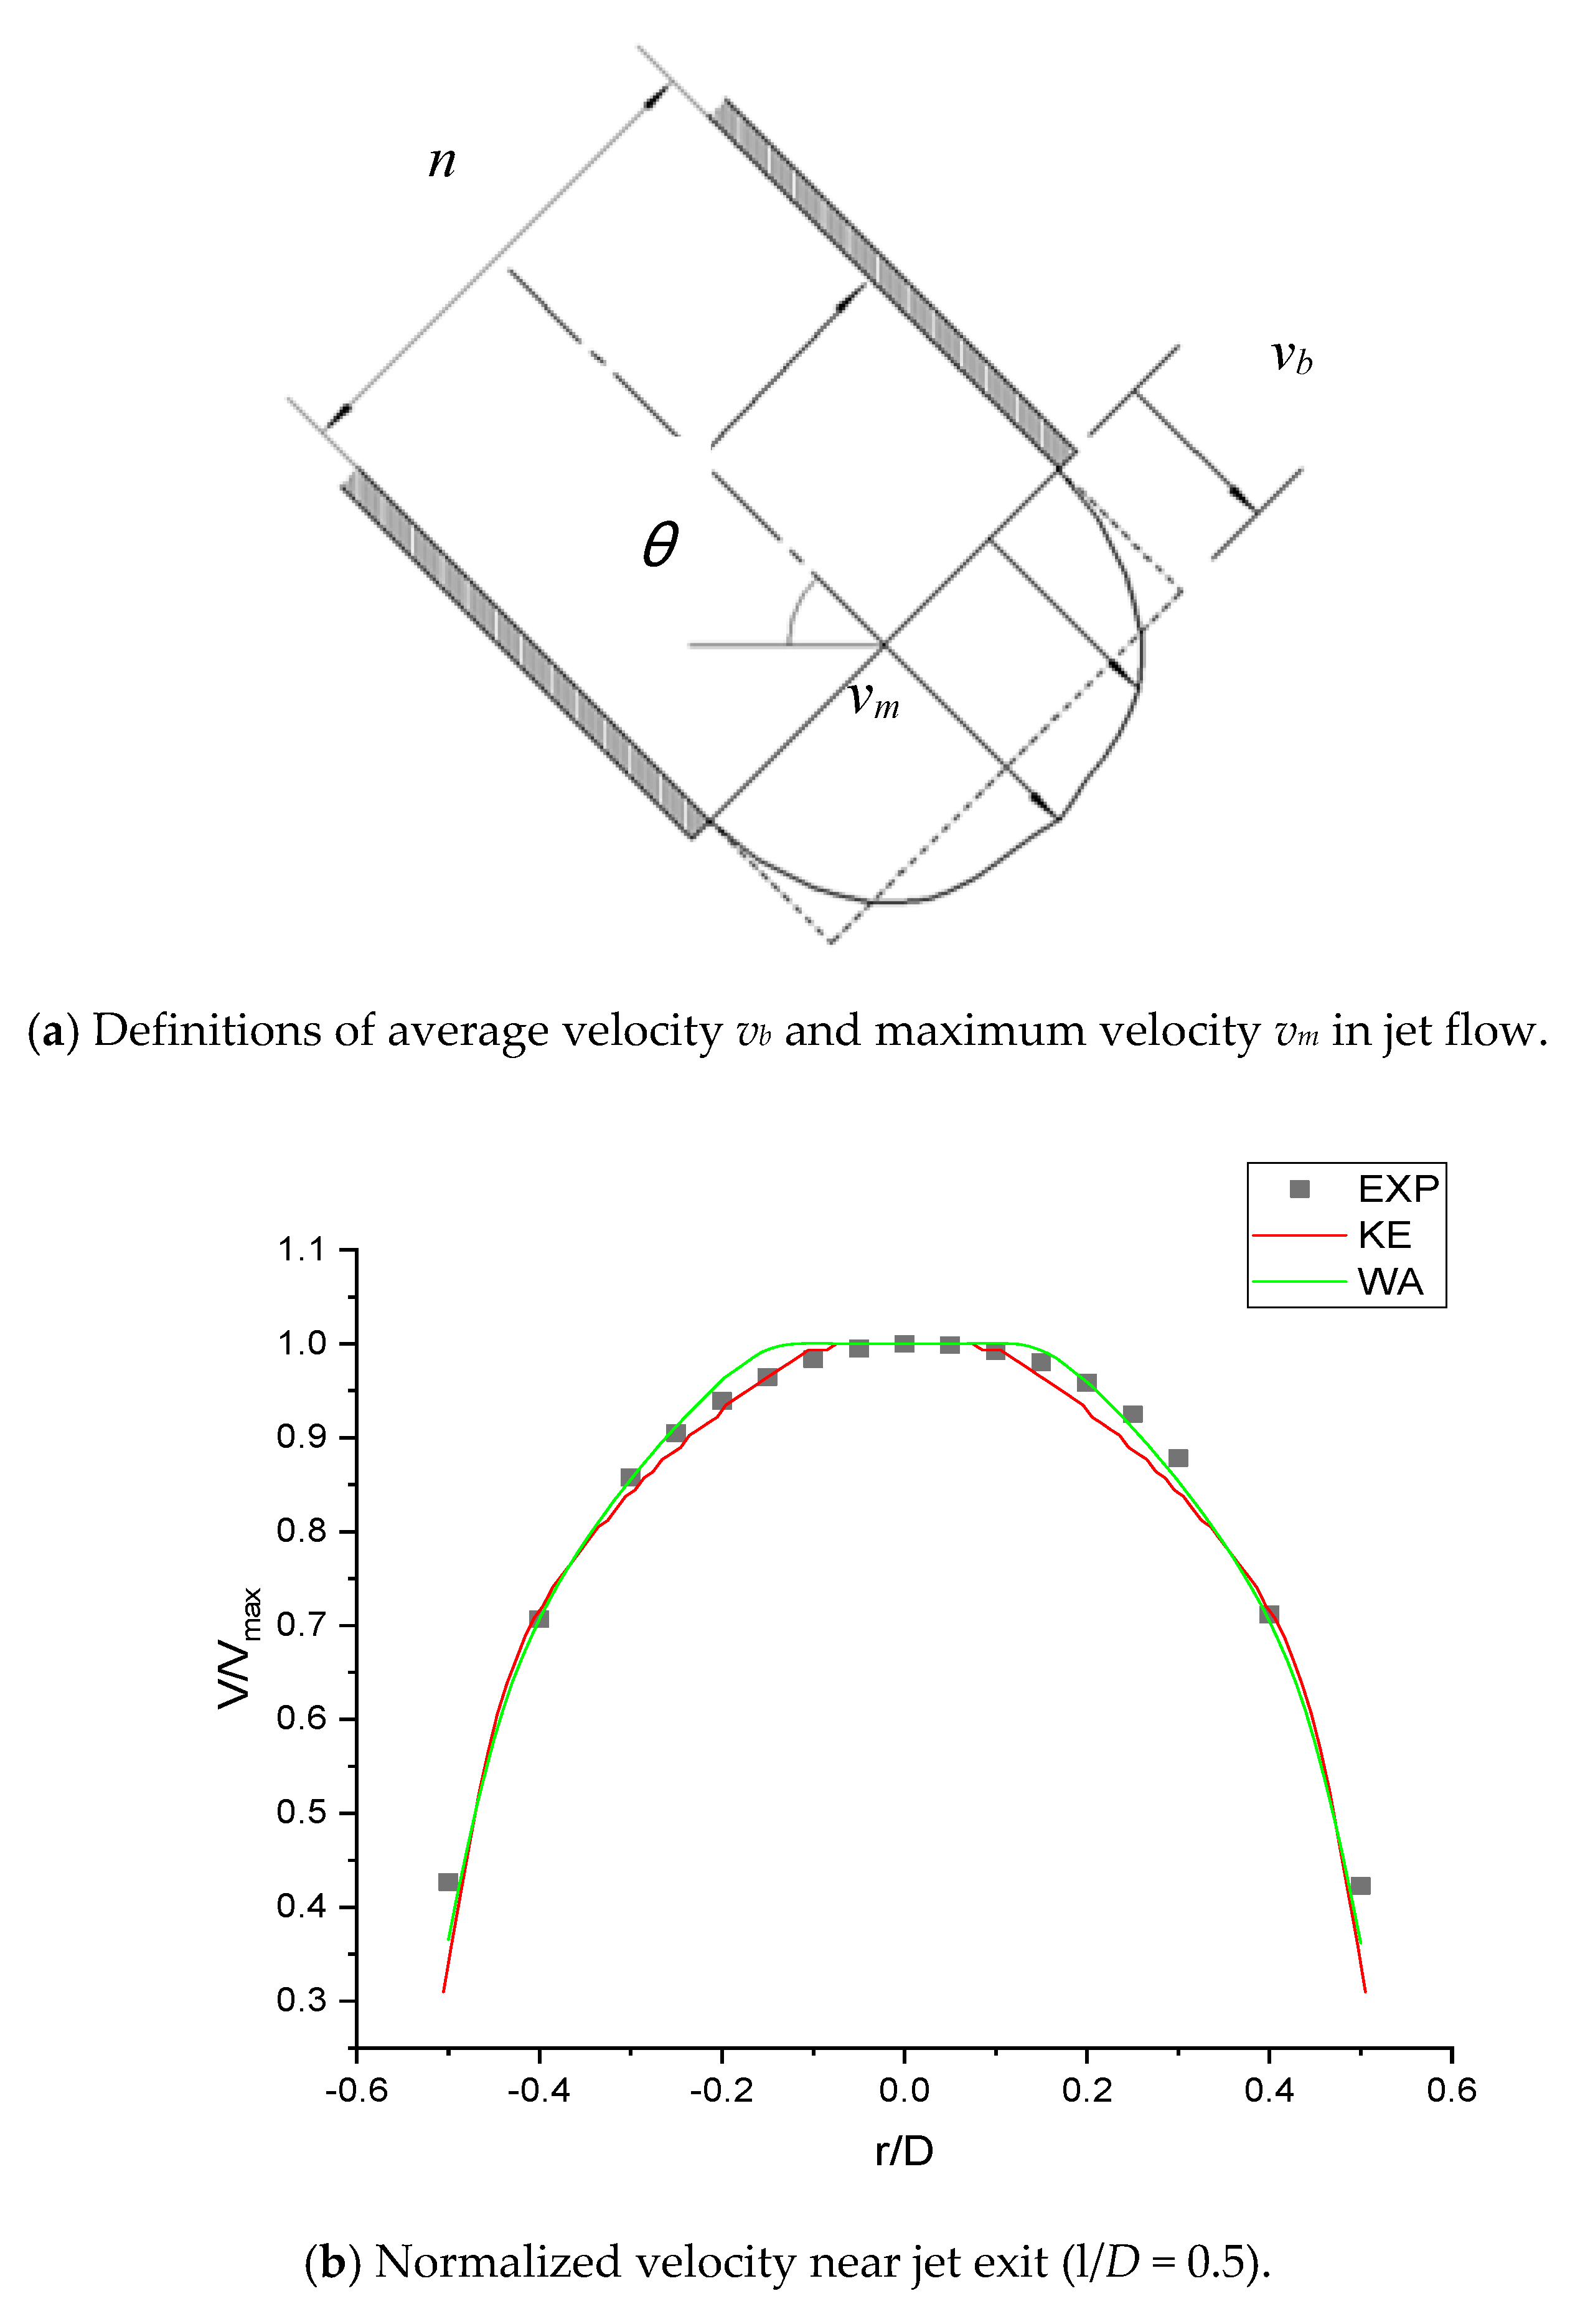
This part compares the results from numerical simulation using k-ε and WA turbulence models and experiment conducted by Wang et al. [9]. A mesh independence of the solution study was conducted by performing the computations on coarse, medium and fine mesh. Figure 4a shows the definition of average velocity, vb, and maximum velocity, vm, in the jet flow. In this study, vb and vm are used to normalize the velocity profiles, and the diameter of jet D is used to normalize the length parameters, e.g., axial distance l, radial distance r, etc. The average velocity vb in this case is 1.28 m/s, corresponding to Re (= vb D/ υ , υ is the kinematic viscosity of water = 1 × 10⁻⁶) = 25,600. Figure 4b shows the velocity profile near the exit of the jet flow (l/D = 0.5) from both CFD and experimental results. There is an excellent agreement between the two.
Figure 5 shows the normalized computed and experimental velocity profiles v/vb at various l/D for normal impingement at Re = 25,600 and H/D = 3. The magnitude of velocity decreases rapidly as |r/D| becomes greater than 0.5, especially in the region near the impingement plane.
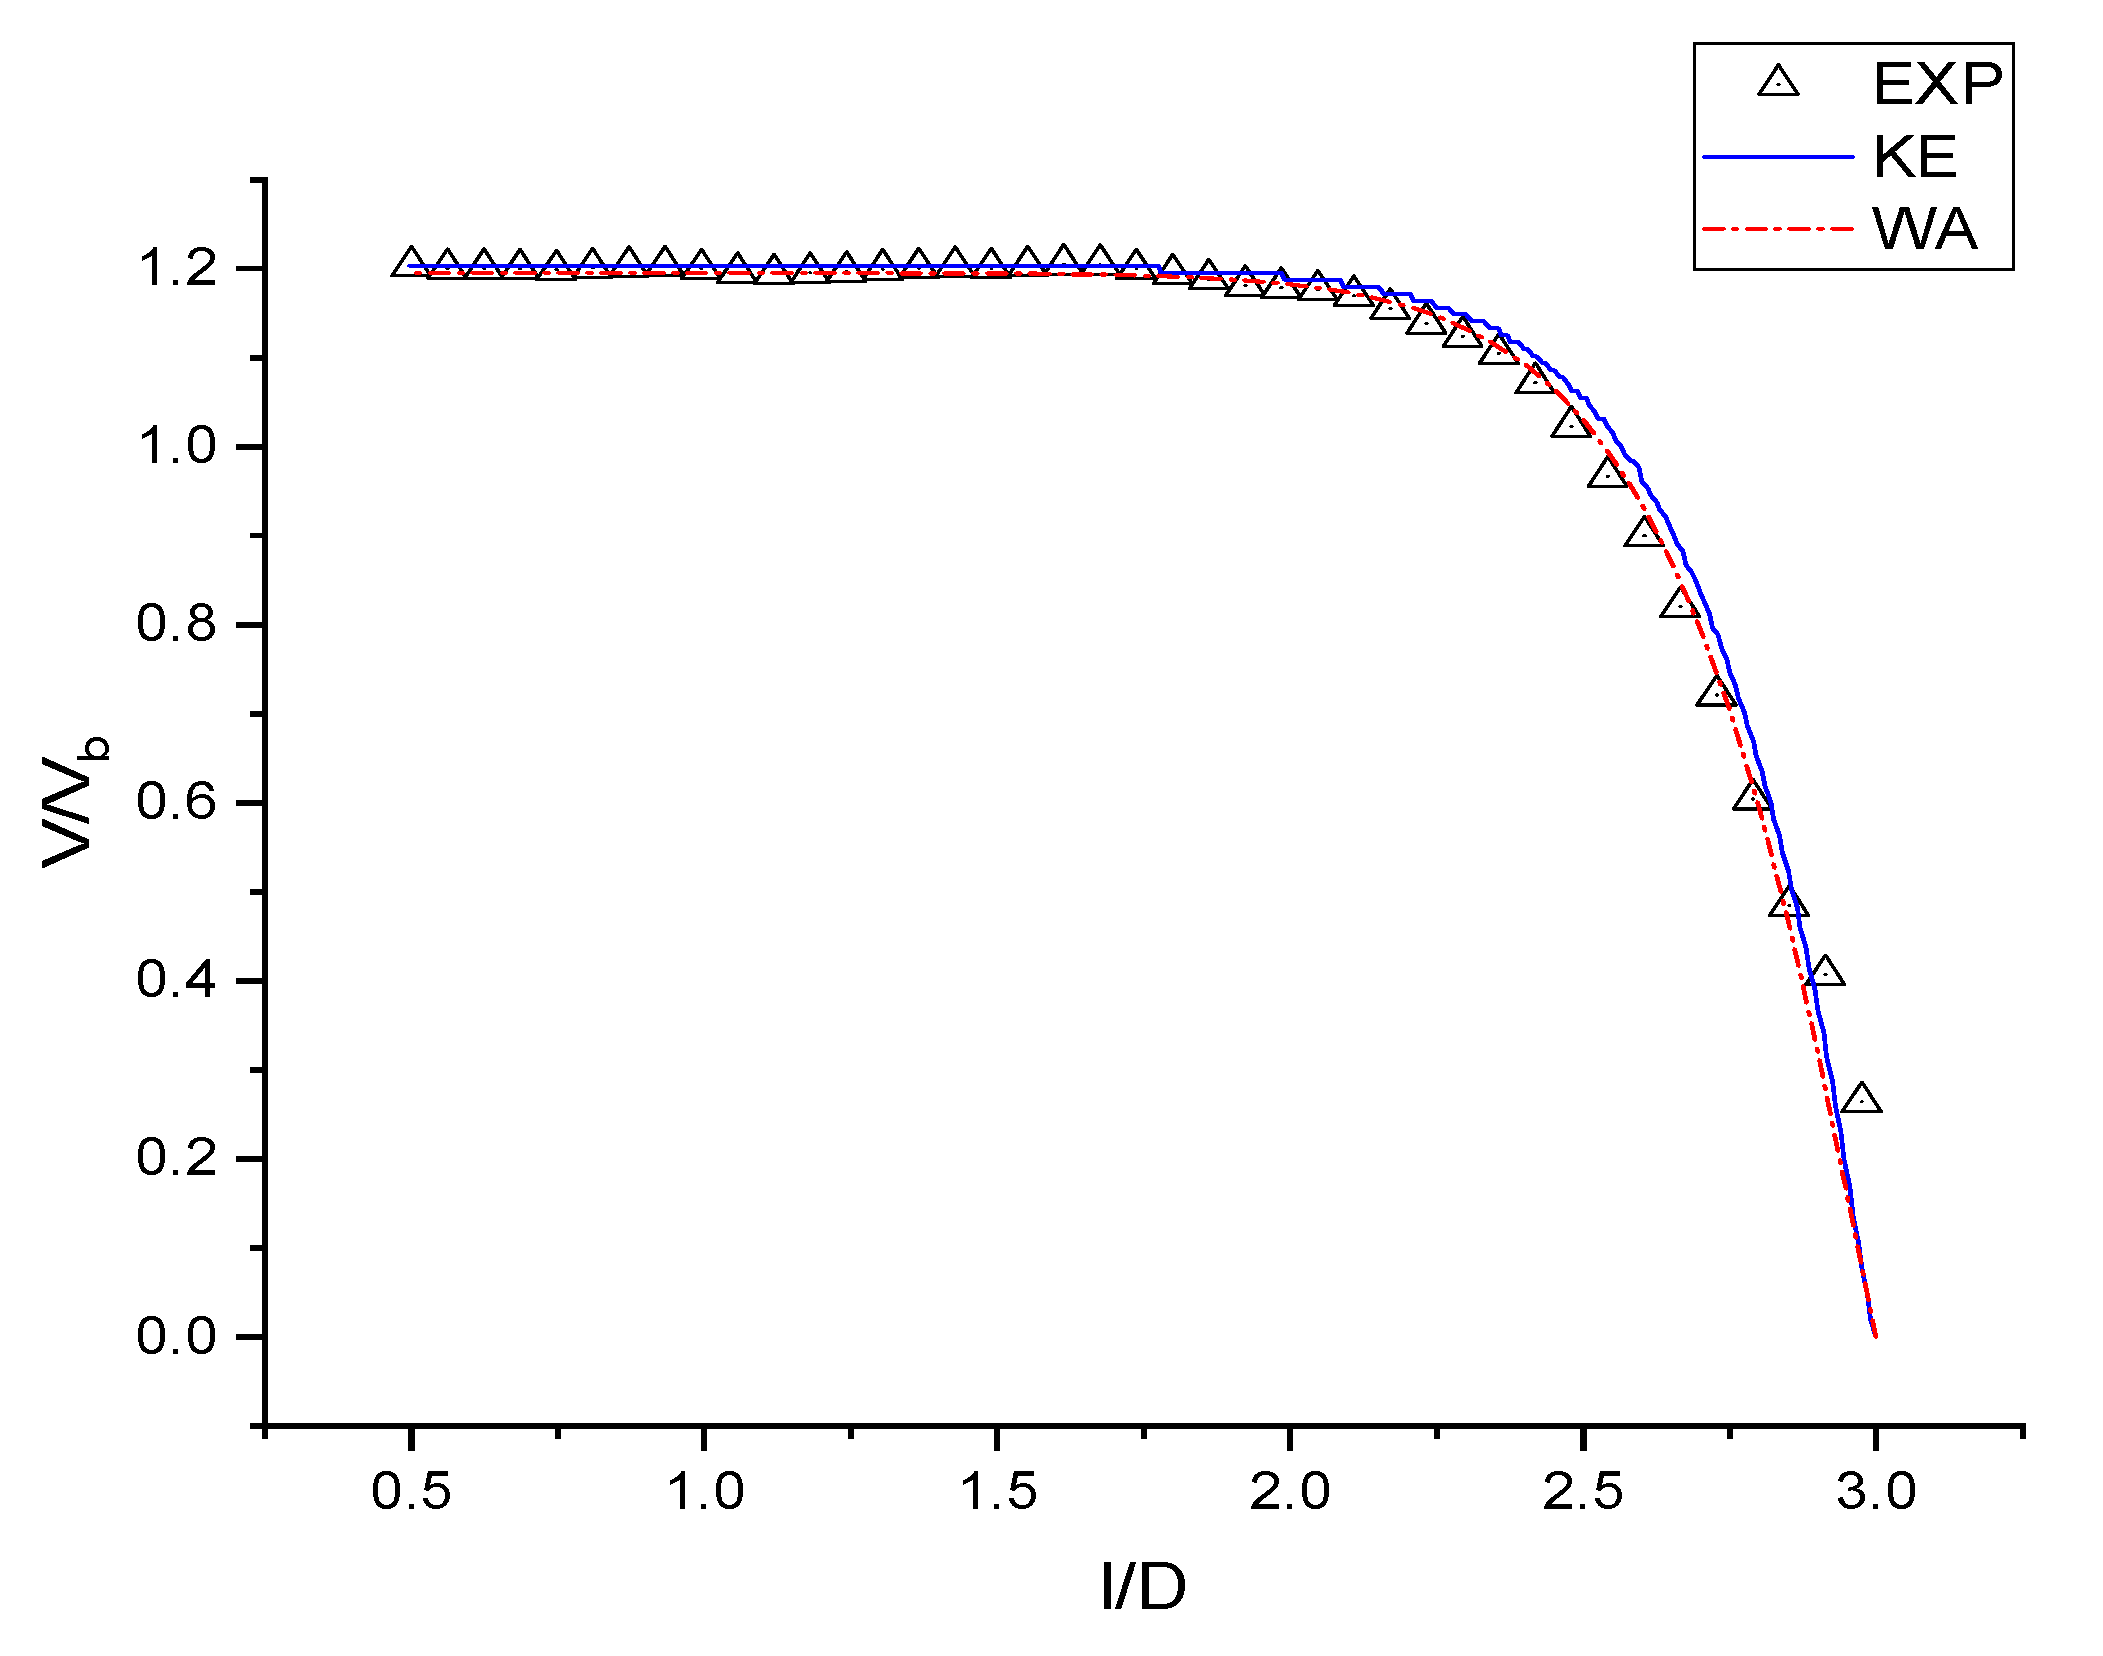
Figure 6 shows the normalized velocity along the centerline of the jet from jet exit to impingement plane when impingement angle is 90 degree. The velocity decreases significantly after l/D = 2.5, where the flow transitions from free jet region to impingement region. CFD results from both k-ε and WA turbulence model, show excellent agreement with experiment results.
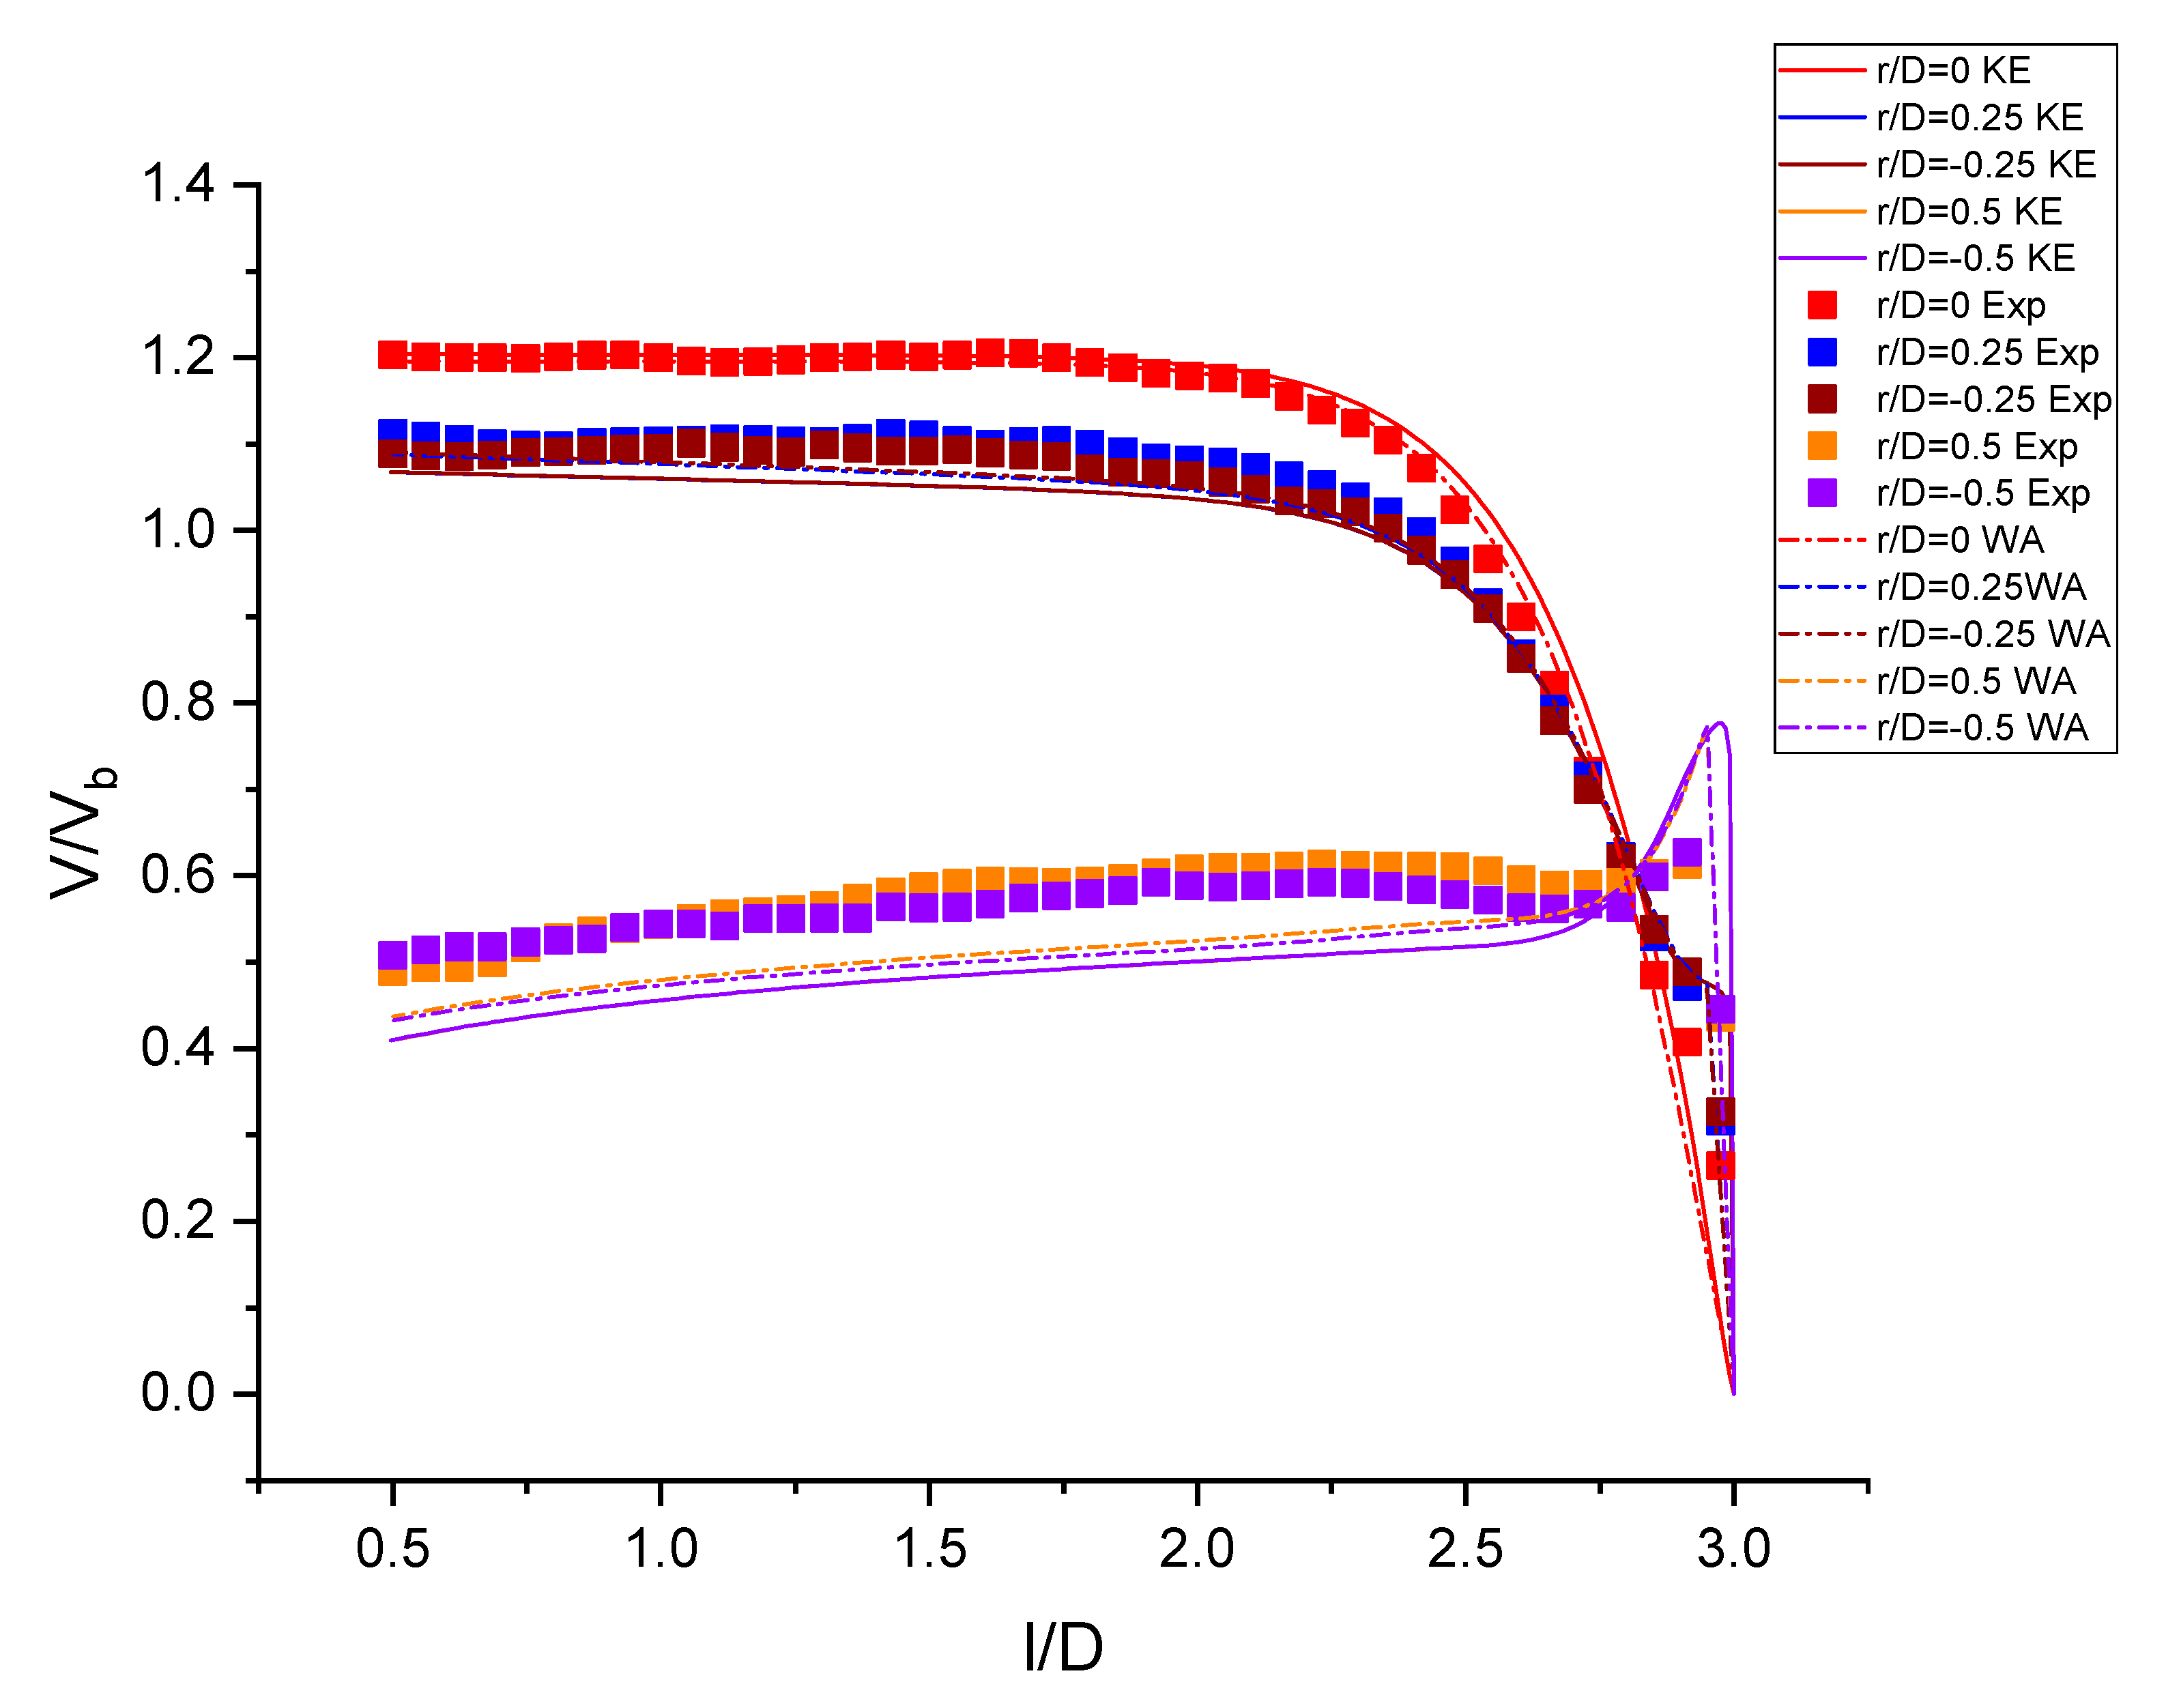
Figure 7 shows the normalized velocity profiles along the centerline of the jet at different locations parallel to the centerline. The peak velocity occurs where r/D is +/− 0.5 at l/D = 2.91 when v/vb reaches 0.62 approximately. The agreement between the CFD using both k-ε and WA model, and experimental results, is overall very good. There is some asymmetry in the experimentally measured velocity profiles. As a result, there are small differences in the CFD results and the experimental results on two sides of the centerline.
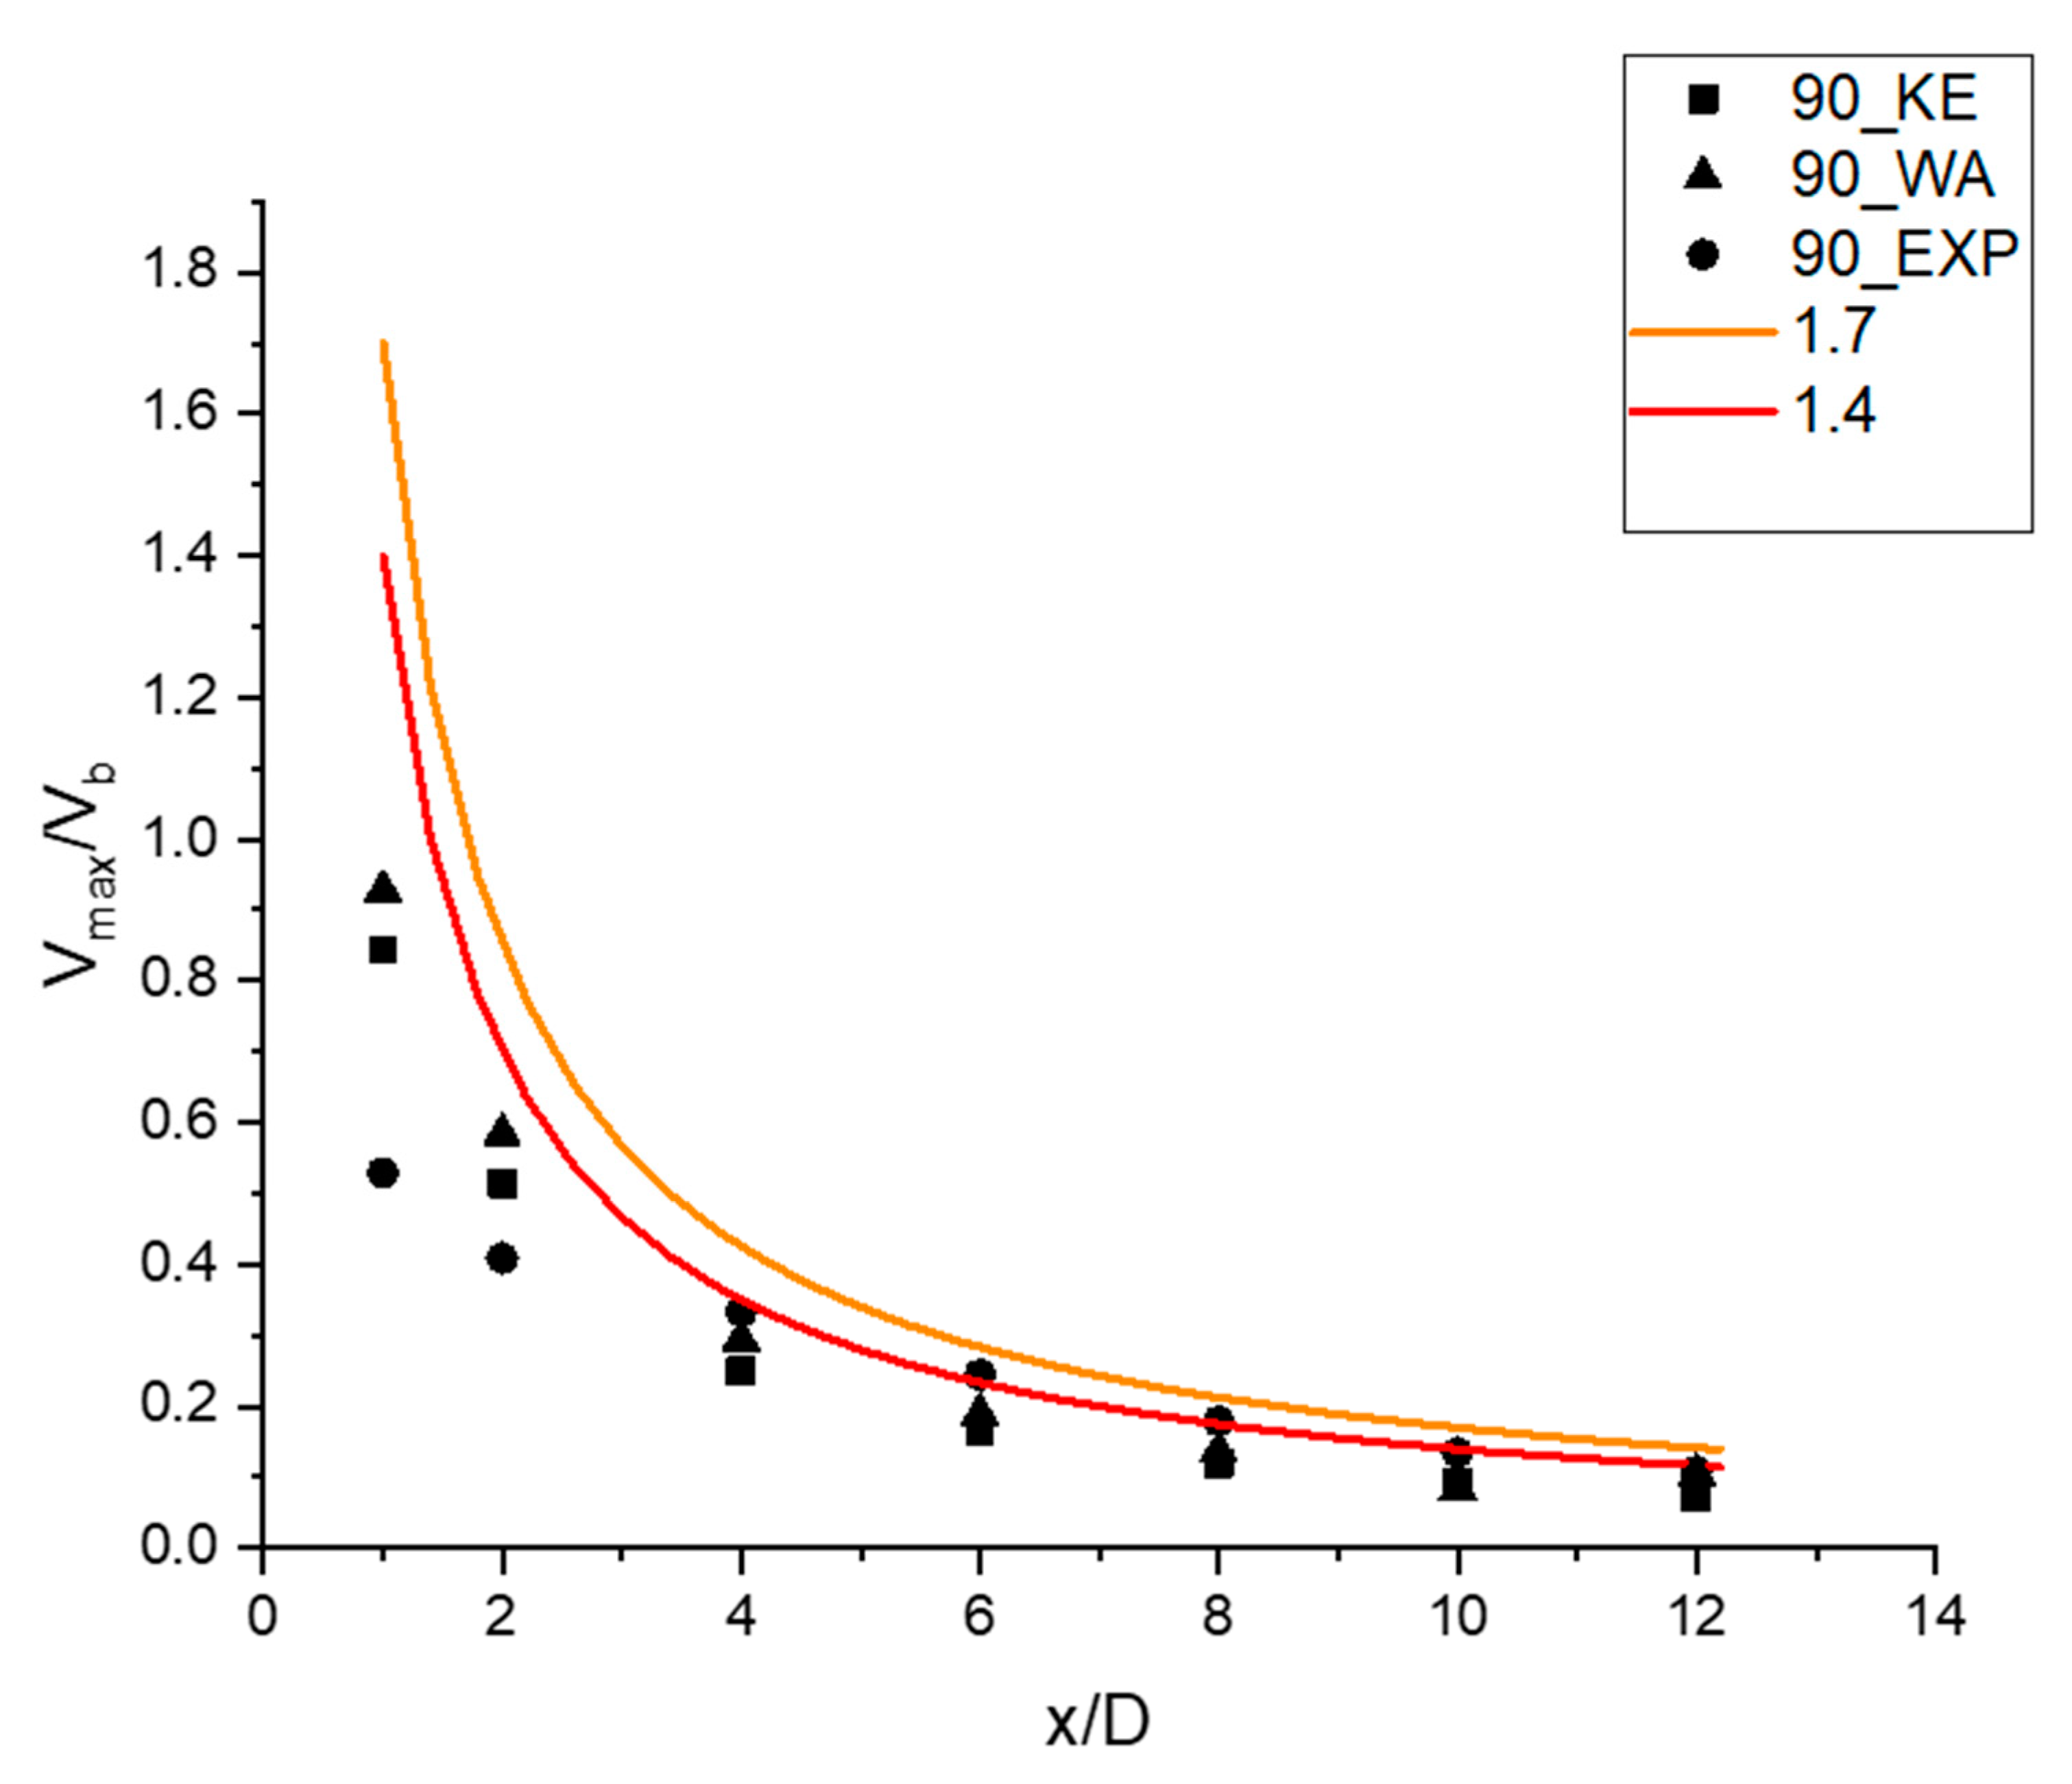
Figure 8 shows the normalized maximum velocity in the wall jet region and a series of velocity ratios for different scaling along x-direction in the wall jet region. It can be seen that CFD results match with experimental data well.
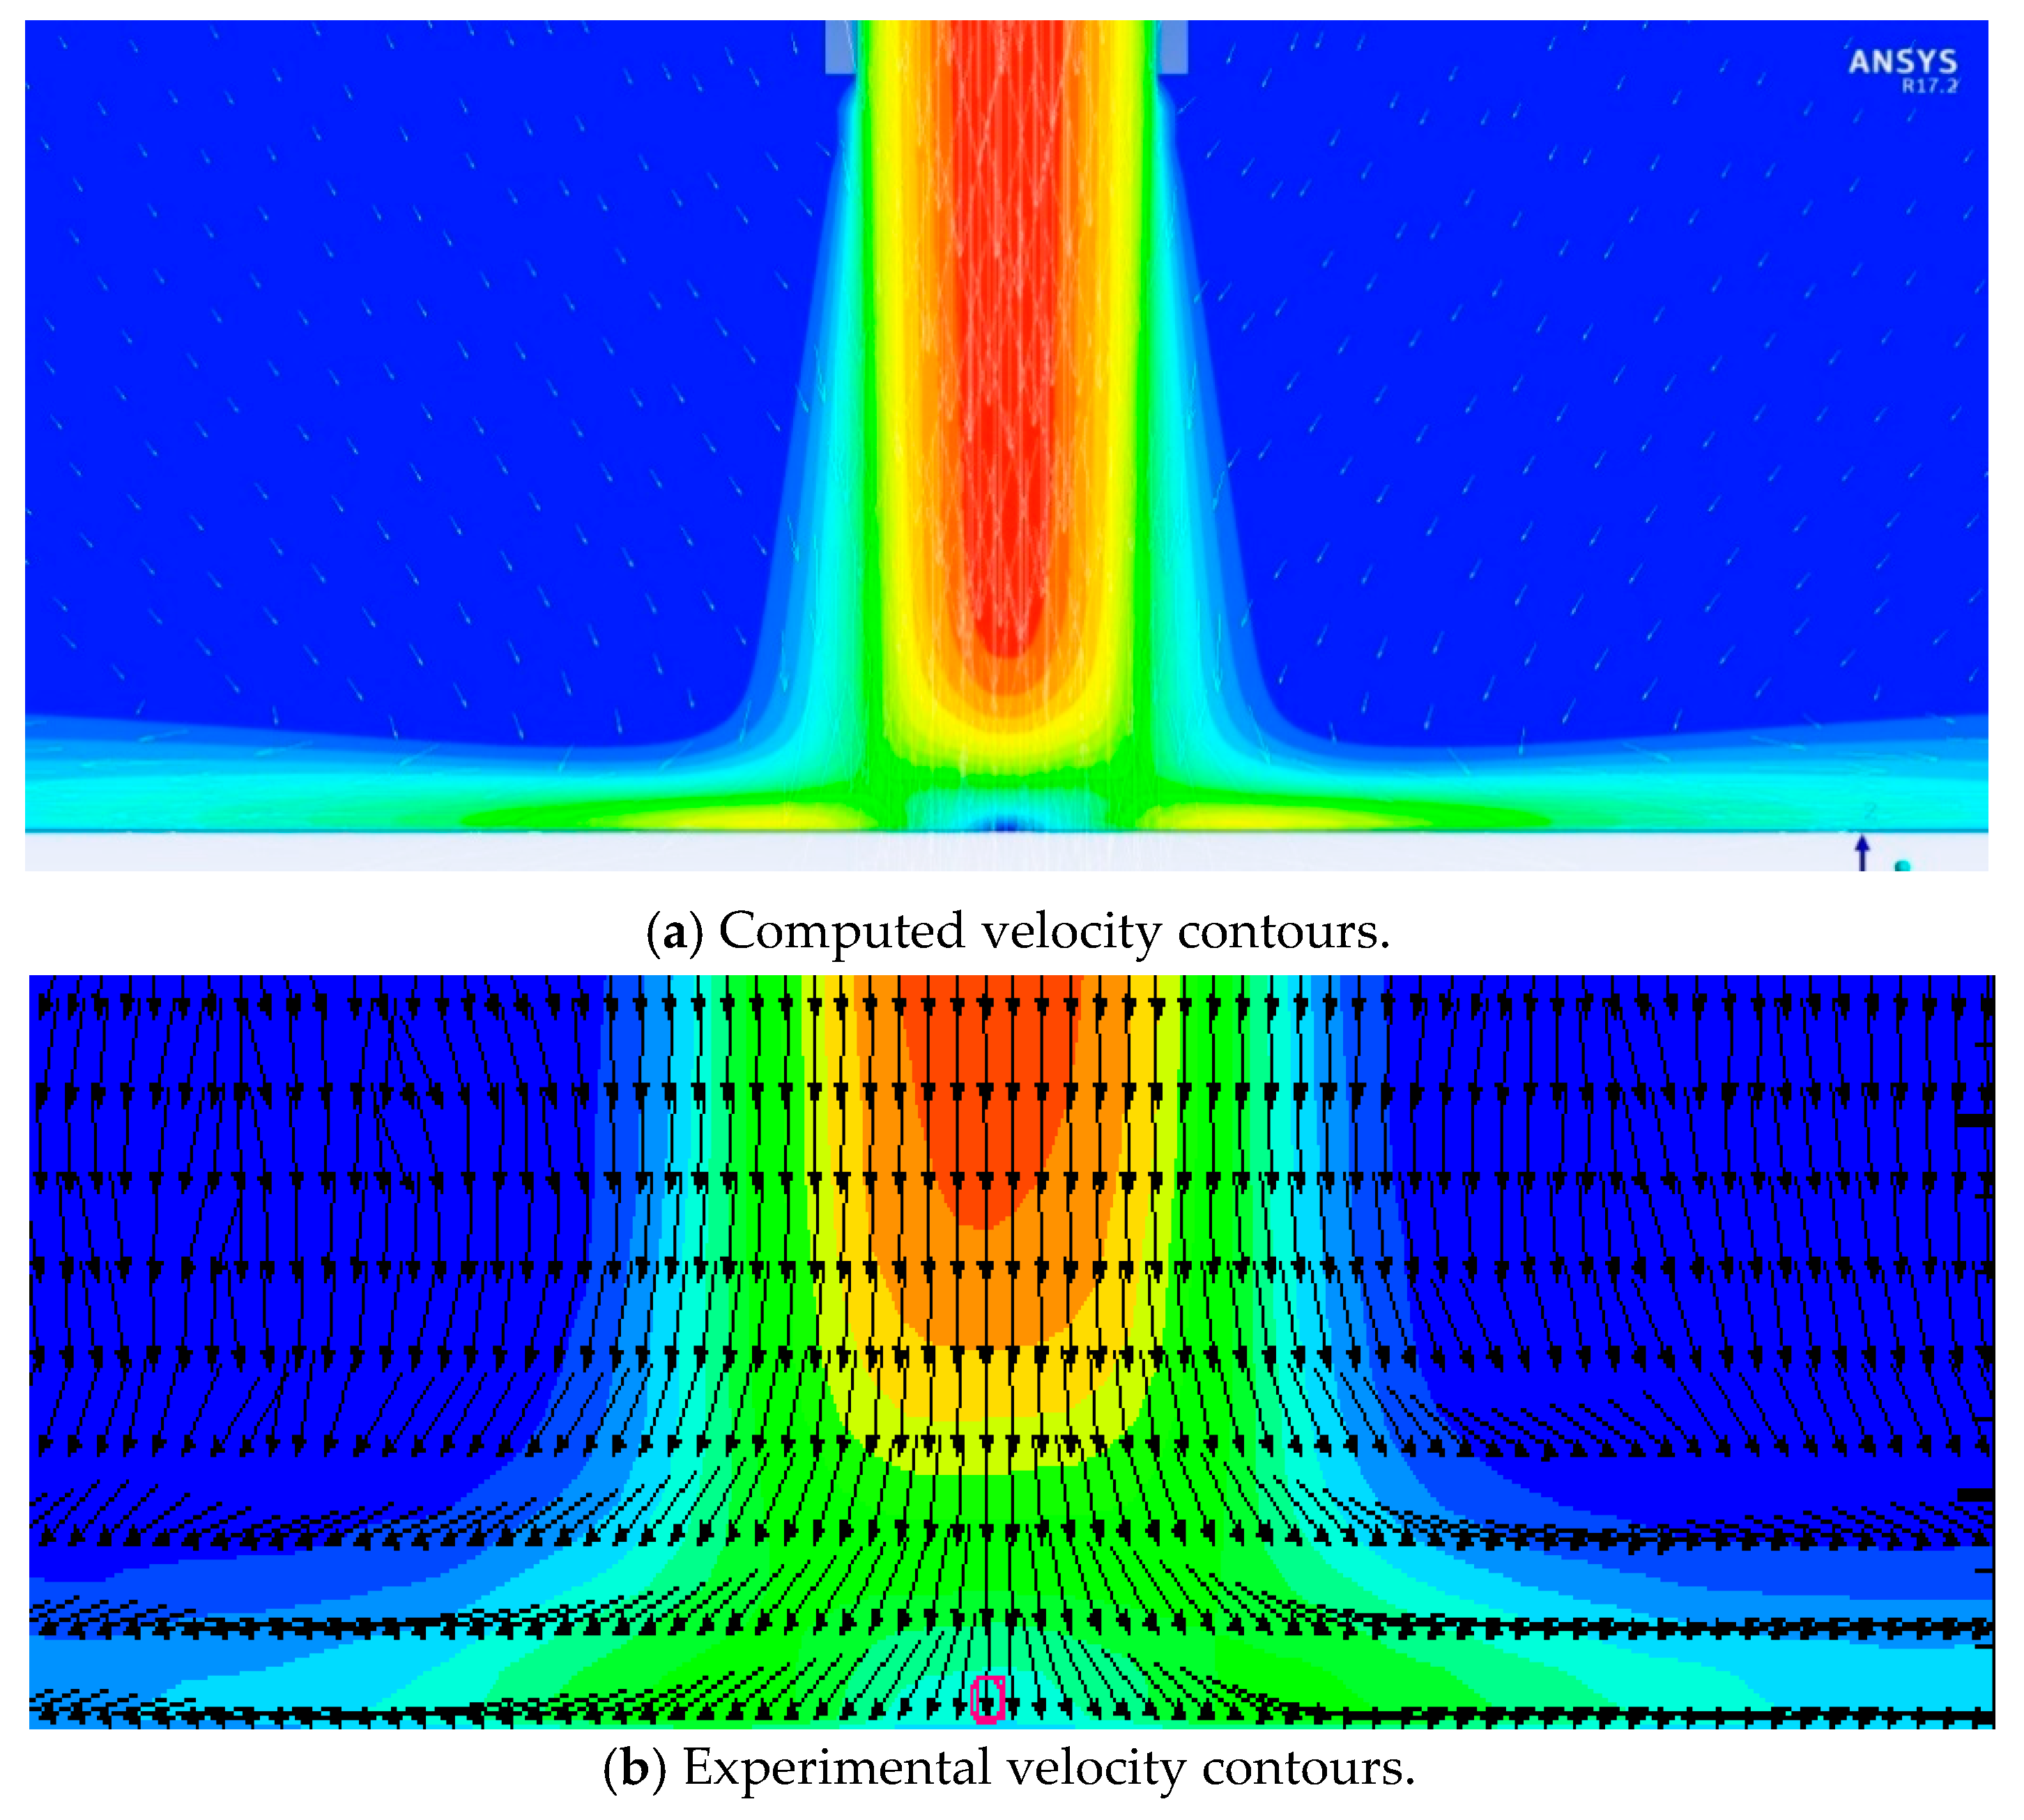
The velocity contours from numerical simulation and experiment are shown in Figure 9. The entrainment of surrounding water due to jet is obvious. The stagnation point is located at the centerline of the jet as expected.
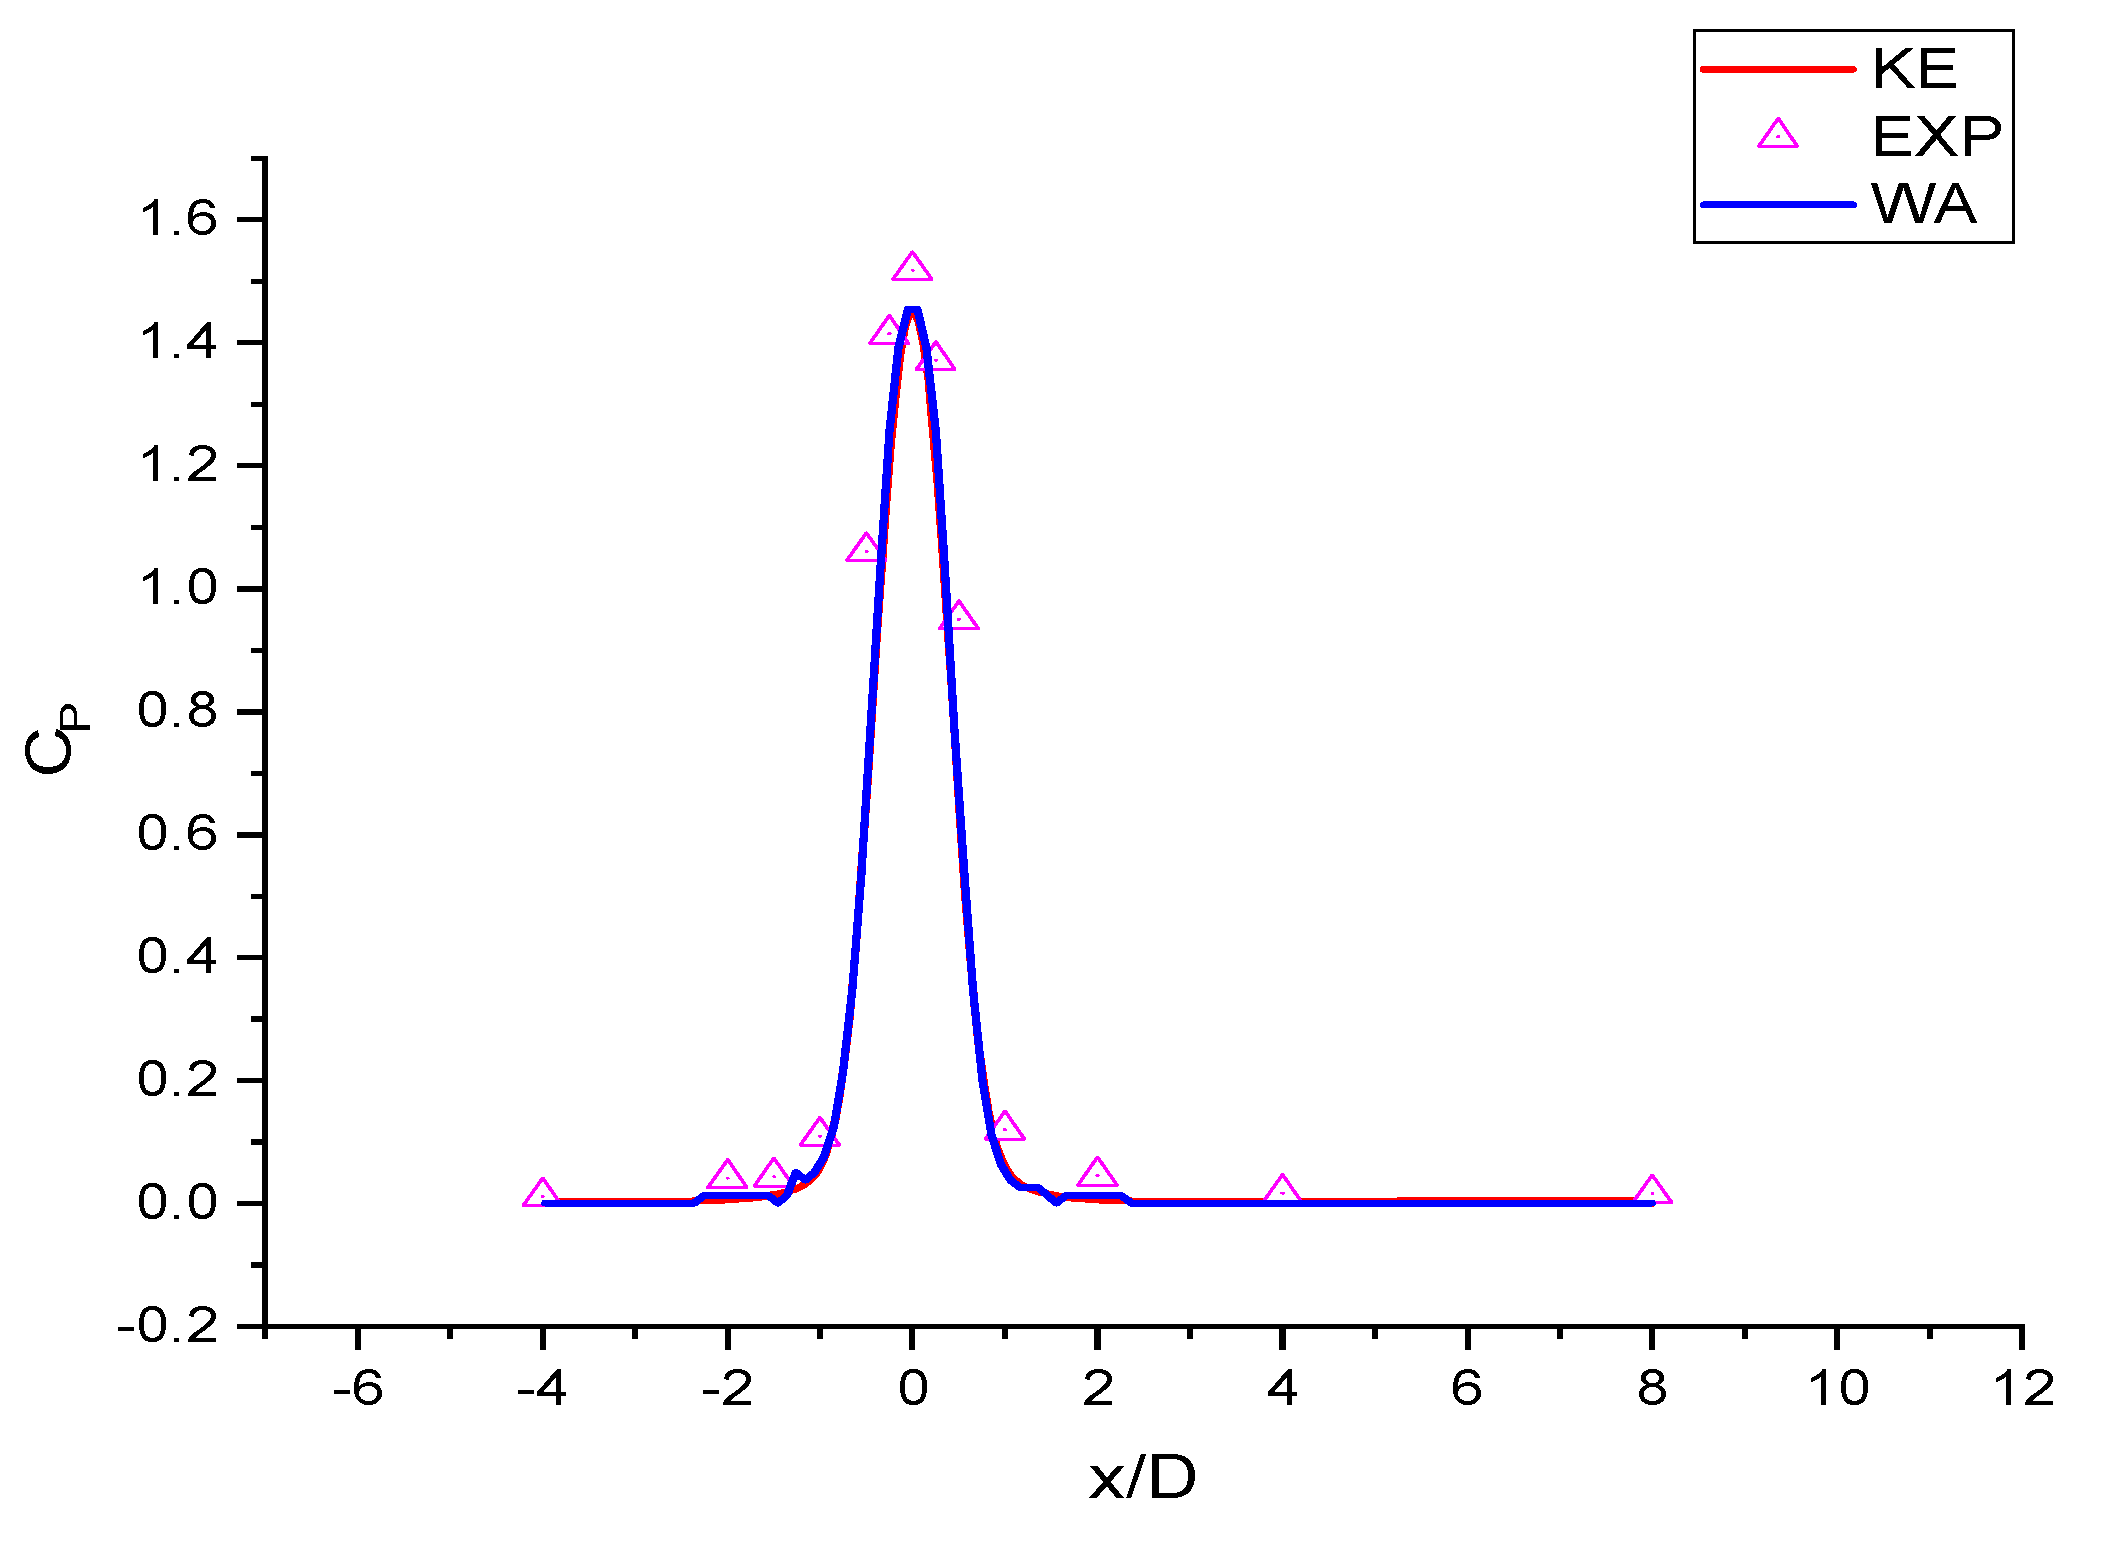
The pressure coefficient in the impingement plane is defined as C p = P P r e f 1 2 ρ V b 2 where P r e f = ρ g H . The small difference between the CFD result and experiment result could be due to a difference in boundary conditions in the experiment and CFD. In the experiment, vb = 1.17 m/s is calculated based on velocity measured near the jet exit. In simulation, the boundary condition at velocity inlet was set at 1.17 m/s. Due to viscosity of the fluid, velocity at the pipe surface is zero. The velocity of the jet at centerline gets larger and velocity distribution becomes more uneven as fluid flows through the pipe due to gravity. Figure 10 shows the pressure coefficient at different impingement angles. Results from both k-ε and WA models show good agreement at 90 degree impingement angle.
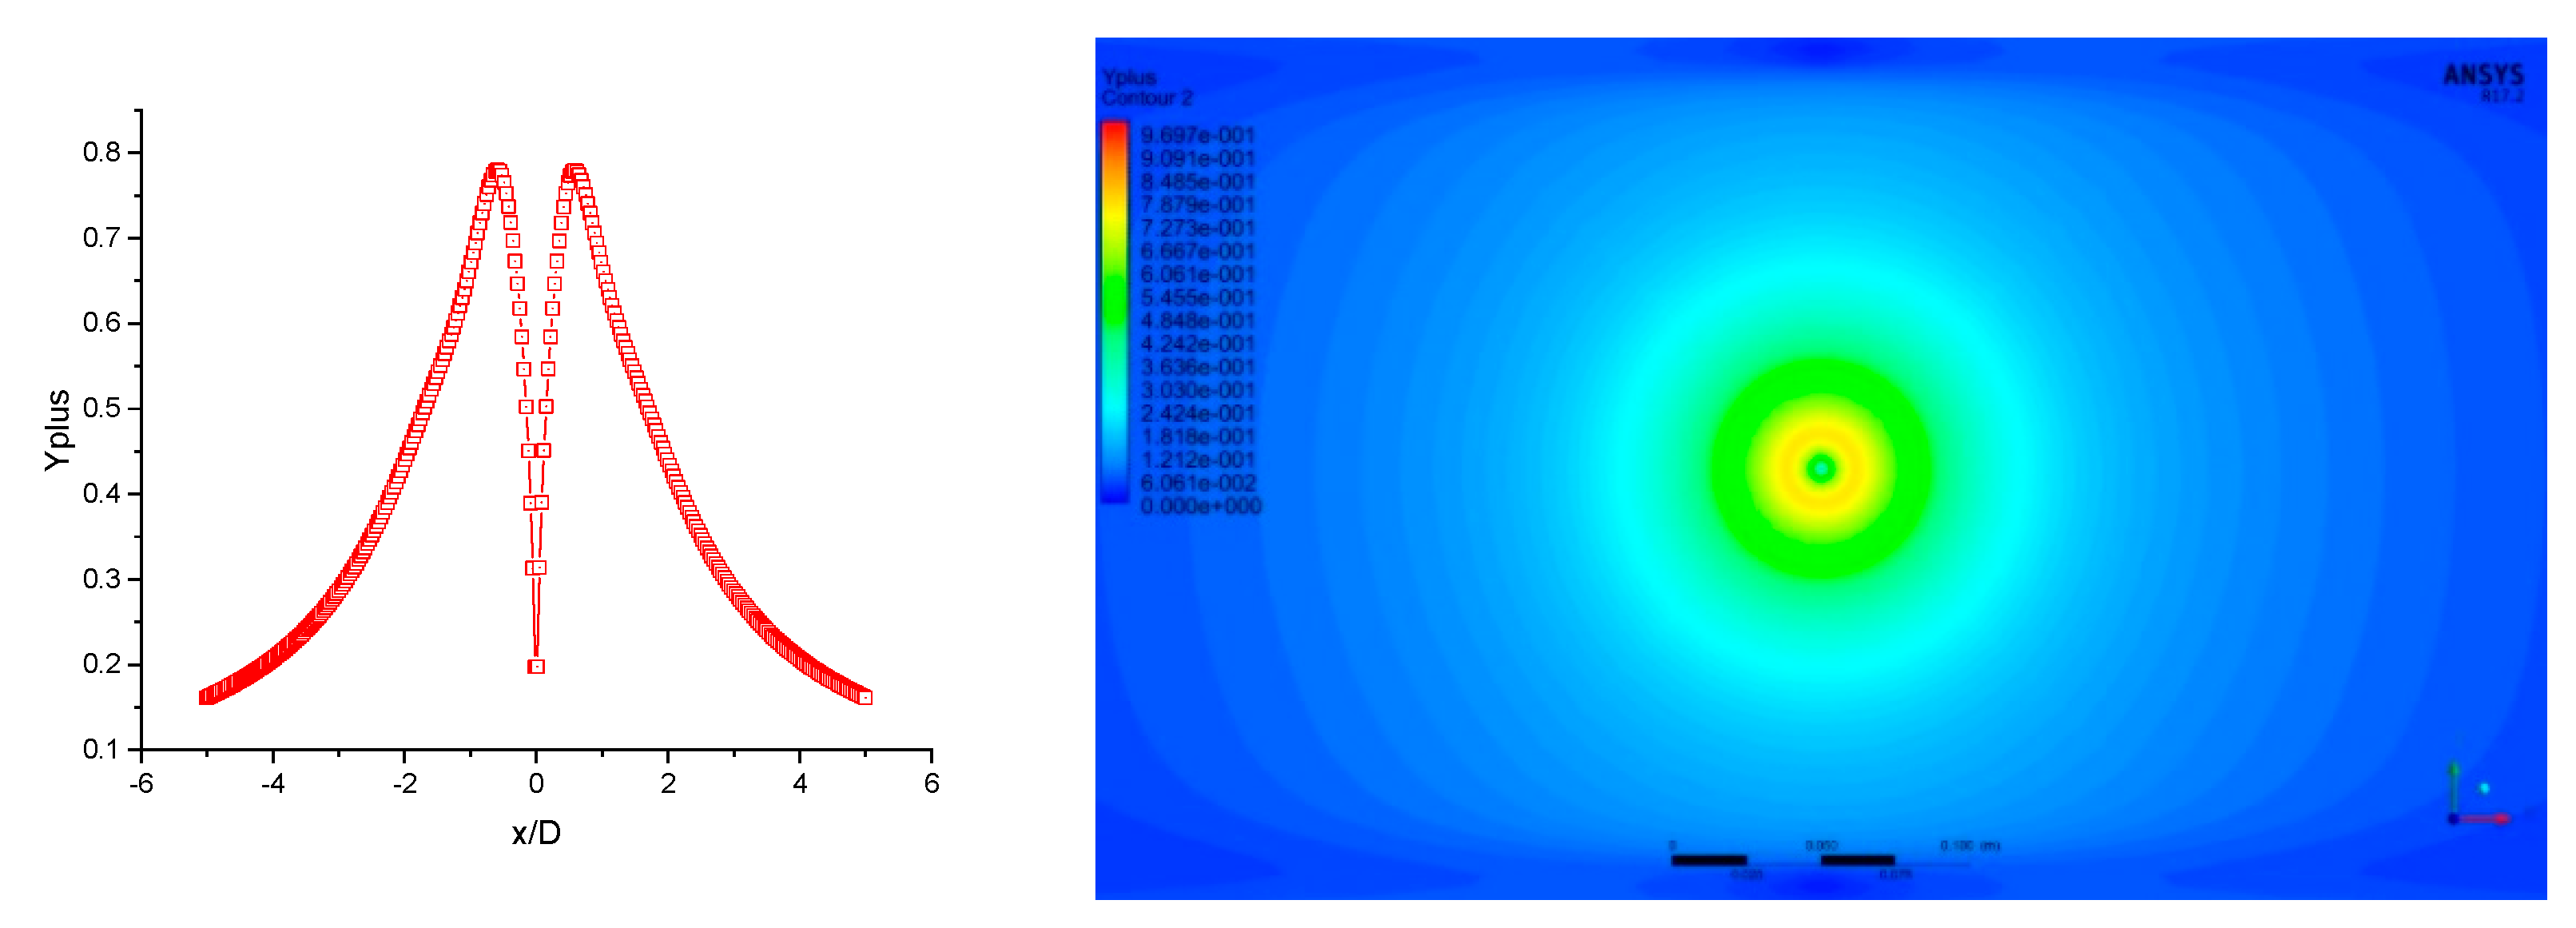
It can be noted from Figure 11 that y+ near the impingement region on the plate is less than 1, attesting to the proper implementation of CFD methodology in ANSYS Fluent.

3. Results and Discussion

3.1. Flow Conditions to Form a Straight Fountain

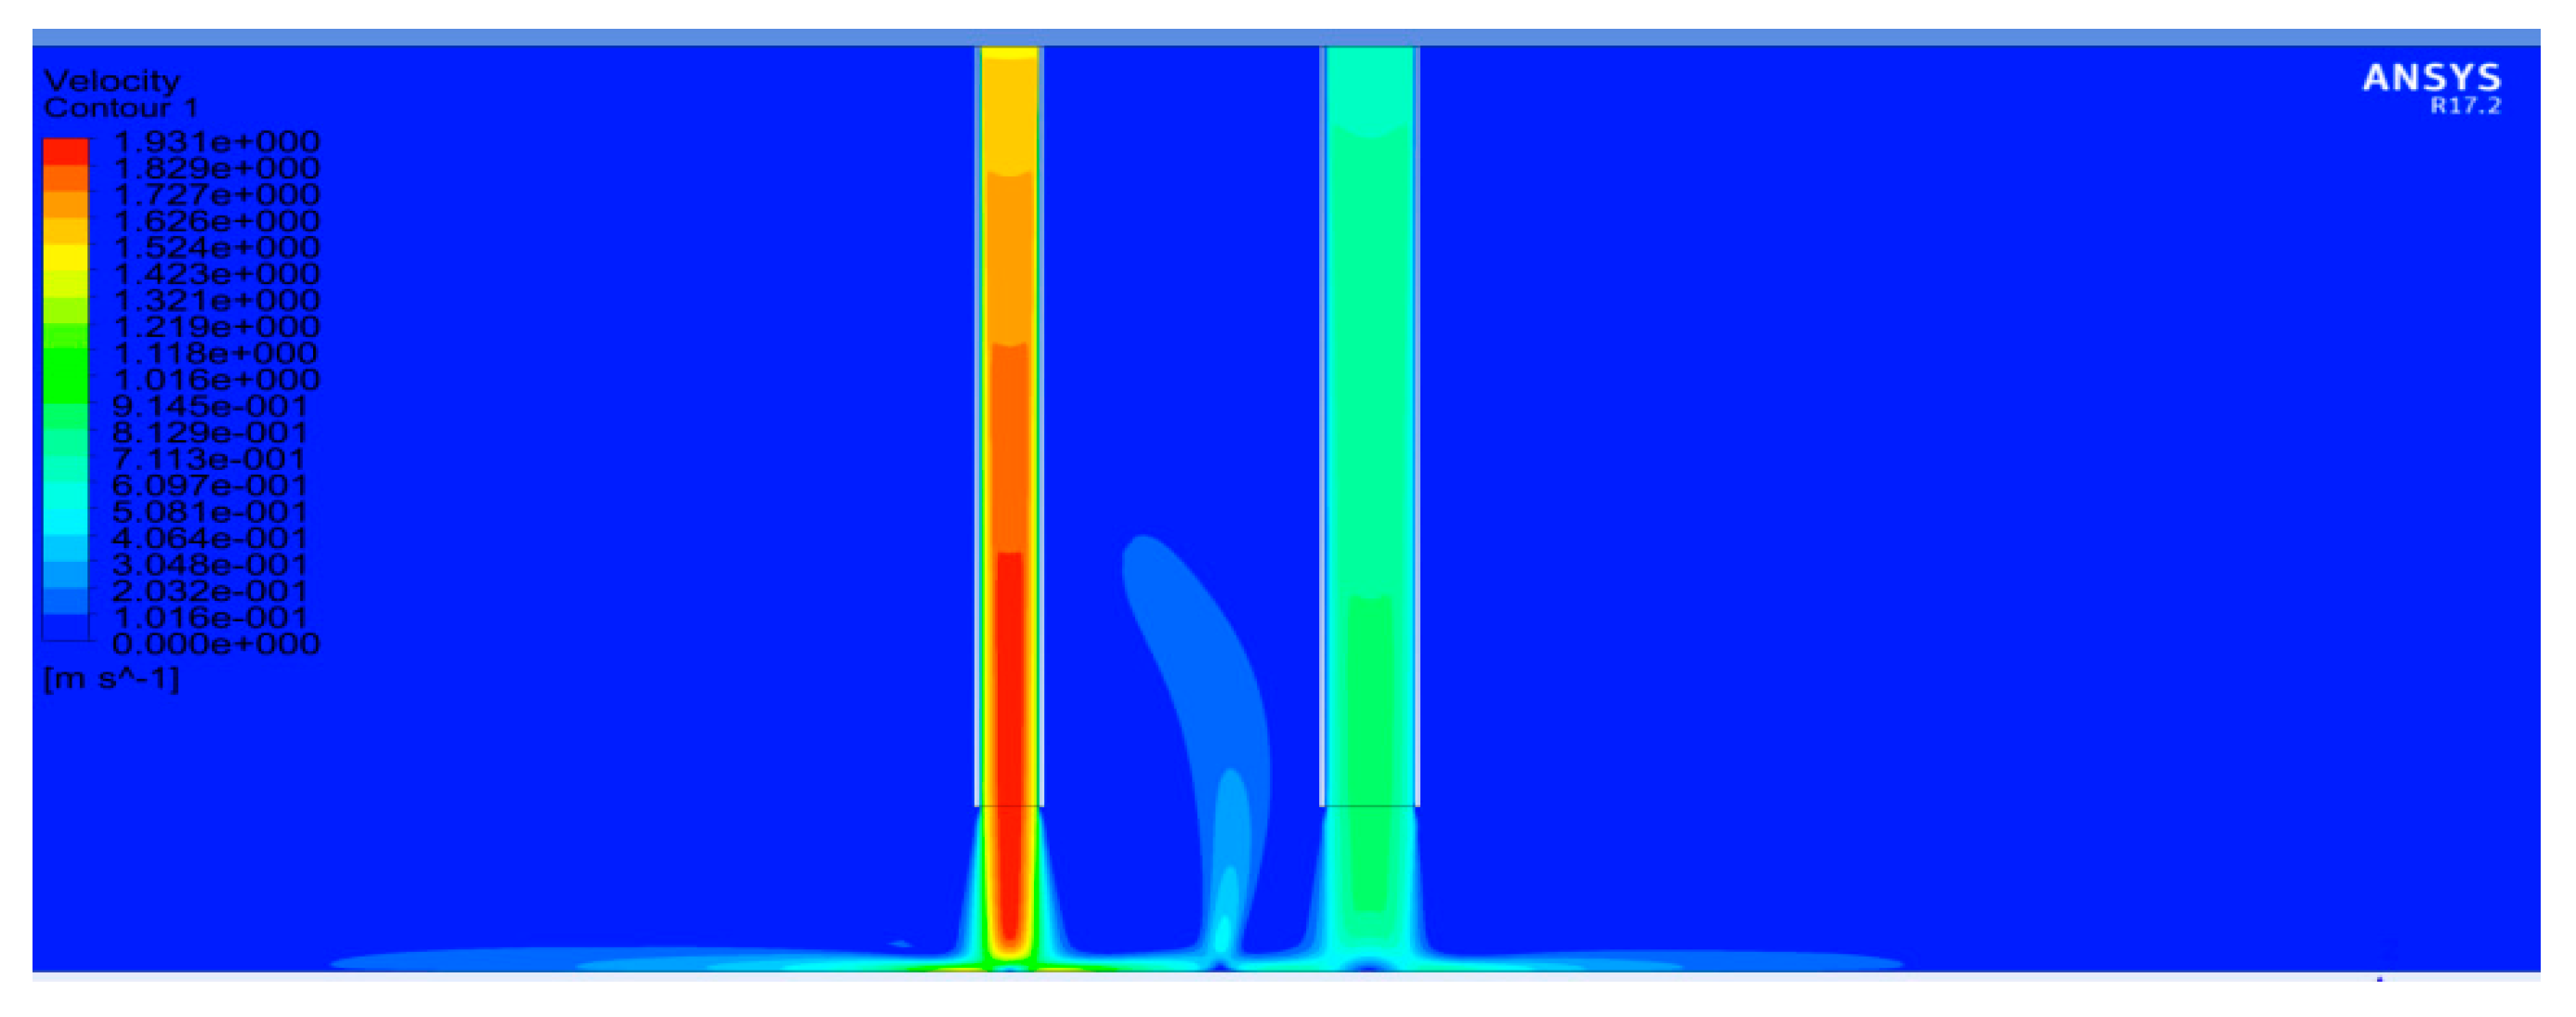
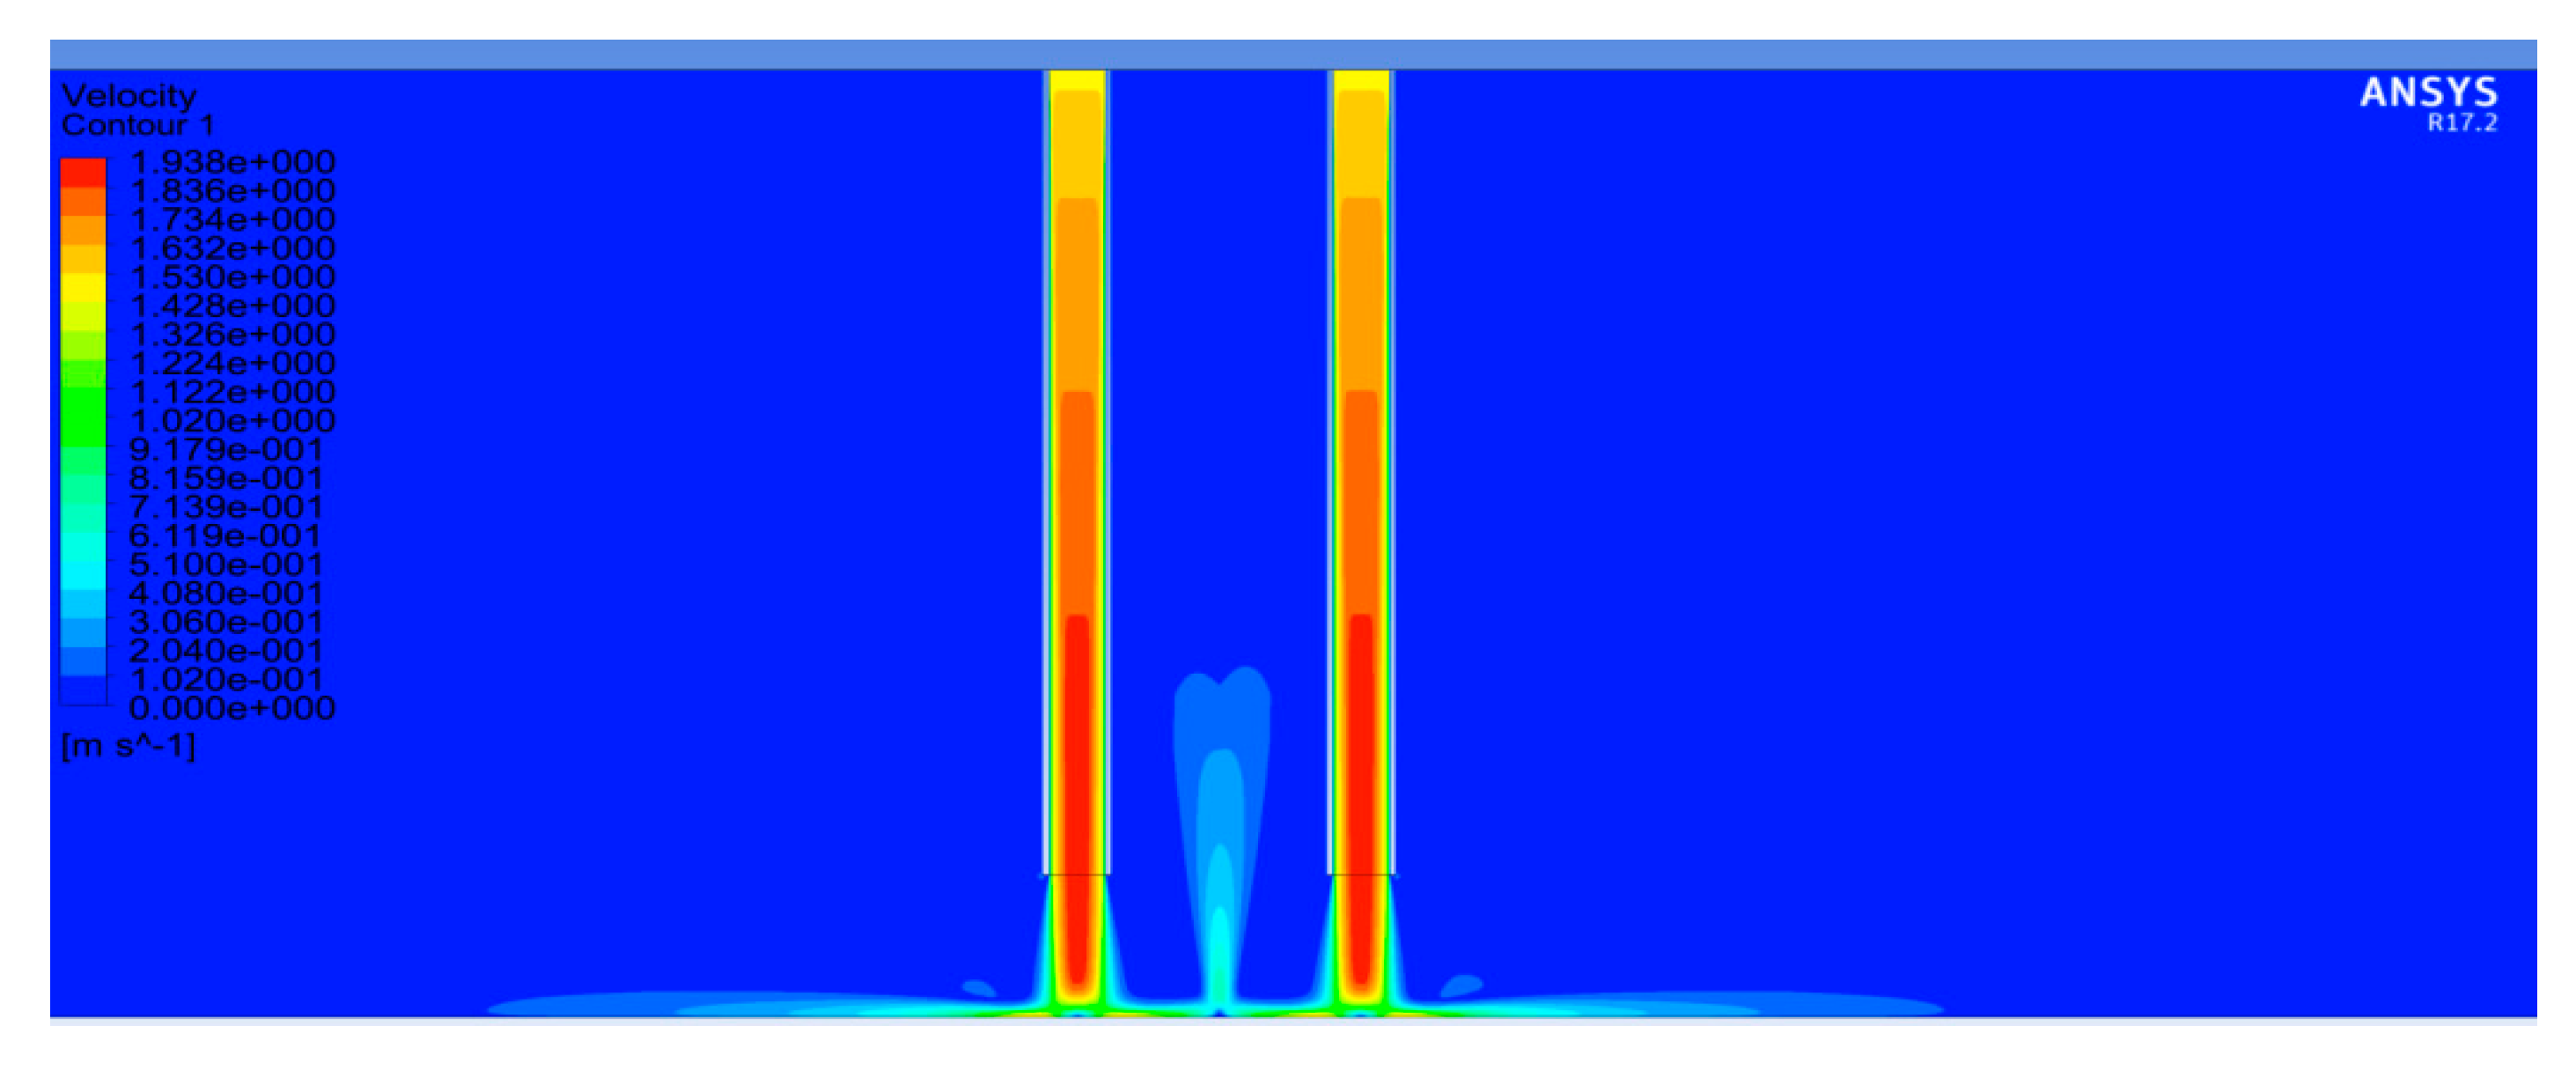
When the wall jets produced by jet impingement are of identical strength, they can produce a fountain normal to impingement surface. Therefore, it is critical to find the parameters that form a normal fountain. In this section, the fountain formation is considered by jets of different diameters: D 1 = 0.02   m   and   D 2 = 0.03   m . To determine the factors that influence the character of the fountain, three cases are conducted. Two cases have twin-jet with different diameters (   D 1 = 0.02   m ,   D 2 = 0.03   m ) , in which the difference is that in the first case, twin-jets are controlled to have identical mass flow rate while in the second case twin-jets are controlled to have identical Reynolds number. The third case is performed under the condition that D 1 = D 2 = 0.02   m   and   V 1 = V 2 = 1.5   m / s . In all three cases, inlet velocity of the left jet is fixed at V 1 = 1.5   m / s , distance between the two jets is fixed such that S/D = 5 where D = D 1 * D 2 . Figure 12, Figure 13 and Figure 14 show the velocity contours of the fountain in the three cases. It can be easily observed from Figure 12 that when the mass flow rates of two jets of different diameters are the same, the fountain has asymmetry inclining toward the jet of larger diameter; however, when the Reynolds numbers of the two jets of different diameter are the same, the fountain formed is straight upward as shown in Figure 13, like the reference case when the diameters and velocities of the two jets are the same as shown in Figure 14. The difference between Figure 13 and Figure 14 could be due to minor differences in the physical model. Diameter of jet D, which is used to create the physical model, is D = D 1 * D 2   ( D 1 = 0.02   m , D 2 = 0.03   m ) in Figure 12 and Figure 13, which is larger than D = D 1 * D 2   ( D 1 = D 2 = 0.02   m ) in Figure 14. This leads to larger impingement height as well as larger distance between the two jets, which can decrease the strength of fountain when Reynolds number is identical for both cases.

3.2. Straight Up-Wash Fountain

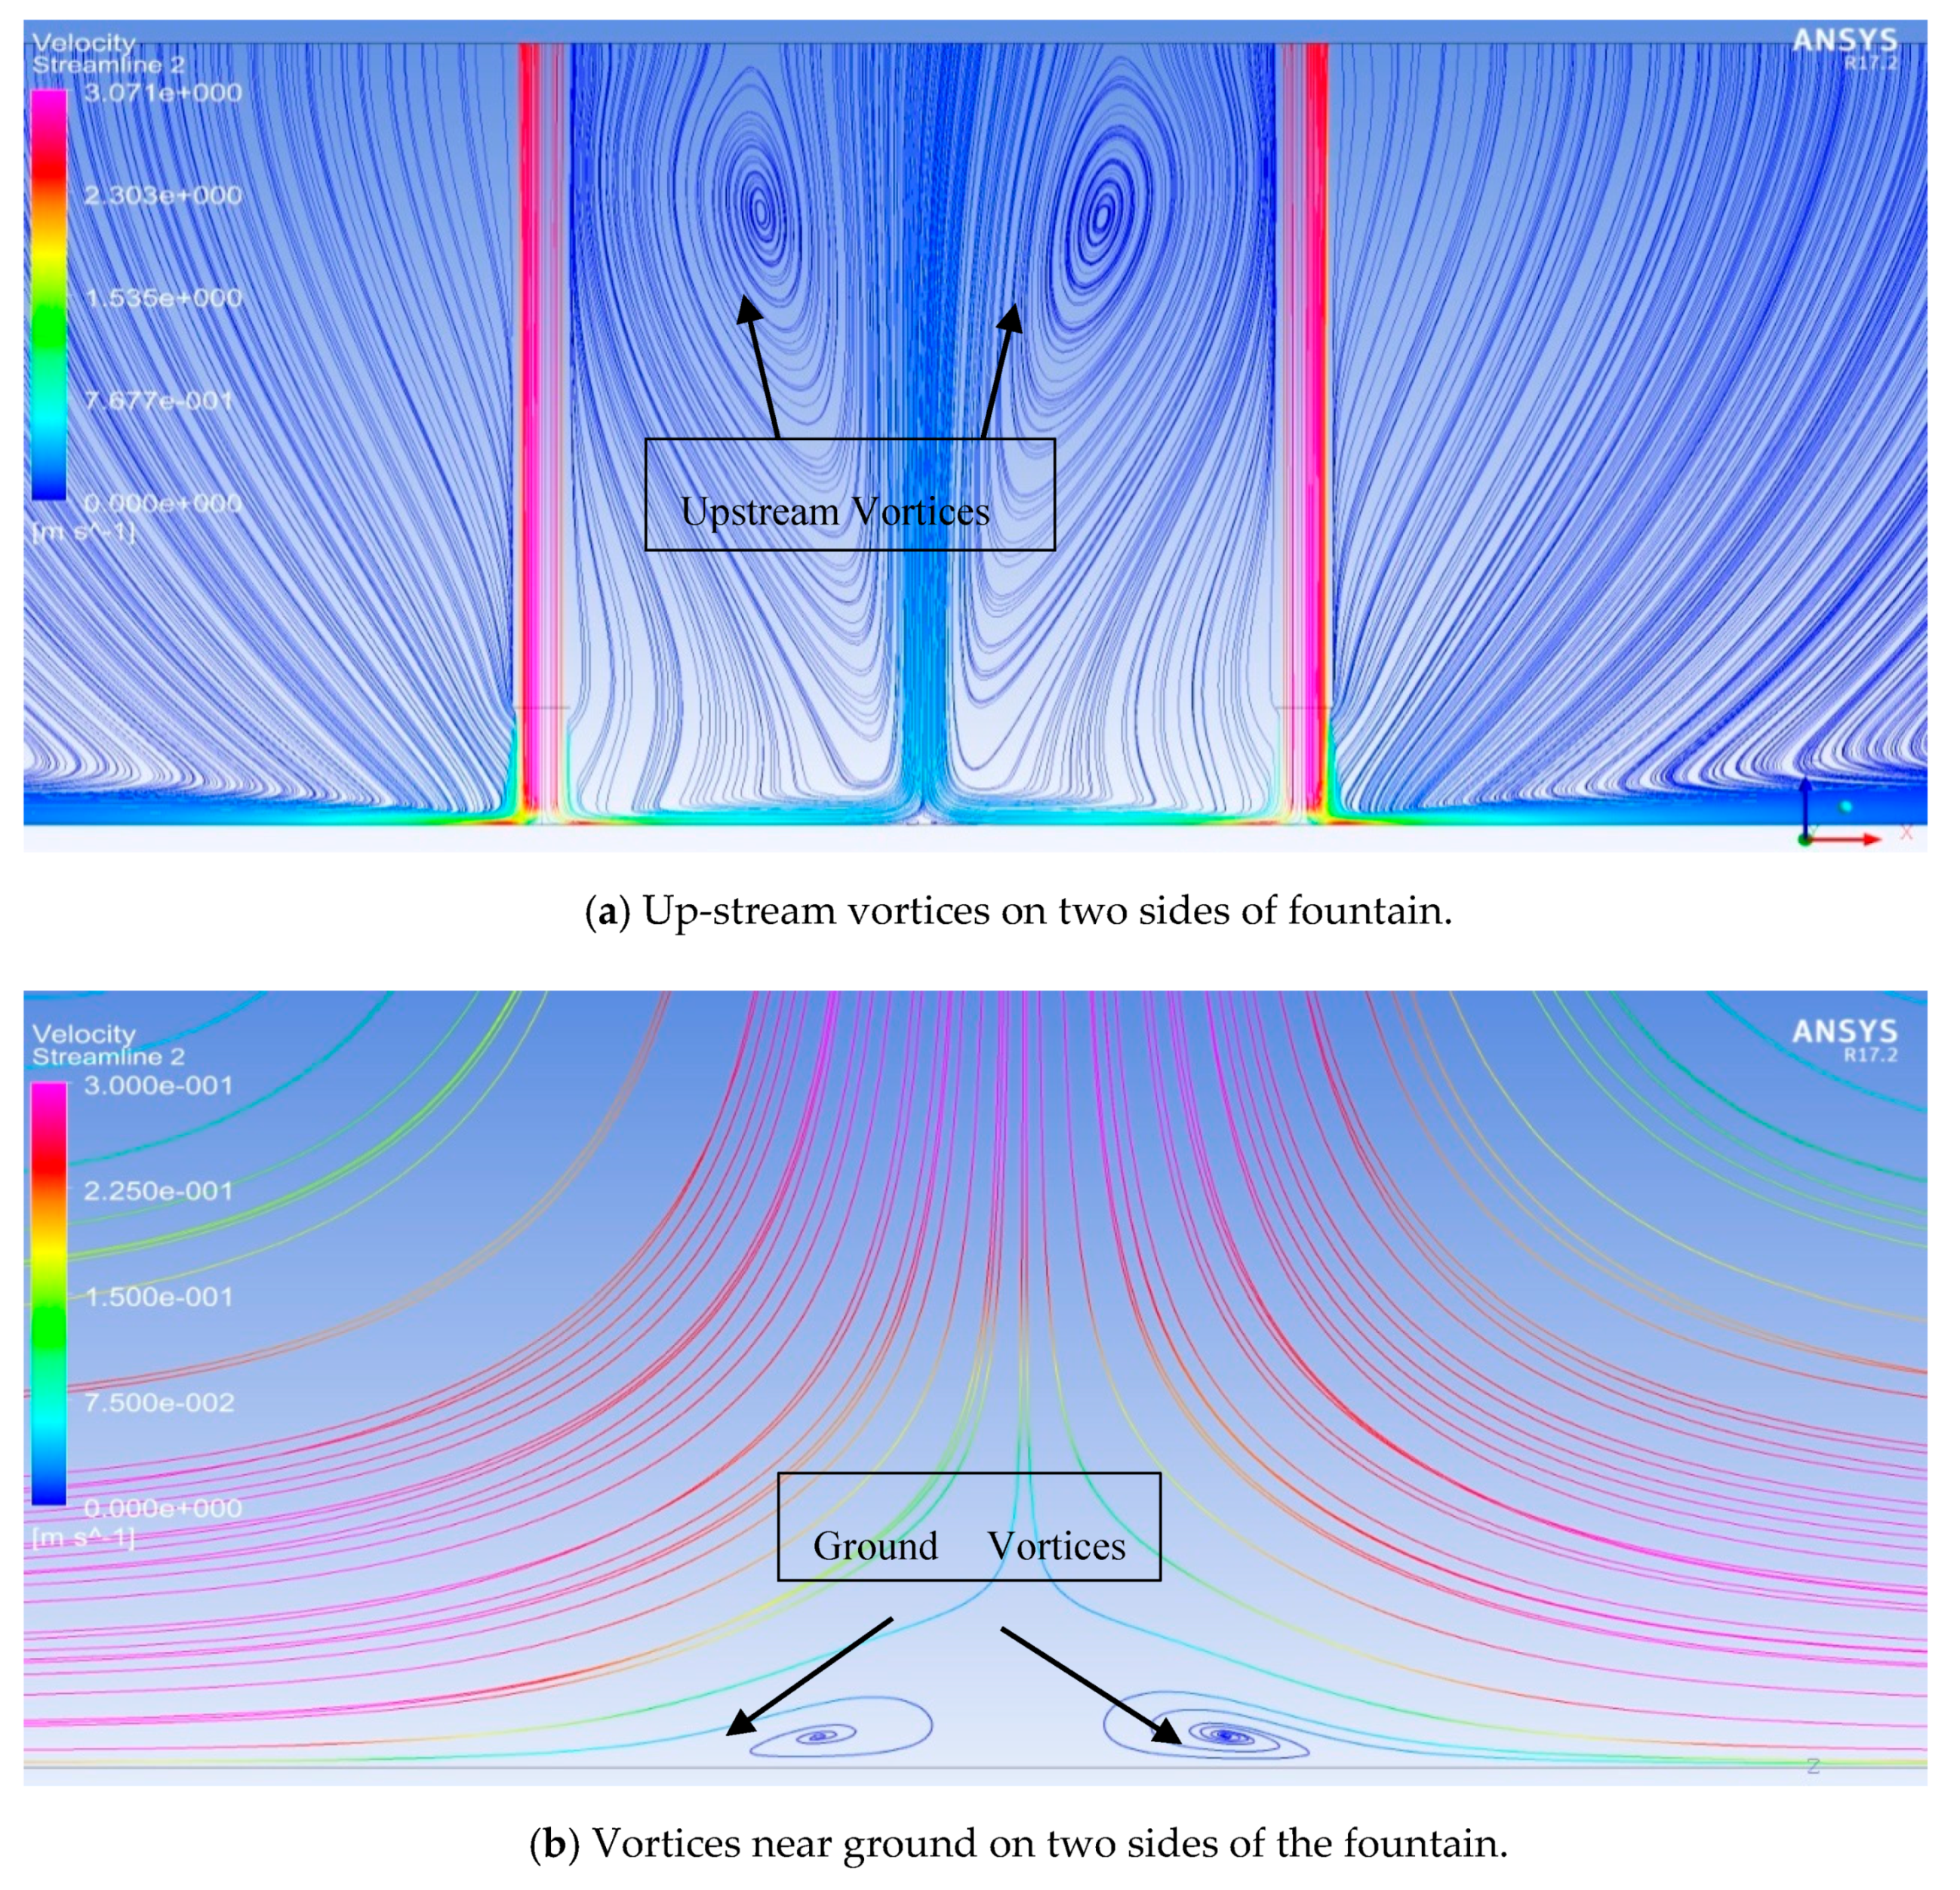
Figure 15 shows the velocity streamlines in a fountain formed by two jets where S/D = 16, H/D = 3 and V1 = V2 = 2.5 m/s. In the region away from the bottom plane, two upstream vortices are formed on two sides of the fountain as shown in Figure 15a. In the region close to the bottom plane, two ground vortices are formed on two sides of the fountain as shown in Figure 15b. Although an up-wash fountain is formed in the middle of two jets, the flow is down-wash in the region very close to ground.
For the same simulation, Figure 16a,b shows the velocity distribution at different radial distances from the centerline of the fountain, ranging from 0D to 4D. The velocity distributions show different characteristics before and after x/D = 0.5. Velocity increases at a smaller rate when x/D is less than 0.5 compared to when it is larger than 0.5. Peak velocity decreases as x/D increases when x/D is less than 0.5; on the other hand, if x/D is larger than 0.5, peak velocity increases as x/D becomes larger.
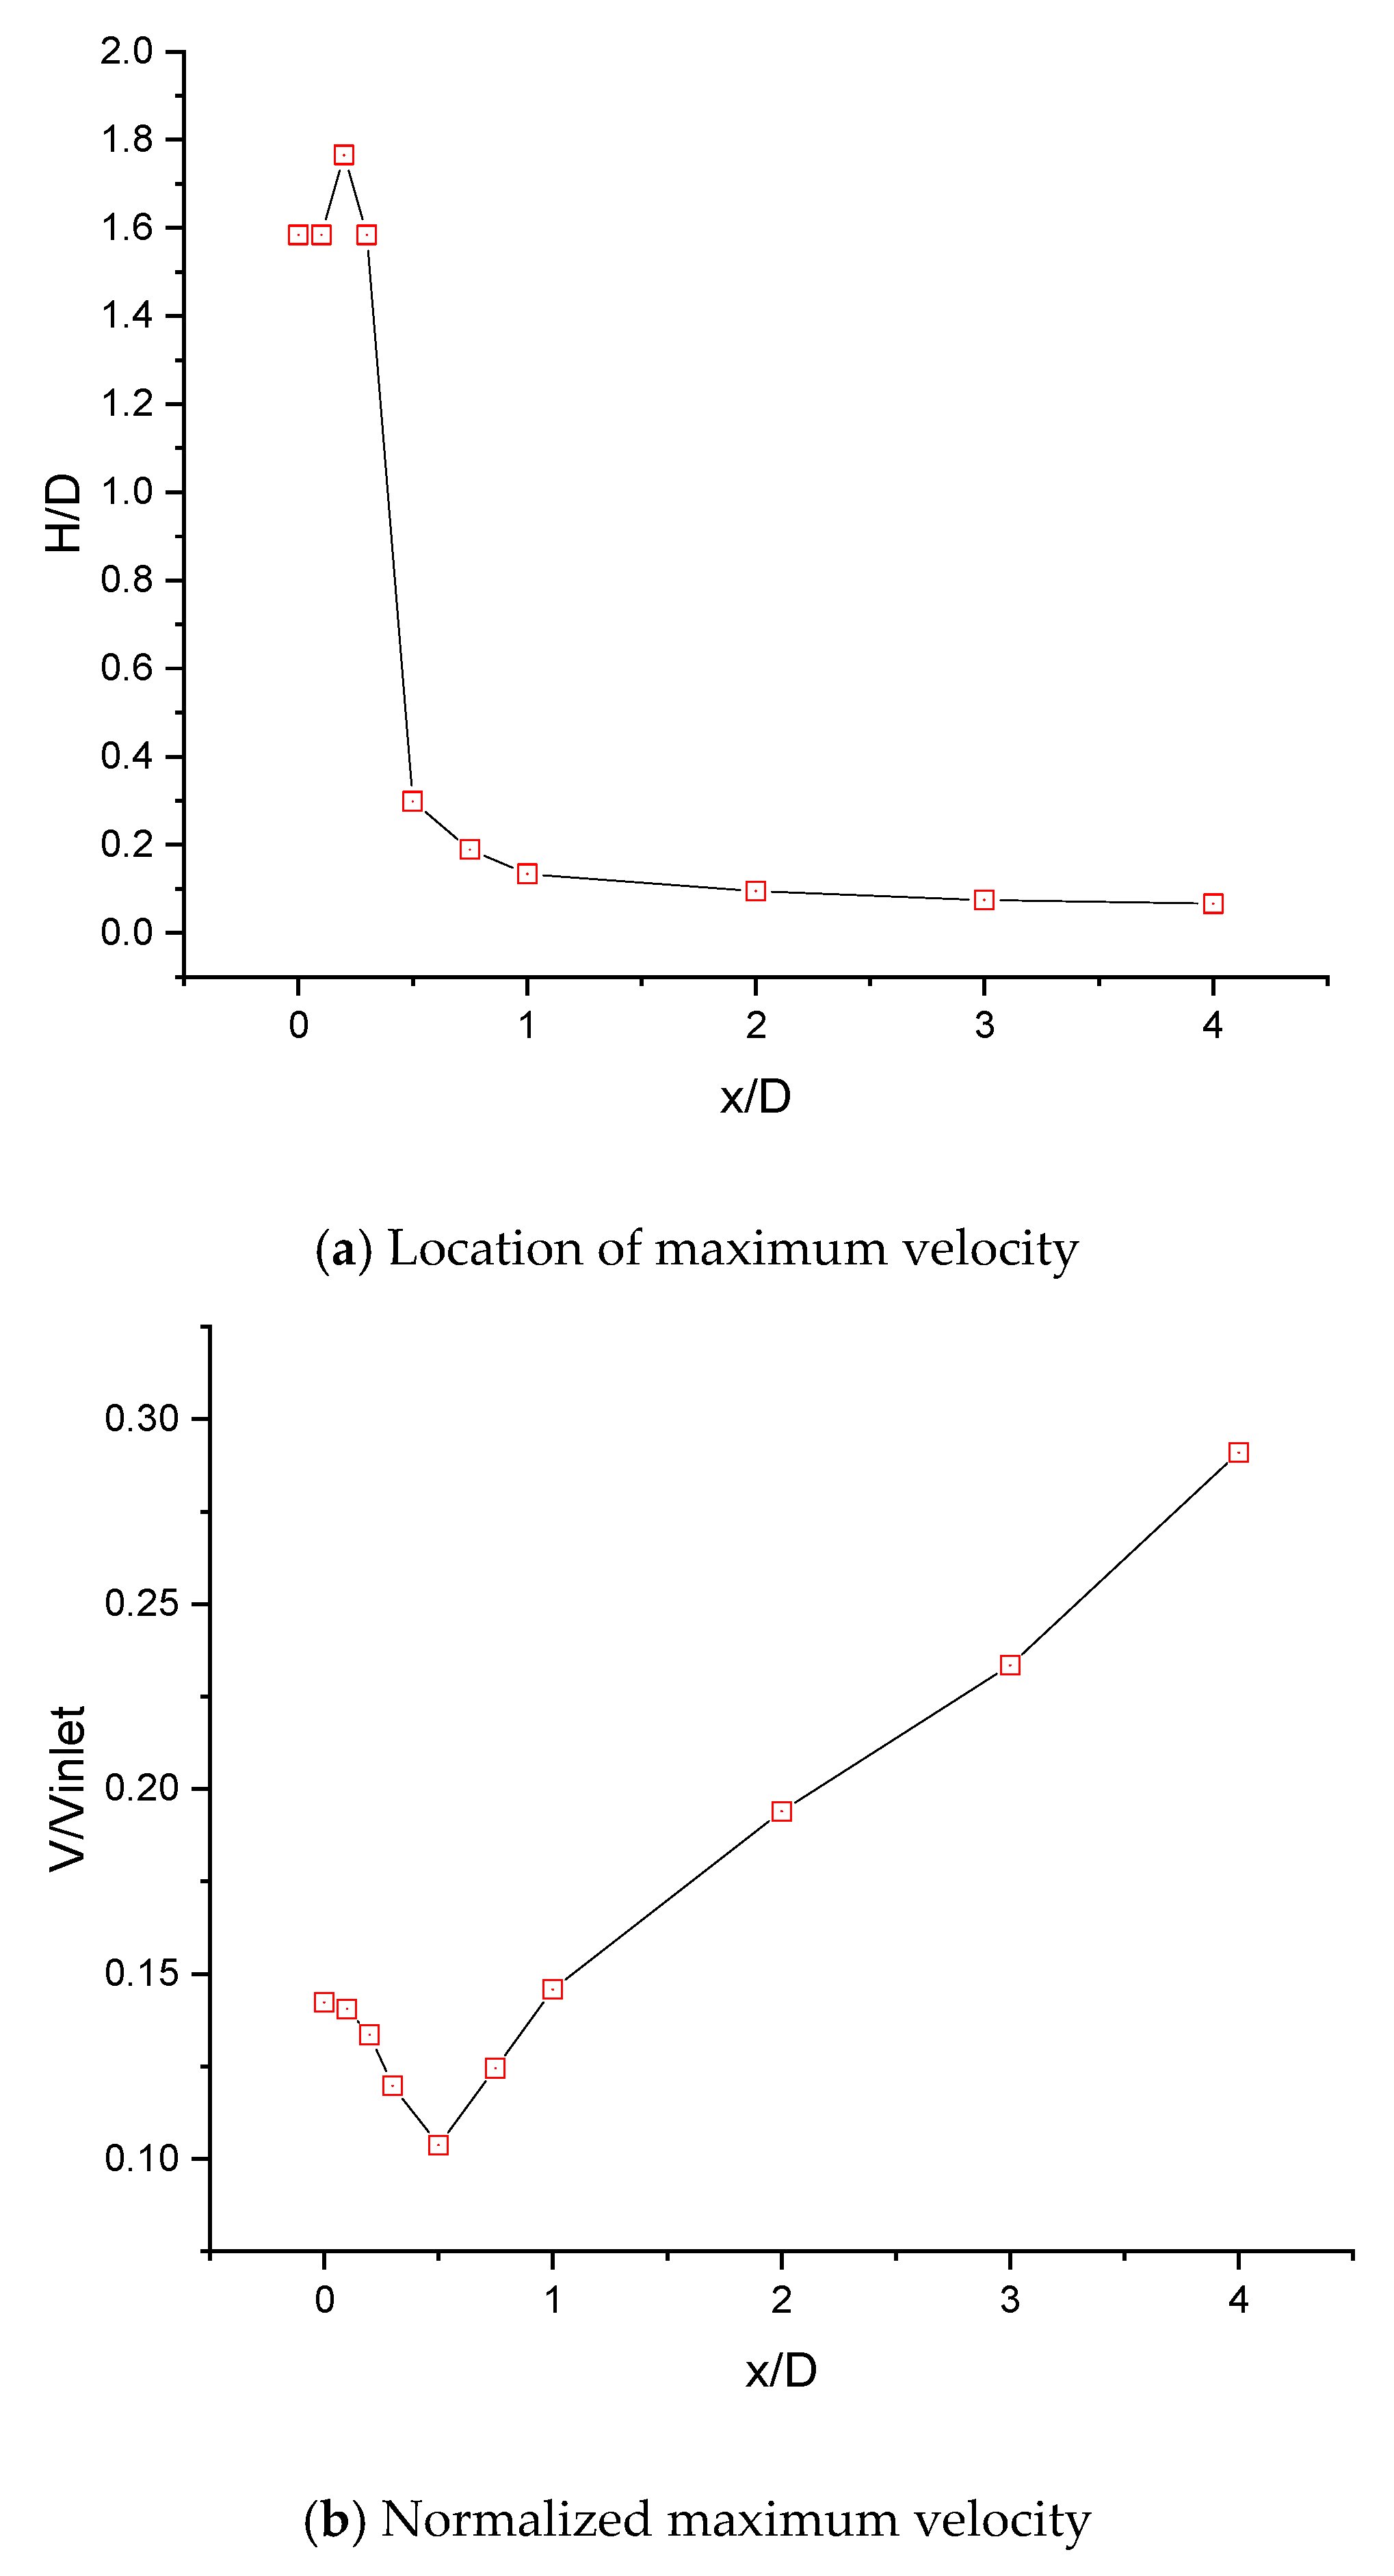
Figure 17a,b shows the location and magnitude of maximum velocity respectively at different radial distances from the centerline of the fountain; they are normalized by the diameter of the jet and inlet velocity respectively. Location and magnitude of maximum velocity are used to describe the strength and shape of the fountain, which is due to multiple factors. Fountain shows different flow characteristics when x/D < 0.5 and when x/D > 0.5. Maximum velocity occurs significantly close to ground when x/D > 0.5. Maximum velocity increases gradually as x/D gets larger than 0.5.

3.3. Straight Fountain Formation under Various Flow Conditions

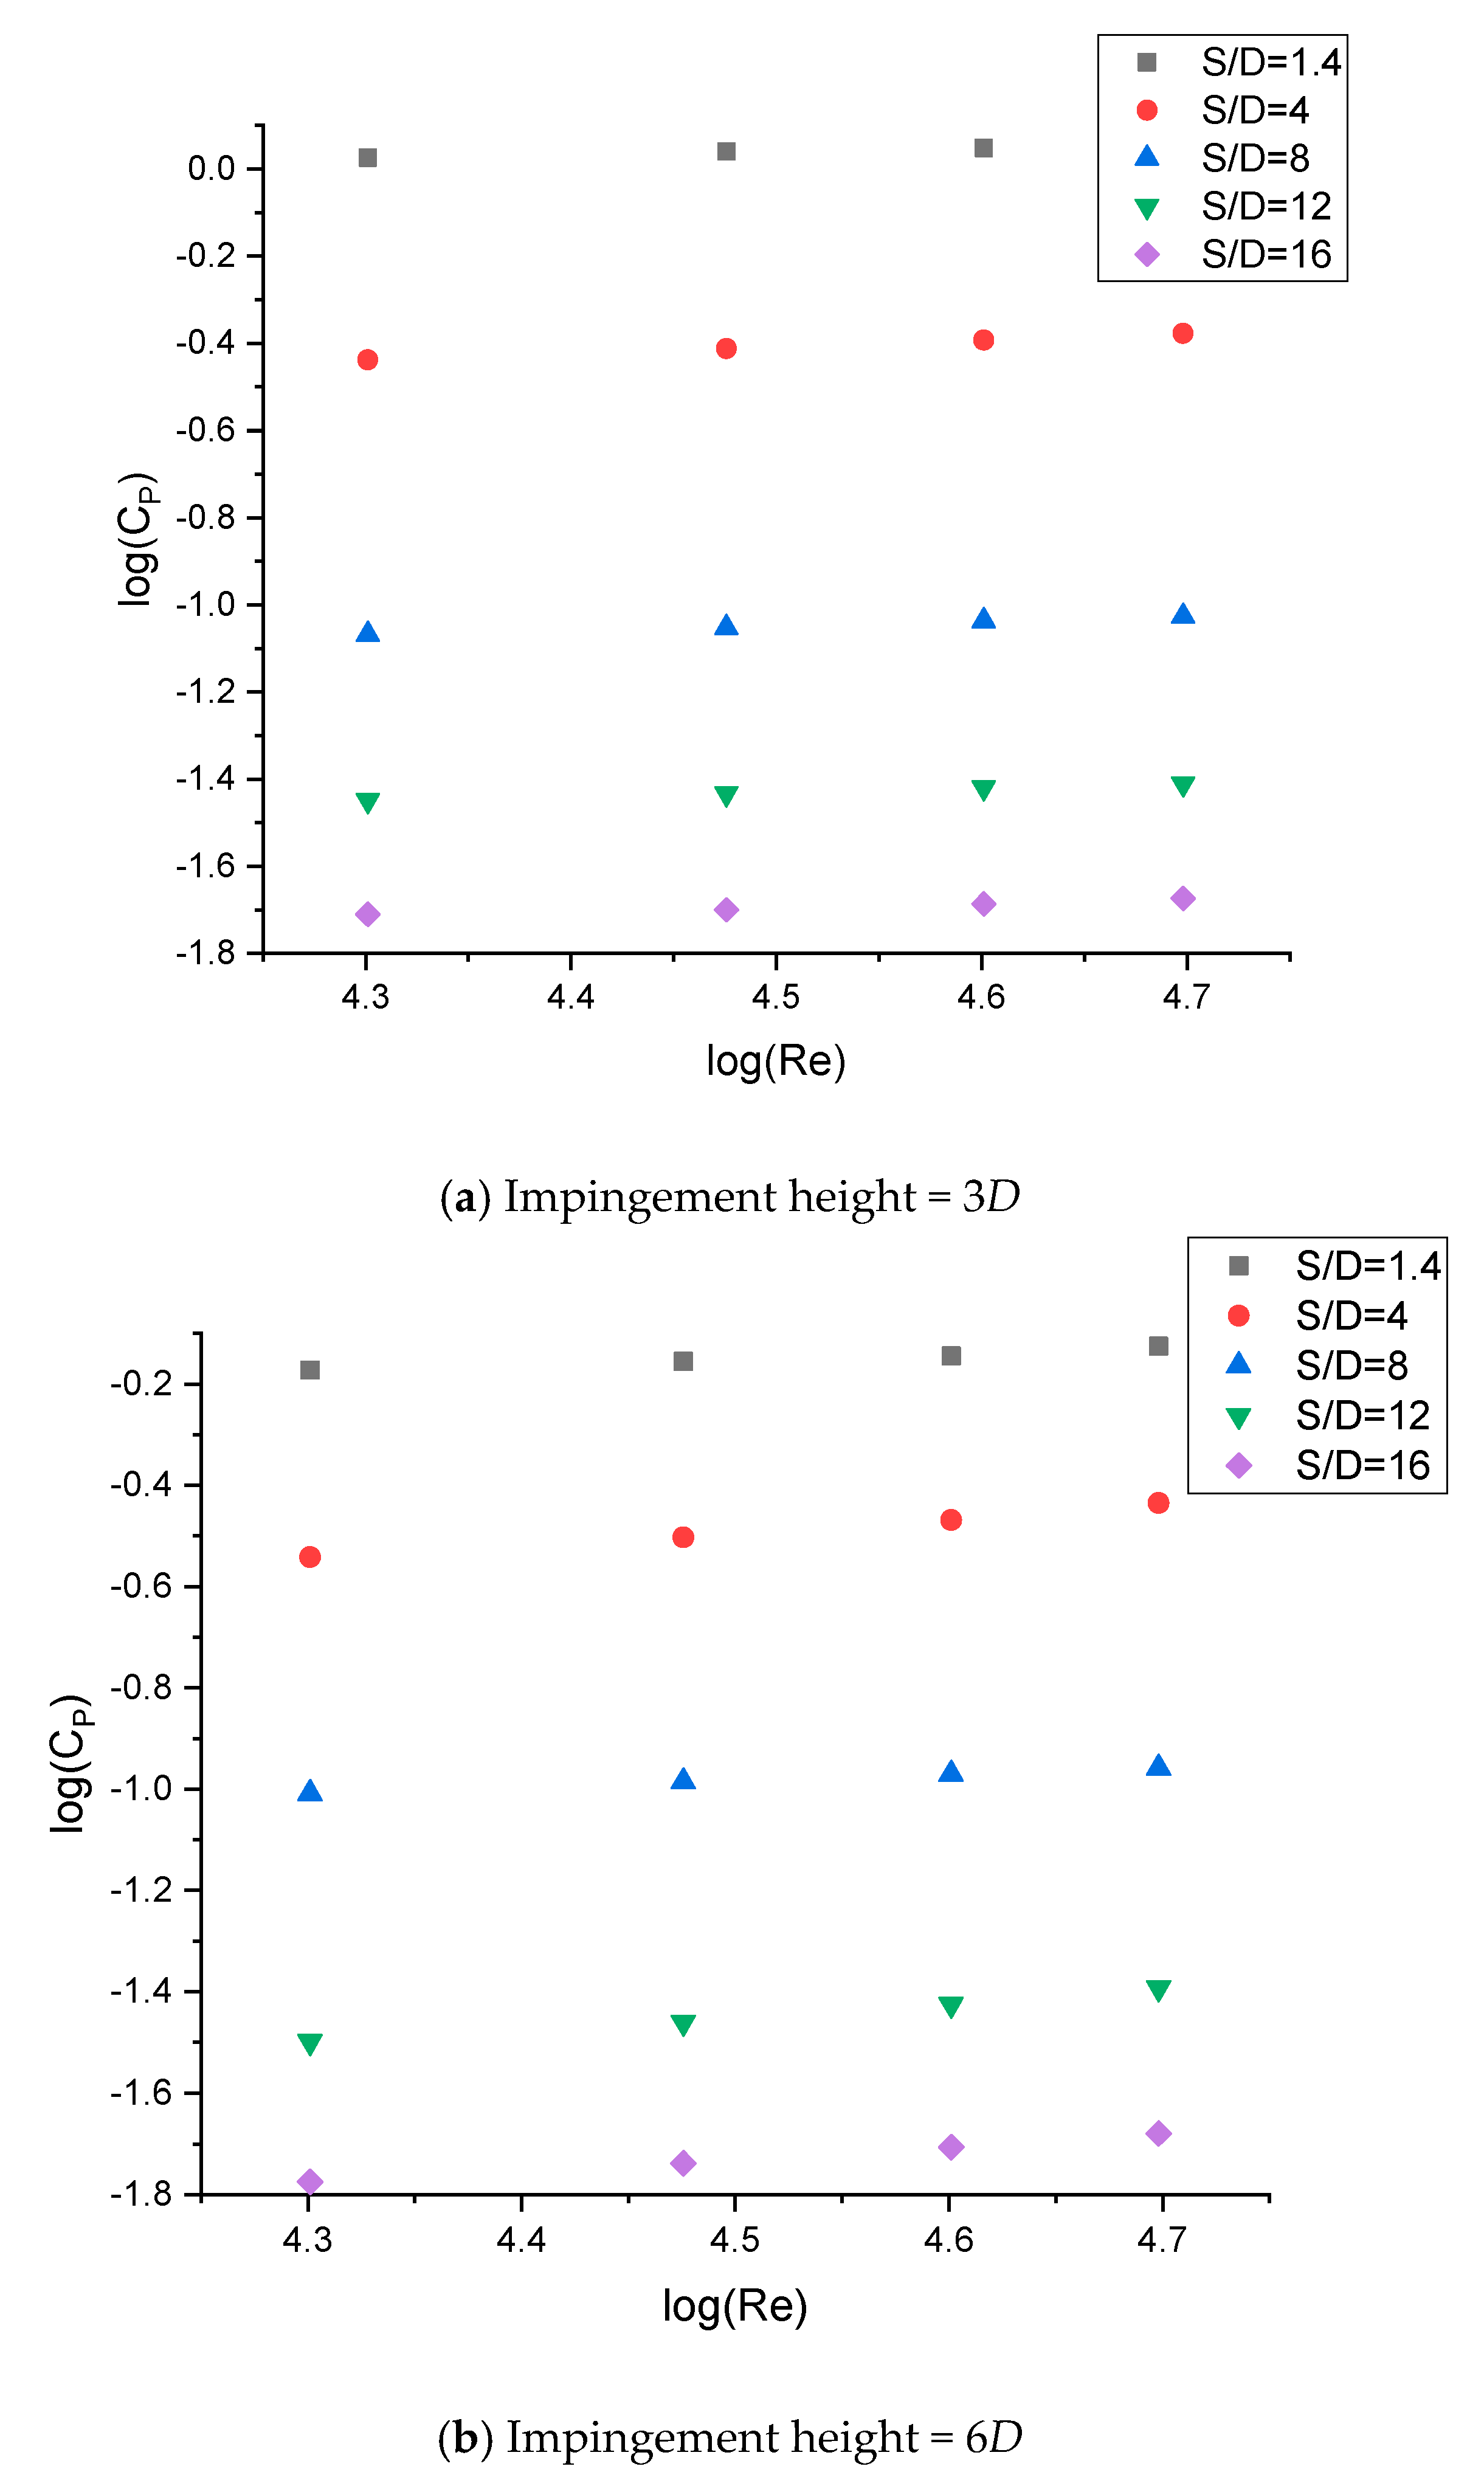
A series of simulations is performed when Reynolds numbers at two velocity inlets of the two jets are the same. Diameters of the two jets are set identical at 0.02 m. Inlet velocity is set at 1 m/s, 1.5 m/s, 2 m/s, and 2.5 m/s, and corresponding Reynolds numbers are 20,000, 29,900, 39,900, and 49,900 respectively. Figure 18 shows the logarithm of stagnation pressure coefficient, defined as C p = P     ρ g h 0.5 ρ v i n l e t 2 , versus logarithm of inlet Reynolds number at different conditions when parameters including the distance between twin jets, S/D and impingement height H/D are changed. For fixed S/D, logarithm of pressure coefficient and logarithm of inlet Reynolds number show a linear relationship. Furthermore, change in impingent height leads to a greater change in pressure coefficient for small S/D, such as 1.4, while the pressure coefficient for S/D = 16 changes slightly.
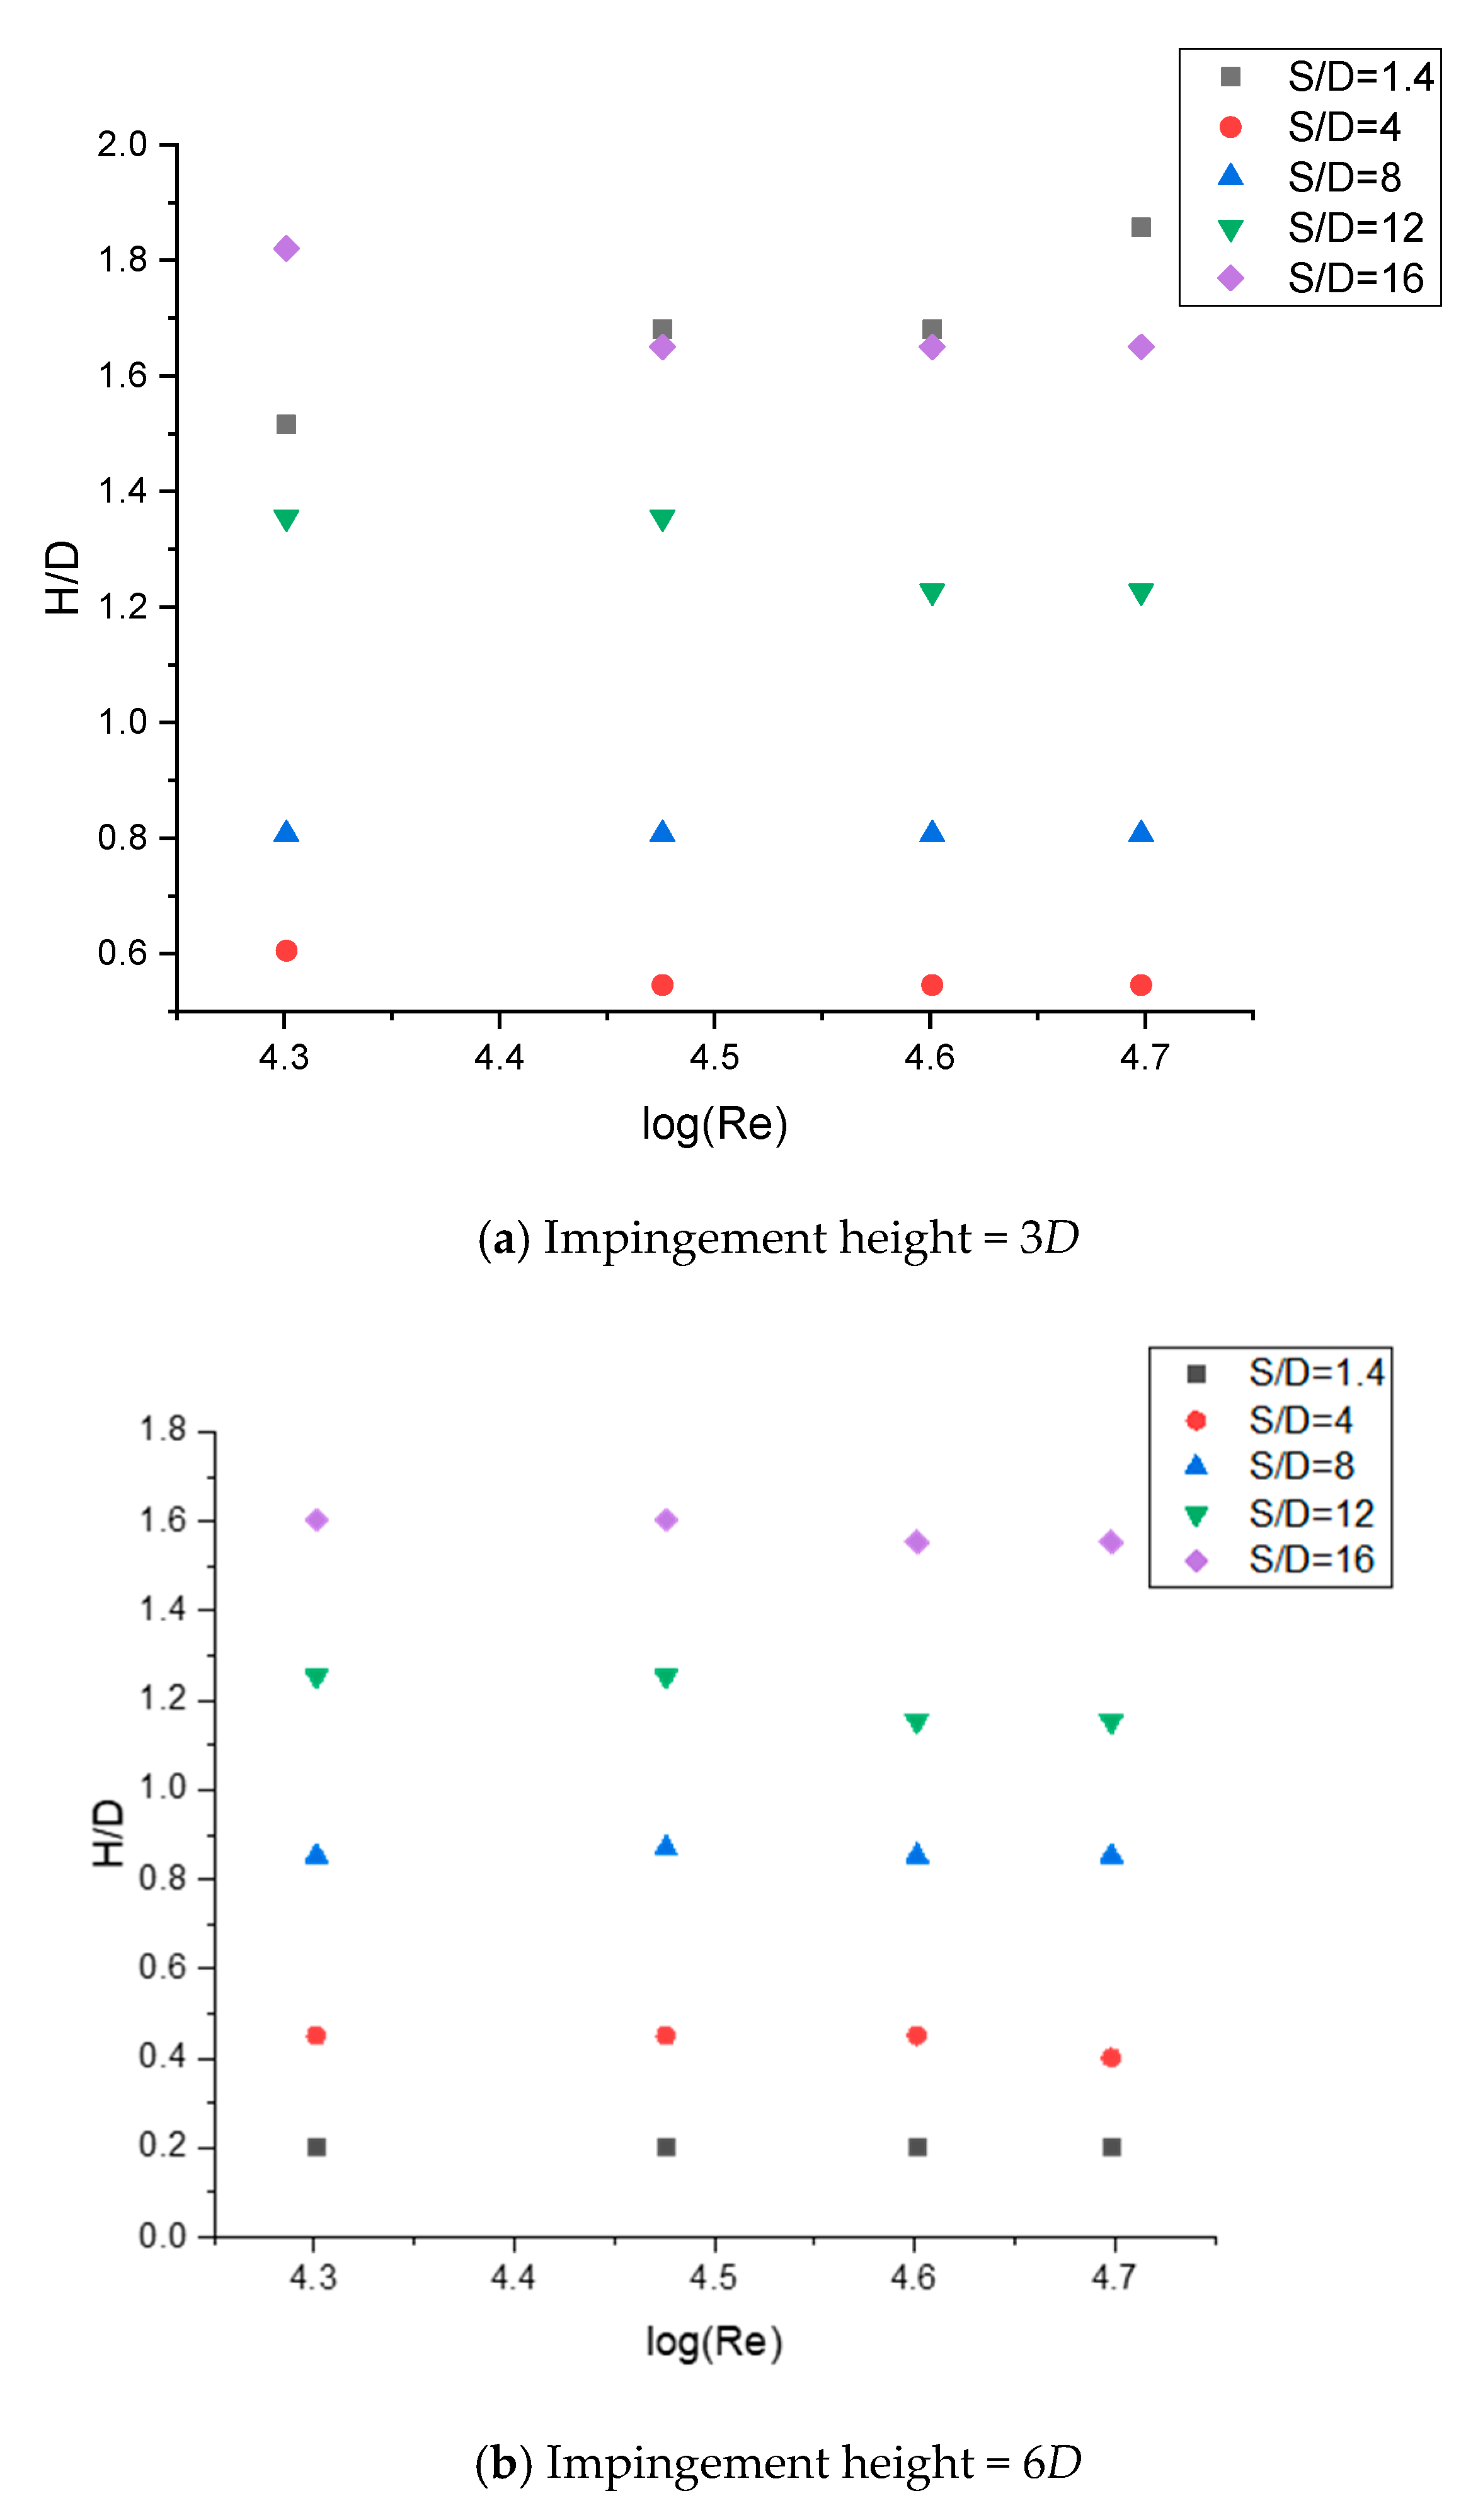
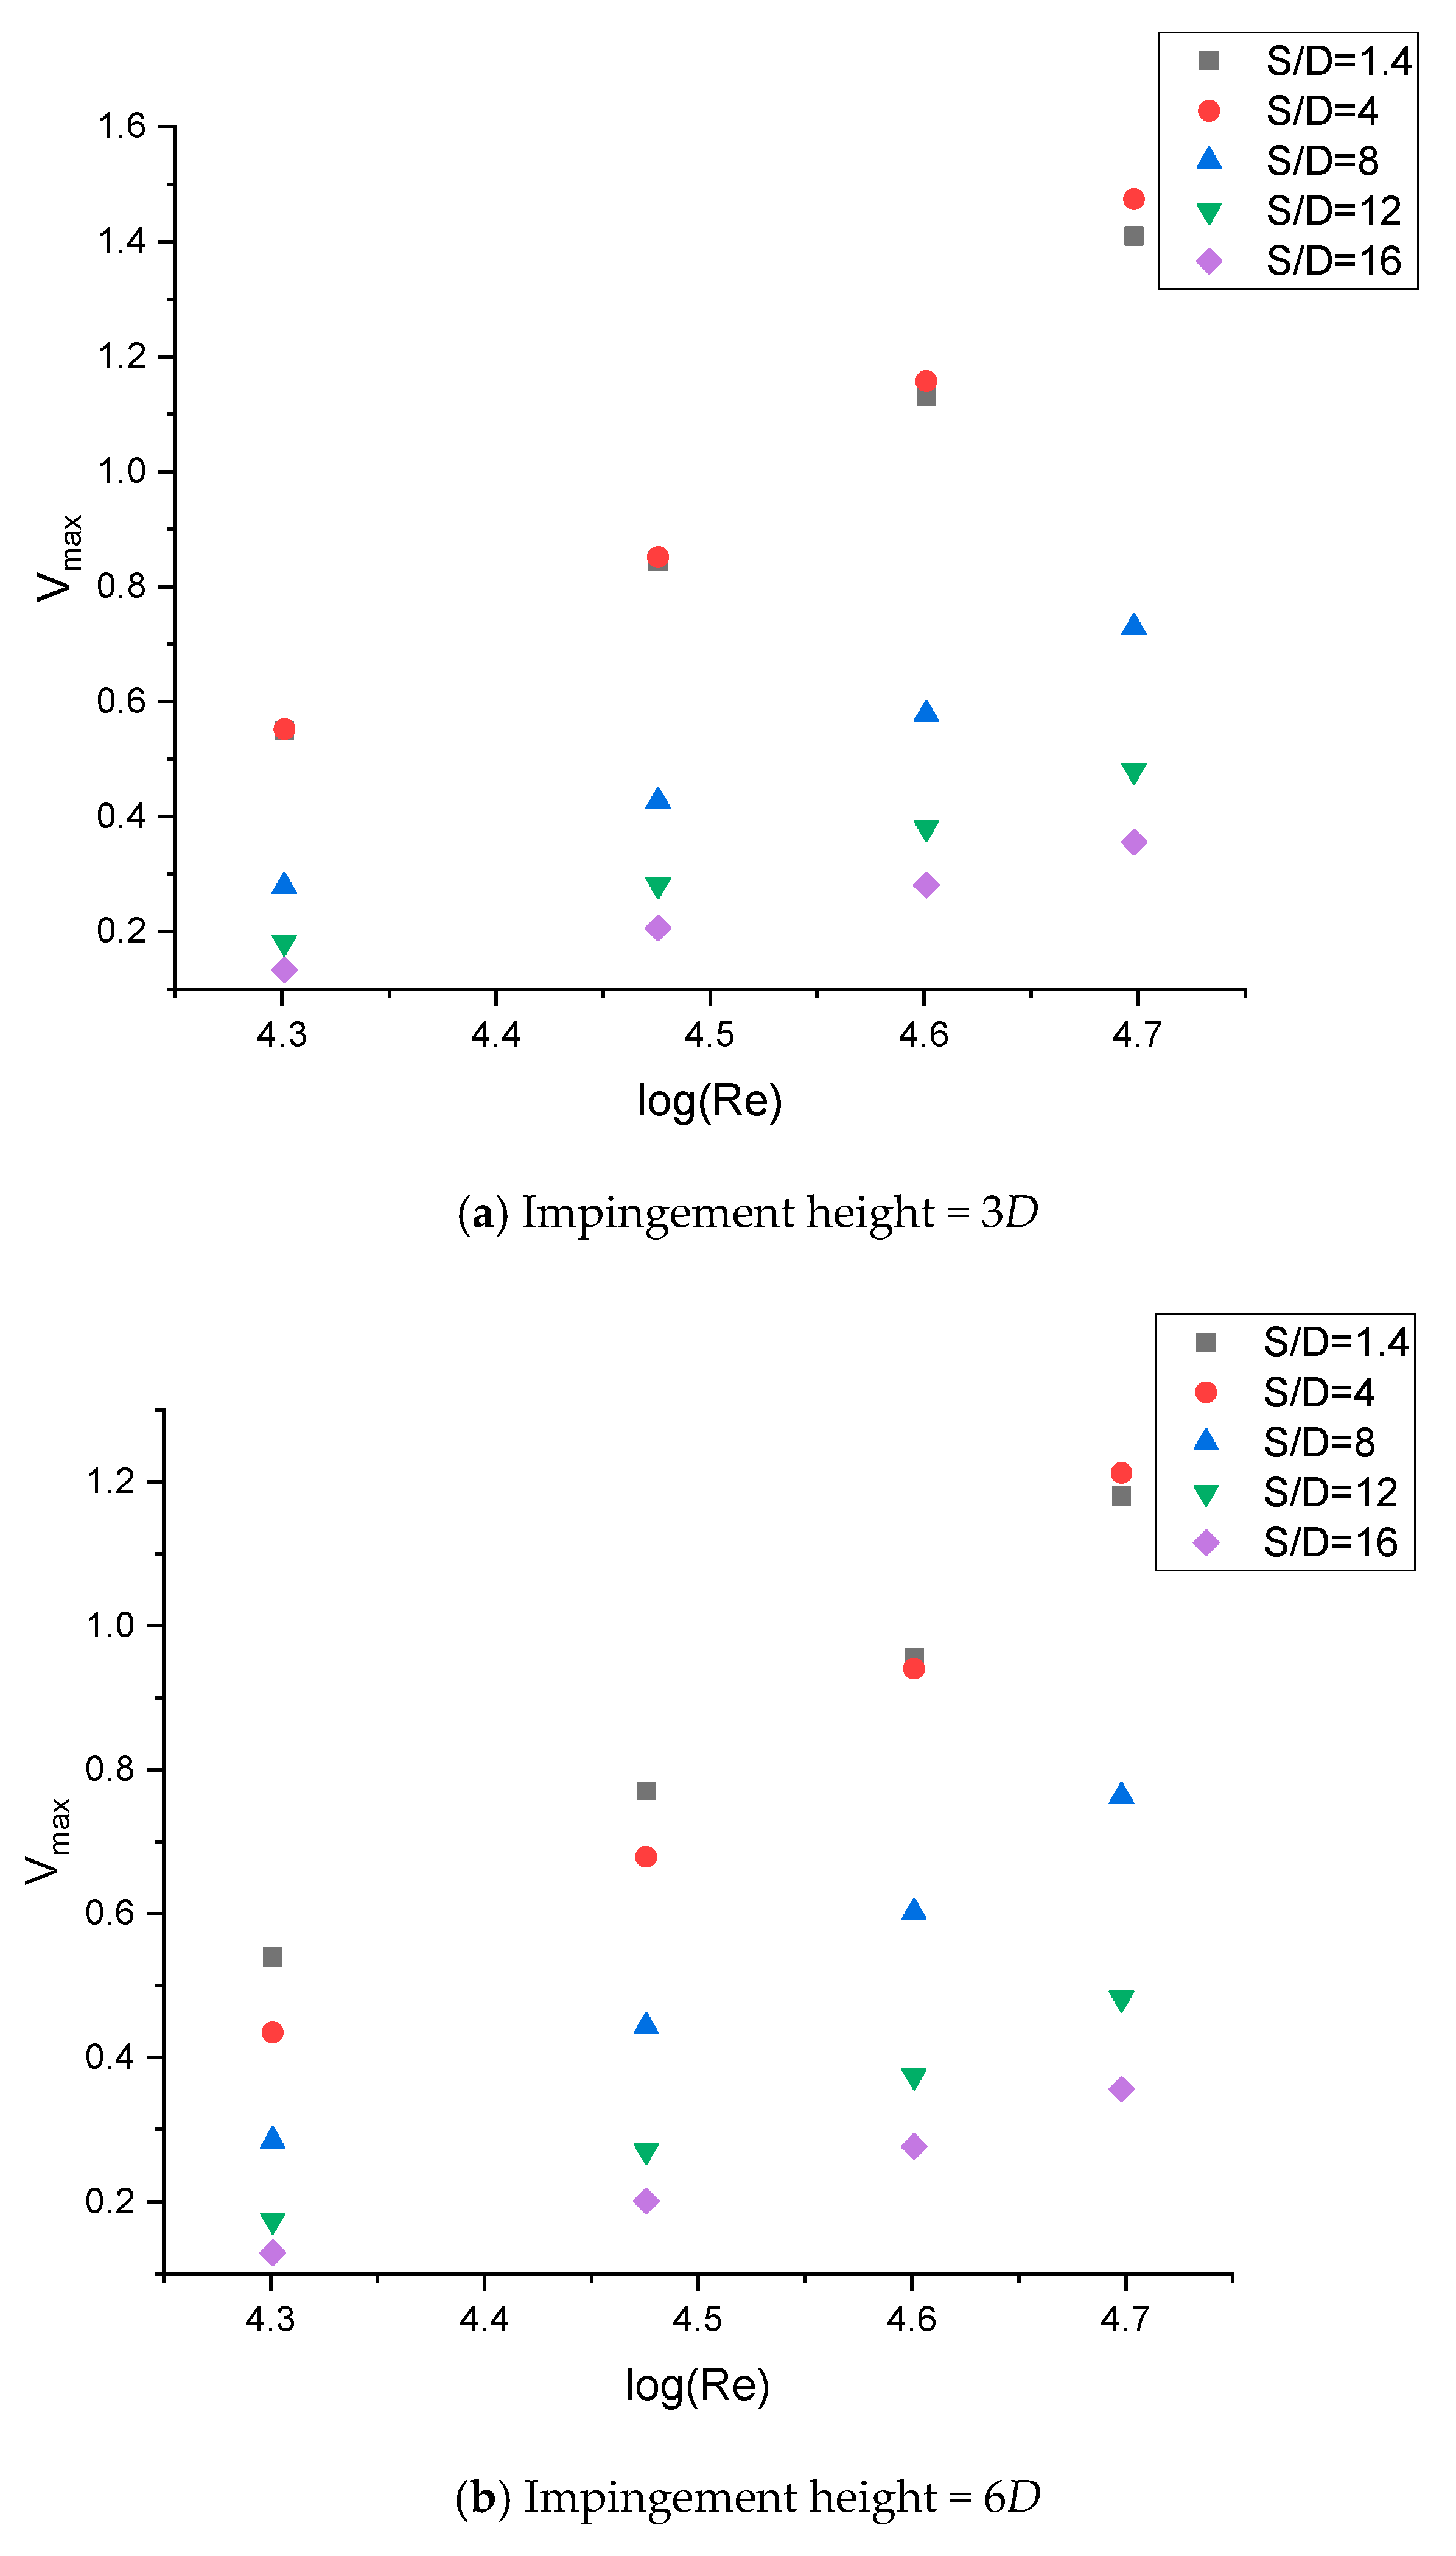
Figure 19 and Figure 20 show the location and magnitude of maximum velocity at the centerline of the fountain under various conditions. For fixed twin-jet distance and impingement height, location of maximum velocity at centerline of the fountain does not change with inlet Reynolds number. Maximum velocities for S/D = 1.4 and 4 at the centerline are very close especially when impingement height is 3D. In addition, change in impingement height has a greater influence on maximum velocity of the centerline for S/D = 1.4 and 4 than on that for S/D = 8, 12 and 16. The larger the S/D, the less is the influence of change in impingement height on maximum velocity of the centerline of the fountain.

3.4. Inclined Fountain Formation

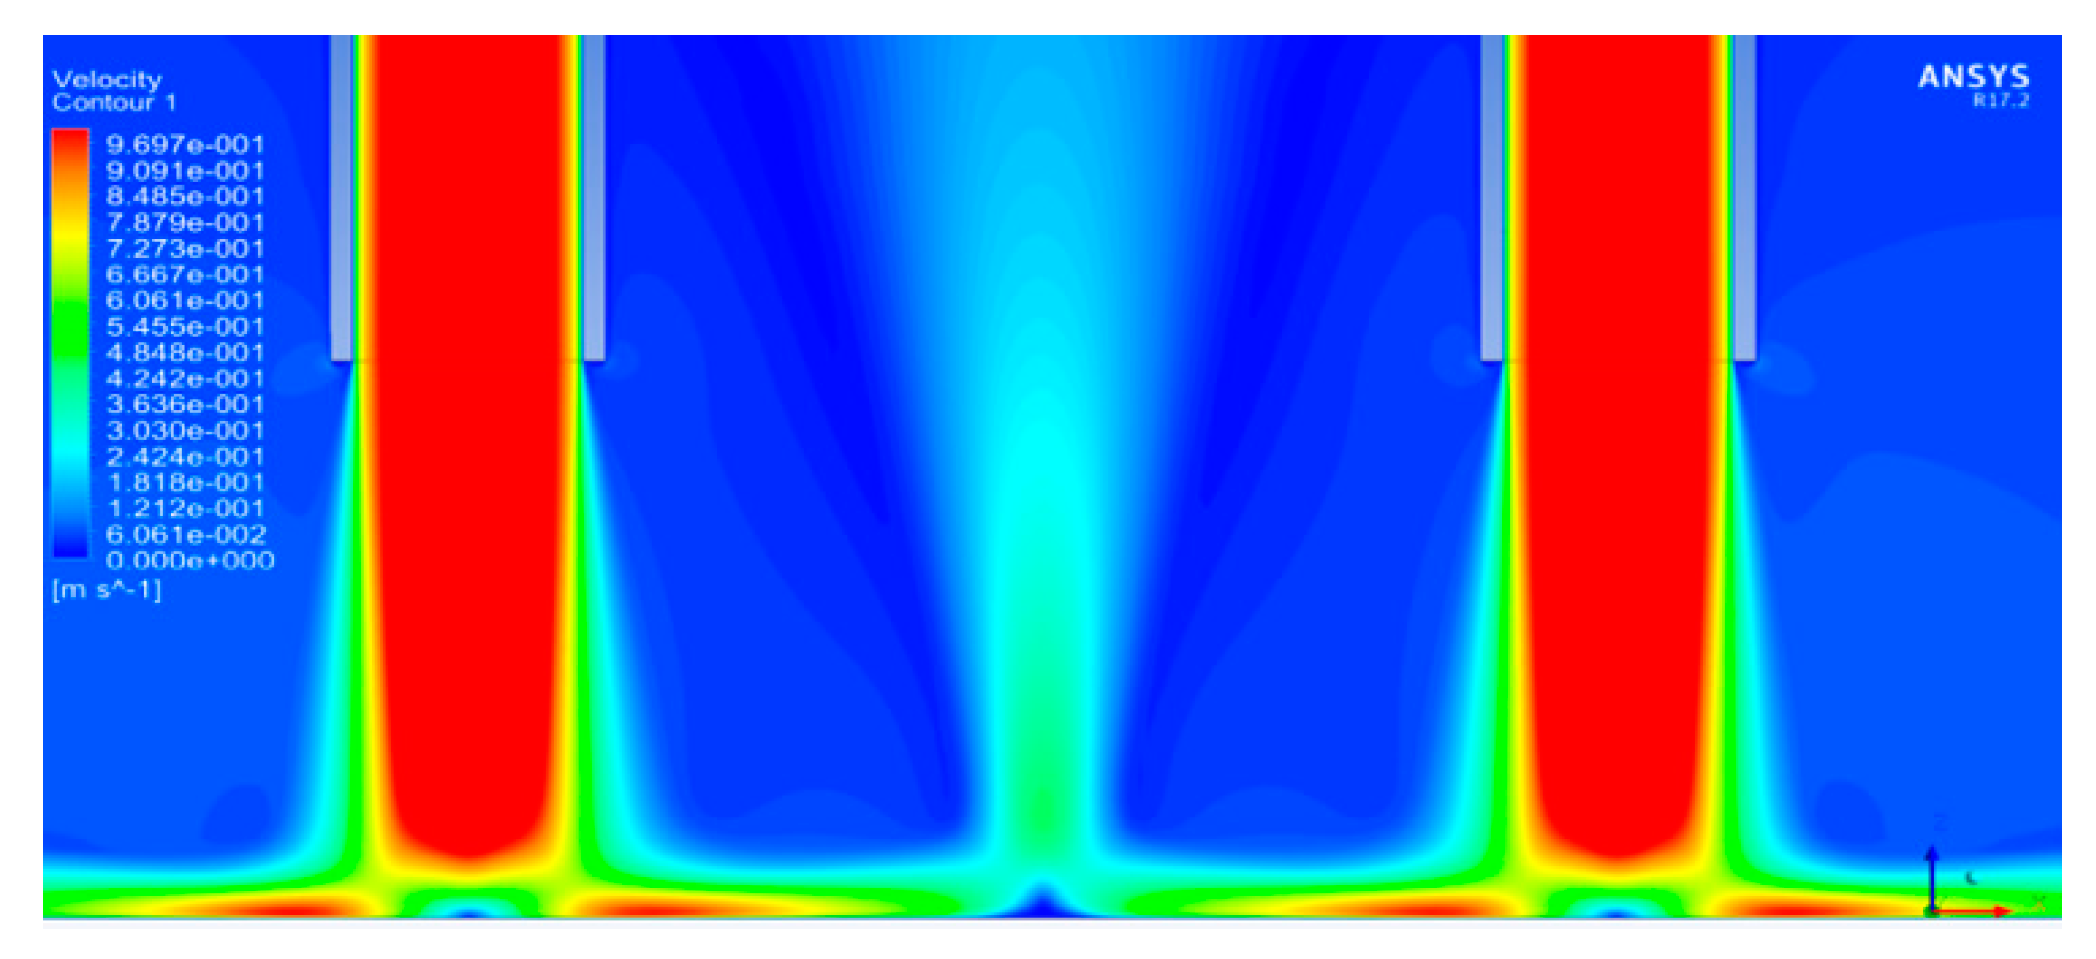
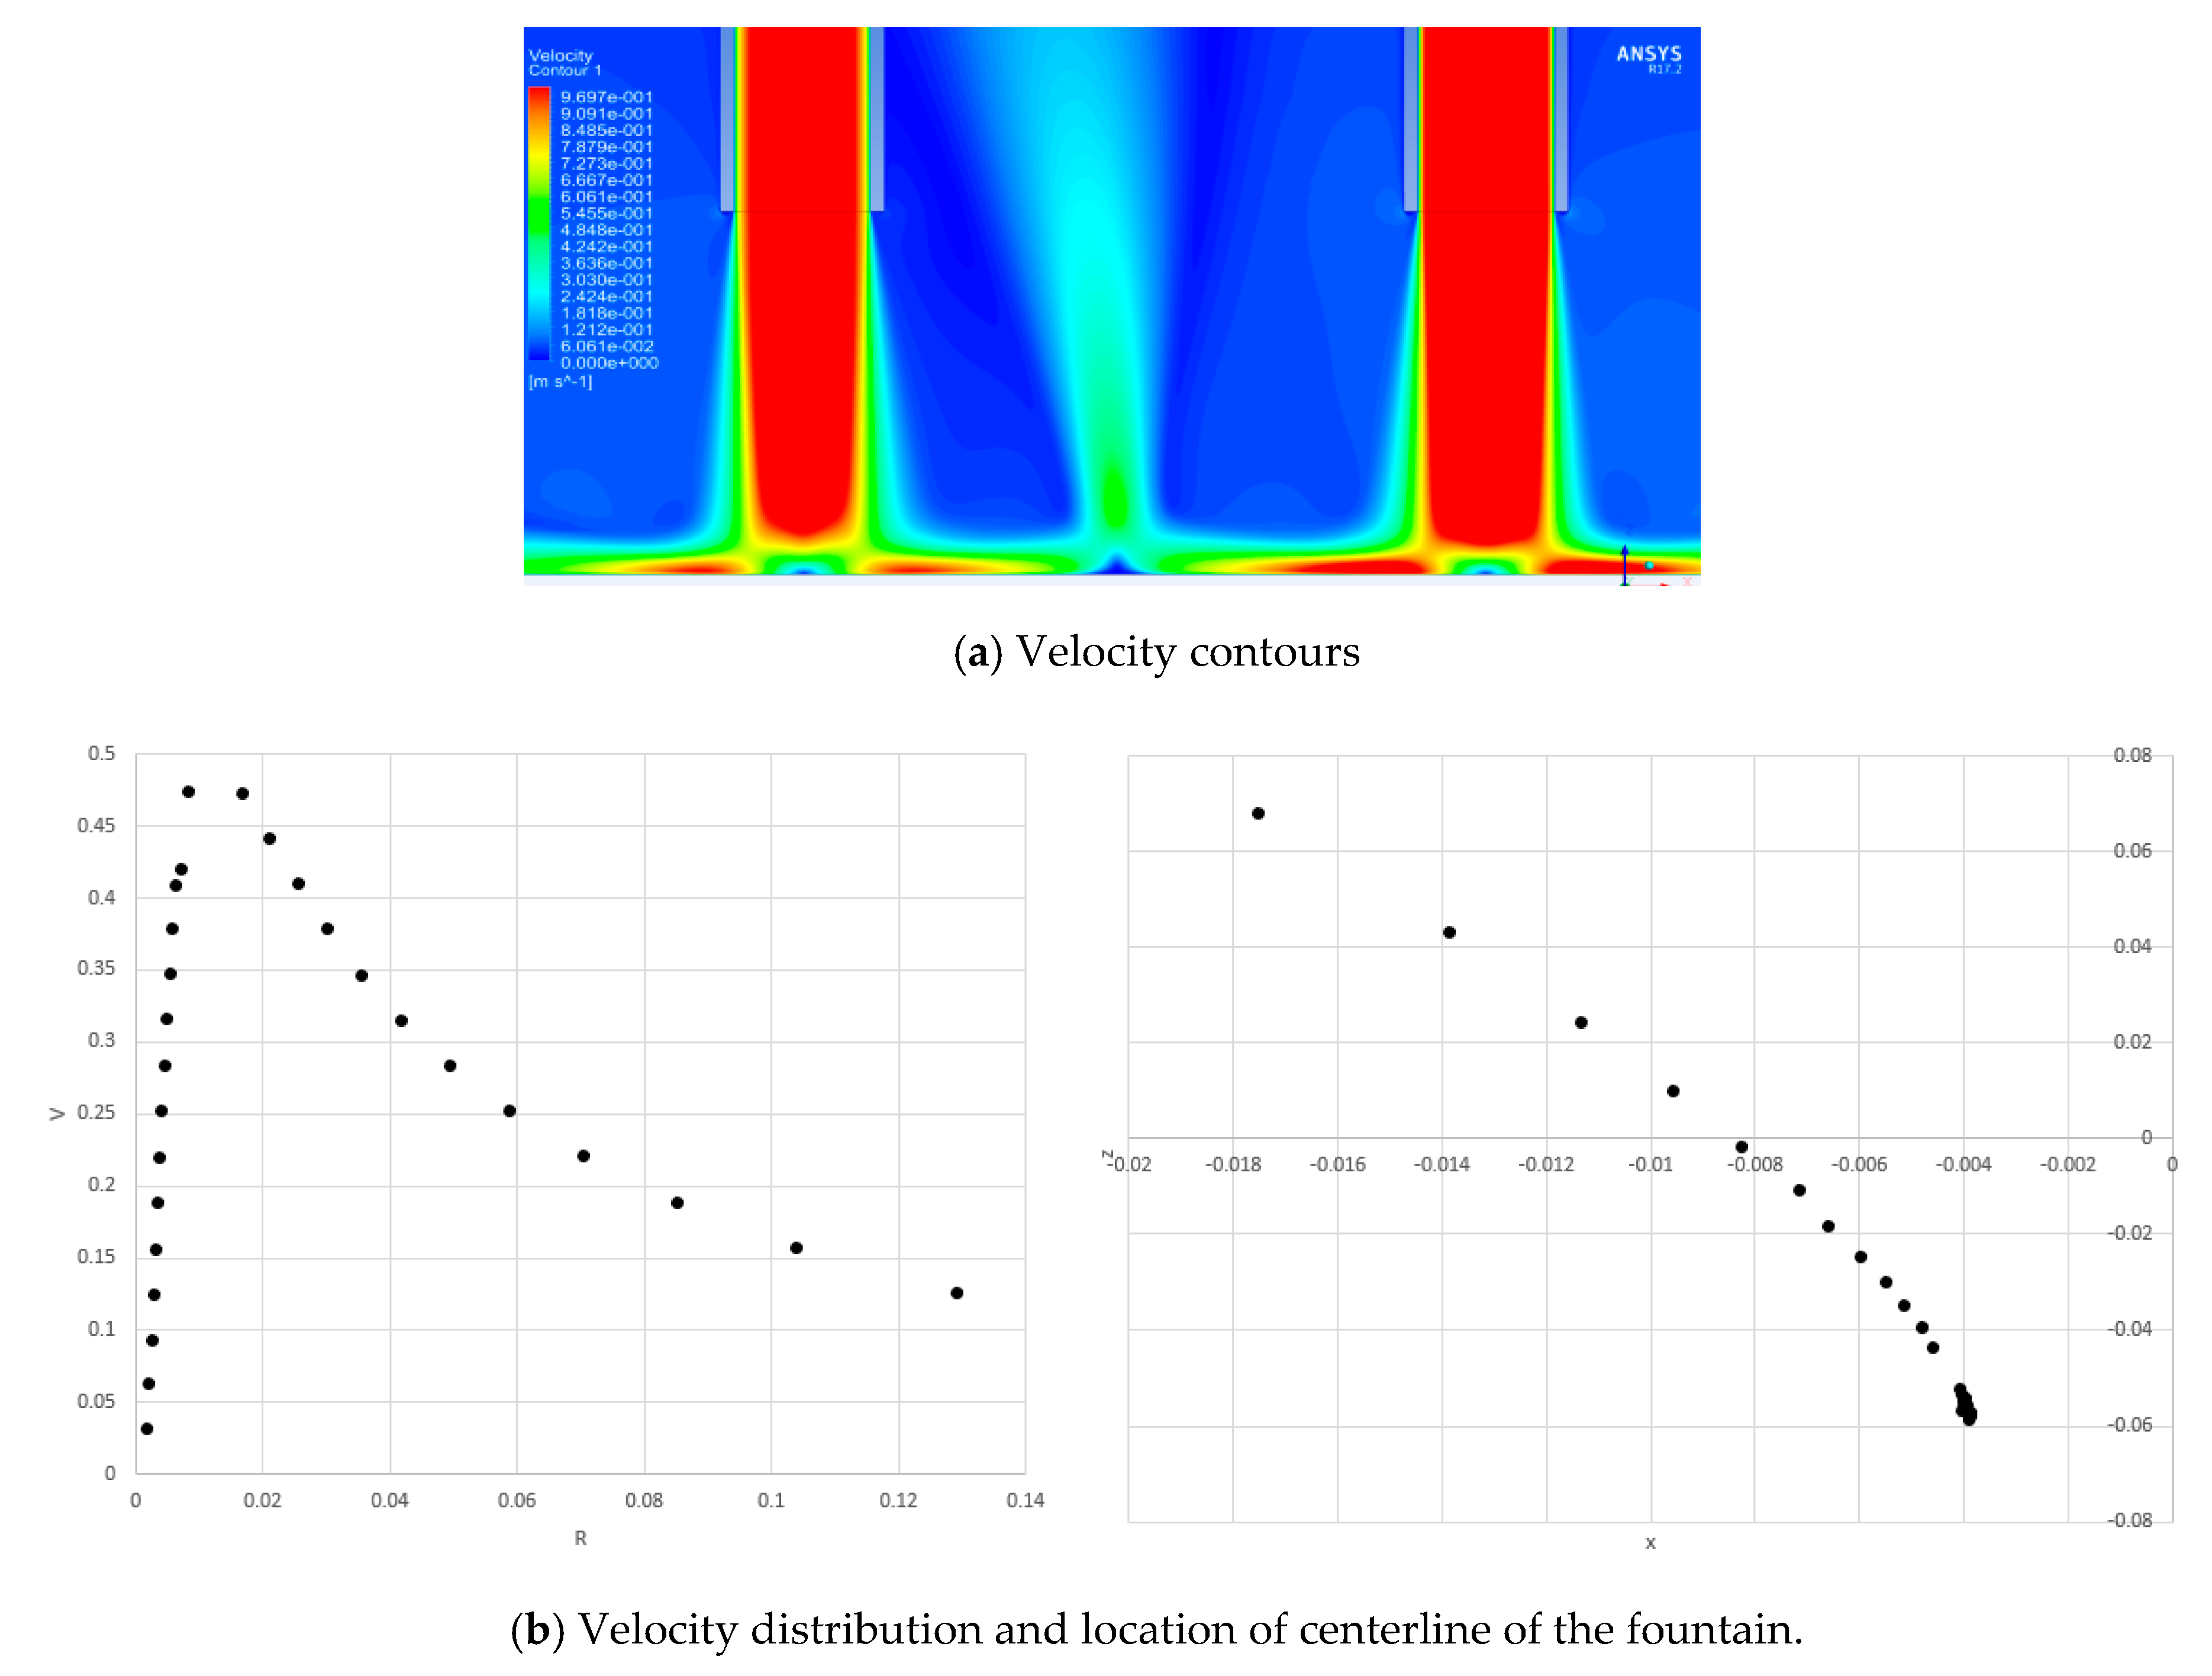
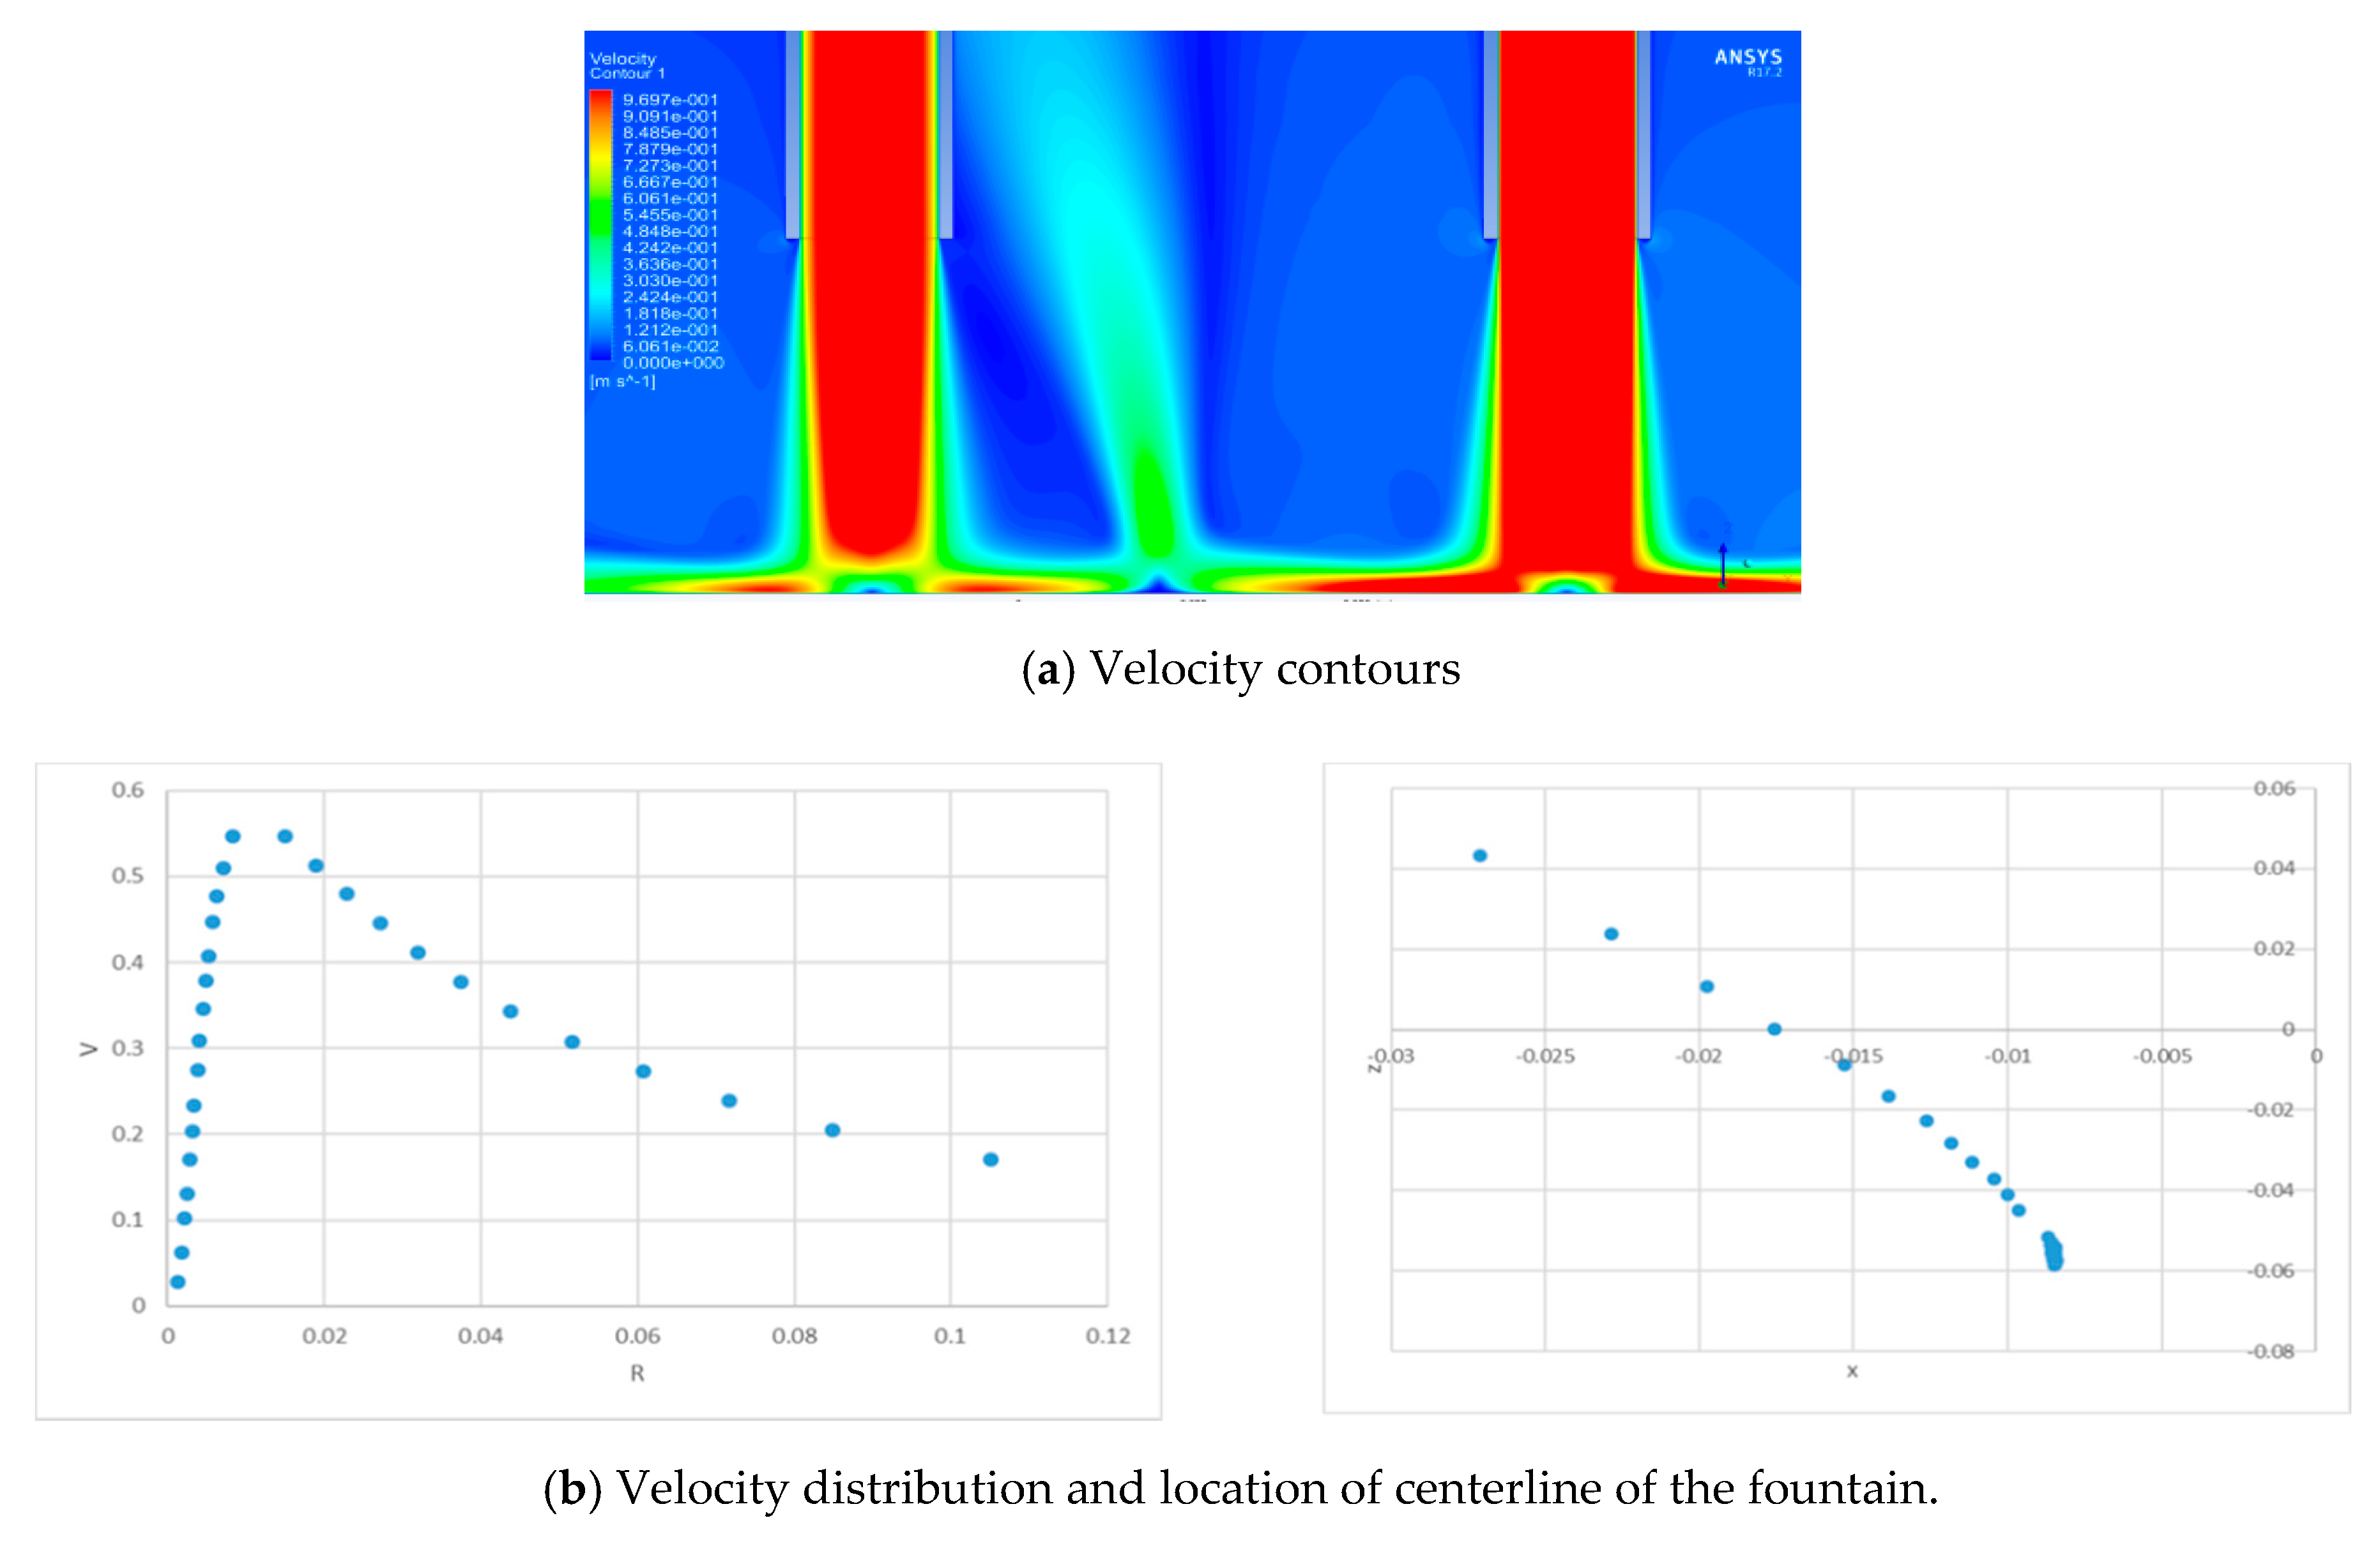
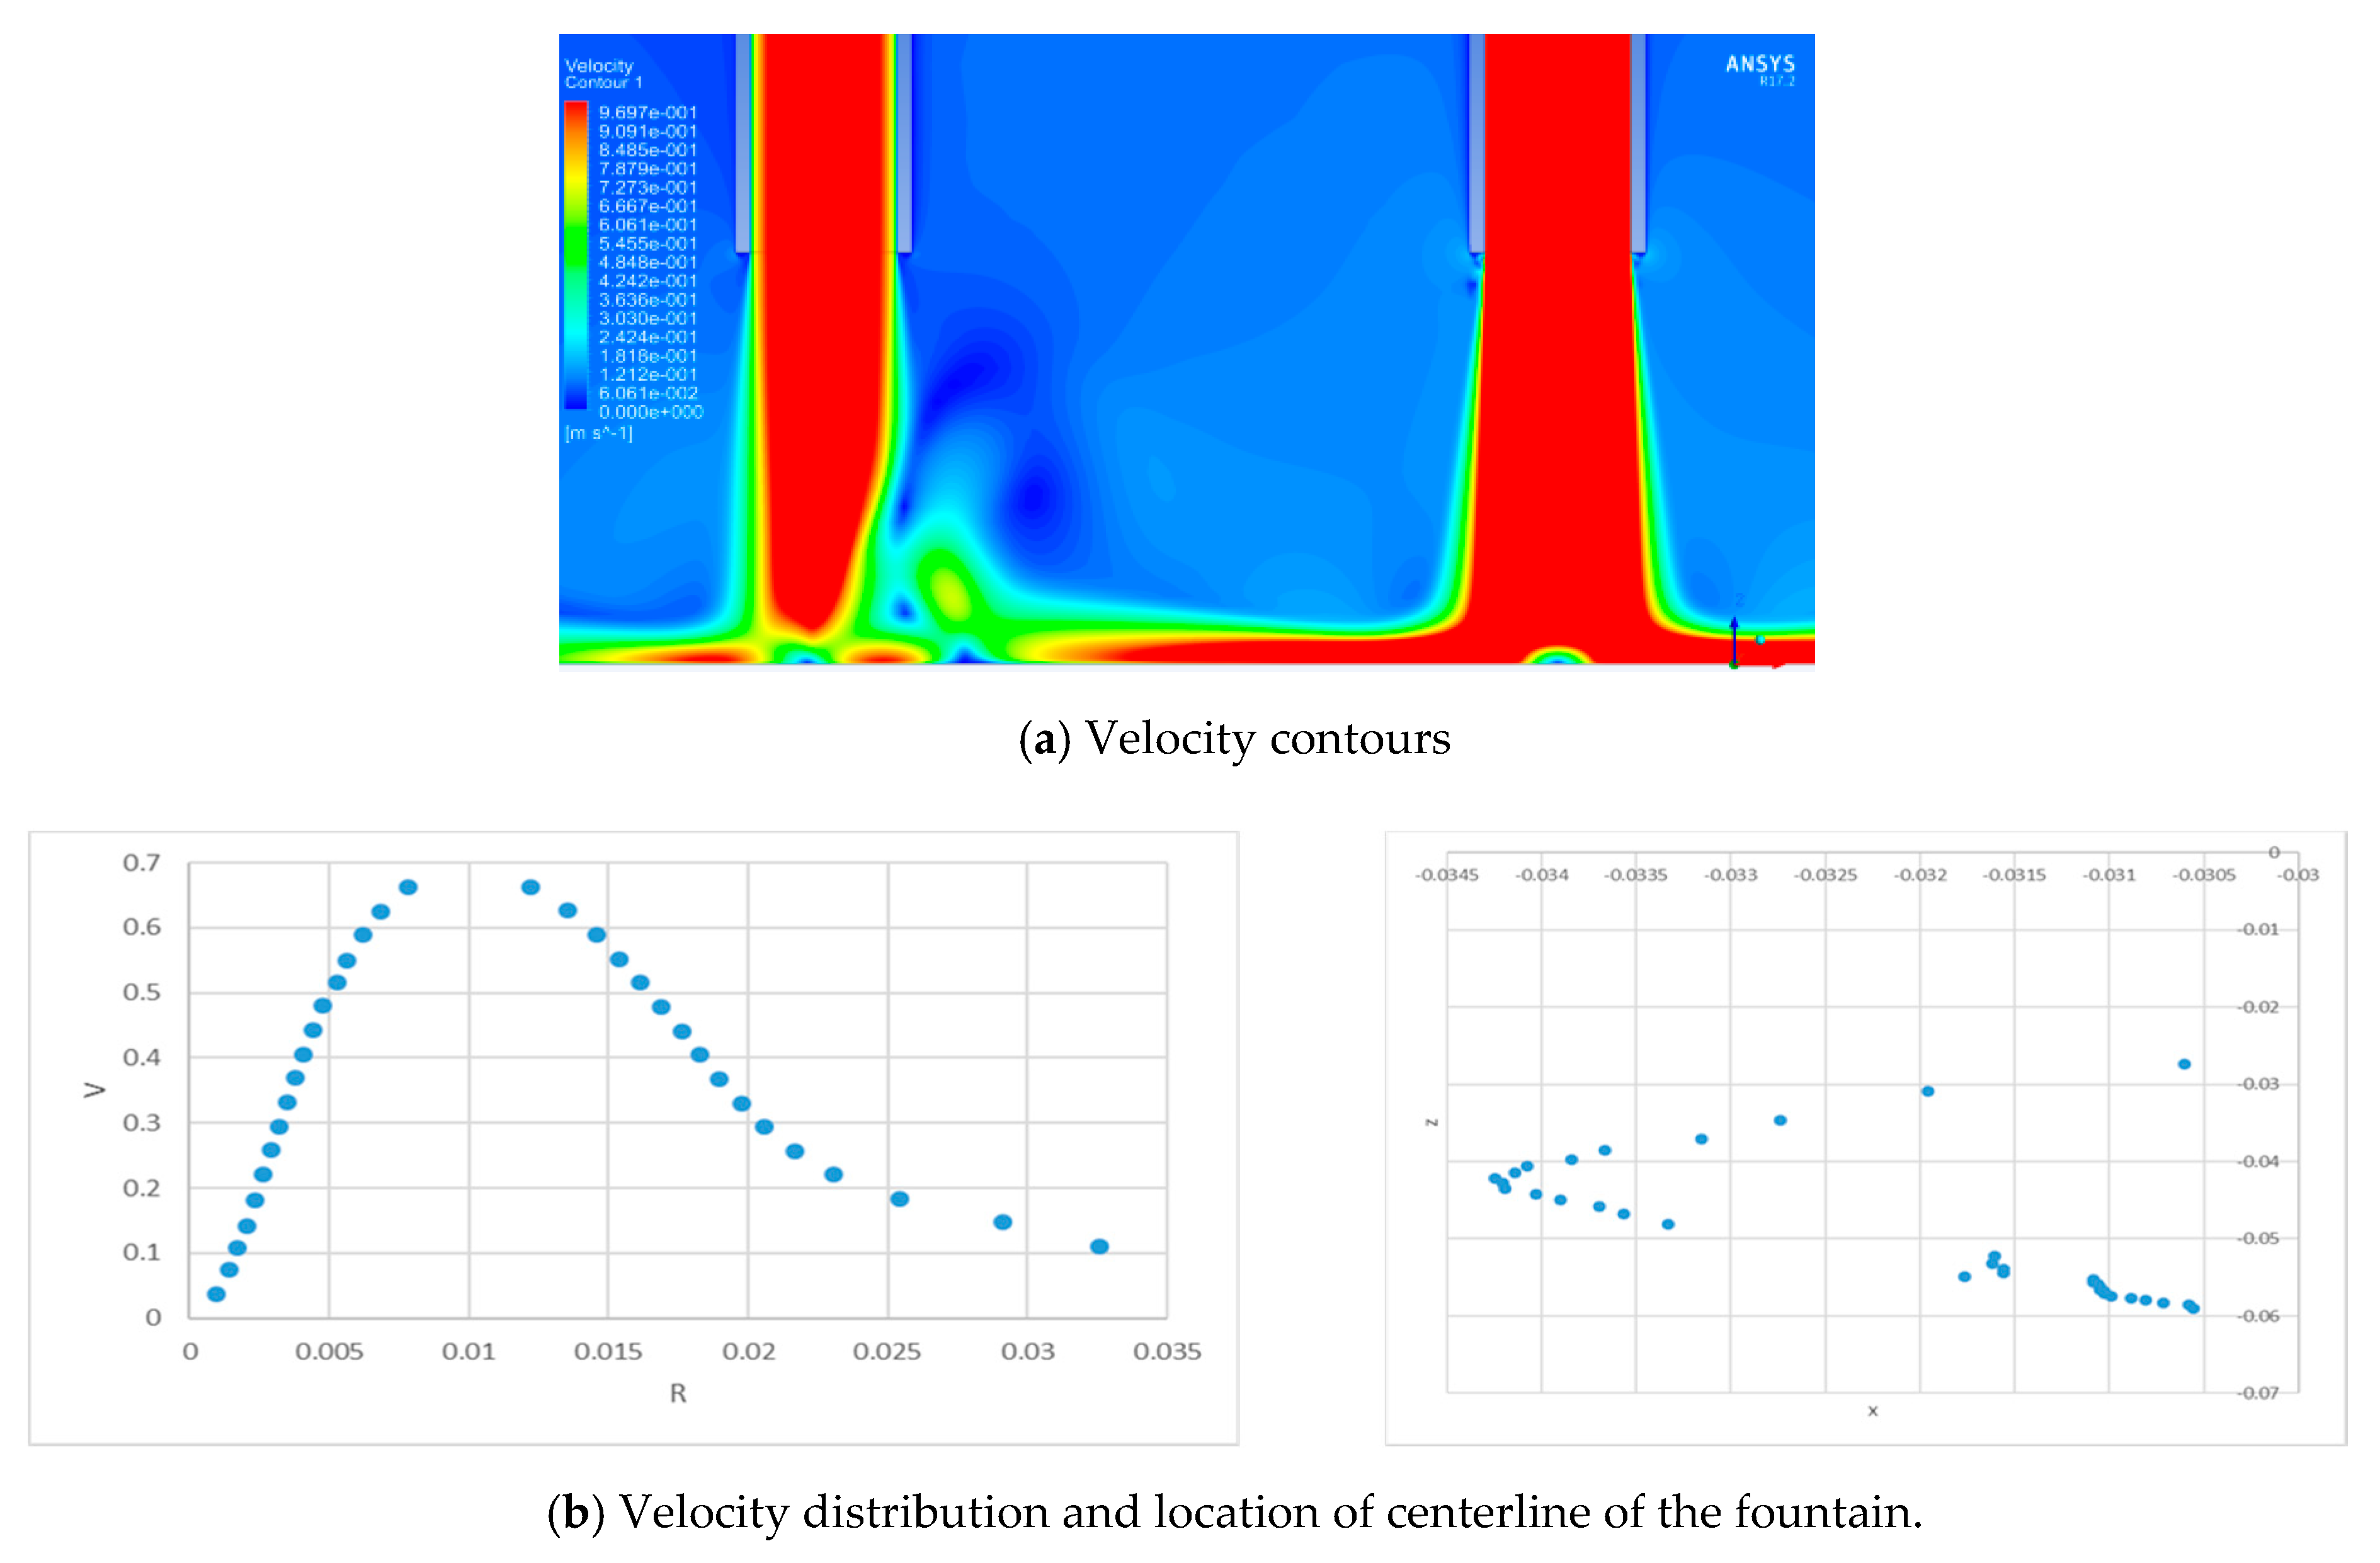
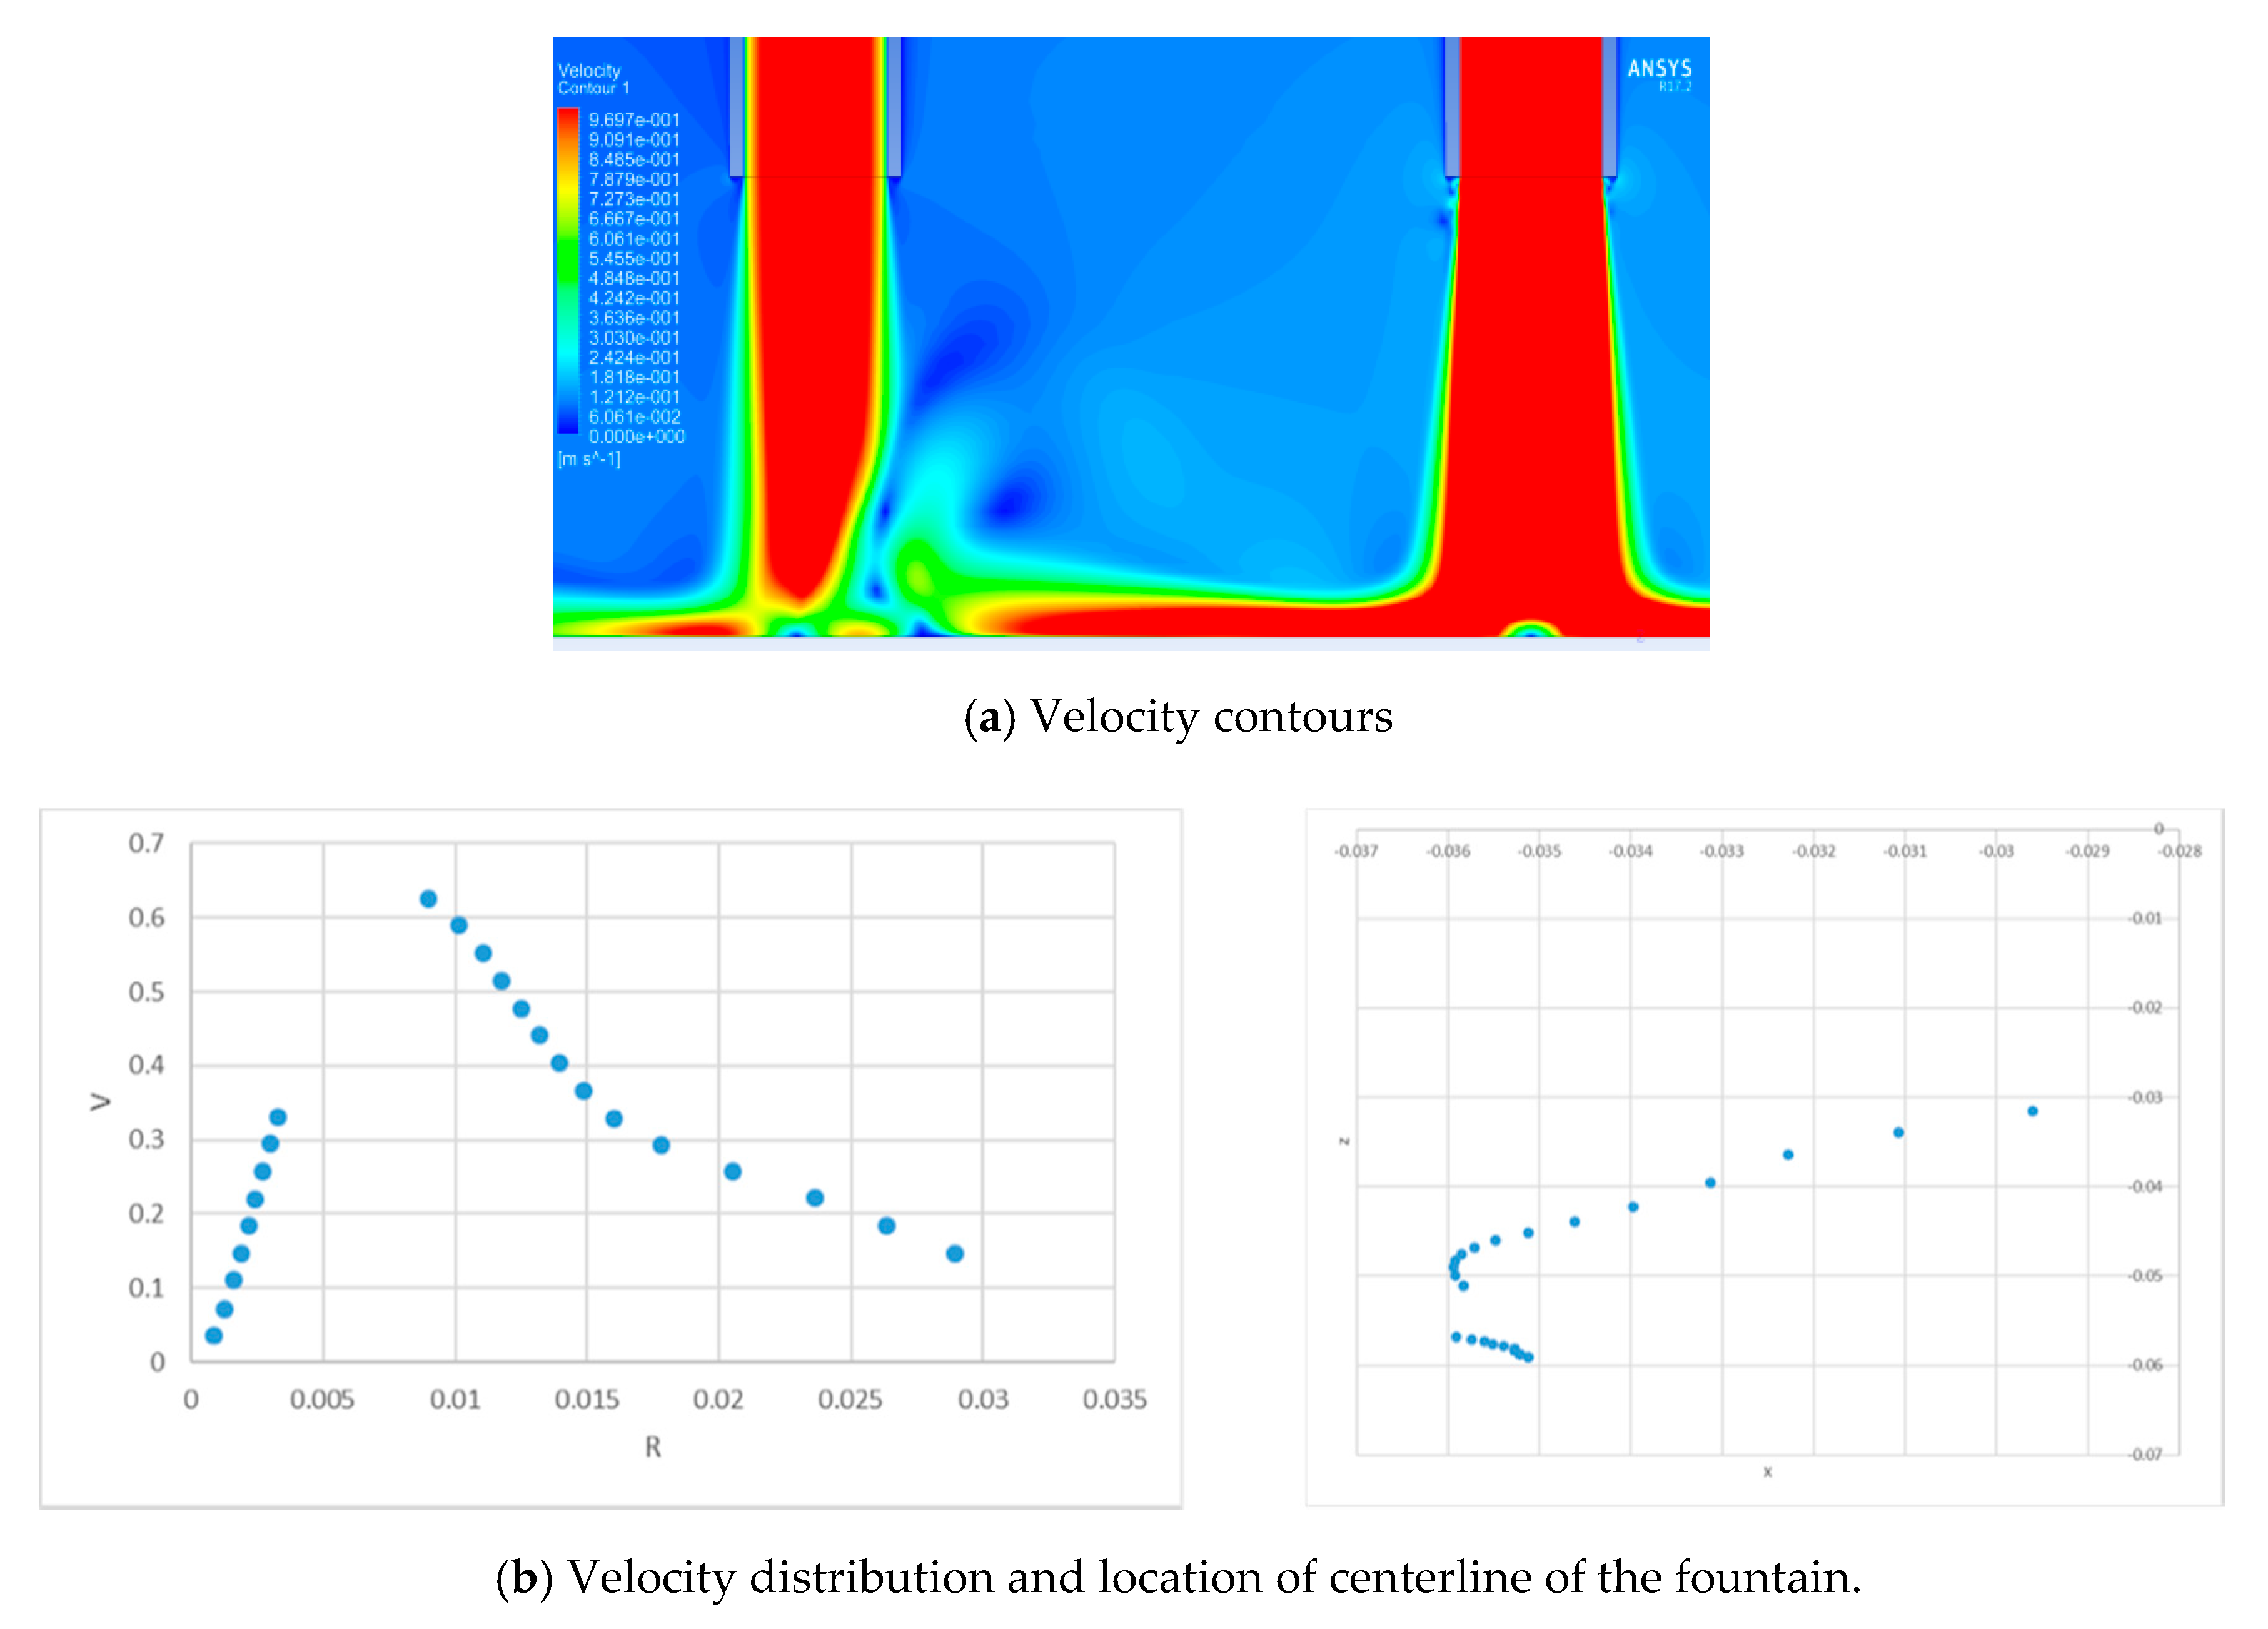
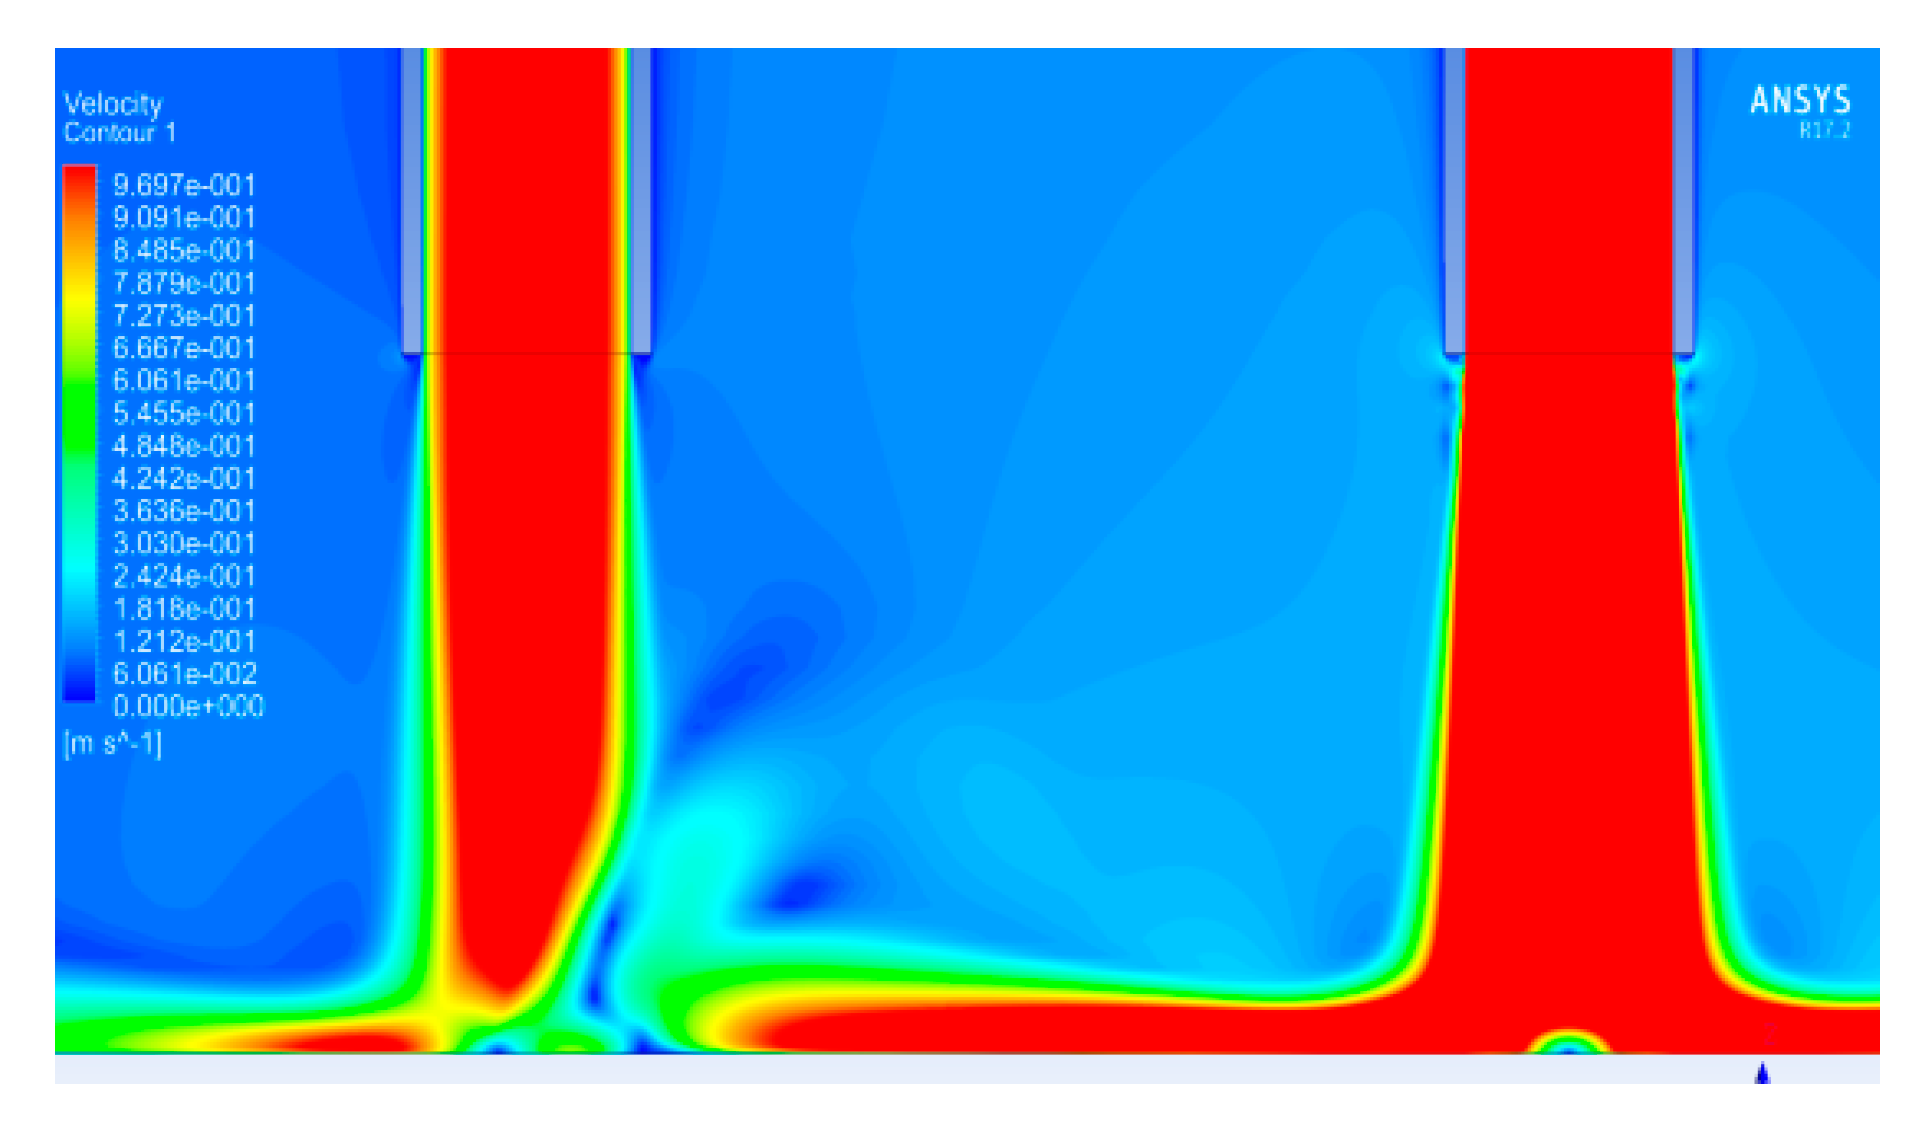
From part A above, it can be seen that differences in Reynolds numbers of the two jets lead to the formation of a fountain that moves and curves towards the jet with smaller Reynolds number. In this case, the character of the fountain is highly influenced by the ratio of the Reynolds numbers, RRe, at jet inlets. The inlet velocity of the right jet is changed to achieve different ratios of Reynolds numbers, while the inlet velocity of left jet is fixed at 1 m/s (Re = 2 × 10⁴). Distance between the two jets is fixed at 5D. Figure 21, Figure 22, Figure 23, Figure 24, Figure 25, Figure 26, Figure 27, Figure 28 and Figure 29 show velocity contours of inclined fountain for various ratios of Reynolds numbers for velocities between 0 and 1 m/s. By connecting the upper and lower boundary of the velocity contour, the formed lines display similar velocity distribution at the centerline of the straight fountain. Therefore, these lines can be treated as centerlines of the inclined fountain. Location and velocity distribution of the centerline of the inclined fountain are also included in Figure 22, Figure 23, Figure 24, Figure 25 and Figure 26. When the ratio of Reynolds numbers becomes larger than 3.3, it becomes very hard to identify the centerline of the inclined fountain. As the ratio of Reynolds numbers increases, the stagnation point of the fountain moves towards the left jet that has smaller Reynolds number than the right jet. As ratio of Reynolds number reaches 3.8, the stagnation point of fountain almost overlaps with that of the left jet impingement. Furthermore, the fountain is also inclined to the same side. However, when the ratio of Reynolds numbers is larger than 2.5, as can be observed in Figure 25, the fountain reflects from the left jet and moves back towards the right jet.
Pressure distribution at the bottom plane when RRe is 3.3 is shown in Figure 30a. Two peak values in the pressure can be seen; the left one corresponds to the stagnation point of the left jet while the right one is the stagnation point of the formed fountain. However, for cases where RRe is 3.8 and 4, the second peak cannot be observed as distinctly as shown in Figure 30b,c.
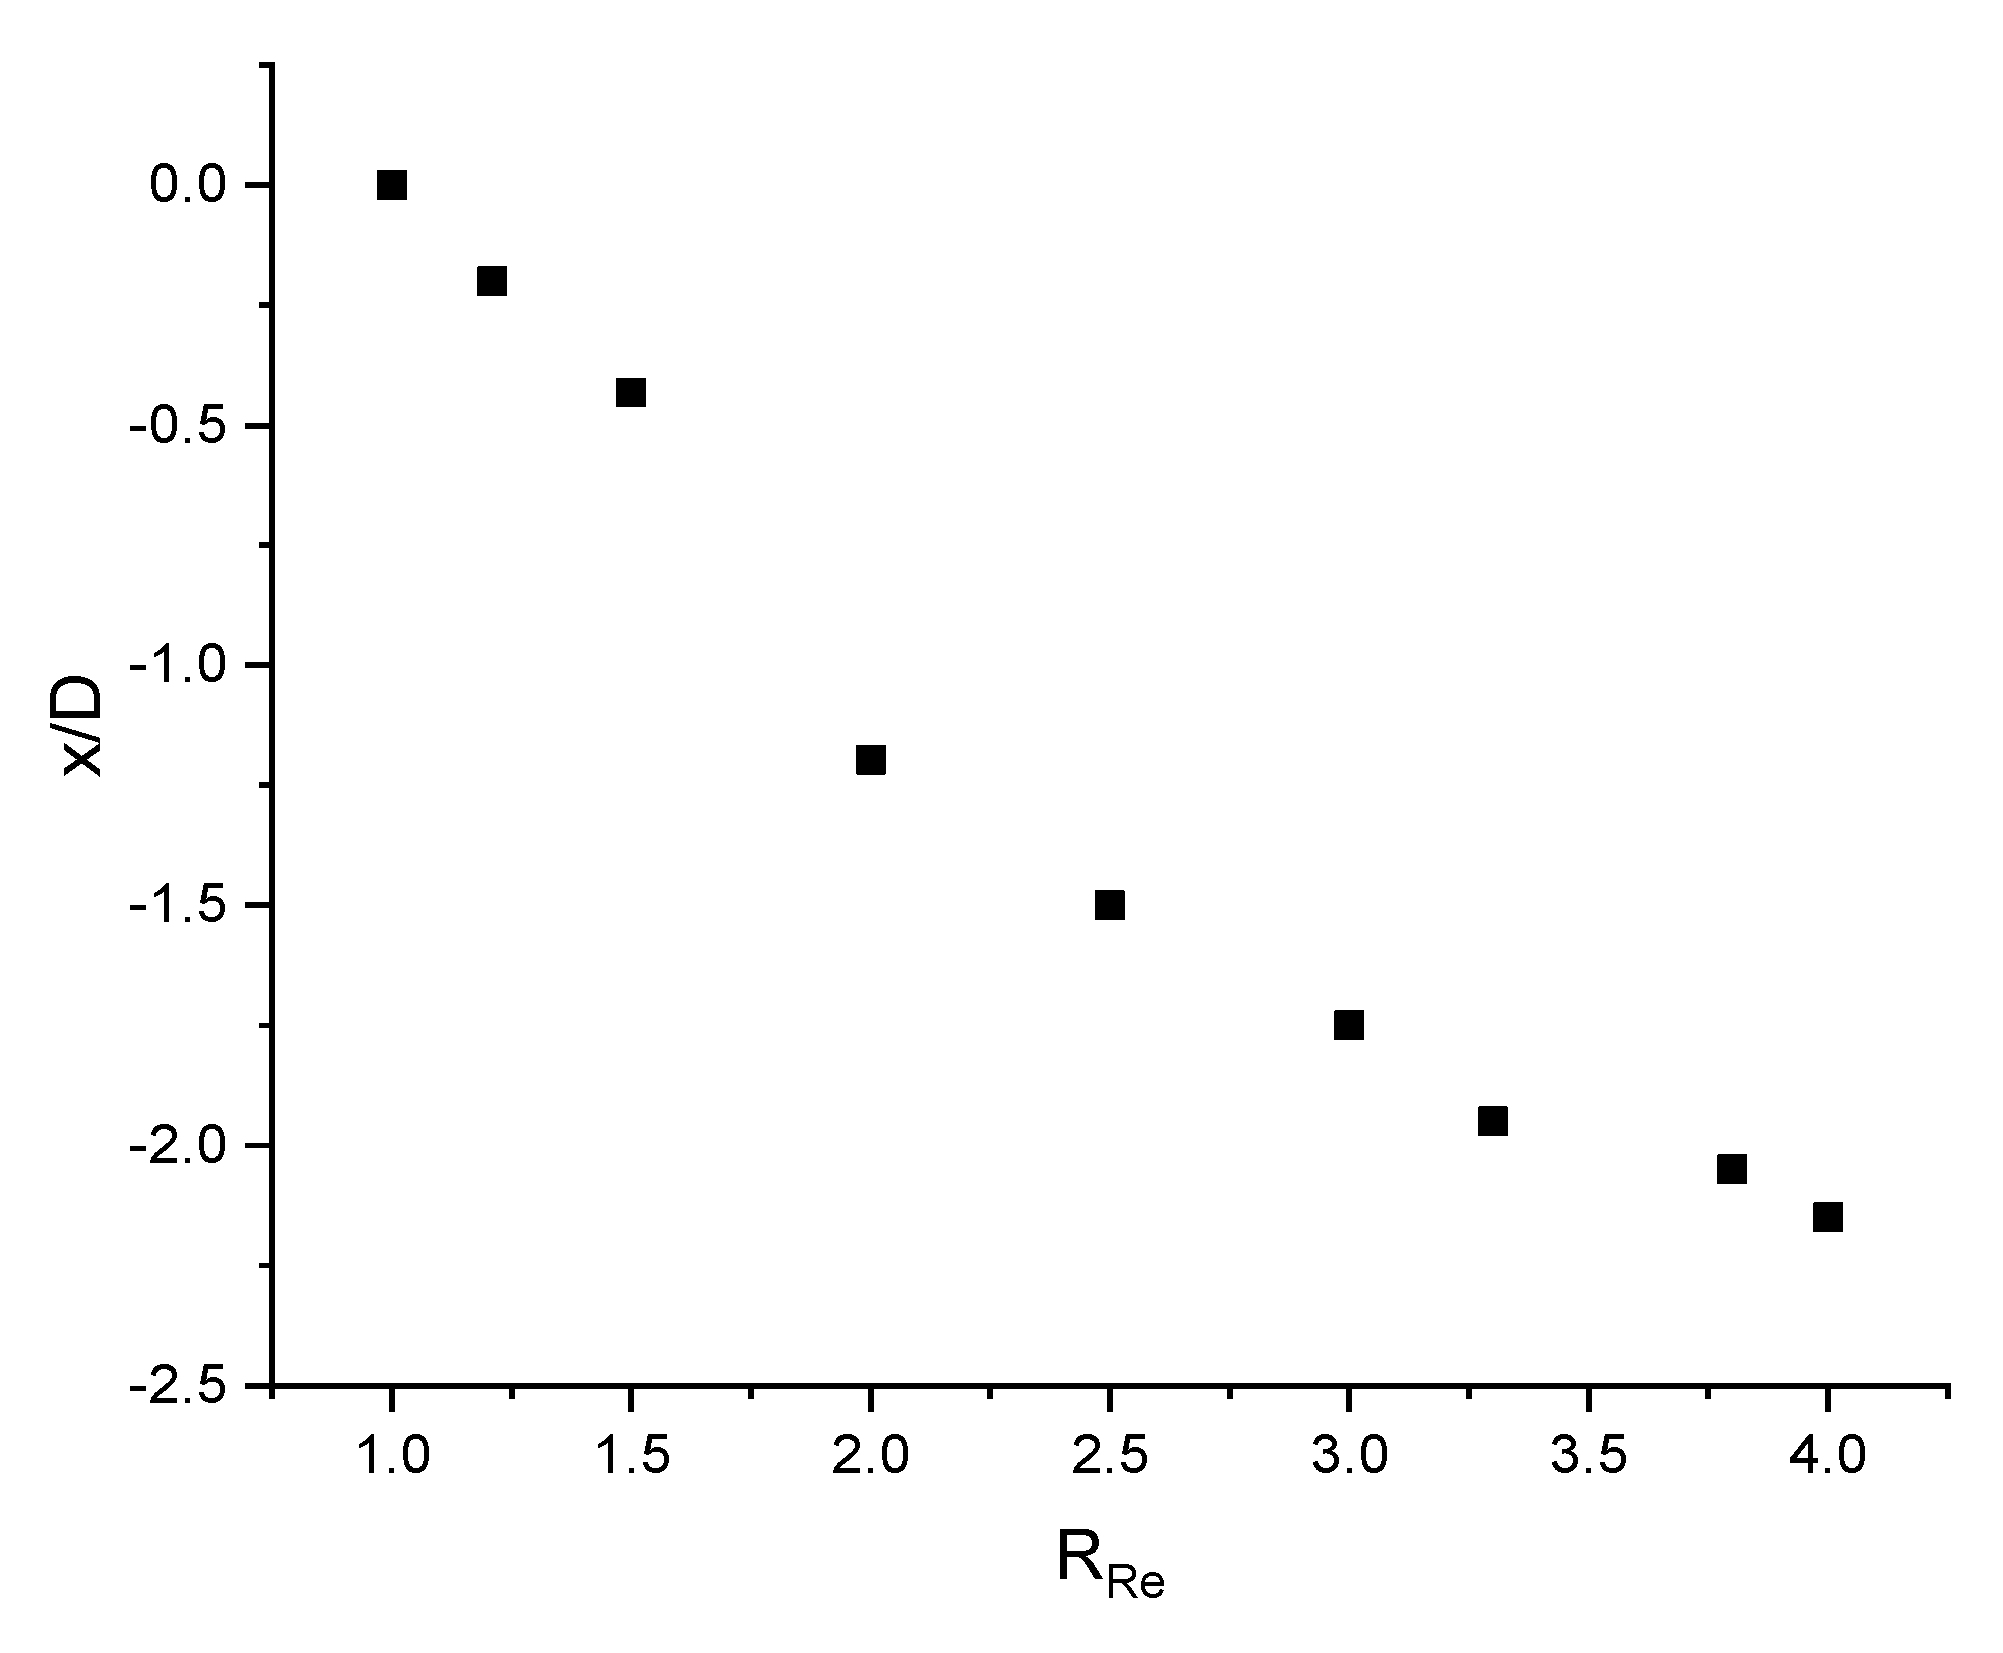
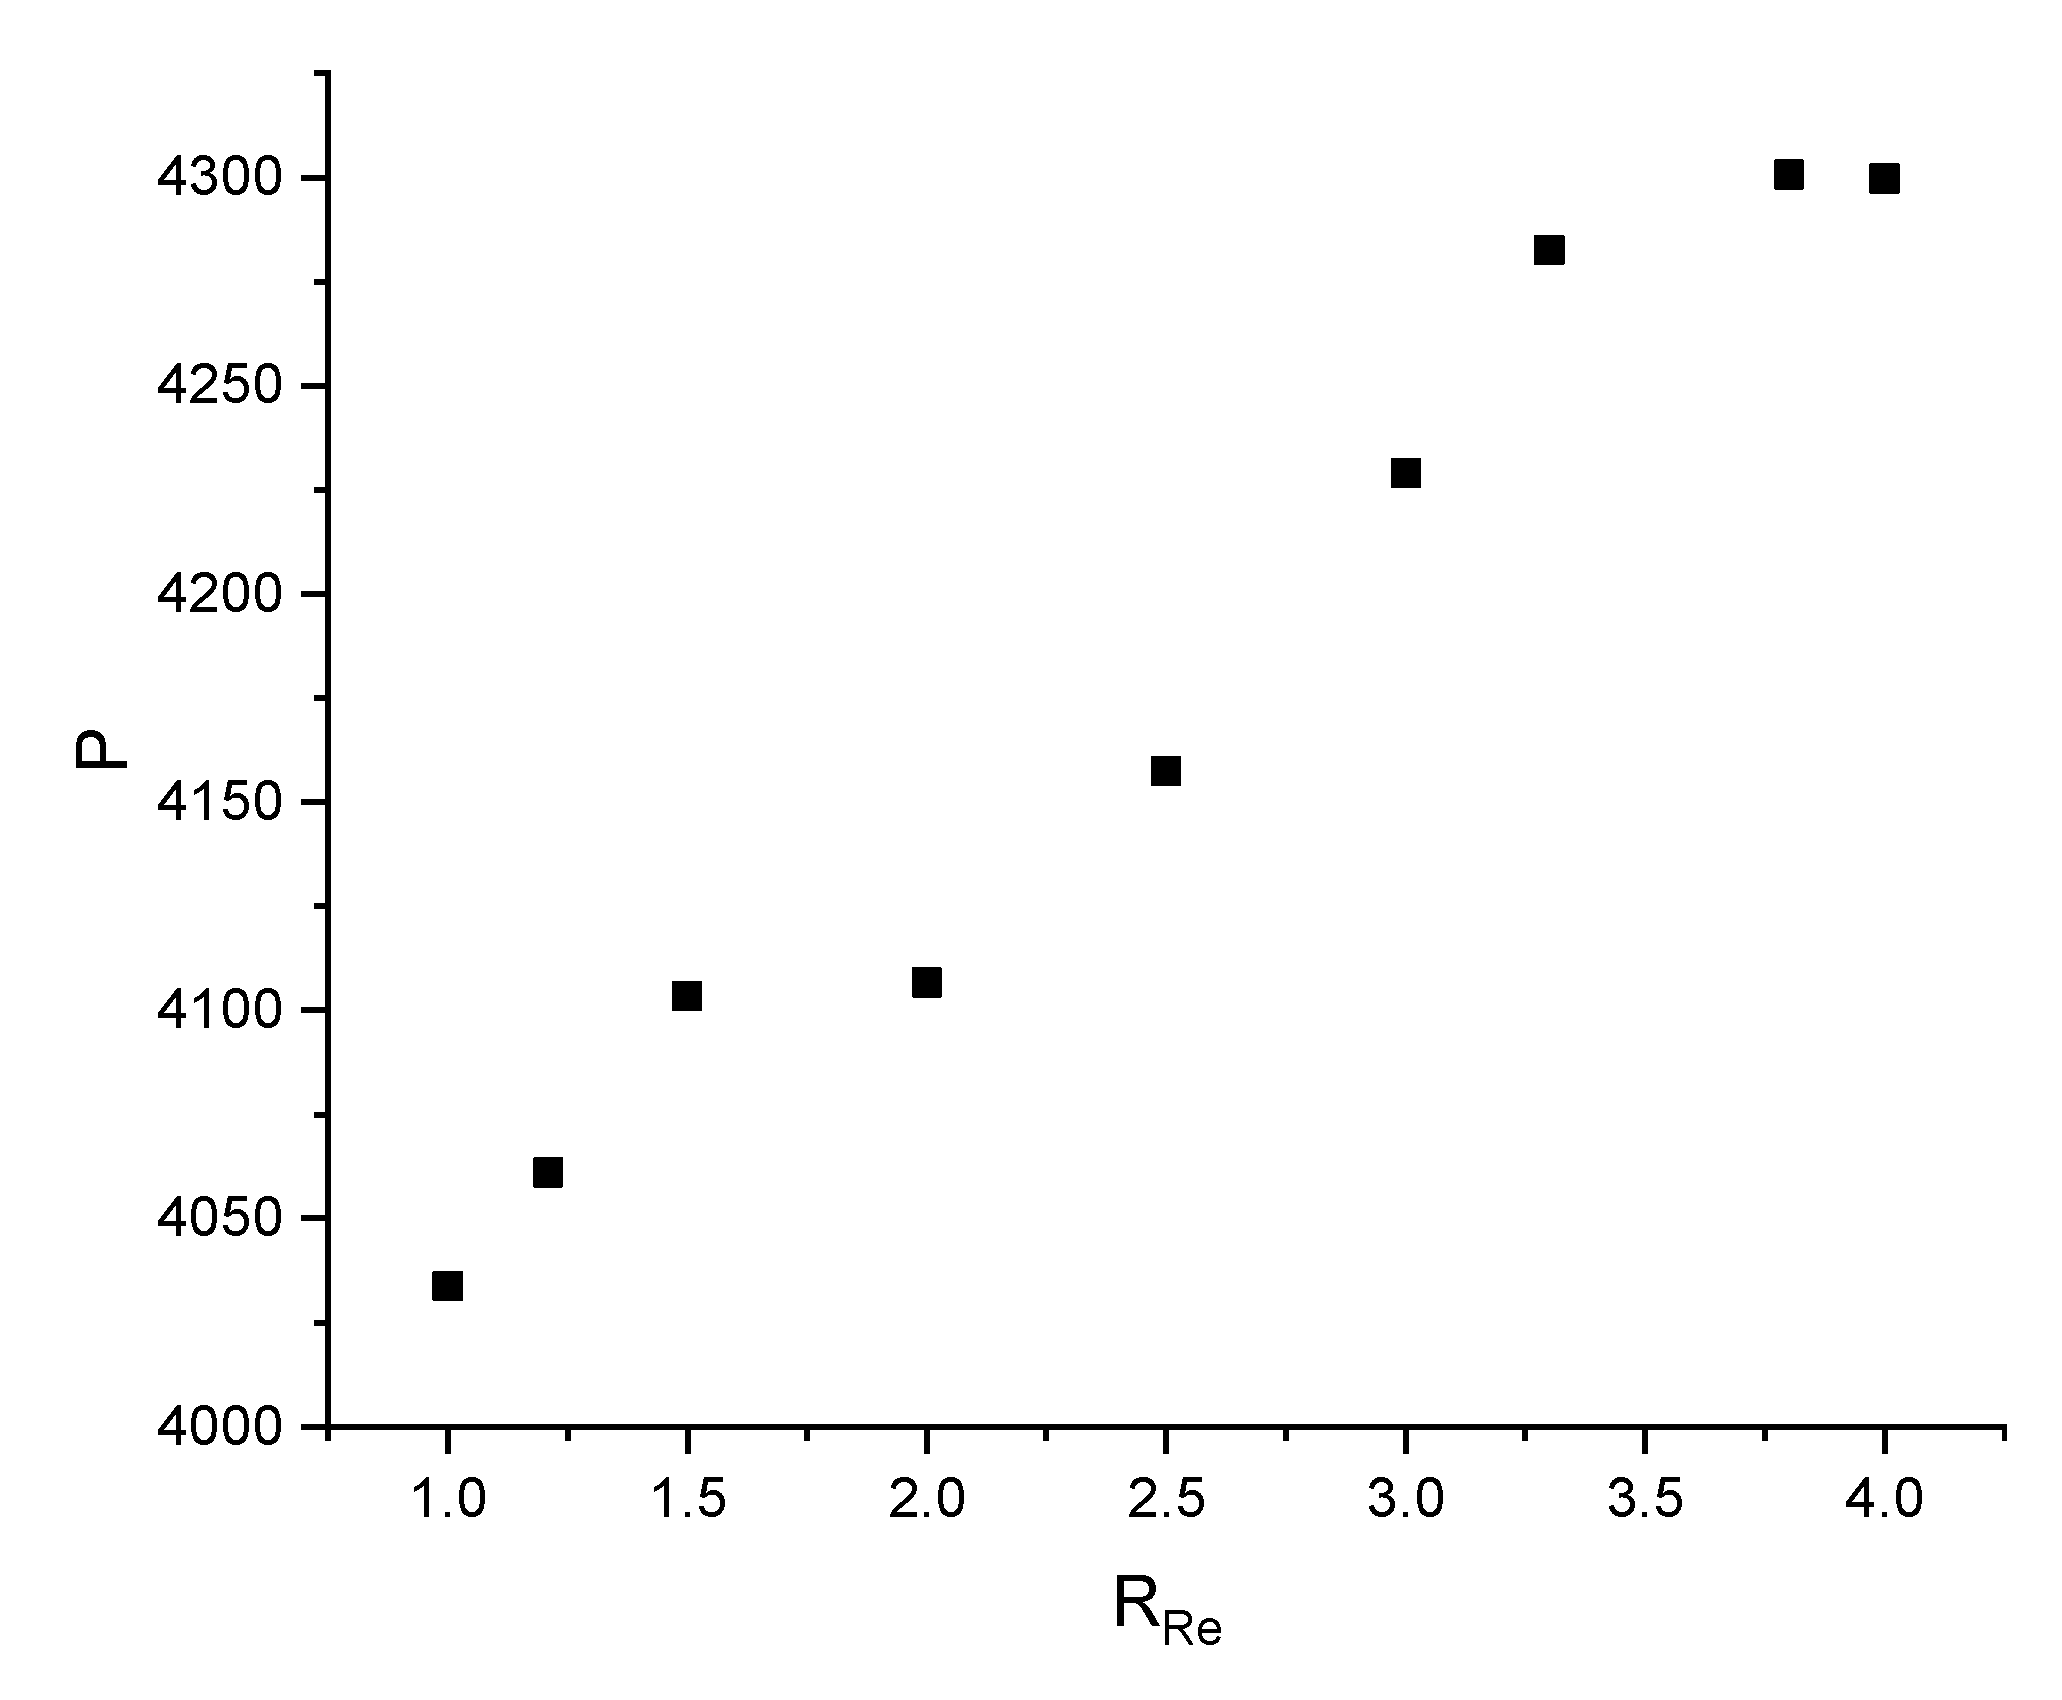
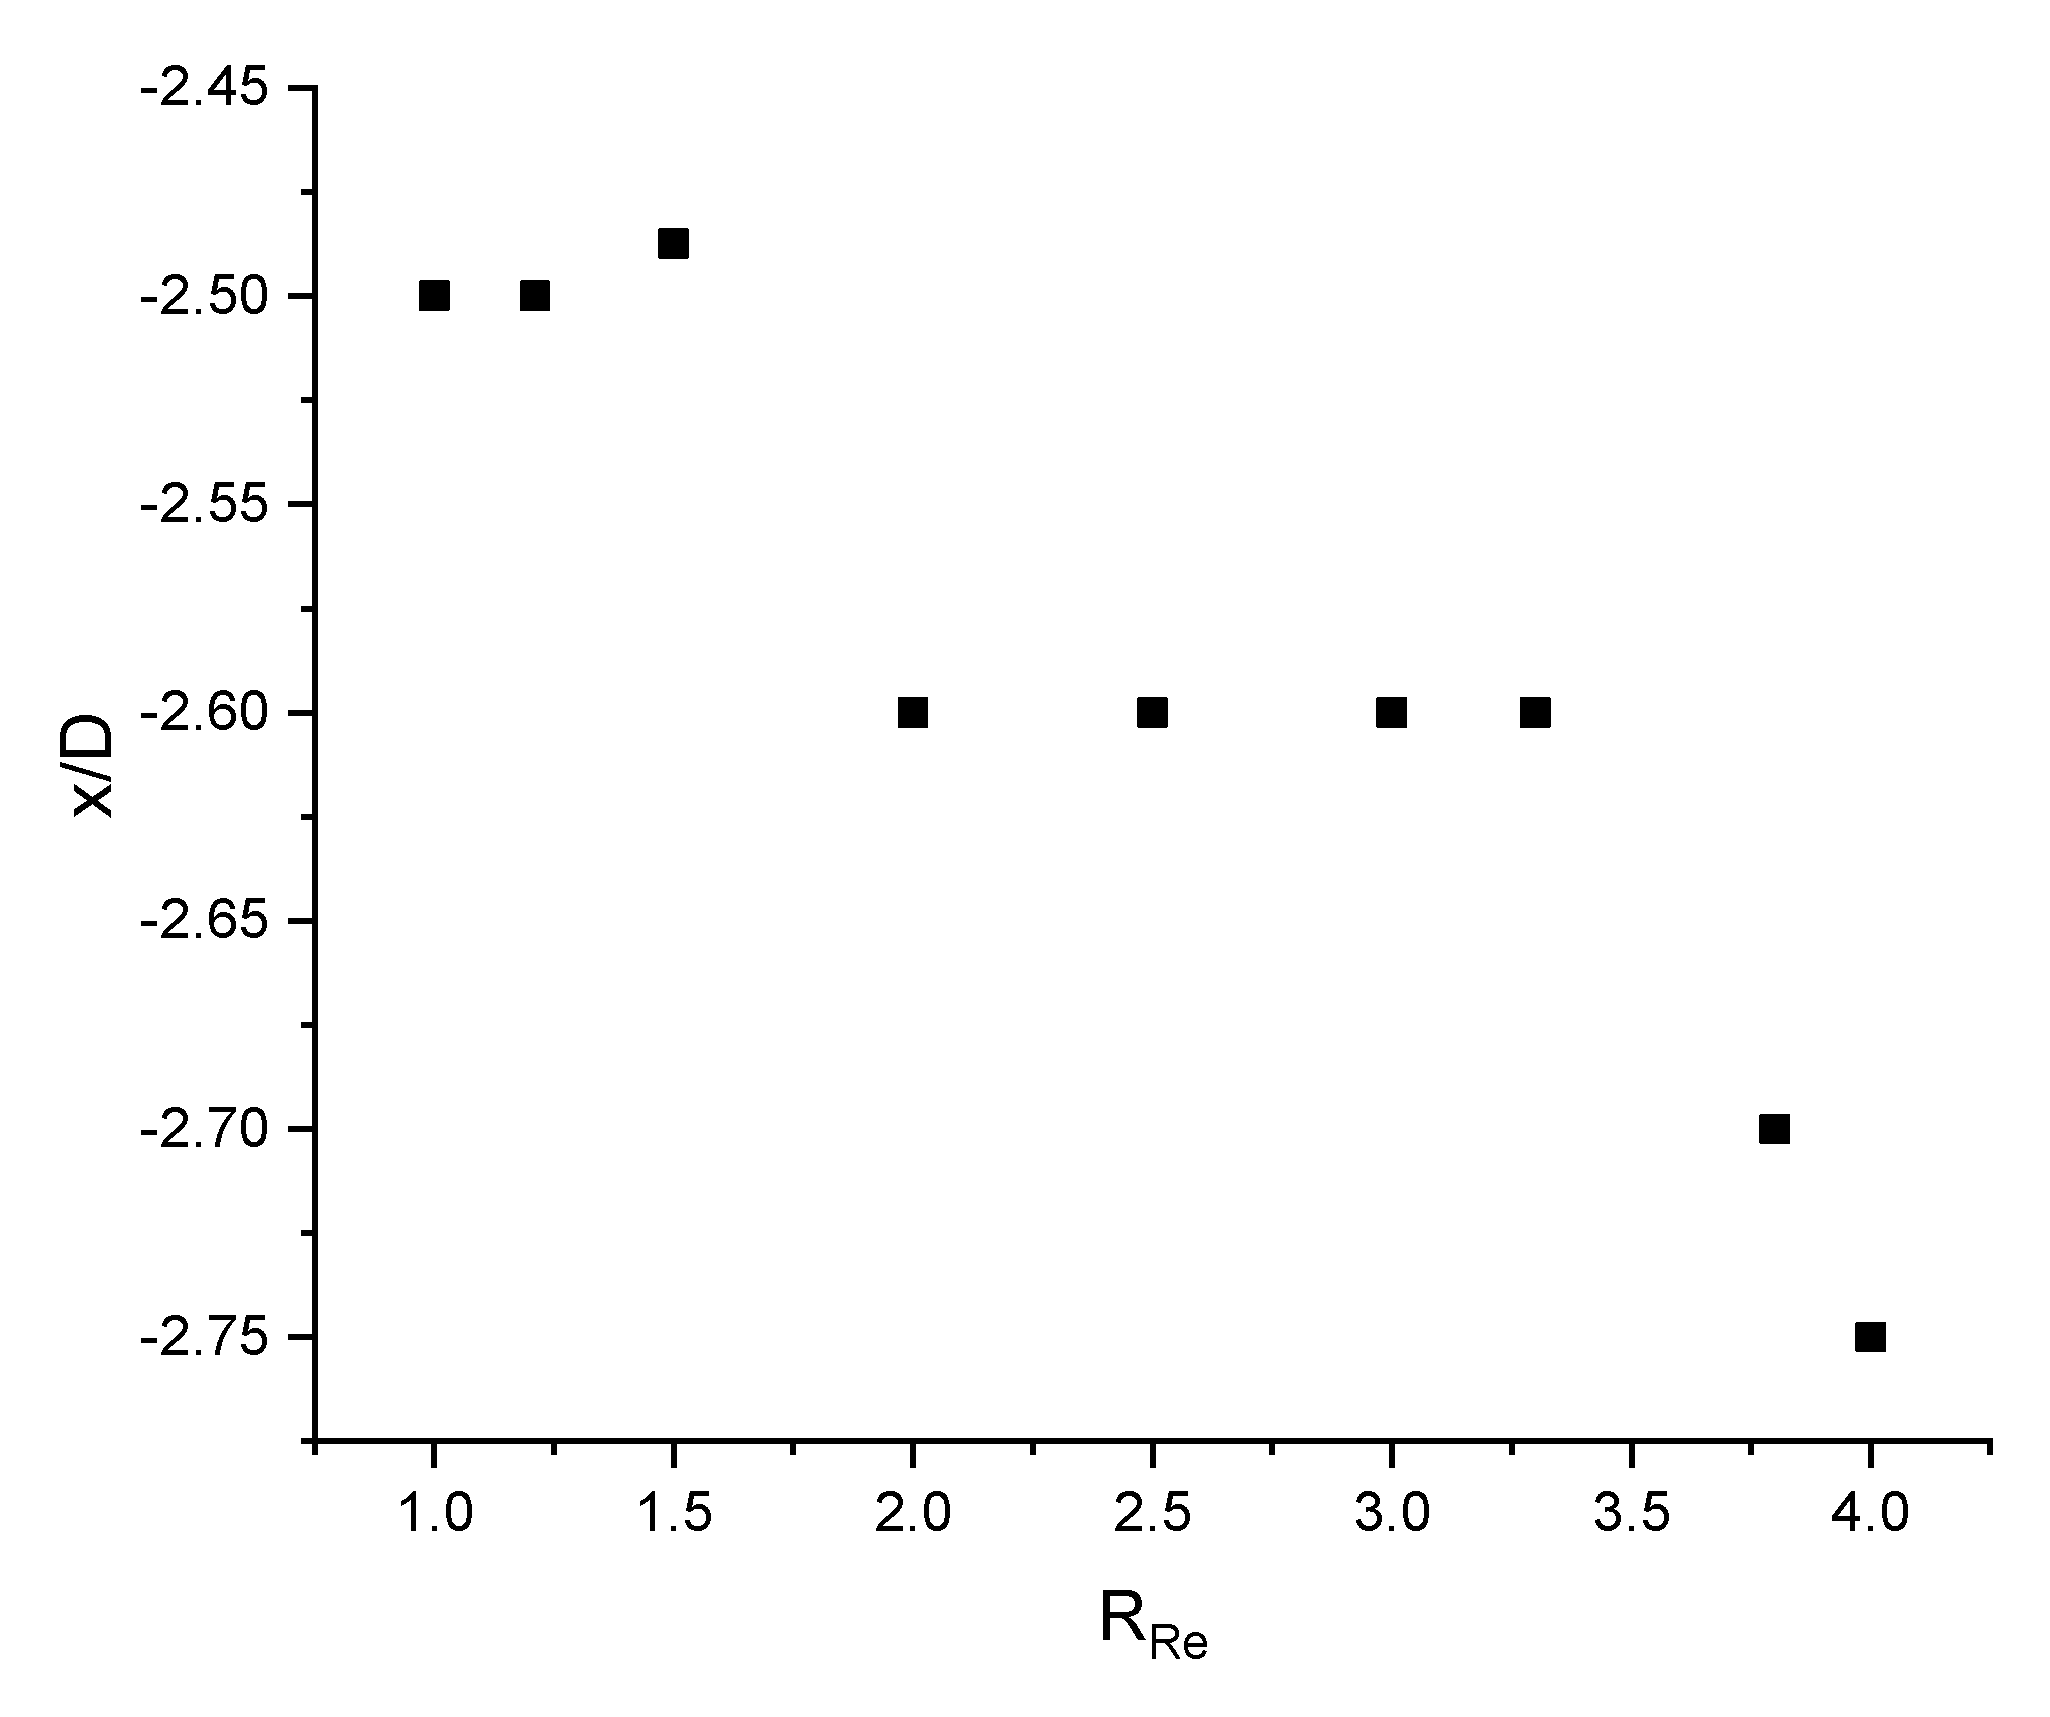
Figure 31 shows the location of stagnation point of the fountain normalized by diameter of jet for various ratios of Reynolds number. When RRe is 1, the fountain is straight upward and the stagnation point is at x/D = 0, right in the middle of the two jets as expected. As RRe increases, the stagnation point of the fountain approaches x/D = −2.5, which is the centerline of the left jet. In addition, for RRe > 3.3, the movement of the stagnation point decreases greatly. Figure 32 shows the static pressure at stagnation points. Similarly, before RRe reaches 3.3, pressure at the stagnation point increases more rapidly compared to that when RRe increases beyond 3.3 when it changes more slowly, and pressure at the stagnation point approaches 4300Pa where 3916 Pa is generated by water due to gravity acceleration.
Figure 33 shows the displacement of the stagnation point of the left jet for different values of RRe Displacement of the stagnation point of left jet for RRe > 3.3 is much faster than for RRe < 3.3. Figure 34 shows the static pressure at the stagnation point. Similarly, for RRe > 3.3, the pressure at the stagnation point of the left jet decreases significantly. This phenomenon could be the result of a strong wall jet produced by the right jet when RRe > 3.3. The vertical velocity component of the wall jet from the right side prevents the left jet from impinging on the bottom plate. Therefore, delayed impingent of the left jet reduces pressure at the stagnation point of the left jet.

3.5. Fountain Formed by Inclined Jets

The discussion in the sections above has been for the fountain formed by twin-jets normal to impingement surface. However, in many applications, jets are inclined from the normal position. This section describes the simulations and analyzes how the flow properties of the fountain would be affected by impingement angles of the two jets. The two jets are symmetric about the centerline with identical diameter, inlet velocity and inclination angle. When building the geometry, both pipes are rotated towards the origin point while O1 points (see Figure 1c) of two pipes are fixed, which means that the left pipe rotates counterclockwise and the right pipe rotates clockwise. The distance between the two jets, from O1 point on left side to that on right side, is 5D. The impingement height is 3D. Inlet velocity is 1 m/s. Figure 35 shows the velocity contour when impinging angles are 60, 75 and 90 degrees.
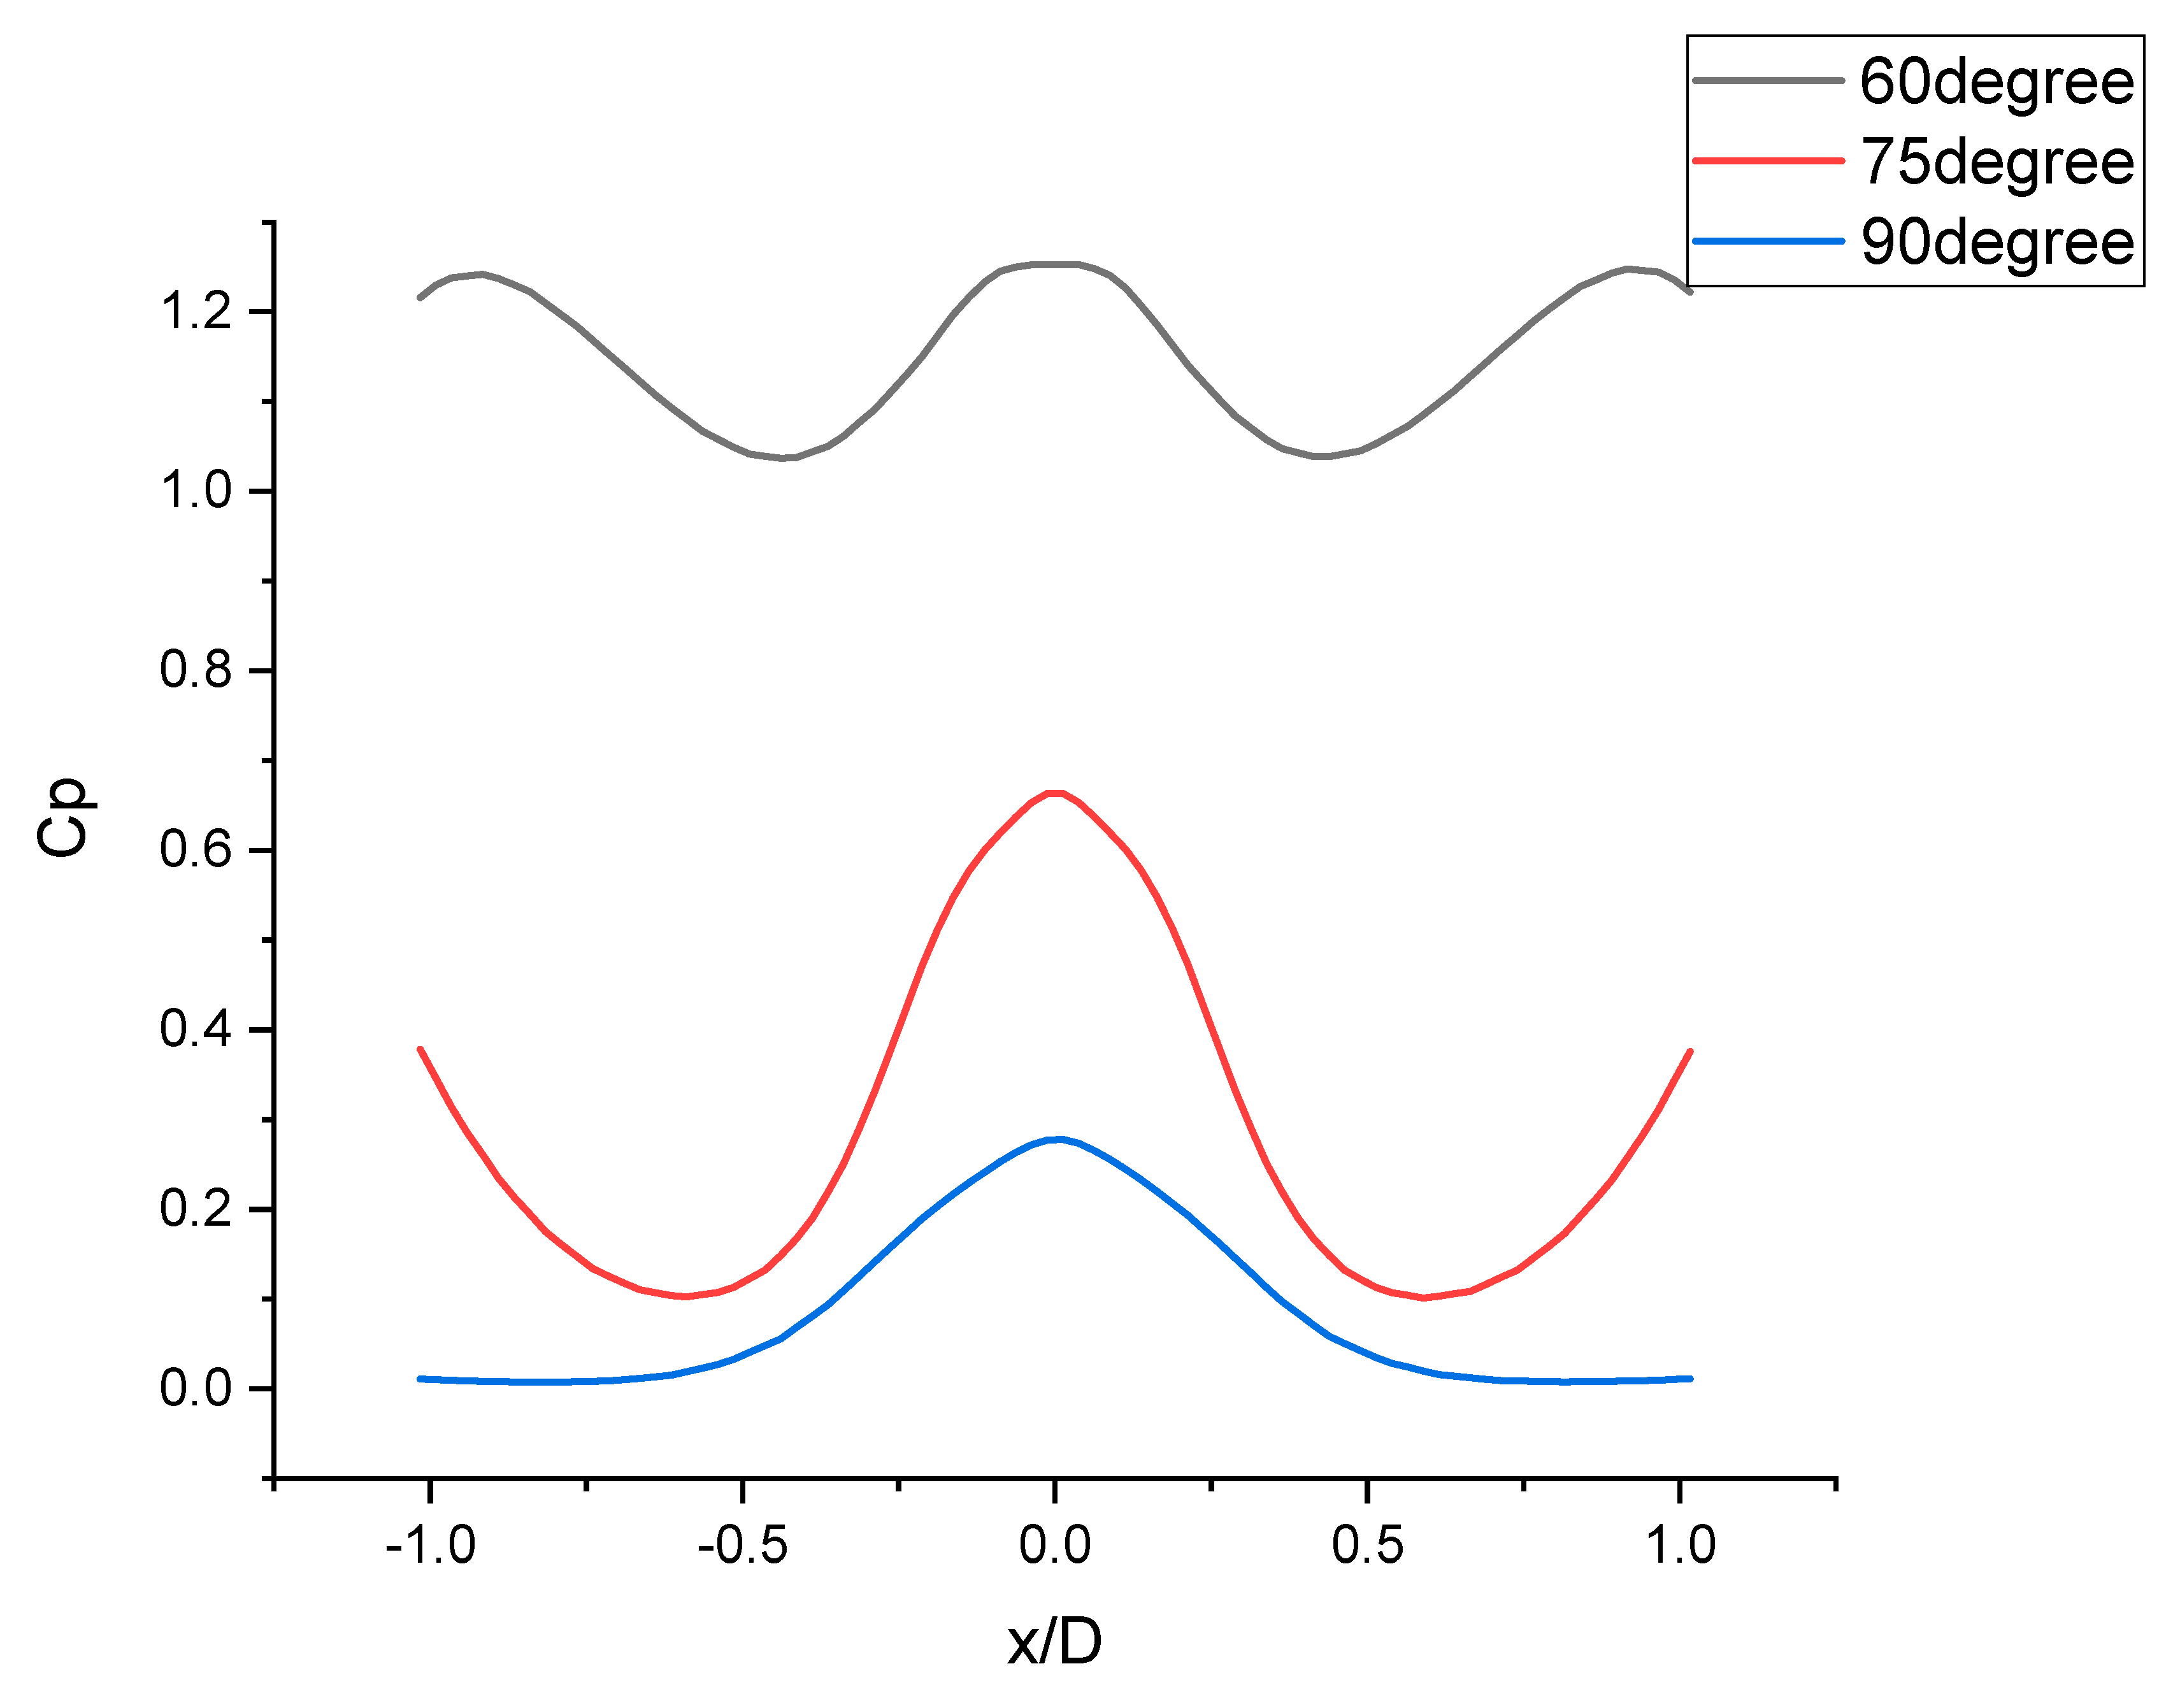
Figure 36 shows the distribution of the pressure coefficient at various impingement angles in the region close to the fountain center. As the jets get inclined further from normal position, the pressure coefficient in this region becomes much higher. This phenomenon is mainly led by two factors. If the impinging jet is inclined from its normal position to the ground, the wall jet on two sides will be asymmetric. Wall jet of one side is stronger than that of the other side. Such a difference becomes larger when impingement angle becomes smaller since the jet is further away from normal or symmetric position. In these cases, fountains are formed by wall jets of stronger side and are thus of greater strength as impingement angle becomes smaller. Besides, rotation of pipe while fixing O1 point leads to an impinging center of two jets or O2 point (see Figure 1c) getting closer. Thus, the distance of the initial location of wall jets from two impinging jets is smaller than the distance of two jets, which increases the strength of the fountain.
Figure 37a–c shows velocity profiles at various heights above the ground when the impingement angles are 60, 75 and 90 degrees. There are significant differences in the velocity profiles due to inclination angle of the jets. All velocity profiles in the region near the formation of the fountain exhibit a similar behavior. Lines of h = 0.2D have a local minimum point at x/D = 0, while velocities at other heights have a local maximum point at x/D = 0. Besides, velocities at h = 0.5D have the largest local maximum at x/D = 0. As height becomes larger than 0.5D, the local maximum of velocity becomes smaller and plotted lines reach their local maximum point with a smaller slope.
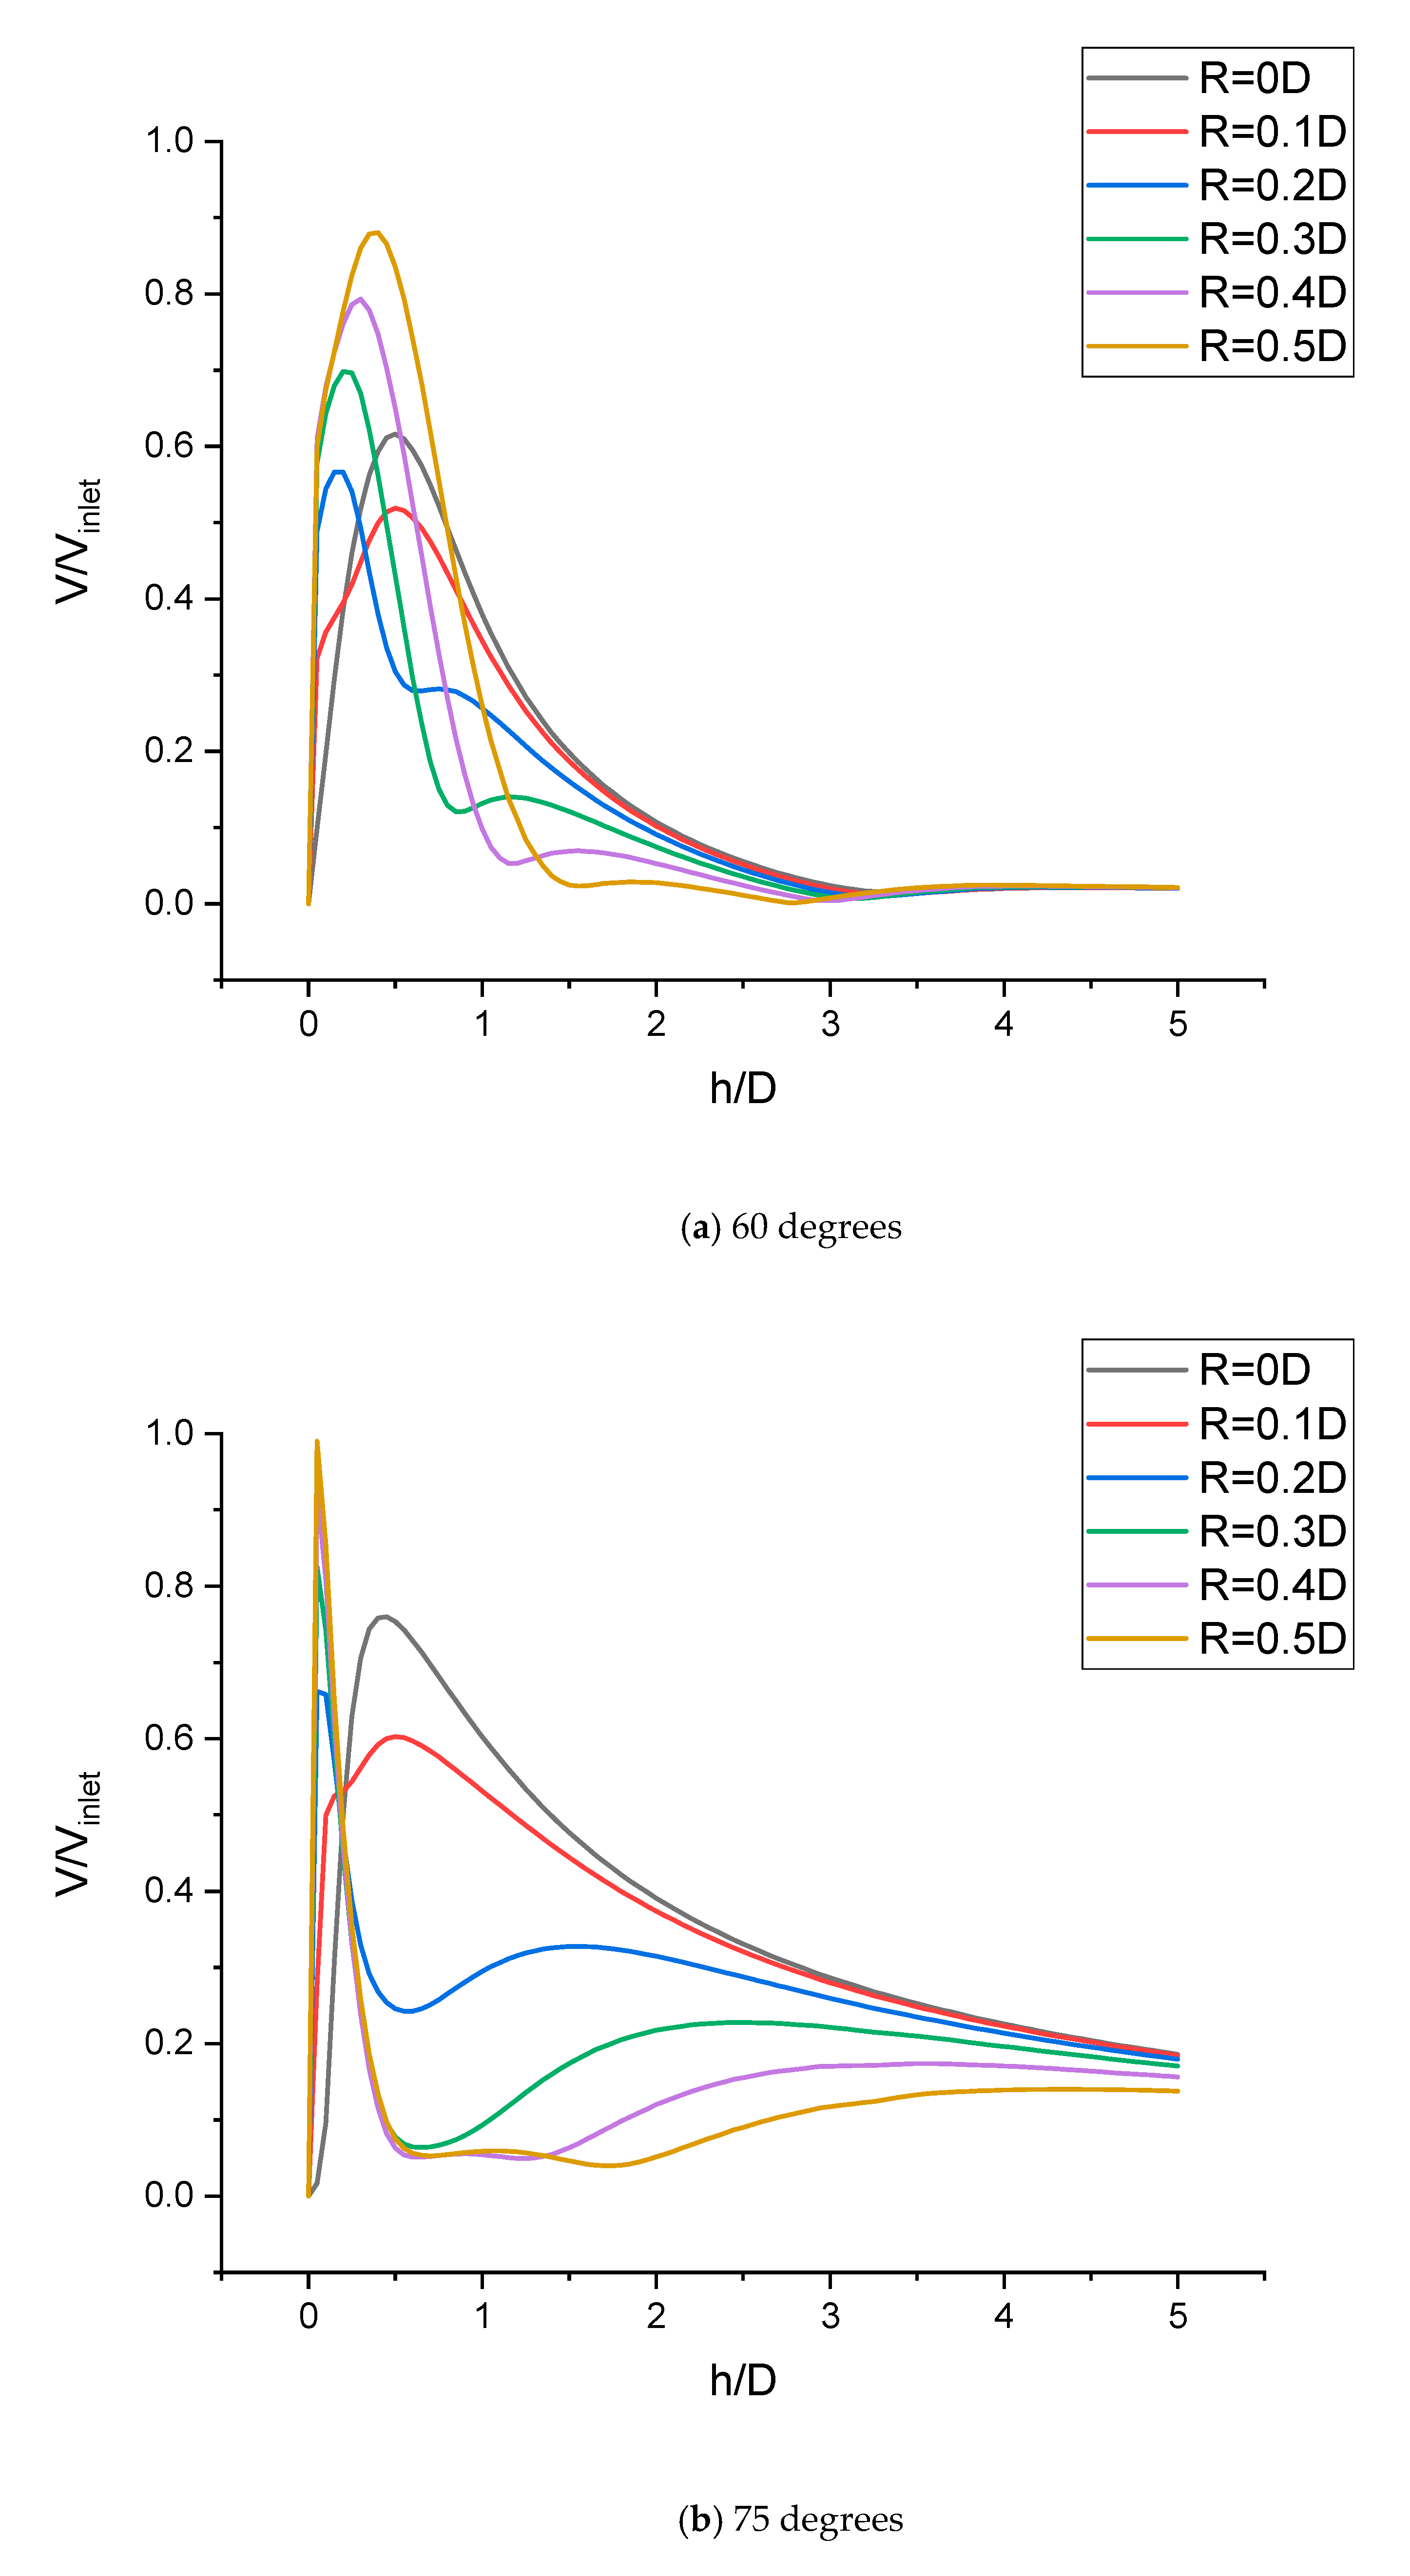
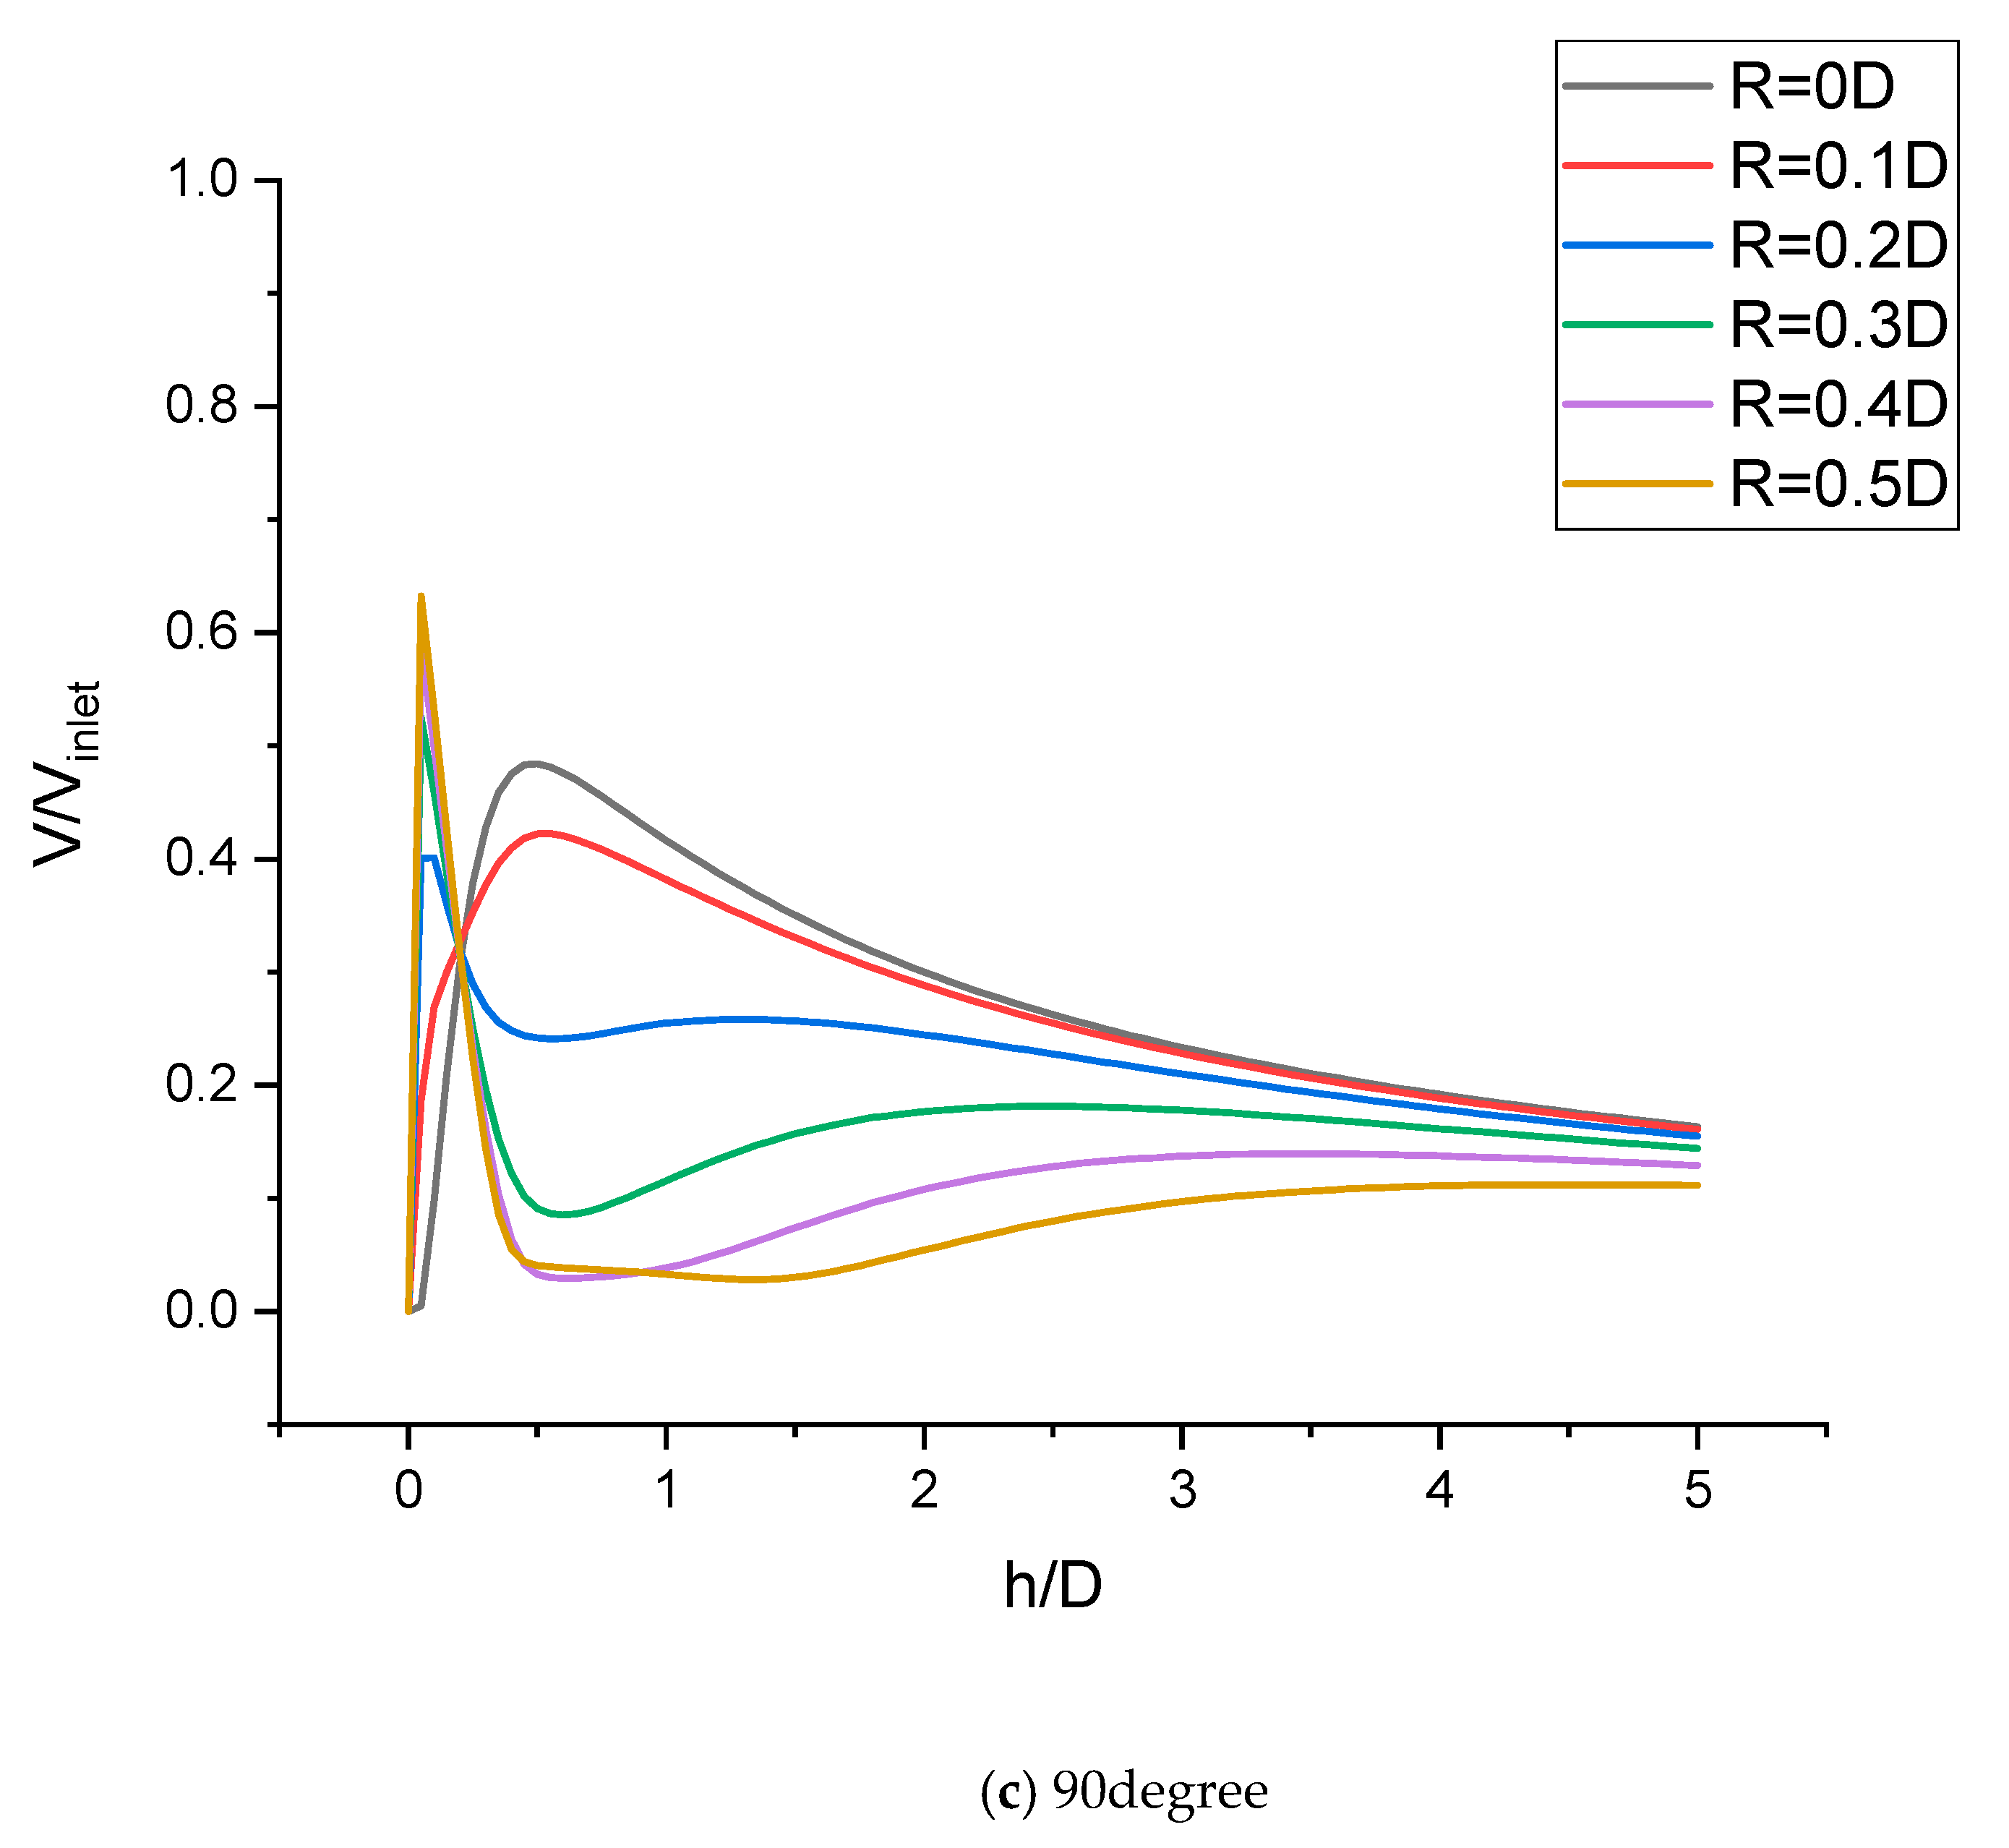
Figure 38a–c shows the velocity profiles at different radial distances from the centerline of the fountain. In all three figures, the velocity lines have a point of maximum velocity. When R is 0.1D or less, maximum velocity occurs at larger h/D, while when radial distance is larger than 0.1D, maximum velocity occurs at smaller h/D very close to the ground. Also, when R is greater than 0.1D, peak velocity increases as R becomes larger. However, there are some differences among the three cases. Looking at the velocity plot of R = 0.1D, there are two stages in slope before reaching the peak point. The slope of the first stage is always greater than that of the second stage. However, the slope of the first stage is largest at the impingement angle of 60 degree and is the smallest at normal impingement. Cases of 75 and 90 degree impingement angles show similar behavior. However, in the 60 degree impingement case, the velocity plot when R is greater than 0.1D is different from the cases of 75 and 90 degree impingement angle; the velocity plot of R = 0.1D shows two stages of slope before the peak point. The peak velocities in cases of 75 and 90 degree impingement angles are at similar positions and are very close to the ground, while in the case of the 60 degree impingement angle, peak occurs at different h/D.

4. Conclusions

Based on the results presented in this paper, the following conclusions can be drawn:
1
Numerical results from both k-ε and Wray-Agarwal turbulence model show good agreement with experimental data for single jet impingement.
2
For the fountain formed by two round jets, if Reynolds number of the two jets at the inlet is identical and exits of jets are located at same horizontal level, the fountain formed in this condition is straight and upwards.
3
Pressure at the fountain center is highly sensitive to the inlet Reynolds number of the jets when distance between the jets S, is small. However, the pressure coefficient is much less sensitive to inlet Reynolds number than pressure in Pascal.
4
Straight fountain exhibits different velocity profiles in regions at different radial distances. Fountain flow has larger acceleration near the bottom plane when radial distance x/D > 0.5 compared to when x/D < 0.5.
5
When inlet Reynolds number of jets are different, the fountain formed by the two jets moves to the side of the jet with smaller inlet Reynolds number and stagnation point of the fountain also moving along the same direction. As the ratio of Reynolds number increases, the fountain reflects back to the jet with larger inlet Reynolds number and the stagnation point of the fountain tends to merge with the stagnation point of the left jet that has smaller inlet Reynolds number. Meanwhile, strong wall jet from the right side has a negative influence on impingement of the left jet.
6
Change in impinging angle of the jets significantly changes the behavior of the fountain because of the change in strength and location of the wall jets.

Author Contributions

R.K.A. conceived, formulated, provided technical guidance and administered the project. X.Z. performed the computations and wrote the paper which was reviewed and edited by R.K.A. All authors have read and agreed to the published version of the manuscript.

Funding

This research received no external funding.

Conflicts of Interest

The authors declare no conflict of interest.

Nomenclature

C p Pressure coefficient
Ddiameter of water jet
Hvertical distance from impingement plane
SDistance between the centerlines of two jets
ReReynolds number based on the diameter of the pipe
y + dimensionless wall distance of first grid layer
Pstatic pressure
P r e f reference pressure
ρ density of water
Vinletvelocity at jet inlet

References

  1. Weigand, B.; Spring, S. Multiple jet impingement—A review. Heat Transf. Res. 2011, 42, 101–142. [Google Scholar] [CrossRef]
  2. Dewan, A.; Dutta, R.; Srinivasan, B. Recent trends in computation of turbulent jet impingement heat transfer. Heat Transf. Eng. 2012, 33, 447–460. [Google Scholar] [CrossRef]
  3. Ostheimer, D.; Yang, Z. A CFD Study of Twin Impinging Jets in a Cross-Flow. Open Numer. Methods J. 2012, 4, 24–34. [Google Scholar] [CrossRef] [Green Version]
  4. Saripalli, K.R. Visualization of Multi-Jet Impingement Flow. AIAA J. 1983, 21, 483–484. [Google Scholar] [CrossRef]
  5. Ozmen, Y. Confined impinging twin air jets at high reynolds numbers. Exp. Therm. Fluid Sci. 2011, 35, 355–363. [Google Scholar] [CrossRef]
  6. Barata, J.M.; Durao, D.F.G.; Heitor, M.V.; McGuirk, J. Impingement of single and twin turbulent jets through a crossflow. AIAA J. 1991, 29, 595–602. [Google Scholar] [CrossRef]
  7. Greco, C.S.; Ianiro, A.; Astarita, T.; Cardone, G. On the near field of single and twin circular synthetic air jets. Int. J. Heat Fluid Flow 2013, 44, 41–52. [Google Scholar] [CrossRef]
  8. Abdel–Fattah, A. Numerical and experimental study of turbulent impinging twin-jet flow. Exp. Therm. Fluid Sci. 2007, 31, 1061–1072. [Google Scholar] [CrossRef]
  9. Wang, C.; Wang, X.; Shi, W.; Lu, W.; Tan, S.K.; Zhou, L. Experimental investigation on impingement of a submerged circular water jet at varying impinging angles and Reynolds numbers. Exp. Therm. Fluid Sci. 2017, 89, 189–198. [Google Scholar] [CrossRef]
  10. Taghinia, J.; Rahman, M.M.; Siikonen, T. Numerical investigation of twin–Jet impingement with hybrid–type turbulence modeling. Appl. Therm. Eng. 2014, 73, 648–657. [Google Scholar] [CrossRef]
  11. Attalla, M.; Maghrabie, H.M.; Specht, E. Effect of inclination angle of a pair of air jets on heat transfer into the flat surface. Exp. Therm. Fluid Sci. 2017, 85, 85–94. [Google Scholar] [CrossRef]
  12. Sharif, M.A.R. Heat transfer from an isothermally heated flat surface due to twin oblique slot-jet impingement. Procedia Eng. 2013, 56, 544–550. [Google Scholar] [CrossRef] [Green Version]
  13. Faris, A.M.; Zulkifli, R.; Harun, Z.; Abdullah, S.; Wan Ghopa, W.A. Experimental and numerical simulation of the heat transfer enhancement on the twin impingement jet mechanism. Energies 2018, 11, 927. [Google Scholar] [CrossRef] [Green Version]
  14. Shih, T.-H.; Liou, W.W.; Shabbir, A.; Yang, Z.; Zhu, J. A new k-ϵ eddy viscosity model for high Reynolds number turbulent flows. Comput. Fluids 1995, 24, 227–238. [Google Scholar] [CrossRef]
  15. Han, X.; Wray, T.J.; Agarwal, R.K. Application of a new DES model based on Wray-Agarwal turbulence model for simulation of wall-bounded flows with separation. In Proceedings of the 47th AIAA Fluid Dynamics Conference, Denver, CO, USA, 5–9 June 2017; AAIA: Reston, VA, USA, 2017; p. AIAA2017-3966. [Google Scholar]
  16. Turbulence Modeling Resource. Available online: https://www.turbmodels.larc.nasa.gov/wray_agarwal.html (accessed on 22 September 2019).
  17. Wray Agarwal Models. Available online: https://www.github.com/xuhanwustl/WrayAgarwalModels (accessed on 14 August 2019).
Figure 1. (a) Physical model and 3D computational domain, (b) Cross section of physical model, (c) Schematic of submerged impinging jet.
Fluids 05 00132 g001aFluids 05 00132 g001b
Figure 2. Structured grid in the computational domain.
Fluids 05 00132 g002
Figure 3. Pre-mesh grid quality distribution.
Fluids 05 00132 g003
Figure 4. Velocity profile after exit from pipe.
Fluids 05 00132 g004
Figure 5. Velocity profiles along the centerline after jet exit.
Fluids 05 00132 g005
Figure 6. Velocity along the jet centerline.
Fluids 05 00132 g006
Figure 7. Normalized velocities along lines parallel to centerline at different radial distances from jet.
Fluids 05 00132 g007
Figure 8. Normalized maximum velocity at various radical distances.
Fluids 05 00132 g008
Figure 9. Velocity contours and velocity vectors.
Fluids 05 00132 g009
Figure 10. Pressure coefficient distribution on ground surface.
Fluids 05 00132 g010
Figure 11. y+ distribution (a) at different radial distances from stagnation point (b) in the impingement plane.
Fluids 05 00132 g011
Figure 12. Fountain formed by twin jets with identical mass flow rate.
Fluids 05 00132 g012
Figure 13. Fountain formed by two jets with identical inlet Reynolds number.
Fluids 05 00132 g013
Figure 14. Fountain formed by two identical jets.
Fluids 05 00132 g014
Figure 15. Velocity streamlines in a fountain formed by two jets.
Fluids 05 00132 g015
Figure 16. Normalized vertical velocity distribution for various radial distances, x/D.
Fluids 05 00132 g016
Figure 17. Location and magnitude of maximum velocity at various radial distances, x/D.
Fluids 05 00132 g017
Figure 18. Variation in pressure coefficient at stagnation point of the fountain with jet inlet Reynolds numbers for various cases.
Fluids 05 00132 g018
Figure 19. Location of maximum velocity at centerline of the fountain for various flow conditions.
Fluids 05 00132 g019
Figure 20. Magnitude of maximum velocity at centerline of the fountain at various flow conditions.
Fluids 05 00132 g020
Figure 21. Straight Fountain when RRe = 1.
Fluids 05 00132 g021
Figure 22. Inclined fountain when RRe = 1.2.
Fluids 05 00132 g022
Figure 23. Inclined fountain when RRe = 1.5.
Fluids 05 00132 g023
Figure 24. Inclined fountain when RRe = 2.
Fluids 05 00132 g024
Figure 25. Inclined fountain when RRe = 2.5.
Fluids 05 00132 g025
Figure 26. Inclined fountain when RRe = 3.
Fluids 05 00132 g026
Figure 27. Inclined fountain when RRe = 3.3.
Fluids 05 00132 g027
Figure 28. Inclined fountain when RRe = 3.8.
Fluids 05 00132 g028
Figure 29. Inclined fountain when RRe = 4.
Fluids 05 00132 g029
Figure 30. Pressure distribution at the bottom plane for different RRe.
Fluids 05 00132 g030
Figure 31. Variation in location of stagnation point of the fountain for various RRe.
Fluids 05 00132 g031
Figure 32. Variation in static pressure at stagnation point of fountain with RRe.
Fluids 05 00132 g032
Figure 33. Variation in location of stagnation point of left jet with RRe.
Fluids 05 00132 g033
Figure 34. Variation in pressure at stagnation point of left jet with RRe.
Fluids 05 00132 g034
Figure 35. Velocity contours at various impinging angles.
Fluids 05 00132 g035
Figure 36. Pressure Coefficient on ground at different impingement angles.
Fluids 05 00132 g036
Figure 37. Velocity profiles at different heights from ground surface.
Fluids 05 00132 g037aFluids 05 00132 g037b
Figure 38. Velocity profiles at different radial distances from the fountain center.
Fluids 05 00132 g038aFluids 05 00132 g038b