Data-Driven Pulsatile Blood Flow Physics with Dynamic Mode Decomposition


1
Department of Mechanical Engineering, Northern Arizona University, Flagstaff, AZ 86011, USA
2
Department of Mechanical, Materials and Aerospace Engineering, Illinois Institute of Technology, Chicago, IL 60616, USA
*
Author to whom correspondence should be addressed.
Fluids 2020, 5(3), 111; https://doi.org/10.3390/fluids5030111
Submission received: 21 May 2020
/
Revised: 30 June 2020
/
Accepted: 11 July 2020
/
Published: 14 July 2020
(This article belongs to the Special Issue Classical and Modern Topics in Fluid Dynamics and Transport Phenomena)
Abstract
:Dynamic mode decomposition (DMD) is a purely data-driven and equation-free technique for reduced-order modeling of dynamical systems and fluid flow. DMD finds a best fit linear reduced-order model that represents any given spatiotemporal data. In DMD, each mode evolves with a fixed frequency and therefore DMD modes represent physically meaningful structures that are ranked based on their dynamics. The application of DMD to patient-specific cardiovascular flow data is challenging. First, the input flow rate is unsteady and pulsatile. Second, the flow topology can change significantly in different phases of the cardiac cycle. Finally, blood flow in patient-specific diseased arteries is complex and often chaotic. The objective of this study was to overcome these challenges using our proposed multistage dynamic mode decomposition with control (mDMDc) method and use this technique to study patient-specific blood flow physics. The inlet flow rate was considered as the controller input to the systems. Blood flow data were divided into different stages based on the inlet flow waveform and DMD with control was applied to each stage. The system was augmented to consider both velocity and wall shear stress (WSS) vector data, and therefore study the interaction between the coherent structures in velocity and near-wall coherent structures in WSS. First, it was shown that DMD modes can exactly represent the analytical Womersley solution for incompressible pulsatile flow in tubes. Next, our method was applied to image-based coronary artery stenosis and cerebral aneurysm models where complex blood flow patterns are anticipated. The flow patterns were studied using the mDMDc modes and the reconstruction errors were reported. Our augmented mDMDc framework could capture coherent structures in velocity and WSS with a fewer number of modes compared to the traditional DMD approach and demonstrated a close connection between the velocity and WSS modes.
1. Introduction
Patient-specific computational fluid dynamics (CFD) has evolved over the past two decades to become a leading modality for obtaining 3D time-resolved blood flow data [1,2]. Advances in these simulations have recently led to the first ever food and drug administration (FDA) approval of computer simulations in evaluating the severity of coronary artery disease using CFD derived fractional flow reserve [3]. Thanks to today’s computational power and high-performance computing, we are capable of generating hemodynamic data with extraordinarily high spatiotemporal resolution consisting of meshes with tens of millions of degrees of freedom and spanning tens of thousands of intra-cardiac time steps [4,5]. While these high-resolution simulations significantly improve the spatial and temporal accuracy of CFD solutions, they generate hurdles in post-processing data and extracting useful information.
Recent advances in computational power and data science have motivated new avenues of research in fluid mechanics [6,7]. The field of “hybrid analytics" is developed to approximate a nonlinear dynamical system with a system that can switch between different linear models [8,9]. In the fluid mechanics community, data-driven reduced-order modeling techniques seek to find a low-dimensional space where fluid flow could be represented using a limited number of modes and therefore provide an interpretable model for fluid flow evolution [6,10]. The physical motivation is that even complex fluid flow processes could be identified from a limited number of coherent structures that are distinguished from the other flow features. Mathematically, this implies that the high spatiotemporal blood flow data generated using high-resolution CFD could contain data that are highly correlated or in other words are redundant. Reduced-order modeling using modal analysis offers techniques to identify the redundancy and project the data into a low-dimensional manifold exposing the inherent but perhaps hidden low-dimensionality of the system. We should note that in the cardiovascular fluid mechanics community, reduced-order modeling is often referred to as a geometric reduction in the dimension of the problem using 0D or 1D blood flow modeling [11,12], which is different from data-driven reduced-order modeling or modal analysis where the reduction in dimensionality is not geometric.
Proper orthogonal decomposition (POD) is likely the most popular reduced-order modeling tool in fluid flow modeling, which was first introduced to the fluid mechanics community in the context of turbulence [13,14]. In cardiovascular flow modeling, POD has been used to identify coherent structures and dominant flow features [15,16] and characterize transitional and turbulent flows [17,18]. The success of POD is due to its close ties with principal component analysis (PCA), which is a powerful century-old technique in statistics [19] and is used in a wide range of scientific applications to find hidden low-dimensionality in data. In particular, POD provides an orthogonal basis and guarantees minimum error in flow reconstruction for a given number of modes [6]. This is a very desirable feature, however, in complex flows, it confounds the physical interpretability of modes. POD ranks modes based on their energy, however, there could be low energy structures that have dynamically important features.
Dynamic mode decomposition (DMD) was more recently introduced by Schmid in 2010 [20]. In DMD, the modes are identified and ranked by their dynamics as opposed to energy [6,21]. DMD trades the optimal reconstruction property in POD with physical interpretability of the modes where the eigenvalues associated with each mode have a clear physical meaning, providing quantitative information on the oscillation frequency or growth/decay rate of the mode. DMD is a purely data-driven and equation-free method where an optimal linear model is used to represent the system. DMD has been shown to provide a numerical approximation to the Koopman operator [22], which is an old problem in dynamical systems providing a means for representing nonlinear dynamics through the action of the linear Koopman operator on the space of observable functions of the system state [22,23]. In DMD, the temporal evolution of the system is represented using a linear dynamical systems equation (). The mathematical theory behind linear dynamical systems is rich and well understood [24]. In particular, such systems, if diagonalizable, could be fully characterized by their eigenvalues and eigenvectors (modes). The mathematical simplicity of DMD has enabled several theoretical extensions such as optimal mode decomposition [25], sparse DMD [26], DMD with control [27], multiresolution DMD [28], forward-backward DMD [29], input-output DMD [30], DMD with exogenous input [31], and Lagrangian DMD [32] (among many others).
DMD has been used to study various fluid flow problems [33,34,35,36,37,38]. However, there are very few studies that have used DMD in complex cardiovascular flows. In particular, blood flow in an idealized total cavopulmonary connection of Fontan surgery [39] has been studied where the authors were able to capture the flow dynamics with a few modes. Additionally, a 2D model of the left ventricle [40] has been studied with DMD where it was shown how reconstruction errors are important in evaluating the performance of reduced-order models, and the authors highlighted the importance of preserving DMD modes with Ritz values close to the unit circle. These studies motivate the utility of DMD in cardiovascular flows, however, 3D patient-specific models of diseased arteries produce complicated flow structures and represent a challenge for the direct application of DMD. First, we deal with unsteady flow at the inlet due to the pulsatile nature of blood flow. Second, different parts of the cardiac cycle can have topologically very different flow patterns [41], which could challenge the linearization behind DMD. Finally, in cardiovascular flow problems, we are not only interested in coherent structures in velocity but also in the spatiotemporal dynamics of wall shear stress (WSS) vectors to study cardiovascular disease, which is typically localized at the vessel wall. To address the above issues, we propose a multistage DMD with control (mDMDc) approach and augment velocity data with WSS data. The unsteady flow rate produced by the heart is considered as a controller and DMD with control (DMDc) [27] is used to account for the incoming unsteady flow rate at the inlet. Subsequently, the cardiac cycle is divided into different stages based on the flow rate waveform and DMDc is applied to each stage separately. The goal of this study is to demonstrate that mDMDc could reveal the hidden low dimensionality in patient-specific blood flow data and therefore facilitate quantitative flow physics analysis.
In this study, we use 3D image-based models of a cerebral aneurysm and a coronary artery stenosis to evaluate our mDMDc approach. Interestingly, cavity flow [34] and jet flow [33] were among the early applications of DMD, which represent a simplified version of an aneurysm and stenosis, respectively. We first show that DMD modes match with the analytical Womersley solution [42] for pulsatile blood flow in tubes. Next, we demonstrate the performance of our mDMDc model in flow reconstruction, and subsequently, use our augmented mDMDc model to study coherent structures in velocity and WSS.
2. Methods
2.1. Computational Fluid Dynamics (CFD)
A cerebral aneurysm and a coronary artery stenosis model are considered in this study. Both CFD simulations are done using the Oasis solver, an open-source, minimally dissipative, finite-element CFD solver developed in FEniCS [43]. Oasis has been used in previous studies to obtain high-resolution blood flow data [5,44]. Herein, quadratic tetrahedral elements for velocity and first-order linear elements for pressure are used for high accuracy. Blood is assumed as Newtonian homogenous fluid and the walls are assumed rigid. Pulsatile parabolic profiles are used at the inlet. Both simulations are done for three cardiac cycles, and the last cardiac cycle is used in the data processing. The models and the flow waveforms at the inlet are shown in Figure 1.
2.1.1. Cerebral Aneurysm
An image-based cerebral aneurysm model from the online Aneurisk data set is selected. A 3.5 M tetrahedral element mesh with three layers of boundary meshing is created in SimVascular [45]. Thanks to FEniCS, quadratic shape functions are used, and therefore the mesh is approximately equivalent to using 28 M linear elements. A pulsatile flow rate waveform reported in a previous study [46] has been scaled in the range of the mean flow rate for our selected model according to the scaling law in Reference [47]. Zero traction is prescribed at the outlets. Each cardiac cycle is divided into 12,000 time steps.
2.1.2. Coronary Artery Stenosis
The coronary artery model used in a previous study, which includes the left anterior descending artery is considered [48]. The model is publicly available on the SimVascular website. A 50% artificial stenosis is created in the geometry. The mesh is created in SimVascular and consists of 3.31 M elements (equivalent to around 26 M linear elements once quadratic shape functions are applied in FEniCS). A scaled version of the pulsatile flow rate reported in a previous study [49] is used for inlet boundary condition. The cardiac cycle is divided into 10,000 time steps and zero traction is prescribed at the outlets. Thanks to quadratic elements and high-performance computing, our spatial and temporal resolution for both models are an order of magnitude more resolved than most studies in the literature (see Reference [4] for an excellent discussion on this topic).
2.2. Dynamic Mode Decomposition with Control (DMDc)
DMDc was developed by Proctor et al. [27] as an extension of the original DMD method [50] to account for actuators and inputs to the system. This method can be described as a linear discrete state space system for a feedforward control problem as follows:
where and and models the inherent dynamics of the system and describes the effect of the input controller on the system. The state vector is defined as and the input vector is defined as . The state vector could be the variable of interest such as velocity or WSS and represents the unsteady input flow.
The snapshots of data in time (the selected time steps) are arranged in a matrix and a shifted matrix where and . The columns could represent velocity vectors or velocity and WSS vectors combined as discussed below. A matrix is created based on the inputs as . Herein, is a single entry column and represents the average velocity (or flow rate) at the inlet corresponding to the time-point of .
The data-driven DMDc algorithm finds and matrices purely based on snapshots of collected data and input actuation. Based on the above definitions, Equation (1) could be rewritten as
where and .
The best fit linear model is obtained by minimizing the Frobenius norm of data reconstruction . This problem could be solved using the truncated singular value decomposition (SVD) of the augmented matrix , where contains the singular values, the columns of and are the left and right singular vectors, respectively, denotes the complex conjugate transpose, and specifies the truncated matrices from truncated SVD. This leads to the following calculation:
Matrices and can be approximated by separating the complex conjugate transpose of the linear operator into two distinct components:
where ,. Finally, To find the reduced-order subspace of the snapshot matrix the following algorithm is used [27,31]:
- Given data, construct snapshot matrices , , and . Then construct the augmented matrix based on and .
- Compute the SVD of the augmented matrix to get with truncation value q. Subsequently, based on the SVD results and the truncation value q, divide the complex conjugate transpose of into two distinct components .
- Compute the SVD of and obtain the truncated SVD decomposition with truncation value r ().
- Compute a reduced-order approximation of the linear operators and using:
- Compute the spectral decomposition of as to find its eigenvectors () and eigenvalues ().
- Extract the dynamic modes of the operator
2.3. Dynamic Mode Decomposition in Cardiovascular Flows
As explained above, applying DMD directly to cardiovascular flows is challenging. An appropriate DMD model should account for the unsteadiness of blood flow due to the pulsatile nature of the heart. Additionally, different flow topologies during different phases of the cardiac cycle challenge finding optimal linear modes. Finally, we would like to study the coherent structures in velocity and WSS. We discuss how these issues could be handled.
- Multistage dynamic mode decomposition with control (mDMDc)To model the effect of pulsatile flow ejected by the heart, the input matrix could be constructed as where is the mean velocity at the inlet and is computed from Q, the volumetric flow rate at the inlet boundary. Therefore, the mean velocity at the inlet is assumed to be the input controller. To account for different flow topologies in different parts of the cardiac cycle, we use multiple time windows and apply DMDc to each window separately. The different stages of the cardiac cycle are shown in Figure 2 where each stage is colored differently. The coronary artery stenosis flow rate is divided into three parts (low flow rate, acceleration, and deceleration). Since the blood flow in the aneurysm model is more complex and chaotic, we used six stages to capture distinct flow topologies.
- Augmented mDMDcTo model coherent structures (from velocity) and near-wall coherent structures (from WSS) separately, we consider an augmented matrix of velocity and WSS to construct the state space matrix as:Subsequently, the augmented multistage dynamic mode decomposition with control (mDMDc) leads to the following equation:
2.4. Performance Evaluation
To evaluate the performance of mDMDc, the reconstruction error for velocity and WSS in the augmented system is calculated during different stages. After training the mDMDc model with velocity, WSS, and input data, the mDMDc algorithm can approximate A and B matrices in each stage based on Equation (5). Consequently, the velocity and WSS data can be reconstructed and predicted by Equation (1). A spatiotemporal error measure is defined () by calculating the spatiotemporal average of the reconstruction error. Subsequently, the error is normalized by the spatiotemporal average of the data () to obtain a normalized error () and compute a measure of accuracy (). That is,
where n is the number of predicted snapshots (time steps), m is the number of spatial points, and and are the ith snapshot (time) for the jth point predicted from CFD simulation and the mDMDc approach, respectively. The above analysis was done for the velocity and WSS data separately.
3. Results
In this Section, we first demonstrate the relationship between DMD and the classical Womersley analytical solution for incompressible pulsatile flow in straight tubes. Subsequently, the number of modes required for a specific level of accuracy is reported for velocity and WSS reconstruction. Finally, velocity and WSS streamlines for different modes are shown during different stages.
3.1. DMD and Womersley’s Analytical Solution
Womersley derived an analytical solution for homogeneous, incompressible, Newtonian, and pulsatile flow in rigid and straight tubes [42]. The Womersley solution serves as a simple idealized model for pulsatile blood flow. The solution provides an analytical representation for spatial variation of velocity along the radial direction using Bessel functions and temporal variation using periodic Fourier modes. The solution is based on a given input pressure gradient waveform at the inlet, which needs to be represented based on Fourier series. Herein, we demonstrate that Womersley’s analytical solution could be represented precisely using DMD modes.
In Figure 3, we sketch the Womersley solution and show its relationship with DMD modes. The dimensions for the tube and the input pressure gradient waveform are taken from a previous study [51]. The Fourier series frequencies and coefficients used to represent the pressure gradient waveform are shown. Additionally, the Womersley analytical solution and the resulting velocity profile at t = 0.3 s are shown. The final part of the figure reviews the DMD algorithm and shows the DMD results. The data matrix in DMD consists of velocity data at 101 temporal snapshots where each snapshot is sampled at 100 radial positions. The location of the resulting Ritz values (discrete eigenvalues) in the unit circle is shown. The velocity profile reconstructed based on each mode and eigenvalue is also shown. Finally, it is shown that by assembling all of the modes, the resulting DMD velocity profile exactly matches the analytical Womersley solution. The frequency parts of the dominant eigenvalues are listed, which match the frequencies in the pressure gradient waveform and Womersley solution with negligible error.
3.2. Data Reconstruction Accuracy
To evaluate the performance of our model, the minimum number of modes required to reach a certain level of accuracy is reported for each stage. The minimum number of modes for velocity and WSS in the coronary artery stenosis model is shown in Table 1 and Table 2, respectively. Similar tables are also reported for velocity and WSS reconstruction in the cerebral aneurysm model (Table 3 and Table 4). In general, velocity requires fewer number of modes compared to WSS for the same level of accuracy. In all cases, fewer than 10 modes are required for 90% accuracy. To compare the results with the traditional DMD method, Table 5 shows the minimum number of modes required for data reconstruction in each model for the DMD method without dividing the data into multiple stages, and two modes are shown in Figure 4. As expected, a large number of modes are required to reconstruct the data.
3.3. Flow Physics Using mDMDc
In the following figures, representative mDMDc velocity and WSS modes are shown in the coronary artery stenosis and aneurysm models. Each mode represents a different pattern within the data. Namely, each mode consists of the spatial pattern shown (eigenvector) and an associated temporal dynamics (eigenvalue). That is, based on its eigenvalue, each mode will oscillate and/or grow/decay in time with a frequency and rate specified by the eigenvalue. Therefore, using mDMDc we could characterize the spatiotemporal flow physics by dividing the flow into different modes.
3.3.1. Flow Physics Using mDMDc Modes in Coronary Artery Stenosis
The mDMDc modes for the coronary artery stenosis model during different stages are shown in Figure 5, Figure 6 and Figure 7. Three modes are selected for each stage such that they exhibit mostly different flow patterns and can describe the dynamics of periodic flow (Ritz values lying close to the unit circle) [40]. The red dashed part of the waveform shows the stage of the cardiac cycle for each figure. The figures show the selected CFD data, reconstructed data with 95% accuracy, three mDMDc modes, and the location of the Ritz values (discrete eigenvalues) corresponding to the selected modes. The velocity and WSS streamlines are shown for front and back views.
The first stage represents the systole phase of the cardiac cycle where low flow exists in the coronary arteries. Different flow and WSS patterns are seen in each mode. In each mode, regions of high WSS and velocity magnitude at the stenosis throat coincide. Additionally, the WSS vector directions match flow patterns near the wall. In the back view, a close correspondence between helical velocity streamlines and WSS streamlines could be seen in the second mode.
The second stage (flow acceleration) is shown in Figure 6. The close connection between flow and WSS topology could be seen in each mode. The comparison of each velocity and WSS modes could be used to observe how different patterns in velocity induce different WSS patterns. For example, in mode three, a stable fixed point in WSS could be seen, which corresponds to upwelling motion in the velocity streamlines [52]. Finally, similar results are presented for the third stage (flow deceleration) in Figure 7. Different patterns could be seen in different modes and a clear connection between near-wall helical flow and helical WSS patterns with spiral WSS fixed points could be seen in mode one.
3.3.2. Flow Physics Using mDMDc Modes in Cerebral Aneurysm
The mDMDc modes for the cerebral aneurysm model during three representative stages are shown in Figure 8, Figure 9 and Figure 10. The figures are structured similar to the coronary artery stenosis results. For brevity, three stages out of the six stages are shown. The second stage (second half of flow acceleration) is shown in Figure 8. The figure shows how different flow patterns in the velocity lead to synchronized patterns in WSS. For example, regions of high WSS could clearly be identified in the corresponding velocity streamlines by a high speed flow jet. Additionally, it could be seen how the complexity in the 3D flow patterns is translated into the WSS topology. For example, mode two shows dramatic changes in WSS directionality with multiple fixed points, which correspond to the most complex and chaotic flow pattern in the velocity streamlines.
4. Discussion
DMD is a purely data-driven and equation-free technique to reduce the snapshots of data into dynamically coherent modes. We have shown how DMD could be properly modified and applied to pulsatile cardiovascular flows. The incoming transient pulsatile flow waveform in arteries makes the direct application of DMD challenging. DMD seeks to find an optimal linear model based on given data. It may be perceived that linearizing nonlinear flow where the flow behavior jumps between different nonlinear regimes is not an easy task. Dividing the cardiac cycle into different stages based on the flow waveform mitigates this inherent difficulty in applying DMD to these types of flows. Additionally, using DMDc allows one to separate the effect of unsteady inflow and the inherent dynamics of the system.
The application of DMD to cardiovascular flow physics raises a major question: why is DMD an appropriate framework to represent velocity and WSS data from patient-specific cardiovascular flows? To answer this question we demonstrated that the classical Womersley solution could be represented using DMD modes and DMD analysis precisely identifies the frequencies in the Womersley solution. In the Womersley solution, the temporal variation of velocity is represented using Fourier series where the frequencies are based on the frequencies of the input pressure or flow waveform. DMD modes are known to approximate Fourier modes [21,53], therefore we may think of DMD as a data-driven counterpart of the Womersley solution in patient-specific geometries. In other words, in each mode, the eigenvectors represent the spatial approximation to the solution and the eigenvalues correspond to the frequencies. In DMD, each temporal frequency in the solution has its unique spatial velocity pattern, whereas, in the Womersley solution, all frequencies are associated with Bessel functions representing the spatial velocity profile. Having an analytical solution is desirable because it guides a quantitative interpretation of the flow physics. Obviously, it is not possible to find an analytical solution for patient-specific geometries, however, given numerical or experimental solution, we may expect to approximate it with DMD modes to provide a quantitative model for the evolution of coherent structures.
Our results showed that applying mDMDc significantly improves flow reconstruction compared to the traditional DMD approach. Namely, as shown in Table 5, a considerably large number of modes are required to reconstruct the velocity data in both models when DMD is applied directly to the entire data. For example, the cerebral aneurysm model required 155 modes for 98% velocity reconstruction accuracy. Interestingly, a prior DMD study in 2D left ventricles required less than 39 modes for 98% accuracy in capturing the kinetic energy [40], which demonstrates the complexity in our 3D patient-specific models. Nevertheless, using the mDMDc approach reduces the number of required modes for our aneurysm model to 3–13 modes depending on the stage. Additionally, the use of an augmented system enables more accurate mode reconstruction for WSS. Specifically, applying mDMDc directly to WSS data in the coronary artery stenosis model resulted in highly unstable modes with high-frequency structures that compromised flow reconstruction. For the cerebral aneurysm model, we observed that the augmented system required on average 6 and 8 fewer number of modes to obtain 99% and 99.5% accuracy in WSS, respectively (results not shown). We also observed that uniformly scaling the input controller () could improve reconstruction error in some cases. Such scaling is equivalent to changing the weight in the optimization problem for finding matrices and in DMDc.
The relationship between DMD and mDMDc modes in complex data is not trivial. We observed that the mDMDc modes/eigenvalues, in general, are different from any subset of DMD modes/eigenvalues. It is not guaranteed to obtain the same results as a multistage variant of DMD just from knowing which DMD modes (identified from the full dataset) are active in a certain stage. In the ideal cases such as the Womersley solution (sinusoidal data), we saw that mDMDc and DMD modes are aligned together. However, this could not be seen in our patient-specific models.
The mDMDc results shown in the figures show how the spatiotemporal evolution of disturbed blood flow in diseased arteries is made up of different coherent structures (modes) with different flow features. For instance, different types of fixed points in the WSS vector field could be seen in different modes. These WSS fixed points are closely related to flow topology away from the wall [52] as could be seen in the results. For instance, source and sink type fixed points in the WSS vector field correspond to flow towards the wall (impingement) and flow away from the wall (upwelling motion). In general, the WSS modes without fixed points correspond to unidirectional attached flow in the velocity modes. On the other hand, the appearance of WSS fixed points is related to more complex flow patterns as seen in the velocity streamlines.
The application of DMD to diseased arterial flows could provide different types of information. From a mathematical viewpoint, our mDMDc results show that despite the apparent spatiotemporal complexity of blood flow in aneurysms and stenoses, the spatiotemporal evolution of hemodynamic data could be represented with a few modes where each mode evolves in time according to the linear model discovered with DMD. From a flow physics viewpoint, dividing the flow into distinct modes where each mode evolves in time with a fixed oscillation frequency and growth/decay rate significantly simplifies the flow physics. One could identify the modes that decay in time and therefore identify flow structures that dynamically do not persist in the flow. Additionally, the combination of different modes with eigenvalues close to the unit circle represents the flow patterns that persist and oscillate in time. These modes were selected and shown in the results. It can be observed that most modes posses a unique flow pattern. What distinguishes DMD from other tools in studying flow physics is that in DMD each mode is equipped with an eigenvalue that defines the quantitative temporal evolution of the mode. In other words, DMD modes and the flow patterns extracted from each mode are quantitative. For example, if a vortex is identified from one mode, its evolution in time could be quantitatively explained. This is something that other flow physics identification tools, for example, Lagrangian coherent structures (LCS) [54,55], do not offer. One could, of course, compute the LCS from the velocity [41] and WSS [56] modes to rigorously identify flow structures and use the eigenvalues associated with each DMD mode to equip the qualitative flow structures identified from LCS with a quantitative model.
Another interesting potential application of DMD is future forecasting. Once the DMD model is established, one could use the model to predict blood flow beyond the available data. For example, the waveform could be extended (e.g., increase in the peak flow rate) and the DMD model could be used to extend the data based on the new waveform. Dividing the cardiac cycle into multiple stages enables one to extend the waveform in different parts of the flow rate, and therefore study variations in the flow waveform. Of course, it is highly likely that only a short time window could be predicted before the DMD model deviates from the physical system. Nevertheless, such a model could be used in uncertainty quantification where small perturbations to the flow rate need to be examined. Additionally, using DMD on the fly in a CFD code could be used to design a new time integration strategy where the solver could switch between the high-fidelity CFD solver and the DMD model during different time intervals.
There are different possibilities to improve and extend our mDMDc model in future work. Our preliminary investigation revealed that mDMDc accuracy is reduced when the flow rate is sufficiently increased. Transitional and unstable flow patterns have been observed in prior high-resolution CFD studies [57]. These unstable flow patterns challenge the task of finding an optimal linear model in DMD. One solution is to develop hybrid reduced-order models leveraging the optimal reconstruction property in POD [21,58,59]. Additionally, using robust principal component analysis (RPCA) in conjunction with DMD could potentially remove high-frequency components in velocity if they are spatially sparsely distributed [60]. Other developments in DMD such as multiresolution DMD [28] and extended DMD [61] could also be incorporated within the mDMDc framework to improve the method’s accuracy. Finally, it is possible to use other parameters as the input controller in the DMDc framework. For instance, viscosity or vessel stiffness (in a fluid-structure interaction problem) could be varied to build a reduced-order model with these parameters as the input in DMDc.
5. Conclusions
Dynamic mode decomposition (DMD) was used to reconstruct hemodynamic data in image-based coronary artery stenosis and cerebral aneurysm models. A close relationship between DMD and Womersley solution was shown. A new multistage DMD with control (mDMDc) technique was proposed to overcome challenges in the direct application of DMD to pulsatile blood flow data. The results demonstrated that in most stages of the cardiac cycle velocity and WSS data could be reconstructed using less than 10 modes with an error of less than 10%. The flow patterns were studied using DMD modes to extract different spatiotemporal flow structures in velocity and WSS. A close correspondence between coherent structures identified in velocity modes and near-wall coherent structures identified in WSS modes was observed. In summary, this work demonstrated that DMD could be customized to study flow physics in 3D patient-specific cardiovascular flows.
Author Contributions
Conceptualization, A.A. and S.T.M.D.; methodology, M.H. and S.T.M.D. and A.A.; formal analysis, M.H.; data curation, M.H.; writing—original draft preparation, M.H.; writing—review and editing, A.A. and S.T.M.D. All authors have read and agreed to the published version of the manuscript.
Funding
This research received no external funding.
Conflicts of Interest
The authors declare no conflict of interest.
References
- Taylor, C.A.; Figueroa, C.A. Patient-specific modeling of cardiovascular mechanics. Ann. Rev. Biomed. Eng. 2009, 11, 109–134. [Google Scholar] [CrossRef] [PubMed] [Green Version]
- Morris, P.D.; Narracott, A.; von Tengg-Kobligk, H.; Soto, D.A.S.; Hsiao, S.; Lungu, A.; Evans, P.; Bressloff, N.W.; Lawford, P.V.; Hose, D.R.; et al. Computational fluid dynamics modelling in cardiovascular medicine. Heart 2016, 102, 18–28. [Google Scholar] [CrossRef] [PubMed] [Green Version]
- Taylor, C.A.; Fonte, T.A.; Min, J.K. Computational fluid dynamics applied to cardiac computed tomography for noninvasive quantification of fractional flow reserve: Scientific basis. J. Am. Coll. Cardiol. 2013, 61, 2233–2241. [Google Scholar] [CrossRef] [PubMed] [Green Version]
- Khan, M.O.; Valen-Sendstad, K.; Steinman, D.A. Narrowing the expertise gap for predicting intracranial aneurysm hemodynamics: Impact of solver numerics versus mesh and time-step resolution. Am. J. Neuroradiol. 2015, 36, 1310–1316. [Google Scholar] [CrossRef] [PubMed] [Green Version]
- Arzani, A. Accounting for residence-time in blood rheology models: Do we really need non-Newtonian blood flow modeling in large arteries? J. R. Soc. Interface 2018, 15, 20180486. [Google Scholar] [CrossRef] [PubMed] [Green Version]
- Taira, K.; Brunton, S.L.; Dawson, S.T.M.; Rowley, C.W.; Colonius, T.; McKeon, B.J.; Schmidt, O.T.; Gordeyev, S.; Theofilis, V.; Ukeiley, L.S. Modal analysis of fluid flows: An overview. AIAA J. 2017, 102, 4013–4041. [Google Scholar] [CrossRef] [Green Version]
- Brunton, S.L.; Noack, B.R.; Koumoutsakos, P. Machine learning for fluid mechanics. Ann. Rev. Fluid Mech. 2020, 52, 477–508. [Google Scholar] [CrossRef] [Green Version]
- Bamieh, B.; Giarre, L. Identification of linear parameter varying models. Int. J. Robust Nonlinear Control 2002, 12, 841–853. [Google Scholar] [CrossRef]
- Paoletti, S.; Juloski, A.; Ferrari-Trecate, G.; Vidal, R. Identification of hybrid systems: A tutorial. Eur. J. Control 2007, 13, 242–260. [Google Scholar] [CrossRef] [Green Version]
- Kutz, J.N.; Brunton, S.L.; Brunton, B.W.; Proctor, J.L. Dynamic Mode Decomposition: Data-Driven Modeling of Complex Systems; SIAM: Philadelphia, PA, USA, 2016. [Google Scholar]
- Mirramezani, M.; Diamond, S.L.; Litt, H.I.; Shadden, S.C. Reduced order models for transstenotic pressure drop in the coronary arteries. J. Biomech. Eng. 2019, 141, 031005. [Google Scholar] [CrossRef]
- Sankaran, S.; Lesage, D.; Tombropoulos, R.; Xiao, N.; Kim, H.J.; Spain, D.; Schaap, M.; Taylor, C.A. Physics driven reduced order model for real time blood flow simulations. arXiv 2019, arXiv:1911.01543. [Google Scholar]
- Berkooz, G.; Holmes, P.; Lumley, J.L. The proper orthogonal decomposition in the analysis of turbulent flows. Ann. Rev. Fluid Mech. 1993, 25, 539–575. [Google Scholar] [CrossRef]
- Holmes, P.; Lumley, J.L.; Berkooz, G.; Rowley, C.W. Turbulence, Coherent Structures, Dynamical Systems and Symmetry; Cambridge University Press: Cambridge, UK, 2012. [Google Scholar]
- Glenn, A.L.; Bulusu, K.V.; Shu, F.; Plesniak, M.W. Secondary flow structures under stent-induced perturbations for cardiovascular flow in a curved artery model. Int. J. Heat Fluid Flow 2012, 35, 76–83. [Google Scholar] [CrossRef]
- Chang, G.H.; Schirmer, C.M.; Modarres-Sadeghi, Y. A reduced-order model for wall shear stress in abdominal aortic aneurysms by proper orthogonal decomposition. J. Biomech. 2017, 54, 33–43. [Google Scholar] [CrossRef]
- Grinberg, L.; Yakhot, A.; Karniadakis, G. Analyzing transient turbulence in a stenosed carotid artery by proper orthogonal decomposition. Ann. Biomed. Eng. 2009, 37, 2200–2217. [Google Scholar] [CrossRef] [PubMed]
- Kefayati, S.; Poepping, T.L. Transitional flow analysis in the carotid artery bifurcation by proper orthogonal decomposition and particle image velocimetry. Med. Eng. Phys. 2013, 35, 898–909. [Google Scholar] [CrossRef]
- Wold, S.; Esbensen, K.; Geladi, P. Principal component analysis. Chemom. Intell. Lab. Syst. 1987, 2, 37–52. [Google Scholar] [CrossRef]
- Schmid, P.J. Dynamic mode decomposition of numerical and experimental data. J. Fluid Mech. 2010, 656, 5–28. [Google Scholar] [CrossRef] [Green Version]
- Noack, B.R. From snapshots to modal expansions–bridging low residuals and pure frequencies. J. Fluid Mech. 2016, 802, 1–4. [Google Scholar] [CrossRef] [Green Version]
- Rowley, C.W.; Mezić, I.; Bagheri, S.; Schlatter, P.; Henningson, D.S. Spectral analysis of nonlinear flows. J. Fluid Mech. 2009, 641, 115–127. [Google Scholar] [CrossRef] [Green Version]
- Mezić, I. Spectral properties of dynamical systems, model reduction and decompositions. Nonlinear Dyn. 2005, 41, 309–325. [Google Scholar] [CrossRef]
- Perko, L. Differential Equations and Dynamical Systems; Springer Science & Business Media: Berlin, Germany, 2013. [Google Scholar]
- Wynn, A.; Pearson, D.; Ganapathisubramani, B.; Goulart, P. Optimal mode decomposition for unsteady flows. J. Fluid Mech. 2013, 733, 473–503. [Google Scholar] [CrossRef] [Green Version]
- Jovanović, M.; Schmid, P.; Nichols, J. Sparsity-promoting dynamic mode decomposition. Phys. Fluids 2014, 26, 024103. [Google Scholar] [CrossRef]
- Proctor, J.; Brunton, S.; Kutz, J. Dynamic mode decomposition with control. SIAM J. Appl. Dyn. Syst. 2016, 15, 142–161. [Google Scholar] [CrossRef] [Green Version]
- Kutz, J.N.; Fu, X.; Brunton, S. Multiresolution dynamic mode decomposition. SIAM J. Appl. Dyn. Syst. 2016, 15, 713–735. [Google Scholar] [CrossRef] [Green Version]
- Dawson, S.T.M.; Hemati, M.S.; Williams, M.O.; Rowley, C. Characterizing and correcting for the effect of sensor noise in the dynamic mode decomposition. Exp. Fluids 2016, 57, 42. [Google Scholar] [CrossRef] [Green Version]
- Annoni, J.; Seiler, P. A method to construct reduced-order parameter-varying models. Int. J. Robust Nonlinear Control 2017, 27, 582–597. [Google Scholar] [CrossRef]
- Kou, J.; Zhang, W. Dynamic mode decomposition with exogenous input for data-driven modeling of unsteady flows. Phys. Fluids 2019, 31, 057106. [Google Scholar]
- Lu, H.; Tartakovsky, D.M. Lagrangian Dynamic Mode Decomposition for Construction of Reduced-Order Models of Advection-Dominated Phenomena. J. Comput. Phys. 2020, 407, 109229. [Google Scholar] [CrossRef] [Green Version]
- Schmid, P.J.; Li, L.; Juniper, M.P.; Pust, O. Applications of the dynamic mode decomposition. Theor. Comput. Fluid Dyn. 2011, 25, 249–259. [Google Scholar] [CrossRef]
- Seena, A.; Sung, H.J. Dynamic mode decomposition of turbulent cavity flows for self-sustained oscillations. Int. J. Heat Fluid Flow 2011, 32, 1098–1110. [Google Scholar] [CrossRef]
- Dawson, S.T.M.; Schiavone, N.; Rowley, C.; Williams, D. A data-driven modeling framework for predicting forces and pressures on a rapidly pitching airfoil. In Proceedings of the 45th AIAA Fluid Dynamics Conference, Dallas, TX, USA, 22–26 June 2015; p. 2767. [Google Scholar]
- Le Clainche, S.; Han, Z.H.; Ferrer, E. An alternative method to study cross-flow instabilities based on high order dynamic mode decomposition. Phys. Fluids 2019, 31, 094101. [Google Scholar] [CrossRef]
- Alessandri, A.; Bagnerini, P.; Gaggero, M.; Lengani, D.; Simoni, D. Dynamic mode decomposition for the inspection of three-regime separated transitional boundary layers using a least squares method. Phys. Fluids 2019, 31, 044103. [Google Scholar] [CrossRef]
- Pain, R.; Weiss, P.E.; Deck, S.; Robinet, J.C. Large scale dynamics of a high Reynolds number axisymmetric separating/reattaching flow. Phys. Fluids 2019, 31, 125119. [Google Scholar] [CrossRef]
- Delorme, Y.; Kerlo, A.; Anupindi, K.; Rodefeld, M.; Frankel, S. Dynamic mode decomposition of Fontan hemodynamics in an idealized total cavopulmonary connection. Fluid Dyn. Res. 2014, 46, 041425. [Google Scholar] [CrossRef] [PubMed] [Green Version]
- Di Labbio, G.; Kadem, L. Reduced-order modeling of left ventricular flow subject to aortic valve regurgitation. Phys. Fluids 2019, 31, 031901. [Google Scholar] [CrossRef] [Green Version]
- Arzani, A.; Shadden, S.C. Characterization of the transport topology in patient-specific abdominal aortic aneurysm models. Phys. Fluids 2012, 24, 081901. [Google Scholar] [CrossRef] [PubMed] [Green Version]
- Womersley, J.R. Method for the calculation of velocity, rate of flow and viscous drag in arteries when the pressure gradient is known. J. Physiol. 1955, 127, 553–563. [Google Scholar] [CrossRef]
- Mortensen, M.; Valen-Sendstad, K. Oasis: A high-level/high-performance open source Navier–Stokes solver. Comp. Phys. Commun. 2015, 188, 177–188. [Google Scholar] [CrossRef] [Green Version]
- Valen-Sendstad, K.; Steinman, D.A. Mind the gap: Impact of computational fluid dynamics solution strategy on prediction of intracranial aneurysm hemodynamics and rupture status indicators. Am. J. Neuroradiol. 2014, 35, 536–543. [Google Scholar] [CrossRef] [Green Version]
- Updegrove, A.; Wilson, N.; Merkow, J.; Lan, H.; Marsden, A.; Shadden, S. SimVascular: An open source pipeline for cardiovascular simulation. Ann. Biomed. Eng. 2017, 45, 525–541. [Google Scholar] [CrossRef]
- Hoi, Y.; Wasserman, B.; Xie, Y.; Najjar, S.; Ferruci, L.; Lakatta, E.; Gerstenblith, G.; Steinman, D. Characterization of volumetric flow rate waveforms at the carotid bifurcations of older adults. Physiol. Meas. 2010, 31, 291. [Google Scholar] [CrossRef] [PubMed]
- Valen-Sendstad, K.; Piccinelli, M.; KrishnankuttyRema, R.; Steinman, D. Estimation of inlet flow rates for image-based aneurysm CFD models: Where and how to begin? Ann. Biomed. Eng. 2015, 43, 1422–1431. [Google Scholar] [CrossRef] [PubMed]
- Arzani, A. Coronary artery plaque growth: A two-way coupled shear stress–driven model. Int. J. Numer. Methods Biomed. Eng. 2020, 36, e3293. [Google Scholar] [CrossRef] [PubMed]
- Kim, H.; Vignon-Clementel, I.; Coogan, J.; Figueroa, C.A.; Jansen, K.; Taylor, C.A. Patient-specific modeling of blood flow and pressure in human coronary arteries. Ann. Biomed. Eng. 2010, 38, 3195–3209. [Google Scholar] [CrossRef]
- Tu, J.H.; Rowley, C.W.; Luchtenburg, D.M.; Brunton, S.L.; Kutz, J.N. On dynamic mode decomposition: Theory and applications. J. Comput. Dyn. 2014, 1, 391–421. [Google Scholar] [CrossRef] [Green Version]
- Xiao, N.; Alastruey, J.; Figueroa, C.A. A systematic comparison between 1-D and 3-D hemodynamics in compliant arterial models. Int. J. Numer. Methods Biomed. Eng. 2014, 30, 204–231. [Google Scholar] [CrossRef] [Green Version]
- Arzani, A.; Shadden, S.C. Wall shear stress fixed points in cardiovascular fluid mechanics. J. Biomech. 2018, 73, 145–152. [Google Scholar] [CrossRef]
- Chen, K.K.; Tu, J.H.; Rowley, C.W. Variants of dynamic mode decomposition: Boundary condition, Koopman, and Fourier analyses. J. Nonlinear Sci. 2012, 22, 887–915. [Google Scholar] [CrossRef]
- Shadden, S.C.; Lekien, F.; Marsden, J.E. Definition and properties of Lagrangian coherent structures from finite-time Lyapunov exponents in two-dimensional aperiodic flows. Phys. D Nonlinear Phenom. 2005, 212, 271–304. [Google Scholar] [CrossRef]
- Haller, G. Lagrangian coherent structures. Ann. Rev. Fluid Mech. 2015, 47, 137–162. [Google Scholar] [CrossRef] [Green Version]
- Arzani, A.; Gambaruto, A.M.; Chen, G.; Shadden, S.C. Lagrangian wall shear stress structures and near-wall transport in high-Schmidt-number aneurysmal flows. J. Fluid Mech. 2016, 790, 158–172. [Google Scholar] [CrossRef] [Green Version]
- Valen-Sendstad, K.; Mardal, K.A.; Steinman, D.A. High-resolution CFD detects high-frequency velocity fluctuations in bifurcation, but not sidewall, aneurysms. J. Biomech. 2013, 46, 402–407. [Google Scholar] [CrossRef] [PubMed]
- Sieber, M.; Paschereit, C.O.; Oberleithner, K. Spectral proper orthogonal decomposition. J. Fluid Mech. 2016, 792, 798–828. [Google Scholar] [CrossRef] [Green Version]
- Ghate, A.S.; Towne, A.; Lele, S.K. Broadband reconstruction of inhomogeneous turbulence using spectral proper orthogonal decomposition and Gabor modes. J. Fluid Mech. 2020, 888, 1–13. [Google Scholar] [CrossRef]
- Scherl, I.; Strom, B.; Shang, J.K.; Williams, O.; Polagye, B.L.; Brunton, S.L. Robust Principal Component Analysis for Modal Decomposition of Corrupt Fluid Flows. arXiv 2019, arXiv:1905.07062. [Google Scholar] [CrossRef]
- Williams, M.; Kevrekidis, I.; Rowley, C. A data–driven approximation of the Koopman operator: Extending dynamic mode decomposition. J. Nonlinear Sci. 2015, 25, 1307–1346. [Google Scholar] [CrossRef] [Green Version]
Figure 1.
The three-dimensional models, the corresponding mesh, and flow waveforms used as the inlet boundary condition are shown. The left panel shows the coronary artery stenosis model and the right panel shows the cerebral aneurysm model.
Figure 1.
The three-dimensional models, the corresponding mesh, and flow waveforms used as the inlet boundary condition are shown. The left panel shows the coronary artery stenosis model and the right panel shows the cerebral aneurysm model.
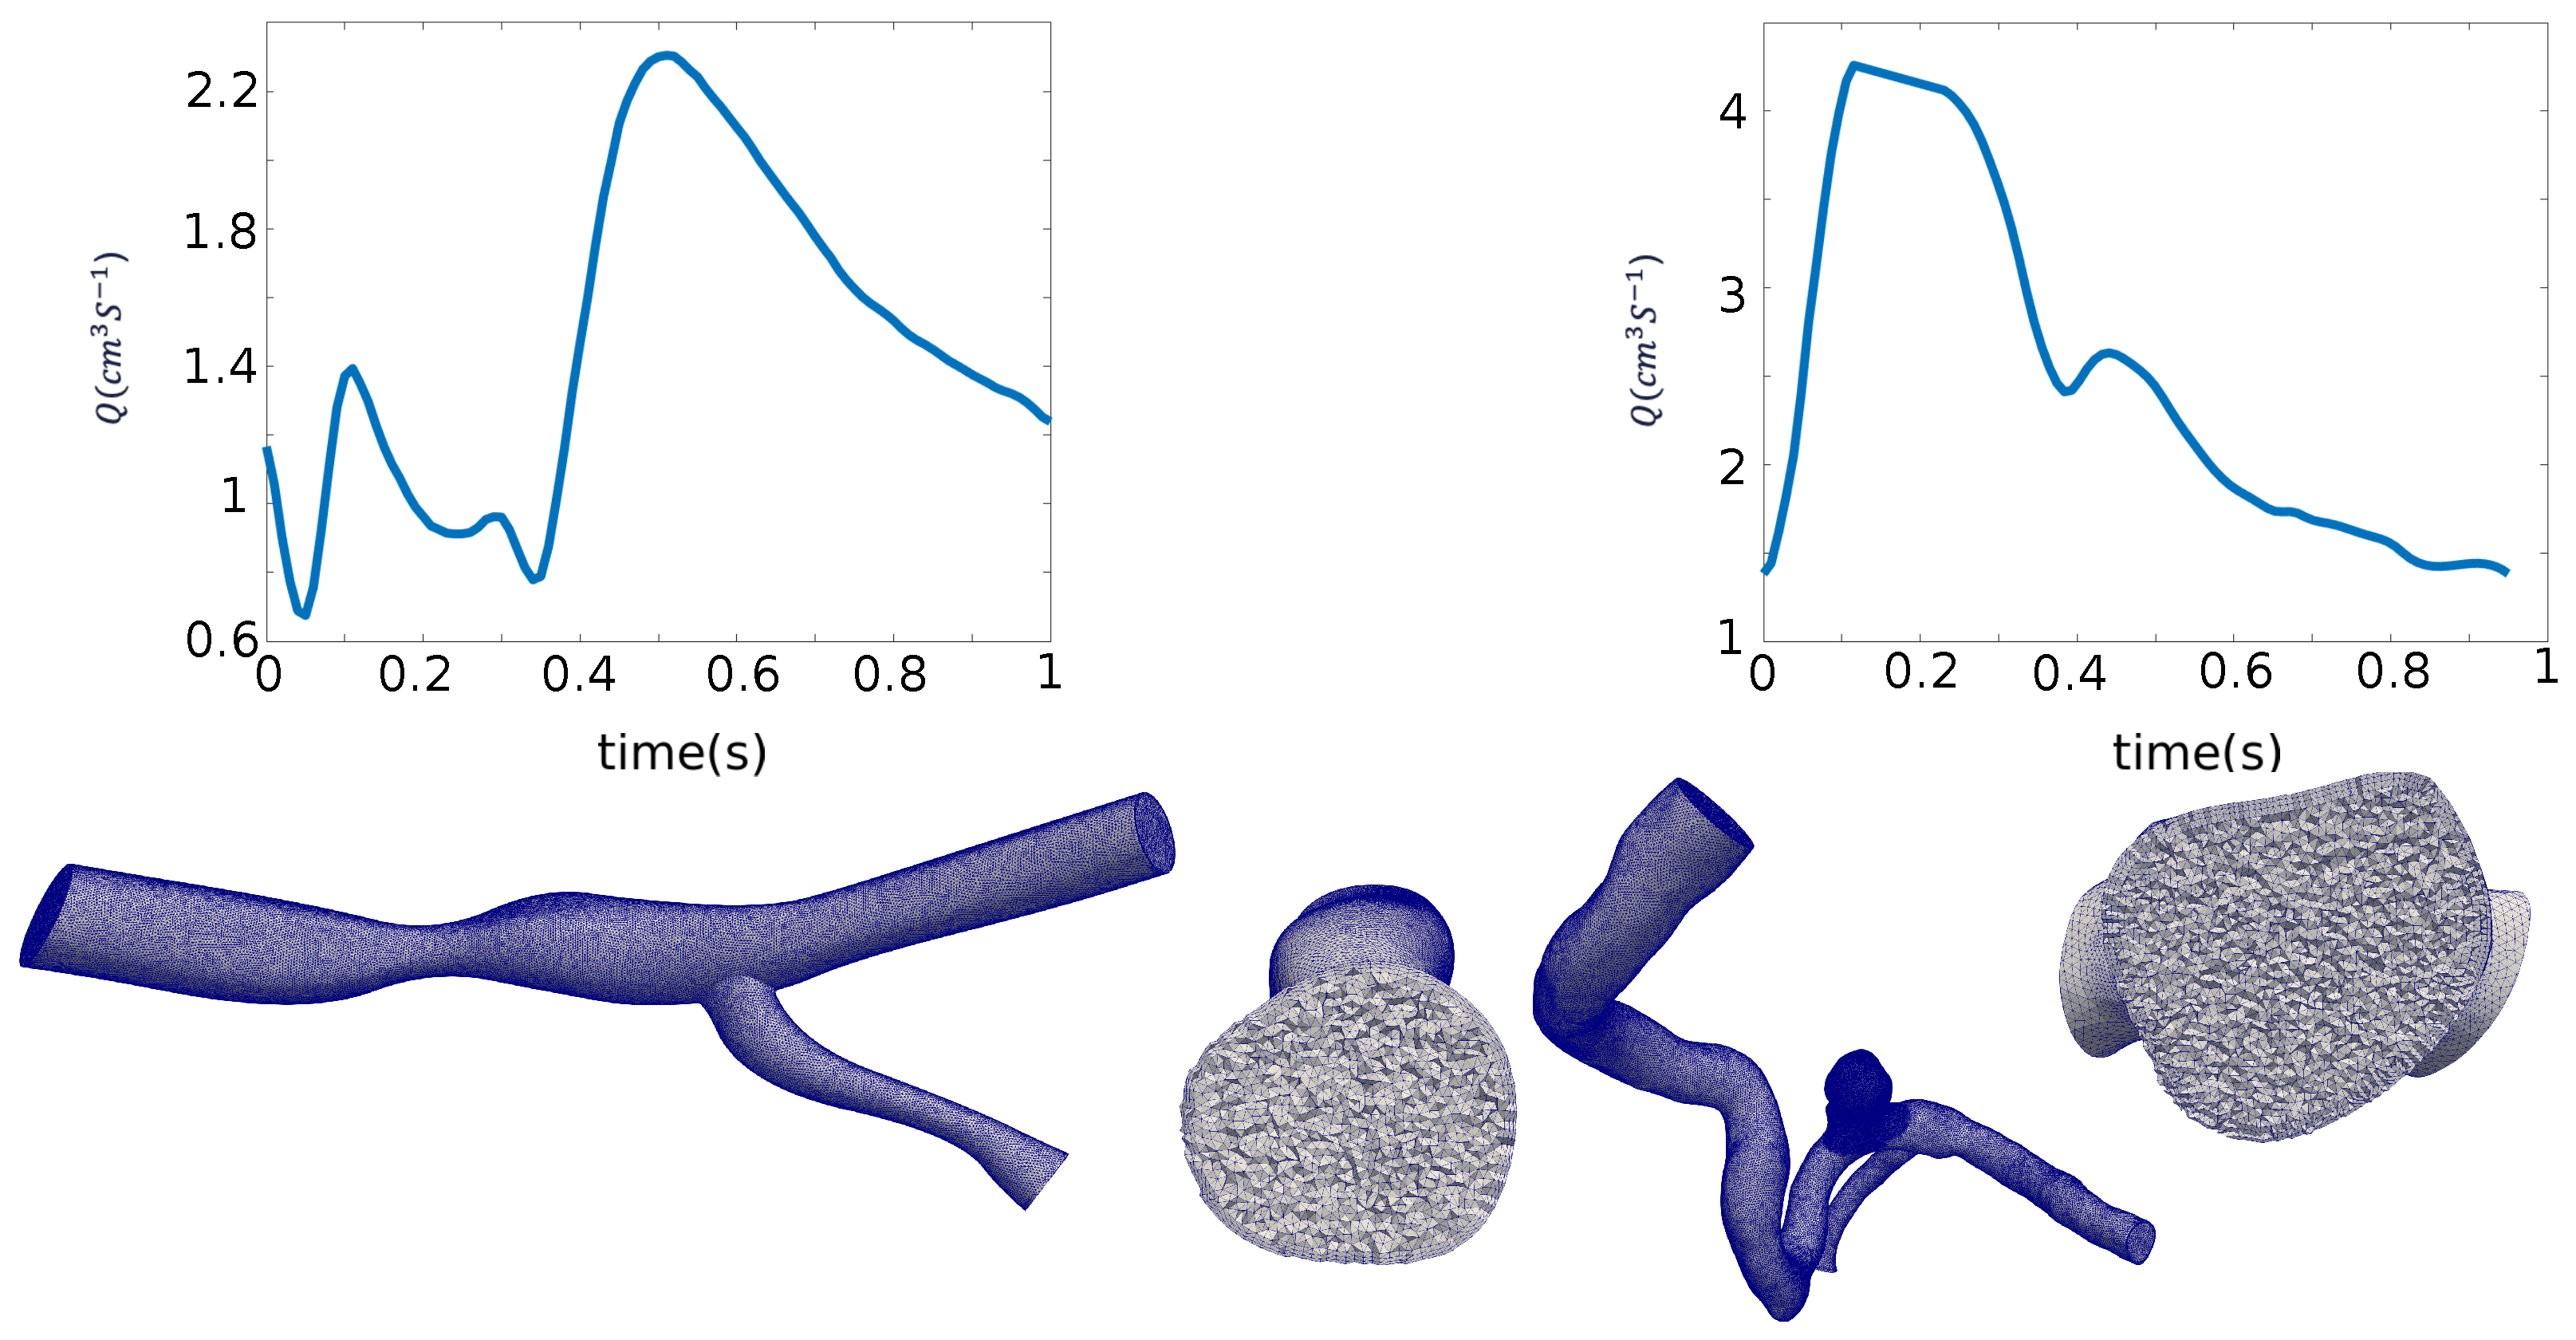
Figure 2.
The flow waveform divided into different stages is shown for the coronary artery stenosis and cerebral aneurysm model. Each stage is colored differently and the number of snapshots used are shown next to the arrow. The coronary artery flow rate is divided into three stages: low flow rate, flow acceleration, and flow deceleration. The aneurysm’s flow is divided into six stages based on the shape of the waveform: two stages during flow acceleration, three stages during flow deceleration, and one stage during low flow rate in diastole.
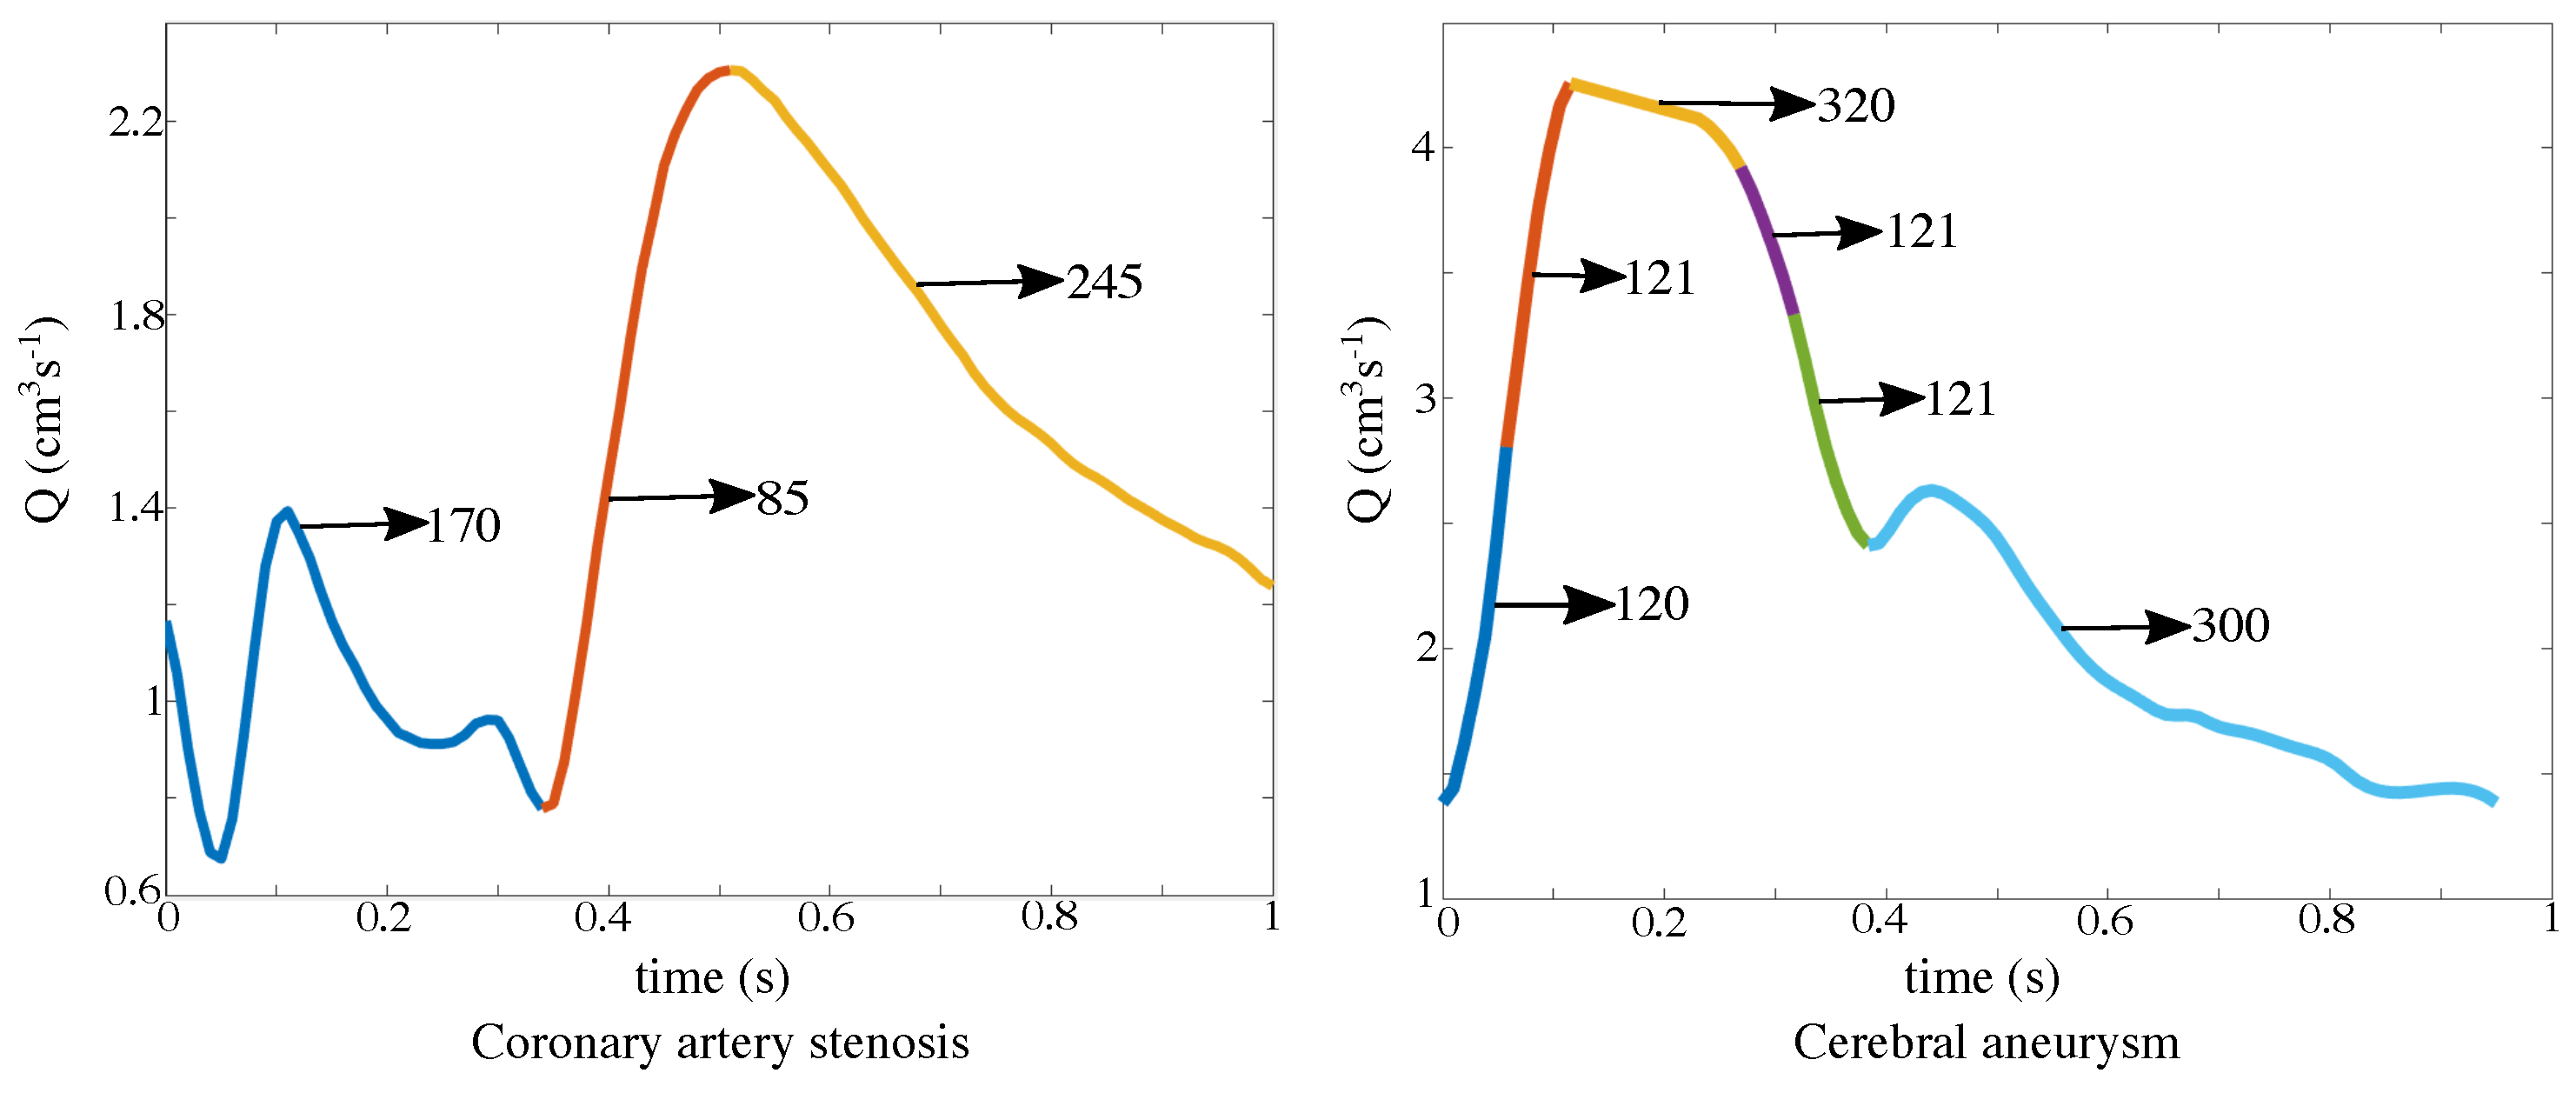
Figure 3.
The relationship between Womersley’s analytical solution and dynamic mode decomposition (DMD) approximation is shown in a rigid tube. Top left: The pressure gradient waveform driving the flow in the rigid tube is shown. Corresponding Fourier series coefficients and frequencies are reported in the table. Top right: The Womersley solution for velocity profile at t = 0.3 s is outlined, and the corresponding coefficients, frequencies, and analytical forms are reported. Bottom: The DMD algorithm is reported. Moreover, the location of discrete eigenvalues in the unit circle is shown and the reconstructed velocity profile based on each eigenvalue is sketched. The assembled velocity profile based on all of the DMD modes and the corresponding frequencies are demonstrated.
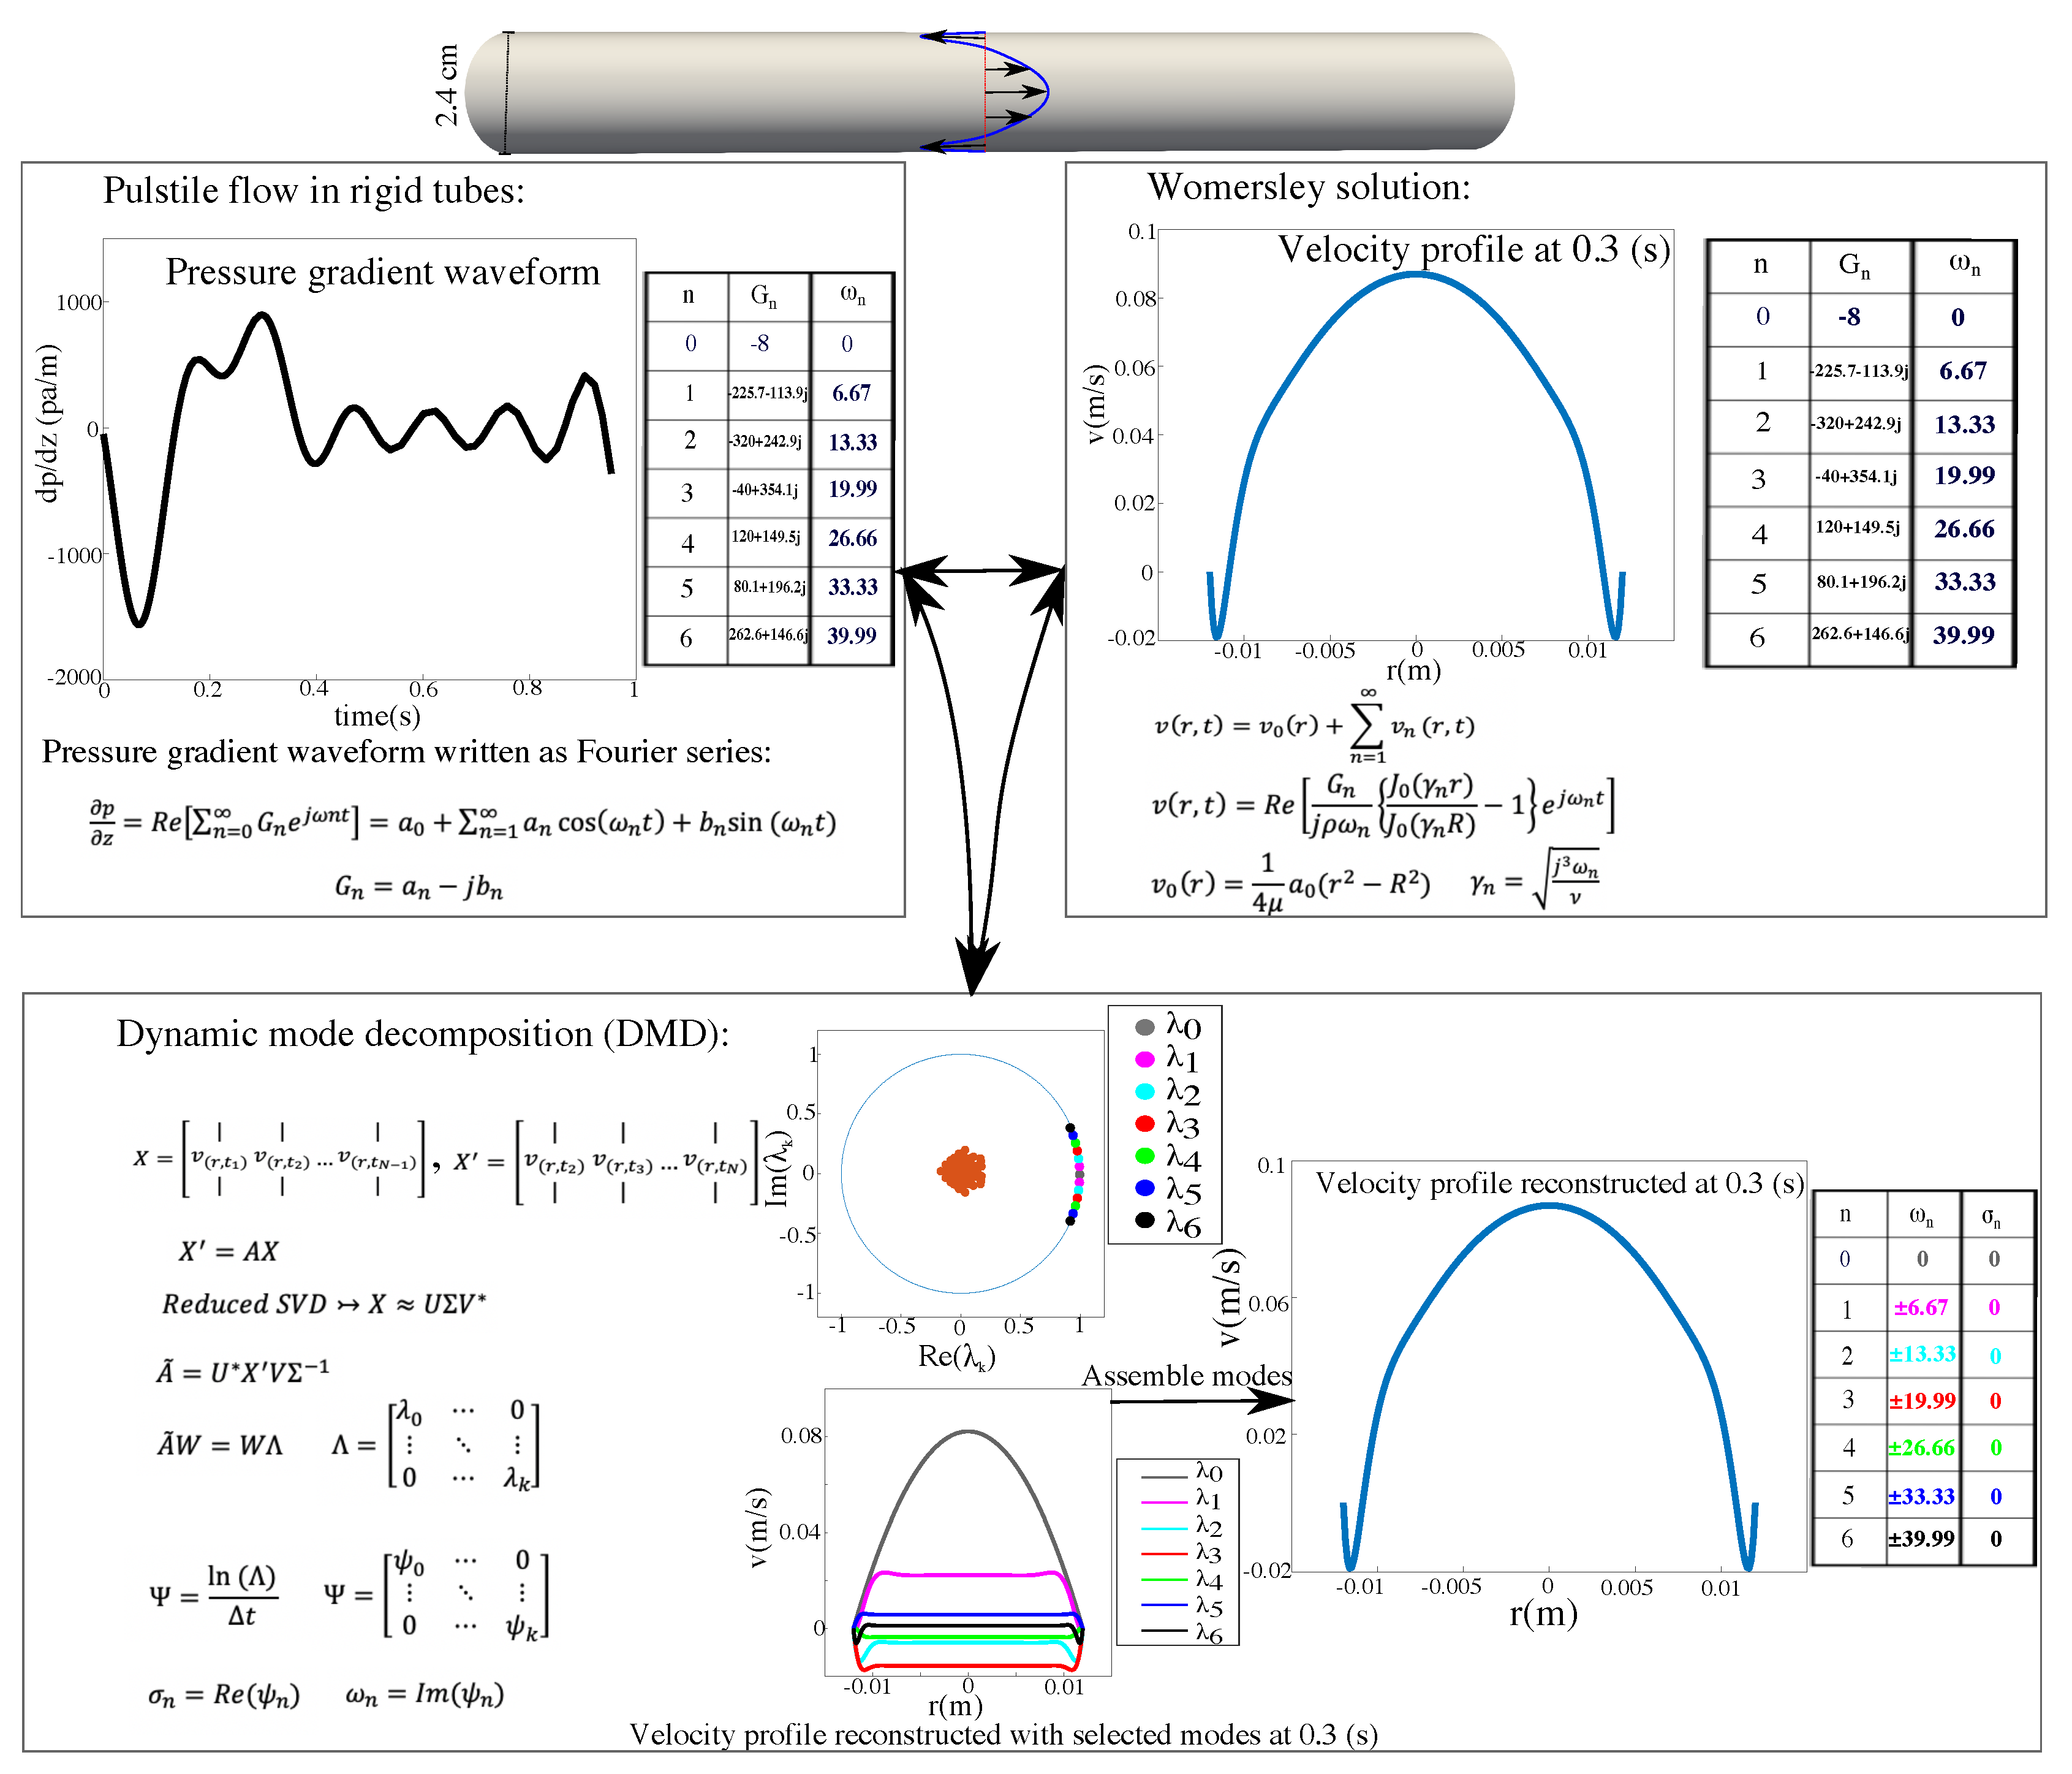
Figure 4.
Two representative velocity DMD modes are shown for the original DMD method applied on the entire cardiac cycle. The location of discrete eigenvalues in the unit circle corresponding to the selected DMD modes are shown. Velocity streamlines are shown and colored by their magnitude. (a) Real part of the DMD mode corresponding to the eigenvalue , (b) real part of the DMD mode corresponding to the eigenvalue for the coronary artery stenosis and (c) real part of the DMD mode corresponding to the eigenvalue , (d) real part of the DMD mode corresponding to the eigenvalue for the cerebral aneurysm model are shown.
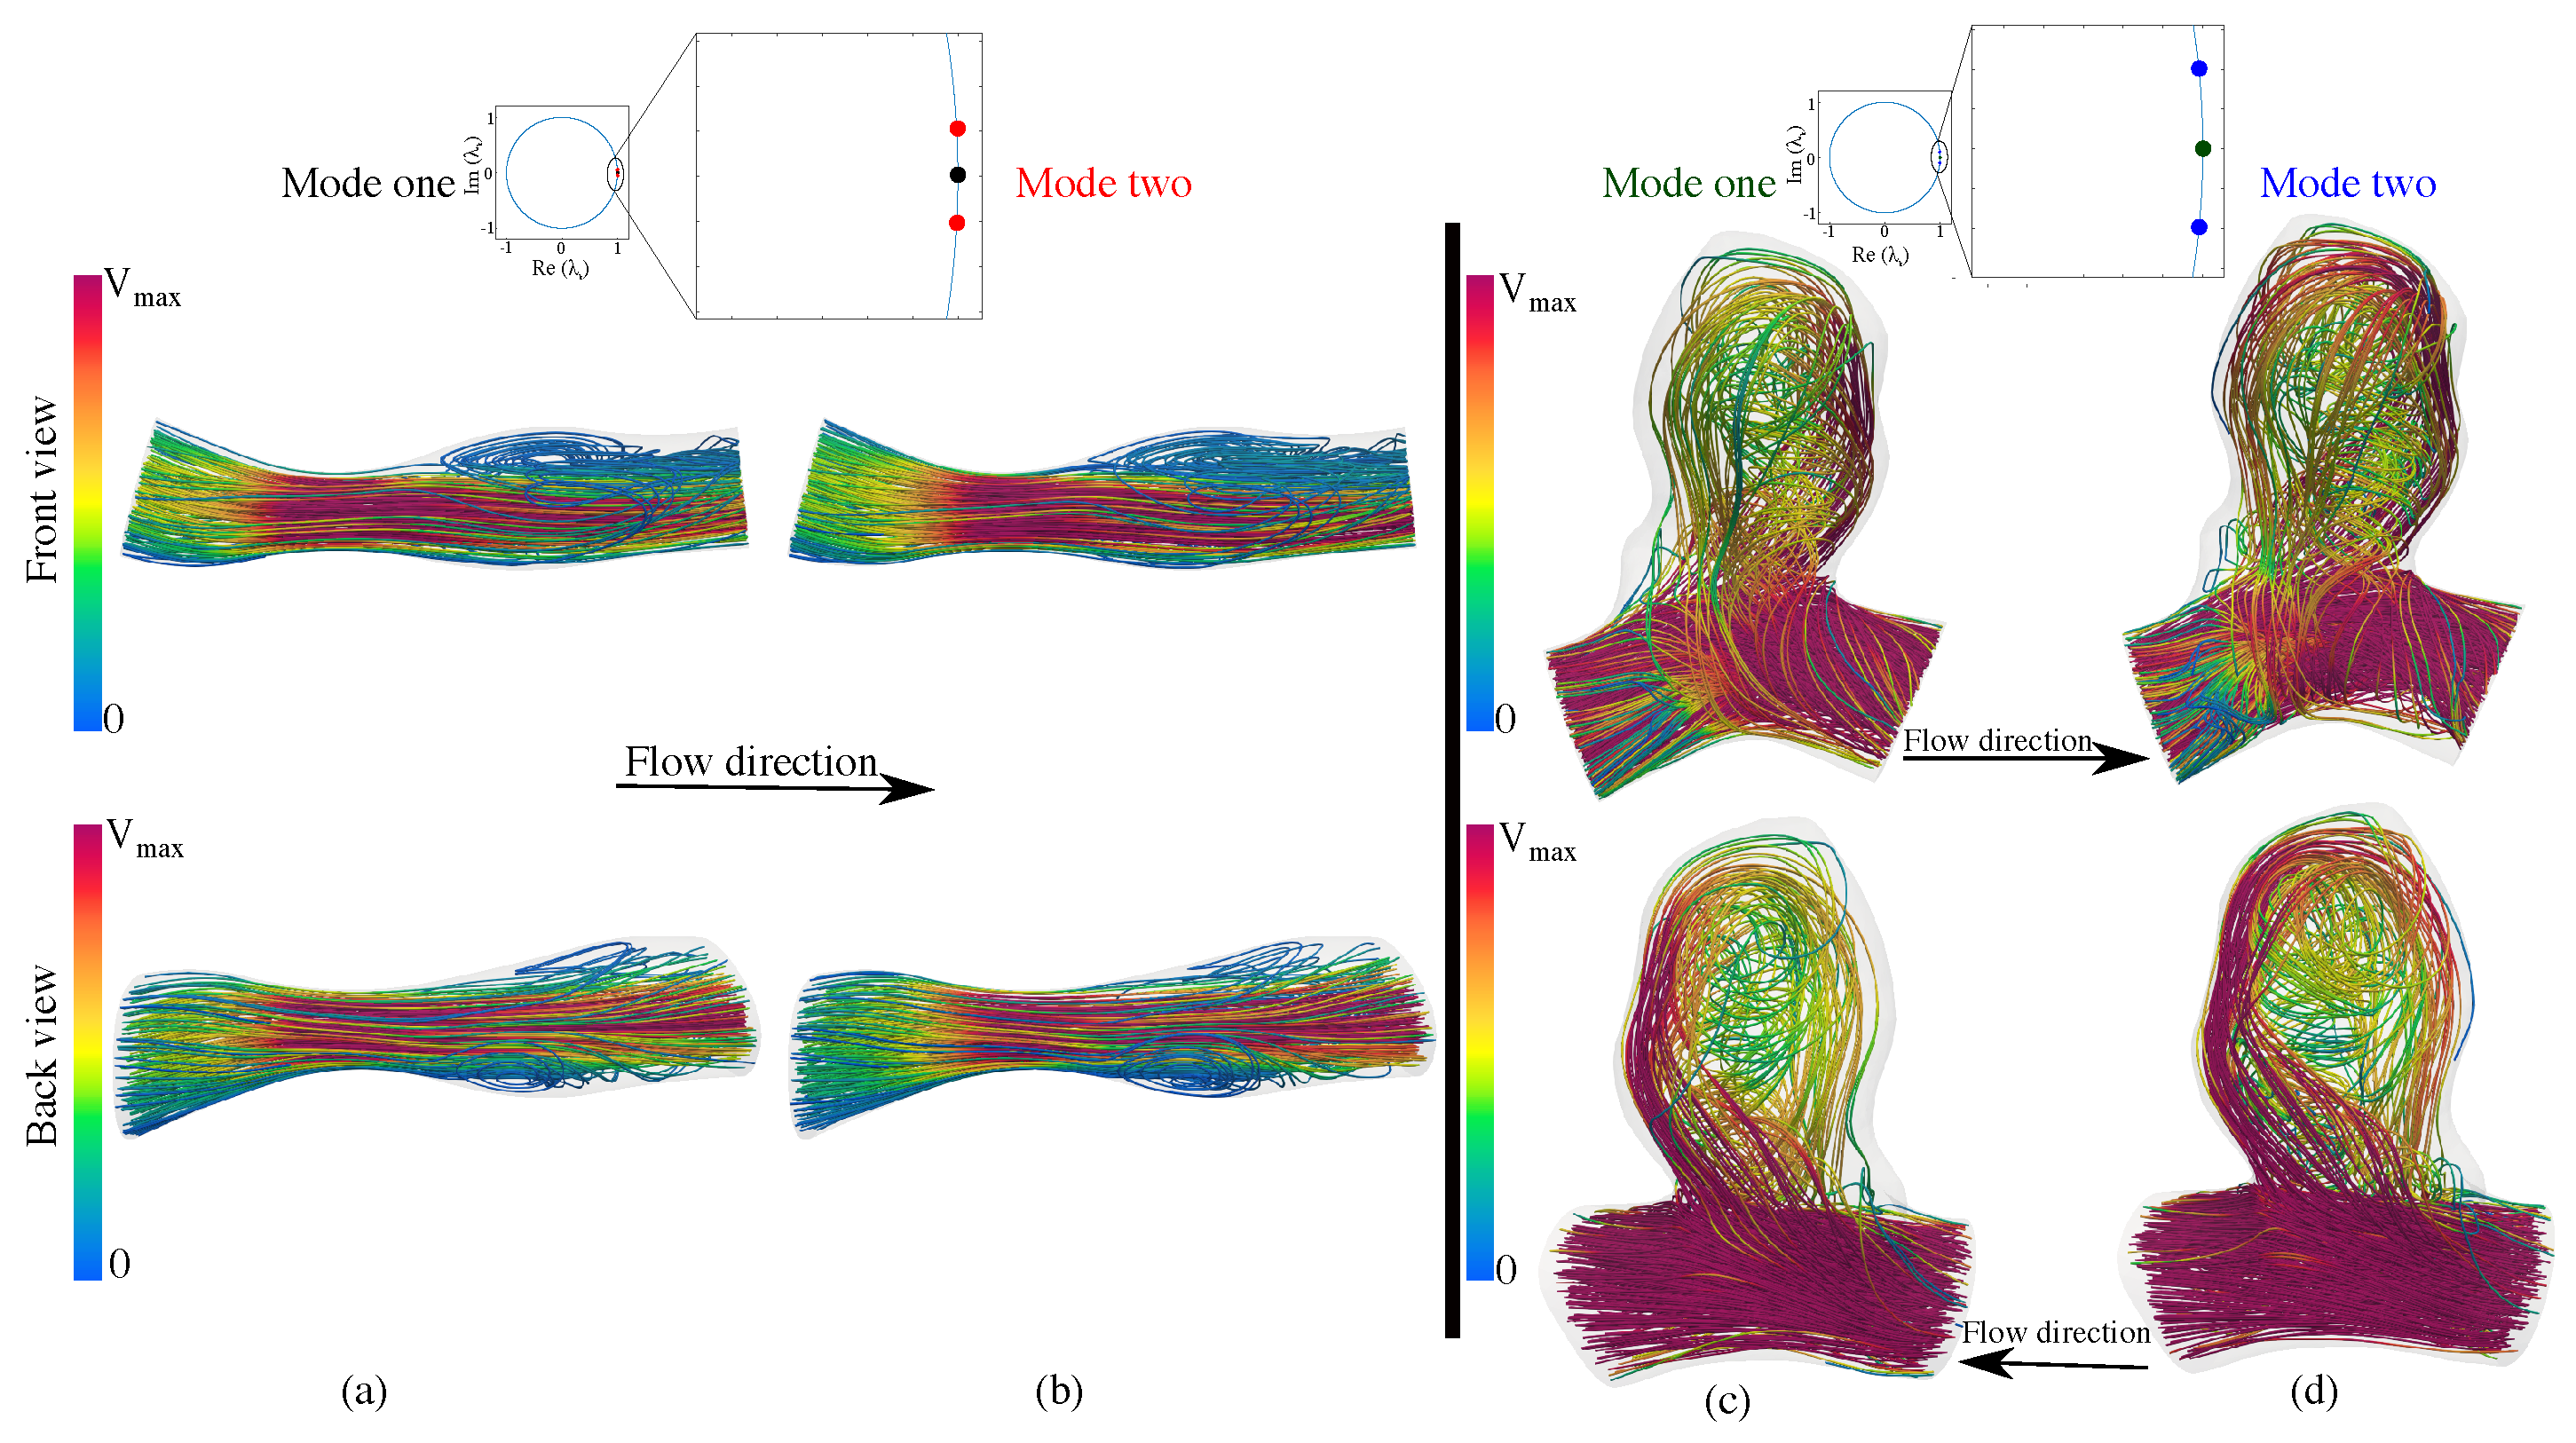
Figure 5.
Velocity and wall shear stress (WSS) computational fluid dynamics (CFD) data and the multistage DMD with control (mDMDc) modes are shown in the first stage of the coronary artery stenosis model. The stage is highlighted with a red dashed line in the flow waveform. The location of discrete eigenvalues in the unit circle corresponding to the selected mDMDc modes are shown. Velocity and WSS streamlines are shown and colored by their magnitude. WSS vectors are normalized and shown on top of the WSS streamlines to show the WSS vector direction. (a) CFD data (time = 0.11 s), (b) reconstructed data with 95% accuracy, (c) real part of the mDMDc mode corresponding to the eigenvalue , (d) real part of the mDMDc mode corresponding to the eigenvalue , (e) real part of the mDMDc mode corresponding to the eigenvalue .
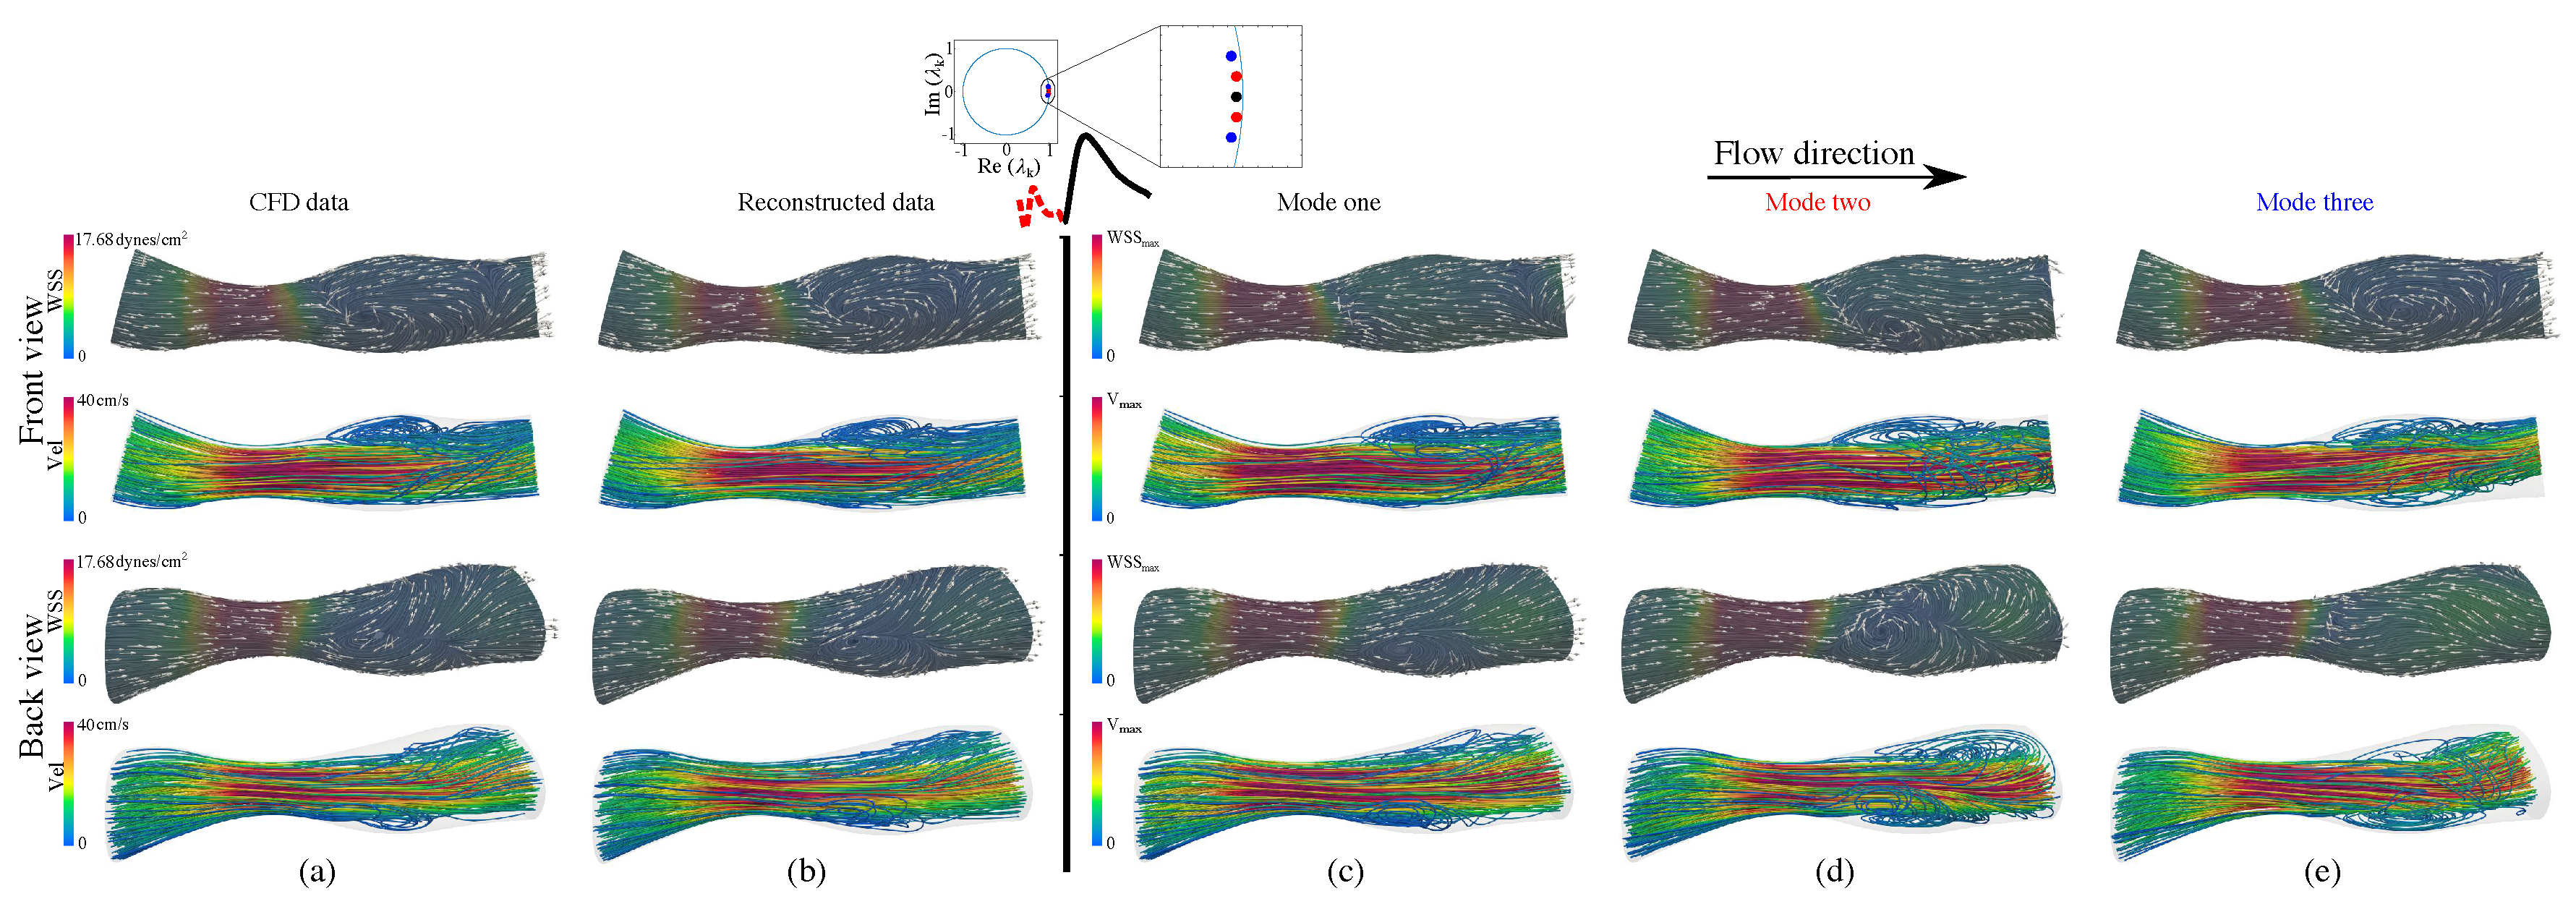
Figure 6.
Velocity and WSS CFD data and the mDMDc modes are shown in the second stage of the coronary artery stenosis model. The stage is highlighted with a red dashed line in the flow waveform. The location of discrete eigenvalues in the unit circle corresponding to the selected mDMDc modes are shown. Velocity and WSS streamlines are shown and colored by their magnitude. WSS vectors are normalized and shown on top of the WSS streamlines to show the WSS vector direction. (a) CFD data (time = 0.36 s), (b) reconstructed data with 95% accuracy, (c) real part of the mDMDc mode corresponding to the eigenvalue , (d) real part of the mDMDc mode corresponding to the eigenvalue , (e) real part of the mDMDc mode corresponding to the eigenvalue .
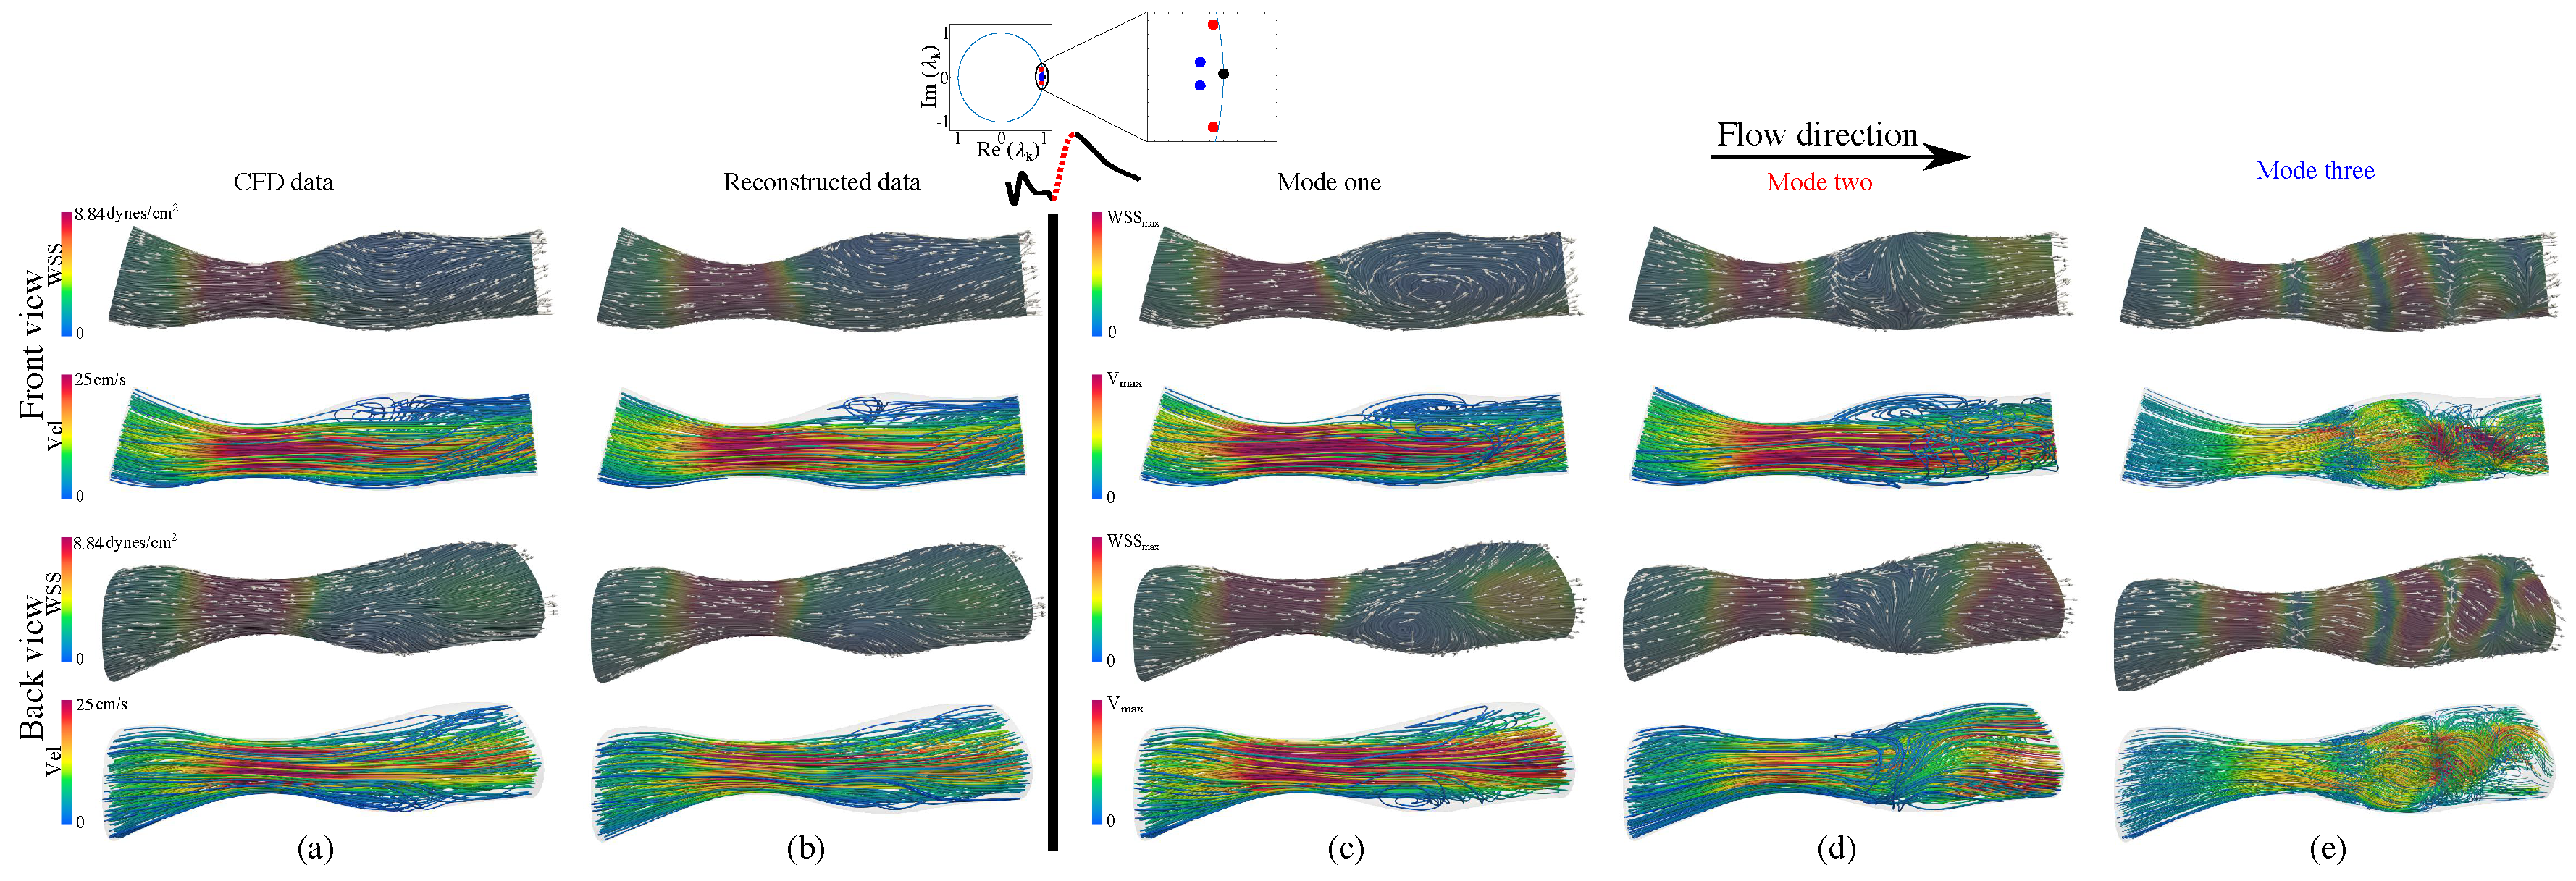
Figure 7.
Velocity and WSS CFD data and the mDMDc modes are shown in the third stage of the coronary artery stenosis model. The stage is highlighted with a red dashed line in the flow waveform. The location of discrete eigenvalues in the unit circle corresponding to the selected mDMDc modes are shown. Velocity and WSS streamlines are shown and colored by their magnitude. WSS vectors are normalized and shown on top of the WSS streamlines to show the WSS vector direction. (a) CFD data (time = 0.8 s), (b) reconstructed data with 95% accuracy, (c) real part of the mDMDc mode corresponding to the eigenvalue , (d) real part of the mDMDc mode corresponding to the eigenvalue , (e) real part of the mDMDc mode corresponding to the eigenvalue .

Figure 8.
Velocity and WSS CFD data and the mDMDc modes are shown in the second stage of the cerebral aneurysm model. The stage is highlighted with a red dashed line in the flow waveform. The location of discrete eigenvalues in the unit circle corresponding to the selected mDMDc modes are shown. Velocity and WSS streamlines are shown and colored by their magnitude. WSS vectors are normalized and shown on top of the WSS streamlines to show the WSS vector direction. (a) CFD data (time = 0.01 s), (b) reconstructed data with 95% accuracy, (c) real part of the mDMDc mode corresponding to the eigenvalue , (d) real part of the mDMDc mode corresponding to the eigenvalue , (e) real part of the mDMDc mode corresponding to the eigenvalue .
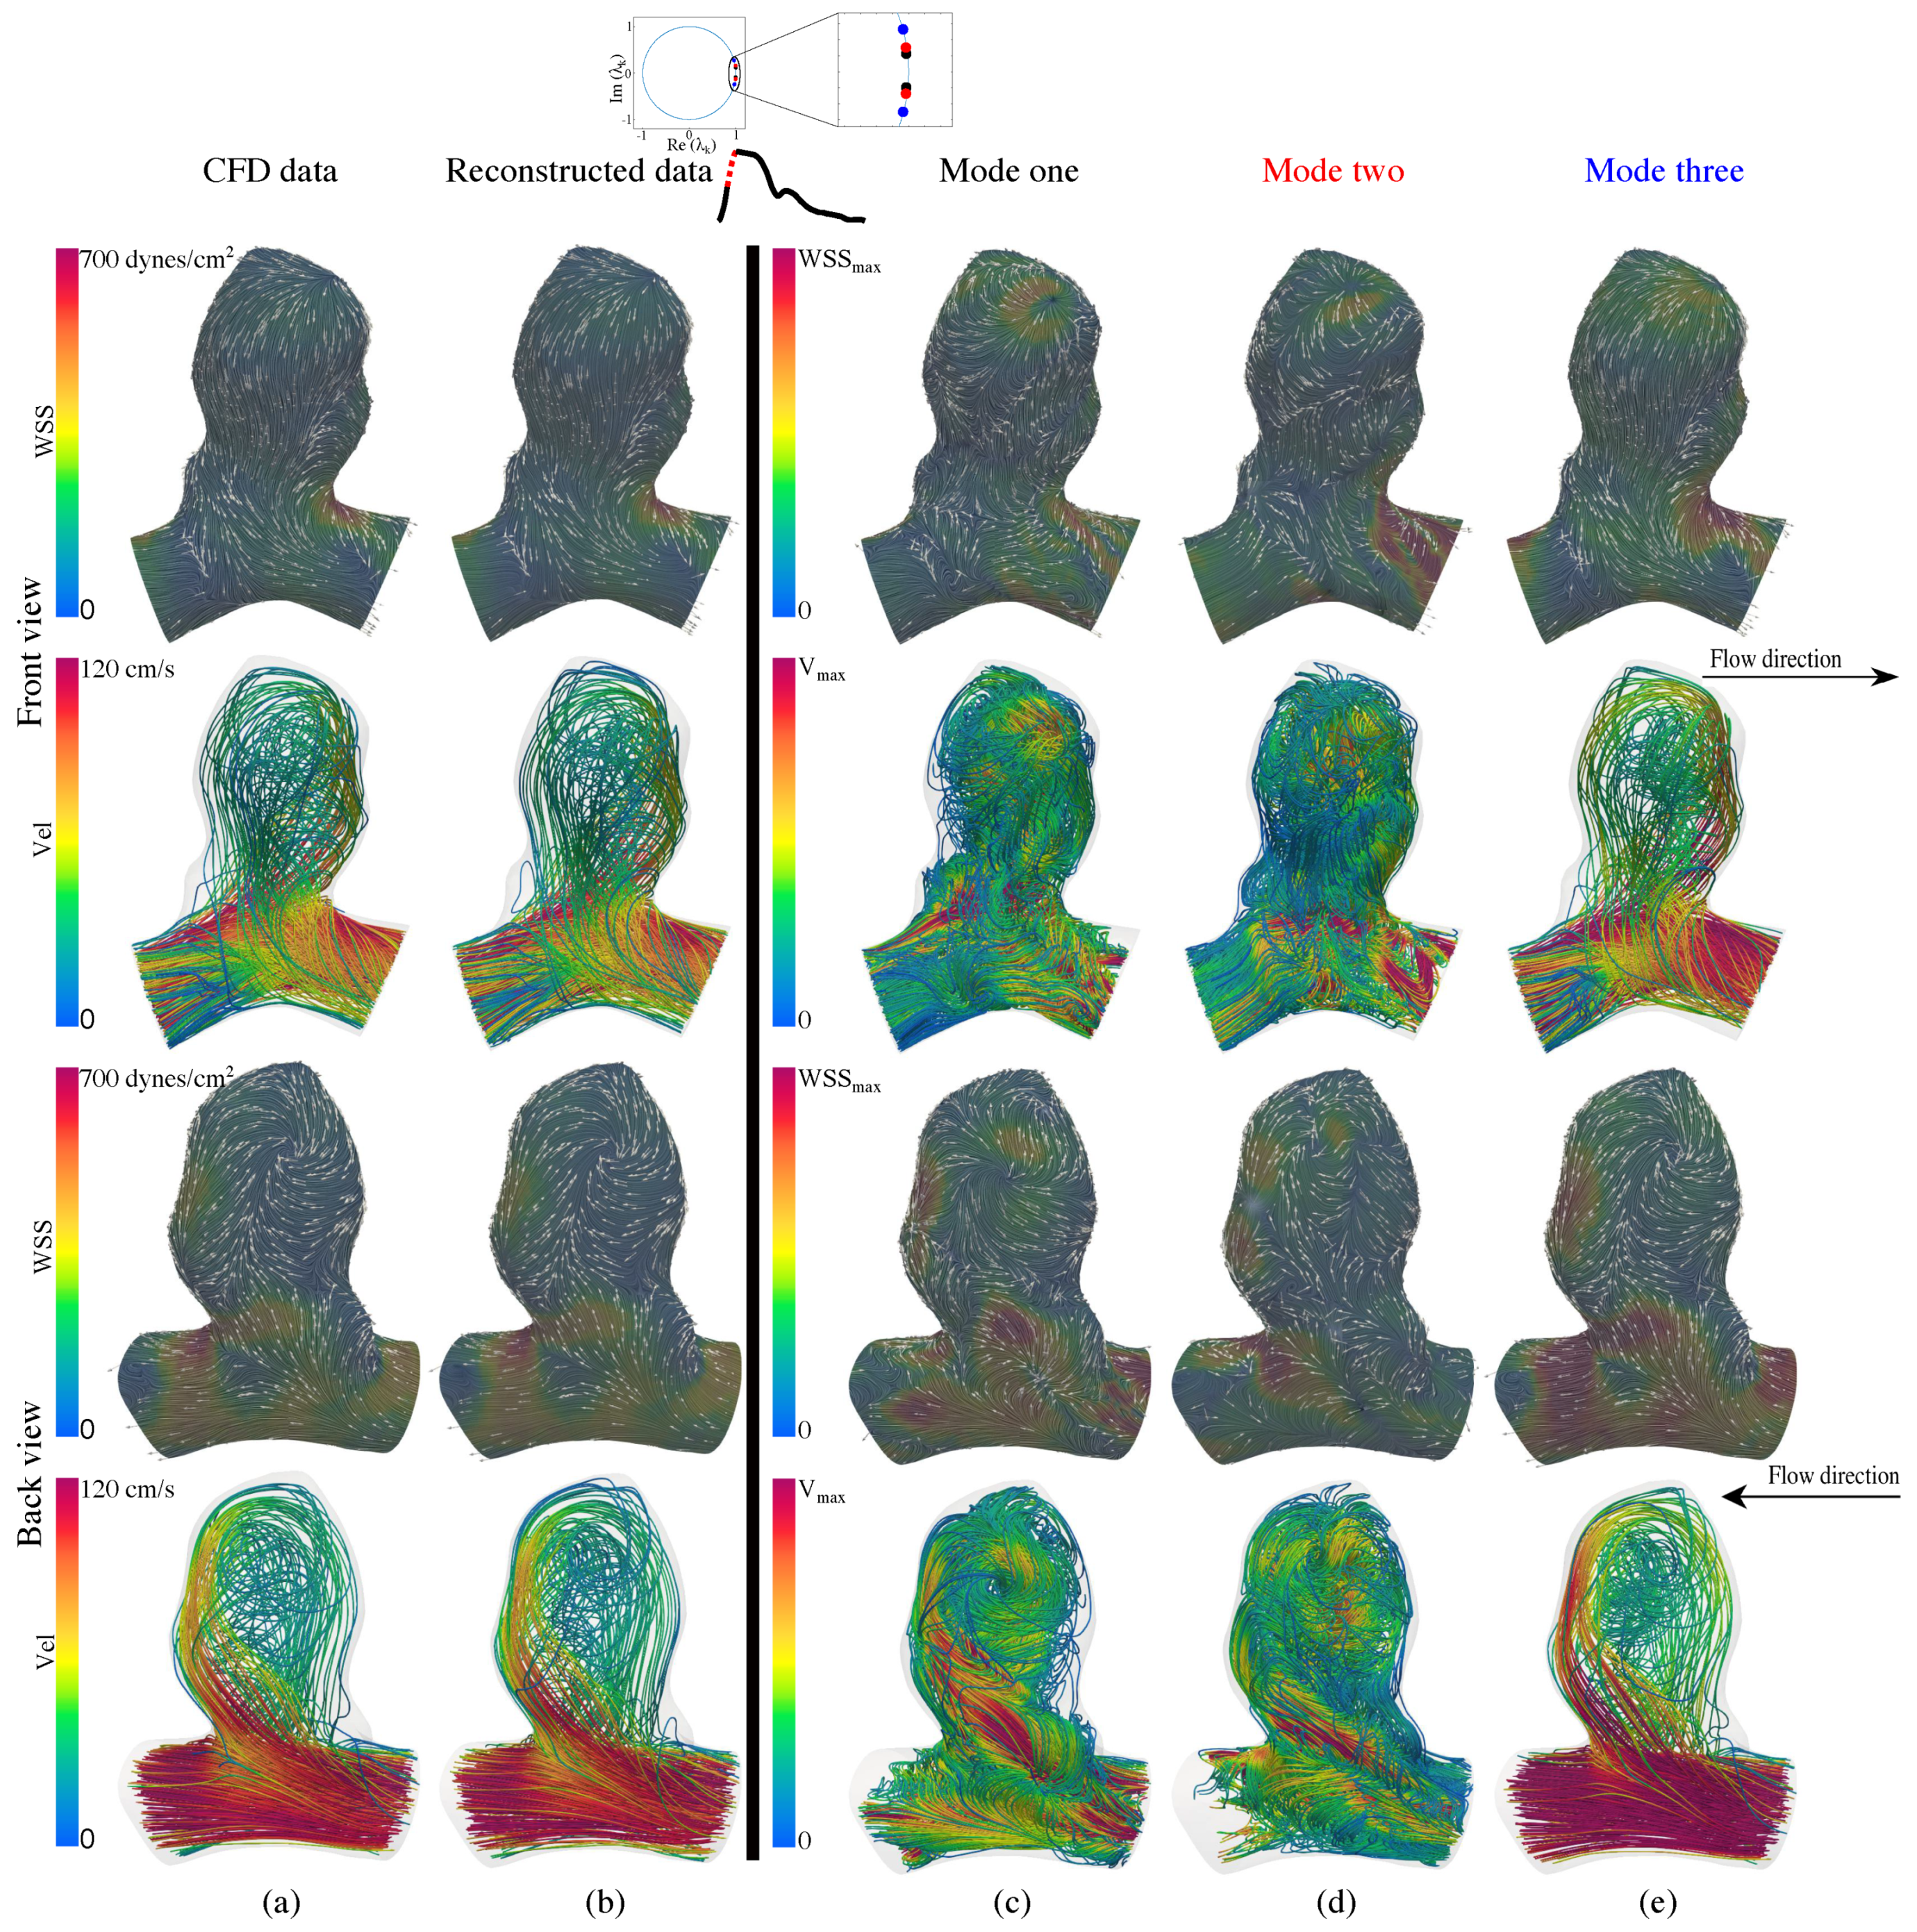
Figure 9.
Velocity and WSS CFD data and the mDMDc modes are shown in the fourth stage of the cerebral aneurysm model. The stage is highlighted with a red dashed line in the flow waveform. The location of discrete eigenvalues in the unit circle corresponding to the selected mDMDc modes are shown. Velocity and WSS streamlines are shown and colored by their magnitude. WSS vectors are normalized and shown on top of the WSS streamlines to show the WSS vector direction. (a) CFD data (time = 0.29 s), (b) reconstructed data with 95% accuracy, (c) real part of the mDMDc mode corresponding to the eigenvalue , (d) real part of the mDMDc mode corresponding to the eigenvalue , (e) real part of the mDMDc mode corresponding to the eigenvalue .
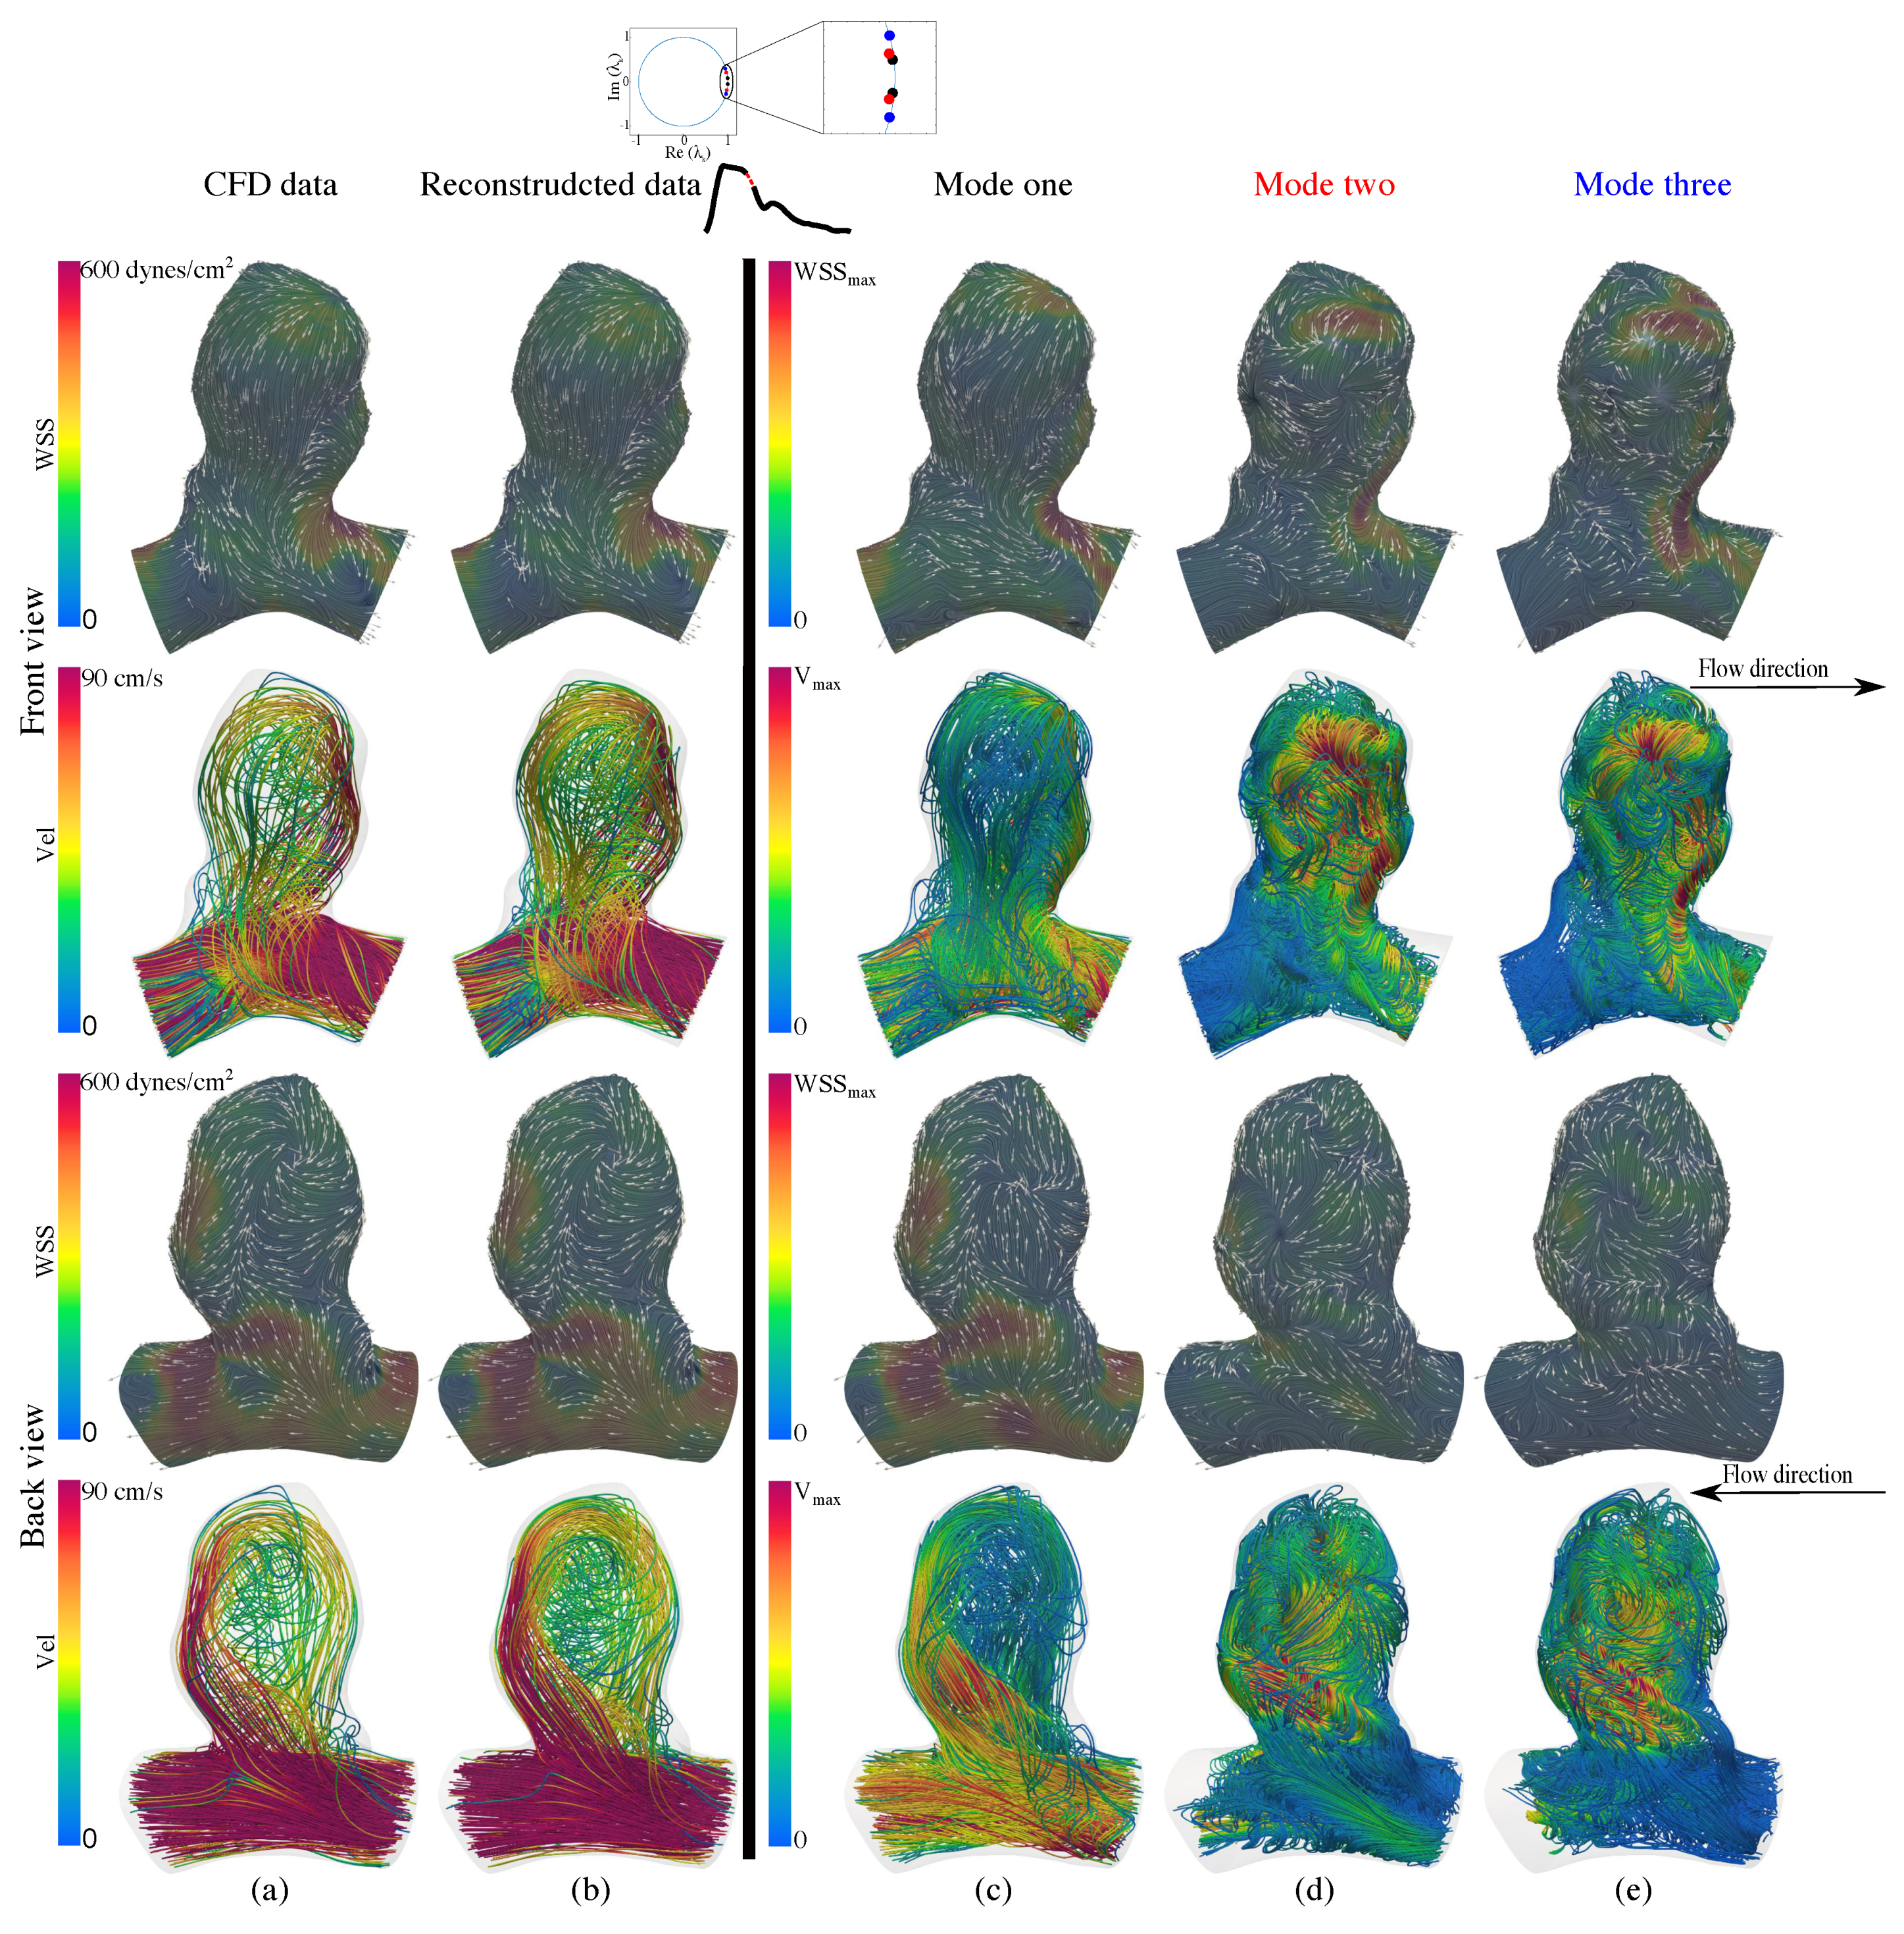
Figure 10.
Velocity and WSS CFD data and the mDMDc modes are shown in the sixth stage of the cerebral aneurysm model. The stage is highlighted with a red dashed line in the flow waveform. The location of discrete eigenvalues in the unit circle corresponding to the selected mDMDc modes are shown. Velocity and WSS streamlines are shown and colored by their magnitude. WSS vectors are normalized and shown on top of the WSS streamlines to show the WSS vector direction. (a) CFD data (time = 0.47 s), (b) reconstructed data with 95% accuracy, (c) real part of the mDMDc mode corresponding to the eigenvalue , (d) real part of the mDMDc mode corresponding to the eigenvalue , (e) real part of the mDMDc mode corresponding to the eigenvalue .


Table 1.
The minimum number of modes required to reach a specified reconstruction accuracy in velocity data is shown for the coronary artery stenosis model. The spatiotemporal average of data () is shown for each stage.
Table 1.
The minimum number of modes required to reach a specified reconstruction accuracy in velocity data is shown for the coronary artery stenosis model. The spatiotemporal average of data () is shown for each stage.
| Accuracy | 90% | 95% | 98% | 99% | 99.5% | (cm/s) | |
|---|---|---|---|---|---|---|---|
| Stage Number | |||||||
| 1st stage | 8 | 13 | 14 | 23 | 30 | 4.5 | |
| 2nd stage | 4 | 4 | 5 | 7 | 10 | 7.6 | |
| 3rd stage | 2 | 2 | 3 | 3 | 8 | 7.8 | |
Table 2.
The minimum number of modes required to reach a specified reconstruction accuracy in wall shear stress (WSS) data is shown for the coronary artery stenosis model. The spatiotemporal average of data () is shown for each stage.
Table 2.
The minimum number of modes required to reach a specified reconstruction accuracy in wall shear stress (WSS) data is shown for the coronary artery stenosis model. The spatiotemporal average of data () is shown for each stage.
| Accuracy | 90% | 95% | 98% | 99% | 99.5% | (dynes/cm2) | |
|---|---|---|---|---|---|---|---|
| Stage Number | |||||||
| 1st stage | 10 | 13 | 23 | 32 | 41 | 1.5 | |
| 2nd stage | 4 | 5 | 6 | 8 | 18 | 3.0 | |
| 3rd stage | 2 | 2 | 3 | 4 | 10 | 3.1 | |
Table 3.
The minimum number of modes required to reach a specified reconstruction accuracy in velocity data is shown for the cerebral aneurysm model. The spatiotemporal average of data () is shown for each stage.
Table 3.
The minimum number of modes required to reach a specified reconstruction accuracy in velocity data is shown for the cerebral aneurysm model. The spatiotemporal average of data () is shown for each stage.
| Accuracy | 90% | 95% | 98% | 99% | 99.5% | (cm/s) | |
|---|---|---|---|---|---|---|---|
| Stage Number | |||||||
| 1st stage | 3 | 3 | 4 | 5 | 12 | 7.1 | |
| 2nd stage | 2 | 2 | 3 | 5 | 6 | 17.8 | |
| 3rd stage | 5 | 5 | 7 | 13 | 22 | 22.1 | |
| 4th stage | 3 | 3 | 4 | 9 | 20 | 19.2 | |
| 5th stage | 3 | 6 | 6 | 10 | 18 | 14.1 | |
| 6th stage | 5 | 5 | 13 | 31 | 48 | 8.4 | |
Table 4.
The minimum number of modes required to reach a specified reconstruction accuracy in wall shear stress (WSS) data is shown for the cerebral aneurysm model. The spatiotemporal average of data () is shown for each stage.
Table 4.
The minimum number of modes required to reach a specified reconstruction accuracy in wall shear stress (WSS) data is shown for the cerebral aneurysm model. The spatiotemporal average of data () is shown for each stage.
| Accuracy | 90% | 95% | 98% | 99% | 99.5% | (dynes/cm2) | |
|---|---|---|---|---|---|---|---|
| Stage Number | |||||||
| 1st stage | 3 | 3 | 4 | 5 | 19 | 23.6 | |
| 2nd stage | 2 | 2 | 3 | 5 | 6 | 78.5 | |
| 3rd stage | 5 | 10 | 10 | 13 | 25 | 105.6 | |
| 4th stage | 7 | 7 | 7 | 9 | 20 | 86.9 | |
| 5th stage | 3 | 3 | 4 | 9 | 17 | 56.6 | |
| 6th stage | 5 | 13 | 13 | 31 | 53 | 3.6 | |
Table 5.
The minimum number of modes required to reach a specified reconstruction accuracy in velocity data is shown for the traditional DMD model applied to the entire data. The spatiotemporal average of data () is reported for each system.
Table 5.
The minimum number of modes required to reach a specified reconstruction accuracy in velocity data is shown for the traditional DMD model applied to the entire data. The spatiotemporal average of data () is reported for each system.
| Accuracy | 90% | 95% | 98% | 99% | 99.5% | (cm/s) |
|---|---|---|---|---|---|---|
| Coronary artery stenosis | 27 | 41 | 53 | 77 | 88 | 6.7 |
| Cerebral aneurysm | 96 | 110 | 155 | 165 | 173 | 12.1 |
© 2020 by the authors. Licensee MDPI, Basel, Switzerland. This article is an open access article distributed under the terms and conditions of the Creative Commons Attribution (CC BY) license (http://creativecommons.org/licenses/by/4.0/).
Share and Cite
MDPI and ACS Style
Habibi, M.; Dawson, S.T.M.; Arzani, A. Data-Driven Pulsatile Blood Flow Physics with Dynamic Mode Decomposition. Fluids 2020, 5, 111. https://doi.org/10.3390/fluids5030111
AMA Style
Habibi M, Dawson STM, Arzani A. Data-Driven Pulsatile Blood Flow Physics with Dynamic Mode Decomposition. Fluids. 2020; 5(3):111. https://doi.org/10.3390/fluids5030111
Chicago/Turabian StyleHabibi, Milad, Scott T. M. Dawson, and Amirhossein Arzani. 2020. "Data-Driven Pulsatile Blood Flow Physics with Dynamic Mode Decomposition" Fluids 5, no. 3: 111. https://doi.org/10.3390/fluids5030111