Assessment of CFD Solvers and Turbulent Models for Water Free Jets in Spillways


1
Hydraulics and Environment Department, Laboratório Nacional de Engenharia Civil (LNEC), 1049-001 Lisboa, Portugal
2
Civil Engineering, Architecture and Georesources Department—CERIS, Instituto Superior Técnico, Universidade de Lisboa, 1049-001 Lisboa, Portugal
*
Author to whom correspondence should be addressed.
Fluids 2020, 5(3), 104; https://doi.org/10.3390/fluids5030104
Submission received: 19 May 2020
/
Revised: 25 June 2020
/
Accepted: 28 June 2020
/
Published: 30 June 2020
(This article belongs to the Special Issue Advances in Numerical Methods for Multiphase Flows)
Abstract
:The capability of two different OpenFOAM® solvers, namely interFoam and twoPhaseEulerFoam, in reproducing the behavior of a free water jet was investigated. Numerical simulations were performed in order to obtain the velocity and air concentration profiles along the jet. The turbulence intensity was also analyzed. The obtained results were compared with published experimental data and, in general, similar velocity and air concentration profiles were found. InterFoam solver is able to reproduce the velocity field of the free jet but has limitations in the simulation of the air concentration. TwoPhaseEulerFoam performs better in reproducing the air concentration along the jet, the results being in agreement with the experimental data, although the computational runs are less stable and more time consuming. The sensitivity analysis of the inlet turbulent intensity showed that it has no influence in the characteristics of the jet core. With this research it is possible to conclude that: interFoam with k-Epsilon (k-ε) turbulence model is the best choice if the goal of the numerical simulations is the simulation of the velocity field of the jet. Meanwhile, twoPhaseEulerFoam with mixturek-Epsilon (mk-ε) shall be considered if the objective is the simulation of the velocity field and the air concentration.
1. Introduction
Spillways are key hydraulic structures for the safety of dams that produce high velocity and turbulent water flows. The energy dissipation of this type of flow is a major concern due to the dynamic pressures and velocities associated to the significant flow turbulence at the downstream zone [1,2,3]. A correct definition of the most important jet parameters is fundamental in the spillway design [4]. In the past, a few studies have been conducted to characterize the flow velocities, air concentrations and turbulence in high velocity water jets [5,6,7,8]. Toombes and Chanson [9] carried out an experimental study of the water–air flow properties in a turbulent water jet, in which air concentration and water–air velocity profiles were measured. Lin et al. [10] characterized the mean velocity of a jet in an experimental facility. Steiner et al. [11] focused their laboratory tests on the definition of the lower and upper nappe trajectories and energy dissipation across the ski jump and, using the same experimental facility, Pfister et al. [12] compared their observations with those published by various other researchers, with the focus on the geometry of the upper and lower nappe jet trajectories and downstream impact characteristics.
Recently, numerical simulation has been gaining importance as a tool for the characterization of complex flows, such as those occurring in spillways [13]. Deshpande et al. [14] studied a circular jet falling into a plunge pool and performed a comparison between numerical and experimental results. Castillo et al. [15] compared numerically calculated velocities along the jet trajectory and the pressures at the impact area with experimental and empirical data. Shonibare and Wardle [16] carried out numerical simulations of a vertical jet impinging on a plunge pool and compared the obtained jet water–air interfaces with experimentally obtained ones. Castillo et al. [17] analyzed the velocity and turbulent kinetic energy in a plunge pool downstream of a rectangular jet and performed a comparison of the numerically obtained results with the experimental ones.
This study aims at validating numerical simulations of a free water jet by comparing obtained results against experimental data under equivalent conditions published by Toombes and Chanson [9]. The numerical results of the velocity and air concentration profiles along the jet are compared with these data in order to evaluate how they match. Also, regarding the turbulence intensity, the influence of its value at the jet initial cross-section on the reproduction of turbulence evolution along the jet trajectory was assessed.
The numerical simulations were carried out using the OpenFOAM® code, a C++ library enabling the simulation of a wide range of engineering cases, incorporating a number of solvers that cover many types of problems in continuous mechanics, such as the interFoam and twoPhaseEulerFoam solvers which were used in this study. Both solvers can model water–air flows by solving a full version of the Navier–Stokes equations. To capture the free surface position, each solver uses a specific methodology [18,19,20].
2. Numerical Modelling
Water–air interaction poses important challenges when numerical simulations of high velocity turbulent flows are involved [21]. The water jets’ air entrainment process is a complex phenomenon that, although involving a wide range of dimensions of air bubbles, those dimensions are much smaller than the acceptable cells’ size for the domain mesh discretization [19,22]. The simulation of a spillway requires domains with dimensions of meters, whereas the diameter of the bubbles is of the order of millimeters. If one considers mesh cell sizes on the same order of magnitude of the air bubbles diameters, domains will involve an excessive number of cells. Presently, mesh cells’ sizes and the total number of cells in the domain are conditioned by the computational limitations of the currently available computers, so a compromise between mesh resolution and computational time effort has to be found.
2.1. Comparison of the Used Solvers
InterFoam can solve problems with two incompressible, isothermal, immiscible fluids and uses VOF method to define the shape and position of the interface between the two fluids [18,23]. It solves the Navier-Stokes equations by means of the pressure implicit splitting of operators (PISO) algorithm [24], in order to define the flow pressure and velocity fields. The continuity and momentum equation implemented in this solver are present in Equations (1) and (2), respectively. To take into account the percentage of fluid inside each cell, density and viscosity are calculated based on the liquid volume fraction defined on the fluid interface.
where denotes velocity, , density defined as , , liquid volume fraction, if cell is filled with fluid 1; if cell filled with fluid 2, , time, , modified pressure, , water depth, , kinematic viscosity defined as ,, gravitational acceleration, and , surface tension.
The fluids’ interface based on the VOF method is not stable for cases in which the interface is unsteady, particularly when a noticeable water–air mixture is involved. Therefore, an accurate definition of the water–air interface by the VOF method depends significantly on the mesh resolution at the interface region. Due to that, water droplets or air bubbles smaller than the cell size cannot be adequately represented [20]. In simulating developed aerated jets, this limitation of the VOF method has to be taken into account, in contrast to undeveloped jets, in which null air concentration can be assumed.
TwoPhaseEulerFoam, being based on a Euler–Euler model [18,25], is able to solve problems of two compressible fluid phases with one of the phases dispersed. This solver treats each phase as a continuum, allowing fluids to inter-penetrate using the Eulerian conservation equations [19]. Equations (3) and (4) represent the continuity and momentum equations used by this solver.
where:
- subscript defines the phase;
- —phase fraction;
- —velocity;
- —pressure;
- —combined turbulent (Reynolds) and viscous stress;
- —inter-phase momentum transfer term.
The main difference between interFoam and twoPhaseEulerFoam is the ability of latter to define two different phases of the fluids and the former only solving one equation defining, each fluid quantity in each cell based on the data from de VOF method. For example, interFoam calculates the velocity field over the whole domain, regardless of the fluid being one or the other (water and air in the present study). Differently, twoPhaseEulerFoam calculates the velocity of the water and the velocity of the air, separately. With this formulation, the momentum transfer between phases is duly considered, which is an important aspect of water jet’s diffusion in the atmosphere. Comparing Equation (2) with Equation (4), it is possible to verify the former does not have a term related to the momentum transfer between fluids, whereas the latter includes the term allowing to incorporate this phenomenon. Table 1 presents the main characteristics of each solver.
2.2. Turbulence Models
With the solver interFoam, the k-Epsilon (k-ε) [26] and SST k-Omega (SST k-) [27,28] turbulence models were used, whereas with twoPhaseEulerFoam, besides these two, the mixturek-Epsilon (mk-ε) model was also analyzed. Mk-ε, due to its formulation, is only available for the solver twoPhaseEulerFoam. All these turbulent models are characterized by two-equations systems and assume that Reynolds stresses are proportional to the mean velocity gradients [26,27]. k-ε and SST k- use an Eulerian approach and are characterized by two-phase flow models. These turbulence models produce a good approximation of the turbulence kinetic energy and the turbulence dissipation rate for flows with a dominant continuous phase, for example a water–air mixture with about 2% of air concentration (C = Volair/Voltot) The turbulent kinetic energy and the turbulent kinetic energy dissipation rate implemented in k-ε model are present in Equations (5) and (6). In the same way, in Equations (7) and (8), the turbulent kinetic energy and the turbulent kinetic energy dissipation rate used by SST k- are represented.
where:
- —turbulent kinetic energy;
- —effective diffusivity for ;
- —turbulent kinetic energy production rate;
- —turbulent kinetic energy dissipation rate;
- —effective diffusivity for ;
- , and —model coefficients, , , ;
- —turbulent kinetic energy production rate;
- —model coefficient, ;
- —internal source term for k
- —turbulent kinetic energy dissipation rate;
- —effective diffusivity for ;
- —viscosity;
- —closure coefficient;
- —lending function;
- ;
- —internal source term for .
However, for a water–air mixture with a high air concentration, 40%, which means a high mixture phase, the results are not reliable [25]. Ervine and Falvey [7] analyzed different types of jet and measured air concentrations in up to 50%, depending on the jet trajectory length. Thus, the limitations of the k-ε and SST k- turbulent models in the simulation of high mixture phase flows may be an important restriction to the simulation of developed aerated jets. To deal with this, Behzadi et al. [25] propose a turbulence model for dispersed two-phase flows with high values of mixture phase, mk-ε. These authors advise the inclusion of a turbulence response coefficient in the standard k-ε formulation, which considers the influence of the concentration of the disperse phase on the turbulence response function. The referred coefficient is defined by the velocity fluctuations in the dispersed phase divided by the velocity fluctuations in the continuous phase. Behzadi et al. [25] compared the obtained results with experimental ones for different case studies, such as the flow inside a circular pipe with a sudden enlargement and an air flow inside a water tank with free surface, presented by Rusche [29], an improvement in the quality of the results obtained with the model mk-ε having been remarked when compared with the results of the k-ε model.
2.3. Mesh
In order to enable the comparison between numerical results with those obtained experimentally, the considered domain essentially matches the experimental facility used by Toombes and Chanson [9]. This includes the 0.237 m (W0) wide channel, with a 0.143 m (h) free overfall at the downstream end, followed by a 0.250 m (W) wide channel. The step is located 0.620 m (x0) downstream of a sluice gate, which controls the flow in the channel (Figure 1).
A two-dimensional domain was used to perform the numerical simulations, corresponding to a window with a vertical section of the longitudinal axis of the experimental facility, 1.450 m long, and 0.300 m high, as shown in Figure 2.
Three meshes were developed to assess the best compromise between results accuracy and computational time effort: (i) first mesh involved a homogenous set of 2.00 mm cells (Figure 3a); (ii) a second mesh was considered, adopting a non-homogenous pattern and local refinement, leading to a cell size of 2.00 mm in the sub-domains distant from the water jet and 1.00 mm in the sub-domains near the water jet, where the mixing zones are likely to develop (Figure 3b); (iii) a third mesh type, involving additional refinement, was then considered in the water jet and vicinity zone, with cells of 0.25 mm (Figure 3c). The studied meshes were generated using blockMesh an OpenFOAM utility. In Table 2 the main characteristics of the analyzed meshes are summarized, cell dimensions in the different zones, number of cells in a jet section, total cell number of the mesh and y+ in the last section of the approach channel are present.
The comparison of the velocity profiles of the jet for each of the three meshes was analyzed at the initial jet cross-section, at x = 0.00 m (S0), and at a downstream cross-section, at x = 0.10 m (S1).
The results obtained using interFoam and the k-ε turbulent model are presented in Figure 4. The plot represents the dimensionless vertical distance Z’ as defined in Equation (9) against, the dimensionless velocity defined in Equation (10).
where:
- —vertical distance (m);
- —vertical distance of the point with C = 0.5 in the upper nappe to the floor (m);
- —vertical distance of the point with C = 0.5 in the lower nappe to the floor (m);
- —approach flow depth (m);
- —flow velocity (m/s);
- —potential velocity of the flow at a cross-section (m/s);
- —distance from the step (m).
The results produced by each of the three meshes present a good agreement with the experimental data obtained by Toombes and Chanson [9] for both selected sections.
In section S0 (x = 0.000 m, Figure 4), the velocity profiles from interFoam solver with k-ε turbulent model present negligible differences between meshes, all being able to reproduce the boundary layer development of the approach flow at the step brink. In the section S1 (x = 0.100 m), mesh 1 produces results differing significantly from those produced by the other two meshes, these being almost coincident. With mesh 1, the velocity profile of the jet lower nappe deviates from the experimental results, whereas meshes 2 and 3 allow a good agreement with the experimental results. The experimental data were obtained based on five different sets of experiments. Due to that, it is likely that they present some inherent scatter along the different profiles when compared with the numerical results, where the data from the three meshes are almost identical.
The same analysis of the dimensionless velocity profiles was made for the results of the solver twoPhaseEulerFoam with mk-ε turbulent model, Figure 5. The three meshes produce very similar results for the velocity profile at cross-section S0. In the comparison with Toombes and Chanson [9] results, a good agreement is observed. For the cross-section S1, similar to interFoam, mesh 1 produced some deviations from the experimental ones in the lower nappe zone, whereas mesh 2 and mesh 3 present analogous results and an adequate agreement with the experimental velocity profiles.
Results from twoPhaseEulerFoam are close to the ones obtained with interFoam. Mesh 1 proved to be too coarse to simulate the velocity profiles, but the local refinement in the water jet and close vicinity zones considered with mesh 2 proved suitable to capture the velocity profiles. Results of mesh 2 are similar to those produced with the much more refined mesh 3 (refinement of one order of magnitude), both having a good agreement with the experimental profile.
Regarding computation times, for mesh 3, interFoam solver requires over 100 h for each second of simulation, whereas for mesh 2 it requires about 100 min of computation time for each second of simulation. As for the twoPhaseEulerFoam solver, it needs more computation time than the interFoam solver for the same mesh. For example, for mesh 2 the twoPhaseEulerFoam solver has spent twice the time of interFoam.
Considering the above, mesh 2 was adopted for the remaining analyses, as it is the one allowing the best compromise between results accuracy and computational effort.
2.4. Boundary Conditions
In order to simulate the same flow conditions as the ones from Toombes and Chanson [9], the top of the domain is left open with atmospheric pressure, Figure 6a. With this boundary condition atmospheric pressure is set in this boundary. Velocity, volume of water, turbulence kinetic energy, and turbulence dissipation can leave the domain or enter with fixed values: vector equal to zero for the velocity; zero of volume of water; turbulent kinetic energy and turbulence dissipation rate equal to the value obtained inside the domain. The left side of the domain includes the water inlet, in which water–air velocity profile and water level ( are imposed as boundary conditions. The used velocity profile is present in Figure 6b and is characterized by: a velocity of 3.75 m/s in the water and in the interface water–air, 0.143 m < z < 0.176 m; a three step reduction to a velocity of 0.50 m/s, 0.176 m < z < 0.243 m; and finally, a constant velocity of 0.50 m/s in the zone with air, z > 0.243 m. The turbulence kinetic energy boundary condition was left as a function of the inlet velocity profile and the turbulence intensity (ti = 0.1%), in the same way the turbulent dissipation rate was defined as a function of the mixing length (ml = 1 × 10⁻⁷). An open boundary was assumed on the right side of the domain. An inlet outlet velocity boundary condition was defined in this boundary. With this boundary condition, the velocity is allowed to leave the domain and to enter with a fixed value equal to a zero vector. All the other variables were left as a zero-order interpolation. The approach channel has a fixed wall with known roughness, velocity equal to zero and wall functions in the turbulent parameters which constrain the turbulence dissipation for low and high Reynolds numbers. To reduce the total simulation computational effort some simplifications were introduced. The downstream jet impact zone was left as an outlet boundary, as the flow in this area does not affect the free jet flow conditions. This type of boundary condition also easily enables the establishment of atmospheric pressure zone under the jet with the adopted 2D numerical modelling, as was the case in the experimental facility, although through a lateral expansion of the channel side walls (plan view in Figure 1). To validate this simplification, a simulation with a closed boundary under the jet and an open flow boundary at the right end of the domain was made. The imposed properties of the boundary conditions in the impact zone for this simulation have the same characteristics of the upstream channel boundary. In this simulation an additional pressure inlet boundary was created in the step wall in order to maintain atmospheric pressure around the jet. The results show no influence of the simplified boundary condition in the free jet characteristics, and thus it was adopted as it allows a significant reduction of the computational times. With these boundary conditions it was possible to obtain a flow in the domain with the same general characteristics of the experimental facility.
In addition to the boundary conditions, initial conditions were also defined with the goal of reducing the simulation time and numerical instability for mesh 1. Along the upstream channel a water flow with the same depth m, Figure 6a and water velocity, Vi = 3.75 m/s, of the left side boundary condition were imposed. Regarding the simulations with mesh 2, and then, with mesh 3, initial conditions were derived from results produced by the previous coarser mesh.
2.5. Numerical Schemes
In addition to the mesh, boundary conditions and the turbulent model numerical schemes must be defined. The simulations were performed using: Euler implicit time scheme to discretize the time; cell limited Gauss linear 1 in the gradient schemes; Gauss linear corrected in the Laplacian schemes; linear for the interpolation scheme; a corrected scheme for the surface-normal gradient scheme and a mesh-wave for the wall distance calculation. The main divergence schemes used for each one of the solvers are present in the Table 3.
3. Results and Discussion
3.1. Velocity
The velocity field along the jet obtained by interFoam solver with k-ε model is presented in Figure 7a. Figure 7b represents the velocity field resulting from the simulation with twoPhaseEulerFoam with mk-ε model. Comparing both results, no significant differences are detected between the solvers. The main difference is at the water–air interface of the jet upper nappe but results are, anyway, in quite similar ranges. This difference can be related to the different approach of each solver in the definition of the water–air interface or mixing zone.
Velocity profiles along the free jet obtained with the two solvers (Figure 8) were compared with the experimental profiles obtained by Toombes and Chanson [9]. Experimental results show the water jet shear effect, which induces a progressive air velocity increase when nearing the water jet, reaching the water velocity in the mixing zone [30]. It must be pointed out that, in the jet’s upper nappe, the experimental flow velocities reveal significant scatter. The authors attribute this scatter to experimental measuring limitations, evidenced by the low cross-correlation signals of the double-tip conductivity probe used to measure flow velocities in the air-water mixing region.
In general, the velocity profiles produced by interFoam reveal a good agreement with the experimental data, however the water–air mixing region evidences some differences between the numerical model results and the experimentally obtained ones. For the profiles located farther from the step it is possible to observe a linear reduction of the velocity in the transition zone from the water to the air in the upper nappe. Also, the experimental data reveals a more abrupt reduction of the velocity when the flow has a higher air concentration.
The results obtained with the twoPhaseEulerFoam solver, Figure 8, also evidence good agreement with the experimental results. The velocities in the upper nappe region reveal the same trend of the experimental ones, but the velocity decay of the numerical results extends to a higher distance from the jet upper nappe. Apparently, this numerical solver leads to more air flow around the water jet than experimentally measured. The model results in the mixing zone reveal similar air and water velocities, as observed experimentally [9] and described in the literature [7,30].
Both solvers have the ability to adequately reproduce the boundary layer development along the upstream channel, as evidenced by the velocity profile at section x = 0.000 m. Velocities obtained in the core of the free jet are very similar for both solvers. On the upper nappe, some relevant differences between solvers are observed, twoPhaseEulerFoam producing results closer to the experimental ones. This can be attributed to the turbulent model used to perform the simulations. In fact, for the simulations with interFoam, a standard k-ε model was used, which does not simulate adequately the mixture zone of two-phase flows. TwoPhaseEulerFoam can be coupled with the mk-ε turbulent model which, as described in Section 2.2, better solves the turbulence flow features in the mixing zone of both flow phases, producing more realistic results.
Detailed analyses of the velocity profiles along the free jet with three different turbulence models were carried out. For the interFoam solver, the results presented in Figure 9 were obtained adopting both k-ε and SST k- models, both leading to the similar velocity profiles. However, SST k- model does not properly reproduce the channel boundary layer development as it can be seen on the velocity profile at the section x = 0.000 m. Also, with SST k- model, velocities in the lower nappe region are higher than those obtained by k-ε and experimentally. Apparently, SST k- model requires a finer mesh near the solid boundaries in order to adequately reproduce boundary layer development. Because of the inaccurate boundary layer definition in the jet initial cross-section, velocities obtained in the lower zone of the jet are also affected, although this situation is progressively attenuated as the jet travels downstream. The computation time to perform the simulations with each turbulent model are quite similar: 105 min to perform one second of simulation with k-ε model and 114 min for the SST k- model. Taking this fact into consideration, none of the turbulent models evidences an advantage over the other.
Only mk-ε and SST k- turbulence models were considered for the twoPhaseEulerFoam solver comparative analysis (Figure 10), as the k-ε model used with interFoam had to be discarded due to its trend for numerical instability. SST k- was used to allow the direct comparison between interFoam and twoPhaseEulerFoam solvers. The velocity profiles obtained with both turbulent models are very similar in the core of the jet, however some relevant differences are observed in the upper and lower nappes, the mk-ε model better characterizing these regions. In the upper and lower nappes, the water–air shear mixing zones produced by this turbulence model reveal similar air and water velocities and then, exiting the mixing zone, an abrupt reduction of the air velocity is observed. This behavior is similar to the air boundary velocities characterized in the literature [7,29]. This phenomenon is not captured by SST k-, the reduction of the velocity presenting an approximately linear decay when moving away from the jet axis. Comparing the computational resources used by each turbulent model, mk-ε takes 119 minutes to perform one second of simulation, whereas SST k- model needs 208 min. However, SST k- results for the upper and lower jet nappes reveal a worse agreement with the experimental data. This fact is relevant for the analyses on which turbulent model performs better for the current case study, with mk-ε model results evidencing a better accuracy and requiring half computational time of the SST k- model.
Comparing the results of SST k- turbulence model coupled either with interFoam or twoPhaseEulerFoam, one concludes that the latter produces better results generating the boundary layer along the upstream channel until reaching the first section of the jet and, consequently, the velocity profiles along the jet lower face result much closer to the experimental. The velocity in the jet core and the upper nappe region are very similar with both solvers.
3.2. Air Concentration
The air concentration along the jet obtained by the two solvers is presented in Figure 11. The results produced by interFoam solver and k-ε turbulent model, Figure 11a, reveal a small air entrainment along the jet and no reduction of its core (region of C = 0.0) along the trajectory. On the other side, the air concentration obtained with twoPhaseEulerFoam coupled with mk-ε turbulent model, Figure 11b shows a reduction of the jet core dimensions caused by the process of air entrainment in the jet.
Numerically obtained air concentration profiles at three cross-sections of the jet, using either interFoam or twoPhaseEulerFoam solvers, were compared against experimental data from Toombes and Chanson [9]. For interFoam, the air concentration profiles are presented in Figure 12, which also includes the experimental data. For the two cross-sections closer to the step, x = 0.025 m and x = 0.100 m, the calculated air concentrations evidence a good agreement with the experimental. However, the jet core dimension in the numerical model tends to be larger than the experimental one, this becoming more noticeable in the cross-sections farther downstream. For the cross-section at x = 0.400 m it is possible to observe a significant difference between numerical and experimental data for C < 0.5. These differences can be explained by the limitations of the interFoam solver in simulating the water–air mixing zone, as pointed out in Section 3.1.
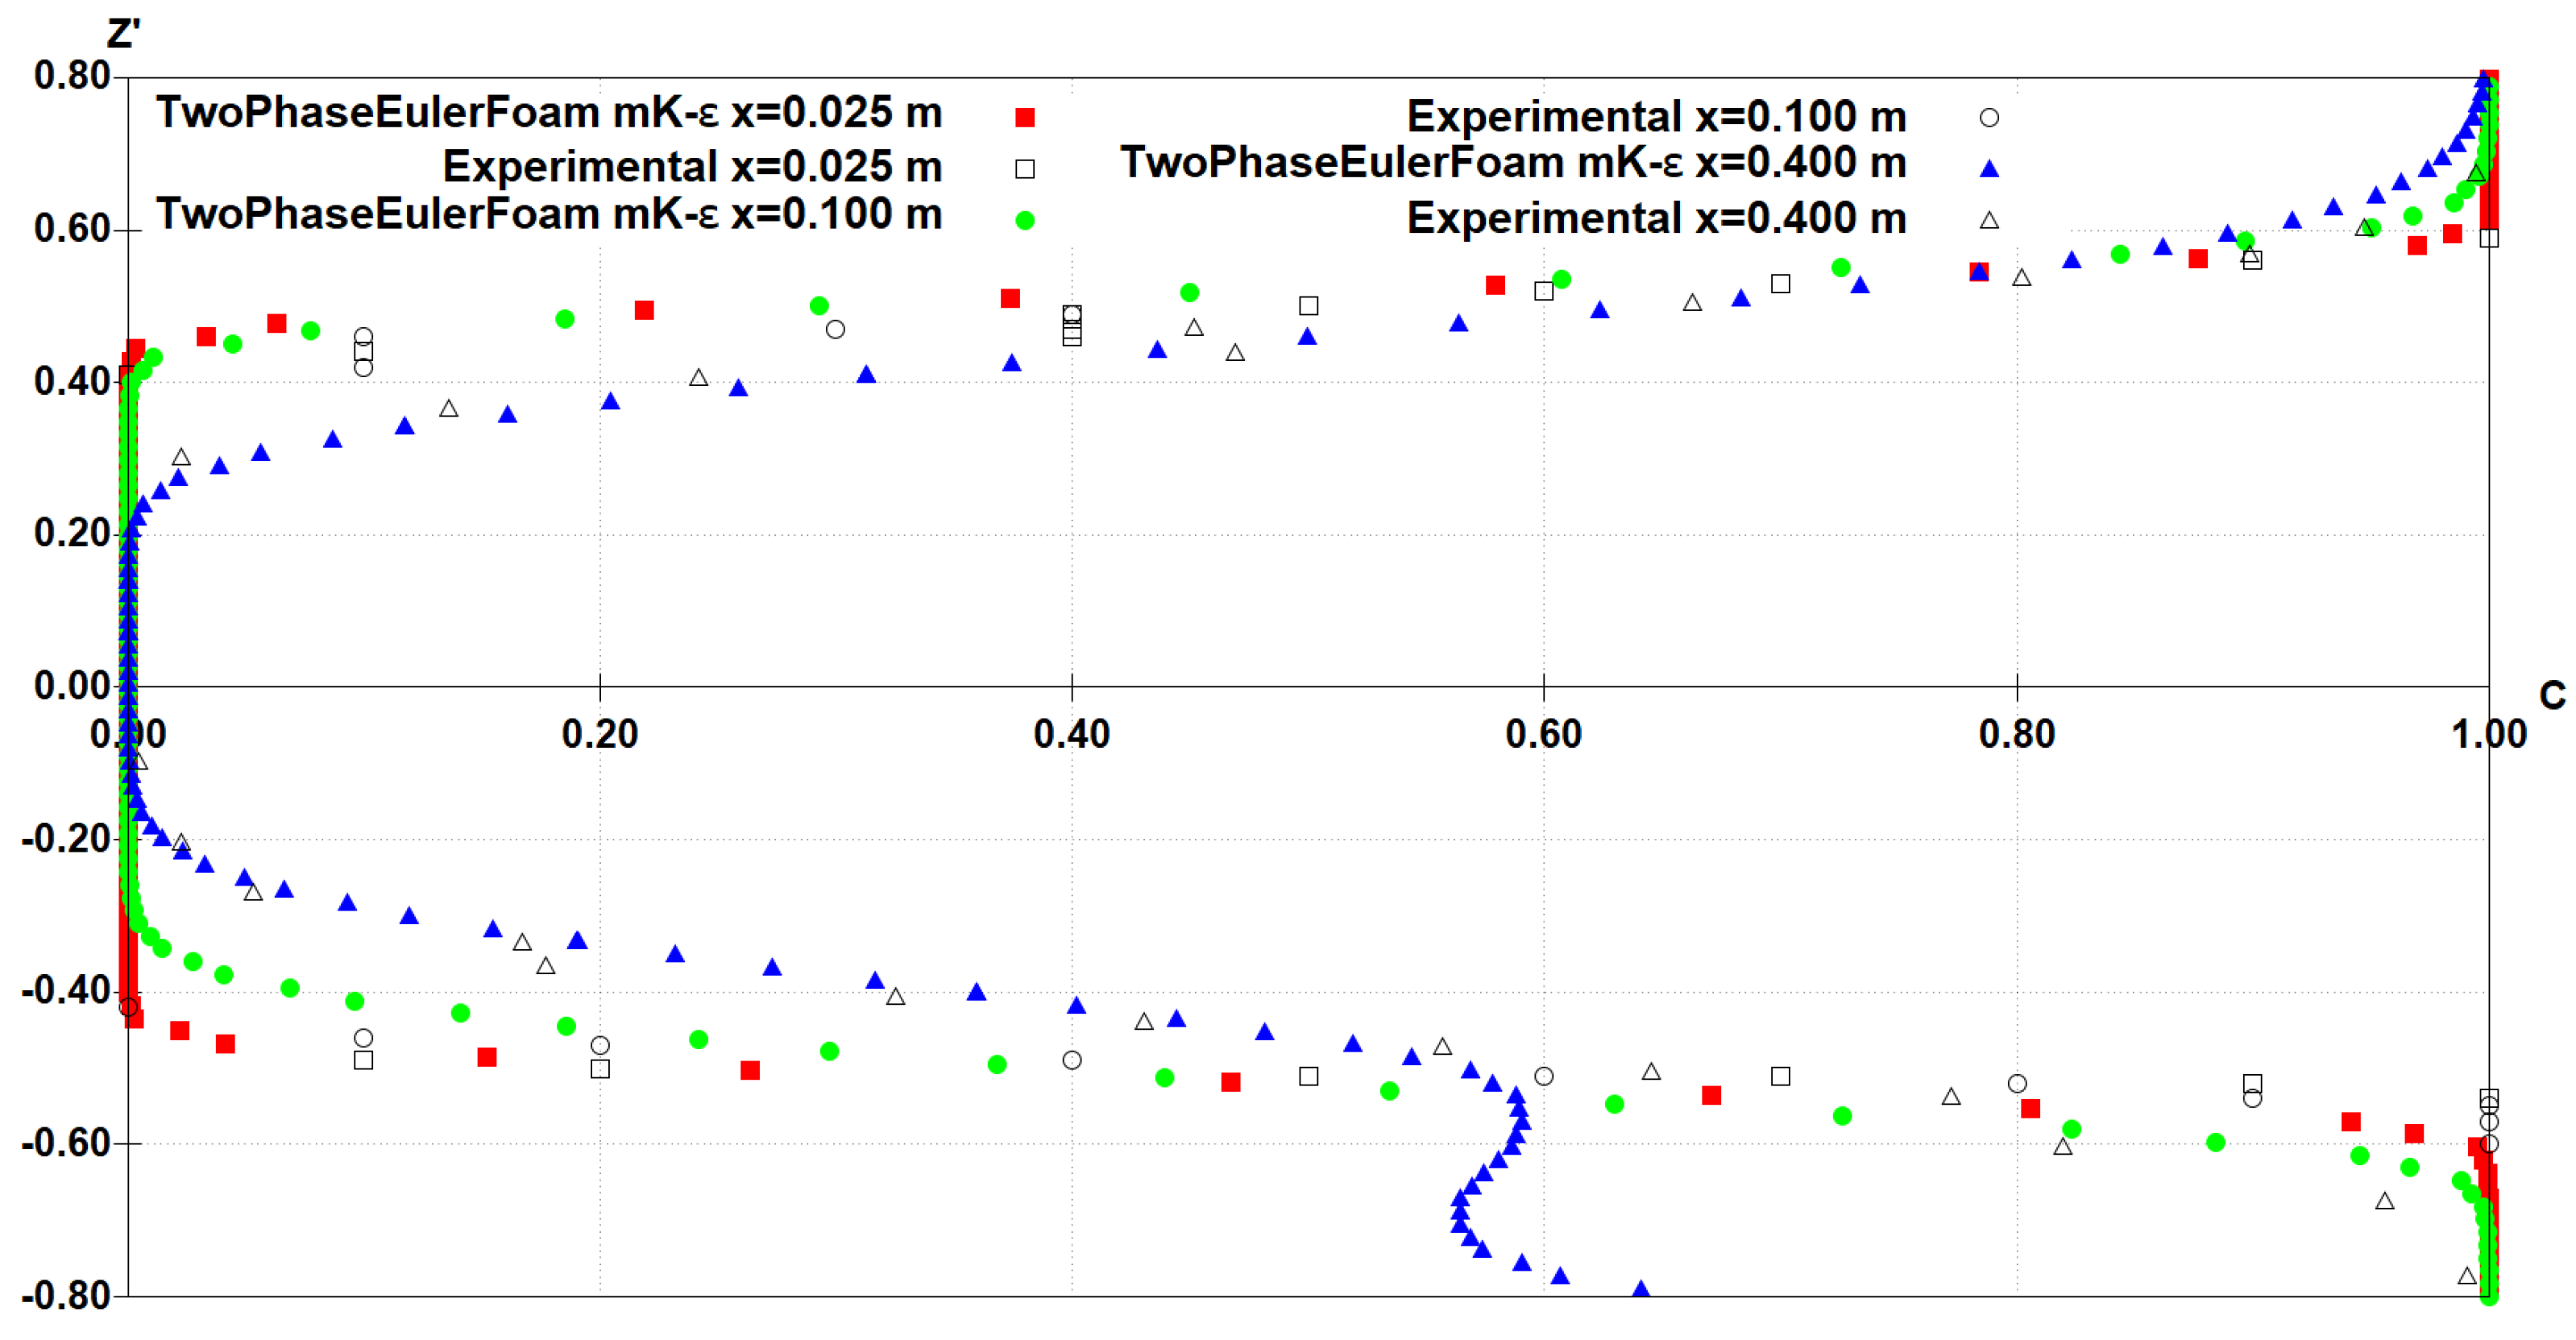
The twoPhaseEulerFoam solver air concentration profiles evidence a better agreement with the experimental ones (Figure 13), however, downstream of cross-section at x = 0.400 m, for C > 0.6 in the lower nappe, a deviation from the general good agreement is observed. A sensitivity analysis to the main jet parameters, such as water–air surface tension, water viscosity, initial average velocity, approach channel length, turbulence model and mesh size was performed in order to assess a probable cause for this discrepancy. Results point out to the flow velocity and turbulence parameters in the initial section of the jet as the parameters with more influence in the onset of the discrepancies between the twoPhaseEulerFoam solver and experiments. Despite this discrepancies, that require further research for a better understanding, it can be concluded that the twoPhaseEulerFoam solver is better suited for simulating the jets’ air entrainment, as it allows a reasonable agreement with experimental values, namely in reproducing the mixing zone and jet core reduction, a feature that cannot be captured using the interFoam solver.
3.3. Turbulence Intensity
Analysis of the water flow turbulence intensity along the jet was carried out, in which the influence of the inlet boundary value of turbulence was studied by varying the imposed turbulence intensity between 0.01% and 10.00%. Results show that, at the initial cross-section of the free jet, x = 0.000 m, the average turbulence intensity in regions with C < 0.5 is not influenced by the imposed value at the inlet boundary condition (Table 4). Simulations using interFoam solver were performed coupling it with the k-ε turbulence model and mk-ε model was coupled with the twoPhaseEulerFoam solver. These turbulent models were selected based on the conclusions present in Section 3.1. Castillo et al. [15] performed numerical simulations of a free jet using Reynolds stress model (RSM) and also concluded the turbulence intensity at the inlet boundary condition does not influence significantly the free jet flow characteristics at a cross-section at a distance of 1.0 m from the boundary. TwoPhaseEulerFoam generated higher values of turbulence intensity than interFoam. This difference can derive from the former having the possibility of being coupled with a more powerful turbulence model (mk-ε), which is able of reproducing the water–air interface and the turbulence kinetic energy transfer between the two phases of the flow. Chanson [31] measured the turbulence intensity in the water–air region and found values five times bigger (5–15%) than in the water jet core (1–3%). This can lead to the higher values of turbulence intensity felt in the results of twoPhaseEulerFoam, as its formulation incorporates the air-water interaction, whereas the interFoam’s does not.
Two additional cross-sections were analyzed, at x = 0.100 m and x = 0.400 m, respectively. The results obtained by interFoam reveal that turbulence intensity in the jet region with C < 0.5 increases with the distance to the step. No significant influence was observed of the imposed inlet turbulent boundary value in the turbulence developed along the jet. With twoPhaseEulerFoam, the average turbulence intensity in the core of the free jet increases with the distance from the step, but with a gentler growing rate than interFoam. The solver interFoam produces results in which the turbulence intensity tends to be approximately 10%, higher than the value 3% referred by Castillo et al. [15], whereas the value of 3% was obtained using twoPhaseEulerFoam.
4. Conclusions
Regarding the domain mesh size, as the sensitivity analyses performed evidenced, simulations shall be preceded by a thorough optimization of the domain meshes in order to achieve a good compromise between results’ accuracy and computational time consumption. In the present study, results with the finest mesh (smaller cells’ size of 0.25 mm) do not show significant improvements in the velocity profiles when compared with the intermediate size mesh (smaller cells’ size of 1.00 mm) and, in turn, the simulation time of the former is about 60 times larger. Contrarily, the velocity profiles obtained with the least refined of the tested meshes (cell sizes of 2.00 mm) are just not accurate enough.
The velocity field along the jet obtained with interFoam and twoPhaseEulerFoam adequately reproduce the free jet and, in general, was confirmed by the experimental published results. Both solvers can reproduce the boundary layer development along the bottom of the upstream channel and its influence in the development of lower nappe of the jet.
The analysis of the velocity field obtained with interFoam solver coupled with either k-ε or SST k- turbulence models shows the former better agrees with the experimental results. It adds that SST k- does not reproduce adequately the boundary layer along the upstream channel. However, this limitation fades out while moving downstream along the jet.
The solver twoPhaseEulerFoam coupled with either SST k- or mk-ε turbulence models produce velocity profiles with a good agreement with the experimental ones. Mk-ε model better characterizes the upper nappe of the jet, which can be explained by the model formulation of mk-ε incorporating the dispersed two-phase flows with high values of mixture phase.
InterFoam solver is not able to simulate the air entrainment process along the jet, as the values of air concentration in the jet core do not increase along its travel path, contrarily to experimental data.
TwoPhaseEulerFoam solver is able to reproduce the air entrainment process, allowing a reasonable agreement with experimental data. It captures the jet core contraction along the its trajectory, as described from experimental observation of Toombes and Chanson [9].
Turbulence intensity analysis allowed to conclude that, for a range of turbulence intensity values imposed at the inlet boundary condition, no influence in the free jet core characteristics was observed in any of the tested solvers, both producing increasing turbulence intensities along the jet trajectory, which agrees with numerically obtained results in the literature.
As final conclusions, the following aspects can be pointed out: (i) for simulating the velocity field along the free jet, both interFoam and twoPhaseEulerFoam are suitable, allowing good agreement with experimental results; (ii) for simulations including air concentration analysis along the jet trajectory, only the solver twoPhaseEulerFoam, namely if coupled with mk-ε turbulence model, can reproduce the experimentally observed patterns. Taking into account the previous conclusions, the following is recommended: (i) due to the larger computational effort and lower numerical stability associated to the twoPhaseEulerFoam solver, if simulations have the objective of just reproducing the velocity field of the jet, the interFoam solver with k-ε is suitable, and (ii) if the objective is the reproduction of the velocity field both in the jet core and mixing zones, and an assessment of air concentrations is required, then solver twoPhaseEulerFoam coupled with mk-ε turbulence model should be adopted.
Author Contributions
Conceptualization, AM., J.F.M. and H.M.R.; software A.M.; validation, A.M.; writing—original draft preparation, AM., J.F.M. and H.M.R. All authors have read and agreed to the published version of the manuscript.
Funding
This research was funded by Fundação para a Ciência e Tecnologia (FCT), Portugal, grant number PD/BD/135593/2018.
Conflicts of Interest
The authors declare no conflict of interest.
References
- Heller, V.; Hager, W.H.; Minor, H. Ski Jump Hydraulics. J. Hydraul. Eng. 2005, 131, 46–51. [Google Scholar] [CrossRef]
- Bollaert, E.F.R.; Schleiss, A.J. Scour of rock due to the impact of plunging high velocity jets Part I: A state-of-the-art review. J. Hydraul. Res. 2003, 41, 451–464. [Google Scholar] [CrossRef]
- Whittaker, J.G.; Schleiss, A.J. Scour Related to Energy Dissipaters for High. In Head Structures ETHZ VAW Report No. 73; Swiss Federal Institute of Technology Zurich: Zürich, Switzerland, 1984. [Google Scholar]
- Duarte, R.; Bollaert, E.F.R.; Schleiss, A.J.; Pinheiro, A. Dynamic pressures around a confined block impacted by plunging aerated high-velocity jets. In Proceedings of the 2nd European IAHR Congress, Munich, Germany, 27–29 June 2012. [Google Scholar]
- Beltaos, S.; Rajaratnam, N. Plane Turbulent Impinging Jets. J. Hydraul. Res. 1973, 11, 29–59. [Google Scholar] [CrossRef]
- Ervine, D.A.; Elsawy, E.M. Effect of turbulence intensity on the rate of air entrainment by plunging water jets. Proc. Inst. Civ. Eng. 1980, 69, 425–445. [Google Scholar] [CrossRef]
- Ervine, D.A.; Falvey, H.T. Behavior of Turbulent Water Jets in the Atmosphere and in Plunge Pools. Proc. Inst. Civ. Eng. 1987, 83, 295–314. [Google Scholar]
- Rajaratnam, N.; Rizvi, S.A.H.; Steffler, P.M.; Smy, P.R. An experimental study of very high velocity circular water jets in air. J. Hydraul. Res. 1994, 32, 461–470. [Google Scholar] [CrossRef]
- Toombes, L.; Chanson, H. Free-surface aeration and momentum exchange at a bottom outlet. J. Hydraul. Res. 2007, 45, 100–110. [Google Scholar] [CrossRef]
- Lin, C.; Hwung, W.Y.; Hsieh, S.C.; Chang, K.A. Experimental study on mean velocity characteristics of flow over vertical drop. J. Hydraul. Res. 2007, 45, 33–42. [Google Scholar] [CrossRef]
- Steiner, R.; Heller, V.; Hager, W.H.; Minor, H.-E. Deflector Ski Jump Hydraulics Remo. J. Hydraul. Eng. 2008, 134, 1094–1100. [Google Scholar] [CrossRef]
- Pfister, M.; Hager, W.H.; Boes, R.M. Trajectories and air flow features of ski jump-generated jets. J. Hydraul. Res. 2014, 52, 336–346. [Google Scholar] [CrossRef]
- Ho, D.K.H.; Riddette, K.M. Application of computational fluid dynamics to evaluate hydraulic performance of spillways in Australia. Aust. J. Civ. Eng. 2010, 6, 81–104. [Google Scholar] [CrossRef]
- Deshpande, S.S.; Trujillo, M.F.; Wu, X.; Chahine, G. Computational and experimental characterization of a liquid jet plunging into a quiescent pool at shallow inclination. J. Heat Fluid Flow 2012, 34, 1–14. [Google Scholar] [CrossRef]
- Castillo, L.G.; Carrillo, J.M.; Sordo-Ward, Á. Simulation of overflow nappe impingement jets. J. Hydroinformatics 2014, 16, 922–940. [Google Scholar] [CrossRef] [Green Version]
- Shonibare, O.Y.; Wardle, K.E. Numerical investigation of vertical plunging jet using a hybrid multifluid-VOF multiphase CFD solver. Int. J. Chem. Eng. 2015. [Google Scholar] [CrossRef]
- Castillo, L.G.; Carrillo, J.M.; Bombardelli, F.A. Distribution of mean flow and turbulence statistics in plunge pools. J. Hydroinformatics 2017, 19, 173–190. [Google Scholar] [CrossRef]
- OpenCFD Limited. OpenFOAM User Guide; OpenCFD Limited: Bracknell, UK, 2018. [Google Scholar]
- Manafpour, M.; Ebrahimnezhadian, H. The Multiphase Capability of Openfoam CFD Toolbox in Solving Flow Field in Hydraulic Structure. In Proceedings of the 4th International Conference on Long-Term Behavior and Eco-Friendly Dams, Tehran, Iran, 17–19 October 2017; pp. 323–330. [Google Scholar] [CrossRef]
- Schulze, L.; Thorenz, C. The Multiphase Capabilities of the CFD Toolbox OpenFOAM for Hydraulic Engineering Applications. In Proceedings of the ICHE 2014, Hamburg, Germany, 28 September–2 October 2014; pp. 1007–1014. [Google Scholar]
- Bombardelli, F. Computational multi-phase fluid dynamics to address flows past hydraulic structures. In Proceedings of the 4th IAHR International Symposium on Hydraulic Structures, Porto, Portugal, 9–11 February 2012. [Google Scholar]
- Wang, Y.; Politano, M.; Weber, L. Spillway jet regime and total dissolved gas prediction with a multiphase flow model. J. Hydraul. Res. 2019, 57, 26–38. [Google Scholar] [CrossRef]
- Deshpande, S.S.; Anumolu, L.; Trujillo, M.F. Evaluating the performance of the two-phase flow solver interFoam. Comput. Sci. Discov. 2012, 5, 014016. [Google Scholar] [CrossRef]
- Issa, R.I. Solution of the implicitly discretized fluid flow equations by operator-splitting. J. Comput. Phys. 1986, 62, 40–65. [Google Scholar] [CrossRef]
- Behzadi, A.; Issa, R.I.; Rusche, H. Modelling of dispersed bubble and droplet flow at high phase fractions. Chem. Eng. Sci. 2004, 59, 759–770. [Google Scholar] [CrossRef]
- Launder, B.E.; Spalding, D.B. The numerical computation of turbulent flows. Comput. Methods Appl. Mech. Eng. 1974, 3, 269–289. [Google Scholar] [CrossRef]
- Menter, F.R. Two-equation eddy-viscosity turbulence models for engineering applications. AIAA J. 1994, 32, 1598–1605. [Google Scholar] [CrossRef] [Green Version]
- Menter, F.R.; Kuntz, M.; Langtry, R. Ten Years of Industrial Experience with the SST Turbulence Model. Turbul. Heat Mass Transfer. 2003, 4, 625–632. [Google Scholar]
- Rusche, H. Compaction of a Clay Loam Soil in Pannonian Region of Croatia under Different Tillage Systems. Ph.D. Thesis, Imperial College of Science, Technology & Medicine, London, UK, 2002. [Google Scholar]
- Falvey, H.T. Air-Water Hydraulic Flow in Structures; Engineering Monograph No. 41; United States Department of the Interior, Water and Power Resources Service: Denver, CO, USA, 1980.
- Chanson, H. Velocity measurements within high velocity air-water jets. J. Hydraul. Res. 1993, 31, 365–382. [Google Scholar] [CrossRef] [Green Version]
Figure 1.
Scheme of the experimental facility (adapted from [9]).
Figure 1.
Scheme of the experimental facility (adapted from [9]).
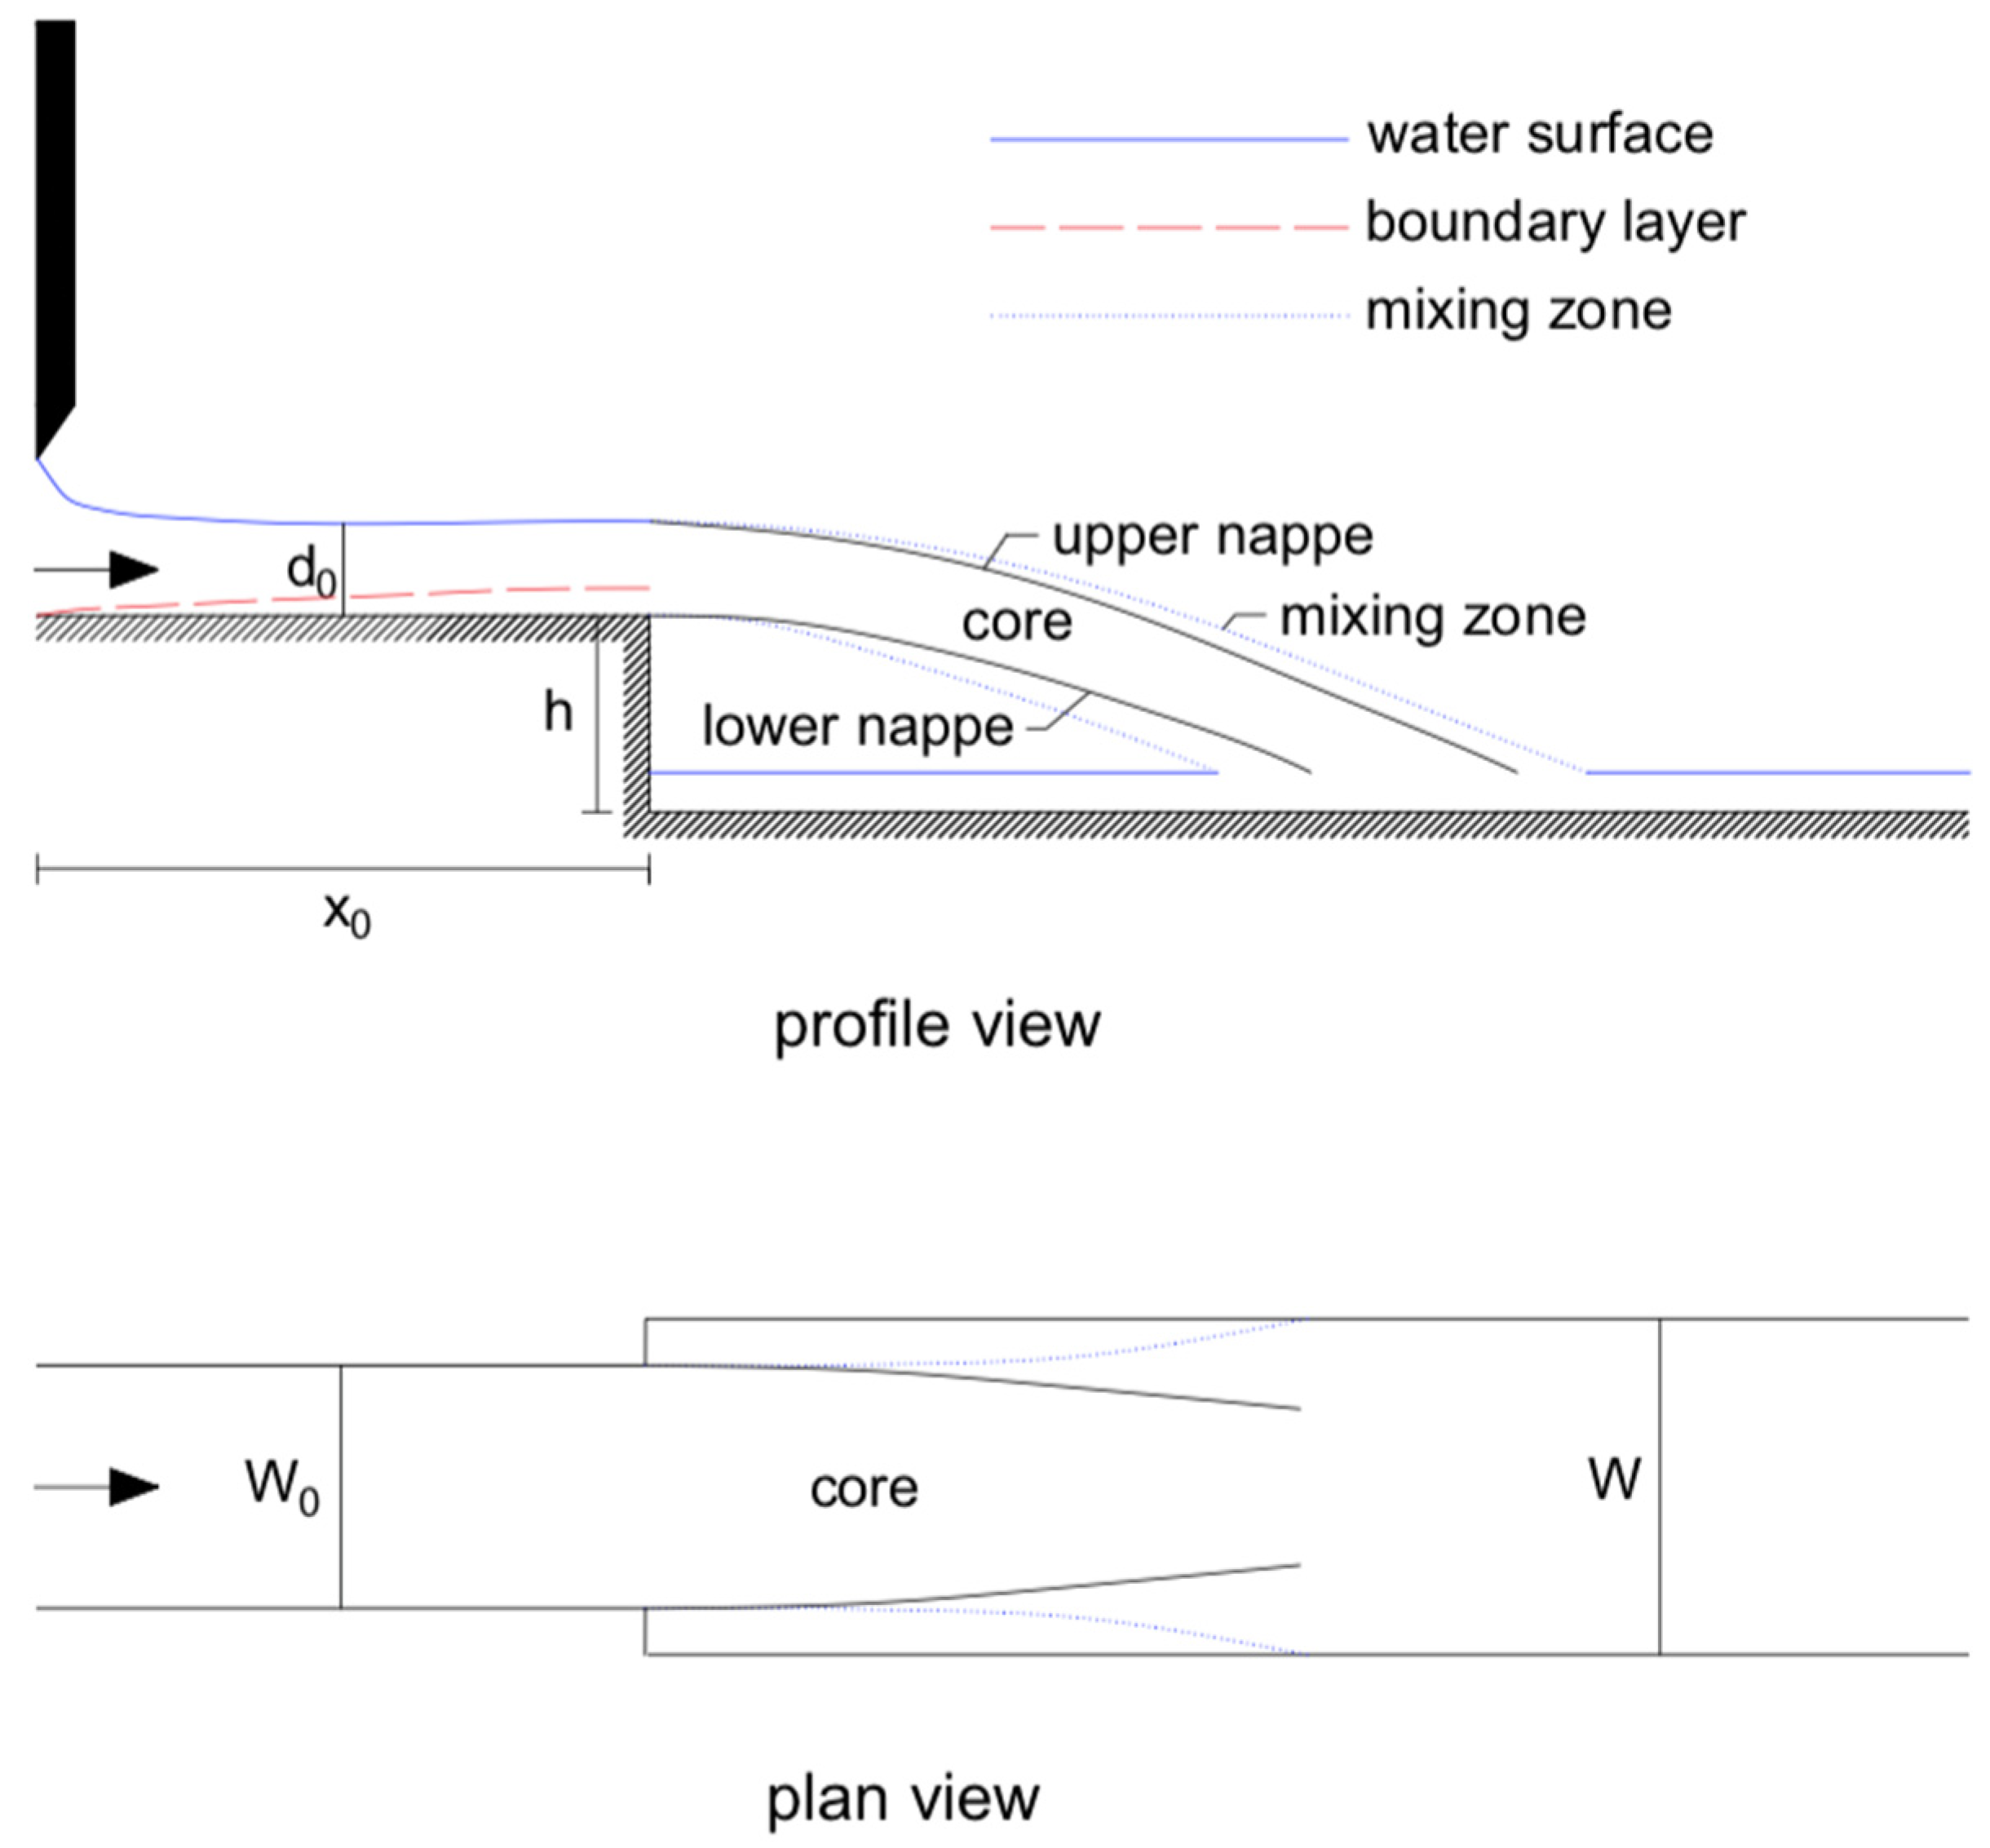
Figure 2.
CFD domain to analyze the free water jet.
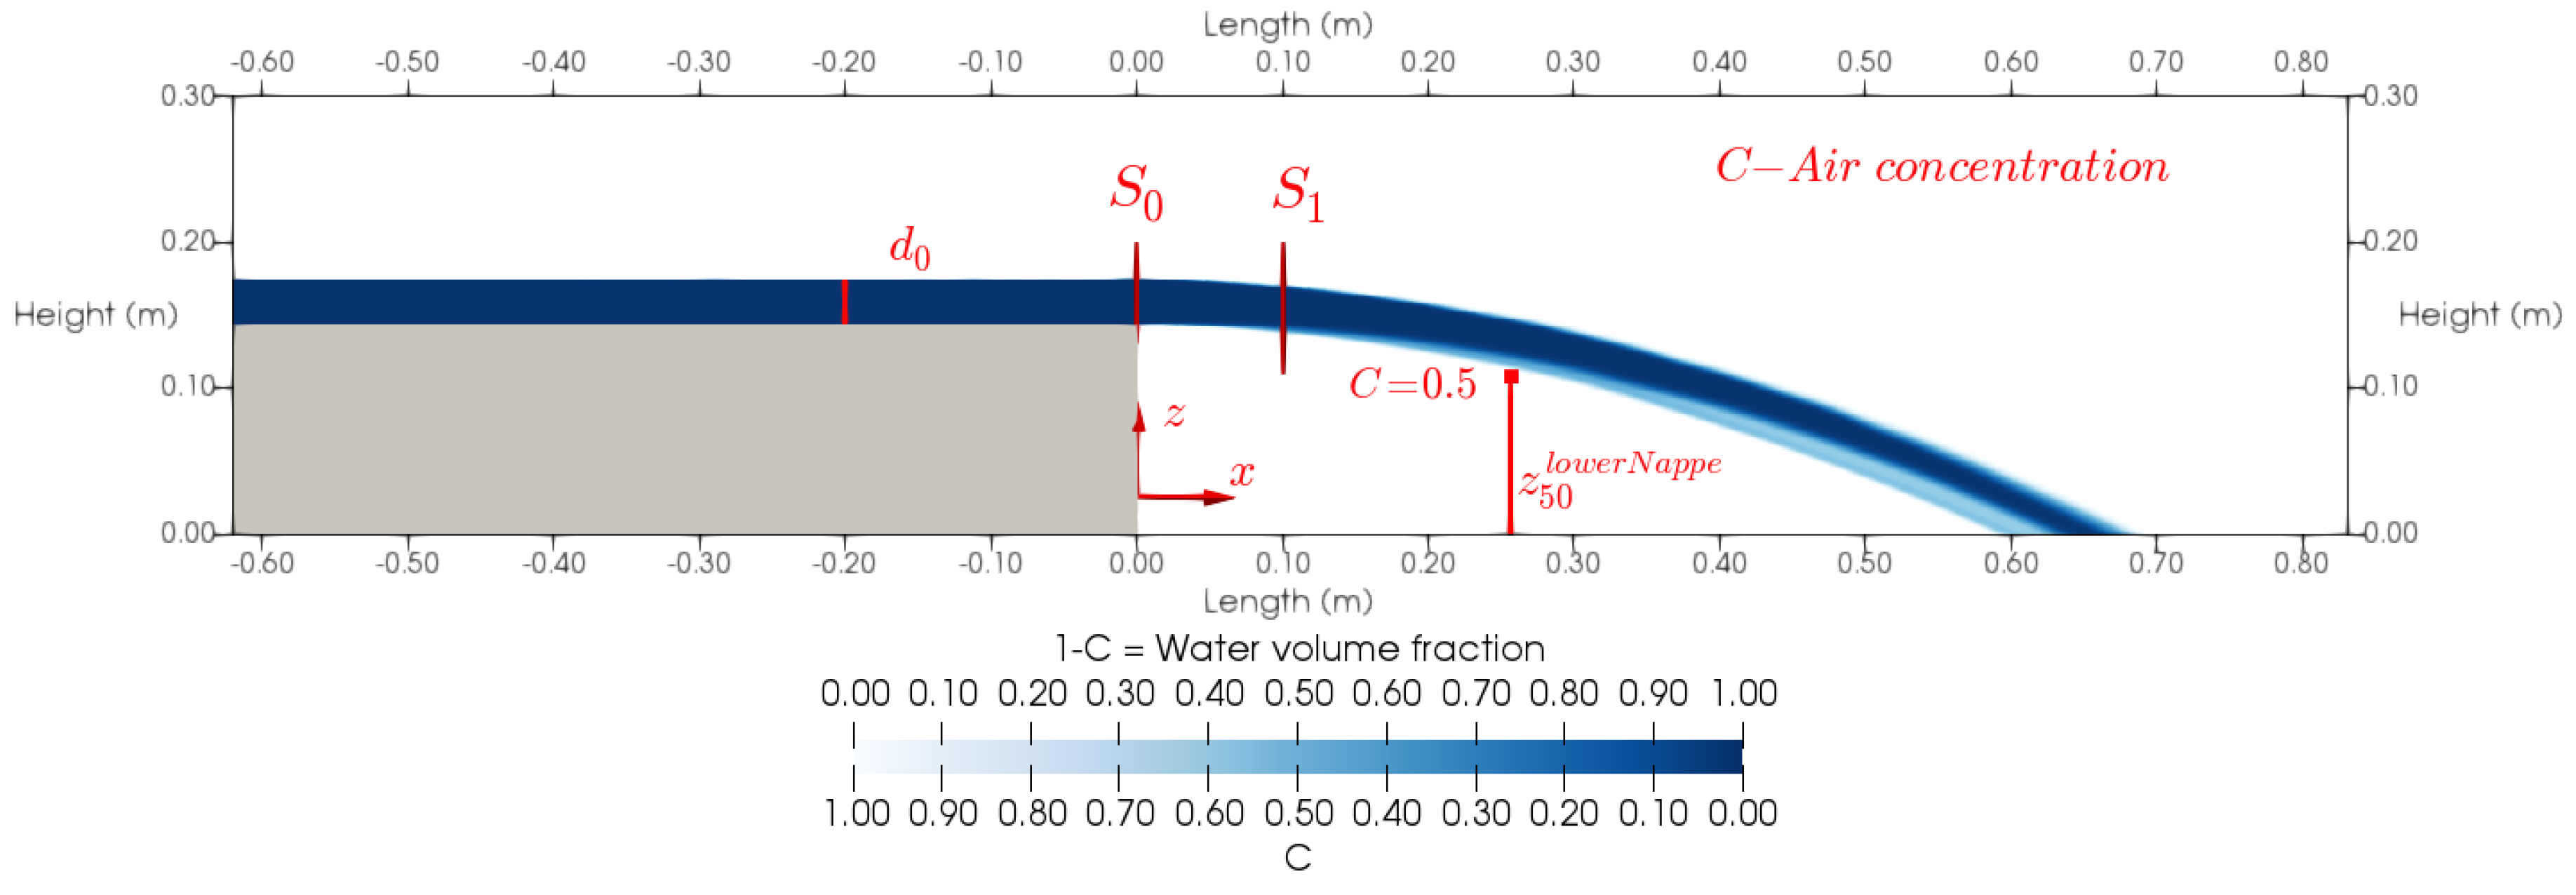
Figure 3.
Detailed of the three meshes in the zone of the step. (a) Mesh 1, (b) Mesh 2, (c) Mesh 3.
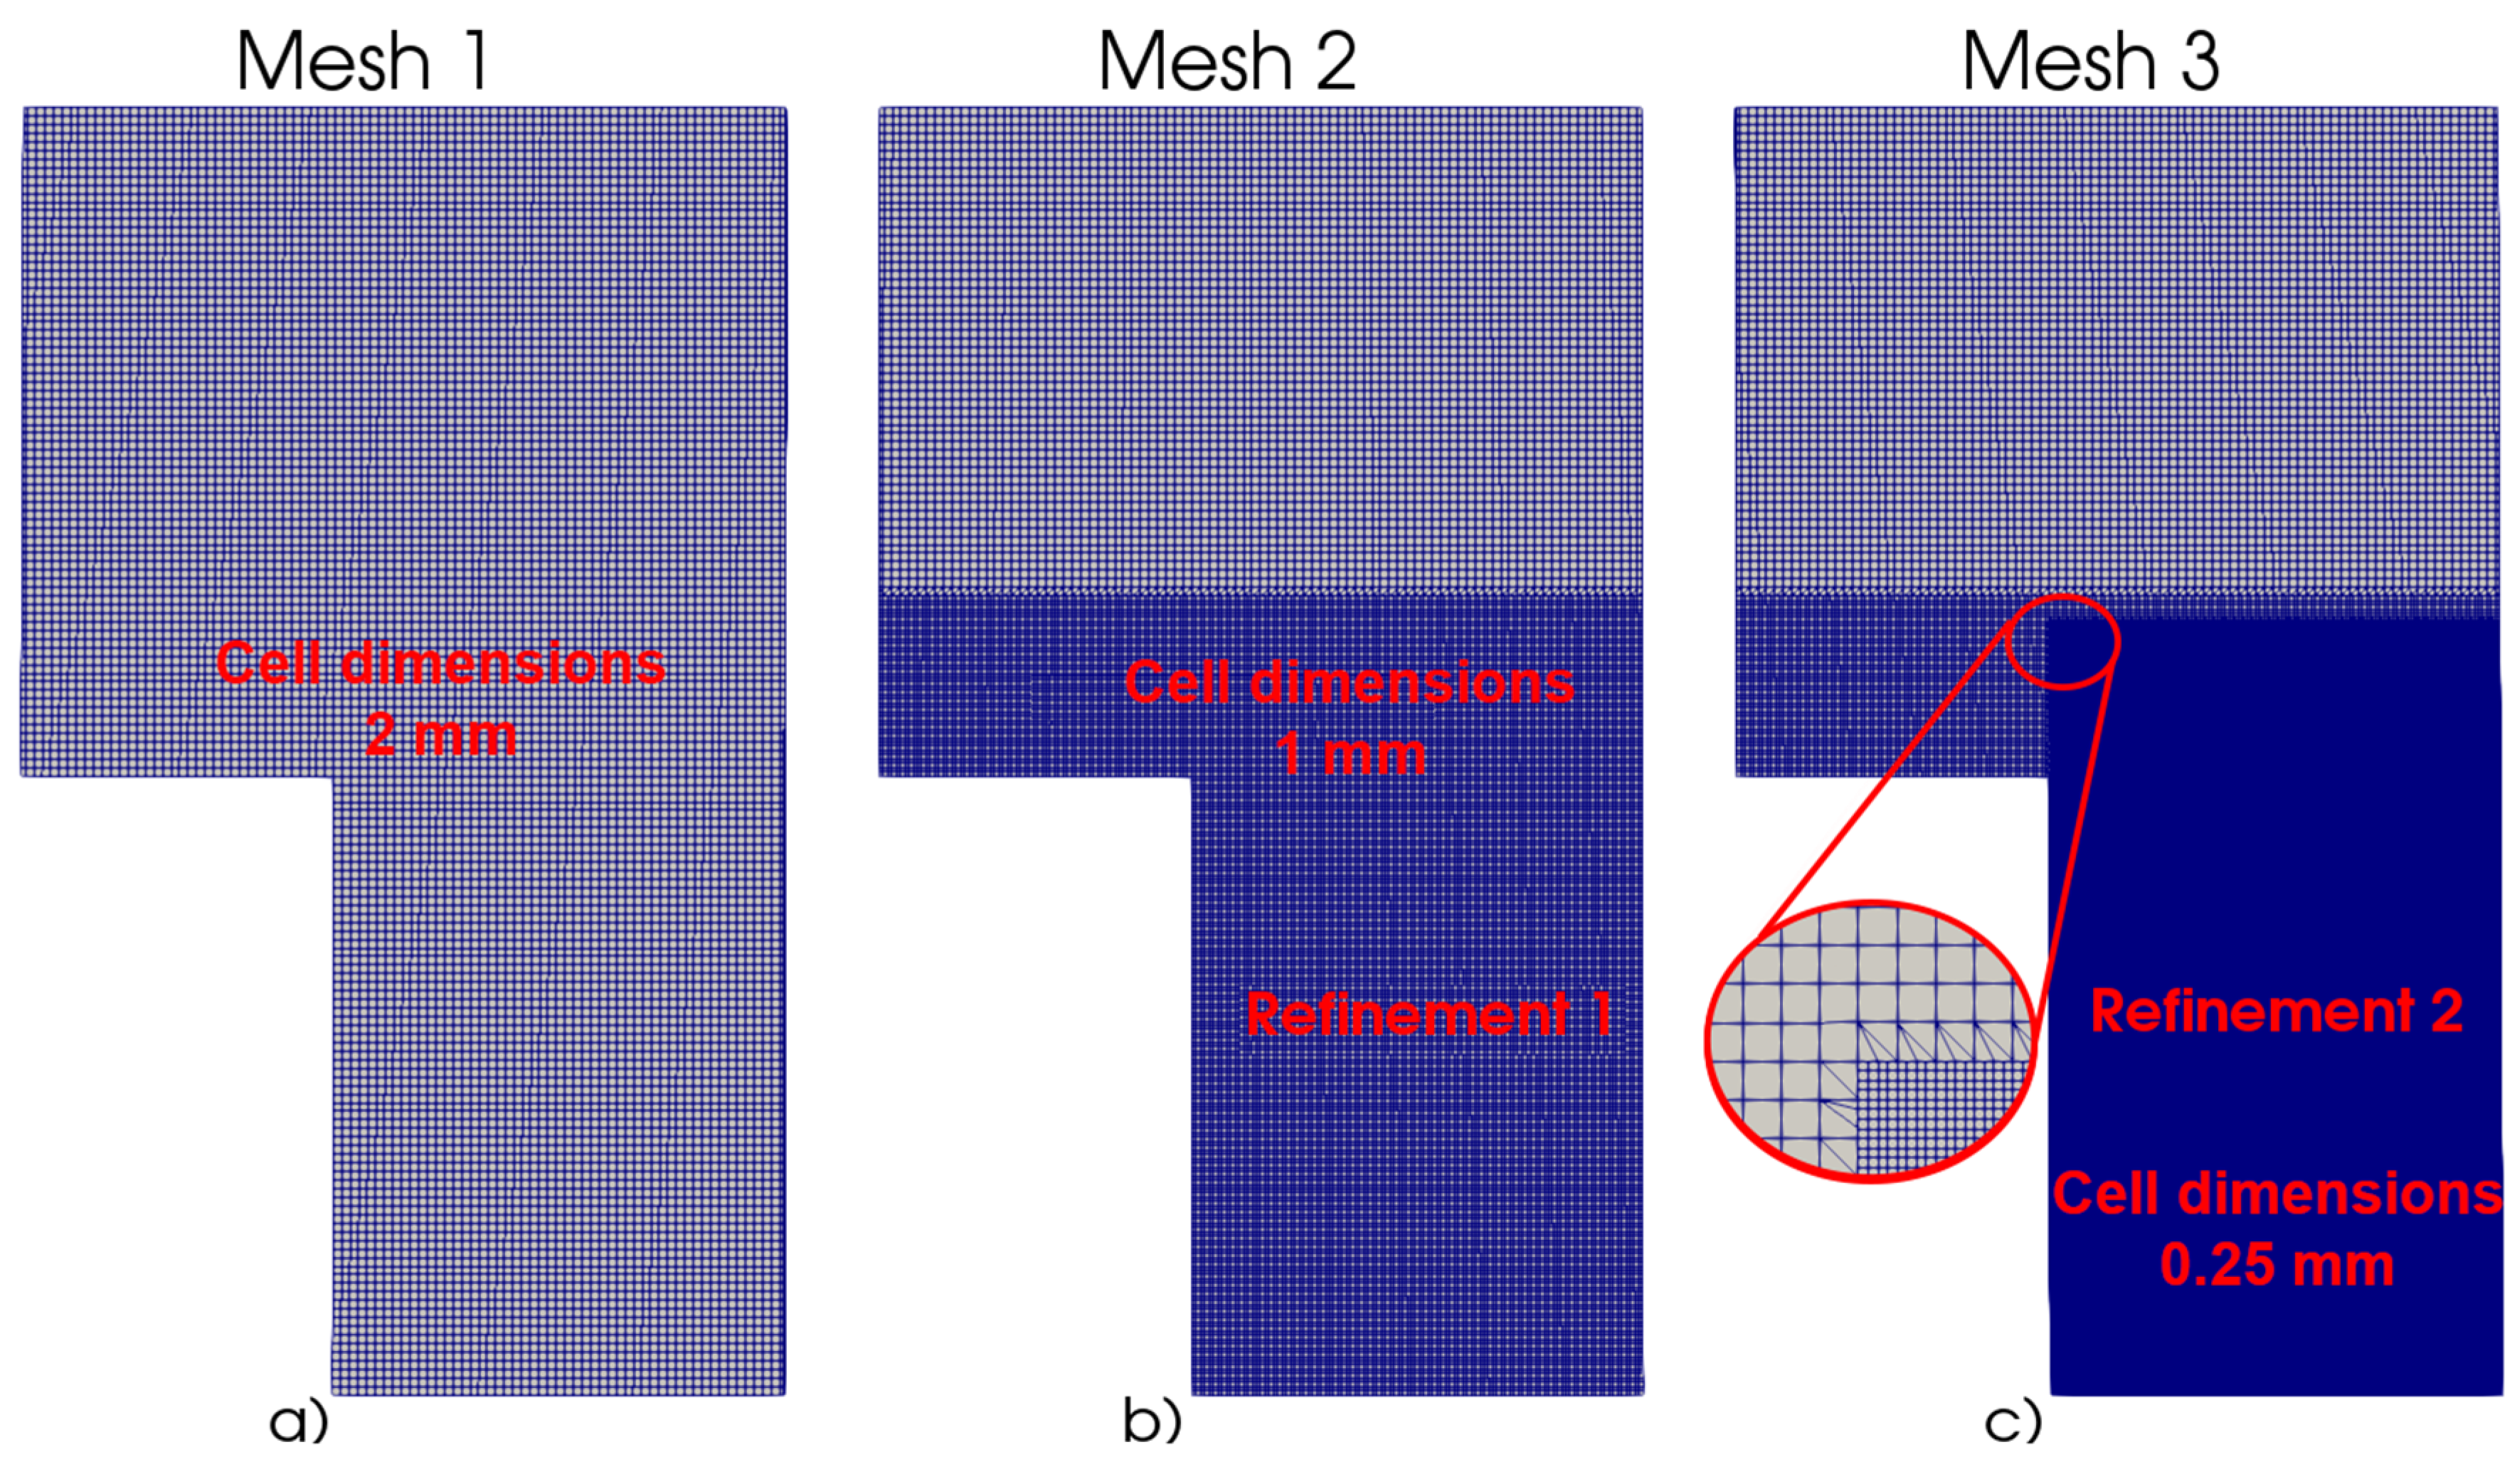
Figure 4.
Dimensionless velocity profile at S0 and S1 with interFoam.
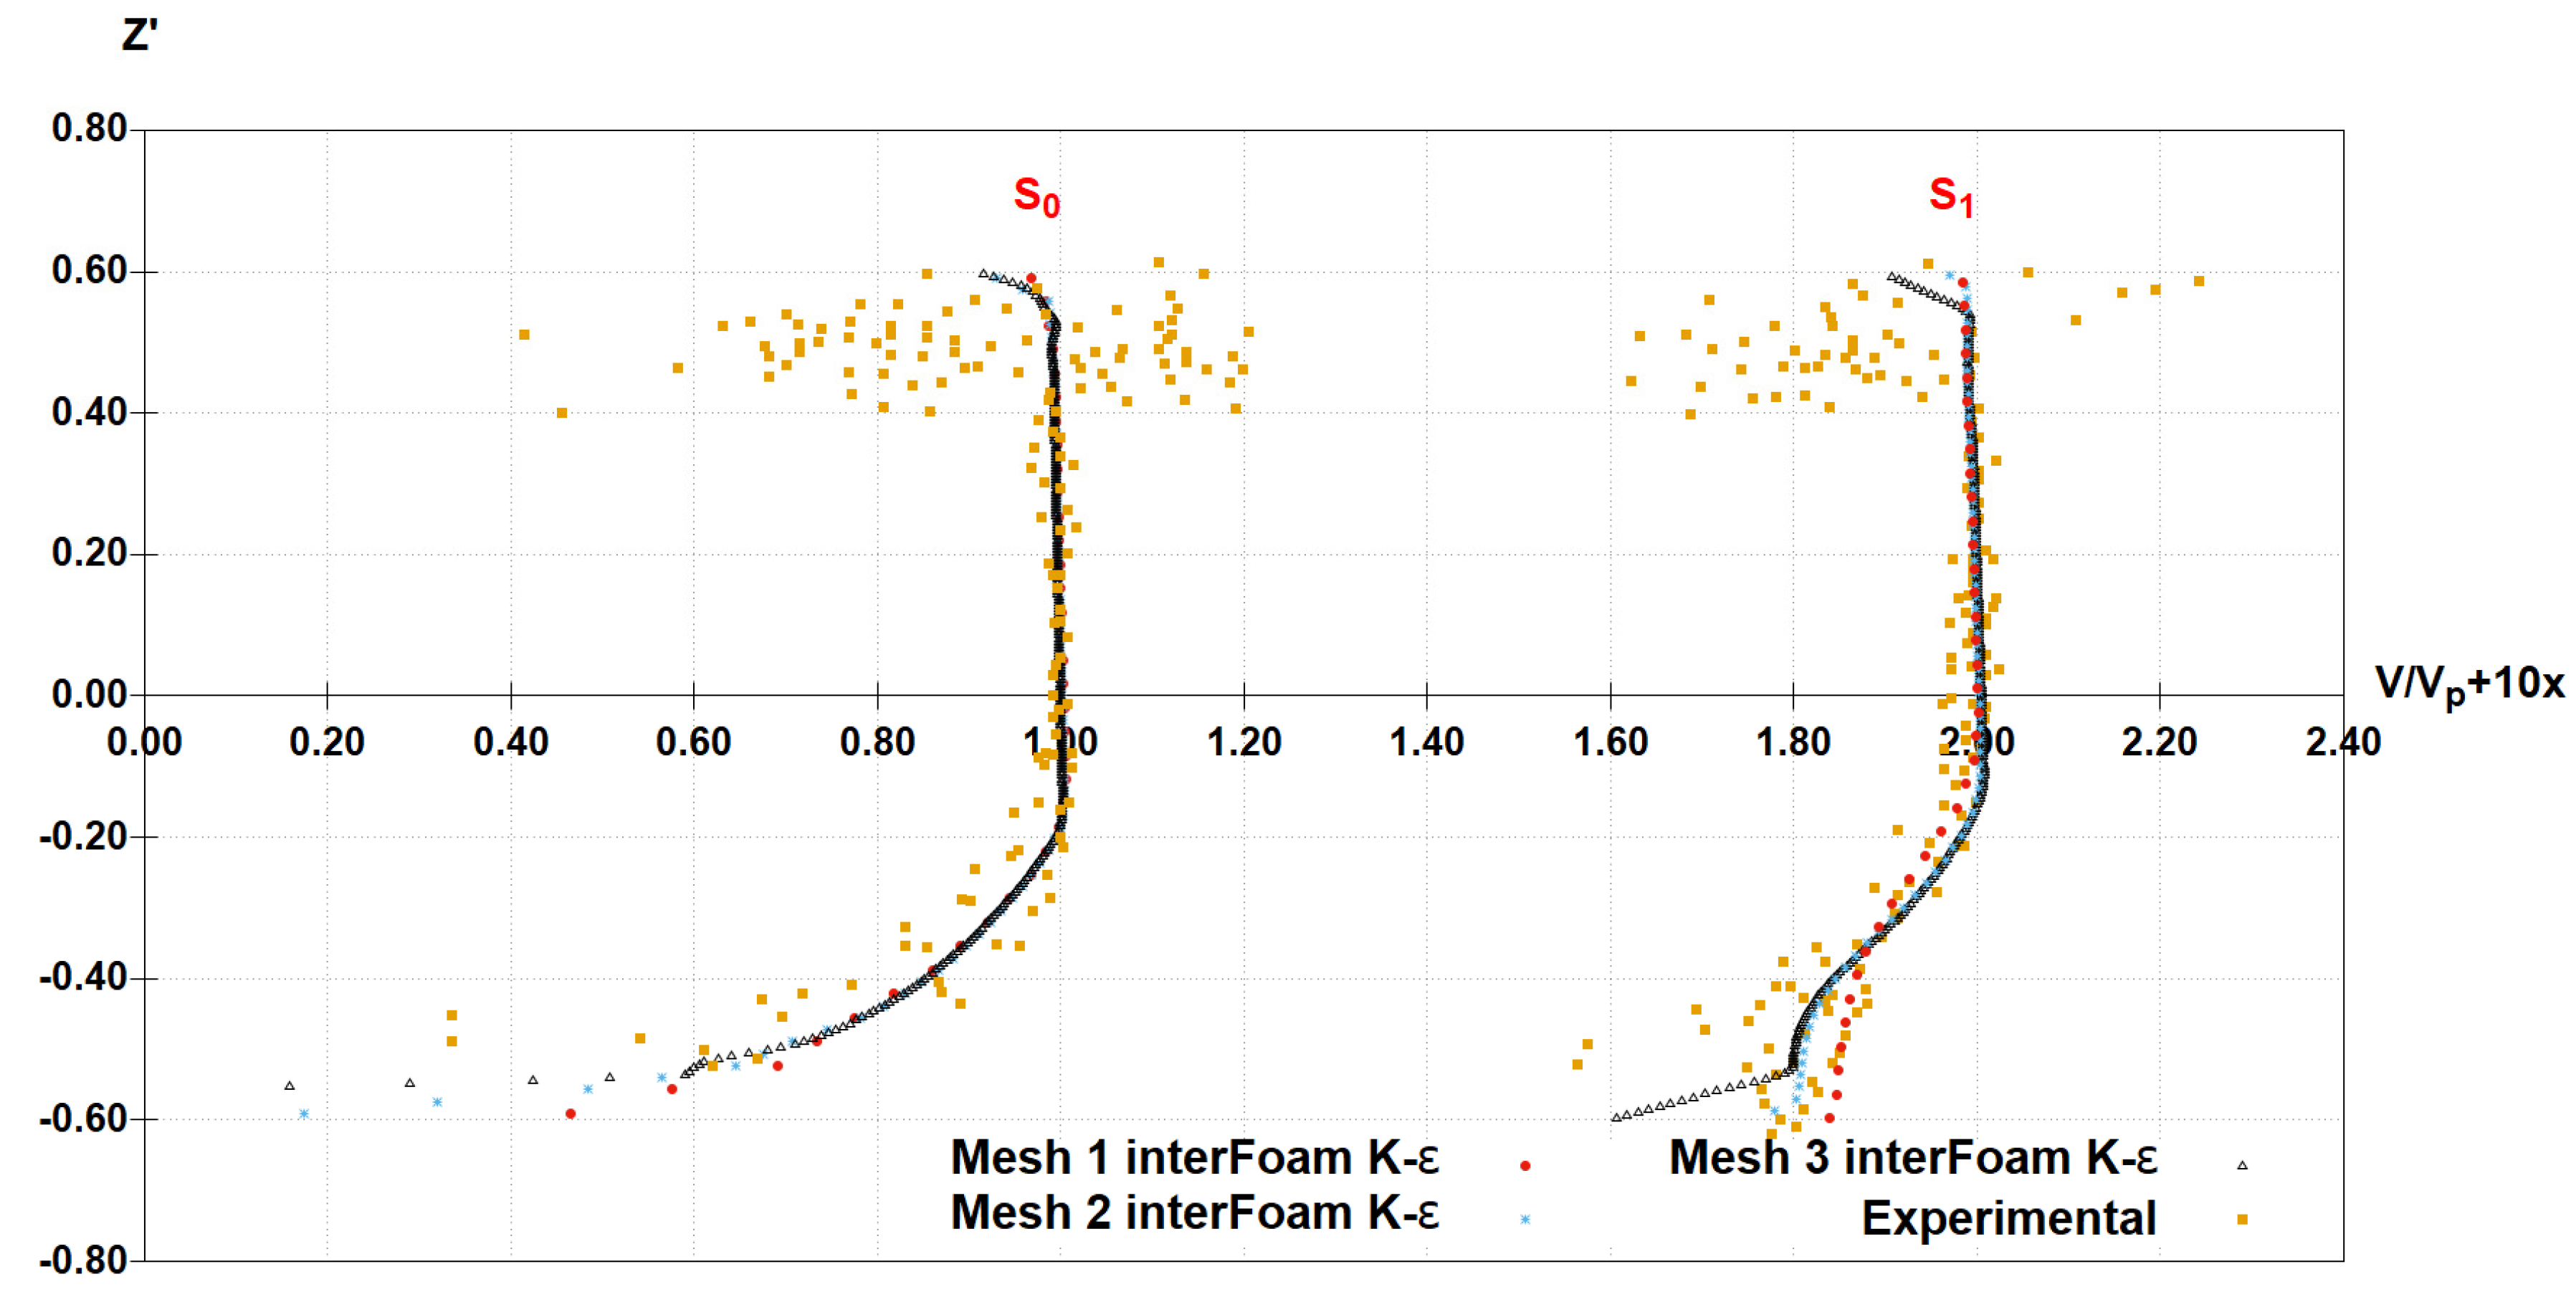
Figure 5.
Dimensionless velocity profile at S0 and S1 with twoPhaseEulerFoam.

Figure 6.
(a) CFD domain boundary definition and initial condition of water volume fraction for simulations with mesh 1; (b) side left velocity profile.
Figure 6.
(a) CFD domain boundary definition and initial condition of water volume fraction for simulations with mesh 1; (b) side left velocity profile.
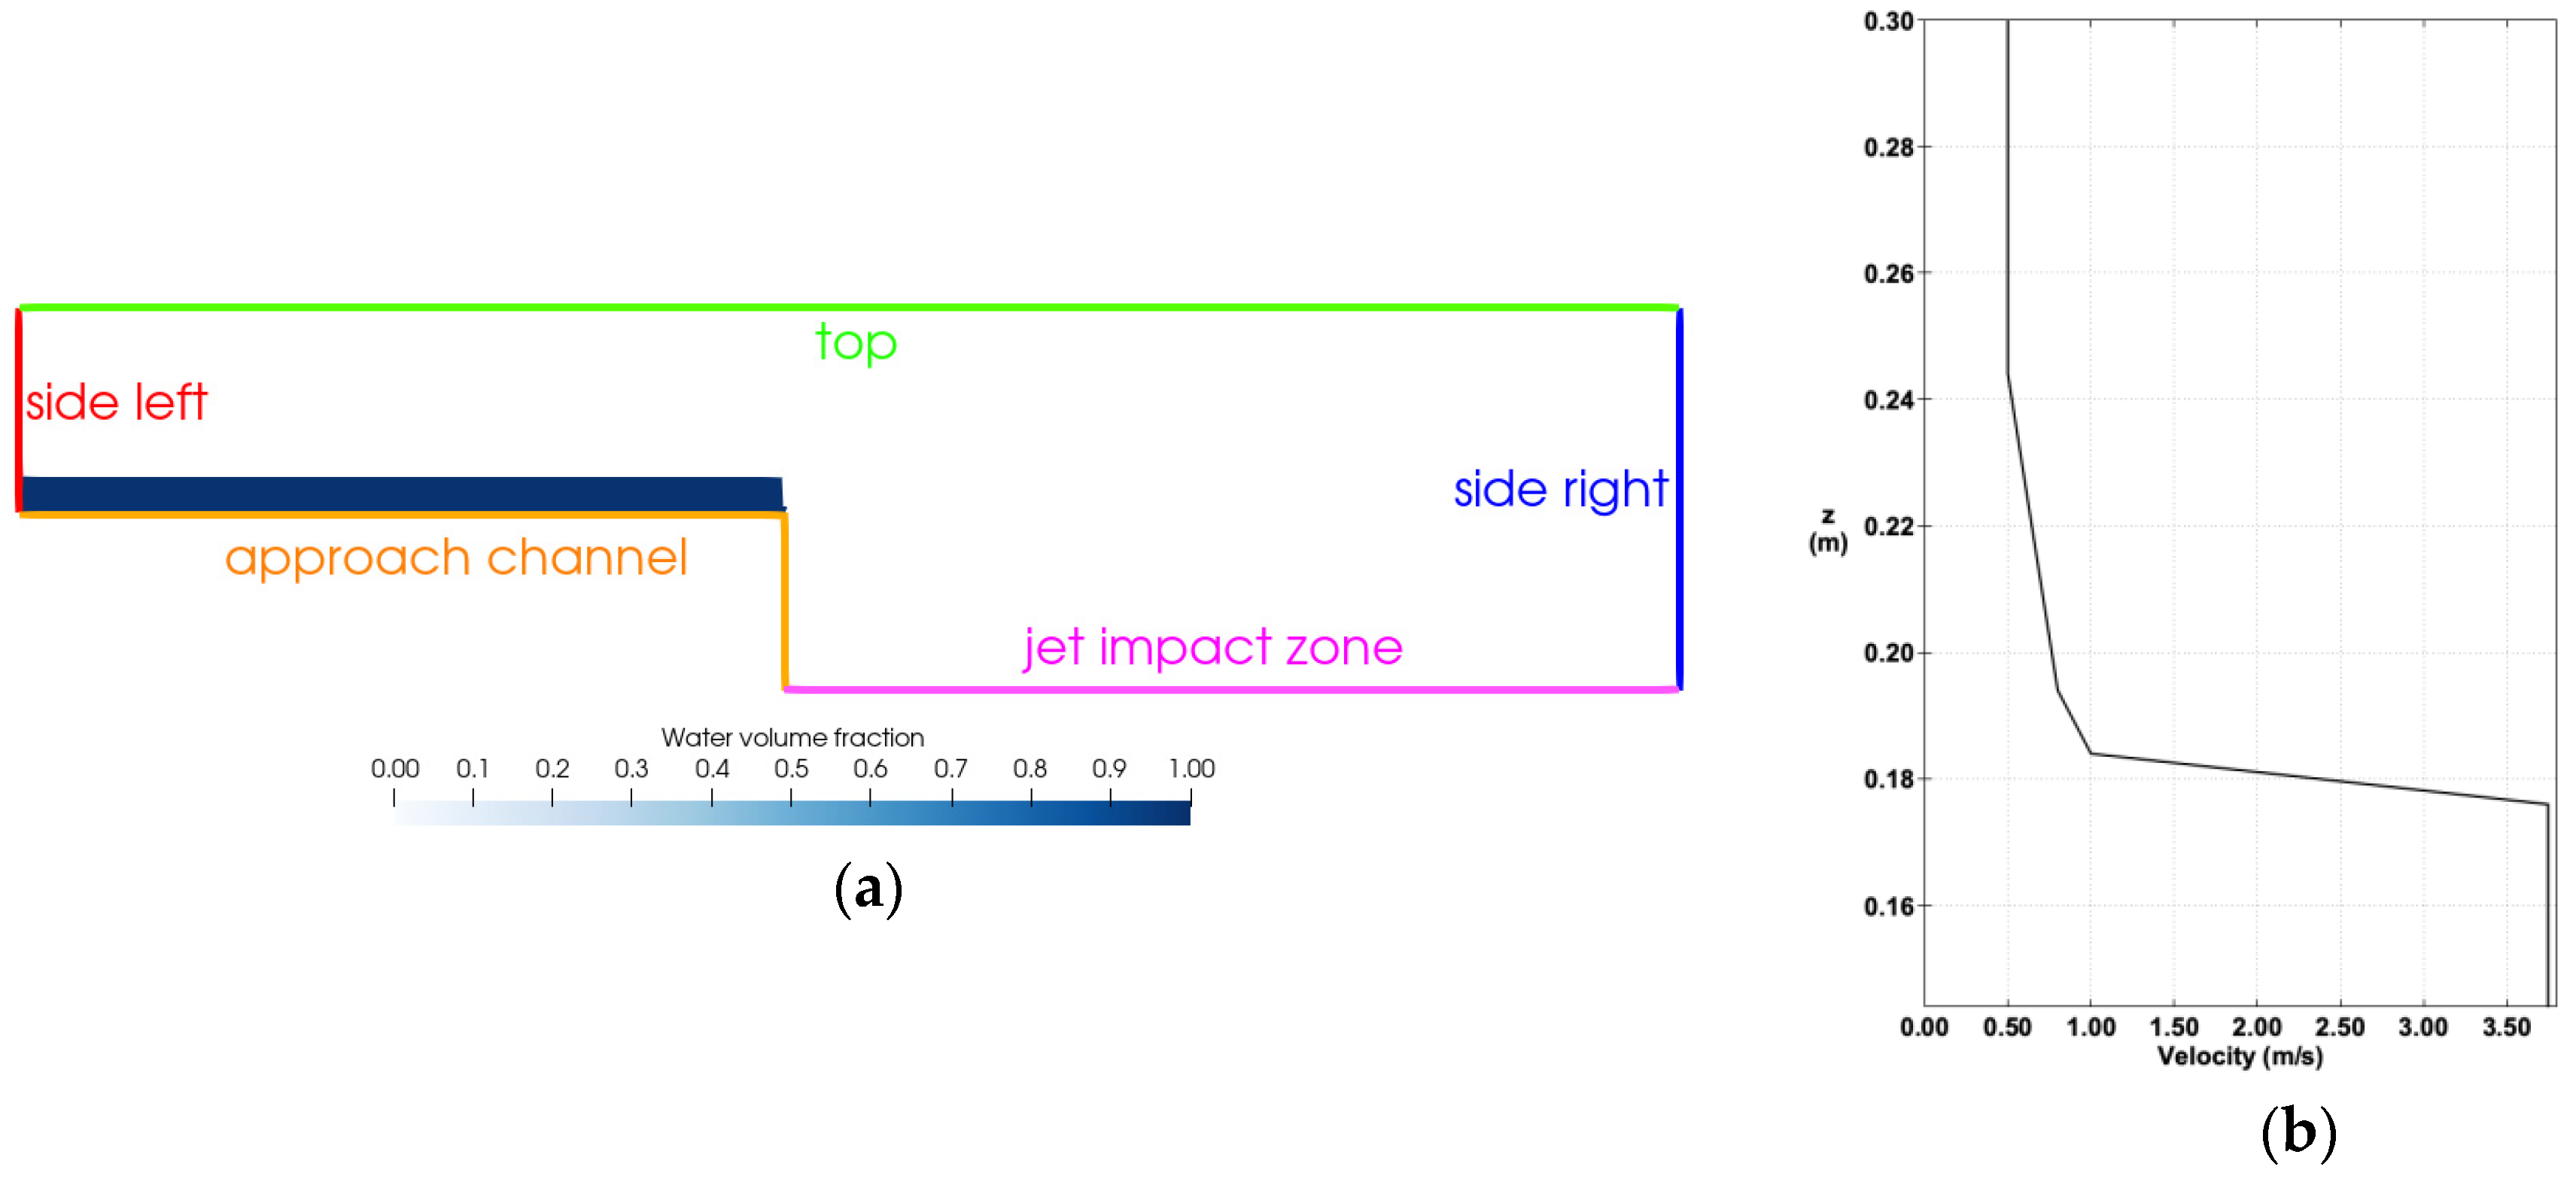
Figure 7.
Velocity field along the free jet for Vi = 3.75 m/s and d0 = 0.0296 m: (a) interFoam solver with, k-ε; (b) twoPhaseEulerFoam with mk-ε.
Figure 7.
Velocity field along the free jet for Vi = 3.75 m/s and d0 = 0.0296 m: (a) interFoam solver with, k-ε; (b) twoPhaseEulerFoam with mk-ε.

Figure 8.
Dimensionless velocity profiles along the free jet for Vi = 3.75 m/s and d0 = 0.0296 m.

Figure 9.
Dimensionless velocity profiles along the free jet for Vi = 3.75 m/s and d0 = 0.0296 m with interFoam solver, k-ε and SST k- turbulence models.
Figure 9.
Dimensionless velocity profiles along the free jet for Vi = 3.75 m/s and d0 = 0.0296 m with interFoam solver, k-ε and SST k- turbulence models.

Figure 10.
Dimensionless velocity profiles along the free jet for Vi = 3.75 m/s and d0 = 0.0296 m with twoPhaseEulerFoam solver, mk-ε and SST k- turbulence models.
Figure 10.
Dimensionless velocity profiles along the free jet for Vi = 3.75 m/s and d0 = 0.0296 m with twoPhaseEulerFoam solver, mk-ε and SST k- turbulence models.

Figure 11.
Air concentration along the free jet for Vi = 3.75 m/s and d0 = 0.0296 m: (a) interFoam solver with k-ε; (b) twoPhaseEulerFoam with mk-ε..
Figure 11.
Air concentration along the free jet for Vi = 3.75 m/s and d0 = 0.0296 m: (a) interFoam solver with k-ε; (b) twoPhaseEulerFoam with mk-ε..
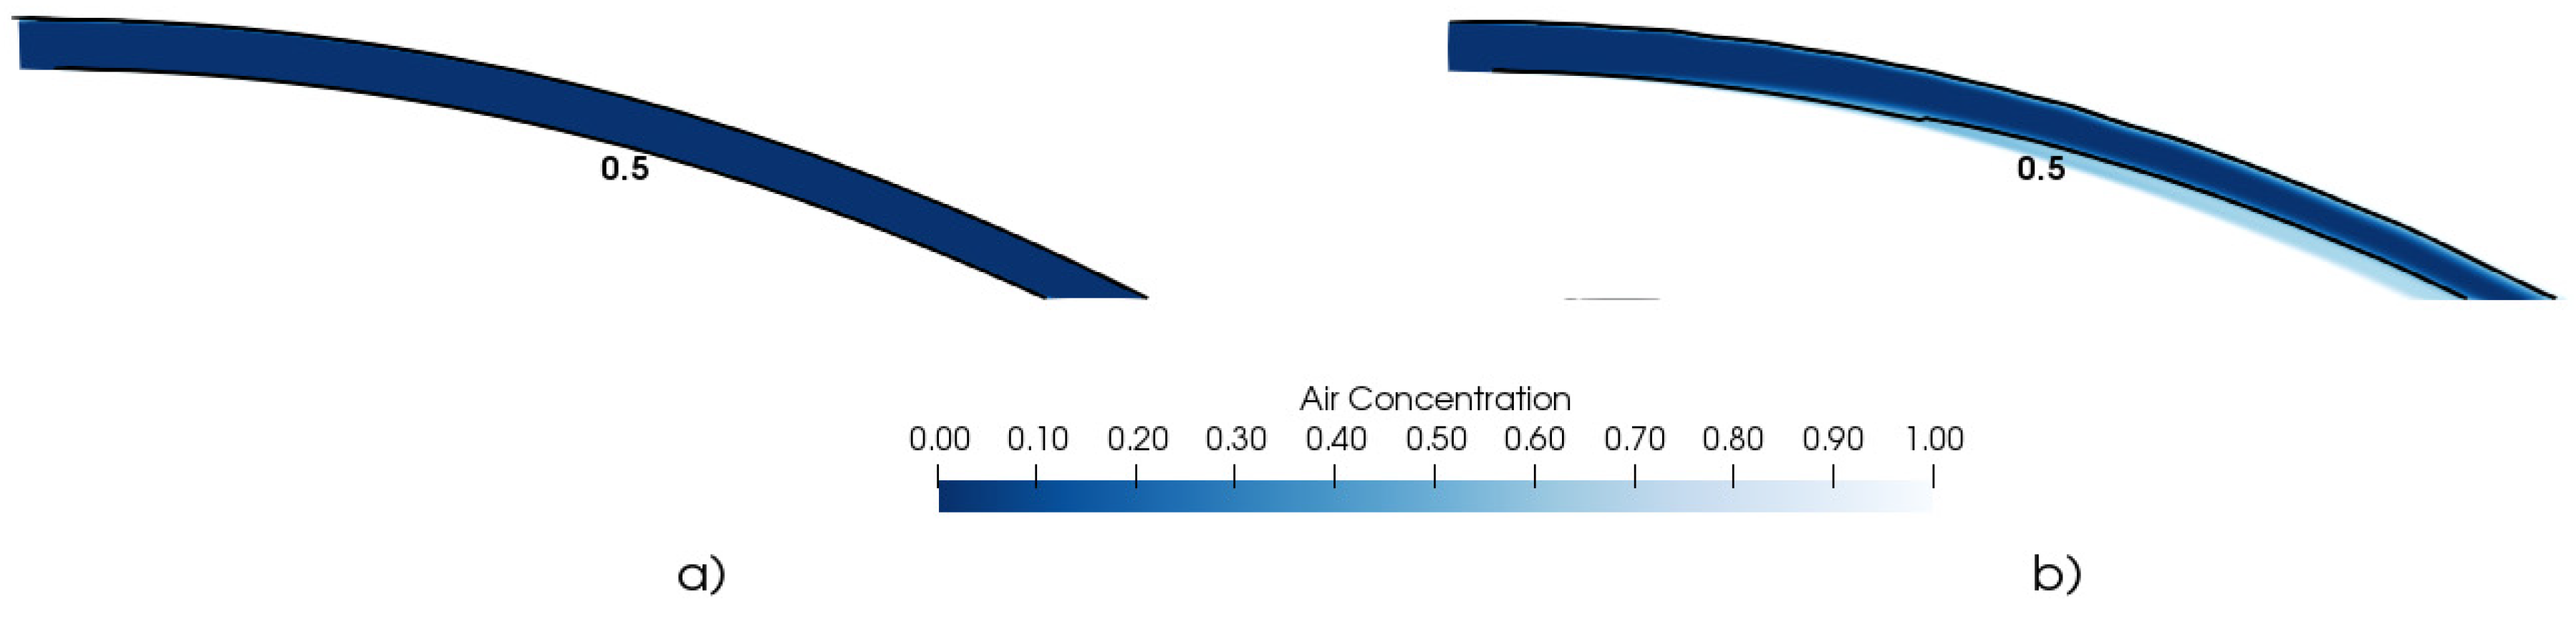
Figure 12.
Dimensionless air concentration distribution in the free jet with interFoam solver for Vi = 3.75 m/s and d0 = 0.0296 m.
Figure 12.
Dimensionless air concentration distribution in the free jet with interFoam solver for Vi = 3.75 m/s and d0 = 0.0296 m.
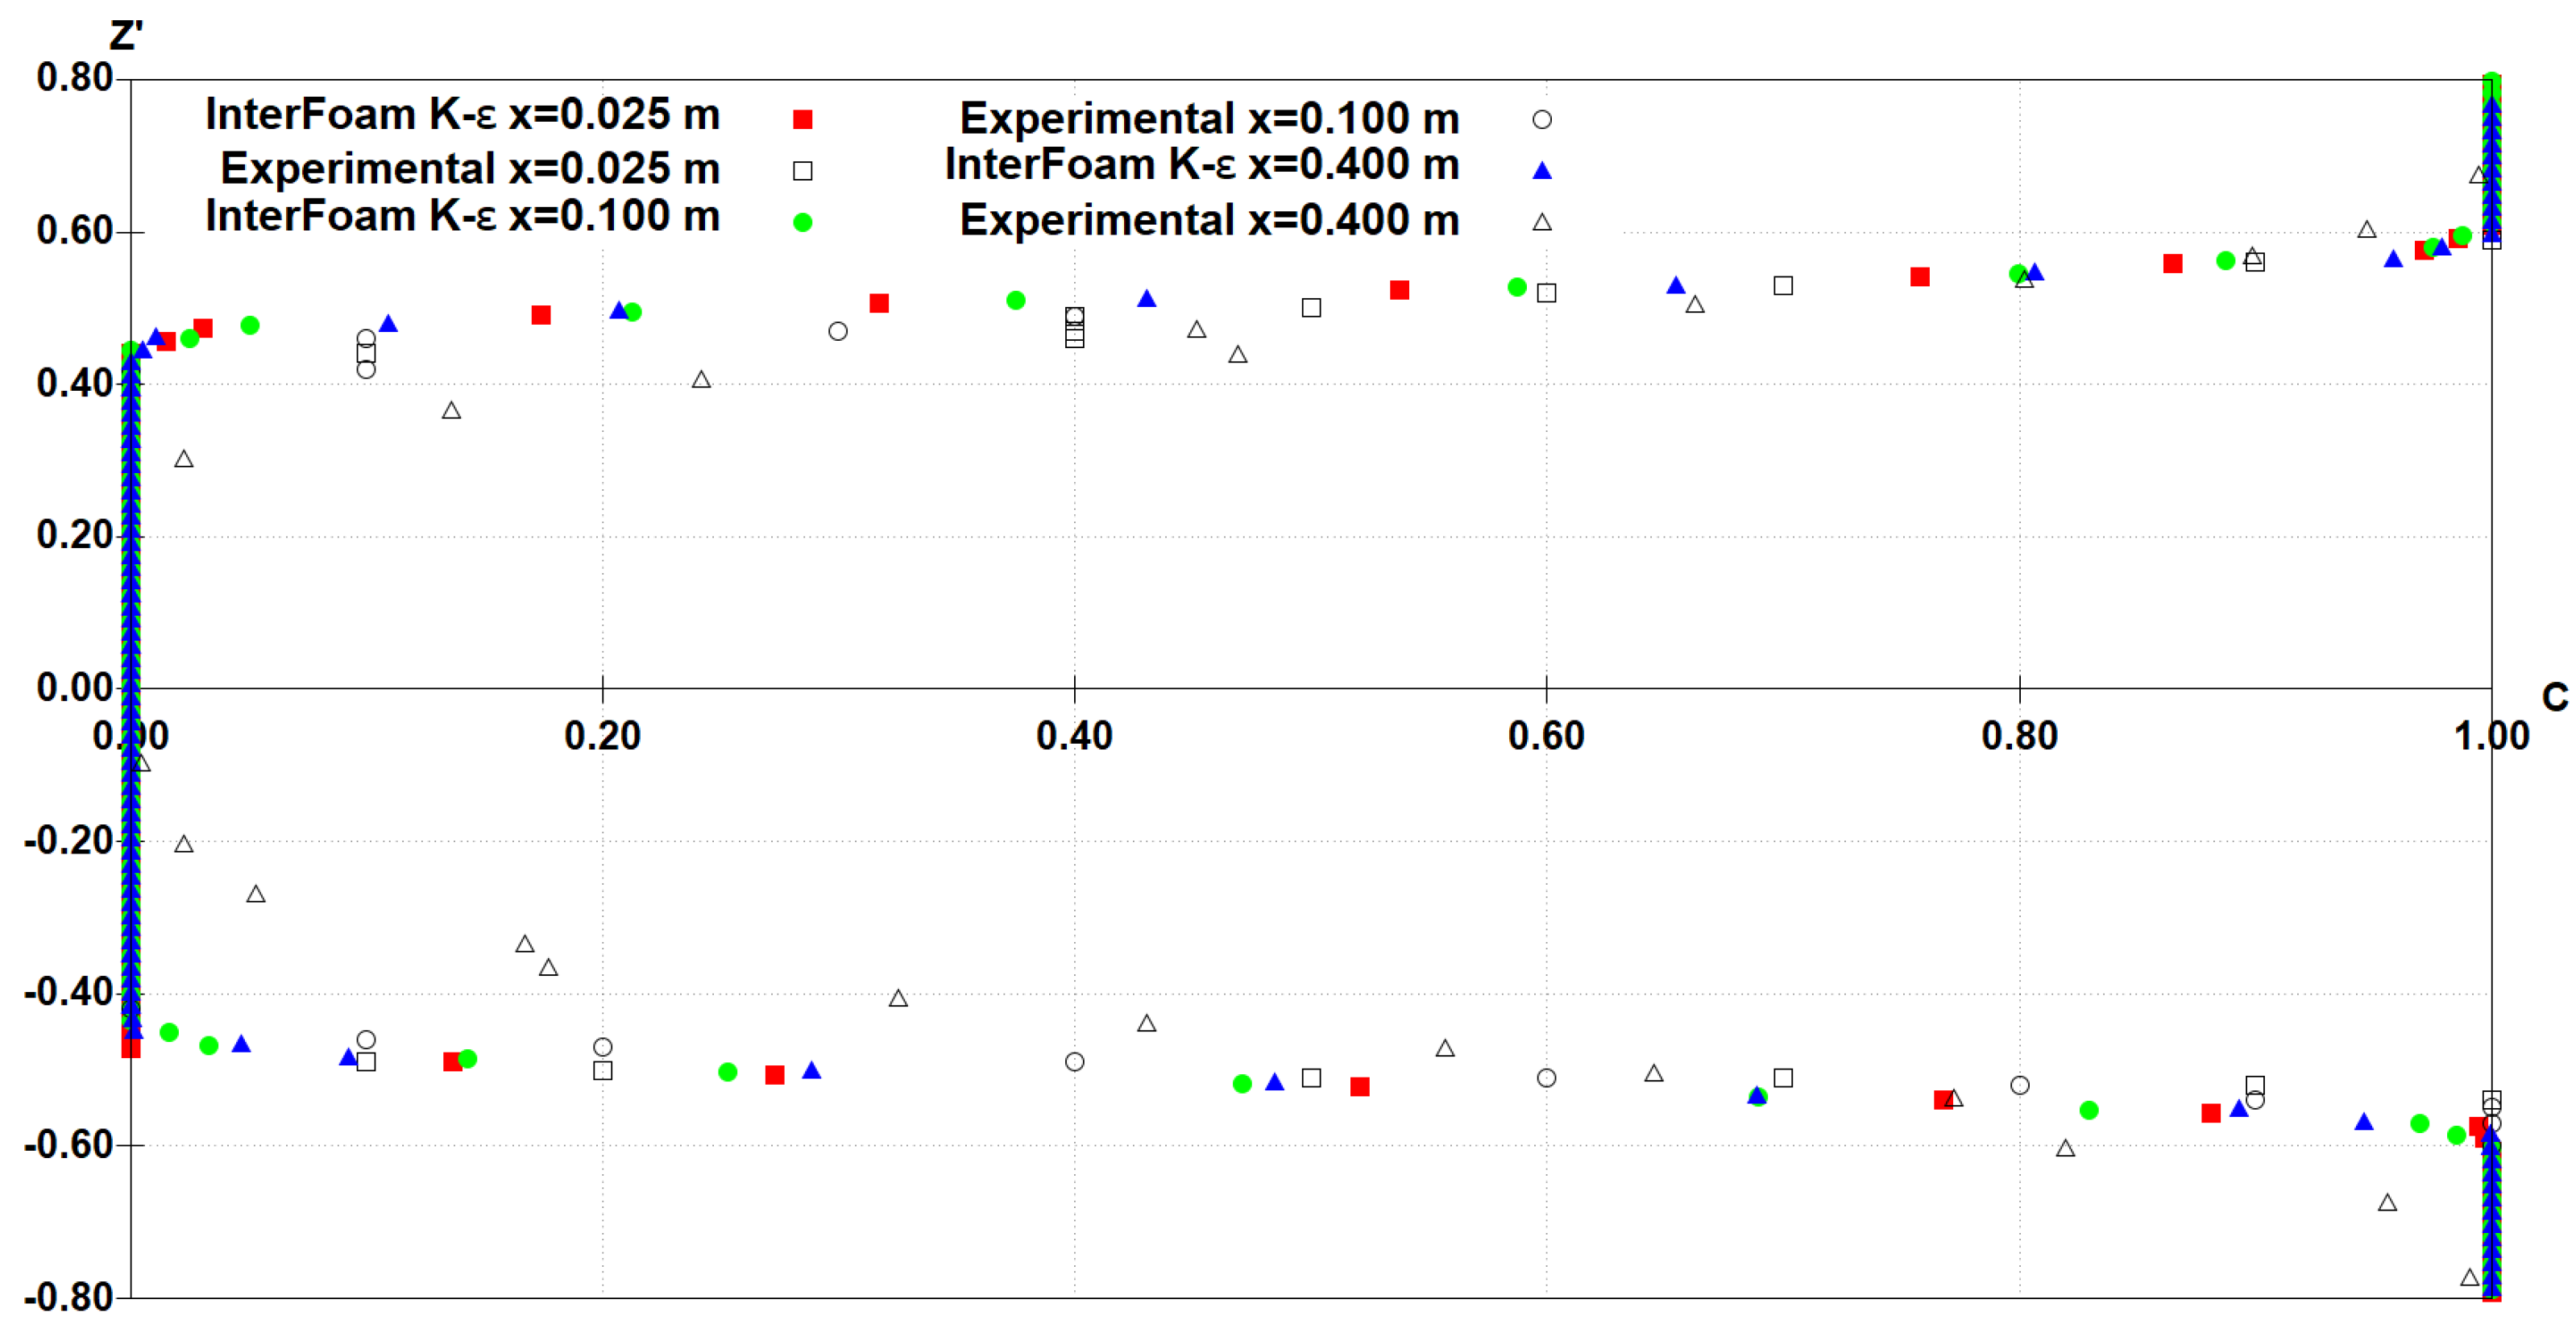
Figure 13.
Dimensionless air concentration distribution in the free jet with twoPhaseEulerFoam solver for Vi = 3.75 m/s and d0 = 0.0296 m.
Figure 13.
Dimensionless air concentration distribution in the free jet with twoPhaseEulerFoam solver for Vi = 3.75 m/s and d0 = 0.0296 m.

Table 1.
Comparison of solvers’ distinctive features.
| Features | interFoam | twoPhaseEulerFoam |
|---|---|---|
| Formulation | Euler-Euler (VOF) | Euler-Euler (Dispersed) |
| Phases | Two continuous | One continuous One dispersed |
| Mass and momentum equations | One set of equations | Two sets of equations |
| Interphase mass and momentum transfer | No | Yes |
Table 2.
Main characteristics of the used meshes.
| Mesh | Sub-Domains | Cell Dimensions (mm) | Number of Cells in a Cross-Section of the Jet | Total Number of Cells of the Mesh | y+ |
|---|---|---|---|---|---|
| 1 | All domain | 2.00 | ≈15 | 86.430 | 150 |
| 2 | Far from the jet Jet and vicinity | 2.00 1.00 | ≈30 | 227.545 | 75 |
| 3 | Far from the jet Jet and vicinity | 2.00 0.25 | ≈120 | 2.074.297 | 75 |
Table 3.
Divergence scheme used in the simulations.
| Term | interFoam | twoPhaseEulerFoam |
|---|---|---|
| convection | Gauss Van Leer | Gauss Van Leer |
| artificial compression | Gauss linear | Gauss Van Leer |
| momentum transport | Gauss linear Upwind grad(U) | Gauss upwind |
| turbulence | Gauss upwind | Gauss upwind |
Table 4.
Turbulence intensity of water at section x = 0.000 m.
| Inlet Turbulence Intensity (%) | interFoam (%) | twoPhaseEulerFoam (%) |
|---|---|---|
| 10.00 | 1.86 | 2.67 |
| 1.00 | 1.83 | 2.65 |
| 0.10 | 1.93 | 2.66 |
| 0.01 | 1.87 | 2.75 |
© 2020 by the authors. Licensee MDPI, Basel, Switzerland. This article is an open access article distributed under the terms and conditions of the Creative Commons Attribution (CC BY) license (http://creativecommons.org/licenses/by/4.0/).
Share and Cite
MDPI and ACS Style
Muralha, A.; Melo, J.F.; Ramos, H.M. Assessment of CFD Solvers and Turbulent Models for Water Free Jets in Spillways. Fluids 2020, 5, 104. https://doi.org/10.3390/fluids5030104
AMA Style
Muralha A, Melo JF, Ramos HM. Assessment of CFD Solvers and Turbulent Models for Water Free Jets in Spillways. Fluids. 2020; 5(3):104. https://doi.org/10.3390/fluids5030104
Chicago/Turabian StyleMuralha, António, José F. Melo, and Helena M. Ramos. 2020. "Assessment of CFD Solvers and Turbulent Models for Water Free Jets in Spillways" Fluids 5, no. 3: 104. https://doi.org/10.3390/fluids5030104