Article

Comparative Studies of Hyaluronic Acid Concentration in Normal and Osteoarthritic Equine Joints

by
Nikolaos Matisioudis
1,
Eleftherios Rizos
1,
Panagiota Tyrnenopoulou
2,
Lysimachos Papazoglou
2,
Nikolaos Diakakis
2 and
Amalia Aggeli
1,*
1
Laboratory of Biomedical Engineering, School of Chemical Engineering, Aristotle University of Thessaloniki, 54124 Thessaloniki, Greece
2
Department of Clinical Studies, School of Veterinary Medicine, Aristotle University of Thessaloniki, 54124 Thessaloniki, Greece
*
Author to whom correspondence should be addressed.
Fluids 2019, 4(4), 193; https://doi.org/10.3390/fluids4040193
Submission received: 4 July 2019 / Revised: 31 October 2019 / Accepted: 2 November 2019 / Published: 5 November 2019

Abstract

:
Osteoarthritis (OA) is the most common major disabling disease in humans and horses. Hyaluronic acid (HA), naturally abundantly present in synovial fluid (SF), is thought to have crucial impact on the functional rheological and biochemical features of SF in healthy and osteoarthritic joints. Here we present comparative measurements of HA concentration in SF from 35 normal and osteoarthritic equine joints, between two different approaches. On the one hand, an established biochemical HA-specific Enzyme–Linked Immunosorbent Assay (ELISA) assay was employed, which determined that SF in healthy and osteoarthritic equine joints is characterized by HA concentration of ca 0.3–2 mg/mL and 0.1–0.7 mg/mL respectively. On the other hand the same SF samples were also examined with a new exploratory approach of finding out HA concentration, which is based on SF rheology. This was done following “calibration” using appropriate model HA solutions. Comparative analysis of the results obtained by both the biochemical and the rheological approaches, revealed that in most cases the rheological approach greatly overestimates HA concentration in SF, by ca 3 to 8 times and 6 to 11 times, in healthy and diseased SF respectively. Overall these findings support the notion that, contrary to the established view, HA may not be the major contributor of equine SF rheology. This should be taken into account for the development of new more effective preventive strategies, as well as more effective early-stage interventions in osteoarthritis.

1. Introduction

Osteoarthritis (OA) is a chronic, degenerative joint disease, and it is an important cause of pain, disability and economic burden. It is the most common joint disease in humans as well as in horses; it is estimated that in 2008 over 100 million adults were affected by clinical OA in the USA and in Europe [1,2,3]. The main characteristic of the disease is the gradual degradation of cartilage as the extracellular matrix (ECM) degrades [4]. Physiologically, chondrocytes maintain an equilibrium between the synthesis and the degradation of ECM components such as collagen type II and aggrecan. However, in pathological circumstances, this balance is disrupted and a progressive loss of the articular cartilage (AC) begins. This process results in pain and physical disability [5,6,7,8].
In addition, in pathological situations, there is a decrease in the concentration and molecular weight of hyaluronic acid (HA), a linear anionic polysaccharide composed of repeated disaccharide units of N-acetyl-D-glucosamine and D-glucuronic acid [9,10], in synovial fluid (SF) [4]. Synovial fluid, a small amount of viscoelastic non-Newtonian fluid, acts both as a biological lubricant between the surfaces of the articular cartilage of the joint [11,12] and as a medium for nutrient transport to chondrocytes [13]. It is an ultrafiltrate of plasma, with a clear to pale yellow color [14] and it mainly consists of HA polymeric chains, which form a transient network structure [15] and other factors such as lubricin (also known as PRG4), a glycoprotein that facilitates the gliding motions in joints, blood plasma proteins, such as albumin and γ-globulin and surface-active phospholipids (SAPL) [11]. HA and PRG4 (~220 kDa) are reported to be the primary lubricant macromolecules in SF [16] and the latter seems to play a crucial role in organizing HA macromolecules and providing SF with the capacity to dissipate strain energy and display shock absorbing properties [12]. HA concentration in healthy adult human synovial fluid ranges from 2.5 to 4 mg/mL and its molecular weight from 4 to 5 × 10⁶ Da [2]. On the other hand, healthy equine synovial fluid is characterized by HA with an average MW ranging from 2 to 3 × 10⁶ Da and HA concentration from 0.33 to 1.5 mg/mL [17].
Current treatment strategies for osteoarthritis aim at relieving the symptoms, such as pain, minimization of the articular cartilage breakdown, swelling, varying levels of lameness, osteophytes and inflammation rather than curing the disease [1,17]. One of the most common treatment approaches is viscosupplementation (VS). Balazs and Denlinger [18] introduced this concept, a process in which the pathological SF is replaced by exogenous hyaluronic acid via intra-articular injection, with the hope of restoring the normal viscoelastic properties of SF in the joint and, thus, improving joint mobility [2,19,20,21]. This approach has recently attracted some controversy regarding its therapeutic efficacy.
In an attempt to cast further light on the role of HA in OA, here we present comparative measurements of HA concentration in SF from 35 normal and osteoarthritic equine joints, using two different approaches: on the one hand, an established biochemical HA-specific ELISA assay was employed; on the other hand the same SF samples were also examined with a new exploratory approach of finding out HA concentration, which is based on SF rheology; this was done following “calibration” using appropriate model HA solutions.

2. Materials and Methods

2.1. Preparation of Model NaHA Solutions

We used Viscure® as a source of pure hyaluronic acid. Viscure®, produced by Hyaltech Ltd., is an intraarticular injection of known concentration (10 mg/mL) and molecular weight (1800–2000 kDa) of uncross linked HA, prescribed to osteoarthritic patients. The production method of Viscure® is based on bacterial fermentation of the safe bacterial stain Streptococcus equi. This method ensures low levels of toxic metabolites and, therefore, high degree of purity. The solvent used for the dilution of the content of injection to lower concentrations was PBS (Phosphate Buffered Saline) and it was purchased from Sigma Aldrich. Sodium Azide (NaN3) was added as an antimicrobial agent at a concentration of 0.1% wt.
A series of solutions of known HA concentration in the range from 0.5 mg/mL to 6 mg/mL were produced. The solutions were prepared by simply diluting the content of the injection in PBS solvent (pH = 7.4 ± 0.1). Dilutions were prepared by simply mixing the product with the solvent in a vial and then placed into a bath at 40 °C for the homogenization of the dilution. All samples were stored at ambient temperature.

2.2. Collection of Synovial Fluid Samples from Healthy and Pathological Equine Joints

Healthy SF samples were obtained from 10 mature Warmblood and 6 English Thoroughbred healthy horses, aged from 4 to 17 years (median 6 years), as previously described [22,23]. SF was directly aspirated from the joints by using of a 21-gauge needle in a routine sterile manner. The absence of lameness at walk and trot, negative flexion tests as well as no radiographic abnormalities in the examined joints of forelimbs were the inclusion criteria for both groups. From each of the two breeds, samples were obtained from the metacarpophalangeal (Fetlock) and the intercarpal joint (Carpus). Furthermore, SF samples were obtained from the 2nd interphalangeal joint (Coffin) of 3 Warmblood horses. None of these horses had received intra-articular medication or non-steroidal anti-inflammatory drugs during the last 3 months before SF aspiration.
Pathological SF samples were collected from 9 mature Warmblood (WB) and 10 English Thoroughbred (TB) horses, aged from 4 to 18 years (median 7 years) with signs of mild to moderate lameness (grade 1–4 on the AAEP lameness scale) attributable to OA. The diagnosis of OA was based on a comprehensive orthopaedic lameness examination and a positive response to intra-articular anaesthesia of the affected joint. For radiographic assessment of the joint a minimum of four views (latero-medial, dorso-palmar and two oblique views) were used. Radiographs were scored blindly by consensus opinion of two experienced radiologists (one board-certified, ECVDI). Scores were allocated to all radiographic findings recorded, using a I-V severity grading system as Verwilghen, et al. [24] described. Radiographs were assessed for swelling, presence and size of osteophytes, narrowing of the joint space, sclerosis or lysis of the bone underlying the joint cartilage. It was required that lameness be present for at least 3 months prior to enrolment in order to exclude horses with acute soft tissue injuries/synovitis. None of the affected joints had undergone intra-articular analgesia or treatment in the month prior to SF aspiration.
Both healthy and osteoarthritic horses were residents at the same premises (horse riding school and Athens racetrack respectively) and received the same training protocol. All of the horses included in the present study were privately owned, active athletes, rather than laboratory animals. Therefore, according to the State Authorities, the only requirement for inclusion in this particular study was the written consent of the owners. Moreover, all of the horses were monitored for a prolonged period of time after the aspiration of the synovial fluid to ensure that no side effects were noted.

2.3. Rheological Studies

Rheological measurements were carried out using an AR-G2 controlled stress rheometer (TA Instruments). Both dynamic and steady state experiments were performed with a 40 mm Titanium parallel plate geometry at 37.5 °C (the physiological horse temperature) and at 25 °C with the lower parallel Peltier plate having a temperature accuracy of ± 0.1 °C, depending on sample availability. A plastic cover was fitted around the plates in order to slow down sample evaporation during the experiment. The volume of each aliquot ranged from 0.30 to 0.35 mL with a gap between the two plates from 240 to 280 μm.
The oscillatory measurements involved the Time Sweep experiment, which measures the alteration of elastic G′ and viscous G″ moduli with time, and the Frequency Sweep experiment which measures the alteration of the same variables as a function of oscillation frequency. The strain applied to the aliquots in both experiments, was 3%, known to be in the Linear Viscoelastic Regime (LVR). The angular frequency of oscillation for Time sweep measurements was kept at 0.5 Hz (3.142 rad/s). The steady-state experiments involved the shear viscosity η measurement of all solutions in a range of shear rates from 0.1 to 1000 1/s. The rheometer’s correct operation was verified by using a Cannon certified viscosity reference standard oil S60 (Cannon Instrument Company, State College, PA, USA), as indicated in Appendix B. The SF samples were measured fresh, i.e., within 24 h from aspiration; in the meanwhile, the samples were kept in a refrigerator at ca 4 °C.

2.4. ELISA Testing

For the biochemical measurements of HA concentration in equine SF samples, a commercially available, non-species specific ELISA kit (Enzyme–Linked Immunosorbent Assay kit) (TECO Hyaluronic Acid, TECO medical AG®) was used. This assay has been used extensively so far for the successful determination of HA concentration in biological fluids [23,25,26,27,28,29]. The assay is based on a HA-specific binding protein (HABP) and is able to detect HA molecules of different molecular weights.
ELISA measurements were carried out as previously described [23]. In brief, samples were stored in aliquots of 500 μL at −40 °C. Prior to testing, SF samples were thawed and diluted thousands of times, typically 1:1000 to 1:2000, as appropriate in order to fit in each case in the range of quantification of the method. The susceptibility of errors related to high dilution and high viscosity of SF samples was determined by repeated dilution of three samples and calculation of variations. Control samples (C1 and C2) as well as known HA concentration samples (A–F: 0–1000 ng/mL), were used to derive the calibration curve. Incubation was carried out at 21 °C for 2 h, followed by ×5 wash with buffer. Then 100 μL of conjugate was added in each samle and incubated at 21 °C for 30 min. This was washed off, then 100 μL of substrate 3, 3′, 5, 5′-tetramethylbenzidine (TMB) was added in each sample, followed by incubation in the dark at 21 °C for 30 min. The reaction was terminated by the addition of 1M HCl. Absorbance values were recorded at 450 nm with reference at 630 nm, using a microplate spectrophotometer (Stat Fax® 3200; Awareness Technology Inc., Palm City, FL, USA). Analysis of the absorbance values of samples and calibrators and calculations of HA concentrations were performed using the GraphPad Prism software (version 7.03; GraphPad Software Inc., La Jolla, CA, USA).

3. Results

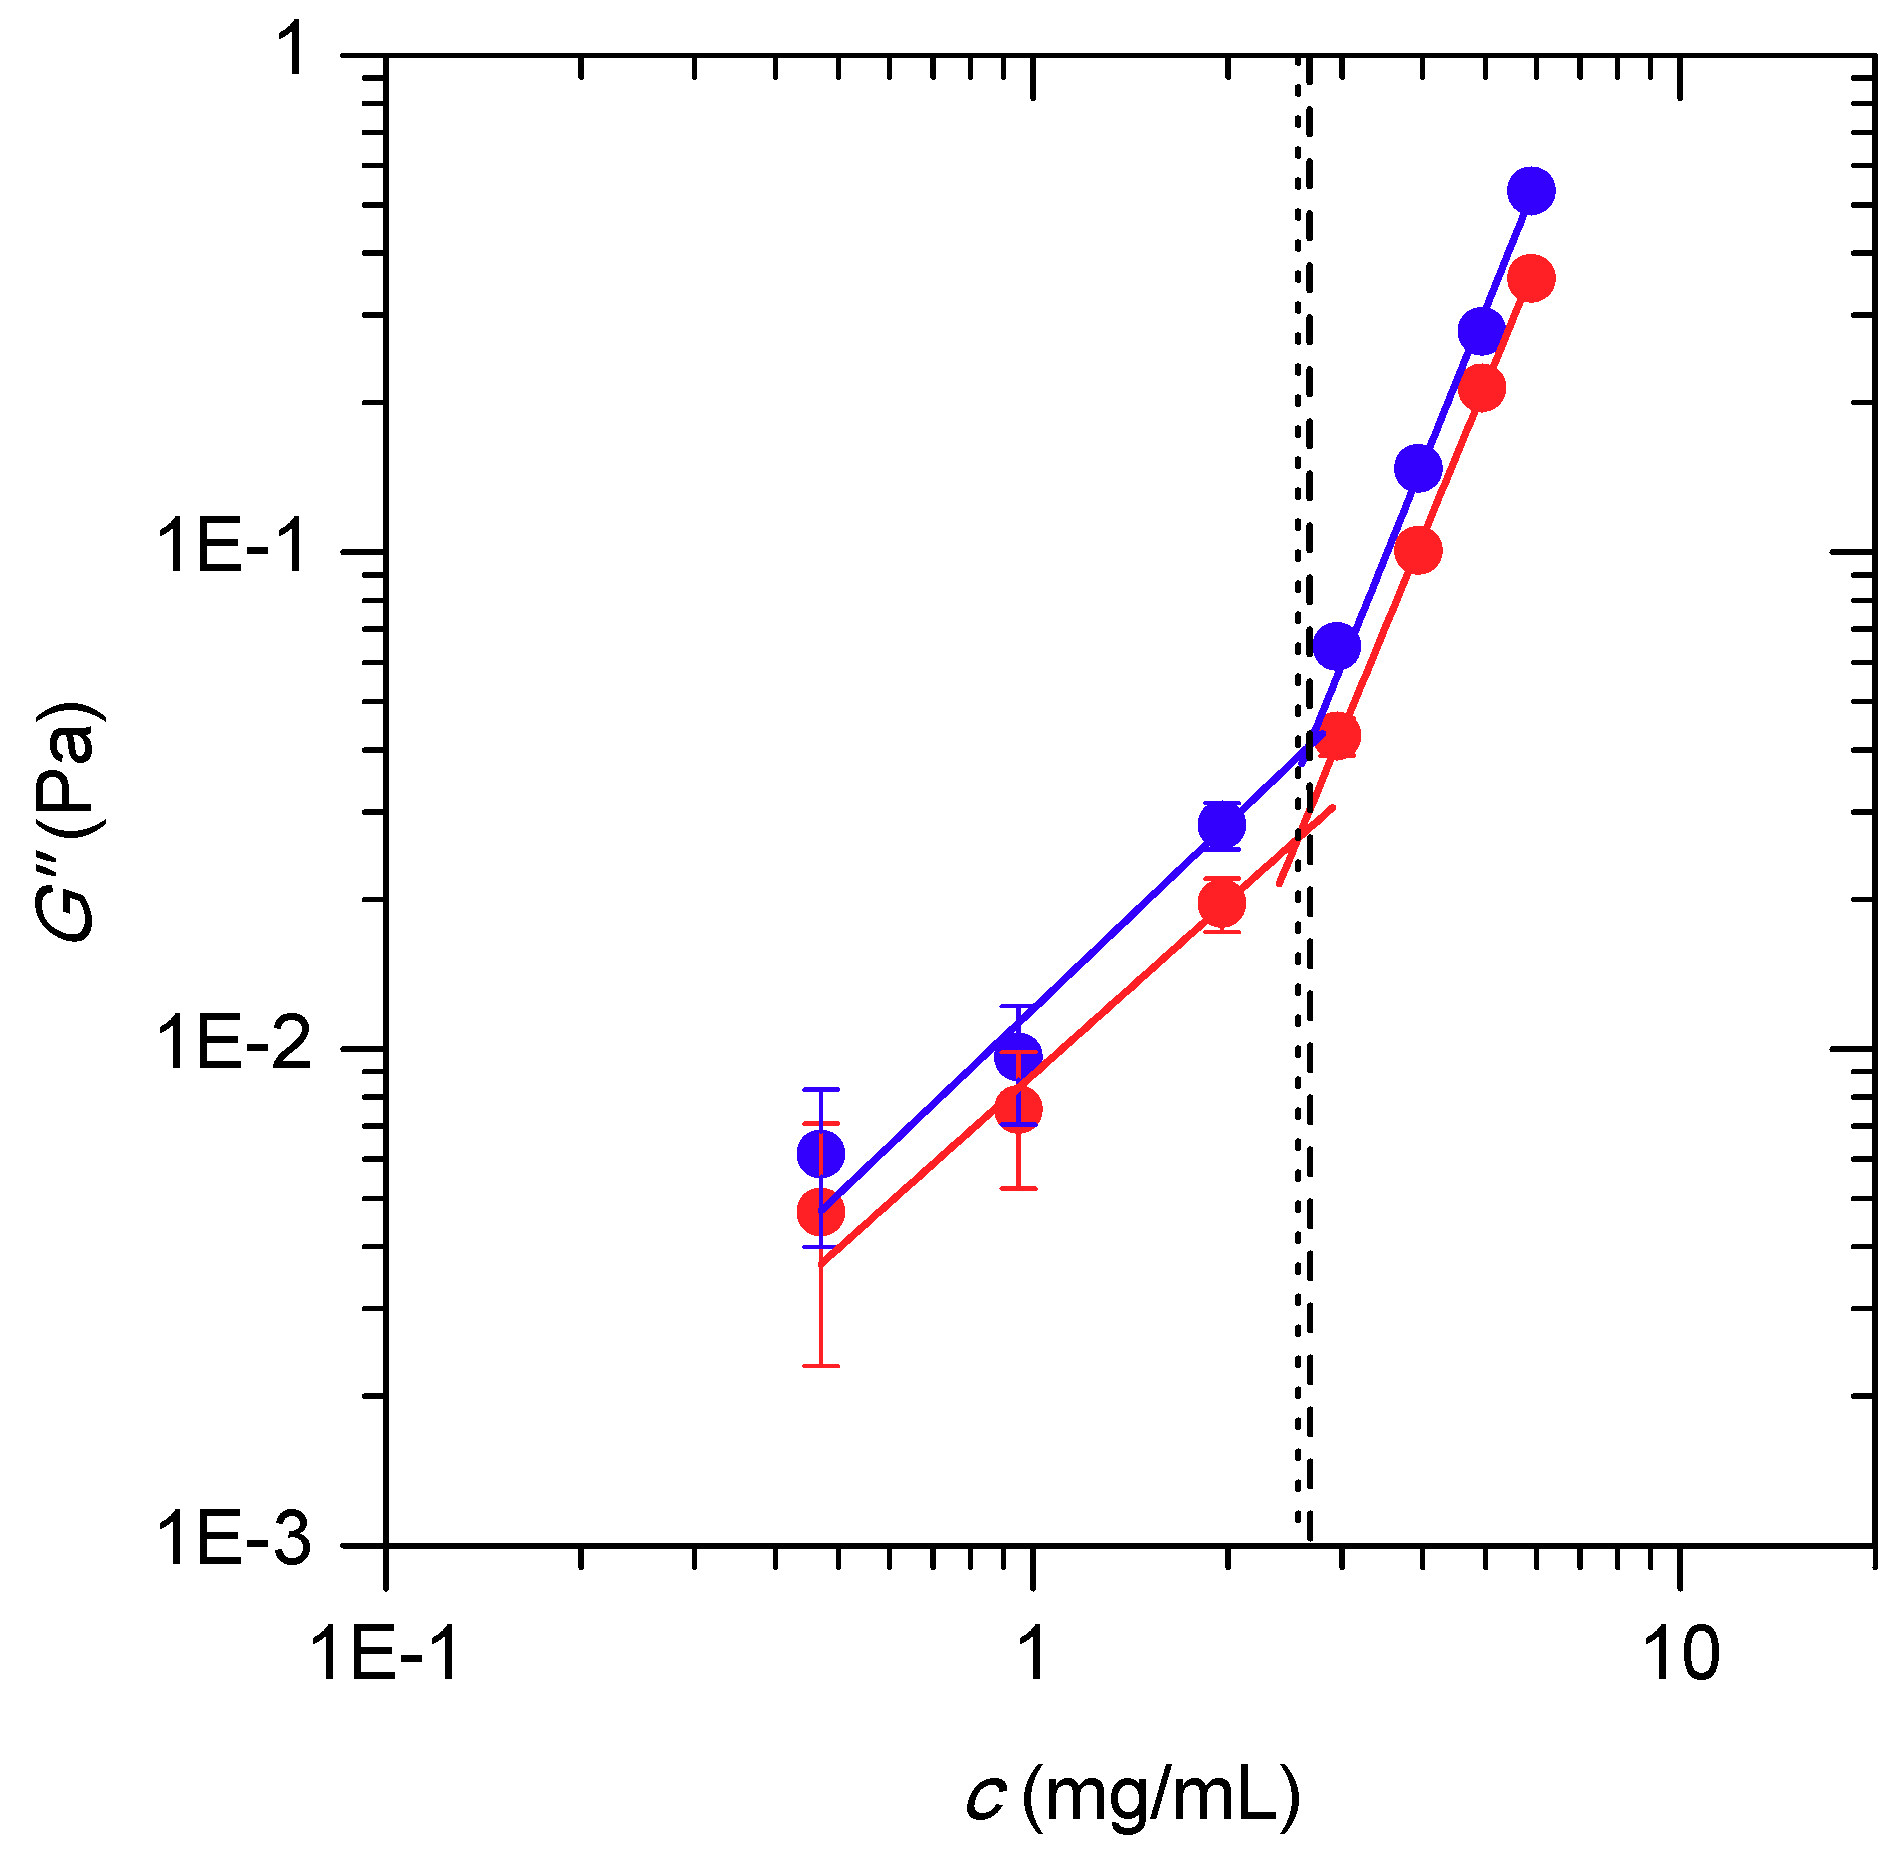
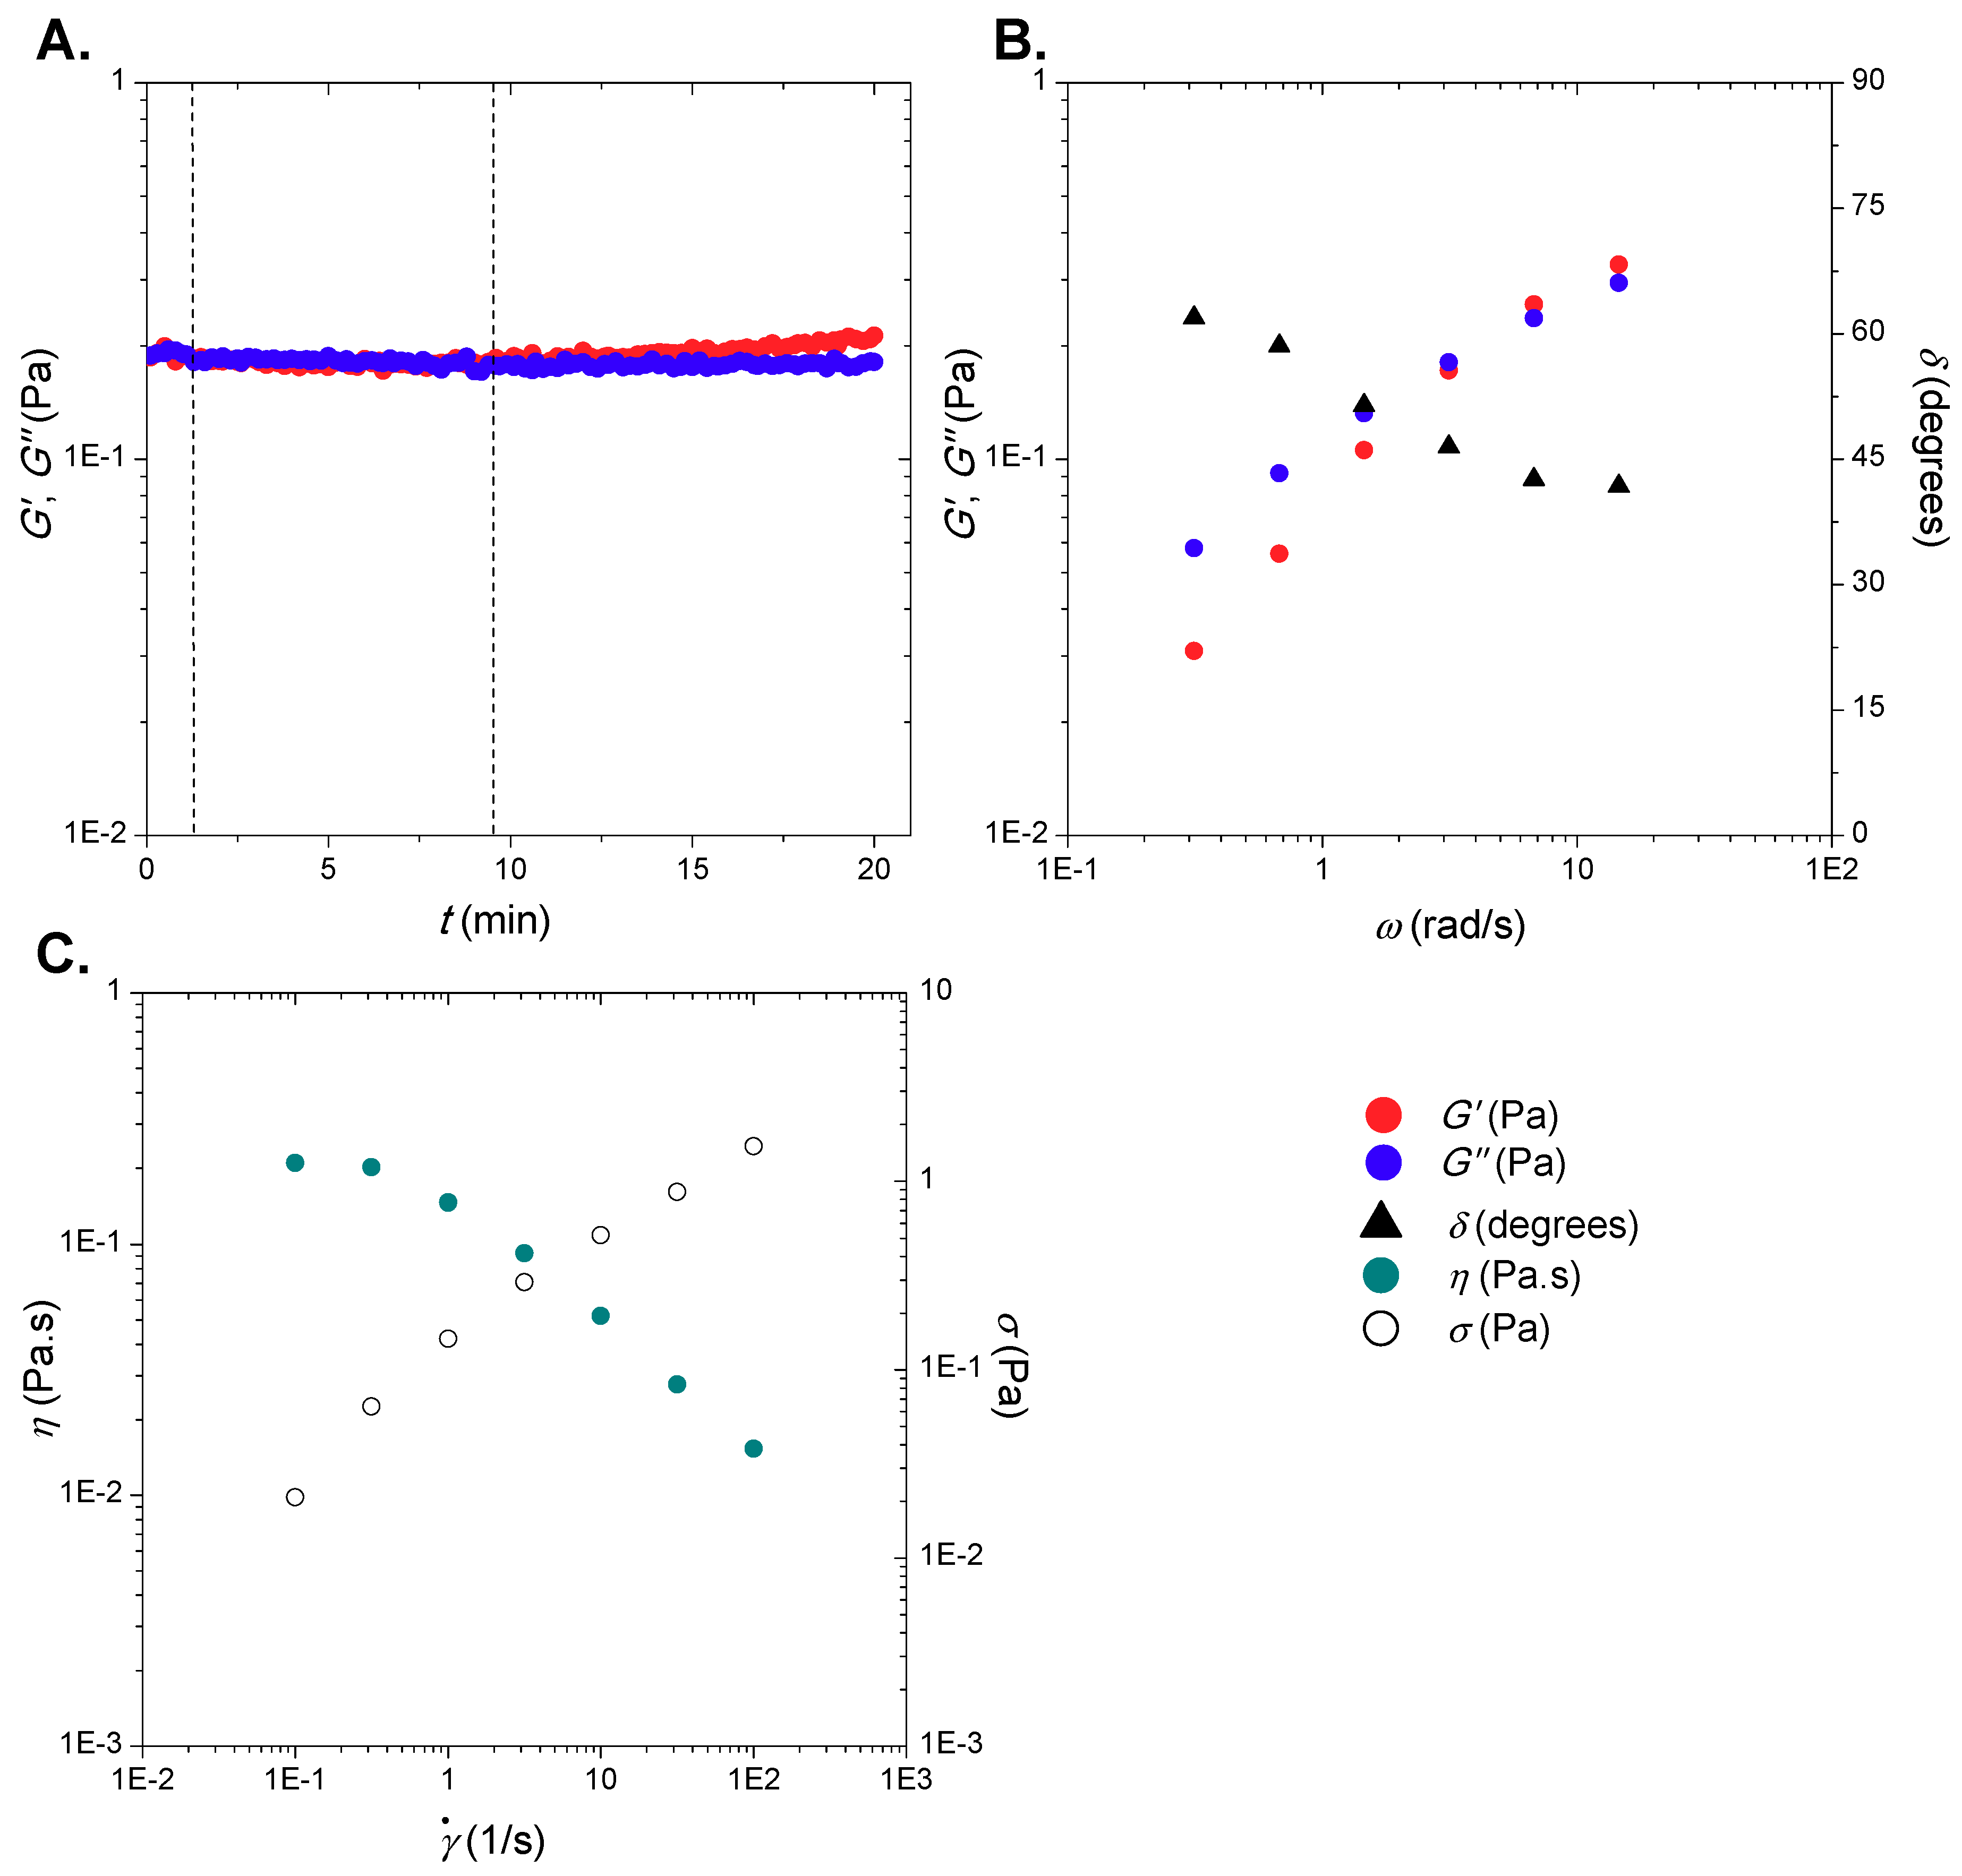
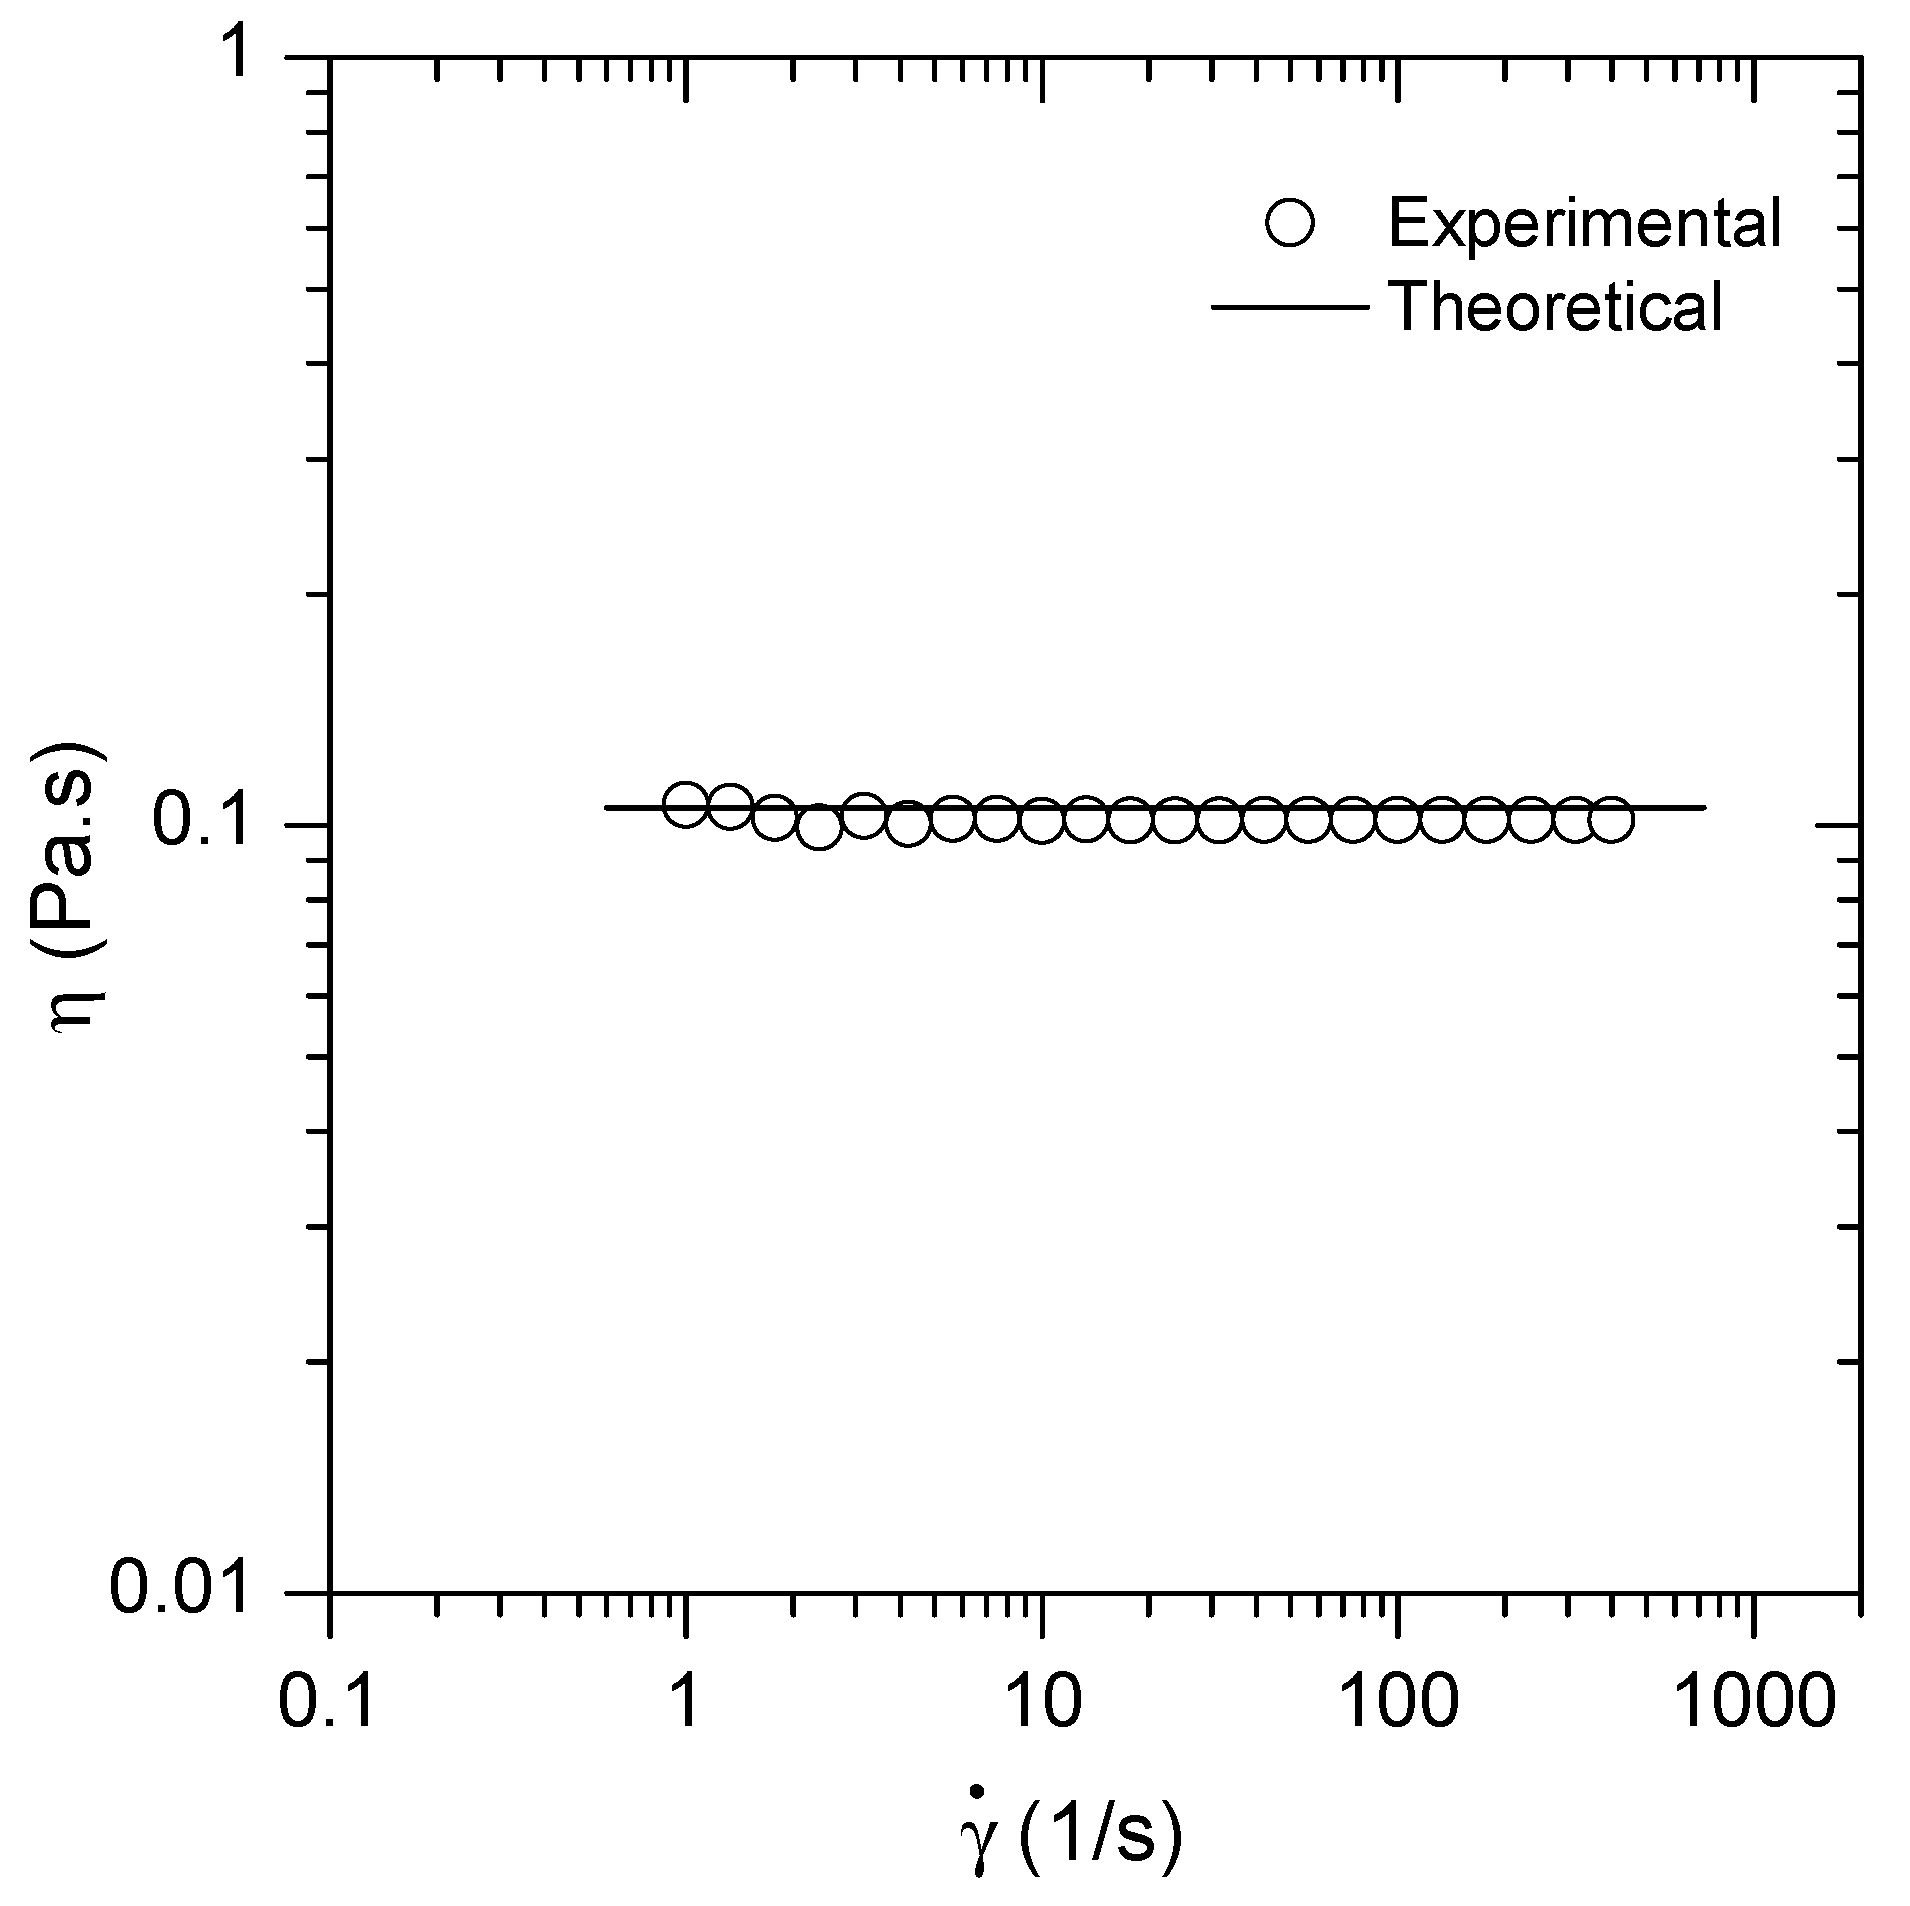
3.1. Rheological Studies of Model HA Solutions and of SF Samples

In Figure 1, the Time Sweep (A), the Frequency Sweep (B) and the Flow Step (C) experiments are presented for a representative model solution of HA concentration of 5 mg/mL at 37.5 °C. Figure 1A shows the alteration of G′ and G″ with time. We observed an increase of G″ and especially of G′, after the 3rd minute. By taking into account the fact that we conduct the experiment at 37.5 °C, we inferred that this may happen due to the evaporation of the water in the sample. Therefore, we decided to consider as reliable only the values between the 1st minute (a short period is necessary in order for the sample to reach thermal equilibrium) and the 3rd minute. Regarding Figure 1B, we noticed that the viscous character of the material (G″) prevails over the elastic one (G′) at lower frequencies of oscillation; the opposite response can be observed at higher frequencies of oscillation. In addition, the tendency of phase δ curve agrees with the aforementioned response, as it shows that at lower frequencies, the material is mainly viscous and at higher ones the elastic character dominates. The crossover point of the G′ and G″ curves, which is observed at 92 rad/s, indicates that at this angular frequency G′ is equal to G″. This response is attributed to the fact that, at low frequencies the entanglements of the HA chains is transient and the chains rearrange during the long period of oscillation [30,31,32]. Finally, Figure 1C shows the viscosity and the shear stress of the material as the shear rate increases. A Newtonian plateau is observed at low and medium shear rates along with a shear thinning behavior at higher shear rates in good agreement with previous studies [32,33,34,35,36,37,38].
In order to compare the viscoelastic properties of the model NaHA solutions via the Time Sweep experiments, we calculated the averages and standard deviations of the rheological parameters in a time period where solvent evaporation has not noticeably begun. The resulting graph as a function of HA concentration: G″ = f(c), is presented in Figure 2.
We observed two distinct regions around a transient HA concentration related to an apparent c*: a region at lower HA concentrations (called here dilute) and a region of higher HA concentrations (called here semidilute). The apparent c* is the critical HA concentration at which polymer chains may start to overlap with each other [33,39,40].
We fitted the experimental data with an equation of the form G   =   a   ·   c b (Table 1).
After solving the system of equations of the dilute and semidilute regimes, c* was found to be at 2.6 mg/mL at 37.5 °C, and at 2.7 mg/mL at 25 °C.
The second experiment via which we compared the viscoelastic properties of model NaHA solutions was the Frequency Sweep experiment. Graphs similar to Figure 2 were obtained, by plotting G′ and G″ as a function of HA concentration at a frequency of 3.142 rad/s, in order to be in agreement with the parameter settings of the time sweep experiments. The data were then fitted with the same type of equation as above. The results of the fits are presented in Table 2. In this case c* was found at 2.2 mg/mL at 37.5 °C and at 2.7 mg/mL at 25 °C.
We also carried out Flow Step experiments in order to measure the shear viscosity as a function of HA concentration in the model NaHA solutions. We noticed yet again that shear viscosity exhibits two discrete regimes as HA concentration increases: a dilute and a semidilute, around the transitional region associated with an apparent c*. The c* is found to be at 2.7 mg/mL and 2.6 mg/mL at 37.5 °C and a 25 °C respectively; these values are in agreement with previous relevant studies of shear viscosity of HA solutions [32,41]. The results of the fits of the curves using shear viscosity at 10 s−1, which follow the power-law formula η   =   a · c b , are presented in Table 3.
Following aspiration, synovial fluid samples from either normal or pathological joints, were also subjected to full rheological analysis [23]. Typical data are depicted in Figure 3.

3.2. HA Concentration in Healthy and Pathological Equine SF Samples

At the next stage we attempted to explore whether or not SF rheology in combination with the quantitative HA rheological understanding of model HA solutions (Table 1, Table 2 and Table 3) and through application of appropriate correction factors, could provide us with HA concentration in unknown SF samples.
The treatment we applied is demonstrated below for rheological data from time sweep measurements (Table 1). The same approach also applies to the other types of rheological data (Table 2 and Table 3). We start by using the equations, as derived from the fitting of the experimental data:
G   =   a · c b
log ( G )   =   log ( a · c b )
log ( c )   =   log ( G )     log ( a ) b
X   =   Y   +   A b
where X   =   log ( c ) ,   Y   =   log ( G ) ,   A   =   log ( a ) and b is the power-law. Hence, it can be deduced that, after the substitution of the known values of G″, a and b, the unknown rheologically-deduced HA concentration CHA, rheological in SF, is given by Equation (5):
c   =   10 X
After the collection of equine SF samples from the two breeds (Thoroughbred and Warmblood) and three joints (carpus, fetlock and coffin), the viscoelastic properties of the fresh SF samples were also determined (Figure 3) [23]. In each case the measured SF rheological values were treated as shown above (Equations (1)–(5)) and in this way, for each SF sample, a rheologically–determined HA concentration, CHA, rheological, was derived. At the same time, a separate aliquot of each SF sample was analysed by ELISA and thus a biochemically-determined HA concentration CHA, biochemical, was also derived [23]. ELISA is a widely accepted method for the determination of HA concentration in biological fluids. We expected that the comparative studies between CHA, rheological and CHA, biochemical values would reveal the actual validity or not of the values of CHA, rheological.
Table 4 is a representative table that shows the derived CHA, rheological values in SF from healthy fetlock joints and comparison with the corresponding CHA, biochemical values of the same SF samples. Full table with the corresponding comparative results of SF from all healthy joints studied (fetlock, carpus and coffin) is presented in Appendix A. For each SF sample, a correction factor (C.F.) was also calculated, which illustrates the contrast between CHA, rheological and CHA, biochemical, so that: C.F. = CHA, rheological/CHA,biochemical.
For comparison we also present rheologically- and biochemically-derived HA concentrations in SF from pathological equine fetlock joints (Table 5); a more comprehensive analysis of pathological SF from fetlock, carpus and coffin joints can be found in Appendix A.

4. Discussion

In this study we aimed at exploring a practical application of SF rheology, ie whether or not we could use our quantitative understanding of the rheological behavior of model HA solutions, in order to derive information about HA concentration in unknown SF samples, via rheological analysis of this biological fluid. As can be seen in Table 4 and Table A1, SF in healthy equine joints was found to have HA concentration of ca 0.3–1.2 mg/mL, as measured by ELISA, an established biochemical method for the determination of HA concentration in biological fluids [23]. This range of HA concentrations is in agreement with previous studies of equine joints [17]. On the other hand, SF from osteoarthritic equine joints was characterized by HA concentration of ca 0.1–0.7 mg/mL, as measured by ELISA (Table 5 and Table A2); this shows a marked decrease of HA concentration in osteoarthritic SF compared to healthy SF, again in agreement with the international literature.
Rheologically-derived calculations of HA concentration in the same SF samples produced values that, in the vast majority of cases, were many times greater than the corresponding ELISA-measured HA concentrations (Table 4, Table 5 and Table 6, Table A1 and Table A2). The discrepancy between rheologically-derived and biochemically-derived HA concentration in each SF sample, was depicted here in each case by the term correction factor C.F. = CHA,rheological/CHA,biochemical. For fetlock joints in particular we find that SF from healthy fetlock joints produced C.F. = 7.5 ± 0.7 for Thoroughbred breed, and C.F. = 5.3 ± 0.7 for Warmblood breed; whilst in SF from osteoarthritic fetlock joints, the C.F. values were C.F. = 7.3 ± 3.1 and C.F. = 6.1 ± 2.8 for Thoroughbred and Warmblood respectively. We notice a large increase in the spread of the correction factor values as we go from the healthy to the osteoarthritic SF. For carpus joints the situation is qualitatively similar to fetlock. SF from healthy carpus joints produced C.F. = 5.8 ± 2.5, for Thoroughbred breed, and C.F. = 3.3 ± 2.3 for Warmblood breed; whilst in SF from osteoarthritic carpus joints, C.F. was equal to 9.1 ± 3.8 for Thoroughbred. We notice a large increase in the value of C.F. as well as in the spread of the correction factor values, as we go from the healthy to the osteoarthritic SF. Coffin joints give results that are qualitatively similar to carpus. SF from healthy coffin joints produced C.F. = 4.5 ± 2.9, for Warmblood, whilst SF from osteoarthritic coffin joints gave C.F. which was equal to 10.9 ± 7.1 for Warmblood. We observe again a very substantial increase in the value of C.F. as well as in the spread of the correction factor values, as we go from the healthy to the osteoarthritic SF.
It is reasonable to expect that rheological determination of HA concentration in SF, will always be overestimating CHA, since in SF, apart from HA, there is also a large amount of proteins, lipids and cells that all contribute in a significant manner to SF rheology [42,43]. In addition, the HA present in SF may have a different average MW and MW distribution compared to the model HA used here to derive the equations used for the rheological determination of CHA. For all these reasons, we introduced a correction factor which would ideally take into account all these discrepancies and would be applied on the rheologically-determined CHA, in order to correct it. Surprisingly we find that the average value of correction factor as well as its spread seem to be joint- and breed-dependent. Thus the value of CF differs from one type of joint to another, for example healthy fetlock joints of Thoroughbred breed have 7.5 ± 0.7, whilst healthy carpus joints of the same breed give 5.8 ± 2.5. Furthermore, the same type of joint gives different results depending on the horse breed, so healthy fetlock joints give CF of 7.5 ± 0.7 for Thoroughbred, and CF of 5.3 ± 0.7 for Warmblood. Finally, the state of joint also has a significant impact on CF values; as an illustration we cite that healthy carpus joints from Thoroughbred give CF of 5.8 ± 2.5, whilst the corresponding osteoarthritic joints produce CF of 9.1 ± 3.8.
These CF variations may illustrate the varying overall composition of SF as a function of joint type, joint state and breed, which result in correspondingly different values of CF. Another important observation is that in most cases, large spread values of CF are observed even within joints of the same type, state and breed. This may reflect the natural biological variability present in the composition of biological fluids of different horses, depending on the exact genetic make-up of the organism, age, physical exercise and living conditions. The lowest value of CF in healthy joint is observed in carpus joints of Warmblood, CF = 3.3 ± 2.3, whilst the highest value of CF in healthy joints, is given by fetlock joints of Thoroughbred breed, CF = 7.5 ± 0.7.
Even more impressive is the transition from healthy to osteoarthritic state for the same type of joint and breed. This transition is seen to always be accompanied by a great increase of CF spread values; this implies that SF composition in pathological joints is even more variable than in healthy ones. Finally, in most cases of transition from healthy to osteoarthritic state for the same type of joint and breed, we observe a marked increase in the average value of CF, signifying a decreased contribution of HA in SF rheology in the case of diseased joints compared to healthy ones. This may be linked to inflammation, which is common in pathological joints; inflammation is characterised by increase of total protein concentration [12,14,41,44].
As for the practical question we set out to answer: whether or not we can extract reliable CHA information from equine SF rheology, the provisional answer seems to be partially yes. This applies in particular to healthy fetlock joints, for which the correction factors seem to be well-defined with narrow spreads for each breed. This tentative conclusion should be further verified with higher n numbers and more detailed ELISA measurements. Overall the findings support the concept that equine SF rheology is complex and HA molecules may not be the major contributor of equine SF rheology. These findings also have wider implications for the development of new more effective preventive strategies as well as more efficient early-stage interventions in osteoarthritis.

Author Contributions

A.A., N.D. and L.P. conceived the main idea of the study, had the overall supervision of the project and finalized the study. N.M., E.R. and P.T. prepared the samples and performed the experiments. N.M., E.R., P.T. N.D. and A.A. analyzed the data. A.A., N.M., E.R., P.T. and N.D. prepared the manuscript.

Funding

This research received no external funding.

Acknowledgments

We gratefully acknowledge the support of Cube Pharmaceuticals.

Conflicts of Interest

The authors declare no conflict of interest.

Appendix A

Table A1. Calculated HA concentration in healthy equine SF samples based on SF rheology and on the biochemical ELISA method.
Sample NoBreedJointSexCHA,rheological (mg/mL) CHA,biochemical9 (mg/mL)C.F.10
1TB 1CarpusFemale3.0 3, 2.9 4, 2.9 5, 2.9 6, 3.2 7, 2.9 80.714.2
2Gelding4.1 41.233.3
3Gelding4.1 3, 4.2 5, 4.2 70.508.3
4Gelding4.3 3, 4.1 4, 4.2 5, 4.1 80.557.6
5FetlockGelding2.4 10.308.0
6Gelding4.6 4, 4.9 5, 4.4 6, 4.8 7, 4.5 80.578.1
7Gelding3.6 3, 3.6 5, 3.8 70.546.8
8WB 2CarpusGelding0.5 3, 0.6 70.551.0
9Gelding4.0 3, 3.9 5, 4.1 70.715.6
10FetlockGelding3.8 3, 3.8 5, 3.9 70.675.7
11Gelding5.3 3, 5.5 50.975.6
12-3.7 3, 4.1 5, 4.0 70.675.9
13Gelding4.0 5, 4.0 70.874.6
14CoffinGelding4.4 3, 4.4 5, 4.5 70.944.7
15-2.7 30.377.3
16-1.4 30.901.6
1 Thoroughbred, 2 Warmblood, 3 Time Sweep at 37.5 °C, 4 Time Sweep at 25 °C, 5 Frequency Sweep at 37.5 °C, 6 Frequency Sweep at 25 °C, 7 Flow Step (at 10 s−1) at 37.5 °C, 8 Flow Step (at 10 s−1) at 25 °C, 9 HA concentration measured with ELISA, 10 Correction Factor = CHA, rheological/CHA,biochemical.
Table A2. Calculated HA concentration in pathological equine SF samples based on SF rheology and on the biochemical ELISA method.
Sample NoBreedJointSexCHA,rheological (mg/mL)CHA,biochemical7 (mg/mL)C.F.8
1TBCarpusGelding3.2 1, 3.2 2, 3.1 3, 3.1 4, 3.0 60.555.3
2Gelding3.8 1, 3.9 3, 3.8 4, 4.0 50.3710.5
3Gelding4.1 1, 4.4 2, 4.4 3, 4.5 4, 4.2 5, 4.0 60.626.9
4Female3.0 1, 2.7 3, 3.2 4, 2.9 60.2312.8
5FetlockGelding3.0 1, 2.7 2, 3.0 3, 3.2 4, 1.3 5, 1.9 60.2412.4
6Gelding3.0 1, 3.4 2, 2.9 3, 3.0 4, 1.4 5, 1.2 60.3010.3
7Gelding2.2 1, 2.4 3, 2.5 50.327.4
8Gelding3.9 1, 4.1 2, 3.8 3, 3.8 4, 3.8 5, 3.7 60.507.7
9Gelding1.2 2, 0.9 4, 1.2 60.264.2
10WBFetlockFemale3.7 1, 3.5 2, 3.5 3, 3.7 50.418.8
11Female3.7 1, 3.5 2, 3.7 3, 3.7 4, 3.9 5, 3.6 60.616.0
12Female4.7 3, 4.8 5, 4.7 70.736.5
13Gelding0.8 1, 1.0 3, 0.9 50.273.3
14CoffinGelding2.6 10.377.0
15Gelding0.6 1, 0.7 3, 0.7 50.116.1
16Gelding0.8 1, 1.0 50.243.8
17Female1.8 10.1018.0
18Female1.6 10.325.0
19Gelding0.9 10.204.5
1 Time Sweep at 37.5 °C, 2 Time Sweep at 25 °C, 3 Frequency Sweep at 37.5 °C, 4 Frequency Sweep at 25 °C, 5 Flow Step (10 s−1) at 37.5 °C, 6 Flow Step (10 s−1) at 25 °C, 7 ELISAmethod, 8 Correction Factor = CHA, rheological/CHA,biochemical.

Appendix B

We used Cannon Certified Viscosity Reference Standard oil S60 (Cannon Instrument Company, State College, PA, USA), in order to verify the good operation of the rheometer. The measurement was carried out in the same way as the measurements of all the samples presented in this study. The alteration of oil viscosity versus shear rate at 25 °C is presented in Figure A1. The expected oil viscosity at 25 °C is 0.1055 Pa.s. The average of the measured viscosity values was found to be 0.1020 Pa.s (standard deviation is equal to 0.0014). Therefore, the difference between the theoretical and the experimental value is 3.3%.
Figure A1. Viscosity versus shear rate of Cannon certified viscosity reference standard oil S60; open circles: measured viscosity; black line: expected viscosity (Cannon Instrument Company, State College, PA, USA) both at 25 °C.
Fluids 04 00193 g0a1

References

  1. McIlwraith, C.W.; Frisbie, D.D.; Kawcak, C.E. The horse as a model of naturally occurring osteoarthritis. Bone Jt. Res. 2012, 1, 297–309. [Google Scholar] [CrossRef]
  2. Mathieu, P.; Conrozier, T.; Vignon, E.; Rozand, Y.; Rinaudo, M. Rheologic behavior of osteoarthritic synovial fluid after addition of hyaluronic acid: A pilot study. Clin. Orthop. Relat. Res. 2009, 467, 3002–3009. [Google Scholar] [CrossRef]
  3. Altman, R.D.; Abramson, S.; Bruyere, O.; Clegg, D.; Herrero-Beaumont, G.; Maheu, E.; Moskowitz, R.; Pavelka, K.; Reginster, J.Y. Commentary: Osteoarthritis of the knee and glucosamine. Osteoarthr. Cartil. 2006, 14, 963–966. [Google Scholar] [CrossRef]
  4. Bagga, H.; Burkhardt, D.; Sambrook, P.; March, L. Longterm effects of intraarticular hyaluronan on synovial fluid in osteoarthritis of the knee. J. Rheumatol. 2006, 33, 946–950. [Google Scholar]
  5. Lee, A.S.; Ellman, M.B.; Yan, D.; Kroin, J.S.; Cole, B.J.; van Wijnen, A.J.; Im, H.J. A current review of molecular mechanisms regarding osteoarthritis and pain. Gene 2013, 527, 440–447. [Google Scholar] [CrossRef] [Green Version]
  6. Bonnevie, E.D.; Galesso, D.; Secchieri, C.; Cohen, I.; Bonassar, L.J. Elastoviscous transitions of articular cartilage reveal a mechanism of synergy between lubricin and hyaluronic acid. PLoS ONE 2015, 10, e0143415. [Google Scholar] [CrossRef]
  7. Schmidt, T.A.; Gastelum, N.S.; Nguyen, Q.T.; Schumacher, B.L.; Sah, R.L. Boundary lubrication of articular cartilage: Role of synovial fluid constituents. Arthritis Rheum. 2007, 56, 882–891. [Google Scholar] [CrossRef]
  8. Majd, S.E.; Kuijer, R.; Kowitsch, A.; Groth, T.; Schmidt, T.A.; Sharma, P.K. Both hyaluronan and collagen type ii keep proteoglycan 4 (lubricin) at the cartilage surface in a condition that provides low friction during boundary lubrication. Langmuir ACS J. Surf. Colloids 2014, 30, 14566–14572. [Google Scholar] [CrossRef]
  9. Khabarov, V.N.; Boykov, P.Y.; Selyanin, M.A. Hyaluronic Acid: Preparation, Properties, Application in Biology and Medicine; John Wiley & Sons, Ltd.: Chichester, West Sussex, UK, 2015. [Google Scholar]
  10. Matteini, P.; Dei, L.; Carretti, E.; Volpi, N.; Goti, A.; Pini, R. Structural behavior of highly concentrated hyaluronan. Biomacromolecules 2009, 10, 1516–1522. [Google Scholar] [CrossRef]
  11. Kung, M.; Markantonis, J.; Nelson, S.; Campbell, P. The synovial lining and synovial fluid properties after joint arthroplasty. Lubricants 2015, 3, 394–412. [Google Scholar] [CrossRef]
  12. Hui, A.Y.; McCarty, W.J.; Masuda, K.; Firestein, G.S.; Sah, R.L. A systems biology approach to synovial joint lubrication in health, injury, and disease. Wiley Interdiscip. Rev. Syst. Biol. Med. 2012, 4, 15–37. [Google Scholar] [CrossRef] [PubMed]
  13. Blewis, M.E.; Nugent-Derfus, G.E.; Schmidt, T.A.; Schumacher, B.L.; Sah, R.L. A model of synovial fluid lubricant composition in normal and injured joints. Eur. Cells Mater. 2007, 13, 26–39. [Google Scholar] [CrossRef]
  14. Steel, C.M. Equine synovial fluid analysis. Vet. Clin. N. Am. Equine Pract. 2008, 24, 437–454. [Google Scholar] [CrossRef] [PubMed]
  15. Borzacchiello, A.; Mayol, L.; Schiavinato, A.; Ambrosio, L. Effect of hyaluronic acid amide derivative on equine synovial fluid viscoelasticity. J. Biomed. Mater. Res. Part A 2010, 92, 1162–1170. [Google Scholar] [CrossRef]
  16. Li, Z.; Yao, S.; Alini, M.; Grad, S. Different response of articular chondrocyte subpopulations to surface motion. Osteoarthr. Cartil. 2007, 15, 1034–1041. [Google Scholar] [CrossRef] [Green Version]
  17. Williams, V.S. Intraarticular hyaluronic acid supplementation in the horse: The role of molecular weight. J. Equine Vet. Sci. 2007, 27, 298–303. [Google Scholar] [CrossRef]
  18. Balazs, E.A.; Denlinger, J.L. Viscosupplementation: A new concept in the treatment of osteoarthritis. J. Rheumatol. Suppl. 1993, 39, 3–9. [Google Scholar]
  19. Balazs, E.A. Analgesic effect of elastoviscous hyaluronan solutions and the treatment of arthritic pain. Cells Tissues Organs 2003, 174, 49–62. [Google Scholar] [CrossRef]
  20. Guidolin, D.; Franceschi, F. Viscosupplementation with high molecular weight native hyaluronan. Focus on a 1500–2000 kda fraction (hyalubrix(r)). Eur. Rev. Med. Pharmacol. Sci. 2014, 18, 3326–3338. [Google Scholar]
  21. Schiraldi, C.; Stellavato, A.; de Novellis, F.; La Gatta, A.; De Rosa, M. Hyaluronan viscosupplementation: State of the art and insight into the novel cooperative hybrid complexes based on high and low molecular weight HA of potential interest in osteoarthritis treatment. Clin. Cases Miner. Bone Metab. 2016, 13, 36–37. [Google Scholar] [CrossRef]
  22. Moyer, W.; Schumacher, J.; Schumacher, J. A Guide to Equine Joint Injection and Regional Anesthesia; Veterinary Learning Systems: Yardley, PA, USA, 2007. [Google Scholar]
  23. Tyrnenopoulou, P.C.; Rizos, E.; Kritsepi-Konstantinou, M.; Papadopoulou, P.L.; Patsikas, M.N.; Papazoglou, L.G.; Aggeli, A.; Diakakis, N.E. Quantitative characterization of viscoelastic properties of normal equine synovial fluid from Thoroughbred and Warmblood horses. Am. J. Vet. Res. 2018, 80, 342–346. [Google Scholar] [CrossRef] [PubMed]
  24. Verwilghen, D.; Busoni, V.; Gangl, M.; Franck, T.; Lejeune, J.P.; Vanderheyden, L.; Detilleux, J.; Grulke, S.; Deberg, M.; Henrotin, Y.; et al. Relationship between biochemical markers and radiographic scores in the evaluation of the osteoarticular status of warmblood stallions. Res. Vet. Sci. 2009, 87, 319–328. [Google Scholar] [CrossRef] [PubMed]
  25. Itenov, T.S.; Kirkby, N.S.; Bestle, M.H.; Nilsson, A.C.; Erlandsen, E.J.; Peters, L.; Jensen, J.U. Hyaluronic Acid Assays: Turbidimetric or Enzyme-Based Immune Assay? A Method Comparison Study. J. Clin. Lab. Anal. 2016, 30, 524–528. [Google Scholar] [CrossRef] [PubMed]
  26. Mittal, V.; Chhabra, A.; Kumar, A.; Soni, S.; Singh, S.; Aggarwal, Y. Correlation of serum hyaluronic acid with clinical and radiological severity in primary knee osteoarthritis. Int. J. Orthop. Sci. 2018, 4, 420–425. [Google Scholar] [CrossRef]
  27. Papakonstantinou, E.; Bonovolias, I.; Roth, M.; Tamm, M.; Schumann, D.; Baty, F.; Louis, R.; Milenkovic, B.; Boersma, W.; Stieltjes, B.; et al. Serum levels of hyaluronic acid are associated with COPD severity and predict survival. Eur. Respir. J. 2019, 53, 1801183. [Google Scholar] [CrossRef] [PubMed]
  28. Jolly, A.; Mascaró, M.; Ingratta, G.G.; Pibuel, M.; Hajos, S.E.; Mundo, S.L. Evaluation of Hyaluronic Acid in Cattle: Physiological Variations Related to Age, Periparturition and in Clinical Cases of Paratuberculosis. J. Vet. Sci. Technol. 2016, 7, 342–346. [Google Scholar] [CrossRef]
  29. Peng, C.; Wallwiener, M.; Rudolph, A.; Ćuk, K.; Eilber, U.; Celik, M.; Modugno, C.; Trumpp, A.; Heil, J.; Marm, F.; et al. Plasma hyaluronic acid level as a prognostic and monitoring marker of metastatic breast cancer. Int. J. Cancer 2016, 138, 2499–2509. [Google Scholar] [CrossRef]
  30. Milas, M.; Rinaudo, M. Characterization and properties of hyaluronic acid (hyaluronan). In Polysaccharides; CRC Press: Boca Raton, FL, USA, 2004. [Google Scholar]
  31. Milas, M.; Rinaudo, M.; Roure, I.; Al-Assaf, S.; Phillips, G.O.; Williams, P.A. Comparative rheological behavior of hyaluronan from bacterial and animal sources with cross-linked hyaluronan (hylan) in aqueous solution. Biopolymers 2001, 59, 191–204. [Google Scholar] [CrossRef]
  32. Yu, F.; Zhang, F.; Luan, T.; Zhang, Z.; Zhang, H. Rheological studies of hyaluronan solutions based on the scaling law and constitutive models. Polymer 2014, 55, 295–301. [Google Scholar] [CrossRef]
  33. Krause, W.E.; Bellomo, E.G.; Colby, R.H. Rheology of sodium hyaluronate under physiological conditions. Biomacromolecules 2001, 2, 65–69. [Google Scholar] [CrossRef]
  34. Braithwaite, G.J.; Daley, M.J.; Toledo-Velasquez, D. Rheological and molecular weight comparisons of approved hyaluronic acid products—Preliminary standards for establishing class iii medical device equivalence. J. Biomater. Sci. Polym. Ed. 2016, 27, 235–246. [Google Scholar] [CrossRef] [PubMed]
  35. Milas, M.; Rinaudo, M.; Roure, I.; Al-Assaf, S.; Phillips, G.; Phillips, G.; Williams, P.A. Rheological behaviour of hyaluronan, healon and hylan in aqueous solutions. In Hyaluronan; Elsevier: Amsterdam, The Netherlands, 2002; pp. 181–193. [Google Scholar]
  36. Meyer, F.; Lohmann, D.; Kulicke, W.M. Determination of the viscoelastic behavior of sodium hyaluronate in phosphate buffered saline with rheo-mechanical and rheo-optical methods. J. Rheol. 2009, 53, 799–818. [Google Scholar] [CrossRef]
  37. Fouissac, E.; Milas, M.; Rinaudo, M. Shear-rate, concentration, molecular weight, and temperature viscosity dependences of hyaluronate, a wormlike polyelectrolyte. Macromolecules 1993, 26, 6945–6951. [Google Scholar] [CrossRef]
  38. Kulicke, W.M.; Meyer, F.; Bingöl, A.Ö.; Lohmann, D. Visco-elastic properties of sodium hyaluronate solutions. AIP Conf. Proc. 2008, 1027, 585–587. [Google Scholar]
  39. Teraoka, I. Polymer Solutions: An Introduction to Physical Properties; Wiley: New York, NY, USA, 2002. [Google Scholar]
  40. Pires, A.M.B.; Santana, M.H.A. Rheological aspects of microbial hyaluronic acid. J. Appl. Polym. Sci. 2011, 122, 126–133. [Google Scholar] [CrossRef]
  41. Fam, H.; Bryant, J.T.; Kontopoulou, M. Rheological properties of synovial fluids. Biorheology 2007, 44, 59–74. [Google Scholar]
  42. Vincent, H.K.; Percival, S.S.; Conrad, B.P.; Seay, A.N.; Montero, C.; Vincent, K.R. Hyaluronic acid (HA) viscosupplementation on synovial fluid inflammation in knee osteoarthritis: A pilot study. Open Orthop. J. 2013, 7, 378–384. [Google Scholar] [CrossRef]
  43. Laurent, T.C.; Fraser, J.R.E.; Laurent, U.B.; Engström-Laurent, A. Hyaluronan in inflammatory joint disease. Acta Orthop. Scand. 1995, 266, 116–120. [Google Scholar] [CrossRef]
  44. Tirtaatmadja, V.; Boger, D.V.; Fraser, J.R.E. The dynamic and steady shear properties of synovial fluid and of the components making up synovial fluid. Rheol. Acta 1984, 23, 311–321. [Google Scholar] [CrossRef]
Figure 1. Time Sweep (A), Frequency Sweep (B), and Flow Step (C) for a model hyaluronic acid (HA) solution with a HA concentration of 5 mg/mL, at 37.5 °C.
Fluids 04 00193 g001
Figure 2. Viscous modulus G″ versus HA concentration in model HA solutions at 37.5 °C (red curve) and at 25 °C (blue curve) as derived from Time Sweep experiments.
Fluids 04 00193 g002
Figure 3. Representative rheological analysis of equine synovial fluid from an osteoarthritic fetlock joint: time sweep (A), frequency sweep (B), and flow step (C) all at 37.5 °C; all graphs were obtained from samples from the same joint.
Fluids 04 00193 g003
Table 1. Coefficient values of equation G   =   a   ·   c b related to Time Sweep experiments.
RegimeT/°CR2AΔabΔbG″* (Pa)
Dilute37.50.971768.88 × 10−30.98 × 10−31.160.182.65 × 10−2
Semidilute0.997161.37 × 10−30.20 × 10−33.150.09
Dilute250.951821.21 × 10−21.75 × 10−31.240.244.05 × 10−2
Semidilute0.991721.73 × 10−30.51 × 10−33.220.18
Table 2. Values of coefficients a and b of equation G   =   a · c b related to the fitting of the Frequency Sweep data.
RegimeT/°CR2AΔabΔbG″* (Pa)
Dilute37.5-7.59 × 10⁻³-1.35-2.25 × 10⁻²
Semidilute0.996752.52 × 10−30.51 × 10−32.710.12
Dilute25-1.28 × 10⁻²-1.13-3.80 × 10⁻²
Semidilute0.996081.87 × 10−30.51 × 10−33.130.16
Table 3. Values of coefficients a and b of equation η = a · c b related to the fitting of flow step data.
RegimeT/°CR2AΔabΔbη* (Pa·s)
Dilute37.50.993242.37 × 10−30.14 × 10−31.180.097.80 × 10−3
Semidilute0.998100.26 × 10−30.56 × 10−43.400.13
Dilute250.991823.66 × 10−30.26 × 10−31.280.111.28 × 10−2
Semidilute0.997310.66 × 10−30.15 × 10−33.070.13
Table 4. HA concentration in SF from healthy equine fetlock joints, as calculated either based on SF rheological data or by employing the biochemical ELISA method.
BreedCHA,rheological (mg/mL) CHA,biochemical (mg/mL) 3C.F.4
TB 12.40.308.0
4.60.578.1
3.70.546.8
WB 23.80.675.7
5.40.975.6
3.90.675.9
4.00.874.6
1 Thoroughbred, 2 Warmblood, 3 ELISA Method, 4 C.F. = CHA, rheological/CHA, biochemical.
Table 5. HA concentration in SF from pathological equine fetlock joints, as calculated either based on SF rheology or by employing the biochemical ELISA method.
BreedCHA,rheological (mg/mL)CHA,biochemical (mg/mL)C.F.
TB2.50.2410.4
2.50.308.3
2.40.327.5
3.90.507.8
1.10.264.2
WB3.60.418.8
3.70.616.1
4.70.736.4
0.90.273.3
Table 6. Summary of all correction factors as a function of joint state, joint type and horse breed; C.F. = CHA, rheological/CHA, biochemical.
Healthy JointsOsteoarthritic Joints
FetlockThoroughbred
C.F. = 7.5 ± 0.7, n = 3
FetlockThoroughbred
C.F.= 7.3 ± 3.1, n = 5
Warmblood
C.F. = 5.3 ± 0.7, n = 4
Warmblood
C.F. = 6.1 ± 2.8, n = 4
CarpusThoroughbred
C.F.= 5.8 ± 2.5, n = 4
CarpusThoroughbred
C.F. = 9.1 ± 3.8, n = 4
Warmblood
C.F. = 3.3 ± 2.3, n = 2
Warmblood
-
CoffinWarmblood
C.F. = 4.5 ± 2.9, n = 3
CoffinWarmblood
C.F. = 10.9 ± 7.1, n = 6

