Aerodynamics of a Wing with a Wingtip Flapper †

Abstract
:1. Introduction
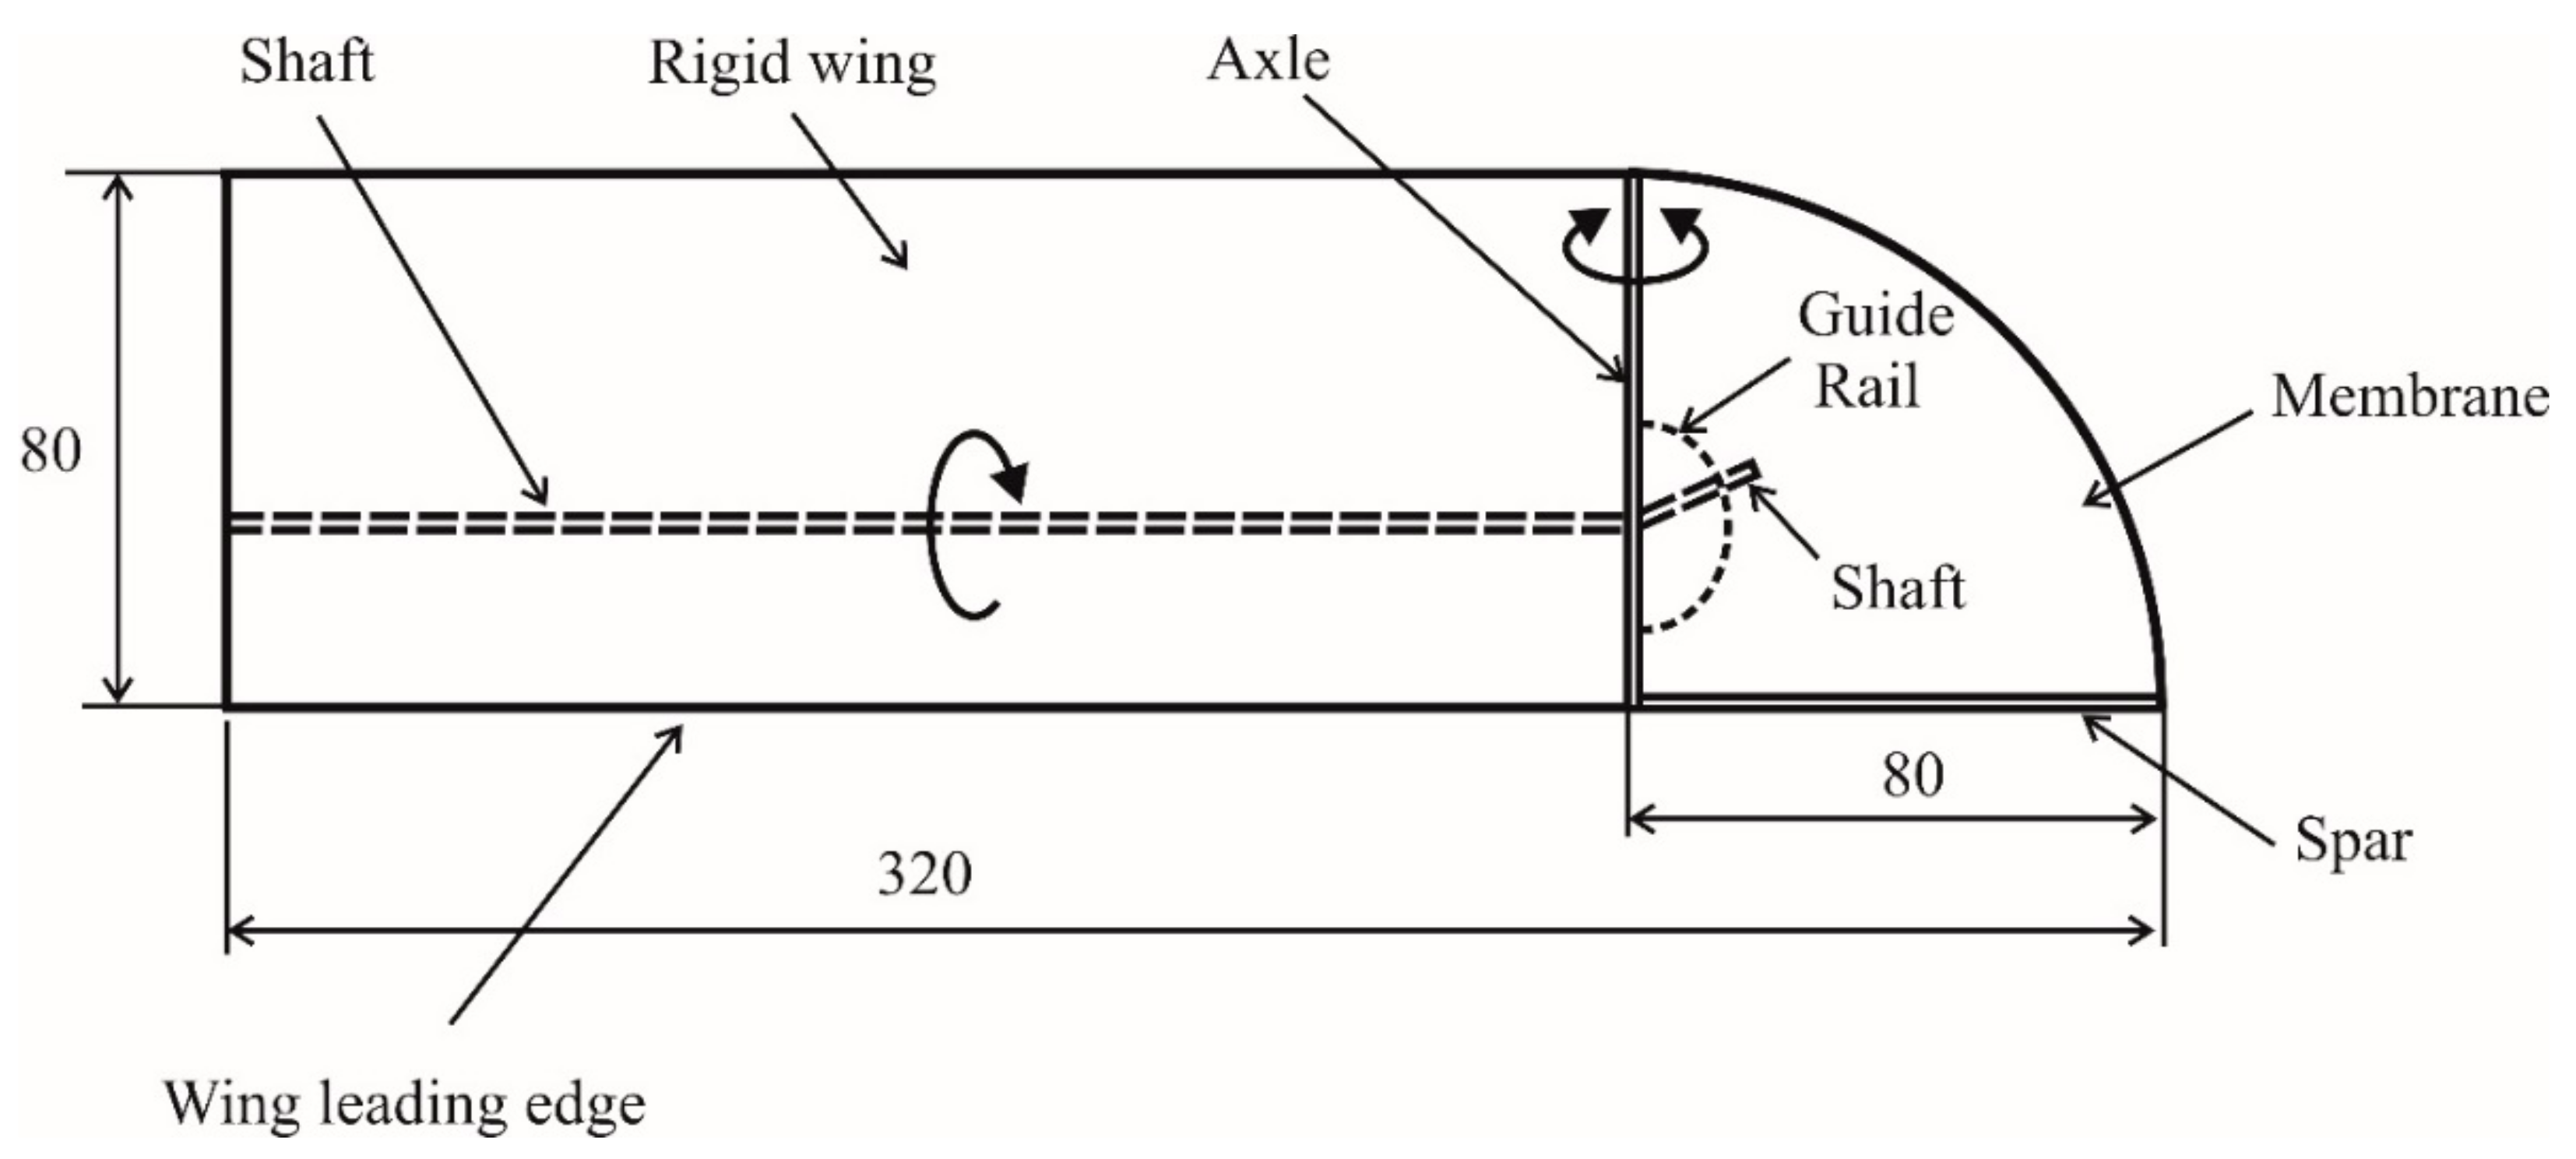
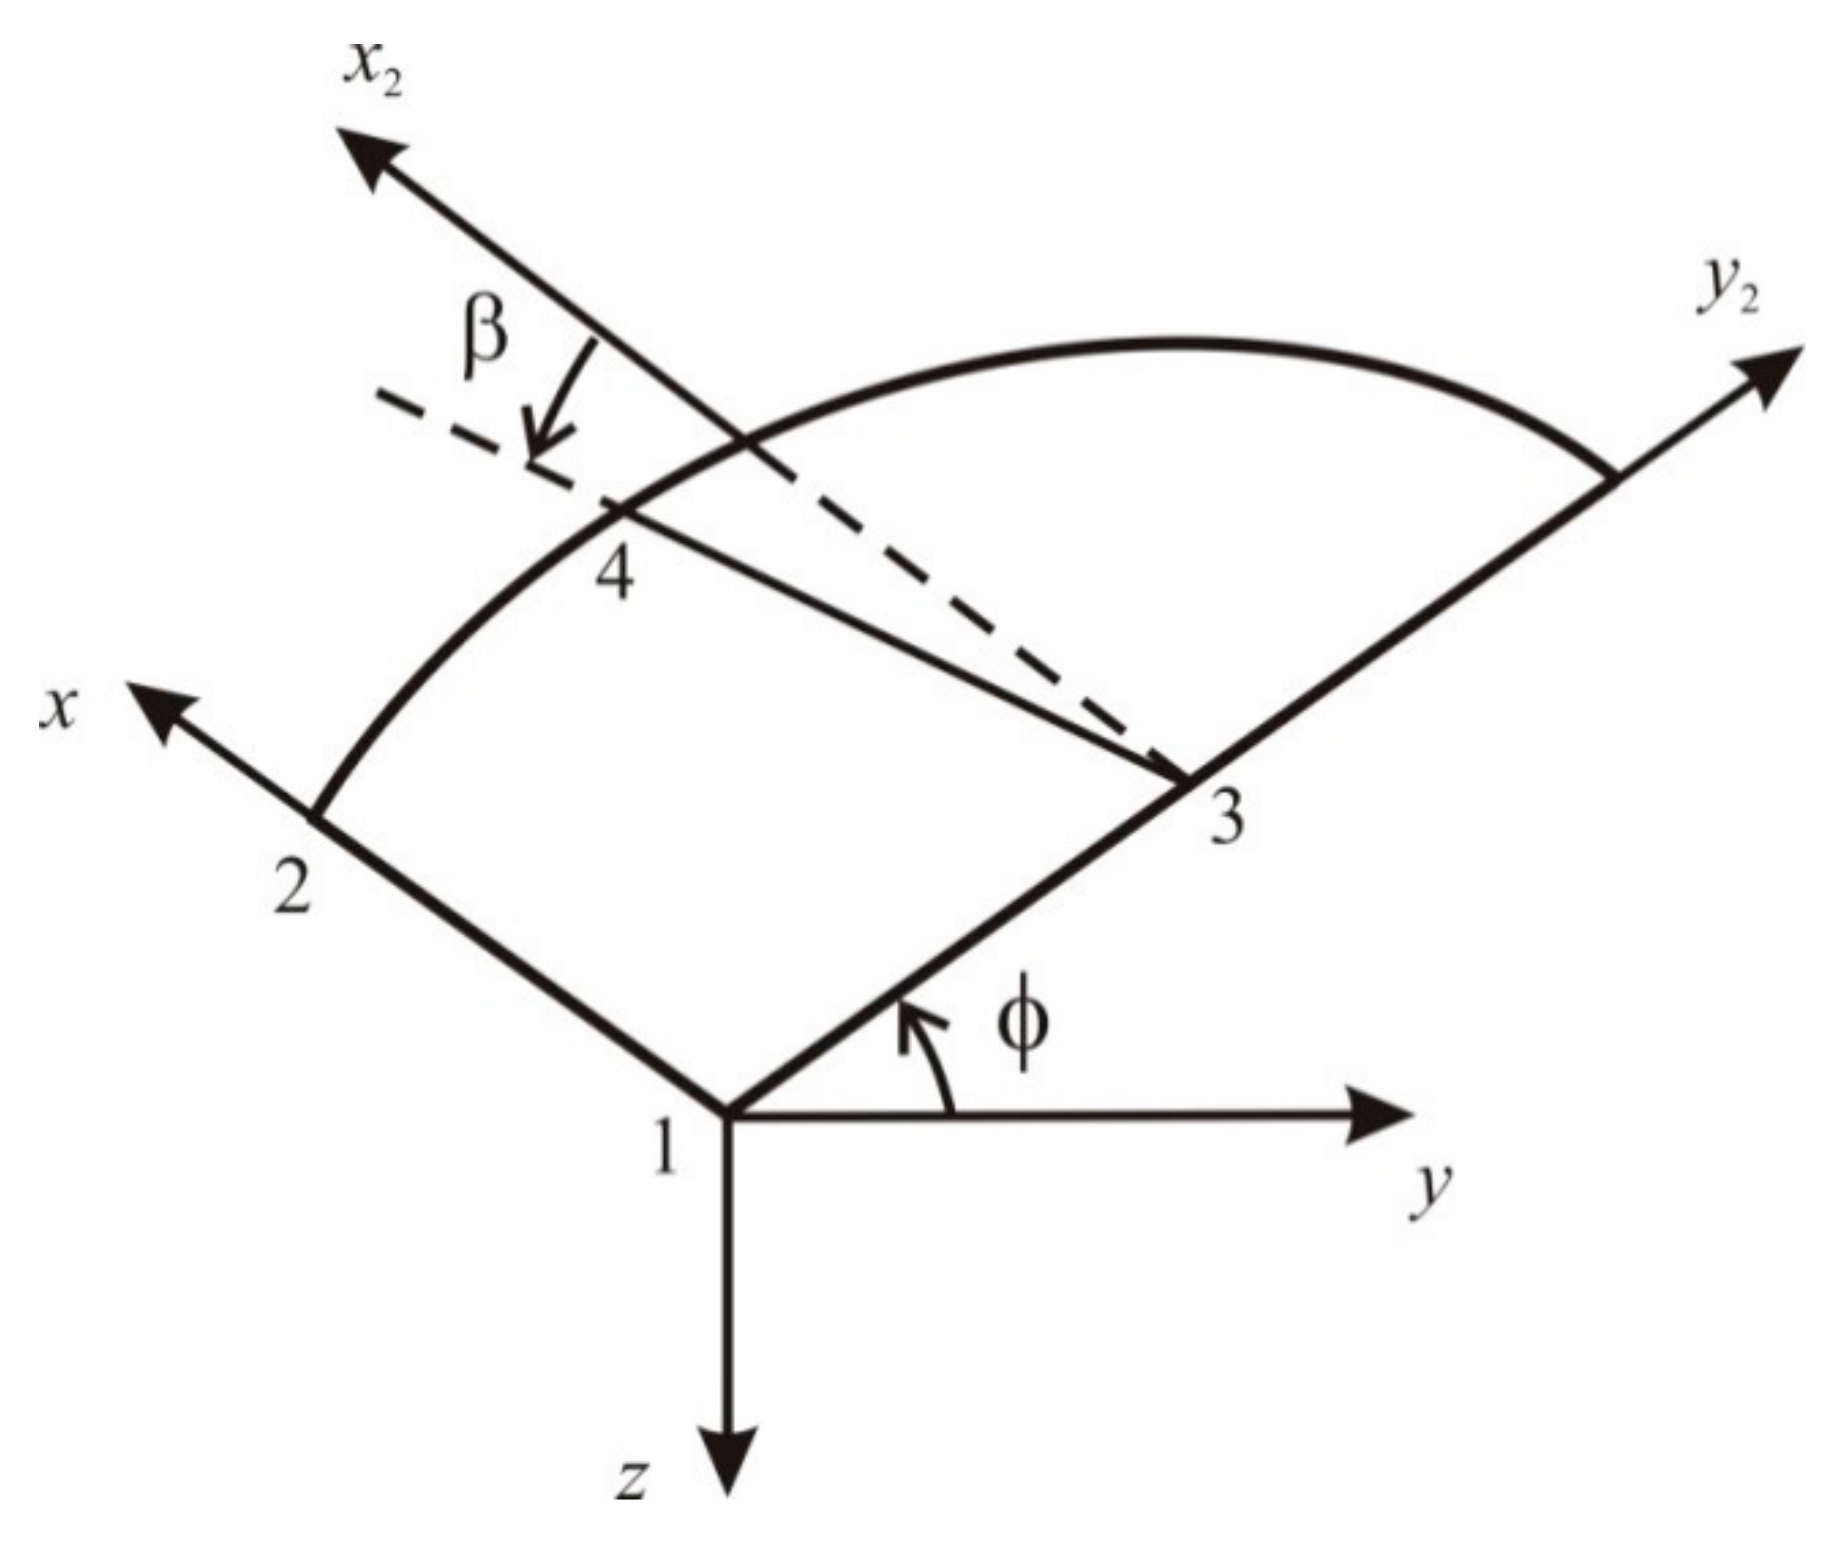
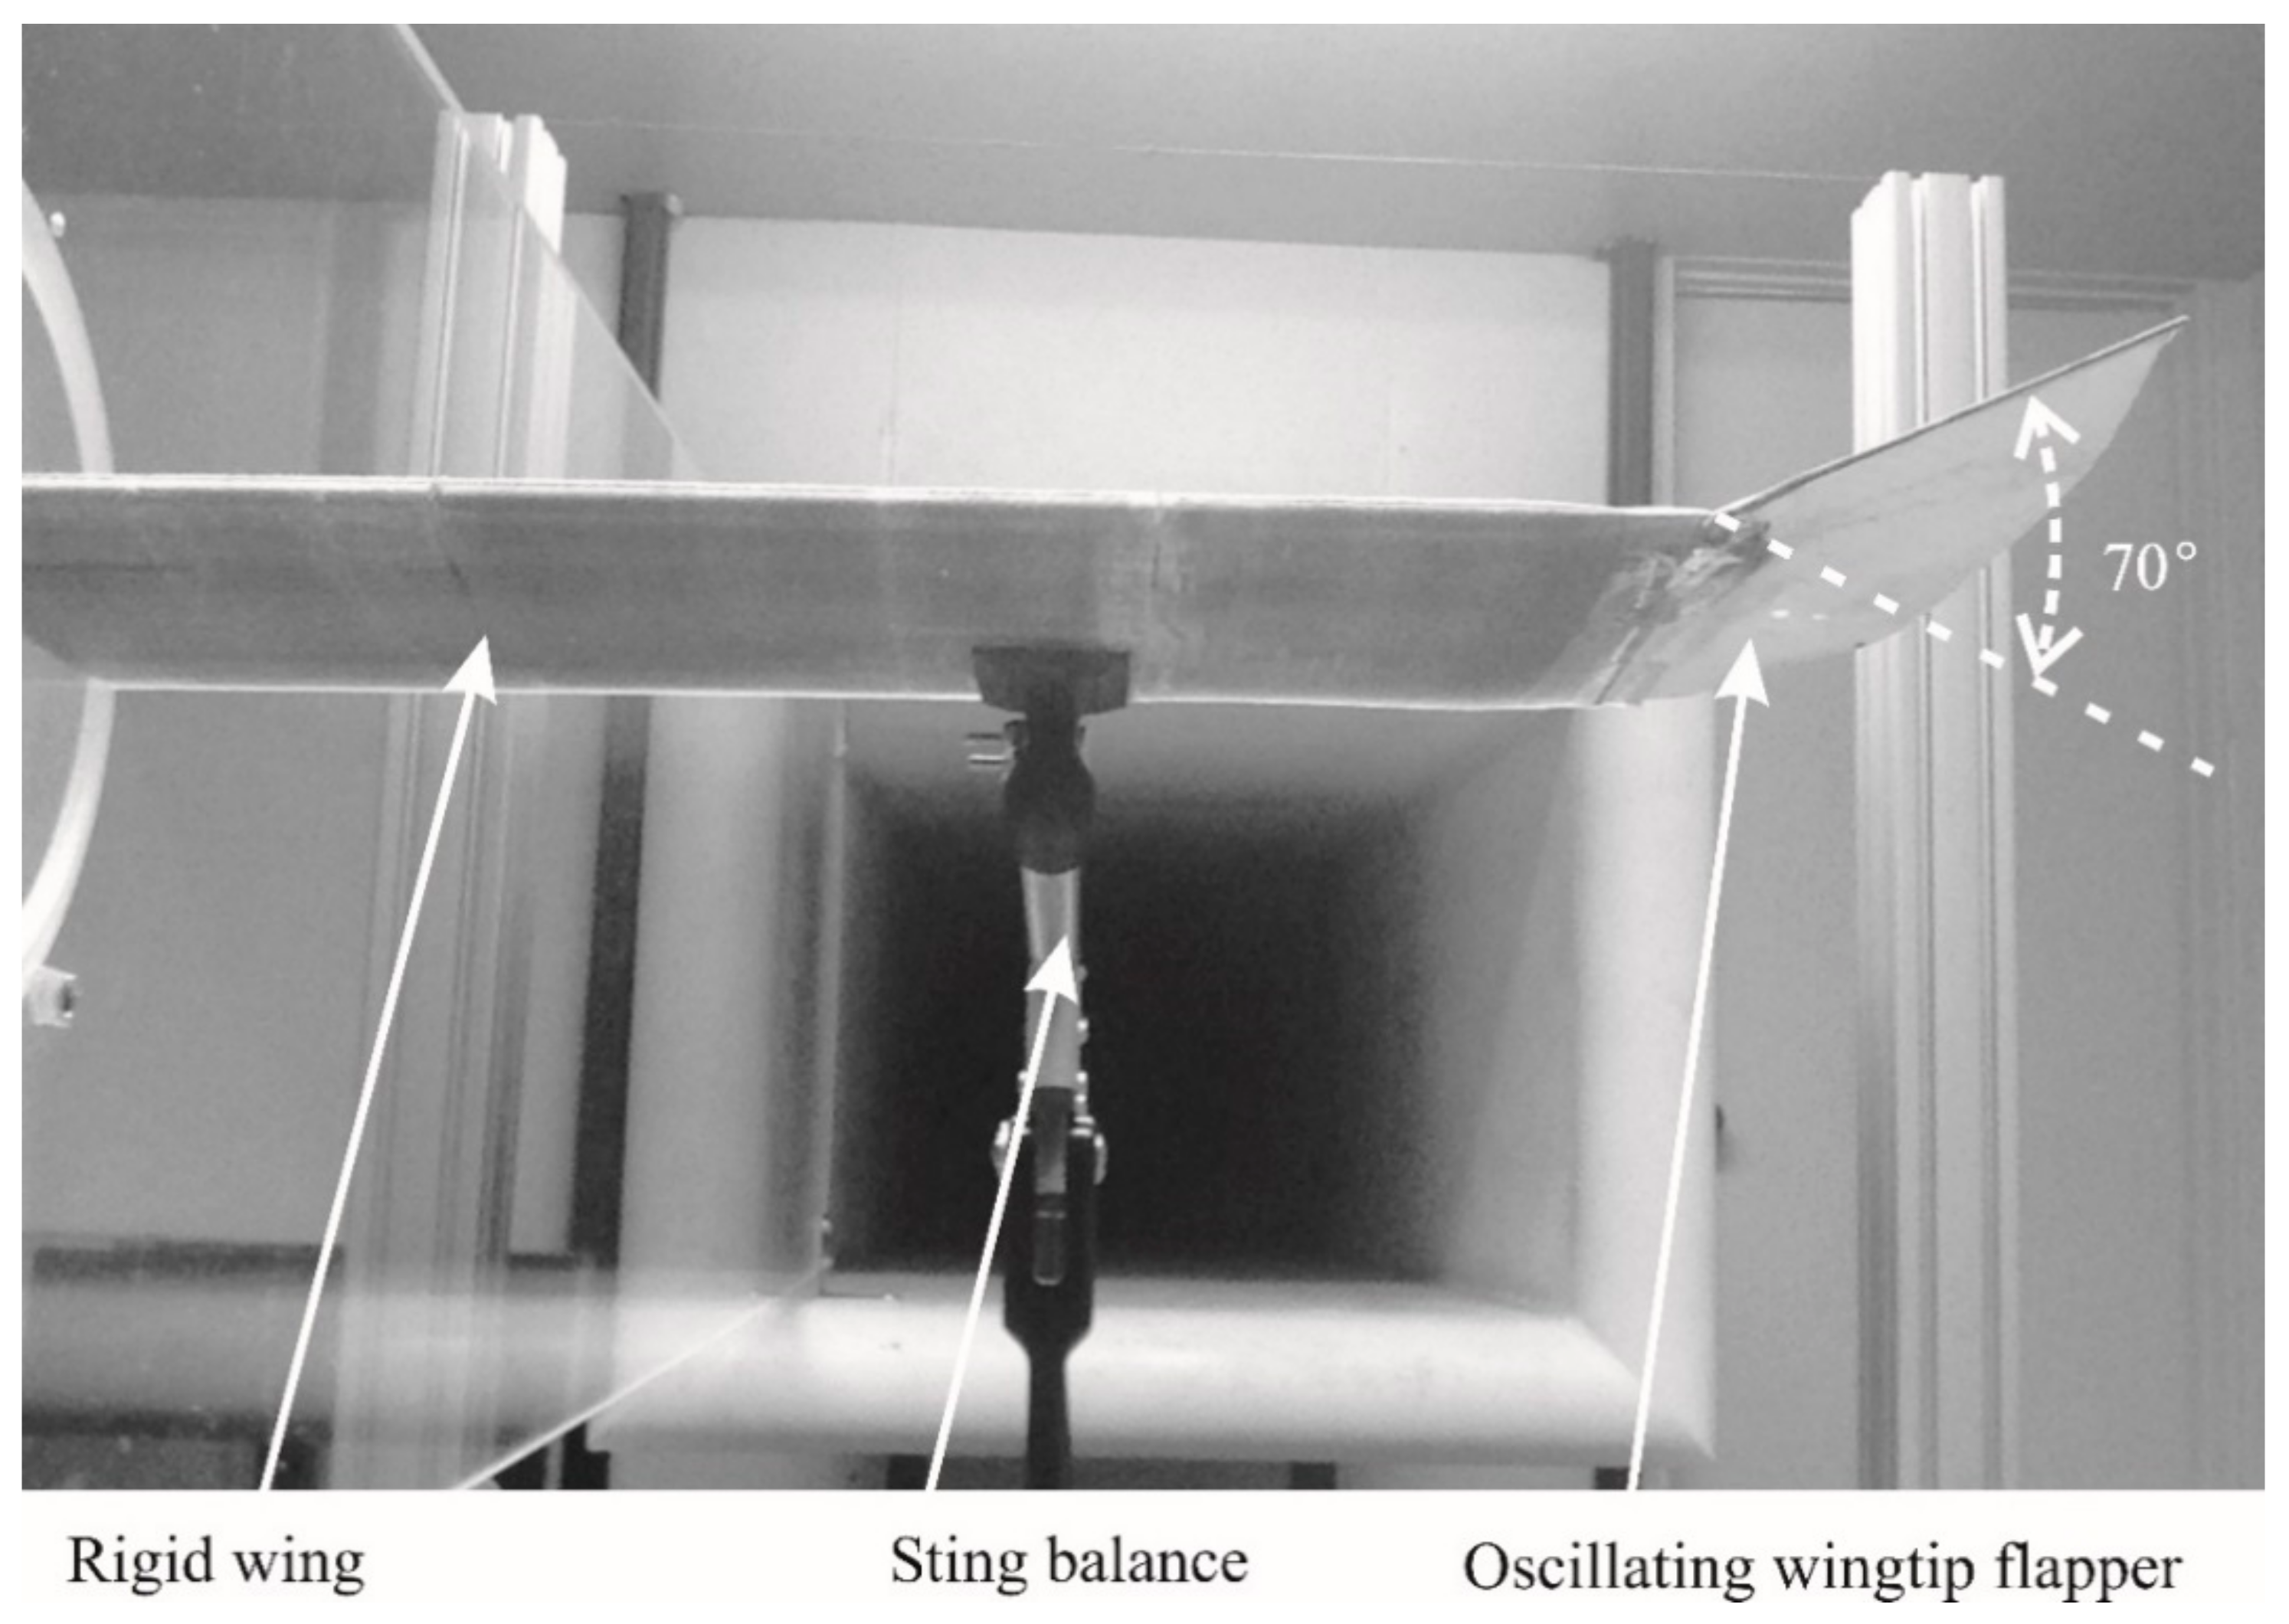
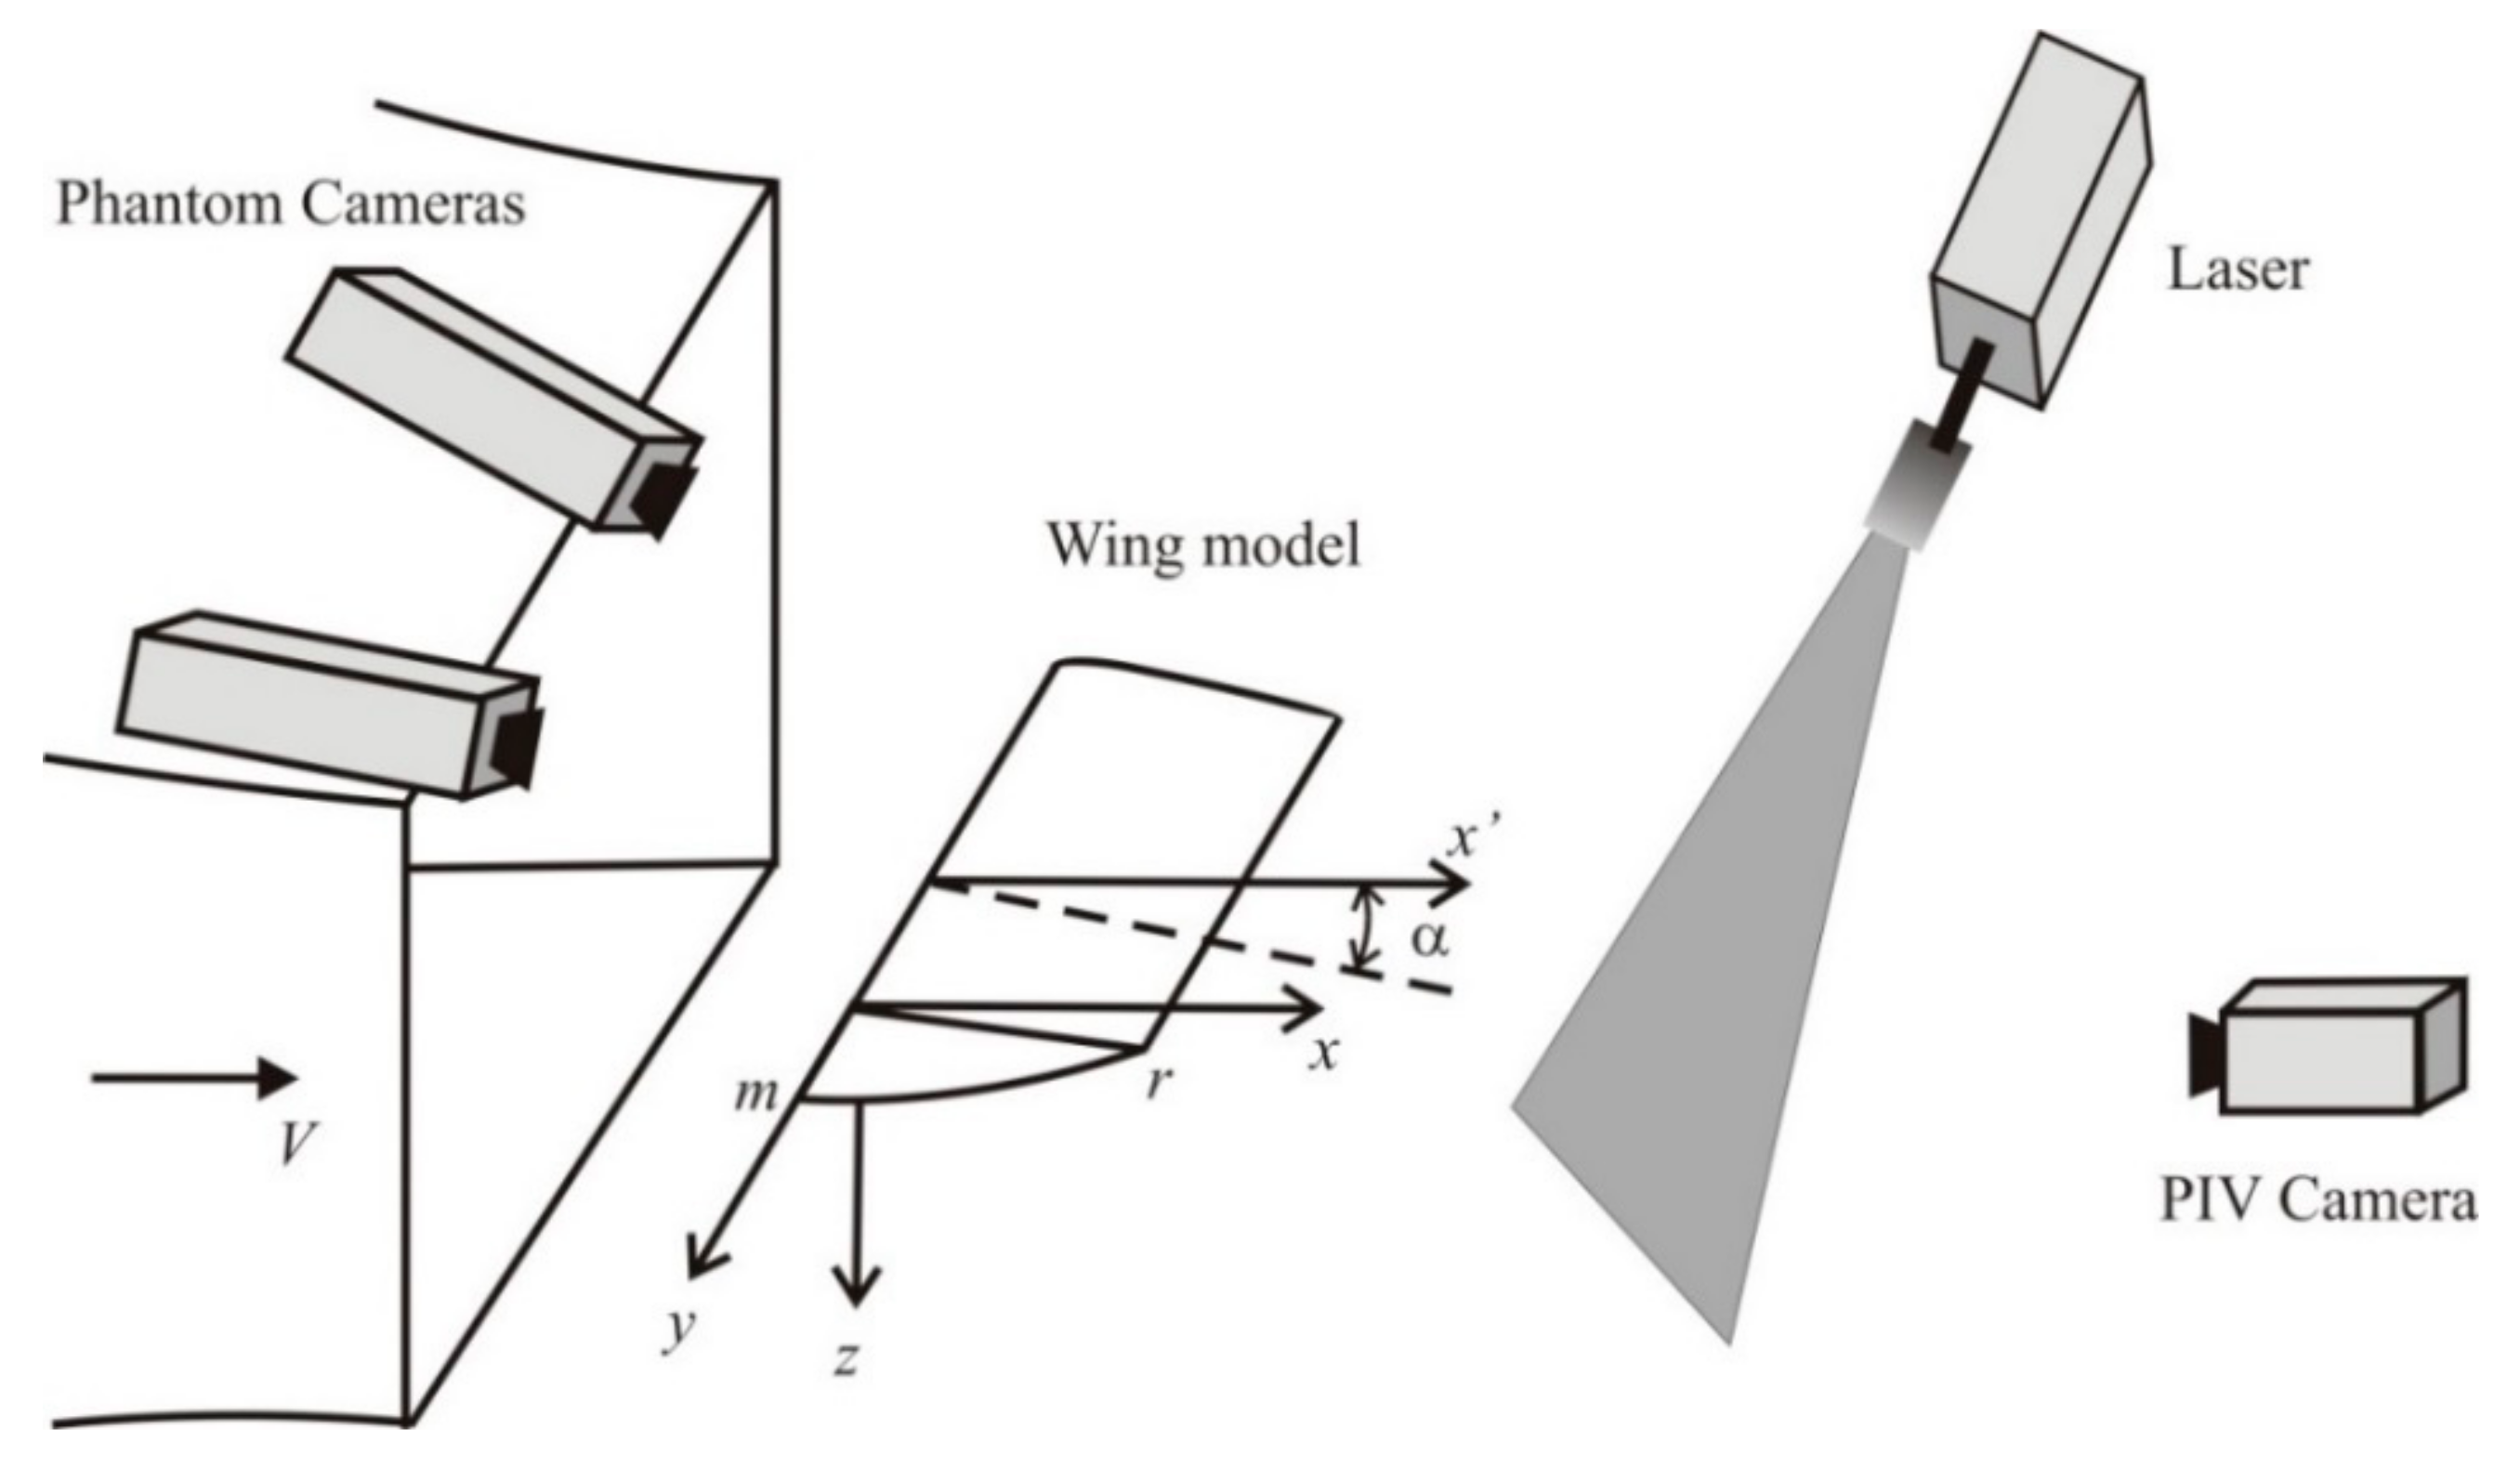
2. Experimental Model and Methods
3. Results and Discussions
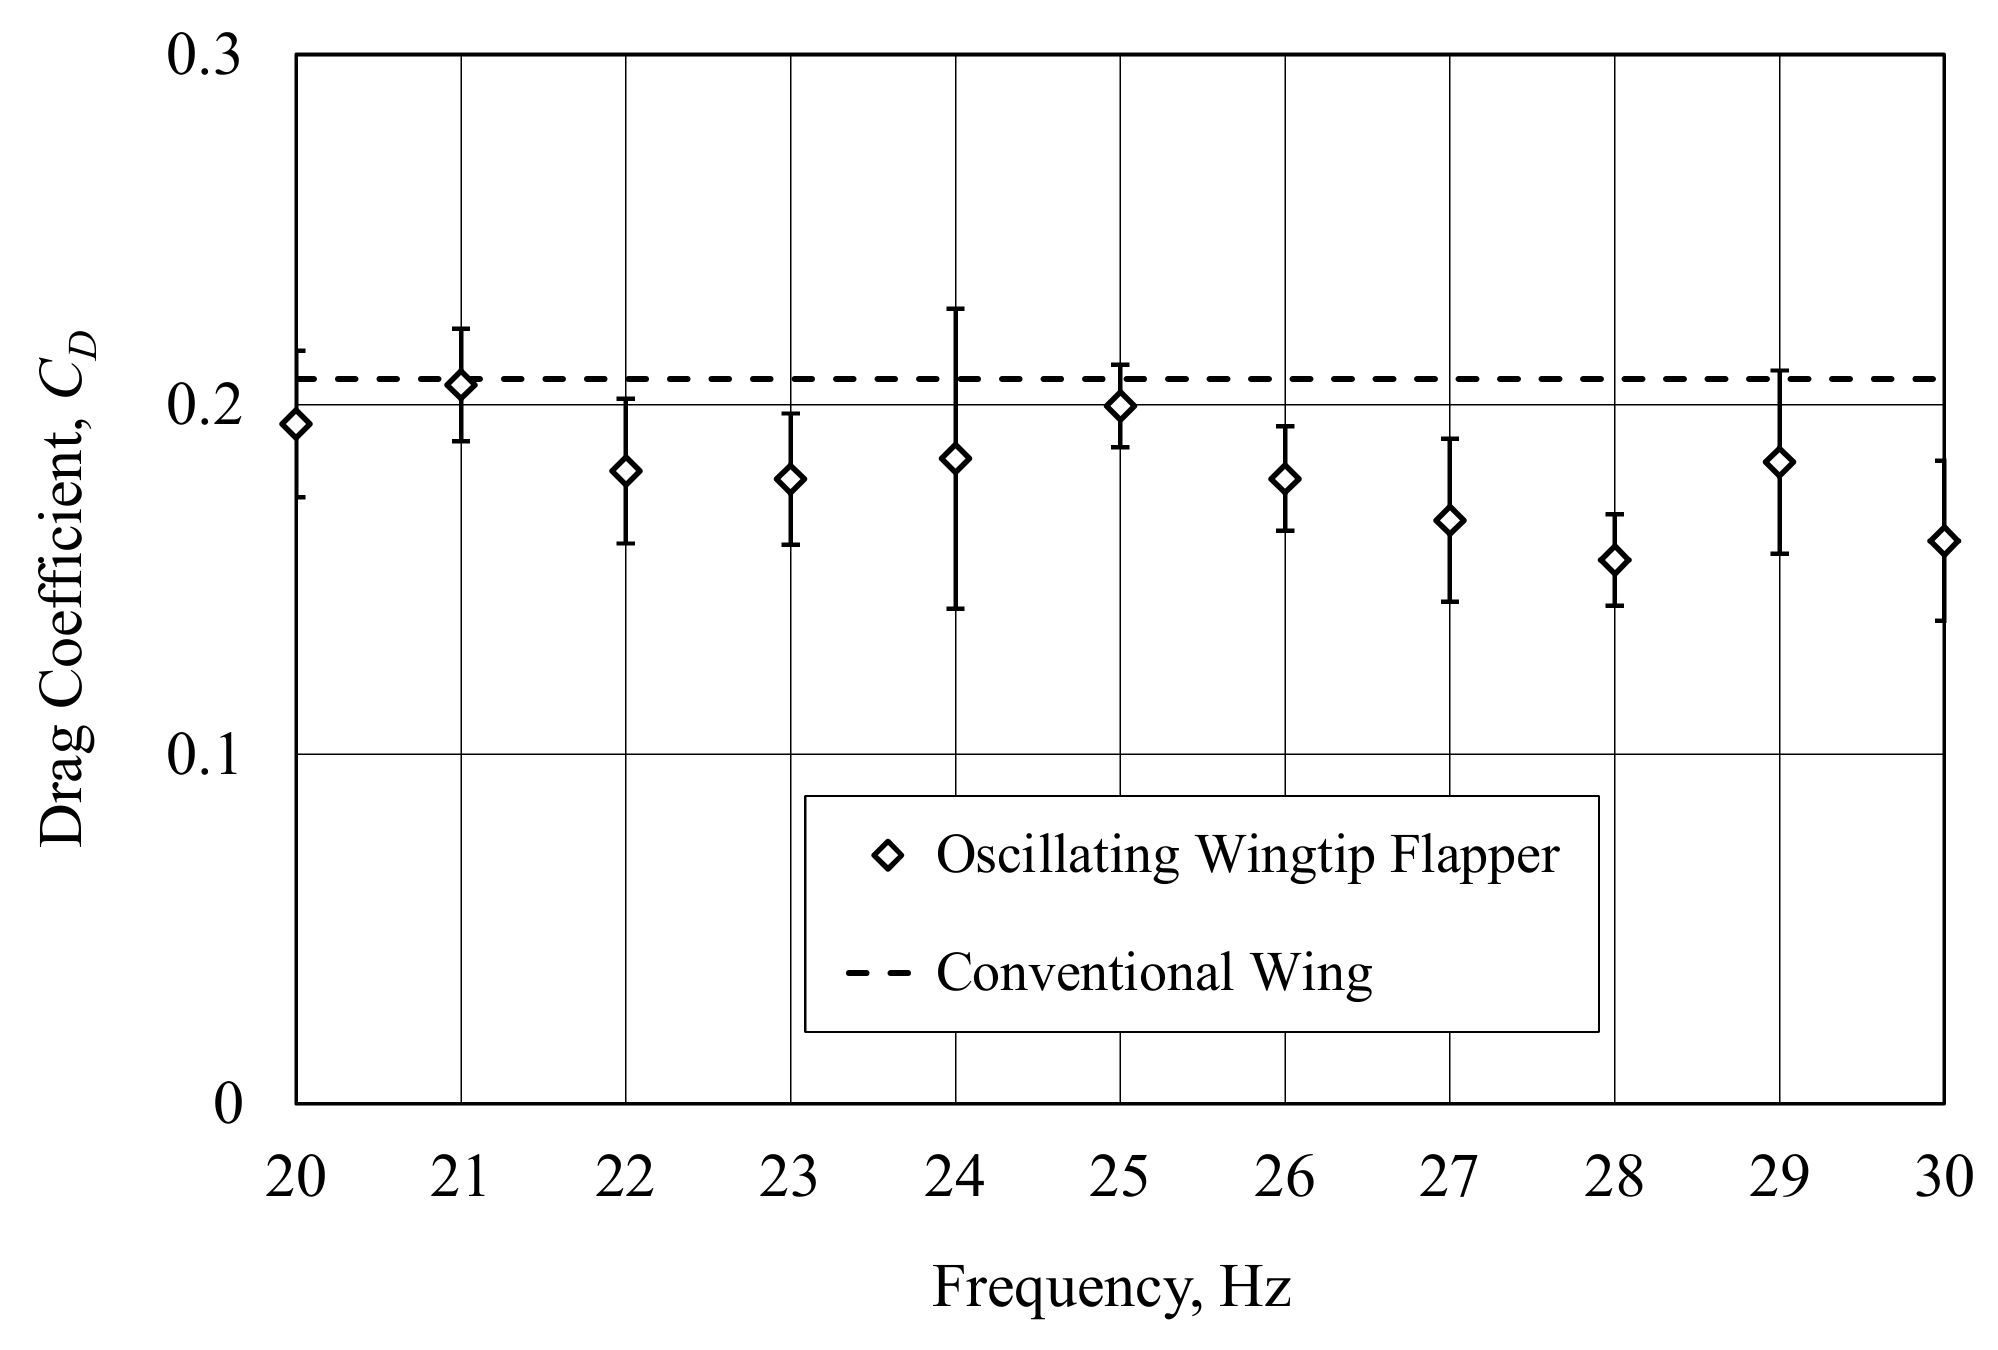
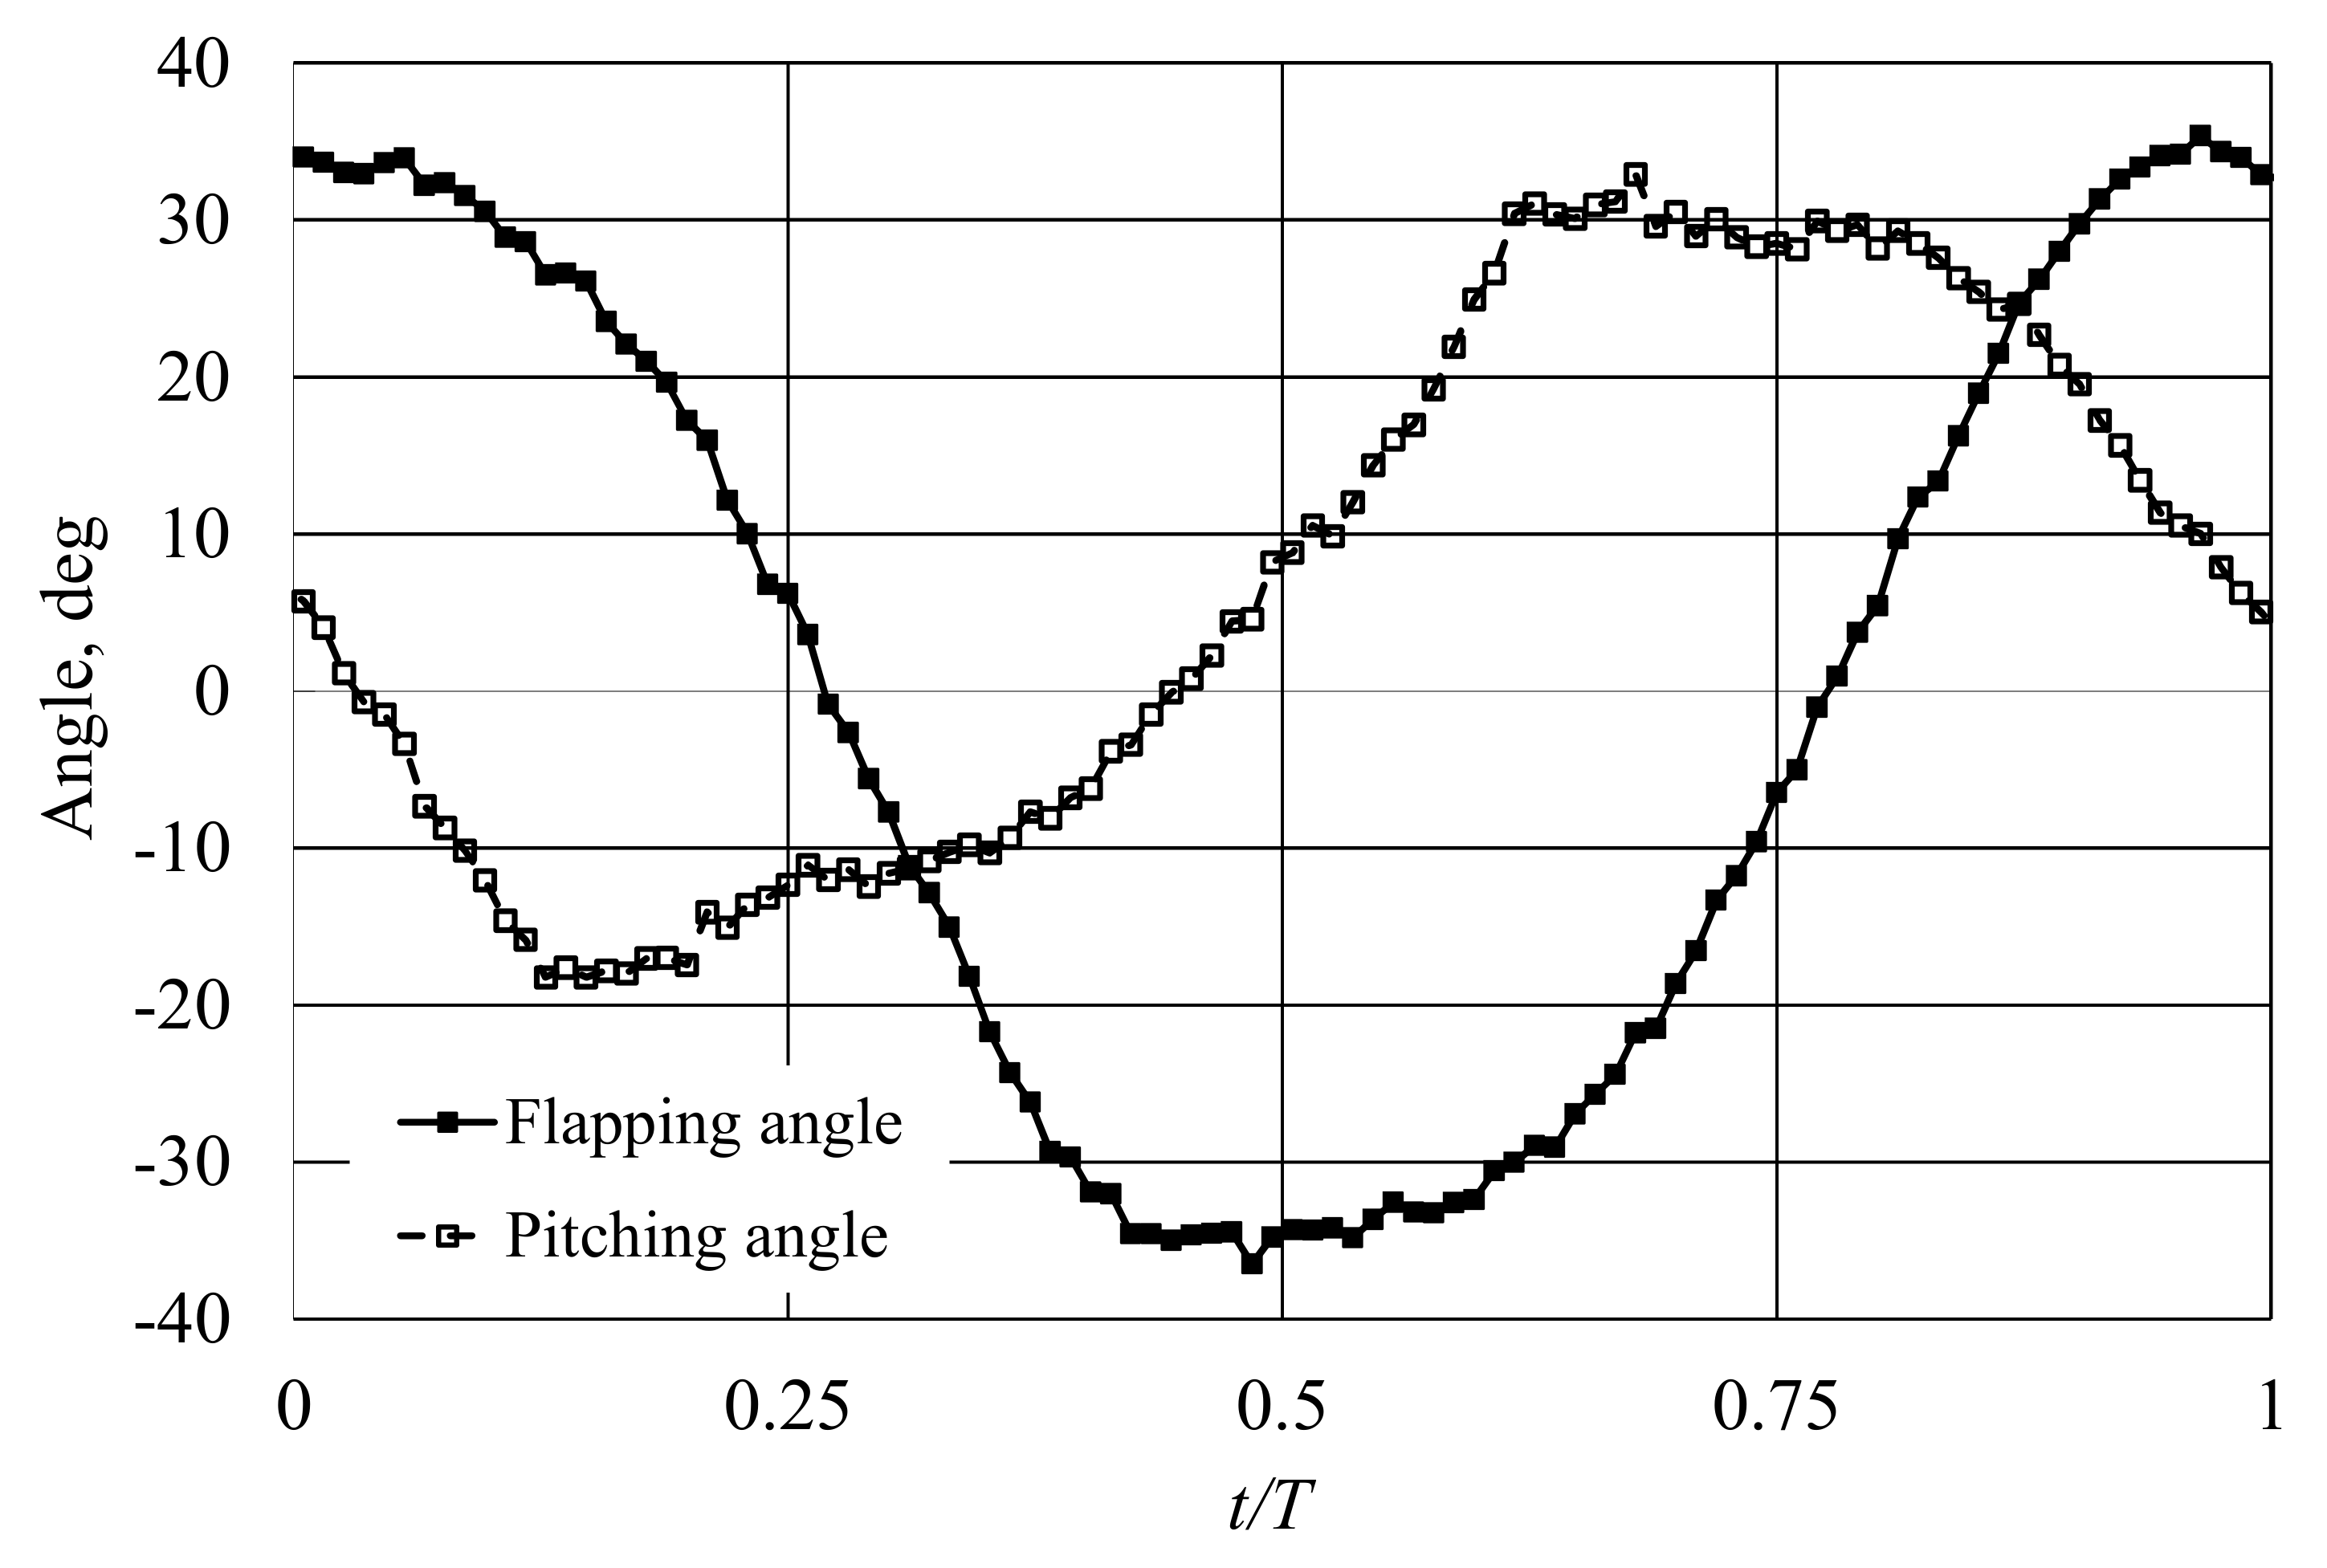
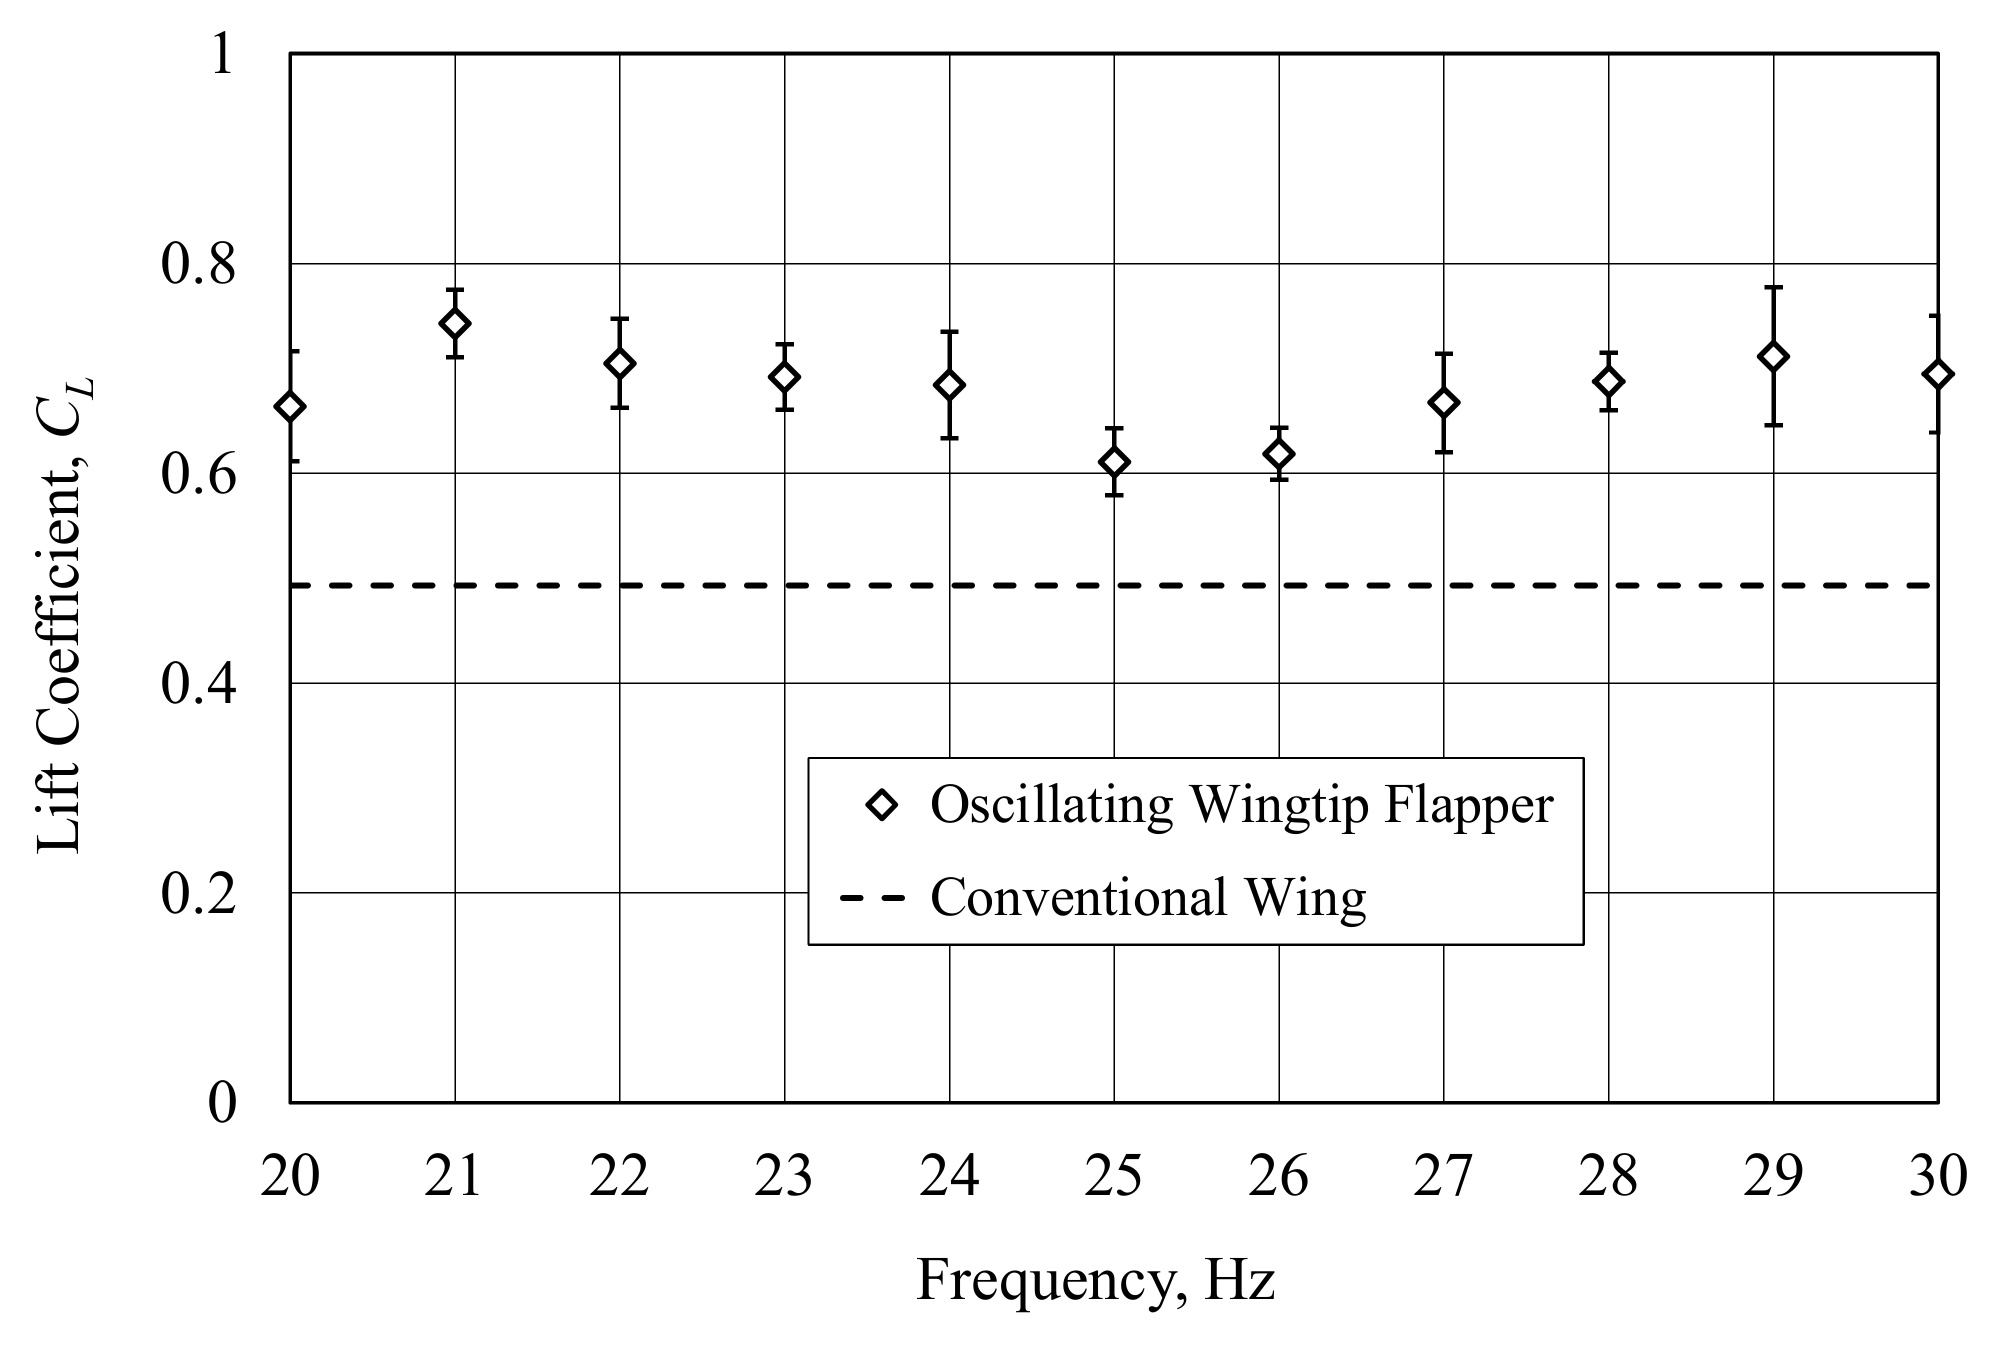
3.1. Kinematic Parameters and Aerodynamic Coefficients of Wing Model
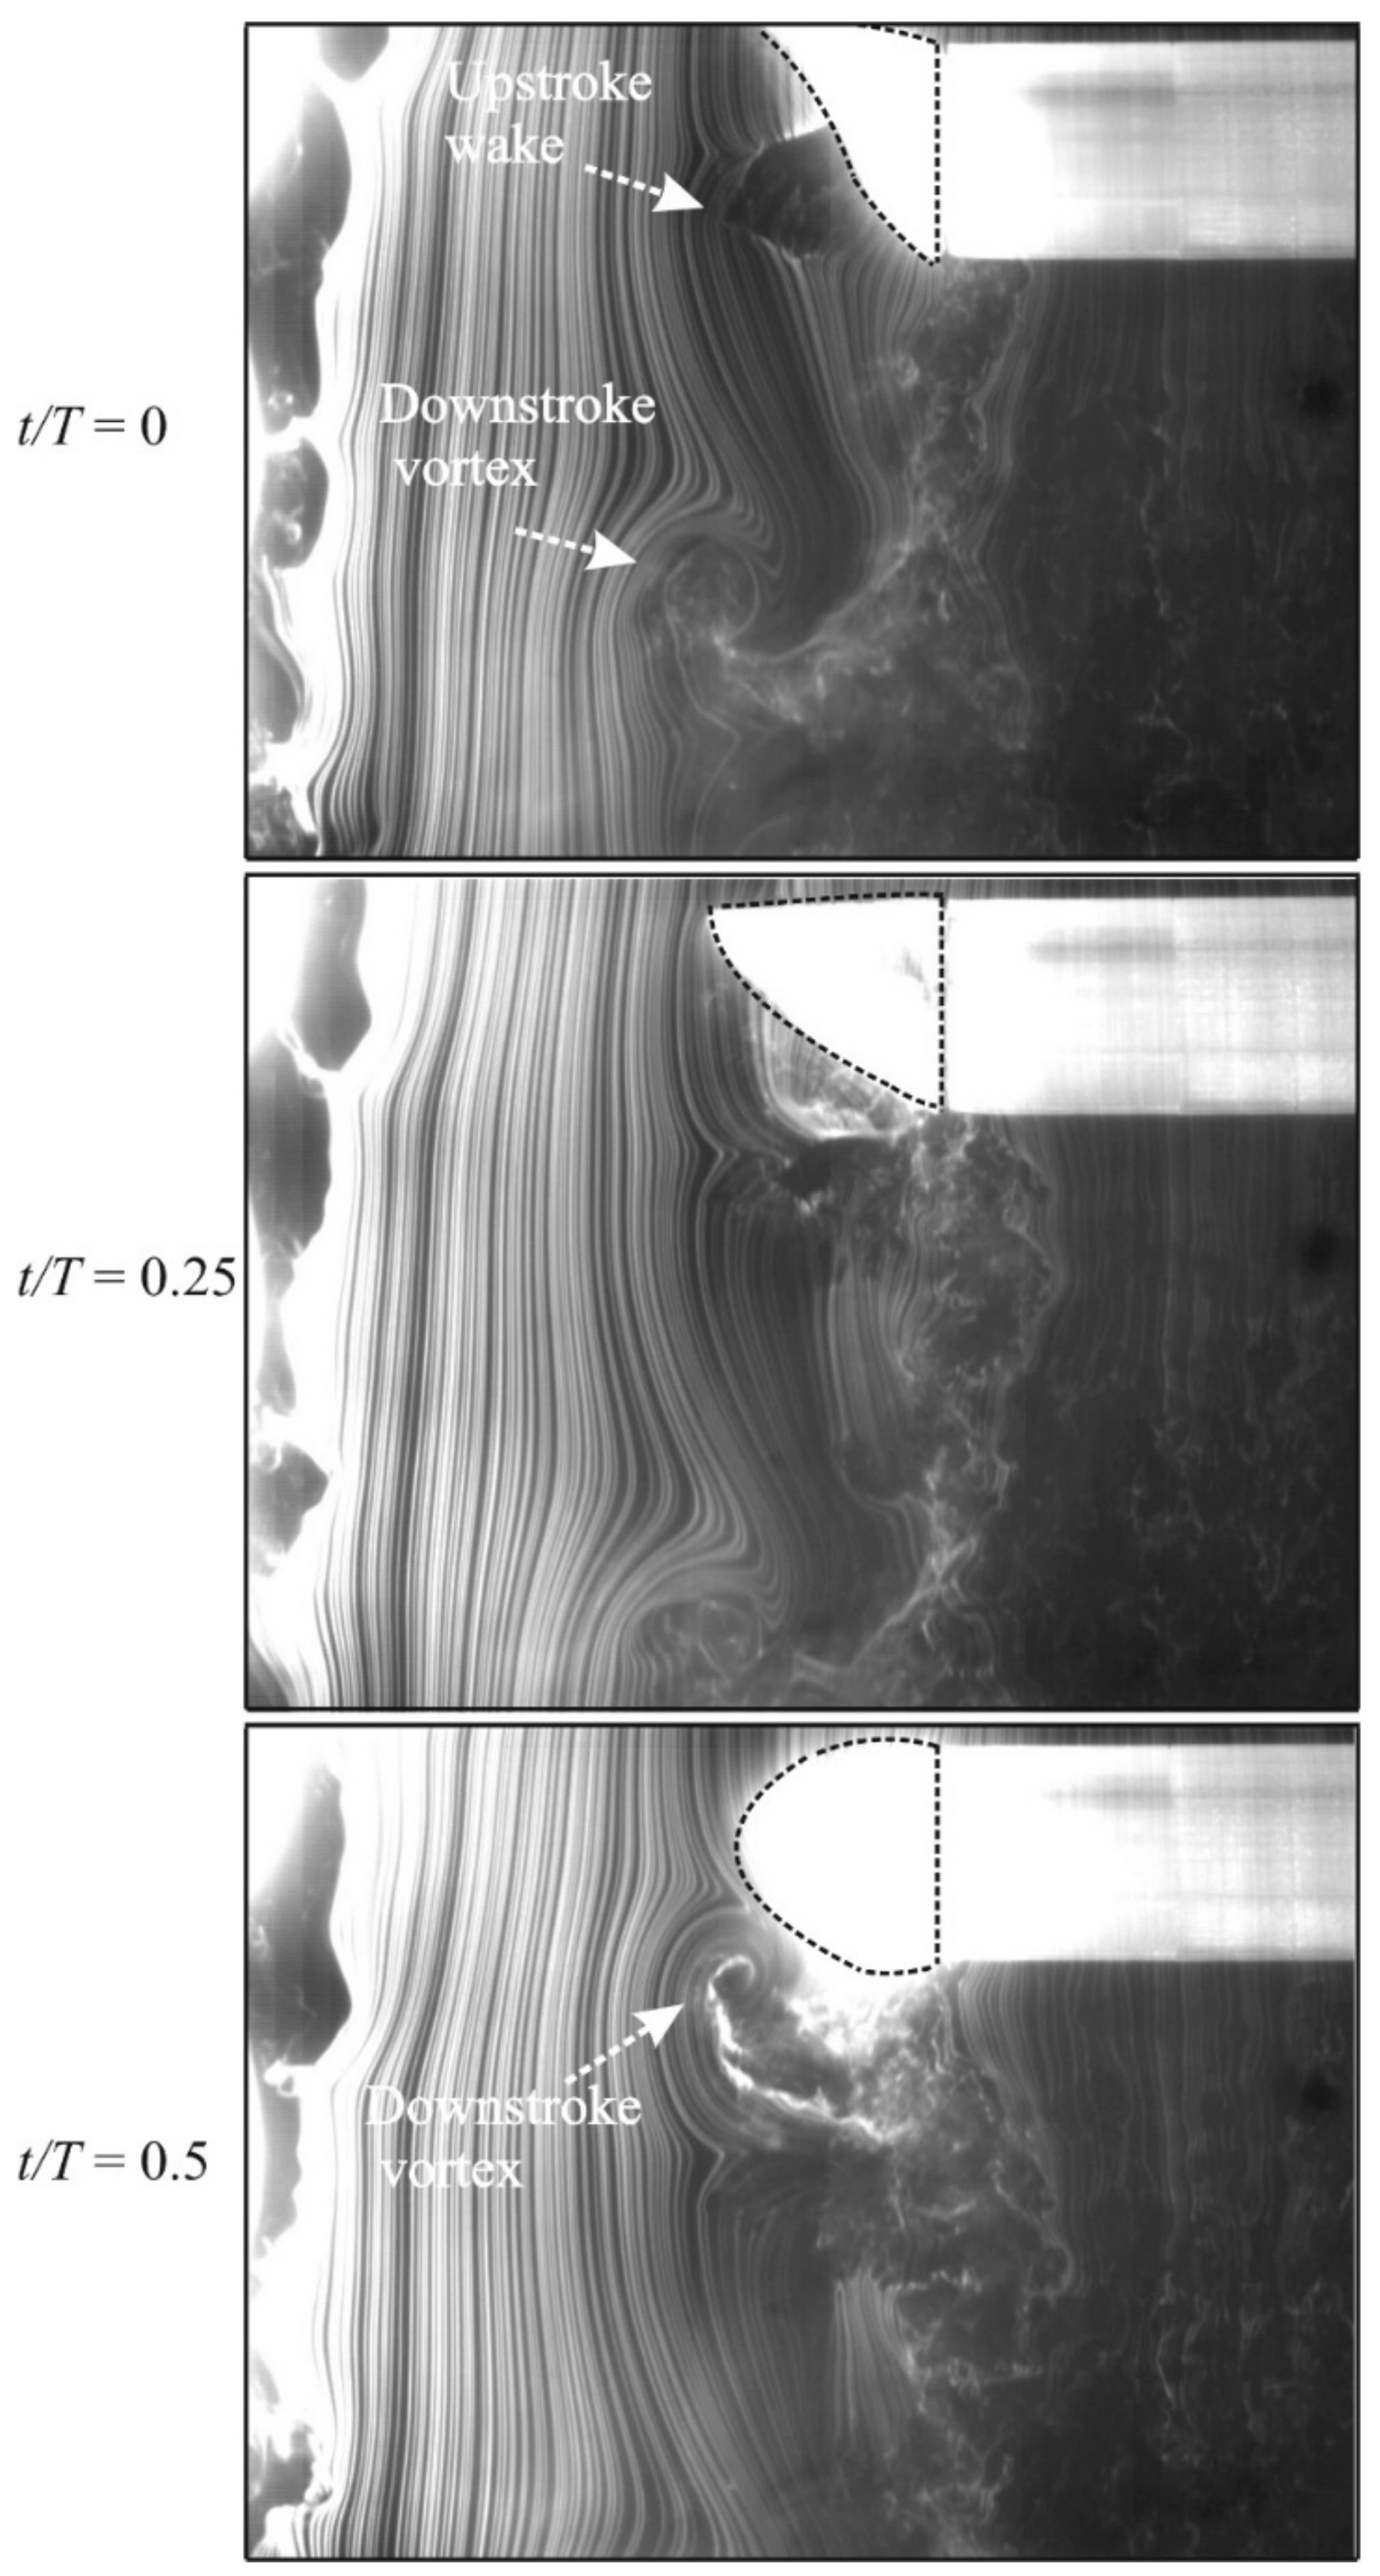
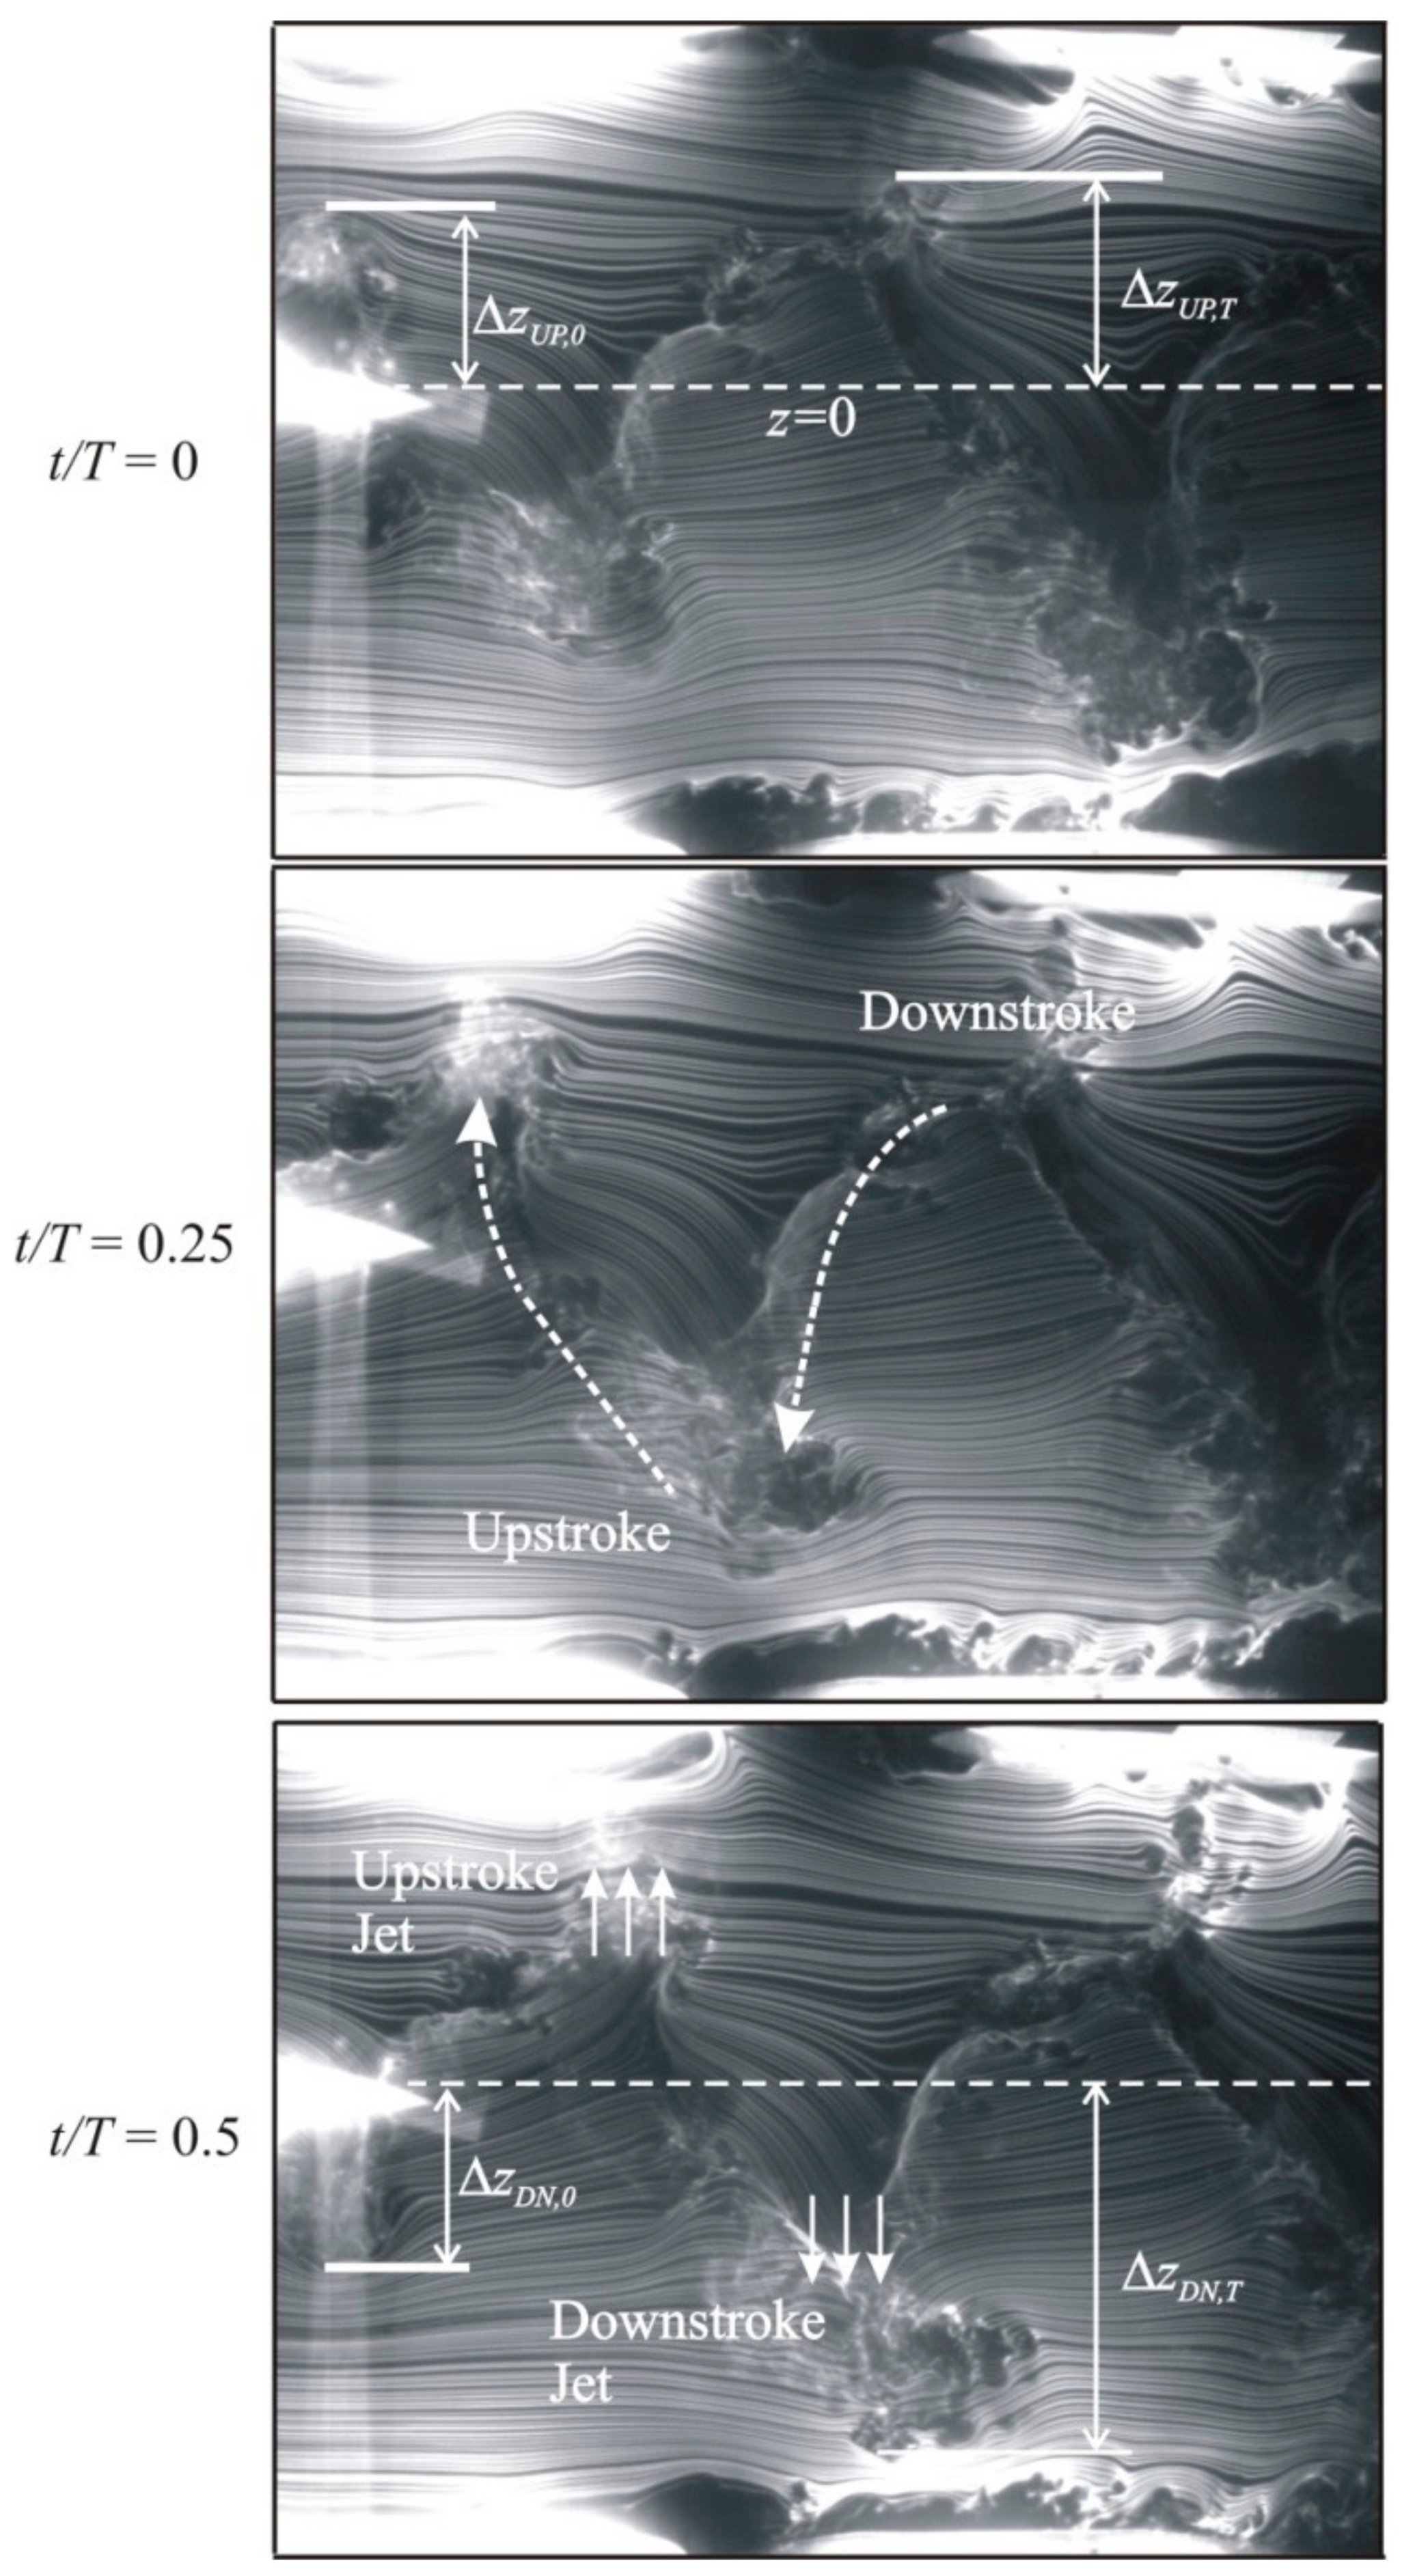
3.2. Smoke-Wire Flow Visualization
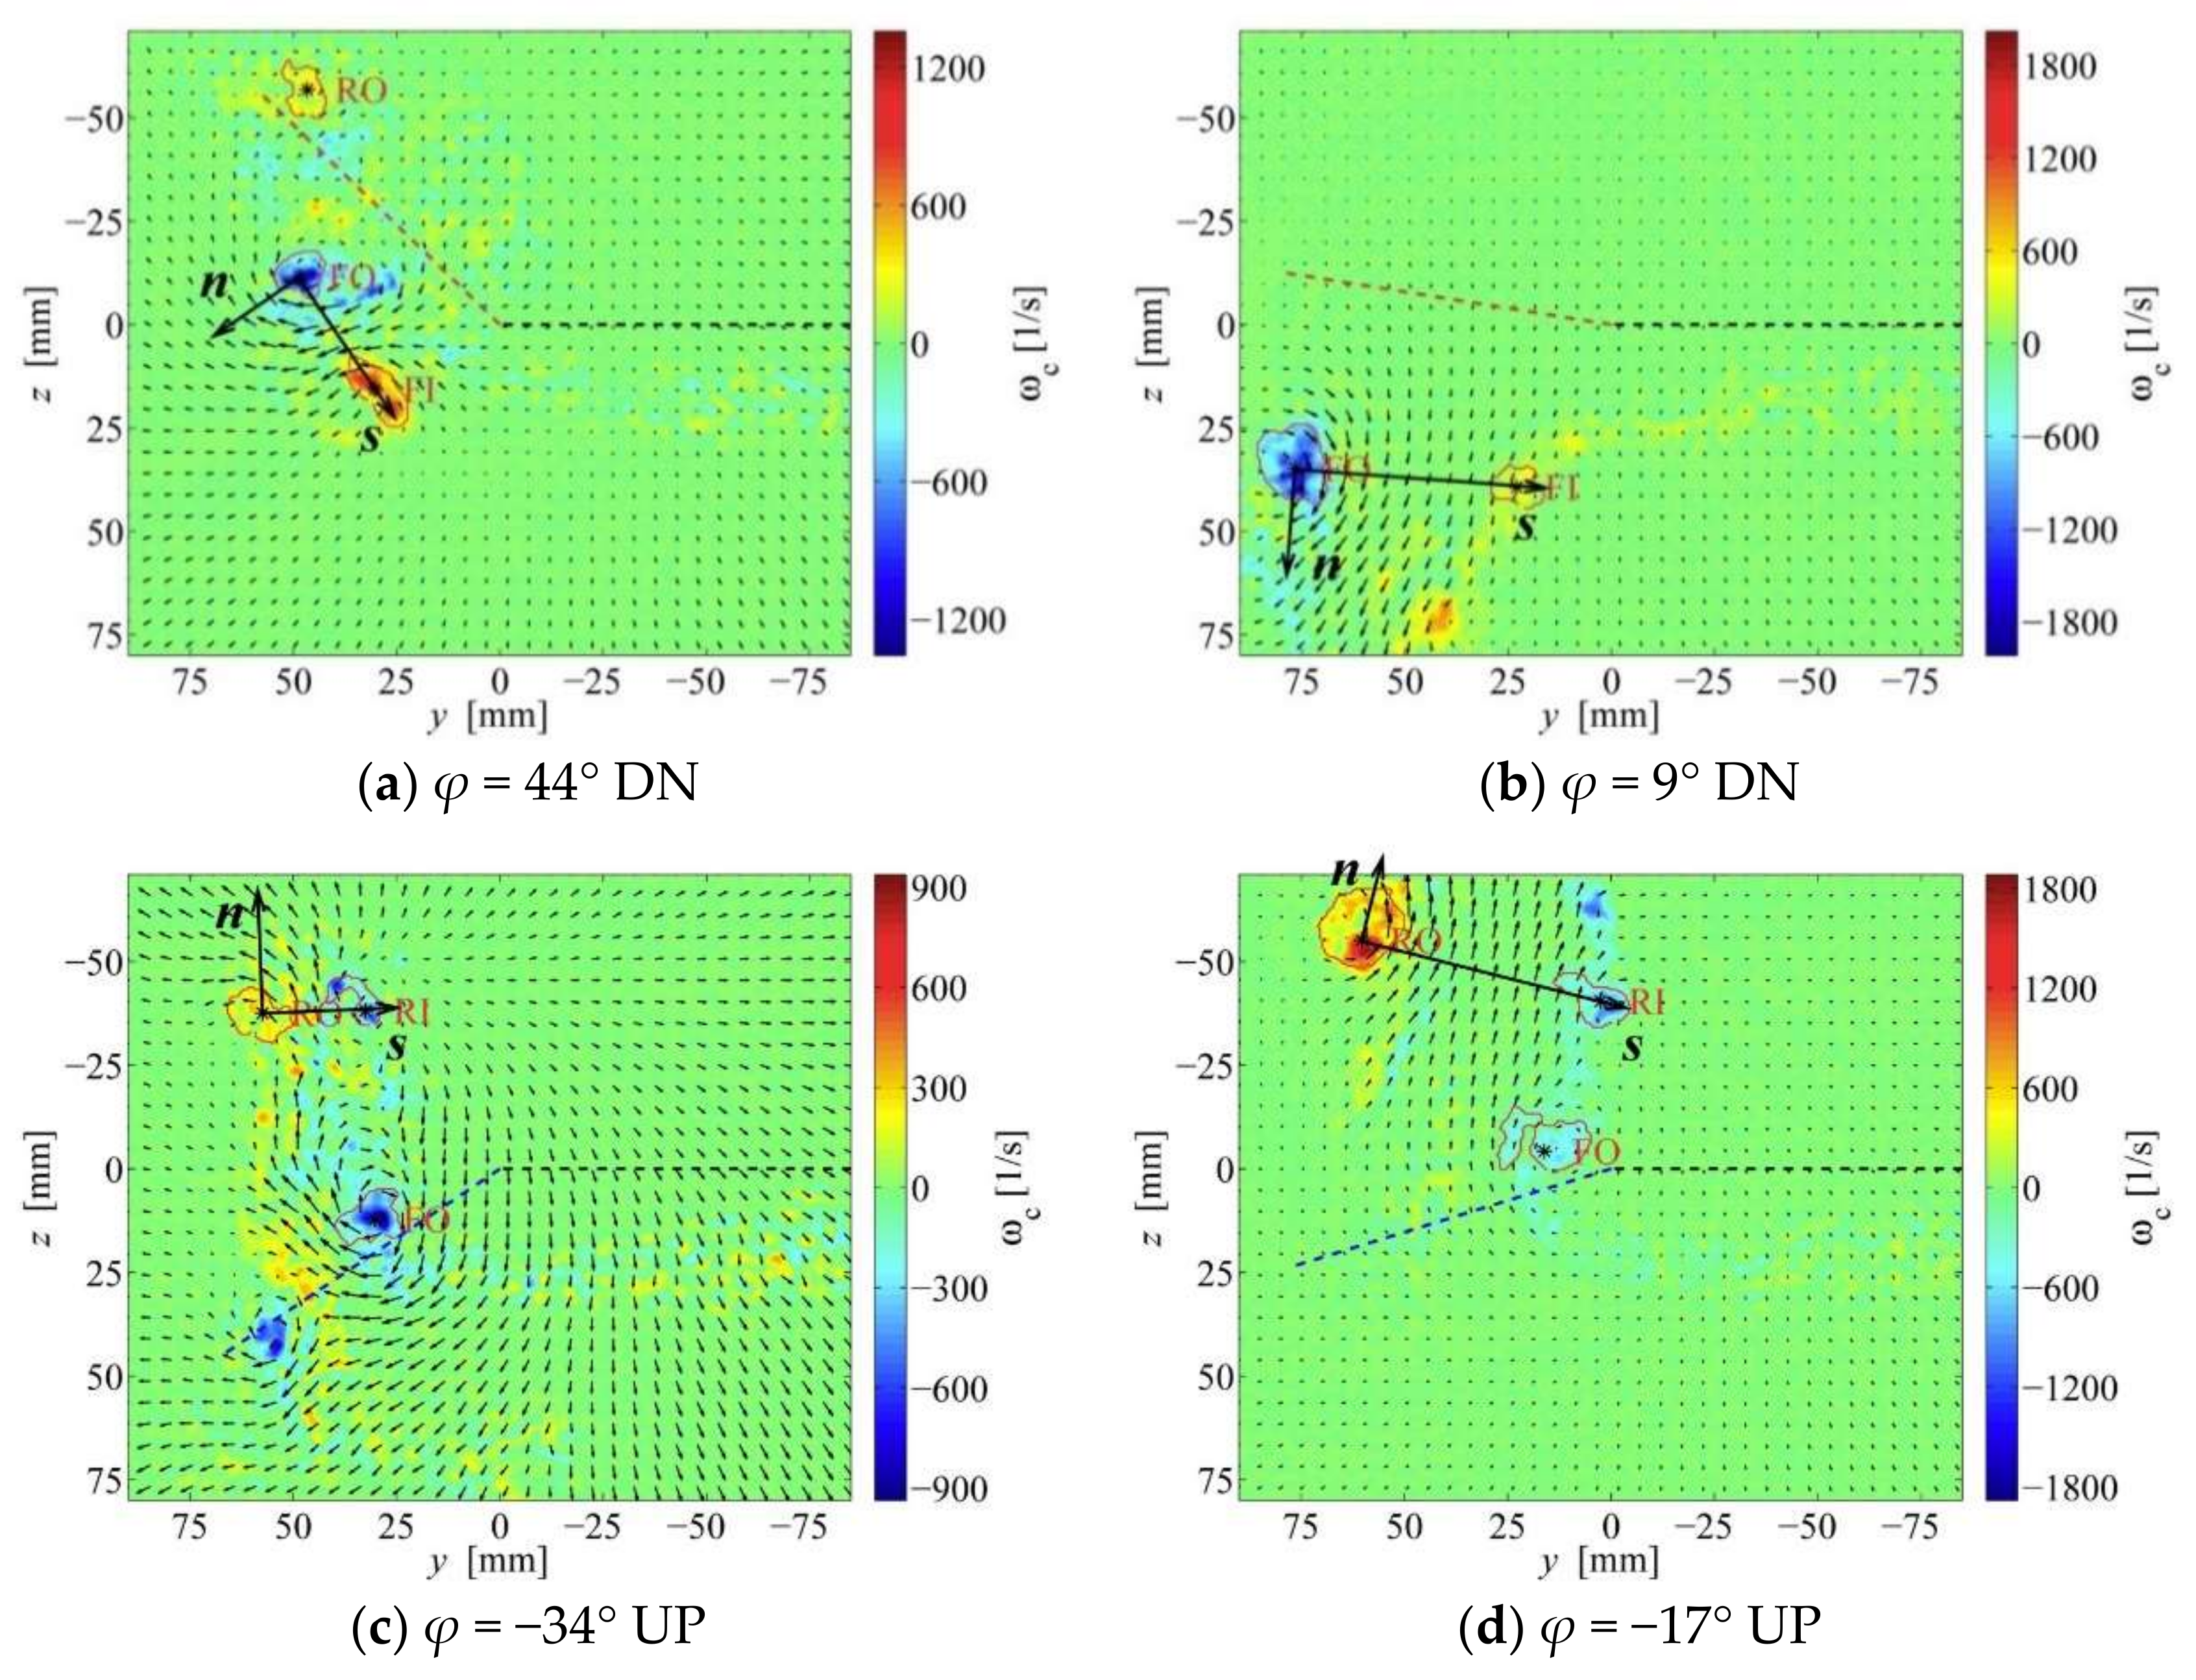
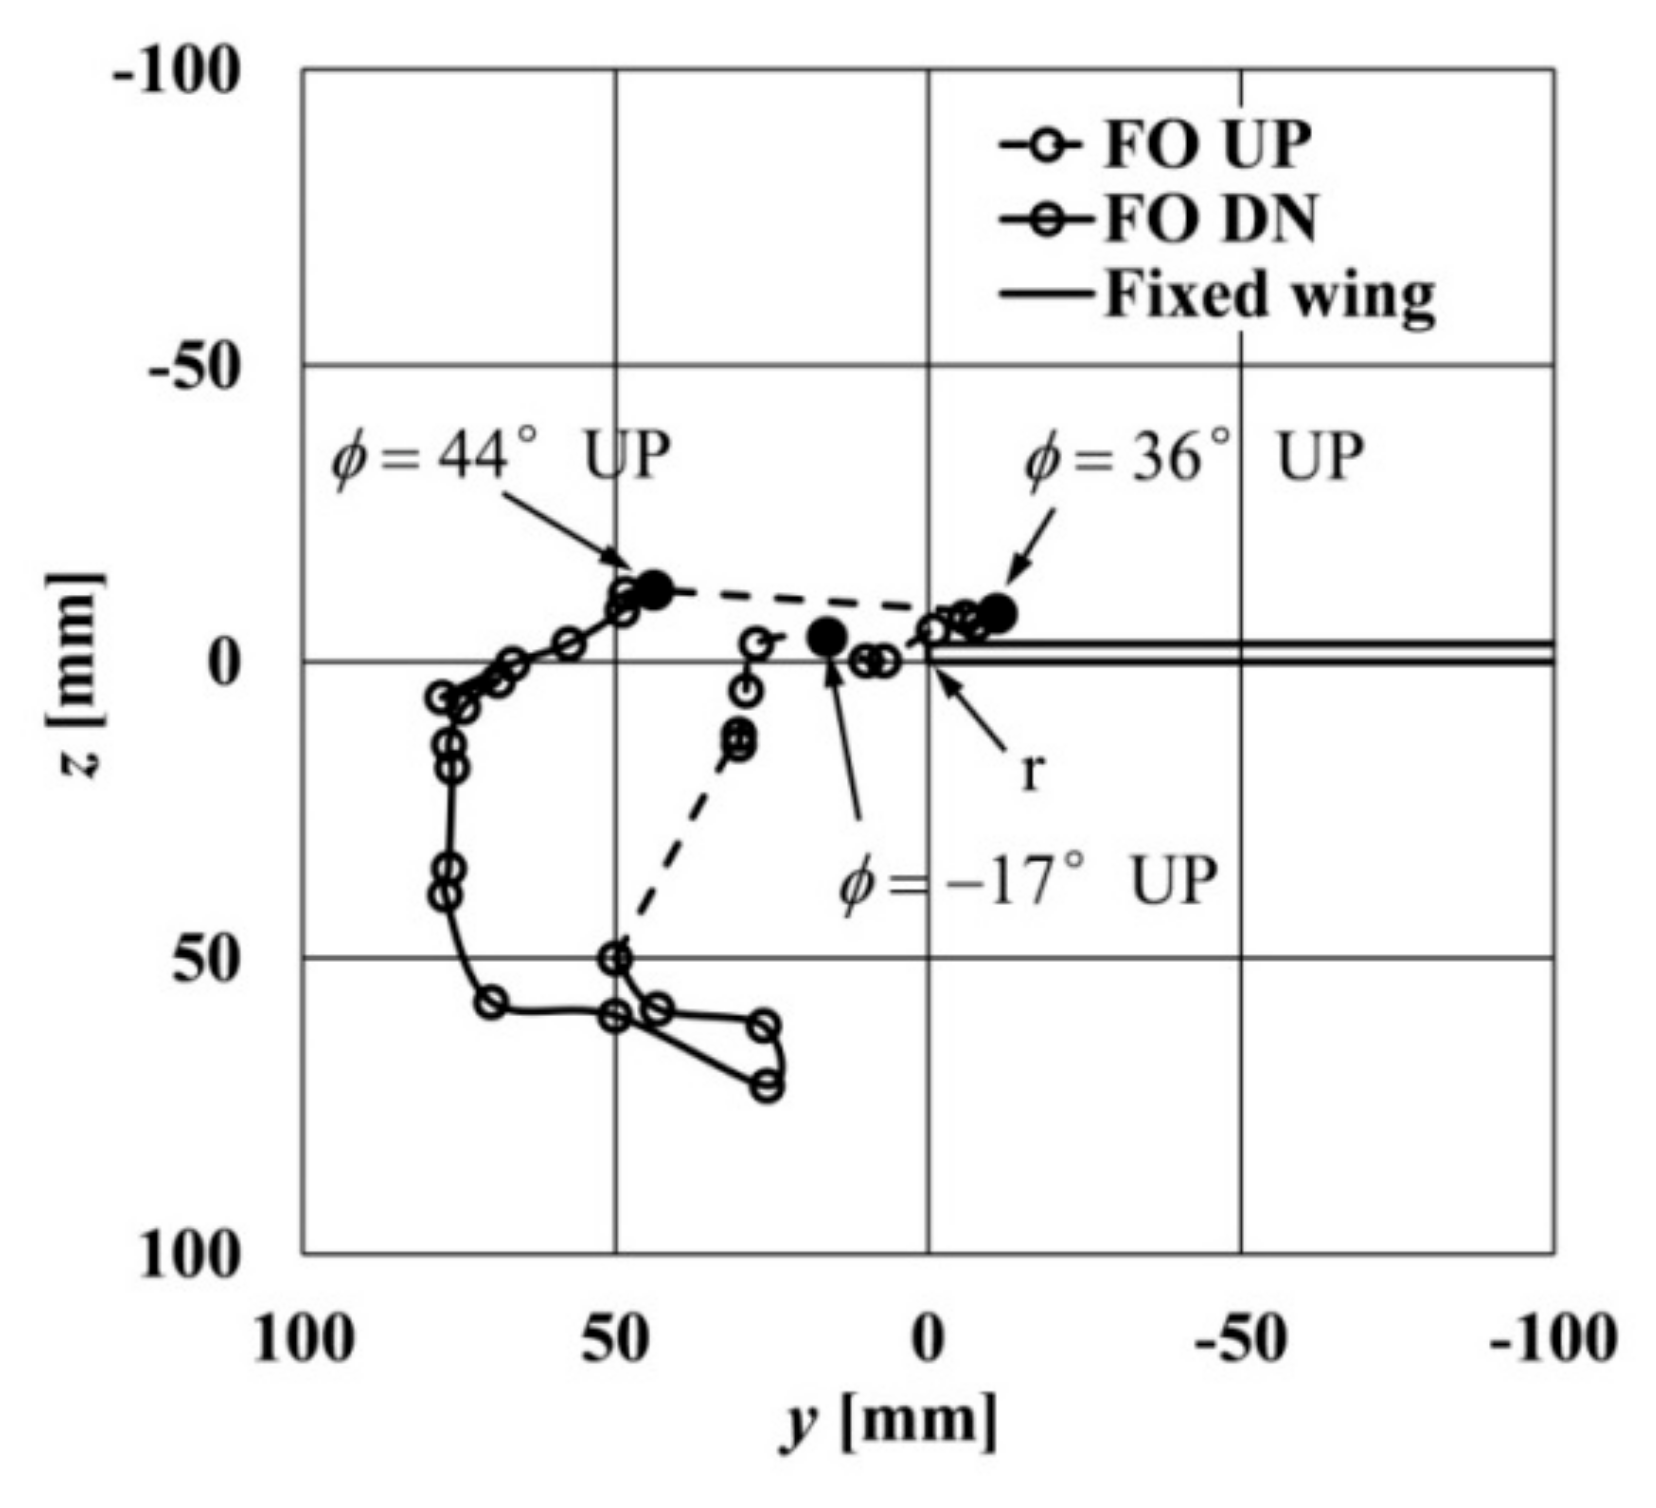
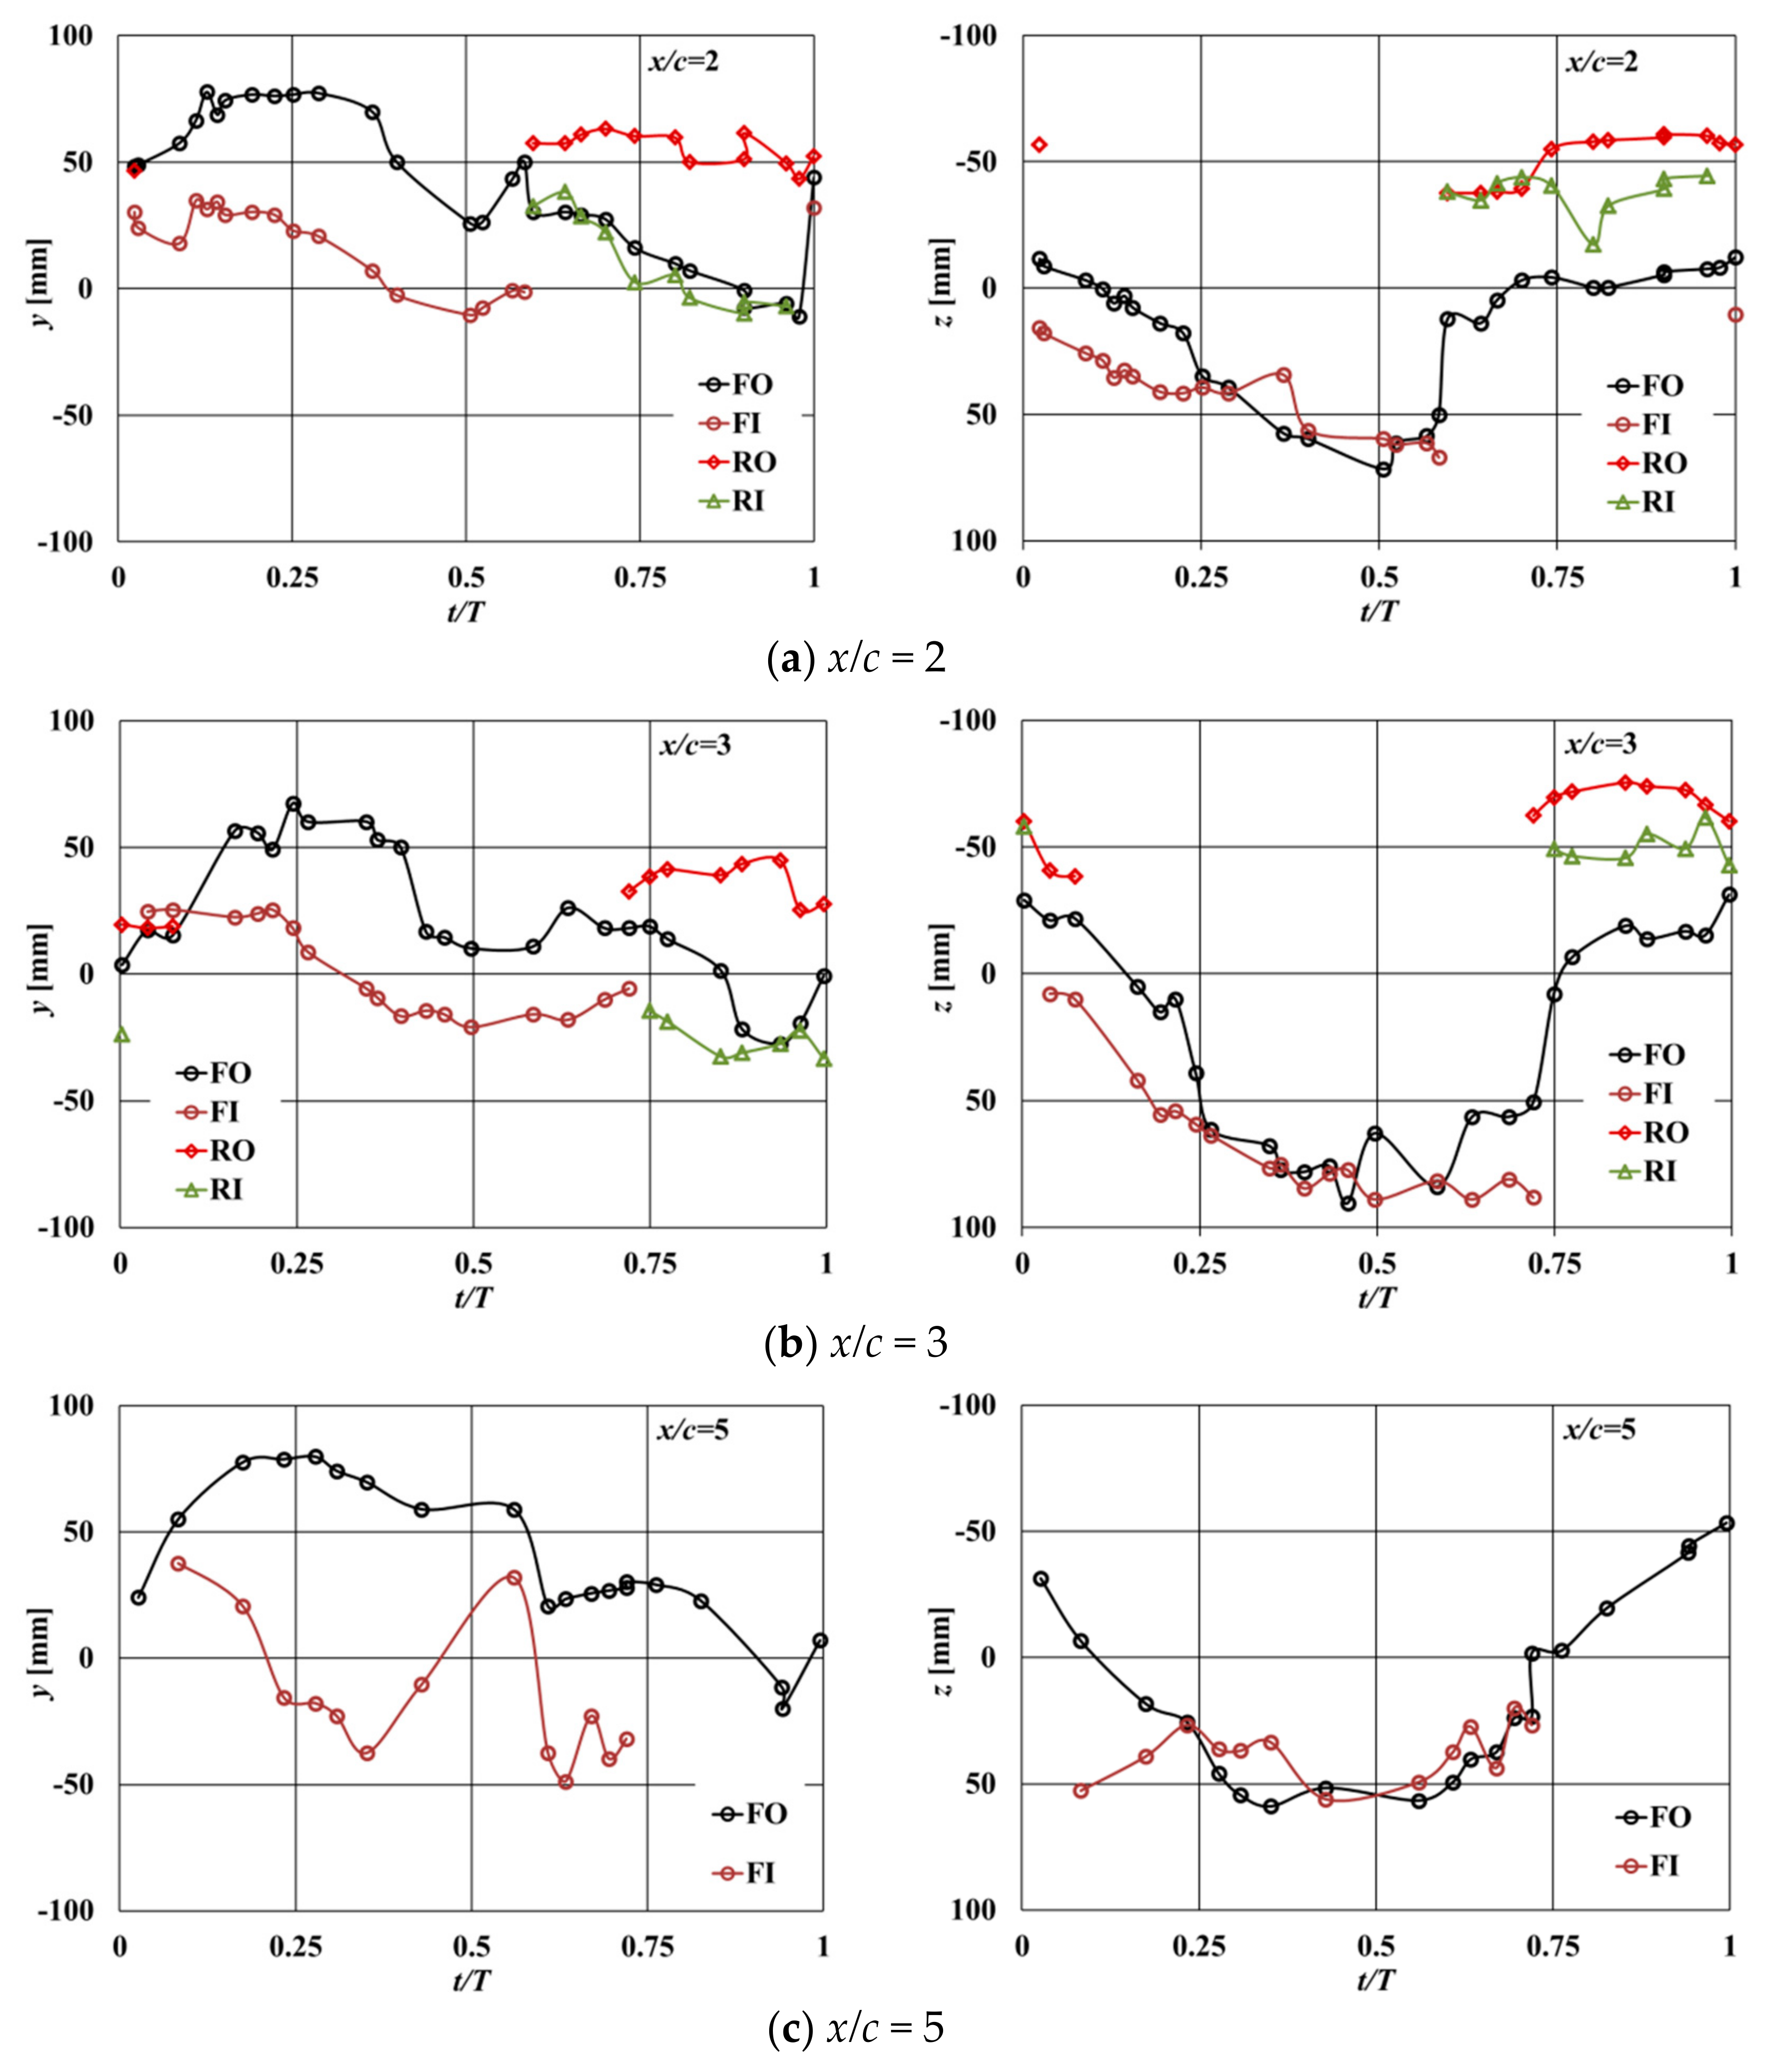
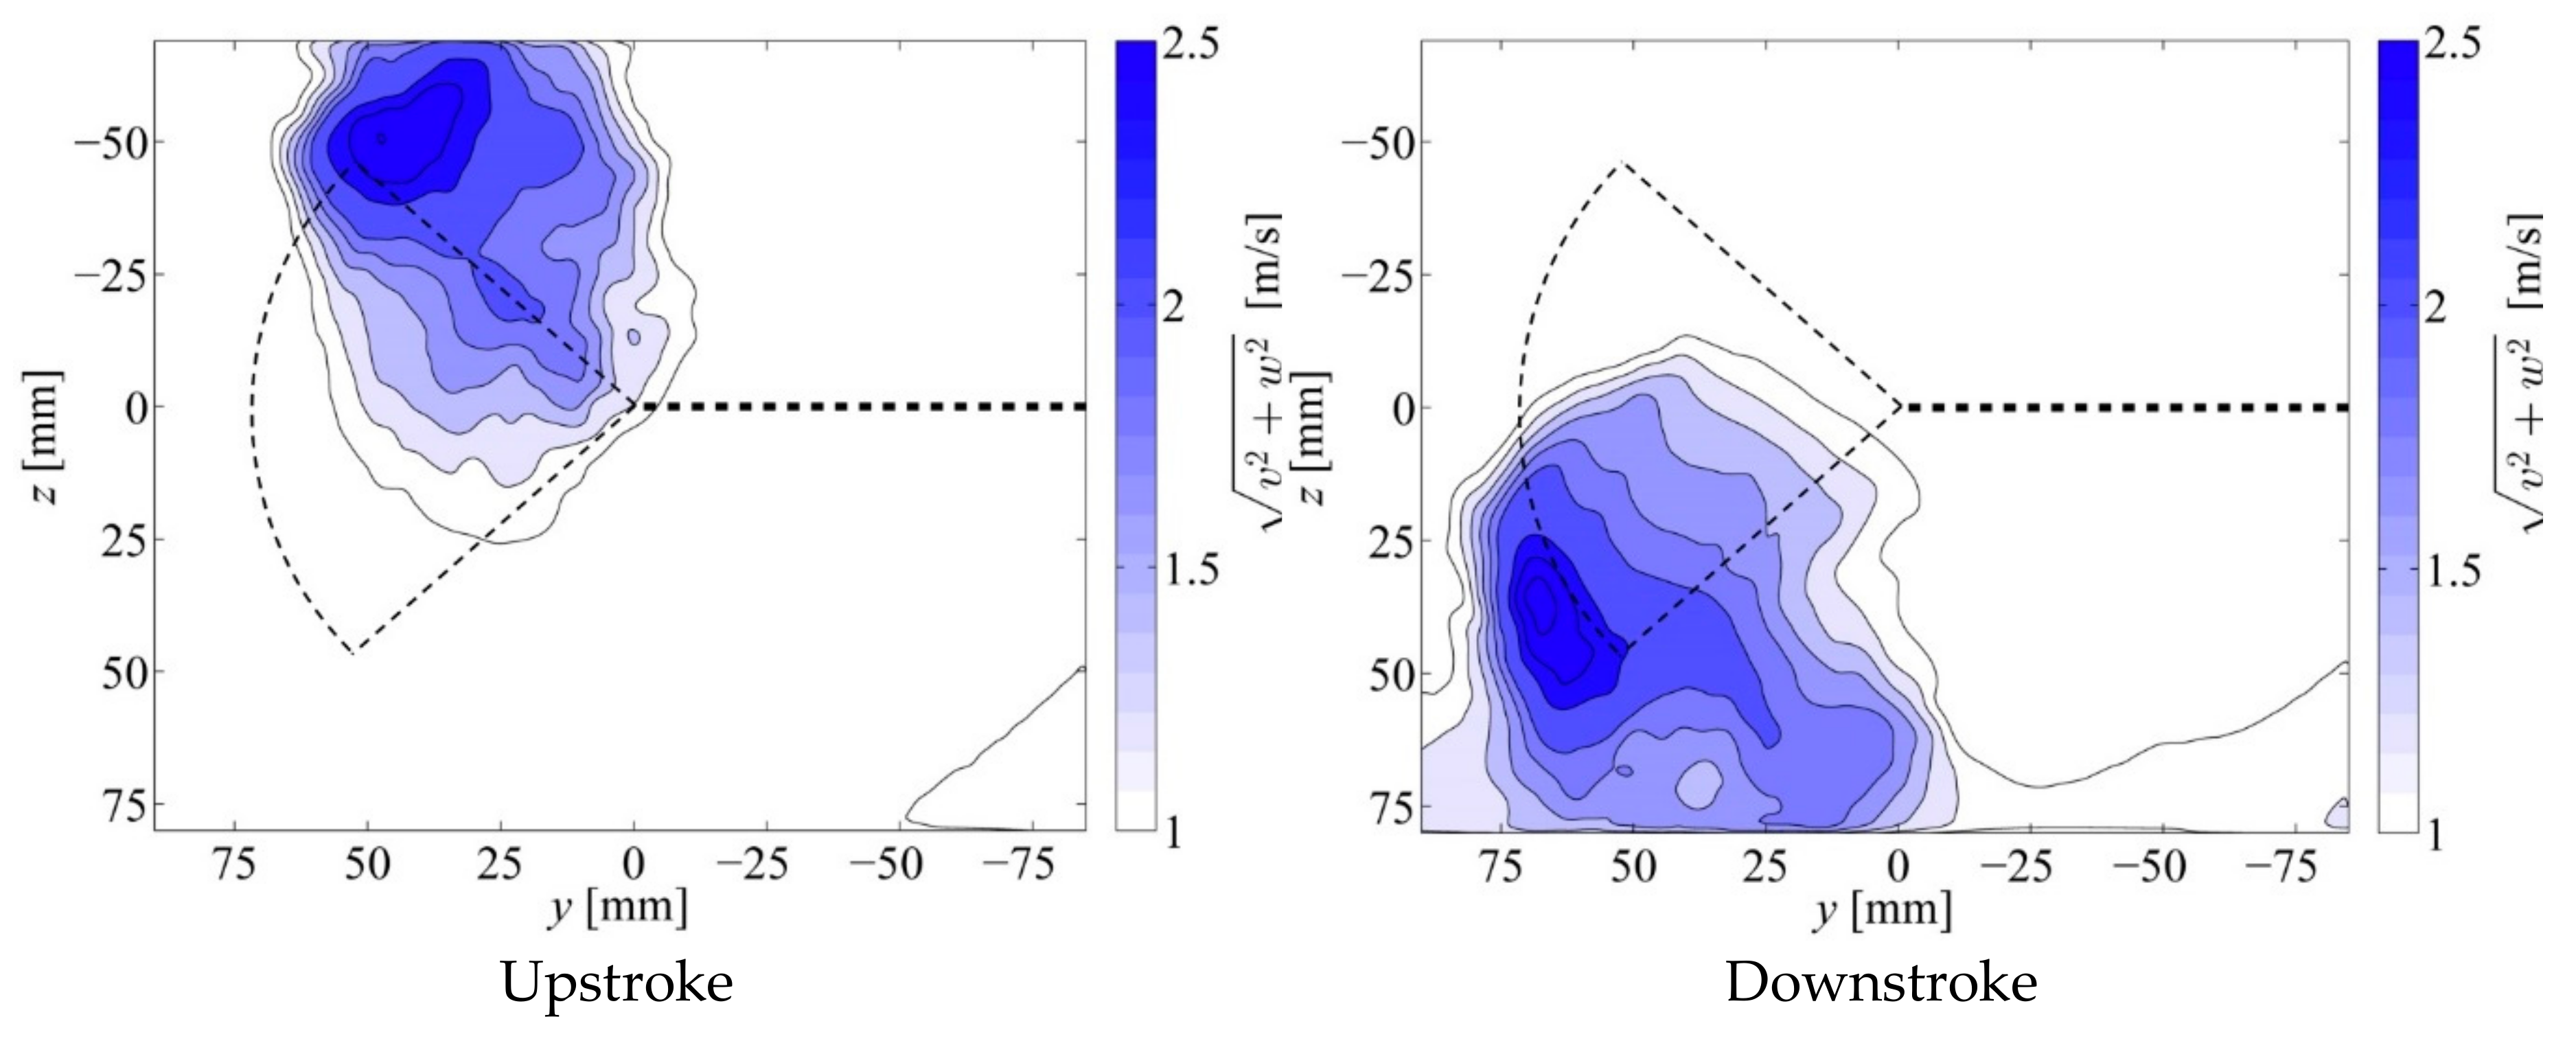
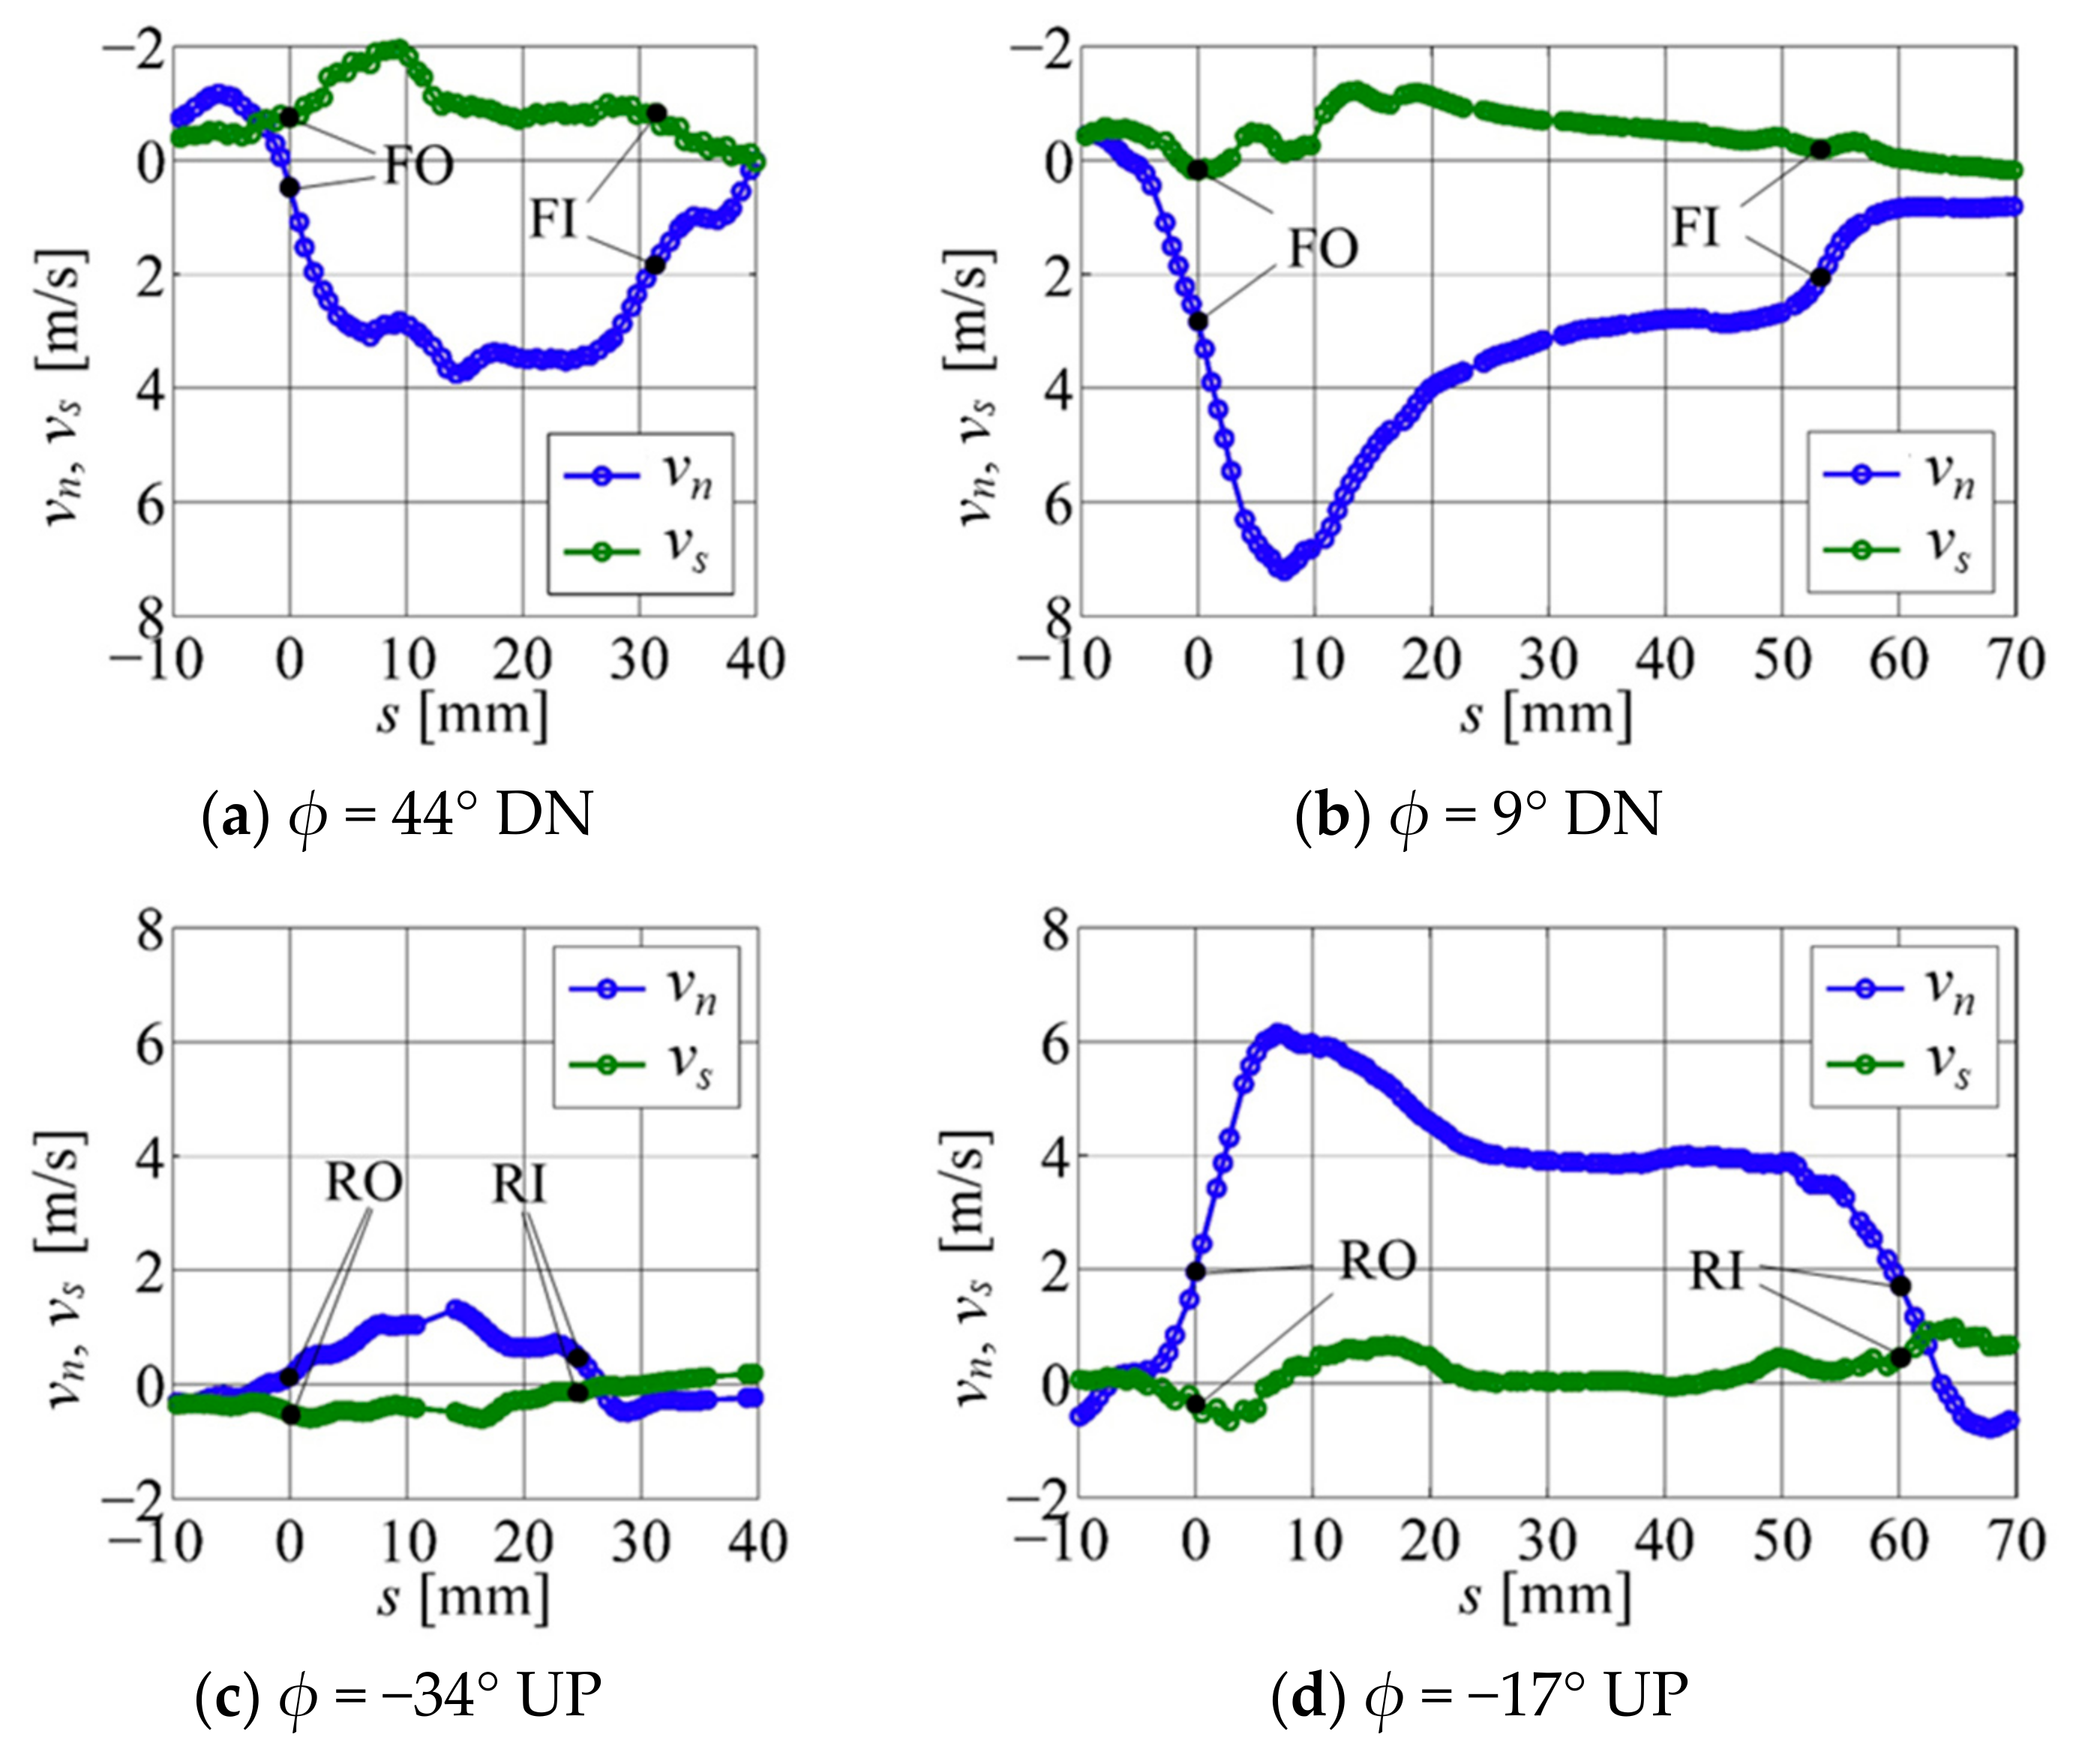
3.3. Near-field PIV Measurements
4. Conclusions
Acknowledgments
Author Contributions
Conflicts of Interest
Nomenclature
| CL | lift coefficient |
| CD | drag coefficient |
| c | chord |
| cm | mean chord length |
| D | drag force |
| FI | secondary undulating vortex |
| FO | primary undulating vortex |
| f | flapping frequency, Hz |
| k | reduced frequency, |
| L | lift force |
| m | tip of membrane flapper |
| Rc | vortex core size, mm |
| r | tip of rigid wing |
| RI | inner part of vortex ring |
| RO | outer part of vortex ring |
| S | total wing area, including both fixed and flapping parts, mm2 |
| t | time, s |
| T | stroke period [T = 1/f], s |
| UP | upstroke |
| DN | downstroke |
| V | tunnel velocity, m/s |
| v | velocity component along y-axis, m/s |
| vn | velocity component of jet flow along n-axis, m/s |
| vs | velocity component of jet flow along s-axis, m/s |
| w | velocity component along z-axis, m/s |
| xyz | model-fixed frame of reference |
| G | vortex circulation, m2/s |
| a | angle of attack, deg |
| b | pitching angle, deg |
| f | flapping angle of the leading edge spar, deg |
| r | air density, kg/m3 |
References
- Sohn, M.H.; Chang, J.W. Visualization and PIV study of wing-tip vortices for three different tip configurations. Aerosp. Sci. Technol. 2012, 16, 40–46. [Google Scholar] [CrossRef]
- Whitcomb, R.T. A Design Approach and Selected Wind-Tunnel Results at High Subsonic Speeds for Wing-Tip Mounted Winglets; NASA TN D-8260; NASA Langley Research Center: Hampton, VA, USA, 1976. [Google Scholar]
- Crow, S.C. Stability theory for a pair of trailing vortices. AIAA J. 1970, 8, 2172–2179. [Google Scholar] [CrossRef]
- Crow, S.C.; Bate, E.R. Lifespan of trailing vortices in a turbulent atmosphere. J. Aircraft 1976, 13, 476–482. [Google Scholar] [CrossRef]
- Crouch, J.D. Stability of Multiple Trailing-Vortex Pairs; CP-584; AGARD: Paris, France, 1996; pp. 17-1–17-8. [Google Scholar]
- Crouch, J.D.; Miller, G.D.; Spalart, P.R. Active-control system for breakup of airplane trailing vortices. AIAA J. 2001, 39, 2374–2381. [Google Scholar] [CrossRef]
- Spedding, G.R.; Rosén, M.; Hedenström, A. A family of vortex wakes generated by a thrush nightingale in free flight in a wind tunnel over its entire natural range of flight speeds. J. Exp. Biol. 2003, 206, 2313–2344. [Google Scholar] [CrossRef] [PubMed]
- Muijres, F.T.; Johansson, L.C.; Barfield, R.; Wolf, M.; Spedding, G.R.; Hedenström, A. leading-edge vortex improves lift in slow-flying bats. Science 2008, 319, 1250–1253. [Google Scholar] [CrossRef] [PubMed]
- Liu, Y.; Cheng, B.; Barbera, G.; Troolin, D.R.; Deng, X. Volumetric visualization of the near- and far-field wake in flapping wings. Bioinspir. Biomim. 2013, 8, 8. [Google Scholar] [CrossRef] [PubMed]
- Johansson, L.C.; Hedenström, A. The Vortex wake of blackcaps (Sylvia atricapilla L.) measured using high-speed digital particle image velocimetry (DPIV). J. Exp. Biol. 2009, 212, 3365–3376. [Google Scholar] [CrossRef] [PubMed]
- Shkarayev, S.; Silin, D. Measurements of aerodynamic coefficients for flapping wings at 0–90 angles of attack. AIAA J. 2012, 50, 2034–2042. [Google Scholar] [CrossRef]
- Shkarayev, S.; Maniar, G.; Shekhovtsov, A. Experimental and computational modeling of the kinematics and aerodynamics of flapping wings. J. Aircraft 2013, 50, 1734–1747. [Google Scholar] [CrossRef]
- Hedrick, T.L. Software techniques for two- and three-dimensional kinematic measurements of biological and biomimetic systems. Bioinspir. Biomim. 2008, 3, 034001. [Google Scholar] [CrossRef] [PubMed]
- Shkarayev, S.; Kumar, R. Kinematics and inertial effects in locust flapping wings. Exp. Mech. 2016, 56, 245–258. [Google Scholar] [CrossRef]
- Kumar, R.; Randall, R.; Silin, D.; Shkarayev, S. Insect-Inspired Micro Air Vehicles. In Handbook of Biomimetics and Bioinspiration; World Scientific Publishing Company: Singapore, 2014; Volume 3, Chapter 23; pp. 623–649. [Google Scholar]
- Educational Wind Tunnel (EWT) Operations Manual. Available online: http://org.coloradomesa.edu/~skessler/kessler_msc1/MISC_files/AeroLabWindTun_Operator.pdf (accessed on 1 February 2012).
- Kranepuhl, R.; Shkarayev, S.; Planchenault, P. Wingtip vortex modifications using alternating jets. In Proceedings of the 34th AIAA Applied Aerodynamics Conference (AIAA 2016-3118), Washington, DC, USA, 13–17 June 2016. [Google Scholar]
- Shkarayev, S.; Su, E.; Zhao, L. Aerodynamics of wing with oscillating wingtip flapper. In Proceedings of the 34th AIAA Applied Aerodynamics Conference (AIAA 2016-3119), Washington, DC, USA, 13–17 June 2016; p. 3119. [Google Scholar]
- Graftieaux, L.; Michard, M.; Grosjean, N. Combining PIV, POD and vortex identification algorithms for the study of unsteady turbulent swirling flows. Meas. Sci. Technol. 2001, 12, 1422–1429. [Google Scholar] [CrossRef]
- Kurnosov, V.; Shkarayev, S. Modifications of Vortex Identification Method. In Proceedings of the 33rd AIAA Aerodynamic Measurement Technology and Ground Testing Conference (AIAA 2017-3556), Denver, CO, USA, 5–9 June 2017; p. 3556. [Google Scholar]


| Frequency | 0 | 20 | 21 | 22 | 23 | 24 | 25 | 26 | 27 | 28 | 29 | 30 |
|---|---|---|---|---|---|---|---|---|---|---|---|---|
| CL/CD | 2.379 | 3.414 | 3.613 | 3.896 | 3.872 | 3.708 | 3.062 | 3.461 | 3.998 | 4.421 | 3.878 | 4.315 |
| x/c | 2 | 3 | 5 | ||||||
|---|---|---|---|---|---|---|---|---|---|
| min | max | ave | min | max | ave | min | max | ave | |
| FO | 0.051 | 0.210 | 0.113 | 0.039 | 0.217 | 0.116 | 0.011 | 0.142 | 0.066 |
| FI | −0.023 | −0.100 | −0.050 | −0.006 | −0.086 | −0.047 | −0.002 | −0.046 | −0.012 |
| RO | −0.020 | −0.176 | −0.068 | −0.006 | −0.163 | −0.063 | - | - | - |
| RI | 0.016 | 0.094 | 0.049 | 0.010 | 0.053 | 0.028 | - | - | - |
| x/c | 2 | 3 | 5 | ||||||
|---|---|---|---|---|---|---|---|---|---|
| min | max | ave | min | max | ave | min | max | ave | |
| FO | 3.82 | 11.3 | 8.56 | 5.39 | 13.0 | 9.36 | 4.29 | 13.2 | 8.68 |
| FI | 4.83 | 8.54 | 6.40 | 4.05 | 9.78 | 7.32 | 1.95 | 7.9 | 4.32 |
| RO | 4.52 | 9.97 | 7.43 | 2.77 | 11.9 | 7.53 | - | - | - |
| RI | 2.92 | 8.86 | 6.23 | 4.16 | 8.38 | 5.90 | - | - | - |
© 2018 by the authors. Licensee MDPI, Basel, Switzerland. This article is an open access article distributed under the terms and conditions of the Creative Commons Attribution (CC BY) license (http://creativecommons.org/licenses/by/4.0/).
Share and Cite
Zhao, L.; Shkarayev, S.; Su, E. Aerodynamics of a Wing with a Wingtip Flapper. Fluids 2018, 3, 29. https://doi.org/10.3390/fluids3020029
Zhao L, Shkarayev S, Su E. Aerodynamics of a Wing with a Wingtip Flapper. Fluids. 2018; 3(2):29. https://doi.org/10.3390/fluids3020029
Chicago/Turabian StyleZhao, Longfei, Sergey Shkarayev, and Erlong Su. 2018. "Aerodynamics of a Wing with a Wingtip Flapper" Fluids 3, no. 2: 29. https://doi.org/10.3390/fluids3020029
APA StyleZhao, L., Shkarayev, S., & Su, E. (2018). Aerodynamics of a Wing with a Wingtip Flapper. Fluids, 3(2), 29. https://doi.org/10.3390/fluids3020029