The Effect of CO2 Phase on Oil Displacement in a Sandstone Core Sample


1
Institute for Materials and Processes, School of Engineering, The University of Edinburgh, King’s Buildings, Mayfield Road, Edinburgh EH9 3JL, UK
2
Grant Institute, School of Geoscience, The King’s Buildings, The University of Edinburgh, James Hutton Road, Edinburgh EH9 3FE, UK
*
Author to whom correspondence should be addressed.
Fluids 2018, 3(1), 23; https://doi.org/10.3390/fluids3010023
Submission received: 31 December 2017
/
Revised: 1 March 2018
/
Accepted: 15 March 2018
/
Published: 20 March 2018
Abstract
:CO2 sequestration in saline aquifers and hydrocarbon reservoirs is a promising strategy to reduce CO2 concentration in the atmosphere and/or enhance hydrocarbon production. Change in subsurface conditions of pressure and temperature and CO2 state is likely to have a significant impact on capillary and viscous forces, which, in turn, will have a considerable influence on the injection, migration, displacement, and storage capacity and integrity of CO2 processes. In this study, an experimental investigation has been performed to explore the impact of fluid pressure, temperature, and injection rate, as a function of CO2 phase, on the dynamic pressure evolution and the oil recovery performance of CO2 during oil displacement in a Berea sandstone core sample. The results reveal a considerable impact of the fluid pressure, temperature, and injection rate on the differential pressure profile, cumulative produced volumes, endpoint CO2 relative permeability, and oil recovery; the trend and the size of the changes depend on the CO2 phase as well as the pressure range for gaseous CO2–oil displacement. The residual oil saturation was in the range of around 0.44–0.7; liquid CO2 gave the lowest, and low-fluid-pressure gaseous CO2 gave the highest. The endpoint CO2 relative permeability was in the range of about 0.015–0.657; supercritical CO2 gave the highest, and low-pressure gaseous CO2 gave the lowest. As for increasing fluid pressure, the results indicate that viscous forces were dominant in subcritical CO2 displacements, while capillary forces were dominant in supercritical CO2 displacements. As temperature and CO2 injection rates increase, the viscous forces become more dominant than capillary forces.
1. Introduction
The amounts of oil produced during primary and secondary oil recoveries are around one-third of the original oil in place. The growing world energy demand, decline in the exploration of new oil reservoirs, and maturity of oil fields that produce most of the hydrocarbons are motivating oil companies to develop new enhanced oil recovery techniques [1]. Generally, enhanced oil recovery techniques are categorized into three main methods: thermal, chemical, and gas recovery methods. Thermal recovery methods have their limitations; they are not suitable for heavy oil reservoirs if the formations are thin (<10 m) or too deep (>1000 m) due to heat loss to surrounding formations [2]; they are also not suitable for reservoirs with low permeability and low oil saturation [3]. Chemical flooding methods are a good candidate, but they are generally not implemented because of their high cost.
Recently, application of CO2 for CO2 enhanced oil recovery (CO2-EOR) has gained much momentum as it can be used to enhance oil recovery with the added benefit of reducing CO2 emissions into the atmosphere [4] via CO2 sequestration processes [5]. It is estimated that about 80% of oil reservoirs around the world are good candidates for CO2-EOR processes [6]. The injection of CO2 can increase oil recovery through a number of different processes, firstly by displacing oil that is left behind during water displacement. Moreover, it can enhance oil recovery gradually over years through a number of different mechanisms, including oil swelling, viscosity reduction, capillary impact reduction via CO2–oil interfacial tension (IFT) reduction [7], oil extraction [2,8,9,10], permeability alteration [11], mass transfer through diffusion and dispersion, and miscibility [12]. Oil viscosity can drop significantly by about 90% of its original value upon mixing with the injected CO2 [13,14], increasing its mobility. Oil swelling due to CO2 dissolution can enhance oil recovery by expelling oil out of the matrix and increasing oil volume above the residual saturation, leading more oil to flow. Reduction in residual oil saturation can also be achieved by oil extraction upon exposing the oil to a sufficient flow of CO2-rich gas [7]. However, the evaporation of light components of the oil into CO2 may cause oil to increase in density [7]. It is worth mentioning that the extraction mechanism is inversely related to oil density. Thus, the heavy crude oils are less influenced by this mechanism in comparison to light crude oils [2]. The contribution of each aforementioned mechanism to oil recovery is controlled by the pressure, temperature, and CO2 solubility.
The injected CO2 can displace oils through miscible, near miscible, and immiscible CO2 flooding depending on the pressure and temperature conditions and oil reservoir characteristics [15]. Miscible CO2 processes are the most attractive scenario for oil recovery due to their high displacement efficiency [2]. The dissolution of CO2 in the oil phase can substantially improve oil recovery [2] by avoiding the adverse effect of gas–oil interfacial tension, i.e., eliminating trapping forces [2,14]. However, miscible displacements can only be achieved when the reservoir pressure is higher than the minimum miscibility pressure (MMP), which is not the case for the mature oil fields due to the depletion of energy and the low permeability formations due to the high-differential pressure drop between injector and producer wells [15]. The MMP depends on CO2 purity, temperature, and oil composition [16]; the MMP decreases when the reservoir pressure increases or the reservoir temperature decreases [13]; Yellig and Metcalf observed that increasing CO2 temperature by 1 °F (≈0.56 °C) over a temperature range from 95 to 192 °F (35–89 °C) caused the MMP to increase by approximately 15 psi (1 bar) [13]. Near miscible flooding refers to the process of not having a full miscibility and occurs when CO2 is injected at a pressure slightly below the MMP [15,17]. The main displacement mechanisms are oil swelling, oil viscosity reduction, oil extraction, and IFT reduction that leads to favourable conditions [17,18]. On the other hand, immiscible CO2 flooding is a promising and a field-proven method [19] that occurs when reservoir pressure is less than the MMP. Maximum oil recovery can be achieved with this method when the injected CO2 is sufficient to saturate the oil and water. The key factor that governs the success of the CO2 immiscible displacement is the availability of enough resources of CO2 at low cost [19]. This technique can be used for low-pressure reservoirs (≤1000 m depth) and thin and heavy oil reservoirs (10–25° API and >3000 m depth [20] where thermal recovery processes are generally unsuitable [3,20]), with moderately viscous oils [8], and for some shallow-light oil reservoirs where the pressure needed for miscibility cannot be achieved [19]. This technique can also be deployed with gravity-assisted injection into the top of a reservoir [21].
Due to great variations in subsurface conditions of pressure and temperature, the injected CO2 can exist in a gaseous state in warm coal seams (e.g., Alabama Black Warrior Basin: ∼70 bar, 22.85 °C), a liquid state in permafrosts and marine sediments (e.g., West Sak reservoir: ∼110–125 bar, 23.9 °C), and a supercritical state in deep hot rocks (e.g., Weyburn oil field: ∼140 bar, 49.85 °C) [22,23,24,25,26,27], as shown in Figure 1. An example where the injected CO2 can exist in both gaseous and liquid CO2 state is the mature oil fields of the Illinois Basin (USA) that have underground reservoir temperature close to the critical temperature (31.1 °C) [27].
The displacement of oil by CO2 is controlled by viscous, capillary, gravitational, diffusive, and inertial forces [20]. Some of these forces can be neglected based on the rock-fluid properties and the configuration of the experimental model [20]. Changing CO2 phase is likely to have a strong influence on capillary forces and viscous forces through its impact on the IFT between CO2 and oil [28,29], the mass transfer at the interface, the wettability of the solid surface [30,31], and the viscosity and density of CO2 [32,33]. Thus, the change in CO2 state is likely to have a strong impact on the differential pressure across the sample, entry pressure, CO2 injectivity, CO2 displacement rate, CO2 plume migration, CO2 storage capacity, and CO2 integrity as well as the efficiency of enhanced hydrocarbon recovery [22,34,35]. The CO2 injectivity can help in determining the amount, pace, and period of CO2 injection in subsurface formations [36]. The injectivity and performance of CO2 flood are highly influenced by underground conditions of pressure and temperature as well properties of the rock and fluids in host formations [2,8,35,37]. Therefore, it is of great importance to investigate the impact of CO2 phase as well as the operational conditions on CO2 behaviour during its injection into an oil-saturated porous system.
Since CO2 has been in use for several decades, extensive laboratory studies [38,39], numerical simulations, and field applications of CO2 flooding have been conducted in various light, medium, [40] and heavy oil reservoirs [41]. A review of current literature showed that CO2–oil displacements have been conducted to investigate different topics such as (a) oil displacement efficiency and mechanisms, especially in relation to phase behaviour [10], (b) oil displacement efficiency and mechanisms associated with the injection of liquid CO2 and CO2-foam in heavy crude oil [2], (c) the relation between oil recovery and viscosity [42], (d) the effect of viscous forces, diffusive, and gravitational forces on the CO2 slug (20% hydrocarbon pore volume (HCPV)) for heavy oil recovery processes [20], and (e) the phenomena of reservoir blockage and oil production drop [43].
However, the literature review also revealed that CO2–oil displacements were conducted either under gaseous, liquid, or supercritical CO2 conditions with the exception of a few experiments that were conducted under more than one CO2 state. Sankur [44] performed reservoir condition-gaseous displacements of oil by CO2 and refinery gas for the Wilmington Tar zone CO2 injection project. Their results showed that the injection of CO2 enhances the recovery to a greater extent than that of the refinery gas for continuous or low water alternating gas (WAG). Moradi [45] conducted a numerical simulation to investigate the impact of liquid CO2 injection on oil recovery. Liquid CO2 injection yielded 14.79% oil recovery, which was higher than water flooding and natural depletion by around 3.9% and 8.59%, respectively. Arshad [46] performed supercritical CO2 displacements to study the performance of CO2 miscible flooding in tight oil reservoirs. The average oil recovery ranged from 87 to 96%. Chung [47] performed supercritical CO2 core flooding experiments to examine the technical feasibility of the use of CO2 flooding to enhance the recovery of viscous oil under immiscible displacements conditions. They found that CO2 injection resulted in a higher recovery (66% of original oil in place (OOIP)) in comparison to waterflood (44% of OOIP). In addition, the CO2-alternate-brine injection significantly delayed the breakthrough of gas, produced slightly more oil and was a more efficient in CO2 utilization than continuous injection [47]. Huang [10] performed continuous immiscible supercritical CO2 flooding, at 90 °F (32.2 °C) and 1250 psi (86.2 bar), into Texas oil (36° API) saturated watered-out cores to determine the oil recovery efficiency and improve the understanding of oil recovery mechanisms, especially in relation to phase behaviour. The data showed an oil recovery of 69% and 66% of residual oil from a 6 ft Berea and 20 ft sand-packed core sample, respectively. They attributed the oil recovery mainly to the CO2 swelling and CO2 extraction of oil.
On the other hand, Wang [40] carried out both gaseous and liquid CO2 oil recovery displacements under immiscible and miscible conditions to examine oil recovery and permeability reduction in a tight sandstone reservoir. They noticed that during immiscible flooding, the oil recovery was higher when the fluid pressure was between the onset pressure of asphaltene precipitation and the MMP; nonetheless, the effective permeability reduction of the oil was greater at higher fluid pressure. Cao [48] conducted both immiscible and miscible CO2 floodings into light crude oil saturated tight sandstone core plugs at gaseous and supercritical CO2 conditions. The oil recovery increased monotonically as pressure increased during the immiscible flooding. Liu [5] conducted gaseous and supercritical near-miscible CO2 floodings to examine the displacement front characteristics. The supercritical CO2 displacements gave higher oil recovery in comparison to gaseous displacements. Lashkarbolooki [49] and Bayat [50] investigated the recovery efficiency during the injection of supercritical CO2 and supercritical N2 into a live crude oil. The core-flood experiments showed that supercritical CO2 injection, compared with supercritical N2 injection (8.7% of OOIP), could result in a higher recovery (15.8% of OOIP).
Despite the extensive research on CO2–oil displacements, the analysis of the pressure data in core flooding has been widely overlooked despite its high importance [51]. To the best of the authors’ knowledge, there is no study that has been conducted to investigate the effect of CO2 phase on the dynamic pressure evolution and the oil recovery performance during CO2–oil drainage core floodings. In this study, drainage experiments were performed by injecting pure CO2 into an oil-saturated Berea sandstone core sample to investigate the effect of fluid pressure, temperature, and injection rate on the pressure and production behaviour under gaseous, liquid, and supercritical CO2 conditions, especially focusing on the differential pressure profile, cumulative produced volumes, residual oil saturation, and endpoint effective and relative permeabilities of CO2. The results of this study will provide deep insights into the impact of CO2 phase on the injectivity, displacement efficiency, storage capacity, and integrity of CO2 flooding.
2. Materials and Experimental Setup
A Berea sandstone core sample with a diameter of 2.54 cm and a length of 7.62 cm was used for the unsteady state dynamic drainage experiments (CO2–oil displacements). The average porosity and absolute water permeability of the core sample were about 20% and 28.9 mD, respectively. To calculate the core sample pore volume and porosity, the weight difference between the dry and the wet core sample was used. To calculate the absolute water permeability, the steady differential pressure and the water injection rate was used. To alter the core sample wettability to an oil-wet state, the core sample was aged inside the oil at 80 °C for more than eight months.
2.1. Experimental Setup
The schematic of the experimental core flooding setup for this study is shown in Figure 2. It consists of two high-pressure syringe pumps (Teledyne ISCO, Lincoln, NE, USA) with flow rates ranging from 0.0001 to 25 mL/min for the CO2 injection and the CO2 and oil collection, a water bath (Grant Instruments GD 100) with a precision of ±0.02 °C for controlling the temperature, a core holder, a pressure gauge fixed on the core holder for measuring the confining pressure, an overburden pressure pump (CM400) for obtaining the confining pressure, a vacuum pump (Edwards, Model E2M5) for removing the trapped gas, two pressure transducers (UNIK, 0–100 bar with a precision of ±0.1% of BSL) for recording the pressure at the inlet and outlet side of the core sample, and LabVIEW software (2015, National Instruments Cooperation, London, UK) that was built for acquiring the data from the pressure transducers.
2.2. CO2–Oil Displacement Procedure
The three phases (G, L, and Sc) CO2–oil drainage displacements were performed on an oil-wet Berea sandstone core sample with the following steps:
- (1)
- The core sample was wrapped into a shrinkable Teflon tube followed by a rubber sleeve and then fixed inside the core holder. The core holder was mounted horizontally inside the water bath.
- (2)
- To prevent fluid bypassing, a confining pressure of about 135 bar, which is always higher than the pore pressure, was applied to the core with the confining pump. The temperature was controlled by the heater.
- (3)
- The vacuum pump was connected to the system to remove the trapped gas.
- (4)
- To fully saturate the core sample with oil, about 40–60 pore volumes (PVs) of oil were injected at a high-differential pressure of 80–90 bar.
- (5)
- To obtain heat equilibrium, the water bath temperature was set to the required temperature and the system was left overnight for the temperature to stabilize.
- (6)
- Prior to each flooding experiment, a constant pressure was applied to the entire system using the syringe pump at each end.
- (7)
- After reaching the experimental pressure, the system was left for about 20 min to ensure that temperature stabilization had been achieved throughout the system.
- (8)
- The mode of the injected pump (ISCO pump CO2) was changed from a constant pressure mode to a constant flow rate mode to inject CO2 into the core at a constant injection rate to displace the saturated oil. The injected CO2 volumes and the collected volumes were recorded every 30 s.
- (9)
- During the experiment, the inlet and outlet pressure transducer readings were recorded every 6 s, using the LabVIEW software, in order to calculate the differential pressure across the core sample.
- (10)
- When the experiment was finished, the produced volumes were measured to calculate the residual oil saturation with mass balance. Later, the weight of the core sample was measured using a Sartorius weighing scale with a resolution of 0.0001 g to confirm the residual oil saturation measurements.
3. Results and Discussion
To gain a deep understanding of the effect of CO2 phase on the two-phase flow characteristics of CO2–oil drainage displacements, the inlet and outlet pressure, the outlet CO2 and oil flow rates, the differential pressure profile, the cumulative injected and cumulative produced volumes, the residual oil saturation, and the endpoint effective and relative permeabilities of CO2 were measured and analysed.
The differential pressure profile was obtained by taking the difference between the readings of the pressure transducers at the inlet and outlet sides of the core sample. The most influential forces that govern the differential pressure of a drainage displacement during horizontal injection are the capillary forces and the viscous forces [20]. The capillary forces are governed by the CO2–oil interfacial tension, contact angle, and pore diameter and geometry [52,53,54,55] as well as the saturation of the displacing and displaced fluids. The capillary forces arise from the presence of the interface between the immiscible fluids [53]; they are responsible for the entrapment of one phase by another during immiscible displacements in porous media [54,56]; and they govern the multiphase flow in low permeability rocks and fractured reservoirs [57]. The viscous forces are controlled by the viscosity contrast between the displacing and displaced fluids, injection rate of the injected fluid, the permeability and length of the invaded porous media.
In the literature, various formulations have been suggested to account for the impact of the capillary and viscous forces on the differential pressure profile. Recently, Espinoza and Santamarina [22] proposed the following equation to account for these forces:
where ΔP is the differential pressure across the core sample (Pa). PCO2 and POil are the CO2 and bulk oil pressures, respectively. σCO2–Oil is the CO2–oil interfacial tension (mN/m), d (m) is the diameter of the largest effective pore [58,59,60,61], L (m) is the length of the core sample, l (m) is the length of the CO2 or oil phase inside the core sample, v (m/s) is the fluid velocity in the pores, and µ (Pa·s) is the viscosity of the fluids. The first and second terms on the right-hand side of Equation (1) refers to the Young–Laplace equation and Poiseuille’s equation, respectively [22,62]. The Young–Laplace equation can be used to determine the critical pressure point, which is the excess pressure required for the displacing fluid to invade the core sample for the first time. The non-wetting fluid cannot invade the core sample unless its differential pressure exceeds the critical pressure point [61].
In addition to the Young–Laplace equation, a number of analytical capillary pressure formulations have been used to explain laboratory results [63,64]. Among them, the Leverett’s J-function has been intensively used to convert all the capillary pressure (Pc) data, as a function of the invaded fluid saturation, to a universal curve.
where
where S*g is the effective or normalized gas saturation. a and b are coefficients. is the pore geometry factor or (hydraulic radius), which has a similar dimension to the pore radius and is used to correlate petrophysical properties such as relative permeability and saturation.
In this study, the quasi-differential pressure refers to the differential pressure measured at the end of the displacement experiment. The corresponding time represents the time required to achieve the maximum-differential pressure at the start of the experiment. The data are categorized into three main sections. The first main section deals with the impact of fluid pressure, experimental temperature, and injection rate on the differential pressure profile as a function of CO2 phase. The second and the third sections deal with their impact on the production data profiles including the endpoint effective and relative permeabilities of CO2 and the residual oil saturation as a function of CO2 phase, respectively.
3.1. The Pressure Behavior of CO2–Oil Displacements as a Function of CO2 Phase
This section deals with the impact of fluid pressure, experimental temperature, and injection rate on the differential pressure profile of gaseous, liquid, and supercritical CO2 displacements.
3.1.1. The Effect of Fluid Pressure on the Differential Pressure Profile of CO2–Oil Displacements
Figure 3, Figure 4, Figure 5 and Figure 6 present the impact of increasing fluid pressure on the differential pressure profile of gaseous, liquid, and supercritical CO2–oil drainage displacements. During the experiments, the experimental temperature and CO2 fluid rate were held constant. The data from Figure 3, Figure 4, Figure 5 and Figure 6 reveal three important observations (A, B, and C) that can be identified as follows:
(A) For all fluid pressures, the differential pressure profile is characterized by a high increase followed ba sharp decline; the rate and the magnitude of the increase in the differential pressure profile are dependent on the CO2 phase as well as the fluid pressure for gaseous CO2 displacements. The slope of the reduction in the differential pressure profile decreased over time and is dependent on the CO2 phase and the fluid pressure for the gaseous CO2 displacements. Based on the shape of the differential pressure profile, the data is discussed and analysed in two groups. The first group deals with the low-fluid-pressure GCO2–oil displacements (fluid pressure ≤60 bar), while the second group deals with the high-fluid-pressure GCO2–oil displacements, LCO2–oil displacements, and ScCO2–oil displacements.
(A.1) Figure 3 shows the differential pressure profile of the low-fluid-pressure GCO2 displacements. The differential pressure profile is characterized by a slow but significant increase until its maximum value is reached, after around 1.2 pore volumes (PV) of CO2 was injected; then, it is characterized by a slow and slight reduction over time; with the slope of the reduction decreasing over time. Increasing fluid pressure reduced the magnitude of the entry pressure and its associated time before CO2 breakthrough. For illustration, as the fluid pressure increased from 40 to 60 bar, the entry pressure decreased from 1.196 to 0.883 bar and the associated time reduced from around 12.5 to 7.2 min.
The initial increase in the differential pressure profile was to overcome the fluid entry pressure. The reduction in the entry pressure and the associated time as fluid pressure increases can be related to the reduction in the capillary forces due to the reduction in the interfacial tension, as shown in Figure 7, and the increase in the contact angle, respectively. The slow and slight reduction in the differential pressure over time might indicate a slight and slow change in the effective permeability of CO2 and oil due to the low-efficiency displacement of the CO2–oil experiments performed at low-pressure conditions. The low-efficiency displacement might arise from high capillary forces due to high interfacial tension [65] and high mobility contrast at these conditions.
(A.2) Figure 4, Figure 5 and Figure 6 presents the differential pressure profile of the high-fluid-pressure gaseous, liquid, and supercritical CO2–oil displacements. For all displacements, the differential pressure profile is characterized by a high increase until its maximum-differential pressure value is reached, after the injection of around 0.08–0.155 PVs of CO2, and a steep reduction is then experienced until its quasi-differential pressure value is achieved, after around 0.08–0.155 PVs. The maximum-differential pressure varied with the phase of the injected CO2. Liquid CO2 phase gave the highest magnitudes, while gaseous CO2 phase gave the lowest. The highest maximum differential pressure profile of the LCO2 displacements might be attributed to the fact that liquid CO2 phase is less miscible with oil [2] in comparison to gaseous and supercritical CO2 phases. The result of less miscibility of the liquid CO2 was a lower reduction in the CO2–oil interfacial tension and the oil viscosity when the liquid CO2 phase was injected; thereby, the highest differential pressure was obtained. Nonetheless, it might be proposed that the highest differential pressure of the LCO2–oil displacements was because LCO2 displacements were conducted at 20 °C, while GCO2 and ScCO2 displacements were performed at 33 °C; thus, the large temperature difference, 13 °C, which caused a sharp reduction in oil viscosity, could be responsible for the difference in the differential pressure. However, we believe this is not the reason because the LCO2 displacements performed at 29 °C, as shown in Figure 11, also show much higher differential pressure profile than that of GCO2 and ScCO2 displacements performed at 33 °C, despite the smaller temperature difference between these, which was only 4 °C.
The observed high increase in the differential pressure after the injection of CO2 into the core sample can be associated with the increase in pore pressure due to CO2 invasion [66]. According to Equations (1) and (2), the reduction in the differential pressure can be related to both capillary forces and viscous forces. The reduction in the viscous forces can be related to the combined effect of the relative permeability of CO2 and oil and the replacement of a highly viscous fluid (CO2) with a less viscous one (CO2) [66,67]. The reduction in the capillary forces can be associated with the number of pores that were opened to flow by CO2, as CO2 flooding continued after its breakthrough. This agrees with the findings of Kwelle [68], who found that the resistance of capillary pore to two-phase flow (CO2 and water) is much greater than its resistance to single-phase flow (water or CO2). Thus, as the number of the opened pores increased, the two-phase flow is significantly reduced, and the pore resistance to the injection of CO2 flow is significantly reduced. Therefore, the differential pressure is sharply reduced [68].
(B) The differential pressure profile of the low-fluid-pressure GCO2 displacement is characterized by oscillations that increased with increased fluid pressure; for illustration, as the fluid pressure increased from 40 to 60 bar, the oscillations increased from one to three times over the duration of the experiment, as shown in Figure 3. The appearance of the oscillations in the differential pressure profile can be related to the impact of the capillary forces at the trailing end of the CO2–oil slug [67]. According to Nutt, the impact of capillary forces at the trailing end of a CO2–oil slug is dependent on whether a non-wetting or a wetting fluid is flooded. If a non-wetting fluid (e.g., CO2) is flooded, then the capillary forces will oppose the applied viscous forces. Later, with the diminishing of the viscous pressure drop across the core sample due to the progress of oil depletion, it is possible to reach a point at which the flow of CO2 through non-depleted capillaries is prevented by the capillary forces [67]. Hildenbrand et al. observed that the reduction in the excess pressure in the non-wetting phase after gas breakthrough will ultimately lead to a re-imbibition process for the wetting phase [69]. This re-imbibition process begins with the smallest pores and continues progressively to the larger pores. Consequently, it causes a progressive reduction in the relative permeability of the non-wetting phase because of the successive loss of the interconnected flow paths. In the end, when the last interconnected flow path for the non-wetting phase is closed, the permeability of the non-wetting phase will drop to zero [69]. Figure 8 exhibits this re-imbibition process.
The observed oscillations, in Figure 3 as an example, indicate that as the interconnected flow paths for the non-wetting phase (CO2) were closed, the inlet pressure and hence the differential pressure increased due to the continuous injection of CO2. Once the differential pressure became high enough to overcome the capillary forces, the blocked pores opened to flow, leading to the quick release of accumulated CO2, which, in turn, caused a quick reduction in the differential pressure.
However, increasing the frequency of differential pressure oscillations can be attributed to the reduction in the capillary forces and the increase in gas density. An increasing gas density and decreasing capillary forces mean less time was needed to reach a pressure value that is sufficient to overcome the capillary forces, thus pushing the oil that blocks production out of the sample and in turn increasing the differential pressure oscillation frequency.
Nonetheless, since the CO2–oil displacements can be strongly affected by the capillary end effect and viscous instabilities [35], the appearance of the oscillations might be related to the impact of the capillary retention due to the discontinuity of the capillary pressure [51]. The capillary end effect arises at both the inlet and outlet faces of the core sample, but its severances increase at the outlet face. Müller [35] concluded that the impact of the capillary end effect can never be entirely prevented but can be corrected for it. Rapoport and Leas [70] proposed a scaling coefficient for the minimization of the capillary retention and viscous instabilities effects. According to their formula, the capillary retention can be minimized if the scaling coefficient is greater than one:
(C) Increasing fluid pressure led to an increase in the differential pressure profile for the displacements conducted under subcritical conditions but caused a reduction for the displacements performed at supercritical conditions; the magnitude of the change depends on the CO2 phase and the pressure range for GCO2 displacements. The highest percentage increase occurred in the low-fluid-pressure GCO2 displacements, whilst the lowest occurred in LCO2 displacements.
For low-fluid-pressure GCO2 displacements, increasing the fluid pressure from 40 to 60 bar caused the maximum-differential pressure to increase by around 93% (from 1.196 to 2.306 bar), and the differential pressure at the end of the displacements to rise by around 155% (from 0.411 to 1.049 bar), as shown in Figure 3. However, for high-fluid-pressure GCO2 displacements, increasing the pressure from 65 to 70 bar caused the maximum-differential pressure to increase by around 6% (from 3.248 to 3.438 bar), the quasi-differential pressure to rise by about 30% (from 0.536 to 0.699 bar), and the corresponding time to increase by around 27% (from 1.5 to 1.9 min). For LCO2 displacements, as the pressure increased from 70 to 90 bar, the maximum-differential pressure increased by around 49% (from 3.533 to 5.26 bar), the quasi-differential pressure increased by 37.5% (from 0.272 to 0.374 bar), and the corresponding time increased by around 6.7% from (3 to 3.2 min). On the other hand, increasing pressure from 75 to 90 bar for ScCO2 displacements caused the maximum-differential pressure to decrease by 33.3% (from 2.345 to 1.564 bar), the quasi-differential pressure to decline by around 56% (from 0.134 to 0.059 bar), and the corresponding time to decrease by 36% (from 2.5 to 1.6 min).
According to Equation (1), the observed increase in the differential pressure of the subcritical displacements as fluid pressure increased means that the impact of viscous forces was higher than that of capillary forces. The observed increase in the differential pressure is a combination of the increase in the viscous forces and the reduction in the capillary forces. The increase in the fluid pressure leads to an increase in the viscous forces owing to the increase in the CO2 and oil viscosities and the injection rate inside the core sample due to the expansion effect. The reduction in the capillary forces with increasing fluid pressure is because of the reduction in the CO2–oil interfacial tension [65] and the increase in contact angle [71] due to increasing CO2 solubility [41,72,73]. The highest increase in the differential pressure as pressure increases can be related mainly to the increase in the CO2 injection rate due to expansion. The gas expansion occurs due to the temperature difference between the inside and outside of the water bath [74,75]. The change in density leads to a change in the injection rate inside the core sample. The density ratio (dr) [74] has been used to explain gas expansion and to calculate the injection rate inside core samples. For instance, at an experimental pressure of 40 bar, an injection rate of 1 cm3/min at 20 °C becomes 1.108 cm3/min at 33 °C.
On the other hand, the reduction in the differential pressure of the supercritical CO2 displacements as fluid pressure increased means that the reduction in capillary forces was higher than the increase in viscous forces. According to the J-function (Equation (2)), the reduction in the capillary forces can be related to the reduction in the IFT, the increase in contact angle, and the reduction of CO2 saturation, i.e., increase residual oil recovery. The data from Section 3.3 show that, as pressure increased, the residual oil saturation decreased; therefore, CO2 saturation was not responsible for the reduction in the differential pressure. The interfacial tension decreases with the increase in pressure and the reduction in temperature [41], as shown in Figure 7. No reduction in the differential pressure was observed during the subcritical displacements, despite the reduction in their interfacial tension as pressure increased. This indicates that the reduction in the IFT is not the main factor responsible for the observed reduction in the differential pressure profiles of supercritical CO2 displacements. The only possible factor that causes the reduction in the differential pressure is the contact angle. This agrees with the findings by Yang [30], Liu [76], and Jung and Wan [77]. Yang [30] and Liu [76] observed that supercritical CO2 has a higher ability than gaseous and liquid CO2 to alter reservoir rocks towards less water-wetting. Jung and Wan [77] found that, at a pressure higher than the CO2 critical pressure (larger than 73.8 bar), the contact angle increases sharply with a pressure rise up to 100 bar. Below the critical pressure, or above 100 bar, the contact angle remained fairly constant.
3.1.2. The Effect of Temperature on the Differential Pressure Profile of CO2–Oil Displacements
Figure 9, Figure 10, Figure 11 and Figure 12 show the effect of increasing experimental temperature on the differential pressure profile of gaseous, liquid, and supercritical CO2–oil drainage displacements. The results reveal that increasing temperature led to a reduction in the differential pressure for both subcritical and supercritical displacements. The increase in temperature resulted in the appearance of differential pressure (PD) oscillations for the gaseous and supercritical CO2 displacements but not for the liquid CO2 displacements. The highest reduction in the differential pressure profile as temperature increased occurred in the high-fluid-pressure and then low-fluid-pressure gaseous CO2 displacements, followed by supercritical CO2 and then finally by liquid CO2 displacements.
For low-fluid-pressure GCO2 displacements conducted at 40 bar, increasing the temperature from 33 to 55 °C caused the maximum-differential pressure to decrease by around 69% (from 1.196 to 0.371 bar), the quasi-differential pressure to drop by around 81% (from 0.406 to 0.076 bar), and the corresponding time to decline by 67.5% (from 12.3 to 4 min). However, for high-fluid-pressure GCO2 displacements performed at 70 bar, increasing the temperature from 33 to 55 °C caused the maximum-differential pressure to decrease by around 70.6% (from 3.438 to 1.01 bar), the quasi-differential pressure to decline by 88% (from 0.684 to 0.082 bar), the corresponding time to decrease by about 76% (from 2.9 to 0.7 min), and the differential pressure oscillations to appear for the first time. It should be noted that, as the temperature increased from 45 to 55 °C, the quasi-differential pressure increased slightly by around 17% (from 0.082 to 0.096 bar). This increase might be associated with the appearance of the differential pressure oscillations. The appearance of the oscillations indicates that the 55 °C displacement is characterized by a stronger impact of the capillary forces than the 45 °C displacement; thereby, a high quasi-differential pressure occurred in the 55 °C displacements.
For LCO2 displacements, as the temperature increased from 20 to 29 °C, the maximum-differential pressure decreased by around 7.6% (from 5.26 to 4.858 bar), the quasi-differential pressure declined by around 58% (from 0.365 to 0.154 bar), and the corresponding time dropped by around 37.5% (from 3.2 to 2 min). The slight reduction in the maximum-differential pressure of the liquid CO2 displacements as temperature increased is likely to be associated with the smaller increase in the experimental temperature (20–29 °C), the dense-nature of liquid CO2, and the lower miscibility of liquid CO2 with oil [2] in comparison to that of gaseous and supercritical CO2 displacements.
For ScCO2 displacements, increasing the temperature from 33 to 55 °C caused the maximum-differential pressure to decrease by 28.7% (from 1.564 to 1.115 bar), the quasi-differential pressure to decline by around 54% (from 0.059 to 0.027 bar), the corresponding time to decline by around 56% (from 1.6 to 0.7 min), and the differential pressure oscillations to appear for the first time. The appearance of the differential pressure oscillations as temperature increased can be related to the reduction in the applied viscous forces and the increase in the capillary forces due to the increasing interfacial tension [65,78] and the decreasing contact angle [71]. Importantly, the point at which the capillary forces were insufficient to overcome the viscous forces occurred at 55 °C, leading to the blockage of CO2 production during these oscillations.
According to Equation (1), the reduction in the maximum and quasi-differential pressures as temperature increases is the net result of the increase in capillary forces and the reduction in viscous forces. As temperature increases, capillary forces increase because of the increasing CO2–oil interfacial tension [65,78] and the decreasing contact angle [71] due to the decreasing CO2 solubility [72,73], while the viscous forces decrease because of the decreasing viscosities of oil and CO2. However, the change in CO2 viscosity is likely to have little impact on the reduction in the viscous forces in comparison to that caused by oil viscosity reduction as temperature increased. Increasing temperature caused a large reduction in the viscosity of the oil used in these displacements. The oil sample was provided by the BP Exploration Operating Company Limited, but, due to confidentiality, the specified properties of the oil sample cannot be disclosed. Increasing temperature causes only a slight change in CO2 viscosity; the highest reduction occurred with supercritical CO2 displacement. For illustration, increasing the temperature from 33 to 55 °C causes the CO2 viscosity to (1) increase from 16.187 to 17.07 × [10−6 (Pa·s)] for the 40 bar GCO2 displacement, (2) decrease from 20.743 to 18.9 × [10−6 (Pa·s)] for the 70 bar GCO2 displacement, and (3) decrease from 53.837 to 22.26 × [10−6 (Pa·s)] for the 90 bar SCCO2 displacement. On the other hand, increasing temperature from 20 to 29 °C for the liquid CO2 displacements causes the CO2 viscosity to decrease from 81.56 to 63.902 × [10−6 (Pa·s)] [81].
3.1.3. The Effect of Injection Rate on the Differential Pressure Profile of CO2–Oil Displacements
Figure 13, Figure 14, Figure 15 and Figure 16 show the effect of increasing injection rate on the differential pressure profile of gaseous, liquid and supercritical CO2–oil drainage displacements. The results reveal that the increase in the CO2 injection rate led to a substantial increase in the differential pressure for the displacements conducted at both subcritical and supercritical conditions. The magnitude of the increase in the differential pressure depends on the CO2 phase as well as the fluid pressure range for the gaseous CO2 displacements; the highest increase in the maximum-differential pressure occurred in the ScCO2 displacements, and the lowest in the high-fluid-pressure GCO2 displacements conducted at 70 bar.
For low-fluid-pressure GCO2 displacements (40 bar), increasing the injection rate from 0.4 to 1 mL/min caused the maximum-differential pressure to increase by around 34% (from 1.196 to 1.604 bar), the differential pressure at the end of the displacements to increase by around 166% (from 0.408 to 1.084 bar), and the corresponding time to reduce by around 57% (from 12.3 to 5.3 min). However, for higher-fluid-pressure GCO2 displacements performed at 70 bar, increasing the injection rate from 0.4 to 1 mL/min caused the maximum-differential pressure to increase only by around 4.6% (from 3.438 to 3.597 bar), the quasi-differential pressure to decrease by about 31% (from 0.699 to 0.481 min), and the corresponding time to decrease by 72.4% (from 2.9 to 0.8 min). For LCO2 displacements, as the injection rate increased from 0.4 to 1 mL/min, the maximum-differential pressure increased by about 94% (from 3.533 to 6.847 bar), the quasi-differential pressure declined by around 14.34% (from 0.272 to 0.233 bar), and the corresponding time decreased by around 43.33% (from 3 to 1.7 min). For ScCO2 displacements, increasing the injection rate from 0.4 to 1 mL/min caused the maximum-differential pressure to increase by about 105% (from 1.564 to 3.211 bar), the quasi-differential pressure to increase by 54.24% (from 0.059 to 0.091), and the corresponding time to decline by 50% (from 1.6 to 0.8 min).
According to Equation (1), the increase in the differential pressure can be related to the increase in the applied viscous forces due to the increase in the CO2 injection rate. The observed considerable increase in the differential pressure profile with injection rate increased demonstrates the high impact of viscous forces despite the large viscosity contrast between the displacing fluid (CO2) and the displaced one (oil). The observed reduction in the quasi-differential for high-fluid-pressure GCO2 displacements and LCO2 displacements is likely to be related to the increase in the endpoint relative permeability with the increasing injection rate due to increasing viscous forces [66,82,83].
3.2. The Production Behaviur of CO2–Oil Displacements as a Function of CO2 Phase
This section deals with the impact of fluid pressure and experimental temperature on the cumulative produced volumes and transient outflow rates of CO2 and oil of gaseous, liquid, and supercritical CO2 displacements. To avoid repeatability, the impact of injection rate was not presented as it was similar to that presented in the fluid pressure and temperature sections below.
3.2.1. The Effect of Fluid Pressure on Production Behaviour of CO2–Oil Displacement
Figure 17, Figure 18 and Figure 19 show the impact of increasing fluid pressure on the cumulative produced volumes. In general, increasing fluid pressure caused an increase in the cumulative produced volumes of low-fluid-pressure GCO2 displacements but a reduction in the cumulative produced volumes of high-fluid-pressure GCO2 displacements, LCO2 displacements, and ScCO2 displacements. For GCO2 displacements, increasing fluid pressure reduced the time required to achieve most of the oil production.
The data from Figure 17 show that the increase in fluid pressure results in an increase in the cumulative produced volumes of the low-pressure GCO2–oil displacements. As the fluid pressure increased from 40 to 60 bar, the ratio of the cumulative produced volumes to the cumulative injected volumes at the end of the displacements increased from 0.65 to 0.95. The increase is likely to be related to the increase in displacement efficiency and the impact of gas expansion.
The data from Figure 18, Figure 19 and Figure 20 show that increasing fluid pressure resulted in a decrease in the cumulative produced volumes of high-fluid-pressure GCO2 displacements, LCO2 displacements, and ScCO2 displacements; the highest reduction occurred in the ScCO2 displacements, while the lowest occurred in LCO2 displacements. The cumulative produced volumes of the high-fluid-pressure GCO2 displacements at the end of experiment were higher than the total cumulative injected volumes. On the other hand, the cumulative produced volumes of the LCO2 and ScCO2 displacements were less than the total cumulative injected volumes. The observed reduction in the cumulative produced volumes as fluid pressure increased can be related to the increase in gas compressibility and CO2 solubility [72,73]. As the fluid pressure increased from 65 to 70 bar for the high-pressure GCO2 displacements, the ratio of the total produced volumes to the total injected volumes at the end of displacements decreased from 1.05 to 1.02%. As the fluid pressure increased from 70 to 80 bar and then to 90 bar for the LCO2 displacements, the ratio of the total produced volumes to the total injected volumes at the end of displacements decreased from 92.6 to 91.6% and then to around 90.6%. This means that every 10 bar increase in fluid pressure led to about a 1% reduction in production volumes. However, as the fluid pressure increased from 75 to 80 bar sand then to 90 bar for the ScCO2 displacements, the ratio of the total produced volumes to total injected volumes at the end of displacements decreased from 99.5 to 97.5% and then to around 91.5%. It is worth noting that the increase in the cumulative produced volumes occurred only during the first period, and later the injection and production profiles became equal. The equality between the injection and production profiles suggests that the produced CO2 shrinks to its normal volume after leaving the water bath, causing no increase in the produced volumes. Thus, the increase in the cumulative produced volumes can be related to oil production, which mainly occurred during the early stages of the experiments. The equality between the injection and production profiles can be used as an indicator to show when most of the oil production occurred.
The data from Figure 17 and Figure 18 show that increasing fluid pressure results in a decrease in the time required to achieve most of the oil production, from around 20–25 min for the low-fluid-pressure GCO2 experiments (40 and 60 bar) to around 5 min for the high-fluid-pressure GCO2 experiments (65 and 70 bar). After most of the oil production has occurred, the cumulative produced volumes and the cumulative injected CO2 volumes show a constant linear trend with time. For the low-pressure GCO2 experiments conducted at 40 bar, the production profile is characterized by a slight increase during the first 25.5 min followed by a constant linear trend. On the other hand, the production profile of the 60 bar GCO2 displacements is characterized by a continuous increase over time. The main reason behind the highest reductions in the corresponding times and the increase in cumulative produced volumes over time, with the increase in fluid pressure, is the increase in displacement efficiency and CO2 density. Increasing CO2 density means less time was required to reach the differential pressure required for the injected CO2 to enter the core sample at the first time.
3.2.2. The Effect of Experimental Temperature on the Differential Pressure Profile of CO2–Oil Displacements
Figure 21, Figure 22, Figure 23 and Figure 24 show the impact of increasing temperature on the cumulative produced volumes. The results reveal that increasing temperature caused an increase in the cumulative produced volumes.
The data from Figure 21 show that the cumulative produced volumes of low-fluid-pressure GCO2 displacements (40 bar) were less than the cumulative injected volumes. On the other hand, the cumulative produced volumes of high-fluid-pressure GCO2 displacements (70 bar) were higher than the cumulative injected volume, as shown in Figure 22. The increase in temperature caused an increase in the cumulative produced volumes. Increasing the temperature from 45 to 55 °C for the low-fluid-pressure GCO2 displacements (40 bar) caused the ratio of the cumulative produced volumes to the cumulative injected volumes at the end of the displacements to increase from 0.51 to 0.55; nonetheless, the displacement conducted at 33 °C showed the highest ratio (0.65), the reason is not clear. As the temperature increased for the high-fluid-pressure GCO2 displacements (70 bar), the ratio of the cumulative produced volumes to the cumulative injected volumes at the end of the displacements were 1.02, 1.04, and 1.07 for the displacements conducted at 33, 45, and 55 °C, respectively. The observed increase in the cumulative produced volumes as temperature increased can be related to increases in displacement efficiency and decreases in gas compressibility and solubility.
The data from Figure 23 show that the cumulative produced volumes during LCO2 displacements were less than the cumulative injected volumes. Nevertheless, the increase in temperature caused a very slight increase in the cumulative produced volumes. At the end of the displacements, the ratio of the cumulative produced volumes to the cumulative injected volumes were 0.914, and 0.918 for the displacements performed at 20 and 29 °C, respectively. This slight increase might reflect the lower sensitivity of liquid CO2 to pressure and temperature changes in comparison with gaseous and supercritical CO2 displacements.
The data from Figure 24 show that, for ScCO2 displacements, increasing the temperature from 33 to 55 °C caused a substantial increase in the cumulative produced volumes. At the end of the displacements, the ratio of the cumulative produced volumes to the cumulative injected volumes were 0.915 and 1.06 for the displacements performed at 33 and 55 °C, respectively. As temperature increased, the behaviour of supercritical CO2 became very similar to that of high-pressure gaseous CO2 displacements, as shown in Figure 22, as the cumulative produced volumes for both displacements were much higher than the cumulative injected volumes.
3.3. The Effect of Fluid Pressure, Temperature, and Injection Rate on Endpoint Effective (Relative) Permeability and Residual Oil Saturation as a Function of CO2 Phase
Effective permeability of CO2 is of practical interest for CO2 sequestration in subsurface formations [84]. Relative permeability of gas–oil is particularly important in reservoirs that are characterized by gas drive, gas cap expansion, or gas injection [82]. Relative permeability data is a key factor for the determination of the efficiency, integrity, injectivity, and plume migration of CO2 sequestration process [35,85] as well as for the designing and making decisions for reservoir improvement [86], fluid flow in porous media [87], breakthrough time [7], and mobility of the displacing and displaced fluids [7,35]. The mobility of the fluids governs the injection rate and pressure increase during CO2 injection, as well as the distance that the displacing fluid (CO2) and displaced (e.g., oil or brine) can travel from the injection point through the formation [35]. The change in CO2 state is likely to change the mobility of the fluids due to its impact on viscosity and potentially its influence on relative permeability. In this study, when the flooding experiment was finished, the volume of the produced oil was measured, and the residual oil saturation was calculated. The average differential pressure and the average CO2 outflow rate of the last period were used to calculate the endpoint effective (KfCO2) and relative permeabilities (KrCO2) of CO2 using Darcy’s law [66,83]. Then, the core sample was weighed to confirm the calculated residual oil saturation (Sor). The CO2 viscosity at the fluid pressure and the experimental temperature was calculated using the Peace software website [81].
The data from Table 1 shows that the Sor was in ranges of 0.65–0.7, 0.56–0.6, 0.49–0.59, and 0.44-0.56 for the low-fluid-pressure GCO2–oil displacements, high-fluid-pressure GCO2–oil displacements, ScCO2–oil displacements, and LCO2–oil displacements, respectively. The lowest recovery occurred in the low-fluid-pressure GCO2–oil displacements, whilst the highest oil recovery occurred in the LCO2–oil displacements. The data demonstrate the impact of CO2 phase and the operational conditions on oil recovery. The amount of oil recovery depends on many factors, including relative permeability, wetting conditions, viscous fingering, gravity tonguing, channelling, amount of crossflow/mass transfer [86], mobility ratio, and capillary number [88]. The change in CO2 phase and the operational conditions are likely to have an influence on most of the listed factors, leading to their impact on the displacement efficiency. The highest recovery with liquid CO2 phase can be associated with its highest capillary number (due to its highest viscous forces and lowest capillary forces), lowest mobility ratio, and potentially its most stable front displacement in comparison to that of gaseous and supercritical CO2 phases. The highest viscous forces and the lowest mobility ratio of the liquid CO2 phase in comparison to that of gaseous and supercritical CO2 phases can be associated with its highest viscosity, while the lowest capillary forces of the liquid CO2 phase can be related to its lowest IFT, providing a constant contact angle for the three phases of CO2. For illustration, for LCO2 displacements conducted at 90 bar and 29 °C, GCO2 displacements performed at 70 bar and 33 °C, and ScCO2 displacements conducted at 90 bar and 33 °C, the viscosity of the LCO2, GCO2, and ScCO2 phases is 63.902, 20.743, and 53.837 × [10−6 (Pa·s)], respectively [81]. The CO2–oil IFT decreases as pressure increases due to increases in CO2 solubility and increases as temperature increases due to decreases in CO2 solubility [41]. Therefore, the CO2–oil IFT of LCO2 displacement is less than that of GCO2 displacements, due to its higher pressure and lower temperature, as well as less than that of ScCO2 displacements due to its lower temperature.
On the other hand, Table 1 reveals that the KrCO2 was in ranges of 0.015–0.1, 0.034–0.412, 0.144–0.657, and 0.079–0.281 for the low-fluid-pressure GCO2–oil displacements, high-fluid-pressure GCO2–oil displacements, ScCO2–oil displacements, and LCO2–oil displacements, respectively. This data also demonstrates the impact of CO2 phase and the operational conditions on the endpoint CO2 relative permeabilities. In general, the lowest KrCO2 was observed in the low-fluid-pressure GCO2–oil displacements, whilst the highest was obtained in the ScCO2 displacements. The data show also a wide range of endpoint CO2 relative permeabilities from low to high values. The change in relative permeability with CO2 phase and operational conditions can be related to their potential strong influence on the capillary number, viscous forces, capillary forces, flow regimes [82,89], and capillary end effect; thus, in turn, the CO2 phase and operational conditions will have a strong impact on relative permeability data [76,87,90]. Bennion and Bachu [90], Liu [76], and Parvazdavani [87] observed an impact for the operational conditions on relative permeability.
On the other hand, the observed lowest endpoint relative permeabilities of the low-pressure GCO2–oil displacements are likely to be related to the impact of high capillary forces and low viscous forces, due to their higher interfacial tension and lower viscosity, in comparison to the other displacements. Nevertheless, the highest KrCO2 of ScCO2–oil displacements is likely to be associated with the highest ability of the supercritical CO2 phase to alter the wettability towards less water-wetting status in comparison to gaseous and liquid CO2 phases [30,76] (for more information, see Section 3.1). Generally, the observed low endpoint CO2 relative permeability and the wide range of the endpoint CO2 relative permeabilities agree well with the findings of Moortgat et al. [7], Parvazdavani et al. [87], and Müller [35]. The results of Moortgat et al.’s simulation study suggest that the KrCO2 of the CO2-rich phase may be lower than that of the oil phase [7]. However, the results of Parvazdavani et al.’s experimental and modelling study reveal a wide range of GCO2 endpoint relative permeabilities depending on the pressure range and the core sample origin; for illustration, they found that increasing the pressure from 500 psi (34.5 bar) to 800 psi (55 bar) caused the KrCO2 to range from 0.34 to 0.68 for the sandstone sample and from 0.25 to 0.56 for the dolomite sample [87]. The comparison of Müller for relative permeabilities of SCO2–brine systems showed a wide range of relative permeability data that vary between 0.07 and 1 [35].
The data from Table 1 show that increasing fluid pressure caused the KrCO2 of liquid CO2 to decrease by about 0.017 and that of gaseous and supercritical CO2 to increase by 0.034 and 0.261, respectively. On the other hand, increasing the fluid pressure resulted in a decrease in the residual oil saturation of the subcritical CO2 phases by 0.12 and 0.11, respectively; however, this led to an increase in the residual oil saturation of the supercritical CO2 phase by 0.04. It is worth mentioning that, for the GCO2 experiments, the displacement conducted at 65 bar experienced the highest KrCO2, which might be related to its highest gas expansion impact and low capillary forces in comparison to low-fluid-pressure GCO2 displacements; the highest expansion impact is due to its highest density reduction as CO2 entered the water bath (see Section 3.1.1). However, in the ScCO2 experiments, the displacement conducted at 80 bar experienced the lowest endpoint CO2 relative permeability and the lowest residual oil saturation; the reason for this is not entirely clear. The increase in the viscous forces can explain the observed increase in the relative permeability for gaseous and supercritical CO2 displacement, but not the reduction for liquid CO2 displacement. The reason for the reduction might be related to the increasing dissolution of liquid CO2 in oil as pressure increased, which could result in a reduction in the amount of the free movable liquid CO2, thus reducing its relative permeability. The increase in gaseous permeability as fluid pressure increased agrees with the finding of Parvazdavani et al. [87], who observed that increasing fluid pressure for GCO2–oil displacements led to a high increase in the relative permeability of GCO2 [87]. On the other hand, the reduction and increase in the residual oil saturation with subcritical CO2 phases and supercritical CO2 phase, respectively, can be associated with the observed increase and decrease in the differential pressure, as shown in
Figure 3, Figure 4, Figure 5 and Figure 6. The increase and reduction in the differential pressure were related to viscous and capillary forces (for more information, see Section 3.1.1). Therefore, the reduction in the residual oil saturation as fluid pressure increased in the case of the subcritical CO2 phases can be associated with the increase in the viscous forces and the reduction in mobility ratio. However, the increase in residual oil saturation as fluid pressure increased in the case of the supercritical CO2 might be related to the reduction in capillary forces; this indicates that capillary forces complemented viscous forces; thereby, its reduction led to a reduction in oil production [67]. The results indicate that viscous forces were dominant in subcritical CO2 displacements, while capillary forces were dominant in supercritical CO2 displacements.
Increasing the experimental temperature caused the KrCO2 of the three CO2 phases to increase by 0.084, 0.085, 0.378, and 0.024 for the LCO2, the low-fluid-pressure GCO2, and the high-fluid-pressure GCO2 and ScCO2 displacements, respectively. On the other hand, increasing the experimental temperature caused the residual oil saturation to increase by 0.12 for LCO2 displacements. Nevertheless, it led to a decrease in the residual oil saturation by 0.05, 0.02, and 0.06 for the low-fluid-pressure GCO2 and high-fluid-pressure GCO2 and ScCO2 displacements, respectively. It should be noted that, for the 70 bar GCO2 displacements, increasing temperature from 45 to 55 °C reduced the endpoint CO2 relative permeability from 0.412 to 0.342; this reduction could be associated with the appearance of differential pressure oscillations, as shown in Figure 10. The increase in relative permeability as temperature increased could be associated with the increase in the CO2 injection rate [82,89] due to expansion effect (see Section 3.1.2). Skauge [82] and Rostami [89] observed that the increase in the displacement velocity leads to a higher gas relative permeability and can slightly affect the oil relative permeability [82,89]. The reduction in the residual saturation of the LCO2 displacements can be associated with the reduction in differential pressures due to increasing temperature, as shown in Figure 9, Figure 10, Figure 11 and Figure 12. That is, the increase in the residual oil saturation as temperature increased can be associated with the reduction in the viscous forces in the case of liquid CO2 phase. However, the reduction in the residual oil saturation, i.e., increasing displacement efficiency, as temperature increased in the case of gaseous and supercritical CO2 phases might be related to the reduction in oil viscosity as well as the increase in CO2 injection rate inside the core sample because of the gas expansion impact. Increasing displacement efficiency can be seen through the increase in the cumulative produced volumes of gaseous and supercritical CO2 phases as temperature increased (see Figure 22 and Figure 24).
Increasing the injection rate caused the KrCO2 of the three CO2 phases to increase by 0.185, 0.09, and 0.252 for the LCO2 and high-fluid-pressure GCO2 and ScCO2 displacements, respectively. In addition, increasing the injection rate led to the reduction of the residual oil saturation of the three CO2 phases by 0.07, 0.02, 0.03, 0.1 for the LCO2, low-pressure GCO2, and high-fluid-pressure GCO2 and ScCO2 displacements, respectively. It should be noted that, as injection rate increased from 0.4 to 1 mL/min for the low-pressure GCO2 (40 bar), the KrCO2 experienced no change. The increase in the differential pressure due to increasing viscous forces could be the reason behind the increase in KrCO2 [66,83] and the reduction in the residual oil saturation with increasing injection rate [82].
4. Conclusions
In this paper, the effect of fluid pressure, temperature, and injection rate on CO2 behaviour during the flooding of an oil-saturated Berea sandstone core sample has been investigated as a function of CO2 phase. The results indicate that fluid pressure, experimental temperature, and injection rate significantly influence the differential pressure profile, cumulative produced volumes, endpoint CO2 relative permeability, and oil recovery. The trend and the size of the changes depend on the CO2 phase as well the pressure range for GCO2 displacements. The data indicate that, as fluid pressure increases, the capillary forces have a stronger impact on the differential pressure profile of supercritical CO2–oil displacements than that on subcritical CO2–oil displacements. As temperature and injection rates increased, the viscous forces become more dominant than capillary forces.
In summary, for all fluid pressures, temperature, and injection rates, the differential pressure profile is characterized by a strong increase, followed by a high reduction until it reached the value of quasi-differential pressure; the rate of the increase and reduction in the differential pressure depends on the CO2 phase and the pressure range for the GCO2 displacements. In general, liquid CO2 phase gave the highest differential pressure magnitude, while gaseous CO2 phase gave the lowest. Increasing fluid pressure caused an increase in the differential pressure profile of subcritical CO2 displacements but a reduction in that of supercritical CO2 displacements; the magnitude of the change in the differential pressure depends on the CO2 phase and the pressure range of GCO2 displacements. The highest percentage increase occurred in low-fluid-pressure GCO2 displacements, whilst the lowest occurred in LCO2 displacements. In addition, increasing fluid pressure for low-pressure GCO2 displacements increased the frequency of the differential pressure oscillations and reduced the entry pressure and its associated time. Increasing temperature caused a reduction in the differential pressure profile for the three CO2 phases along with the appearance of the pressure oscillations in the case of gaseous and supercritical CO2 displacements. The magnitude of this reduction in the differential pressure depends on the CO2 phase and the pressure range for the GCO2 displacements; the highest reduction occurred in high-fluid-pressure GCO2 displacements, while the lowest occurred in LCO2 displacements. The increase in injection rate caused a substantial increase in the differential pressure of the three CO2 phases with the highest percentage increase occurred in the ScCO2 displacements and the lowest in the high-fluid-pressure GCO2 displacements conducted at 70 bar.
The increase in fluid pressure caused an increase in the cumulative produced volumes of low-fluid-pressure GCO2 displacements, but a reduction in those of high-fluid-pressure GCO2, LCO2, and SCO2 displacements; the largest reduction occurred in the ScCO2 displacements, while the lowest occurred in the LCO2 displacements; increasing fluid pressure reduced the time required to achieve the majority of the oil production. However, increasing temperature caused an increase in the cumulative produced volumes; the lowest increase occurred in LCO2–oil displacements.
The residual oil saturation was in the range of around 0.44–0.7; liquid CO2 gave the lowest, and low-fluid-pressure gaseous CO2 gave the highest. The endpoint CO2 relative permeability was in the range of about 0.015–0.657; supercritical CO2 gave the highest, and low-pressure gaseous CO2 gave the lowest. Increasing fluid pressure caused the endpoint relative permeability of liquid CO2 to decrease, but that of gaseous and supercritical CO2 to increase. However, increasing fluid pressure caused the residual oil saturation to decrease for the subcritical CO2 displacements but to decrease for the supercritical CO2 displacements. Increasing the experimental temperature caused the endpoint relative permeability of the three CO2 phases to increase. However, increasing the experimental temperature caused the residual oil saturation to increase for liquid CO2 displacements but to decrease for gaseous and supercritical CO2 displacements. Increasing the injection rate caused the endpoint relative permeability of the three CO2 phases to increase and the residual oil saturation to decrease.
Acknowledgments
The authors wish to thank the Higher Committee for Education Development in Iraq and the Ministry of Oil in Iraq for their sponsorship of the first author PhD study and Edlmann acknowledges the support of the European Union’s H2020 programme under Grant Agreement No. 636811.
Author Contributions
Ebraheam Al-Zaidi and Xianfeng Fan conceived and designed the experiments, Ebraheam Al-Zaidi performed the experiments and analysed the data. Ebraheam Al-Zaidi, Katriona Edlmann, and Xianfeng Fan contributed to the interpretation of the results. Ebraheam Al-Zaidi took the lead writing the manuscript with support from Katriona Edlmann and Xianfeng Fan, with all authors providing critical feedback to shape the analysis and manuscript.
Conflicts of Interest
The authors declare no conflict of interest.
References
- Alvarado, V.; Manrique, E. Enhanced oil recovery: An update review. Energies 2010, 3, 1529–1575. [Google Scholar] [CrossRef]
- Emadi, A.; Sohrabi, M.; Farzaneh, S.A.; Ireland, S. (Eds.) Experimental Investigation of Liquid-CO2 and CO2-Emulsion Application for Enhanced Heavy Oil Recovery. In Proceedings of the EAGE Annual Conference & Exhibition incorporating SPE Europec, London, UK, 10–13 June 2013; Society of Petroleum Engineers: Houston, TX, USA, 2013. [Google Scholar]
- Srivastava, R.; Huang, S.; Dyer, S.; Mourits, F. (Eds.) Heavy oil recovery by subcritical carbon dioxide flooding. In Proceedings of the SPE Latin America/Caribbean Petroleum Engineering Conference, Buenos Aires, Argentina, 27–29 April 1994; Society of Petroleum Engineers: Houston, TX, USA, 1994. [Google Scholar]
- Tahmasebi, P.; Sahimi, M.; Kohanpur, A.H.; Valocchi, A. Pore-scale simulation of flow of CO2 and brine in reconstructed and actual 3D rock cores. J. Petrol. Sci. Eng. 2017, 155, 21–33. [Google Scholar] [CrossRef]
- Liu, Y.; Teng, Y.; Jiang, L.; Zhao, J.; Zhang, Y.; Wang, D.; Song, Y. Displacement front behavior of near miscible CO2 flooding in decane saturated synthetic sandstone cores revealed by magnetic resonance imaging. Magn. Resonance Imaging 2017, 37, 171–178. [Google Scholar] [CrossRef] [PubMed]
- Vega, B.; Kovscek, A.R. Carbon dioxide (CO2) sequestration in oil and gas reservoirs and use for enhanced oil recovery (EOR). In Developments and Innovation in Carbon Dioxide (CO2) Capture and Storage Technology; Woodhead Publishing: Sawston, UK, 2010; Volume 2, pp. 104–126. [Google Scholar]
- Moortgat, J.B.; Firoozabadi, A.; Li, Z.; Espósito, R.O. CO2 injection in vertical and horizontal cores: Measurements and numerical simulation. SPE J. 2013, 18, 331–344. [Google Scholar] [CrossRef]
- Klins, M.A.; Ali, S.M.F. Heavy Oil Production by Carbon Dioxide Injection. J. Can. Petrol. Technol. 1982, 21. [Google Scholar] [CrossRef]
- Todd, M.; Grand, G. Enhanced oil recovery using carbon dioxide. Energy Conv. Manag. 1993, 34, 1157–1164. [Google Scholar] [CrossRef]
- Huang, E.T.; Tracht, J.H. (Eds.) The displacement of residual oil by carbon dioxide. In Proceedings of the SPE Improved Oil Recovery Symposium, Tulsa, Oklahoma, 22–24 April 1974; Society of Petroleum Engineers: Houston, TX, USA, 1974. [Google Scholar]
- Spivak, A.; Garrison, W.H.; Nguyen, J.P. Review of an immiscible CO2 project, tar zone, fault block V, Wilmington field, California. SPE Reserv. Eng. 1990, 5, 155–162. [Google Scholar] [CrossRef]
- Hao, H.; Hou, J.; Zhao, F.; Song, Z.; Hou, L.; Wang, Z. Gas channeling control during CO2 immiscible flooding in 3D radial flow model with complex fractures and heterogeneity. J. Pet. Sci. Eng. 2016, 146 (Suppl. C), 890–901. [Google Scholar] [CrossRef]
- Yellig, W.; Metcalfe, R. Determination and Prediction of CO2 Minimum Miscibility Pressures. J. Pet. Technol. 1980, 32, 160–168. [Google Scholar] [CrossRef]
- Tran, T.Q.M.D.; Neogi, P.; Bai, B. Stability of CO2 Displacement of an Immiscible Heavy Oil in a Reservoir. SPE J. 2017, 22. [Google Scholar] [CrossRef]
- Ren, B.; Xu, Y.; Ren, S.; Li, X.; Guo, P.; Song, X. (Eds.) Laboratory assessment and field pilot of near miscible CO2 injection for IOR and storage in a tight oil reservoir of ShengLi Oilfield China. In Proceedings of the SPE Enhanced Oil Recovery Conference, Kuala Lumpur, Malaysia, 9–21 July 2011; Society of Petroleum Engineers: Houston, TX, USA, 2011. [Google Scholar]
- Stalkup, F. Carbon dioxide miscible flooding: Past, present, and outlook for the future. J. Petrol. Technol. 1978, 30, 1102–1112. [Google Scholar] [CrossRef]
- Bui, L.H. Near Miscible CO2 Application to Improve Oil Recovery. Ph.D. Thesis, University of Kansas, Lawrence, KS, USA, 2010. [Google Scholar]
- Shyeh-Yung, J. (Ed.) Mechanisms of miscible oil recovery: Effects of pressure on miscible and near-miscible displacements of oil by carbon dioxide. In Proceedings of the SPE Annual Technical Conference and Exhibition, Dallas, TX, USA, 6–9 October 1991; Society of Petroleum Engineers: Houston, TX, USA, 1991. [Google Scholar]
- Khatib, A.K.; Earlougher, R.C.; Kantar, K. CO2 Injection As An Immiscible Application For Enhanced Recovery In Heavy Oil Reservoirs. 1981/1/1/. In Proceedings of the SPE California Regional Meeting, Bakersfield, CA, USA, 25–27 March 1981; Society of Petroleum Engineers: Houston, TX, USA, 1981. [Google Scholar]
- Rojas, G.; Ali, S. Dynamics of subcritical CO2/brine floods for heavy-oil recovery. SPE Reserv. Eng. 1988, 3, 35–44. [Google Scholar] [CrossRef]
- Hatchell, D.; Benson, S. Examining the Potential of Immiscible CO2 for Gravity-assisted Enhanced Oil Recovery and Storage. Energy Procedia 2017, 114, 6980–6988. [Google Scholar] [CrossRef]
- Espinoza, D.N.; Santamarina, J.C. Water-CO2-mineral systems: Interfacial tension, contact angle, and diffusion—Implications to CO2 geological storage. Water Resour. Res. 2010, 46. [Google Scholar] [CrossRef]
- Bachu, S. Sequestration of CO2 in geological media: Criteria and approach for site selection in response to climate change. Energy Conv. Manag. 2000, 41, 953–970. [Google Scholar] [CrossRef]
- Saraji, S.; Piri, M.; Goual, L. The effects of SO2 contamination, brine salinity, pressure, and temperature on dynamic contact angles and interfacial tension of supercritical CO2/brine/quartz systems. Int. J. Greenh. Gas Control 2014, 28, 147–155. [Google Scholar] [CrossRef]
- Sohrabi, M.; Jamiolahmady, M.; Al Quraini, A. (Eds.) Heavy Oil Recovery by Liquid CO2/Water Injection. In Proceedings of the EUROPEC/EAGE Conference and Exhibition, London, UK, 11–14 June 2007; Society of Petroleum Engineers: Houston, TX, USA, 2007. [Google Scholar]
- Nourpour Aghbash, V.; Ahmadi, M. (Eds.) Evaluation of CO2-EOR and Sequestration in Alaska West Sak Reservoir Using Four-Phase Simulation Model. In Proceedings of the SPE Western Regional Meeting, Bakersfield, CA, USA, 21–23 March 2012; Society of Petroleum Engineers: Houston, TX, USA, 2012. [Google Scholar]
- Frailey, S.M.; Grube, J.P.; Seyler, B.; Finley, R.J. (Eds.) Investigation of liquid CO2 sequestration and EOR in low temperature oil reservoirs in the Illinois basin. In Proceedings of the SPE/DOE Symposium on Improved Oil Recovery, Tulsa, OK, USA, 17–21 April 2004; Society of Petroleum Engineers: Houston, TX, USA, 2004. [Google Scholar]
- Bachu, S.; Bennion, D.B. Interfacial tension between CO2, freshwater, and brine in the range of pressure from (2 to 27) MPa, temperature from (20 to 125) °C, and water salinity from (0 to 334,000) mg·L−1. J. Chem. Eng. Data 2008, 54, 765–775. [Google Scholar] [CrossRef]
- Chun, B.-S.; Wilkinson, G.T. Interfacial tension in high-pressure carbon dioxide mixtures. Ind. Eng. Chem. Res. 1995, 34, 4371–4377. [Google Scholar] [CrossRef]
- Yang, D.; Tontiwachwuthikul, P.; Gu, Y. Interfacial interactions between reservoir brine and CO2 at high pressures and elevated temperatures. Energy Fuels 2005, 19, 216–223. [Google Scholar] [CrossRef]
- Chi, S.; Morsi, B.; Klinzing, G.; Chiang, S. Study of interfacial properties in the liquid carbon dioxide-water-coal system. Energy Fuels 1988, 2, 141–145. [Google Scholar] [CrossRef]
- Plug, W.-J.; Bruining, J. Capillary pressure for the sand–CO2–water system under various pressure conditions. Application to CO2 sequestration. Adv. Water Resour. 2007, 30, 2339–2353. [Google Scholar] [CrossRef]
- Suekane, T.; Ishii, T.; Tsushima, S.; Hirai, S. Migration of CO2 in Porous Media Filled with water. J. Therm. Sci. Technol. 2006, 1, 1–11. [Google Scholar] [CrossRef]
- Riazi, M.; Sohrabi, M.; Bernstone, C.; Jamiolahmady, M.; Ireland, S. Visualisation of mechanisms involved in CO2 injection and storage in hydrocarbon reservoirsand water-bearing aquifers. Chem. Eng. Res. Des. 2011, 89, 1827–1840. [Google Scholar] [CrossRef]
- Müller, N. Supercritical CO2-brine relative permeability experiments in reservoir rocks—Literature review and recommendations. Transp. Porous Media 2011, 87, 367–383. [Google Scholar] [CrossRef]
- Mijic, A.; LaForce, T.C.; Muggeridge, A.H. CO2 injectivity in saline aquifers: The impact of non-Darcy flow, phase miscibility, and gas compressibility. Water Resour. Res. 2014, 50, 4163–4185. [Google Scholar] [CrossRef]
- Kang, S.; Gao, C.; Zhang, S. Scientific Research and Field Application of CO2 Immiscible Flooding in Heavy Oil Recovery. 2013/7/2/. In Proceedings of the SPE Enhanced Oil Recovery Conference, Kuala Lumpur, Malaysia, 2–4 July 2013; Society of Petroleum Engineers: Houston, TX, USA, 2013. [Google Scholar]
- Rathmell, J.; Stalkup, F.; Hassinger, R. (Eds.) A laboratory investigation of miscible displacement by carbon dioxide. In Proceedings of the Fall Meeting of the Society of Petroleum Engineers of AIME, New Orleans, LA, USA, 3–6 October 1971; Society of Petroleum Engineers: Houston, TX, USA, 1971. [Google Scholar]
- Beeson, D.M.; Ortloff, G.D. Laboratory Investigation of the Water-Driven Carbon Dioxide Process for Oil Recovery. J. Petrol. Technol. 1959, 11, 63–66. [Google Scholar] [CrossRef]
- Wang, X.; Gu, Y. Oil Recovery and Permeability Reduction of a Tight Sandstone Reservoir in Immiscible and Miscible CO2 Flooding Processes. Ind. Eng. Chem. Res. 2011, 50, 2388–2399. [Google Scholar] [CrossRef]
- Jha, K. A laboratory study of heavy oil recovery with carbon dioxide. J. Can. Petrol. Technol. 1986, 25. [Google Scholar] [CrossRef]
- Klins, M.A.; Ali, S.M.F. Oil Production in Shallow Reservoirs By Carbon Dioxide Injection. 1981/1/1/. In In Proceedings of the SPE Eastern Regional Meeting, Columbus, Ohio, 4–6 November 1981; Society of Petroleum Engineers: Houston, TX, USA, 1981. [Google Scholar]
- Tuo, Z.; Xuewei, L.; Zhengming, Y.; Xizhe, L.; Shuying, W. Experimental analysis on reservoir blockage mechanism for CO2 flooding. Petrol. Explor. Dev. 2015, 42, 548–553. [Google Scholar]
- Sankur, V.; Creek, J.L.; Di Julio, S.S.; Emanuel, A.S. A Laboratory Study of Wilmington Tar Zone CO2 Injection Project. SPE Reserv. Eng. 1986, 1, 95–104. [Google Scholar] [CrossRef]
- Moradi, B.; Awang, M.; Sabil, K.; Shoushtari, M.; Moradi, P.; Ajdari, H.; Shuker, M.T. (Eds.) Liquid carbon dioxide flooding in low temperature oil reservoirs. In Proceedings of the SPE Asia Pacific Oil and Gas Conference and Exhibition, Jakarta, Indonesia, 22–24 October 2013; Society of Petroleum Engineers: Houston, TX, USA, 2013. [Google Scholar]
- Arshad, A.; Al-Majed, A.A.; Menouar, H.; Muhammadain, A.M.; Mtawaa, B. Carbon Dioxide (CO2) Miscible Flooding in Tight Oil Reservoirs: A Case Study. 2009/1/1/. In Proceedings of the SPE Kuwait International Petroleum Conference and Exhibition, Kuwait City, Kuwait, 14–16 December 2009; Society of Petroleum Engineers: Houston, TX, USA, 2009. [Google Scholar]
- Chung, F.; Jones, R.; Burchfield, T. (Eds.) Recovery of viscous oil under high pressure by CO2 displacement: A laboratory study. In Proceedings of the International Meeting on Petroleum Engineering, Tianjin, China, 1–4 November 1988; Society of Petroleum Engineers: Houston, TX, USA, 1988. [Google Scholar]
- Cao, M.; Gu, Y. Oil recovery mechanisms and asphaltene precipitation phenomenon in immiscible and miscible CO2 flooding processes. Fuel 2013, 109, 157–166. [Google Scholar] [CrossRef]
- Lashkarbolooki, M.; Vaezian, A.; Hezave, A.Z.; Ayatollahi, S.; Riazi, M. Experimental investigation of the influence of supercritical carbon dioxide and supercritical nitrogen injection on tertiary live-oil recovery. J. Supercrit. Fluids 2016, 117, 260–269. [Google Scholar] [CrossRef]
- Bayat, M.; Lashkarbolooki, M.; Hezave, A.Z.; Ayatollahi, S. Investigation of gas injection flooding performance as enhanced oil recovery method. J. Nat. Gas Sci. Eng. 2016, 29 (Suppl. C), 37–45. [Google Scholar] [CrossRef]
- Rezaei, N.; Firoozabadi, A. Pressure evolution and production performance of waterflooding in n-heptane-saturated fired berea cores. SPE J. 2014, 19, 674–686. [Google Scholar] [CrossRef]
- Alkan, H.; Cinar, Y.; Ülker, E. Impact of capillary pressure, salinity and in situ conditions on CO2 injection into saline aquifers. Transp. Porous Media 2010, 84, 799–819. [Google Scholar] [CrossRef]
- Bikkina, P.; Wan, J.; Kim, Y.; Kneafsey, T.J.; Tokunaga, T.K. Influence of wettability and permeability heterogeneity on miscible CO2 flooding efficiency. Fuel 2016, 166, 219–226. [Google Scholar] [CrossRef]
- Chatzis, I.; Morrow, N.R. Correlation of capillary number relationships for sandstone. Soc. Petrol. Eng. J. 1984, 24, 555–562. [Google Scholar] [CrossRef]
- Fulcher, R.A., Jr.; Ertekin, T.; Stahl, C. Effect of capillary number and its constituents on two-phase relative permeability curves. J. Petrol. Technol. 1985, 37, 249–260. [Google Scholar] [CrossRef]
- Akbarabadi, M.; Piri, M. Relative permeability hysteresis and capillary trapping characteristics of supercritical CO2/brine systems: An experimental study at reservoir conditions. Adv. Water Resour. 2013, 52, 190–206. [Google Scholar] [CrossRef]
- Schembre, J.M.; Kovscek, A.R. A technique for measuring two-phase relative permeability in porous media via X-ray CT measurements. J. Petrol. Sci. Eng. 2003, 39, 159–174. [Google Scholar] [CrossRef]
- Chiquet, P.; Broseta, D.F.; Thibeau, S. (Eds.) Capillary alteration of shaly caprocks by carbon dioxide. In Proceedings of the SPE Europec/EAGE Annual Conference, Madrid, Spain, 13–16 June 2005; Society of Petroleum Engineers: Houston, TX, USA, 2005. [Google Scholar]
- Chiquet, P.; Daridon, J.-L.; Broseta, D.; Thibeau, S. CO2/water interfacial tensions under pressure and temperature conditions of CO2 geological storage. Energy Conv. Manag. 2007, 48, 736–744. [Google Scholar] [CrossRef]
- Farokhpoor, R.; Bjørkvik, B.J.A.; Lindeberg, E.; Torsæter, O. Wettability behaviour of CO2 at storage conditions. Int. J. Greenh. Gas Control 2013, 12, 18–25. [Google Scholar] [CrossRef]
- Han, F.; Busch, A.; van Wageningen, N.; Yang, J.; Liu, Z.; Krooss, B.M. Experimental study of gas and water transport processes in the inter-cleat (matrix) system of coal: Anthracite from Qinshui Basin, China. Int. J. Coal Geol. 2010, 81, 128–138. [Google Scholar] [CrossRef]
- Li, X. Experimental Studies on Pore Wetting and Displacement of Fluid by CO2 in Porous Media. Ph.D. Thesis, University of Edinburgh, Edinburgh, UK, 2015. [Google Scholar]
- Behrenbruch, P.; Huu, M.T.D.; Hoang, T.G.; Bui, K.D. (Eds.) Modelling of Drainage Capillary Pressure: A Comparative Study of Various Analytical Capillary Pressure Formulations in Matching Laboratory Results. In Proceedings of the SPE Asia Pacific Oil & Gas Conference and Exhibition, Perth, Australia, 25–27 October 2016; Society of Petroleum Engineers: Houston, TX, USA, 2016. [Google Scholar]
- Parvazdavani, M.; Abbasi, S.; Zare-Reisabadi, M. Experimental study of gas–oil relative permeability curves at immiscible/near miscible gas injection in highly naturally fractured reservoir. Egypt. J. Petrol. 2017, 26, 171–180. [Google Scholar] [CrossRef]
- Georgiadis, A.; Maitland, G.; Trusler, J.M.; Bismarck, A. Interfacial tension measurements of the (H2O + CO2) system at elevated pressures and temperatures. J. Chem. Eng. Data 2010, 55, 4168–4175. [Google Scholar] [CrossRef]
- Chang, C.; Zhou, Q.; Xia, L.; Li, X.; Yu, Q. Dynamic displacement and non-equilibrium dissolution of supercritical CO2 in low-permeability sandstone: An experimental study. Int. J. Greenh. Gas Control 2013, 14, 1–14. [Google Scholar] [CrossRef]
- Nutt, C. (Ed.) The physical basis of the displacement of oil from porous media by other fluids: A capillary bundle model. Proc. R. Soc. Lond. A Math. Phys. Eng. Sci. 1982, 382, 155–178. [Google Scholar] [CrossRef]
- Kwelle, S.O. Experimental Studies on Resistance to Fluid Displacement in Single Pores. Ph.D. Thesis, The University of Edinburgh, Edinburgh, UK, 2017. [Google Scholar]
- Hildenbrand, A.; Schlömer, S.; Krooss, B. Gas breakthrough experiments on fine-grained sedimentary rocks. Geofluids 2002, 2, 3–23. [Google Scholar] [CrossRef]
- Fathollahi, A.; Rostami, B. Carbonated water injection: Effects of silica nanoparticles and operating pressure. Can. J. Chem. Eng. 2015, 93, 1949–1956. [Google Scholar] [CrossRef]
- Banerjee, S.; Hassenklöver, E.; Kleijn, J.M.; Cohen Stuart, M.A.; Leermakers, F.A. Interfacial Tension and Wettability in Water–Carbon Dioxide Systems: Experiments and Self-consistent Field Modeling. J. Phys. Chem. B 2013, 117, 8524–8535. [Google Scholar] [CrossRef] [PubMed]
- Bennion, D.B.; Bachu, S. (Eds.) The impact of interfacial tension and pore size distribution/capillary pressure character on CO2 relative permeability at reservoir conditions in CO2-brine systems. In Proceedings of the SPE/DOE Symposium on Improved Oil Recovery, Tulsa, OK, USA, 22–26 April 2006; Society of Petroleum Engineers: Houston, TX, USA, 2006. [Google Scholar]
- Yang, D.; Gu, Y.; Tontiwachwuthikul, P. Wettability determination of the reservoir brine—Reservoir rock system with dissolution of CO2 at high pressures and elevated temperatures. Energy Fuels 2007, 22, 504–509. [Google Scholar] [CrossRef]
- Perrin, J.-C.; Benson, S. An experimental study on the influence of sub-core scale heterogeneities on CO2 distribution in reservoir rocks. Transp. Porous Media 2010, 82, 93–109. [Google Scholar] [CrossRef]
- Carpenter, C. Enhanced Recovery in Unconventional Liquid Reservoirs by Use of CO2. J. Petrol. Technol. 2014, 66, 138–141. [Google Scholar] [CrossRef]
- Liu, N.; Ghorpade, S.V.; Harris, L.; Li, L.; Grigg, R.B.; Lee, R.L. (Eds.) The effect of pressure and temperature on brine-CO2 relative permeability and IFT at reservoir conditions. In Proceedings of theSPE Eastern Regional Meeting, Morgantown, WV, USA, 13–15 October 2010; Society of Petroleum Engineers: Houston, TX, USA, 2010. [Google Scholar]
- Jung, J.-W.; Wan, J. Supercritical CO2 and ionic strength effects on wettability of silica surfaces: Equilibrium contact angle measurements. Energy Fuels 2012, 26, 6053–6059. [Google Scholar] [CrossRef]
- Nobakht, M.; Moghadam, S.; Gu, Y. Effects of viscous and capillary forces on CO2 enhanced oil recovery under reservoir conditions. Energy Fuels 2007, 21, 3469–3476. [Google Scholar] [CrossRef]
- Mahdavi, E.; Zebarjad, F.S.; Taghikhani, V.; Ayatollahi, S. Effects of paraffinic group on interfacial tension behavior of co2–asphaltenic crude oil systems. J. Chem. Eng. Data 2014, 59, 2563–2569. [Google Scholar] [CrossRef]
- Escrochi, M.; Mehranbod, N.; Ayatollahi, S. The gas–oil interfacial behavior during gas injection into an asphaltenic oil reservoir. J. Chem. Eng. Data 2013, 58, 2513–2526. [Google Scholar] [CrossRef]
- Peace Software. 2017. Available online: http://www.peacesoftware.de/einigewerte/co2_e.html (accessed on 20 December 2017).
- Skauge, A.; Håskjold, G.; Thorsen, T.; Aarra, M. Accuracy of gas-oil relative permeability from two-phase flow experiments. In Proceedings of the International Symposium of the Society of Core Analysts, Calgary, AB, Canada, 7–10 September 1997. [Google Scholar]
- Akbarabadi, M.; Piri, M. Geologic storage of carbon dioxide: An experimental study of permanent capillary trapping and relative permeability. In Proceedings of the International Symposium of the Society of Core Analysts, Austin, TX, USA, 18–21 September 2011; pp. 18–21. [Google Scholar]
- Rathnaweera, T.; Ranjith, P.; Perera, M. Effect of salinity on effective CO2 permeability in reservoir rock determined by pressure transient methods: An experimental study on Hawkesbury sandstone. Rock Mech. Rock Eng. 2015, 48, 2093–2110. [Google Scholar] [CrossRef]
- Busch, A.; Müller, N. Determining CO2/brine relative permeability and capillary threshold pressures for reservoir rocks and caprocks: Recommendations for development of standard laboratory protocols. Energy Procedia 2011, 4, 6053–6060. [Google Scholar] [CrossRef]
- Chukwudeme, E.A.; Hamouda, A.A. Enhanced oil recovery (EOR) by miscible CO2 and water flooding of asphaltenic and non-asphaltenic oils. Energies 2009, 2, 714–737. [Google Scholar] [CrossRef]
- Parvazdavani, M.; Masihi, M.; Ghazanfari, M. Gas–oil relative permeability at near miscible conditions: An experimental and modeling approach. Sci. Iran. 2013, 20, 626–636. [Google Scholar] [CrossRef]
- Kazemifar, F.; Blois, G.; Kyritsis, D.C.; Christensen, K.T. Quantifying the flow dynamics of supercritical CO2–water displacement in a 2D porous micromodel using fluorescent microscopy and microscopic PIV. Adv. Water Resour. 2016, 95, 352–368. [Google Scholar] [CrossRef]
- Rostami, B.; Kharrat, R.; Ghotbi, C.; Tabatabaie, S. Gas-oil relative permeability and residual oil saturation as related to displacement instability and dimensionless numbers. Oil Gas Sci. Technol.–Rev. Inst. Franç. Pét. 2010, 65, 299–313. [Google Scholar] [CrossRef]
- Bennion, D.B.; Bachu, S. (Eds.) Dependence on temperature, pressure, and salinity of the IFT and relative permeability displacement characteristics of CO2 injected in deep saline aquifers. In Proceedings of the SPE Annual Technical Conference and Exhibition, San Antonio, TX, USA, 24–27 September 2006; Society of Petroleum Engineers: Houston, TX, USA, 2006. [Google Scholar]
Figure 1.
The pressure and temperature ranges at which saline aquifers are found underground adopted from Saraji et al. [24].
Figure 1.
The pressure and temperature ranges at which saline aquifers are found underground adopted from Saraji et al. [24].
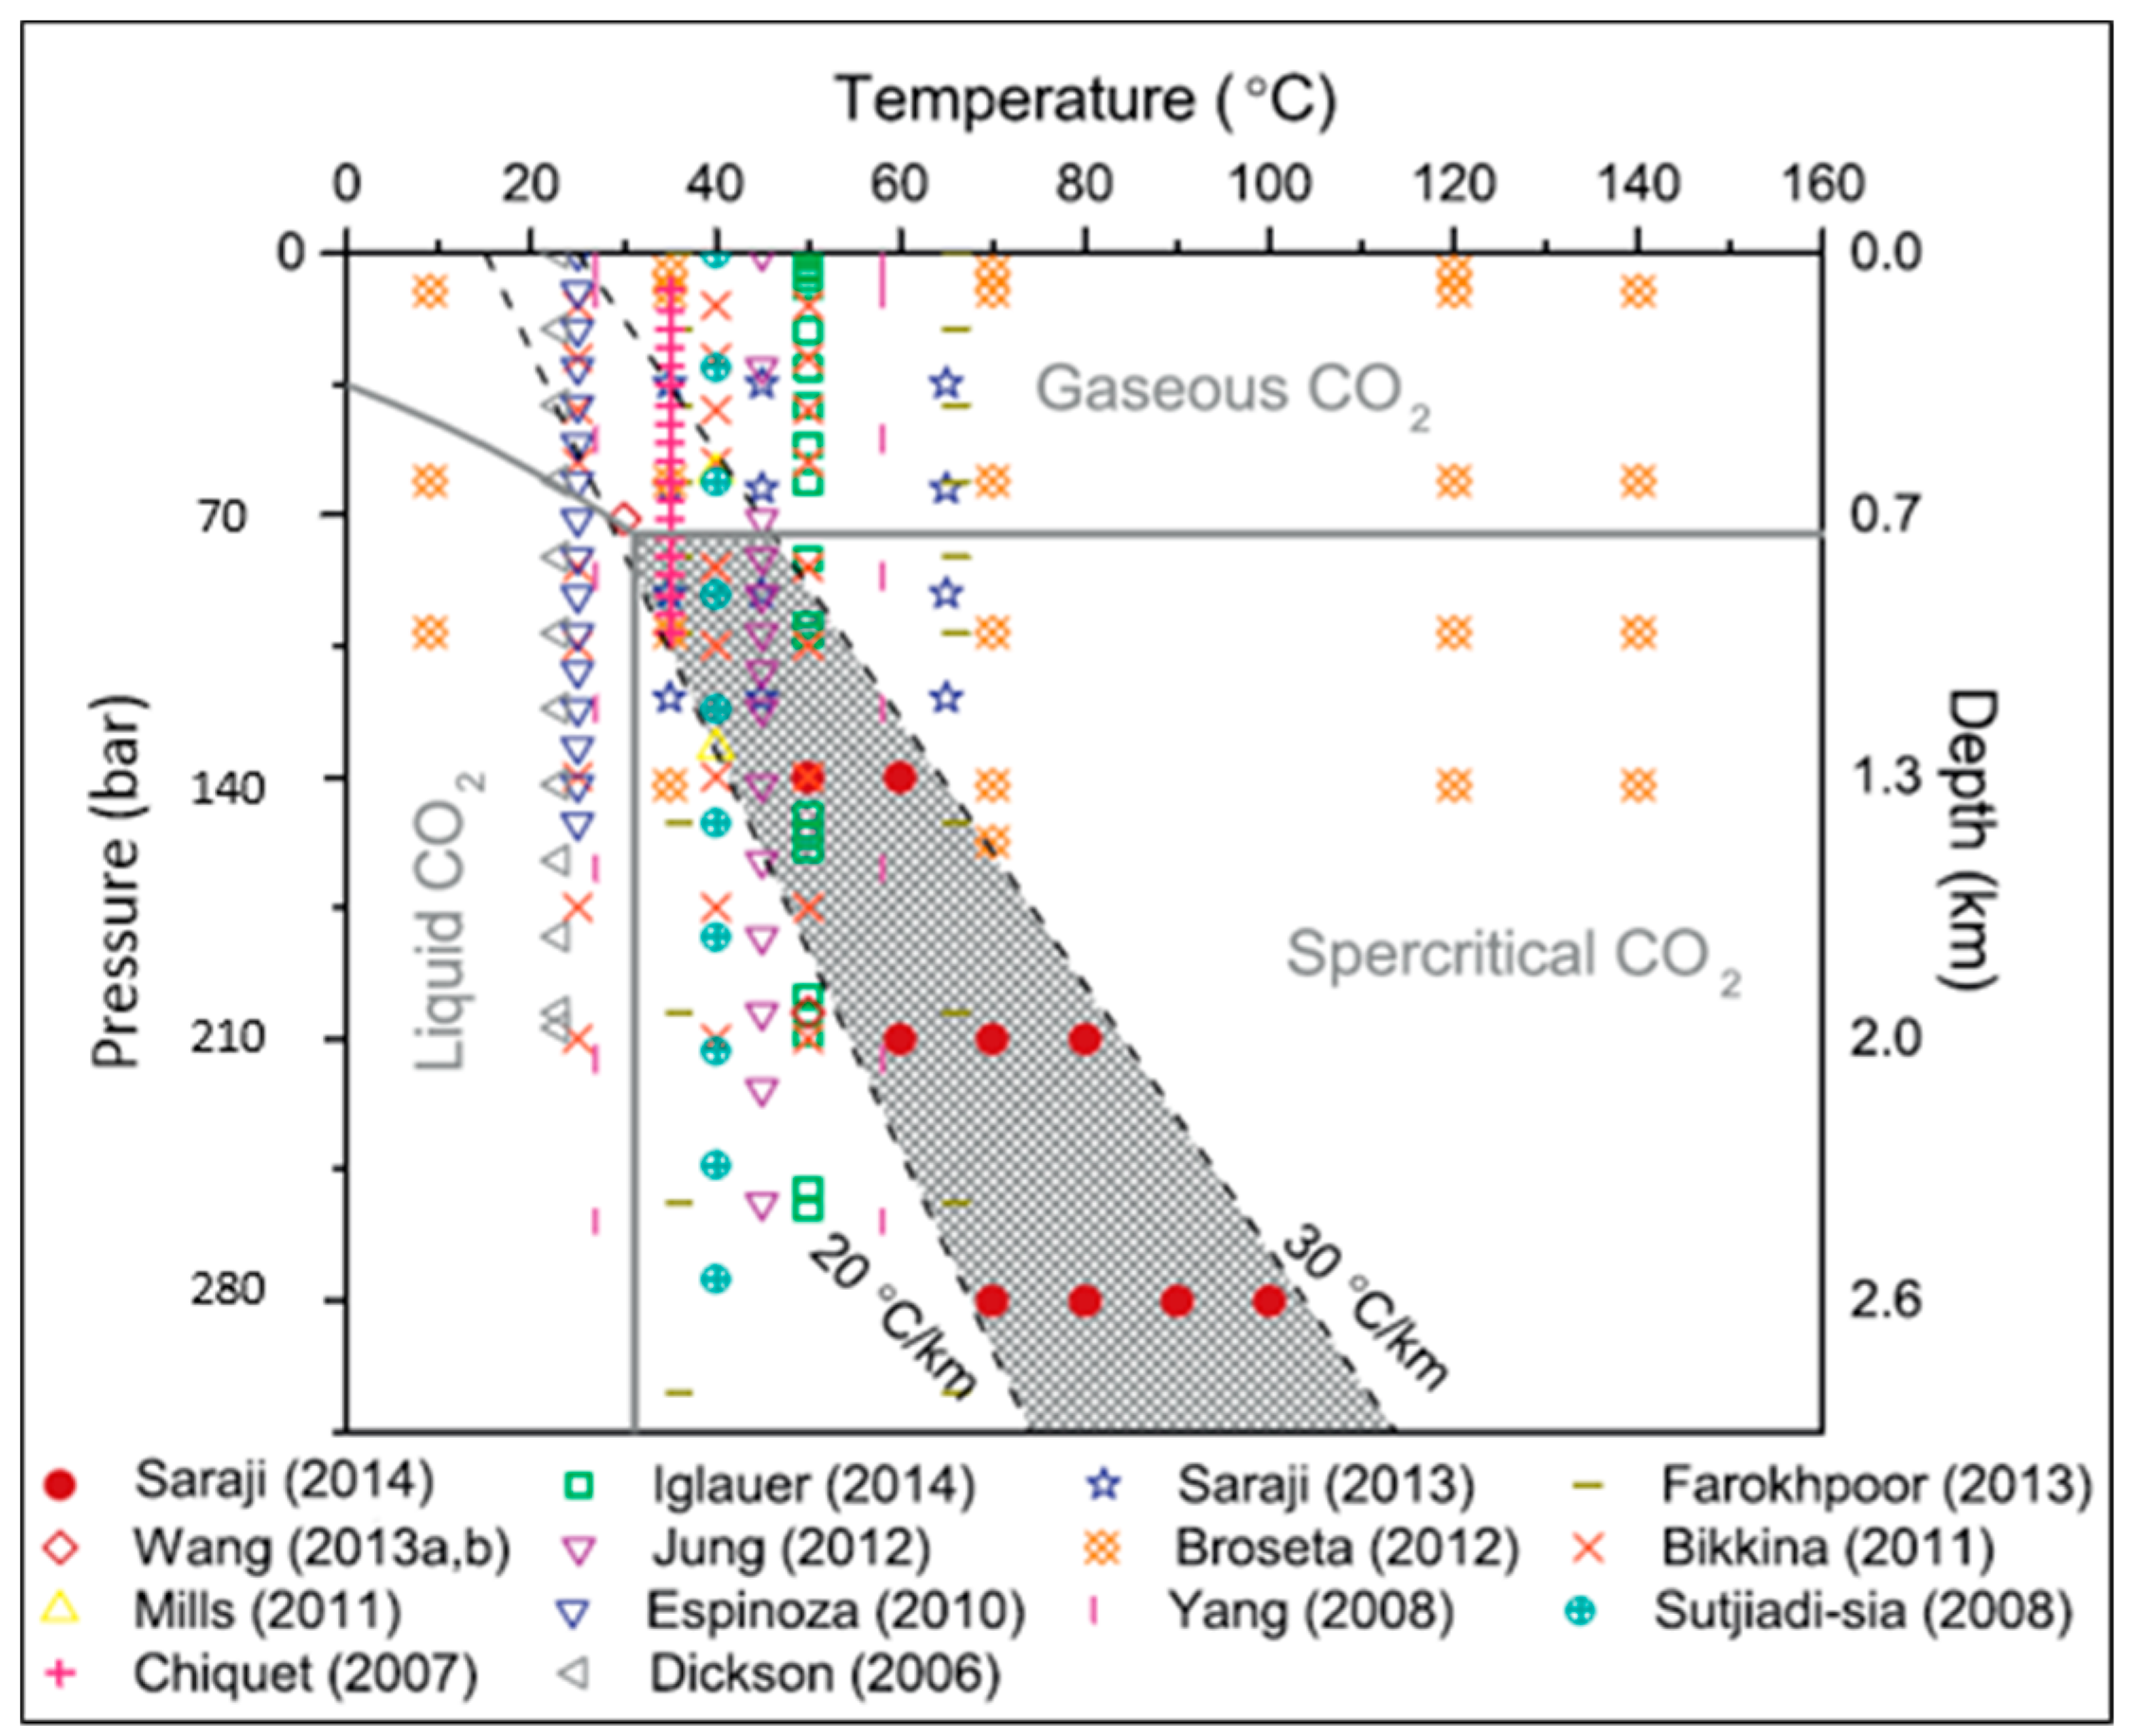
Figure 2.
The experimental setup for CO2 (gas-liquid-supercritical)–oil displacements.

Figure 3.
Effect of fluid pressure on the differential pressure profile of low-pressure GCO2–oil displacements conducted at 0.4 mL/min and 33 °C.
Figure 3.
Effect of fluid pressure on the differential pressure profile of low-pressure GCO2–oil displacements conducted at 0.4 mL/min and 33 °C.
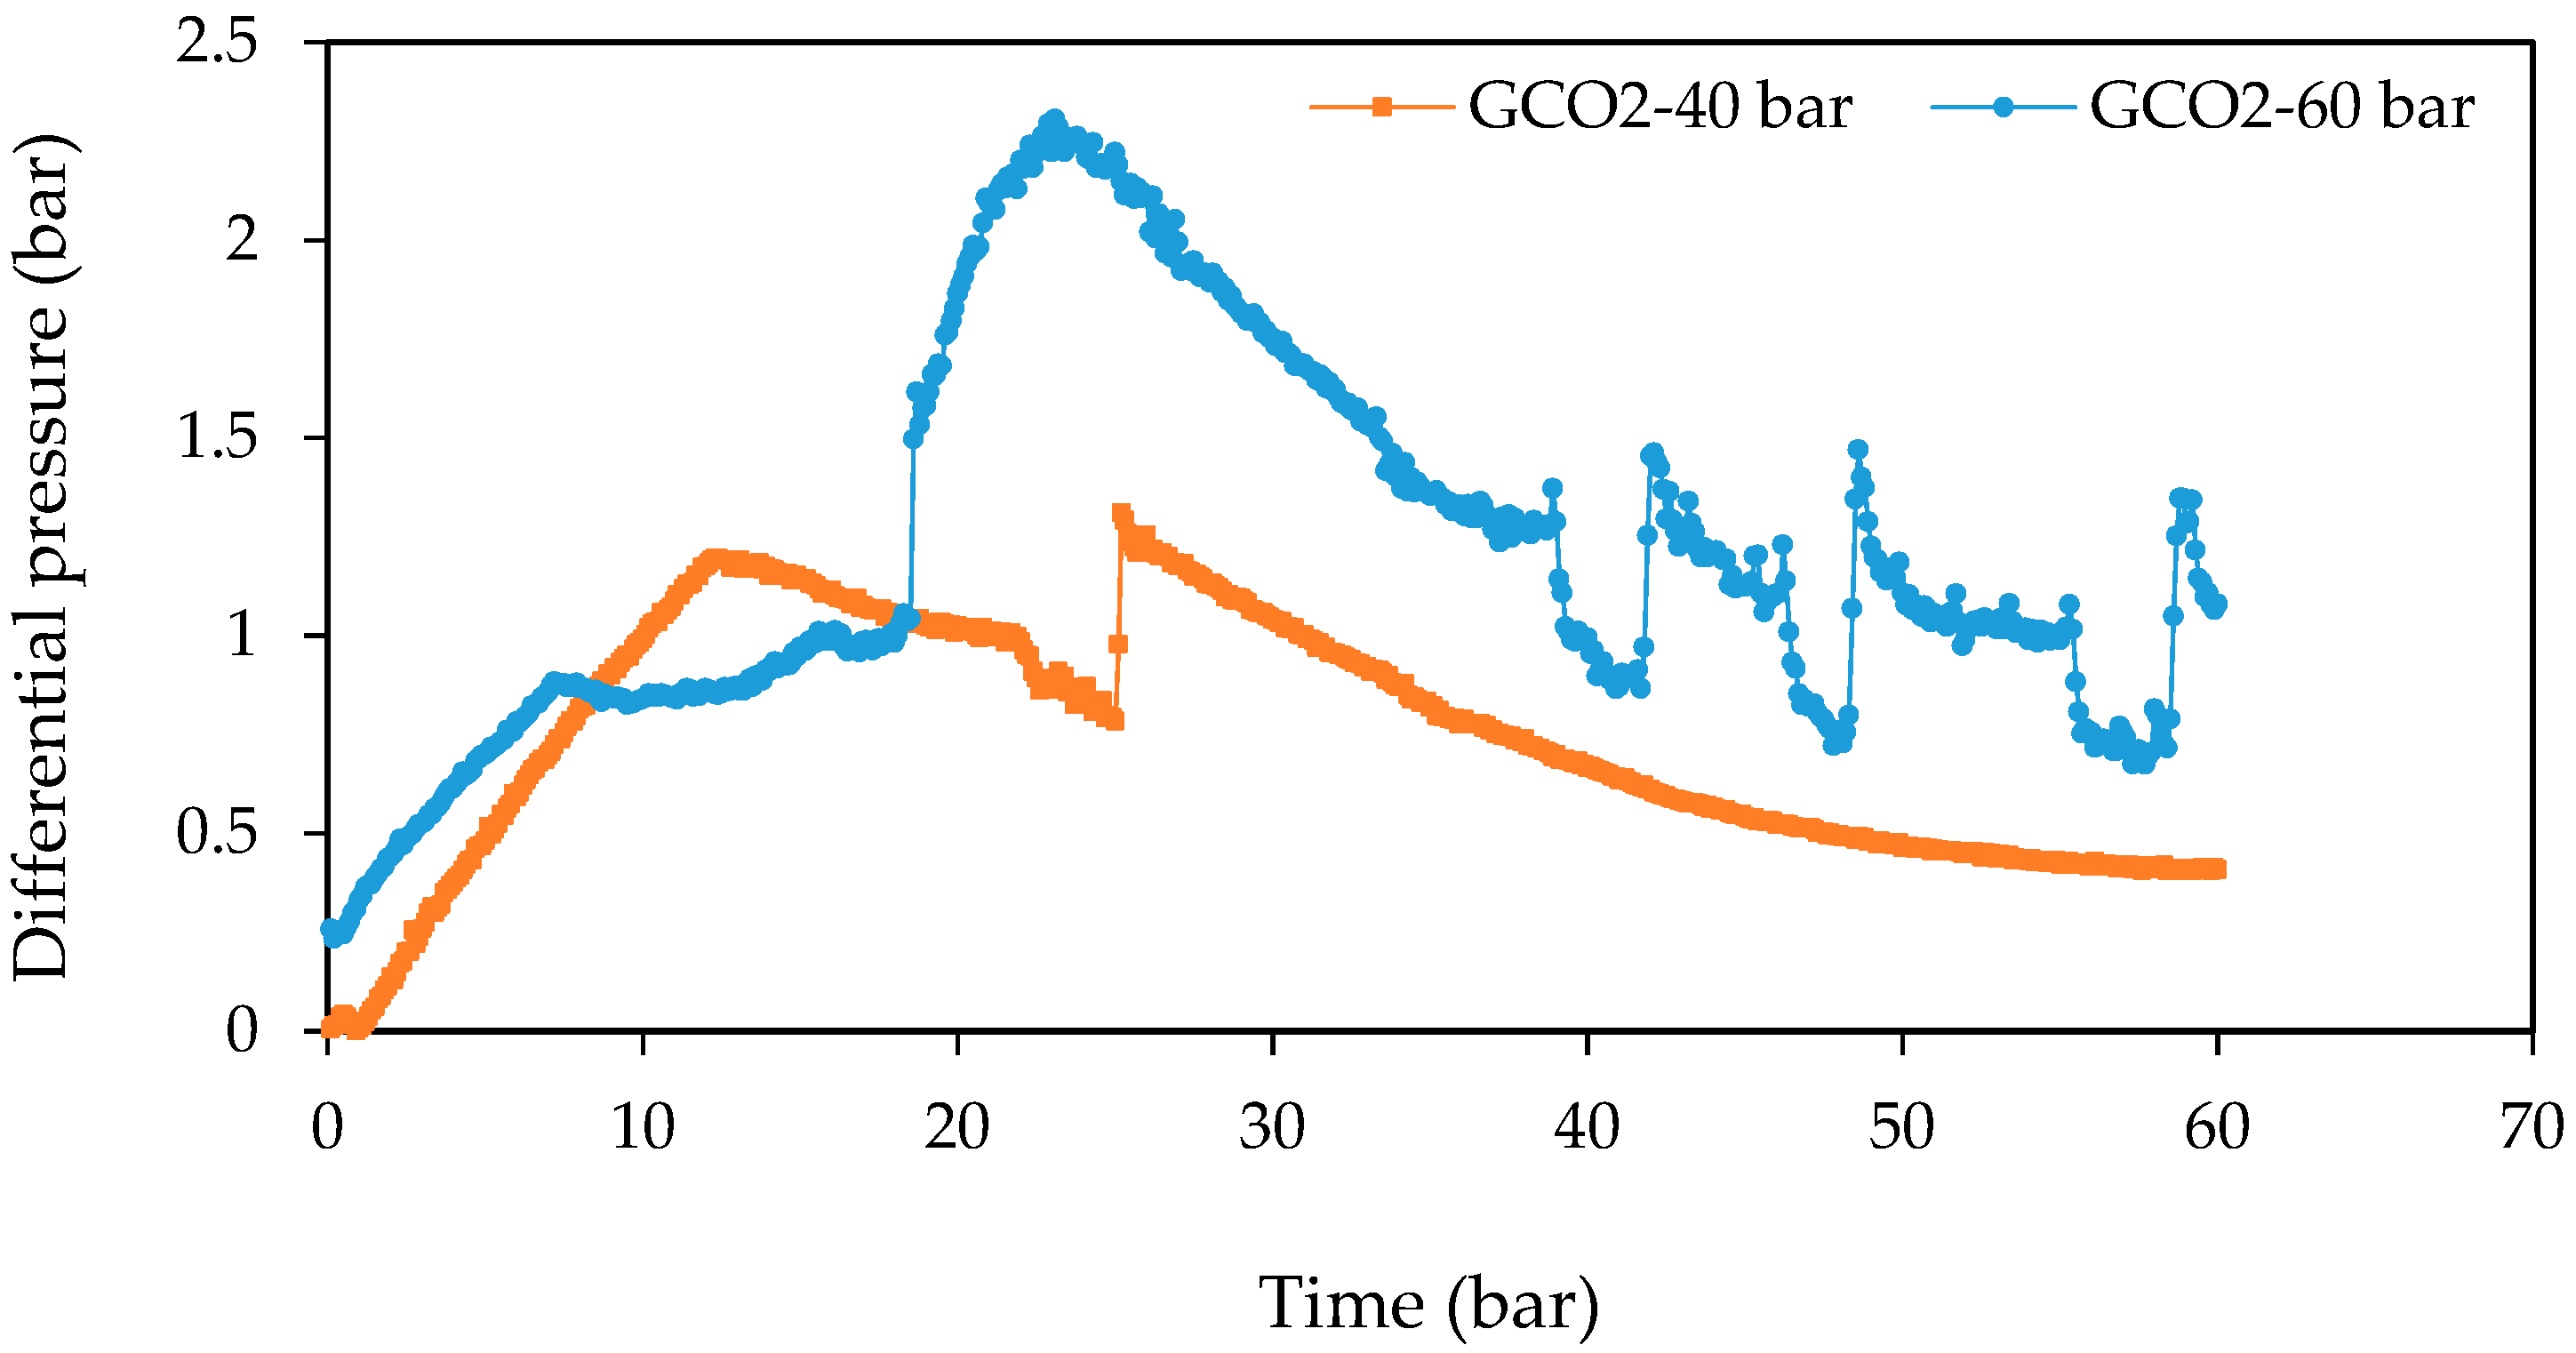
Figure 4.
Effect of fluid pressure on the differential pressure profile of high-pressure GCO2–oil displacements conducted at 0.4 mL/min and 33 °C.
Figure 4.
Effect of fluid pressure on the differential pressure profile of high-pressure GCO2–oil displacements conducted at 0.4 mL/min and 33 °C.
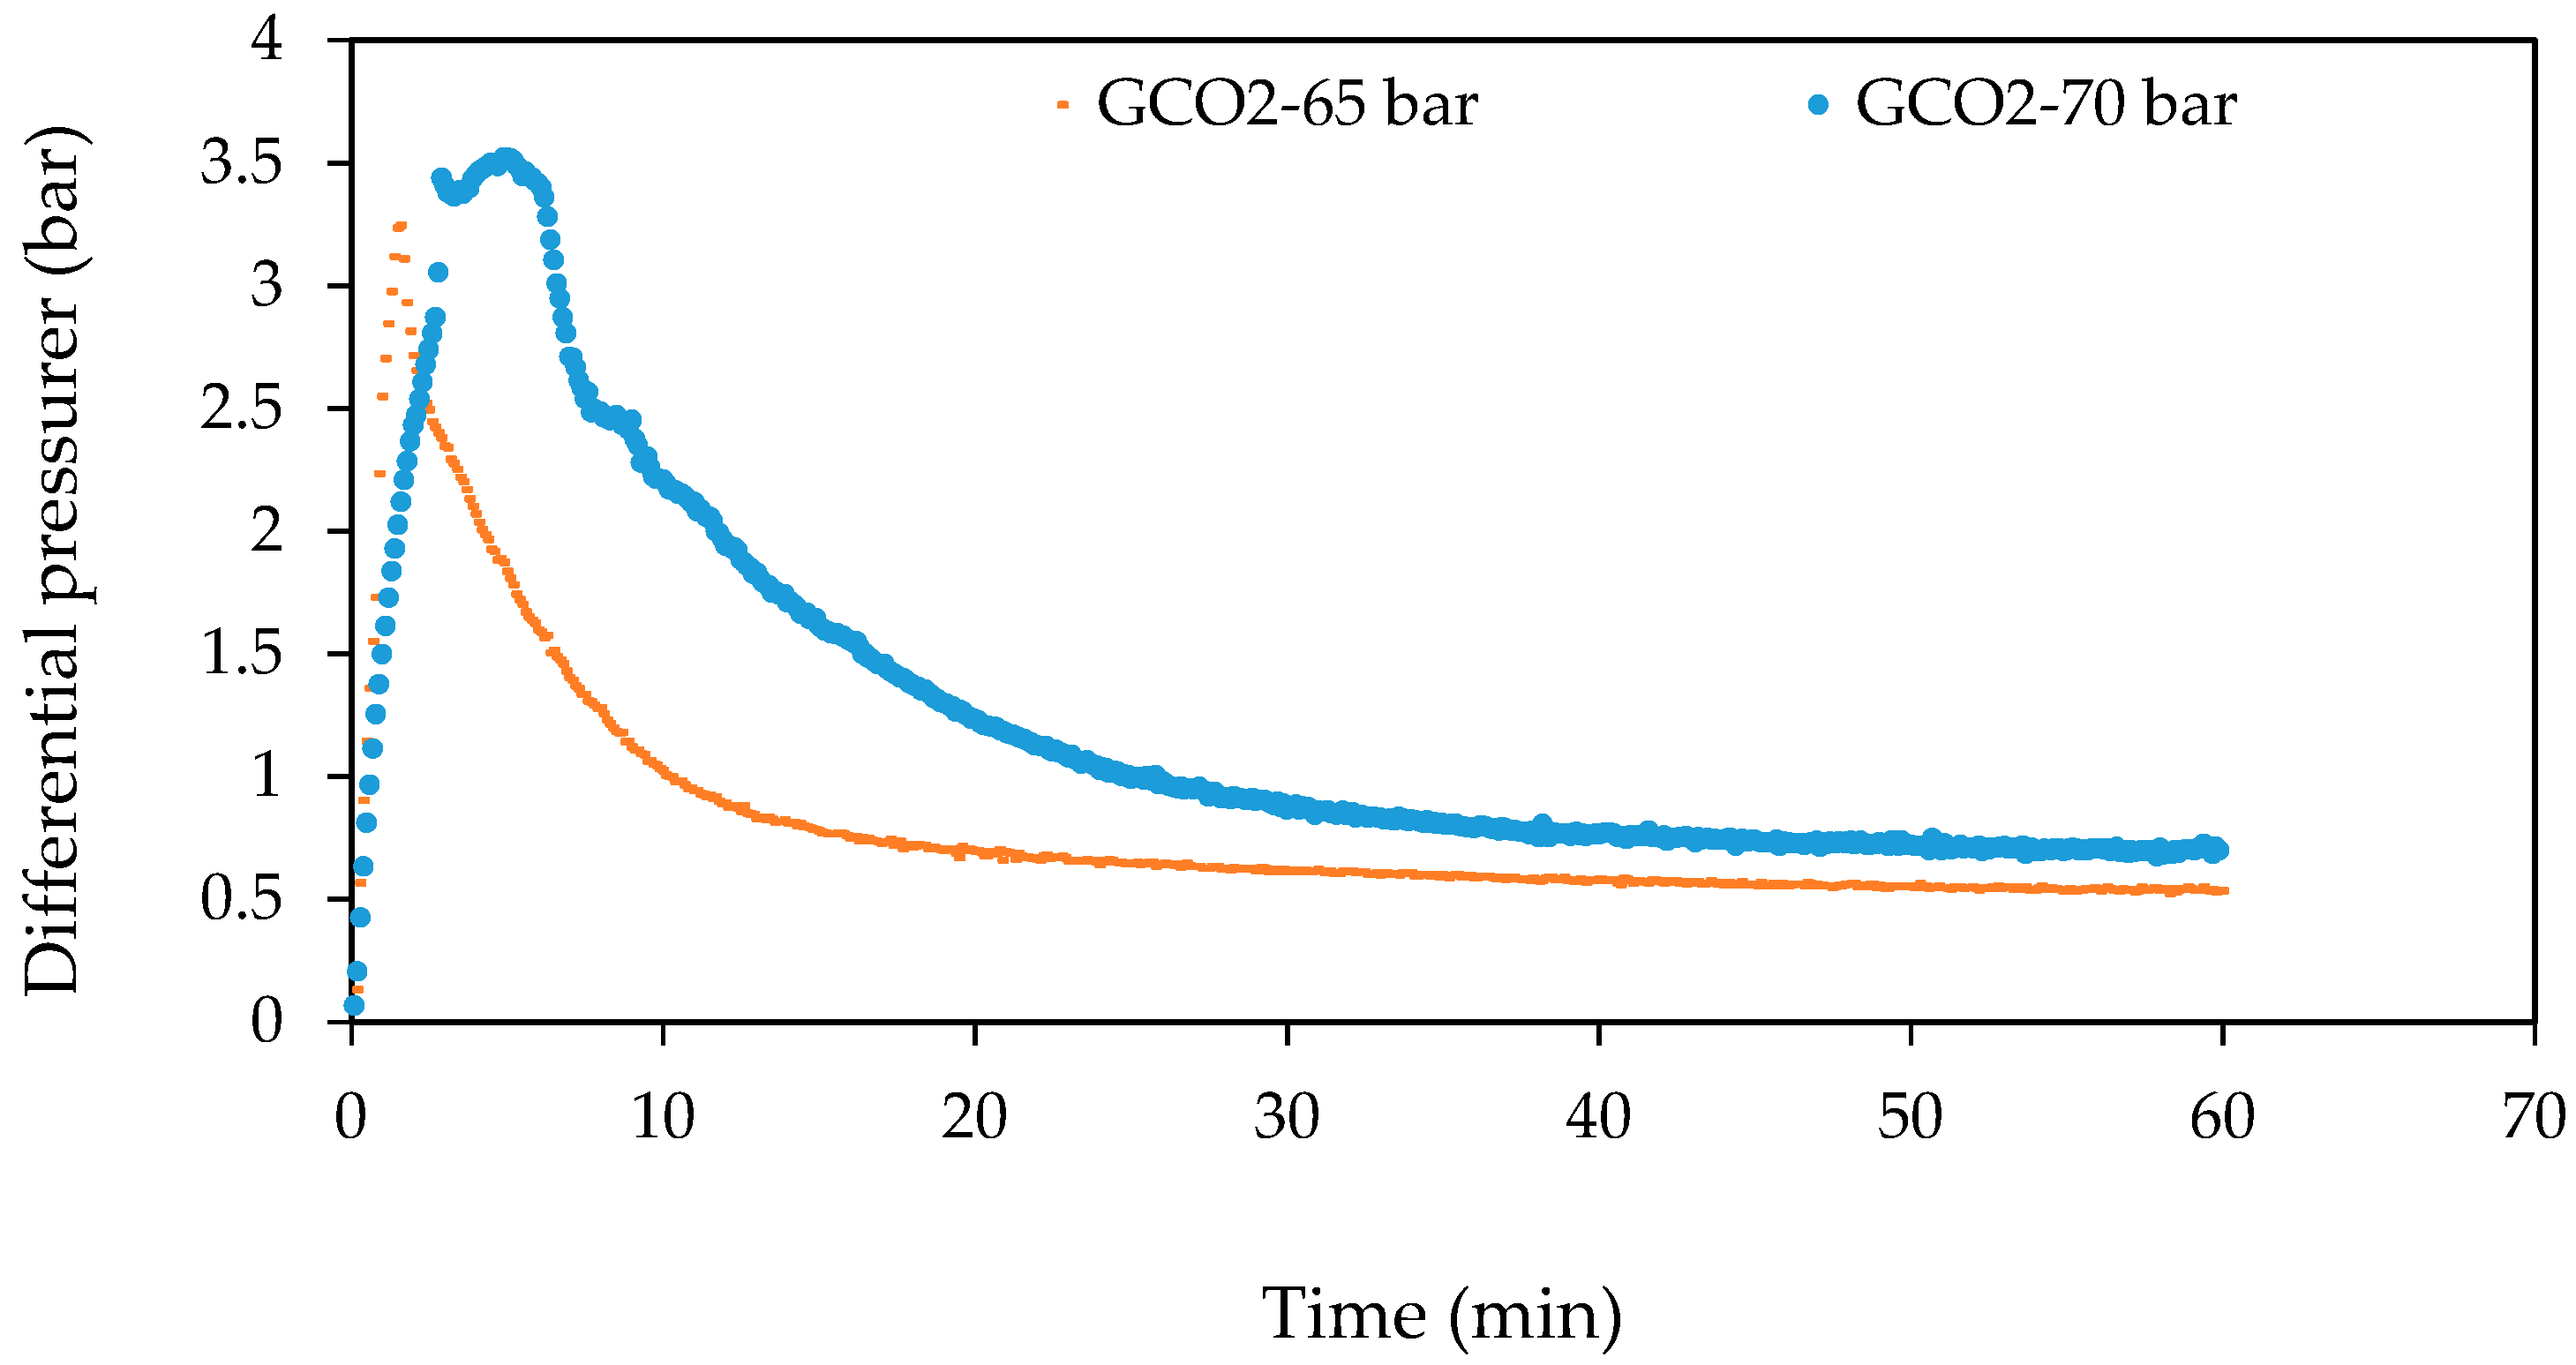
Figure 5.
Effect of fluid pressure on the differential pressure profile of LCO2–oil displacements conducted at 0.4 mL/min and 20 °C.
Figure 5.
Effect of fluid pressure on the differential pressure profile of LCO2–oil displacements conducted at 0.4 mL/min and 20 °C.

Figure 6.
Effect of fluid pressure on the differential pressure profile of ScCO2–oil displacements conducted at 0.4 mL/min and 33 °C.
Figure 6.
Effect of fluid pressure on the differential pressure profile of ScCO2–oil displacements conducted at 0.4 mL/min and 33 °C.

Figure 7.
Interfacial tension (IFT) tension for CO2-crude oils (WO = Weyburn crude oil-CO2 system against equilibrium pressure data at T = 27 °C [78]; A-0 and B-0 = Iranian crude oils at 49.85 °C [79]; BGA-13 = Iranian crude oil at 48.85 °C [80].
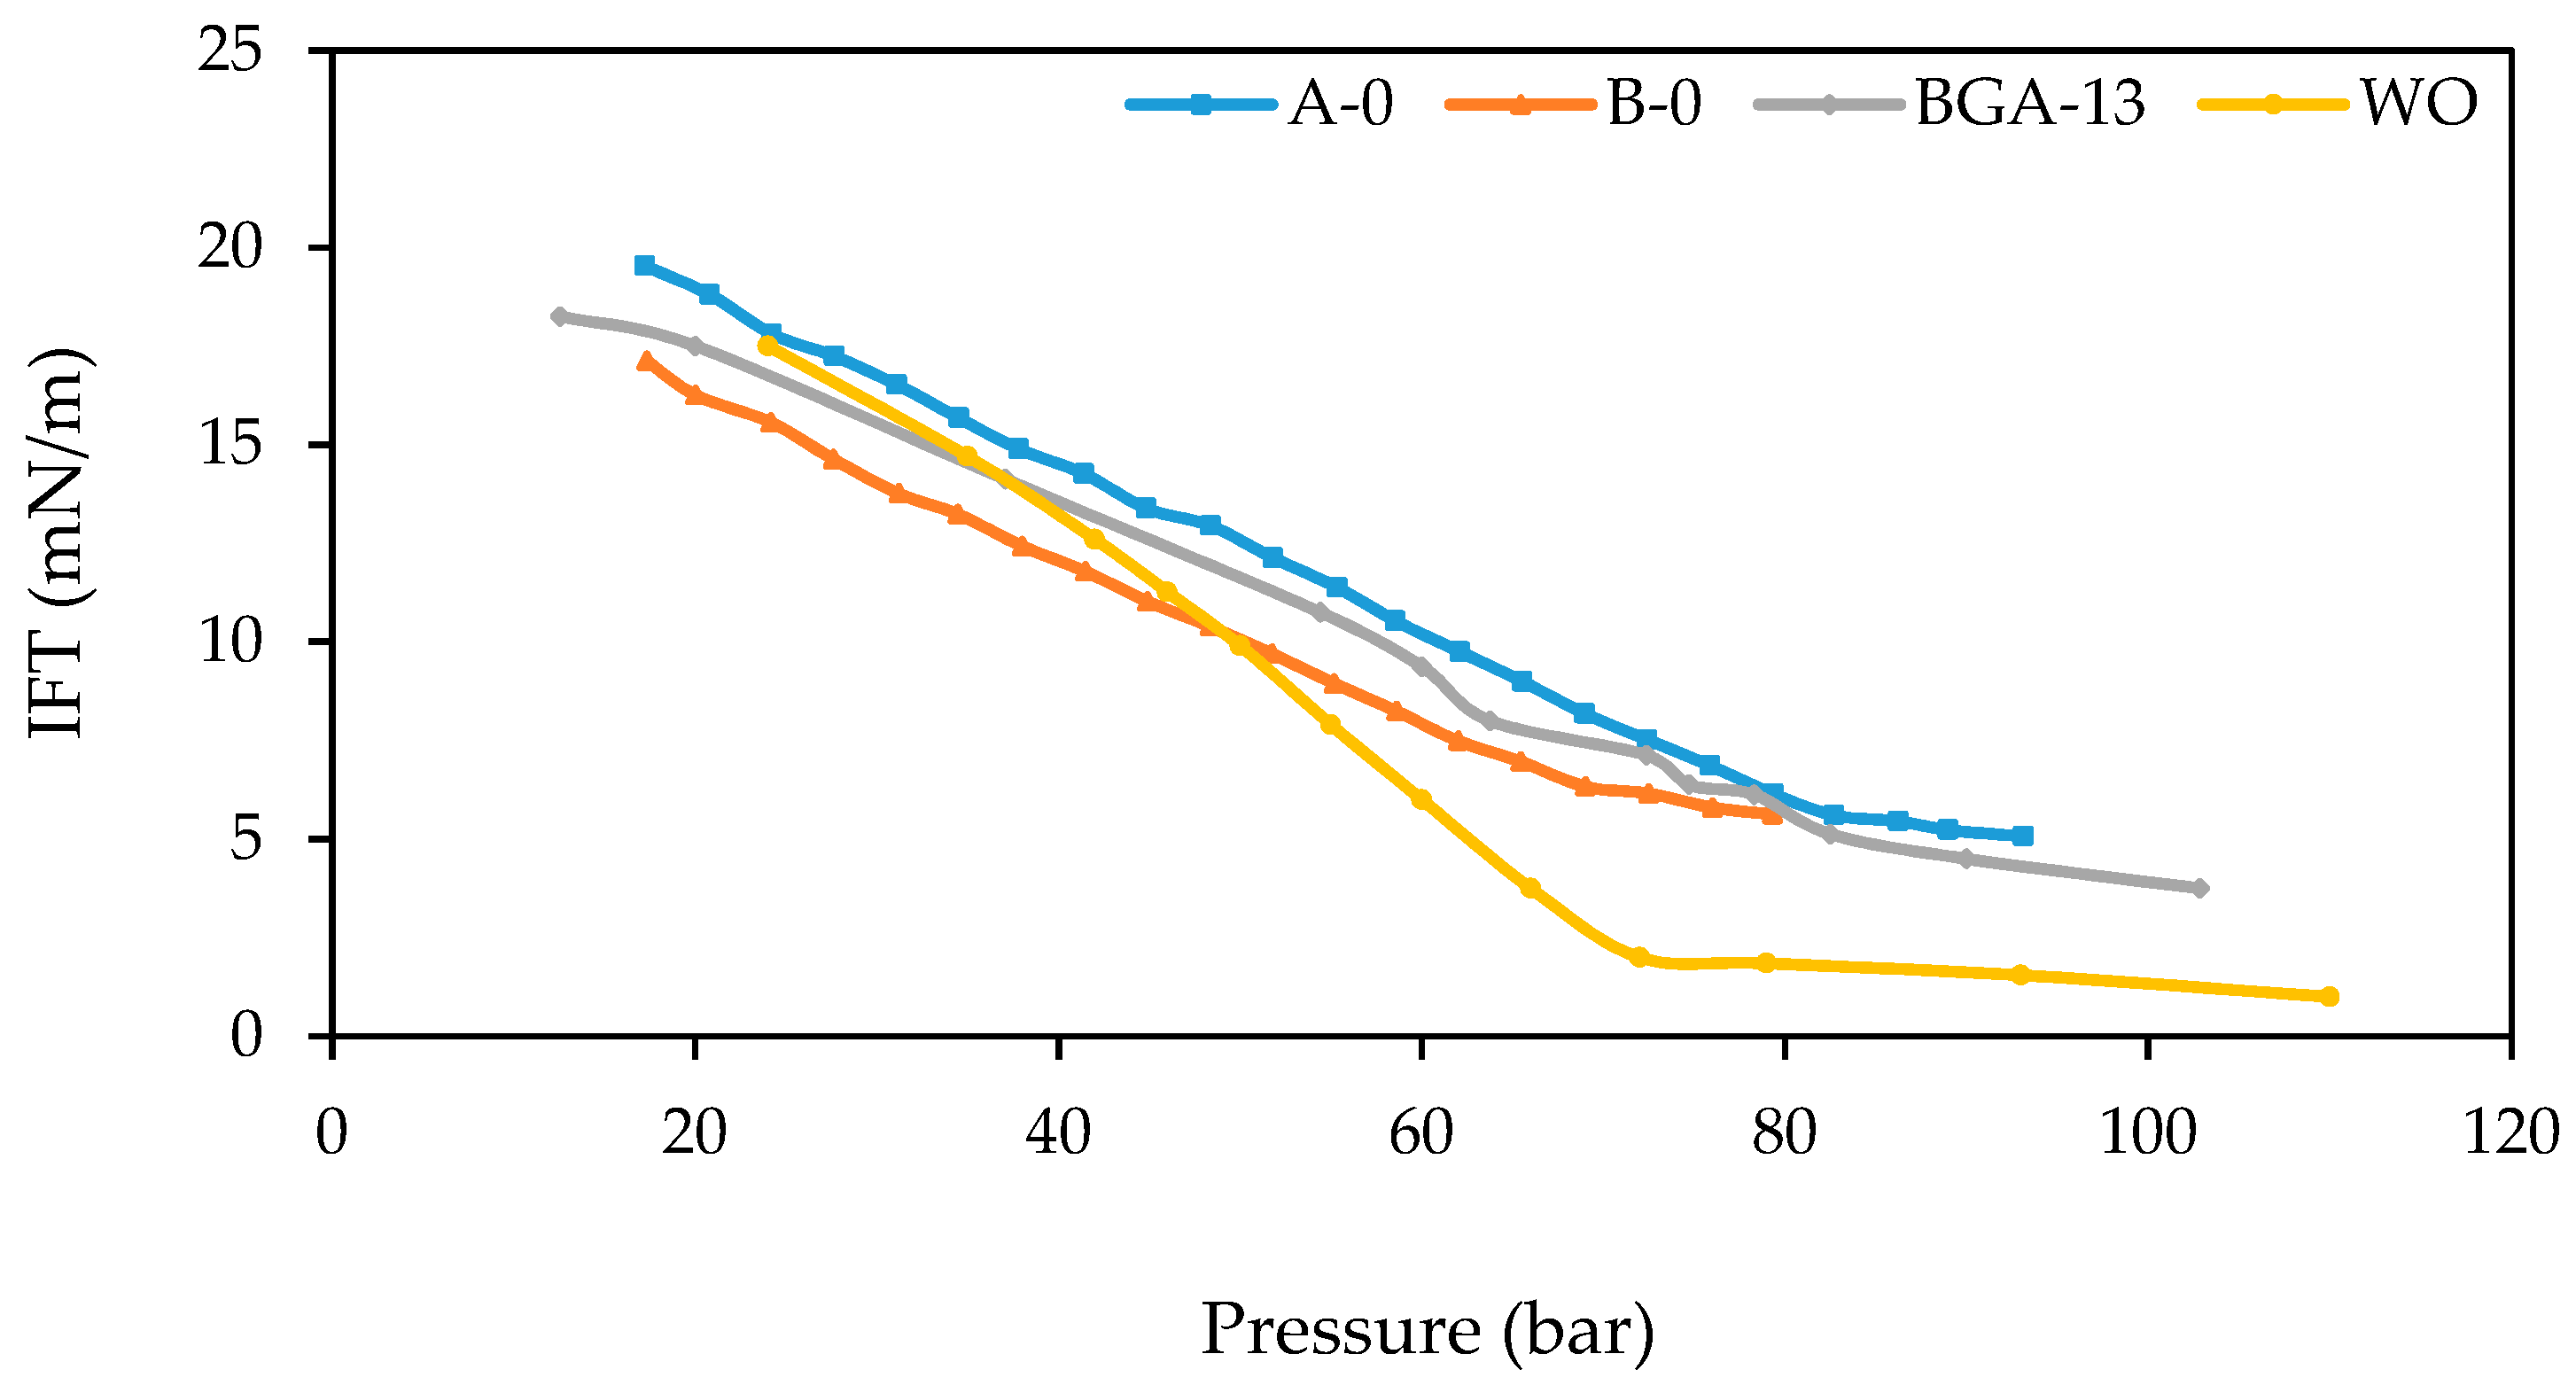
Figure 8.
Re-imbibition process in fine-grained rocks (schematic re-imbibition): (A) drainage, (B) an initially water-saturated sample, (C) gas breakthrough, and (D) re-imbibition [69].
Figure 8.
Re-imbibition process in fine-grained rocks (schematic re-imbibition): (A) drainage, (B) an initially water-saturated sample, (C) gas breakthrough, and (D) re-imbibition [69].

Figure 9.
Effect of experimental temperature on the differential pressure profile of low-fluid-pressure GCO2–oil displacements conducted at 0.4 mL/min and 40 bar.
Figure 9.
Effect of experimental temperature on the differential pressure profile of low-fluid-pressure GCO2–oil displacements conducted at 0.4 mL/min and 40 bar.
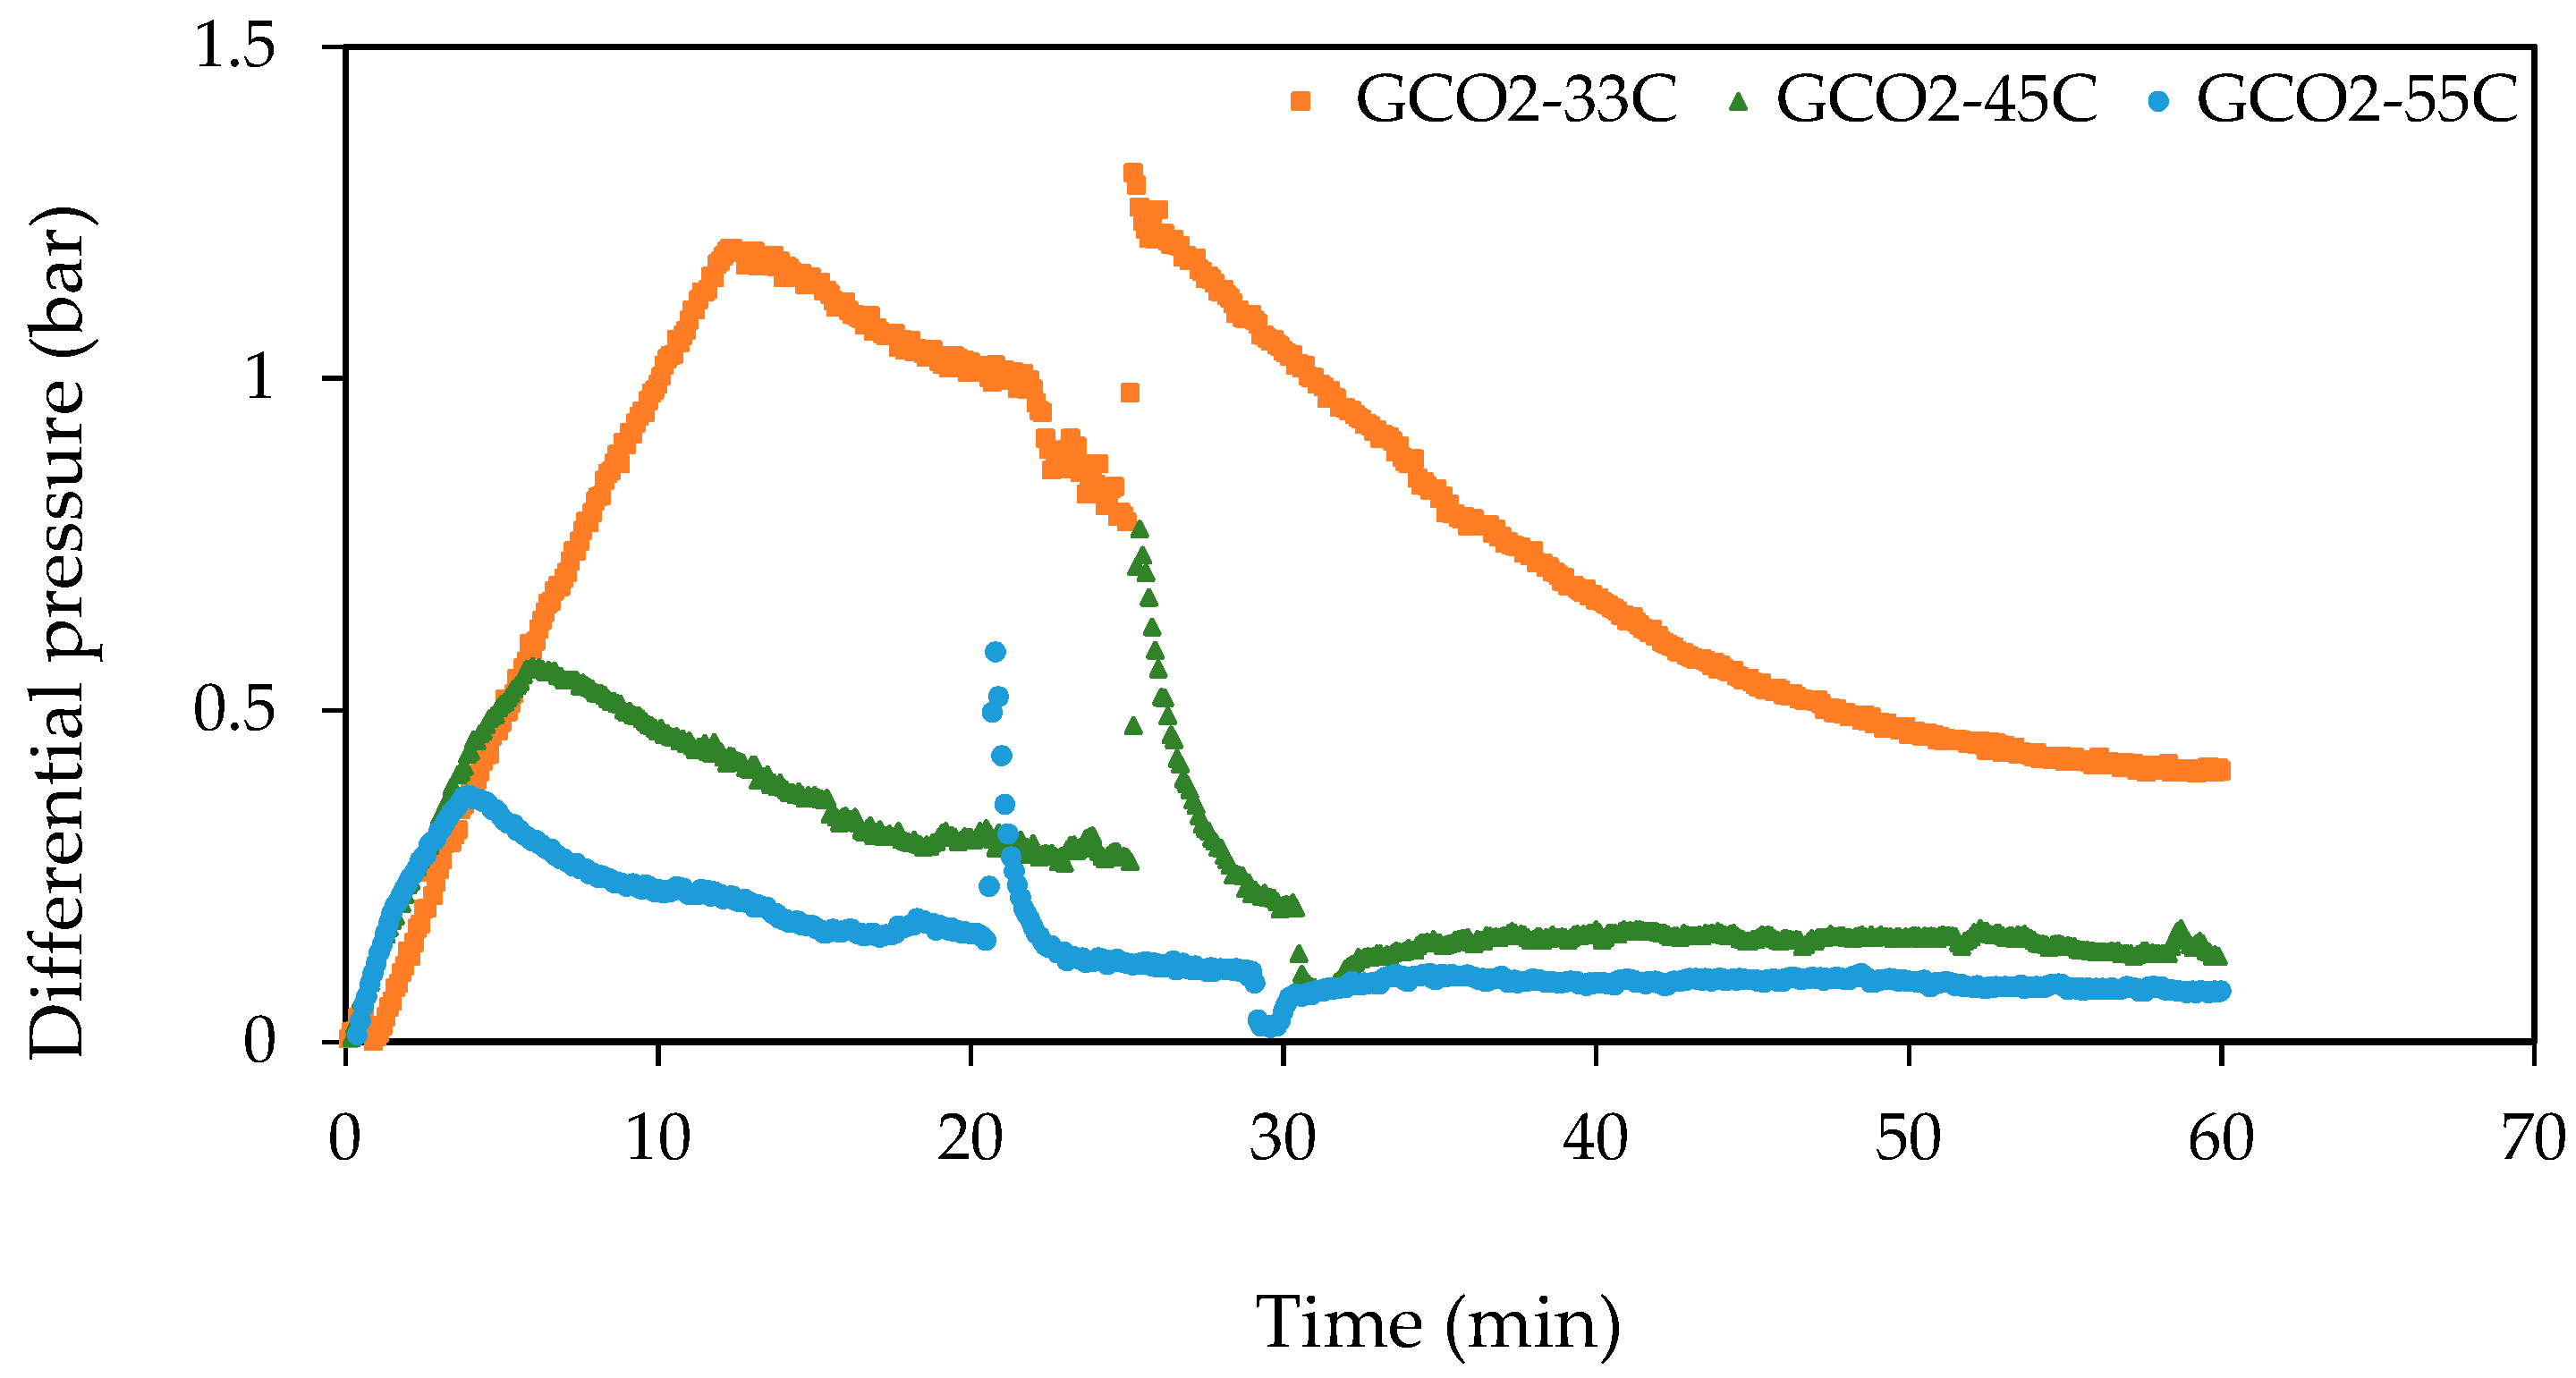
Figure 10.
Effect of experimental temperature on the differential pressure profile of high-fluid-pressure GCO2–oil displacements conducted at 0.4 mL/min and 70 bar.
Figure 10.
Effect of experimental temperature on the differential pressure profile of high-fluid-pressure GCO2–oil displacements conducted at 0.4 mL/min and 70 bar.
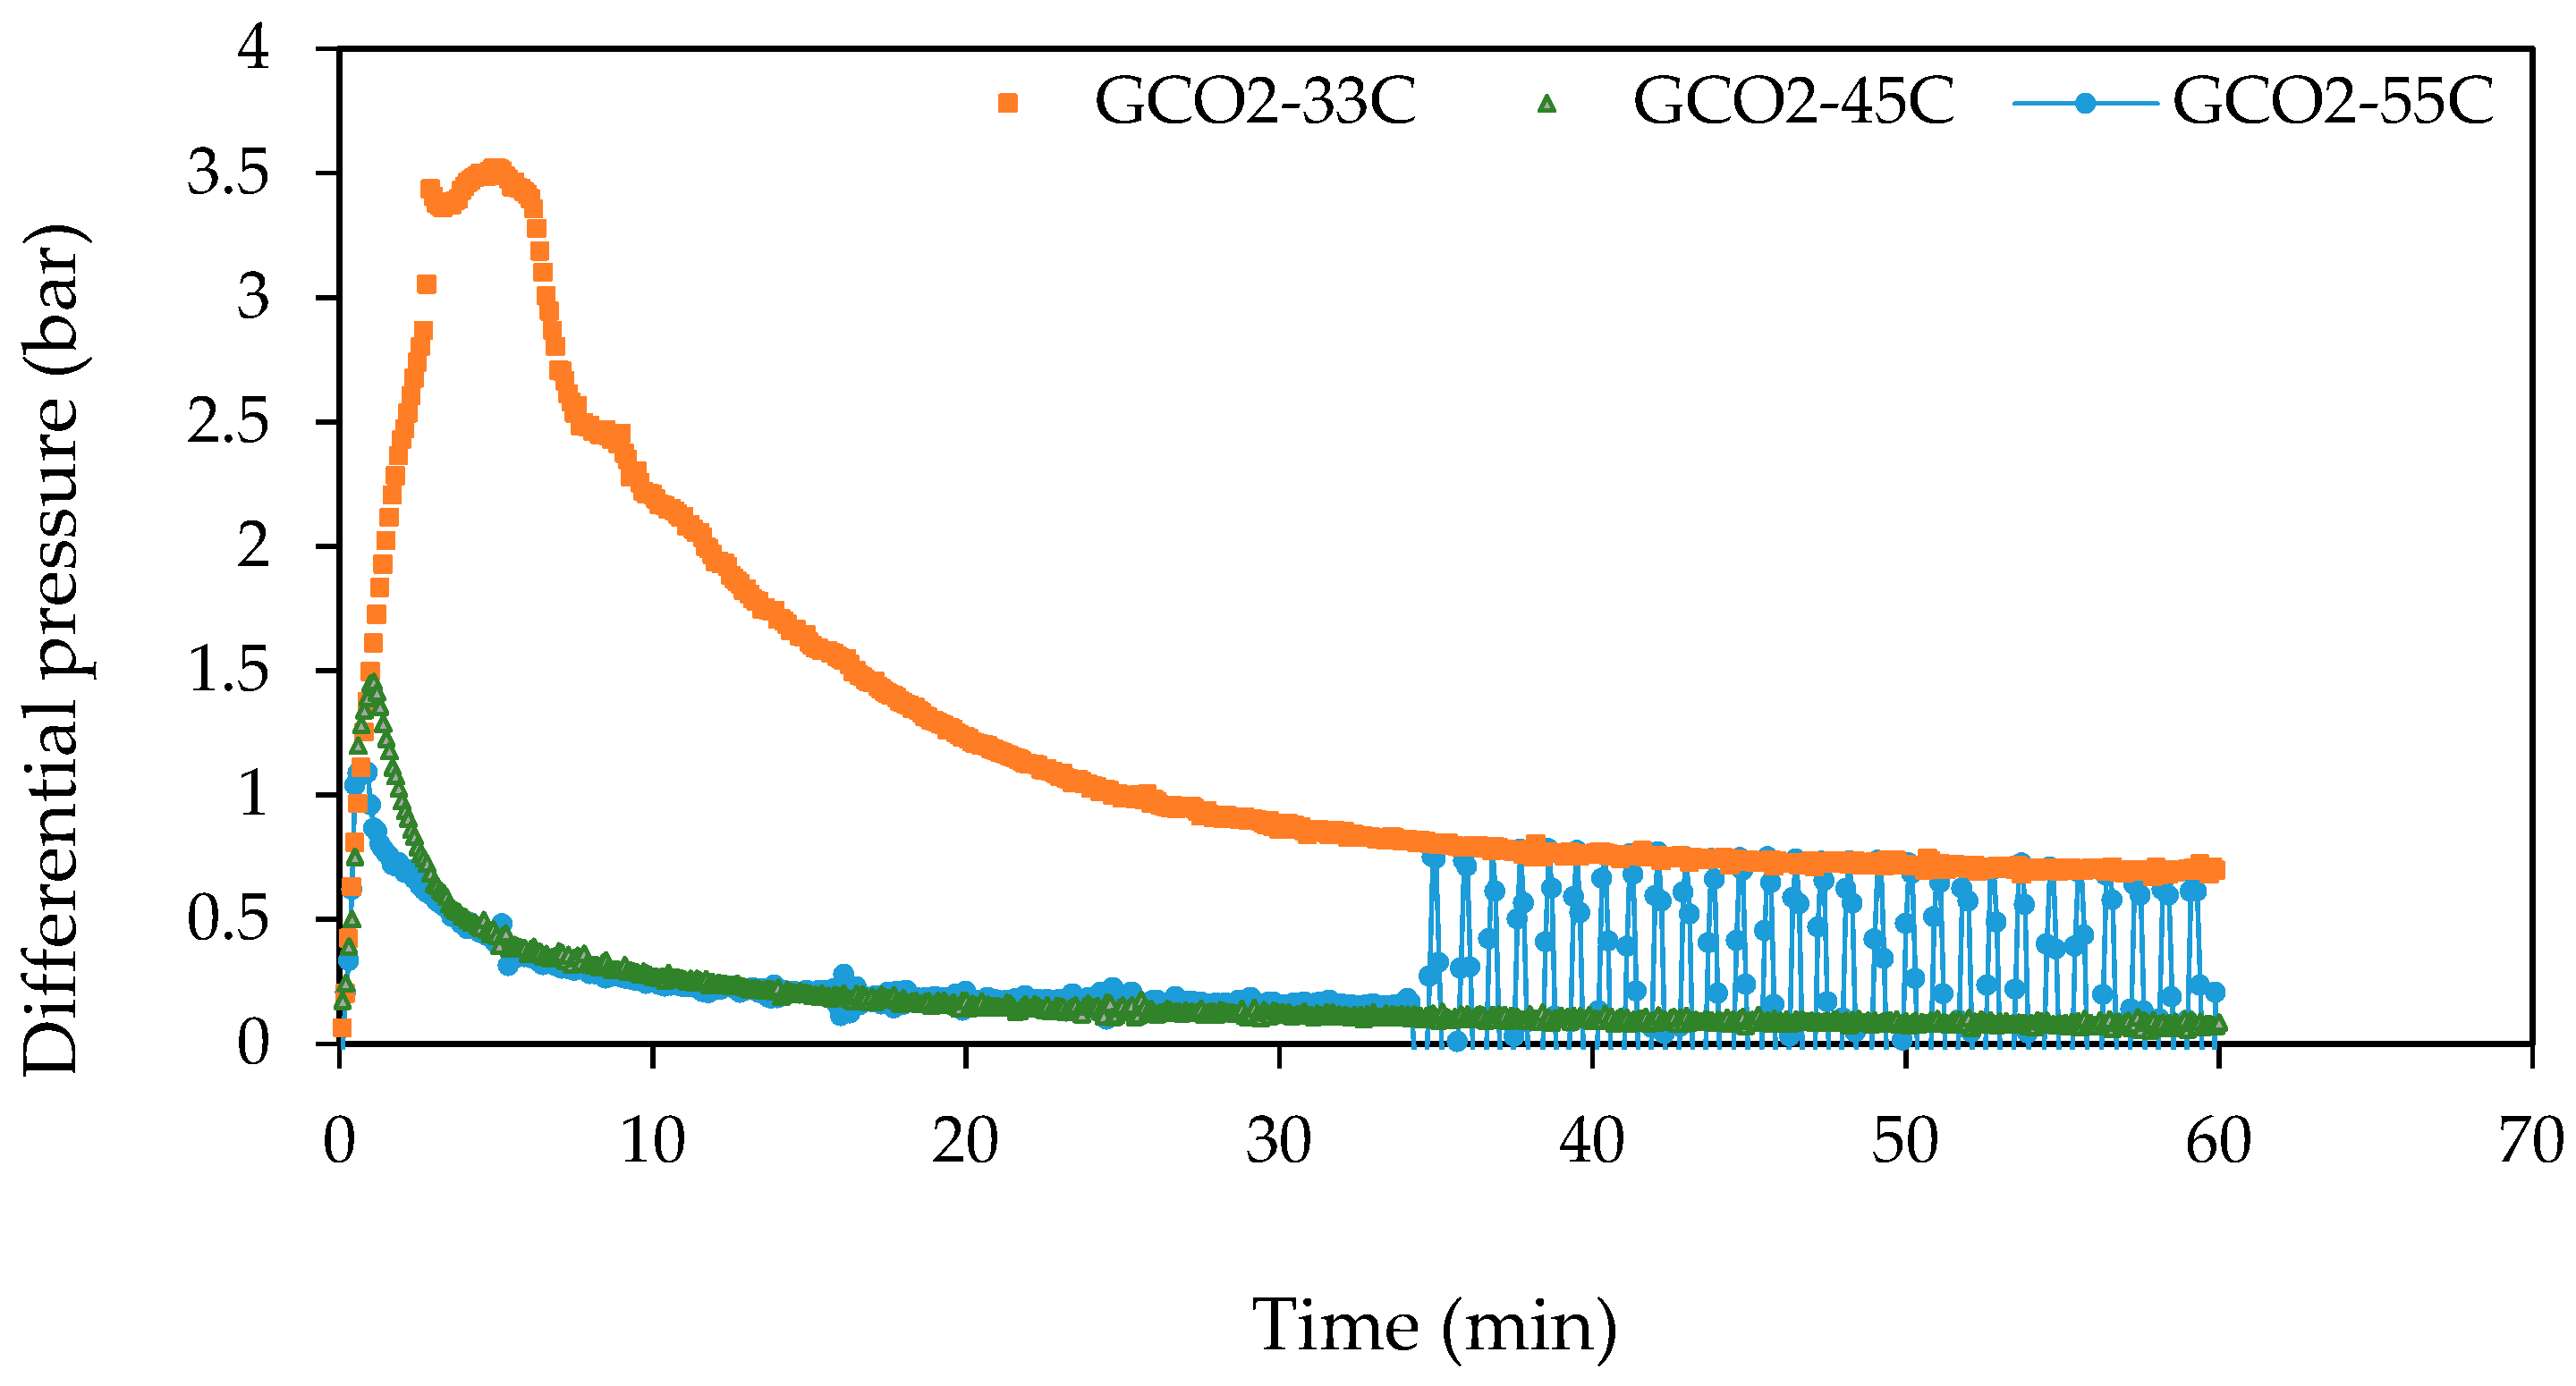
Figure 11.
Effect of experimental temperature on the differential pressure profile of LCO2–oil displacements conducted at 0.4 mL/min and 90 bar.
Figure 11.
Effect of experimental temperature on the differential pressure profile of LCO2–oil displacements conducted at 0.4 mL/min and 90 bar.

Figure 12.
Effect of experimental temperature on the differential pressure profile of ScCO2–oil displacements conducted at 0.4 mL/min and 90 bar.
Figure 12.
Effect of experimental temperature on the differential pressure profile of ScCO2–oil displacements conducted at 0.4 mL/min and 90 bar.
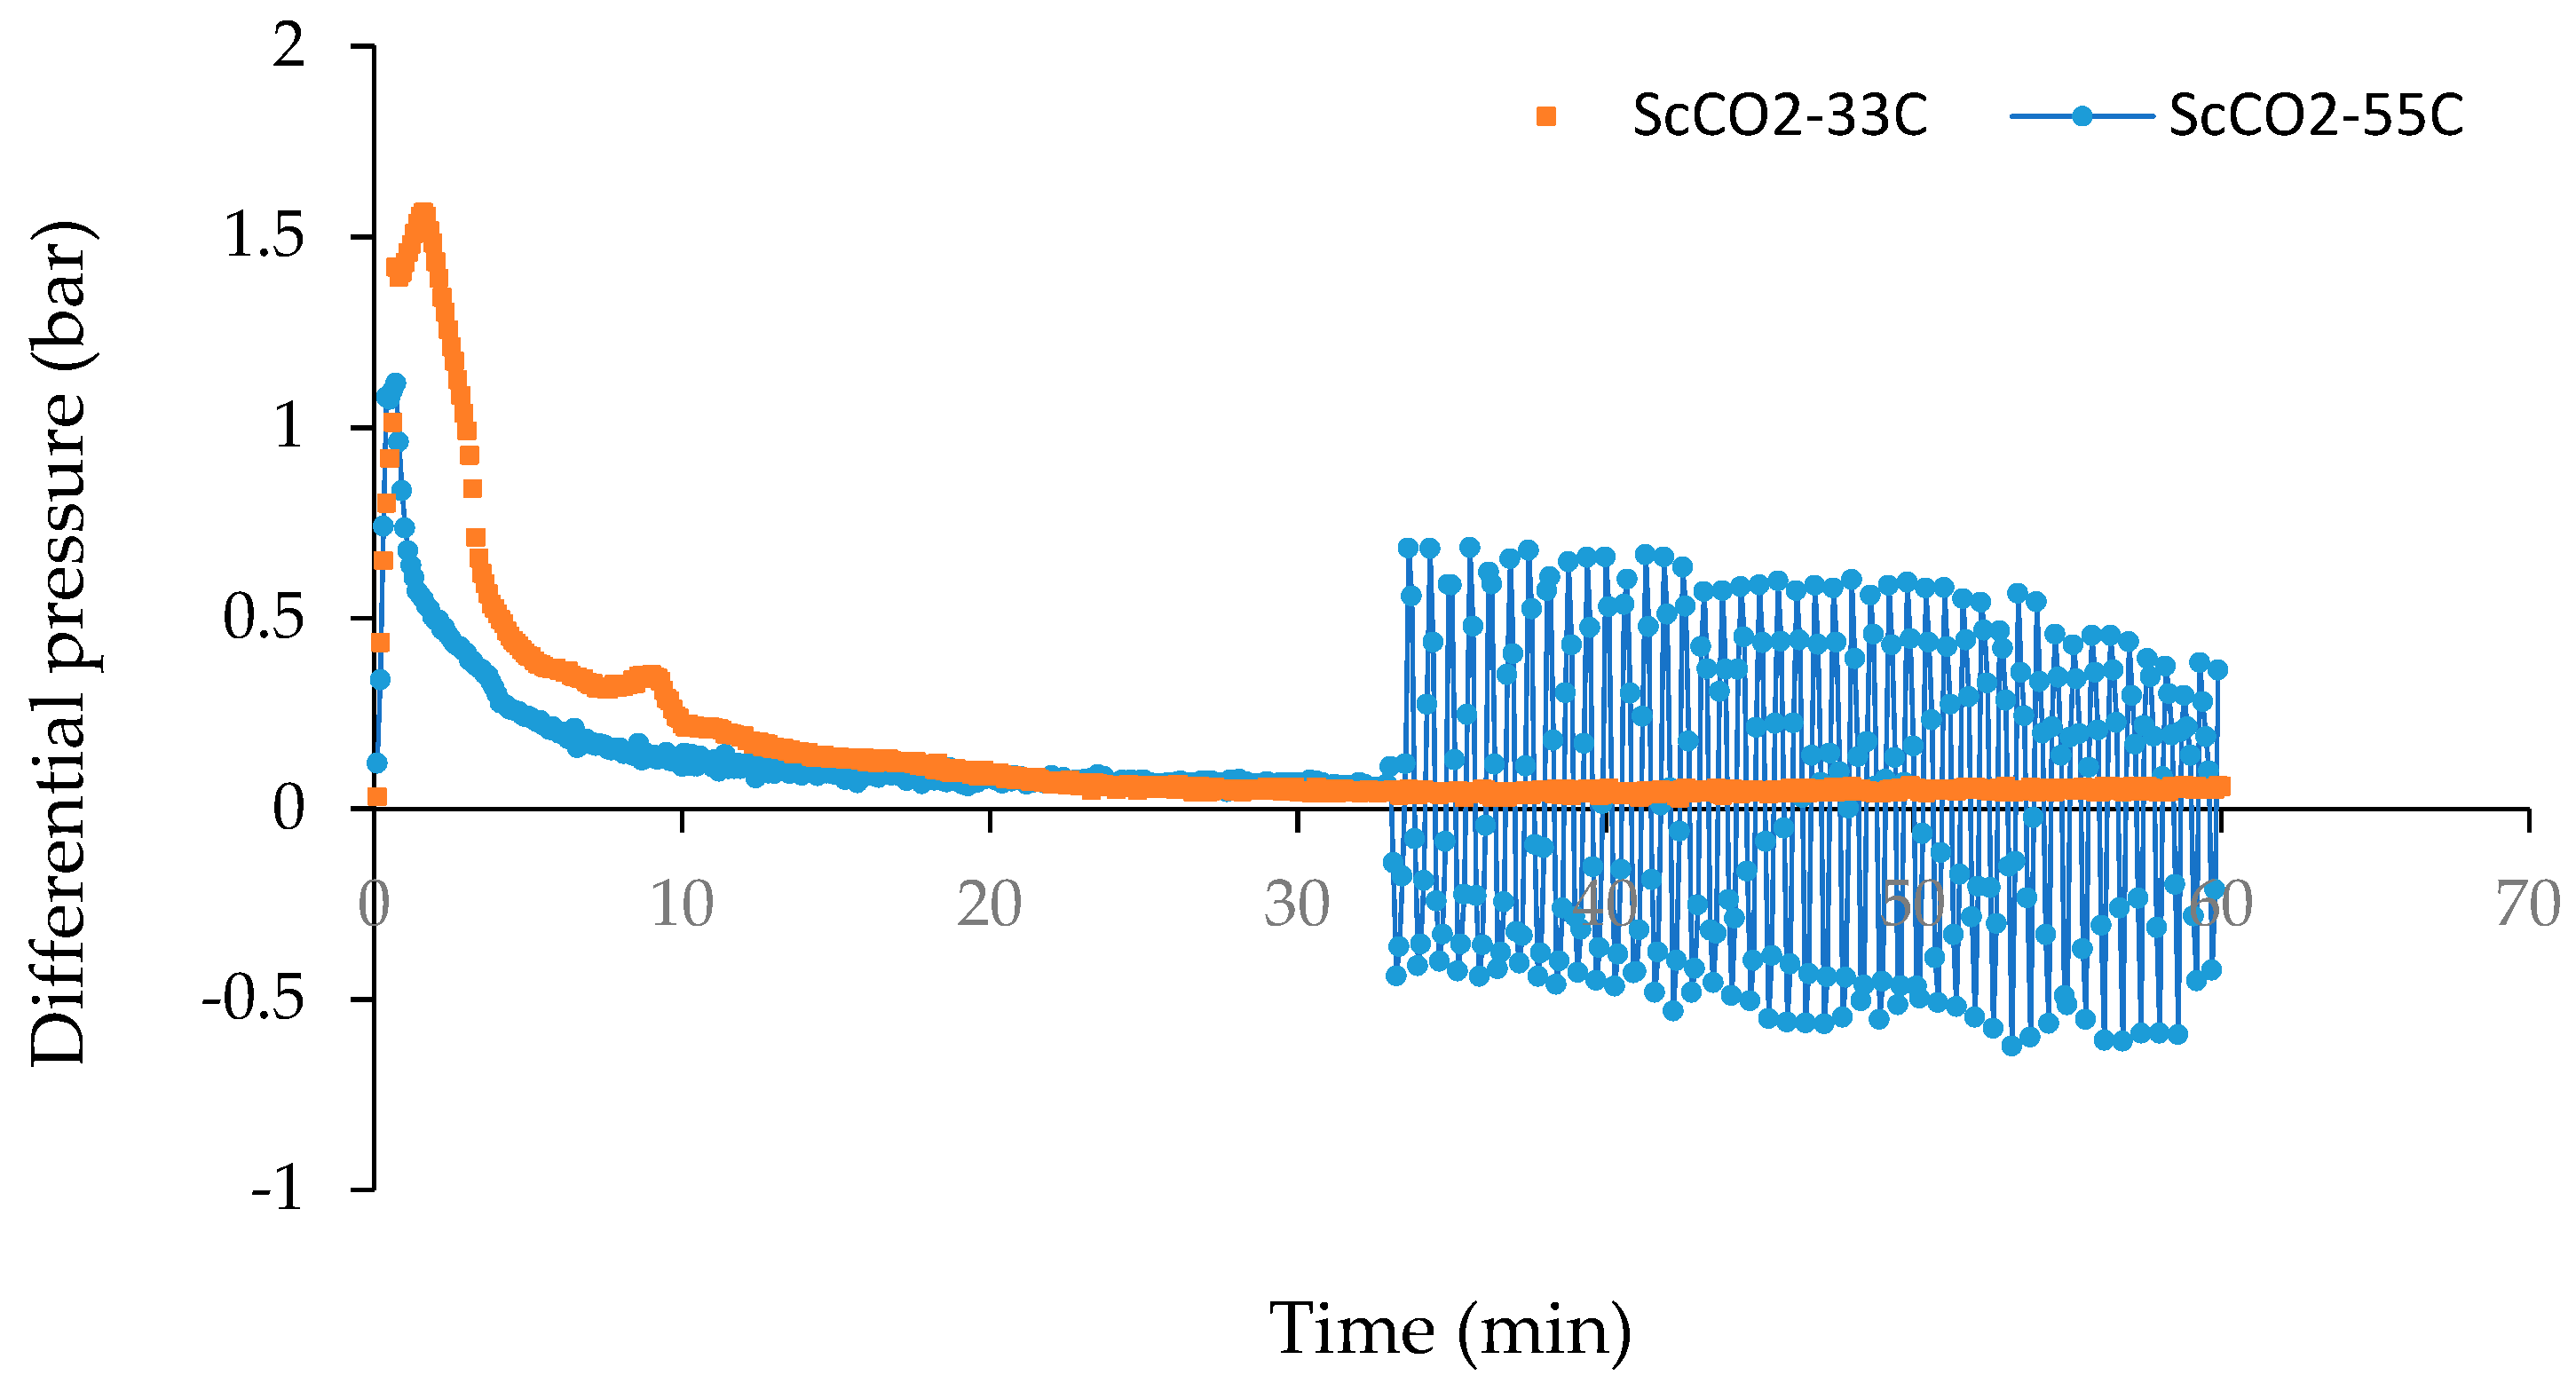
Figure 13.
Effect of injection rate on the differential pressure profile of low-pressure GCO2–oil displacements conducted at 40 bar and 33 °C.
Figure 13.
Effect of injection rate on the differential pressure profile of low-pressure GCO2–oil displacements conducted at 40 bar and 33 °C.
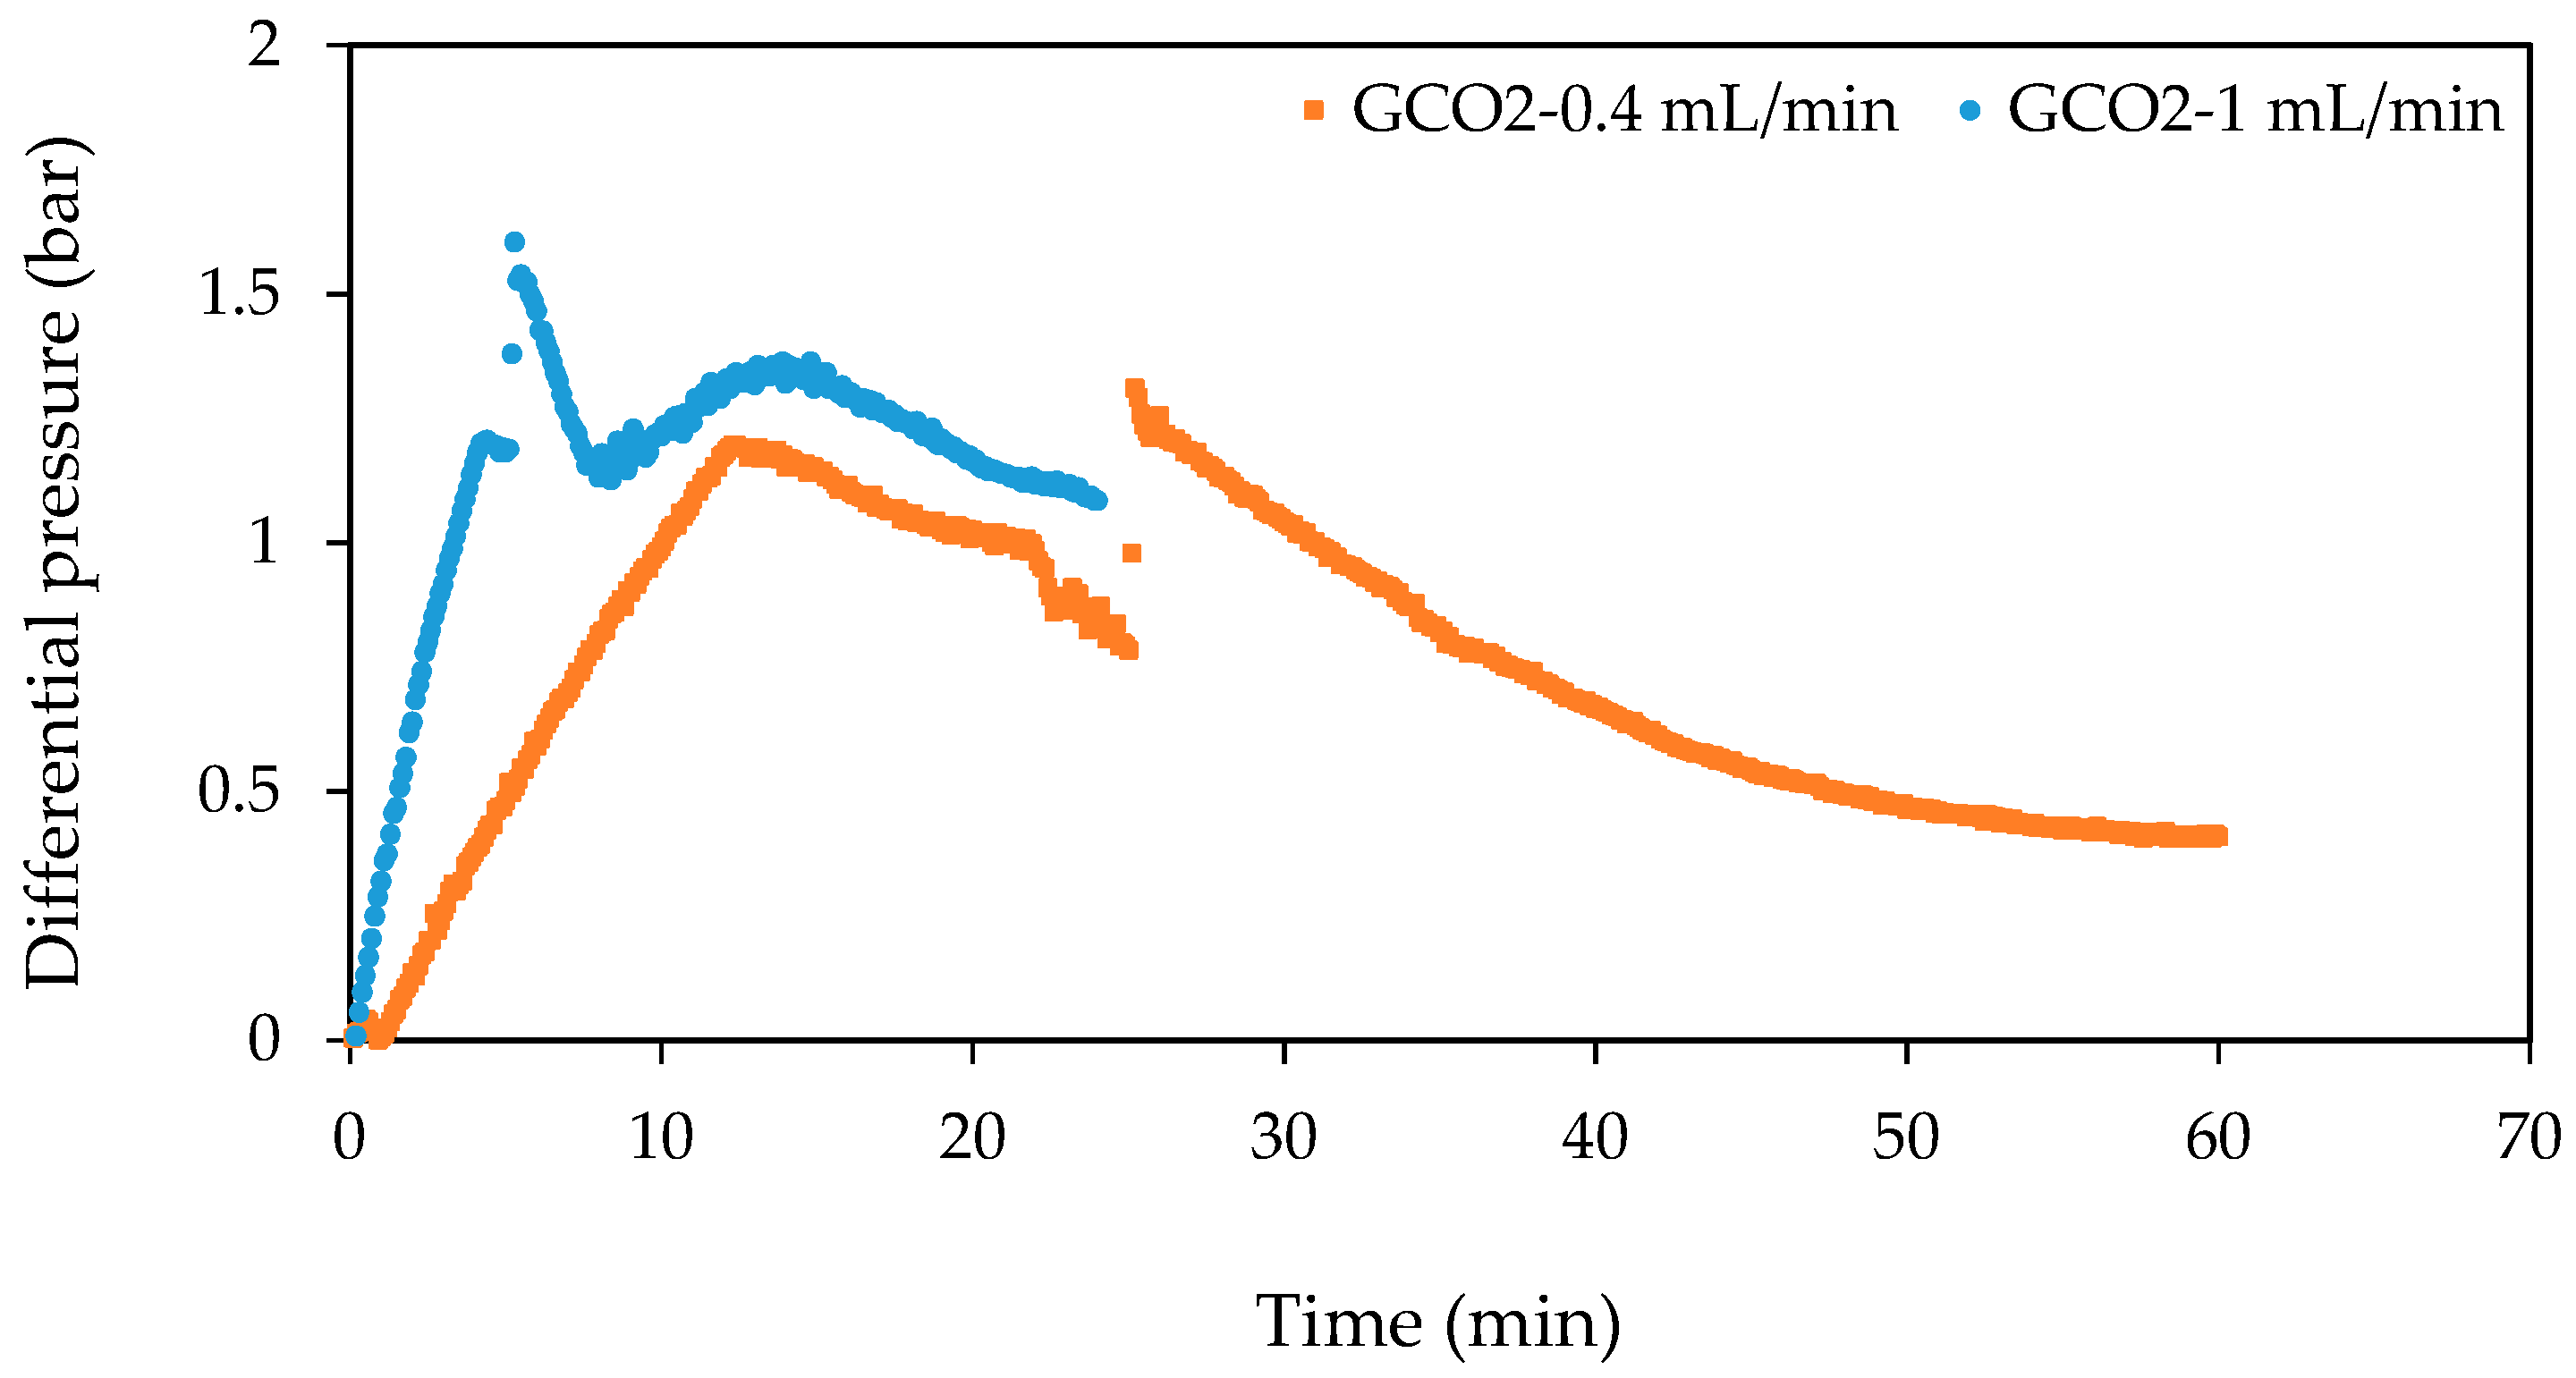
Figure 14.
Effect of injection rate on the differential pressure profile of high-pressure GCO2–oil displacements conducted at 70 bar and 33 °C.
Figure 14.
Effect of injection rate on the differential pressure profile of high-pressure GCO2–oil displacements conducted at 70 bar and 33 °C.
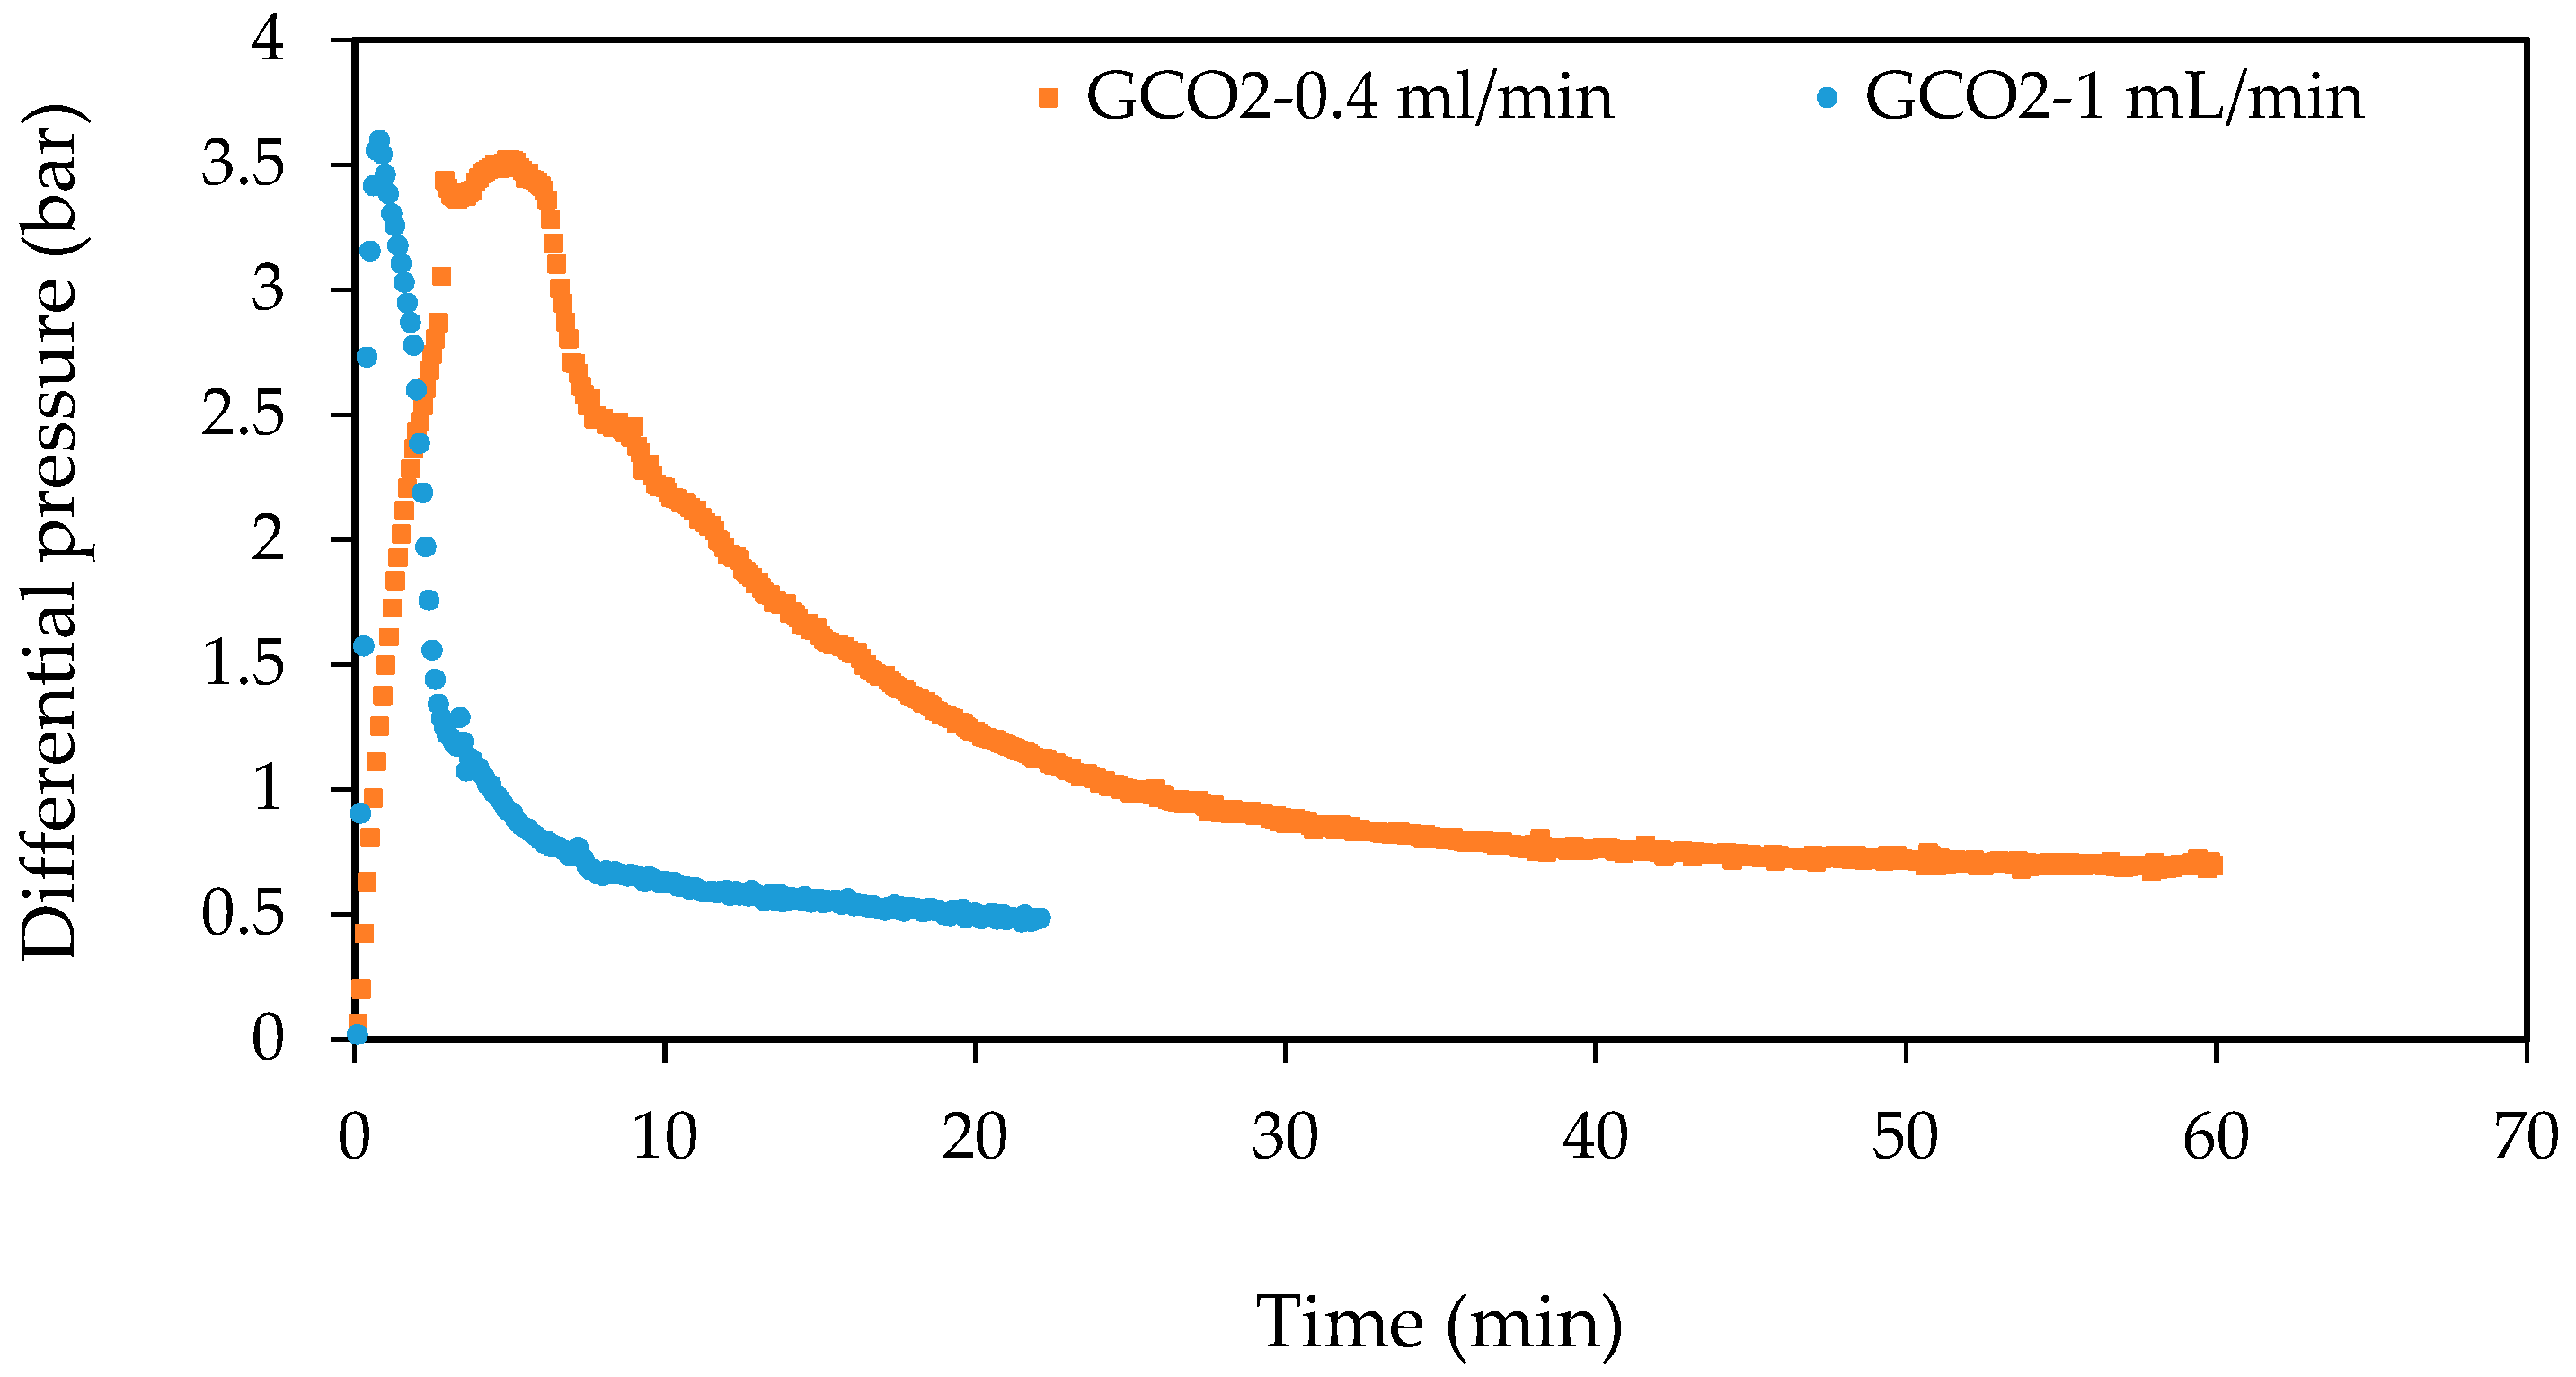
Figure 15.
Effect of injection rate on the differential pressure profile of LCO2–oil displacements conducted at 70 bar and 20 °C.
Figure 15.
Effect of injection rate on the differential pressure profile of LCO2–oil displacements conducted at 70 bar and 20 °C.
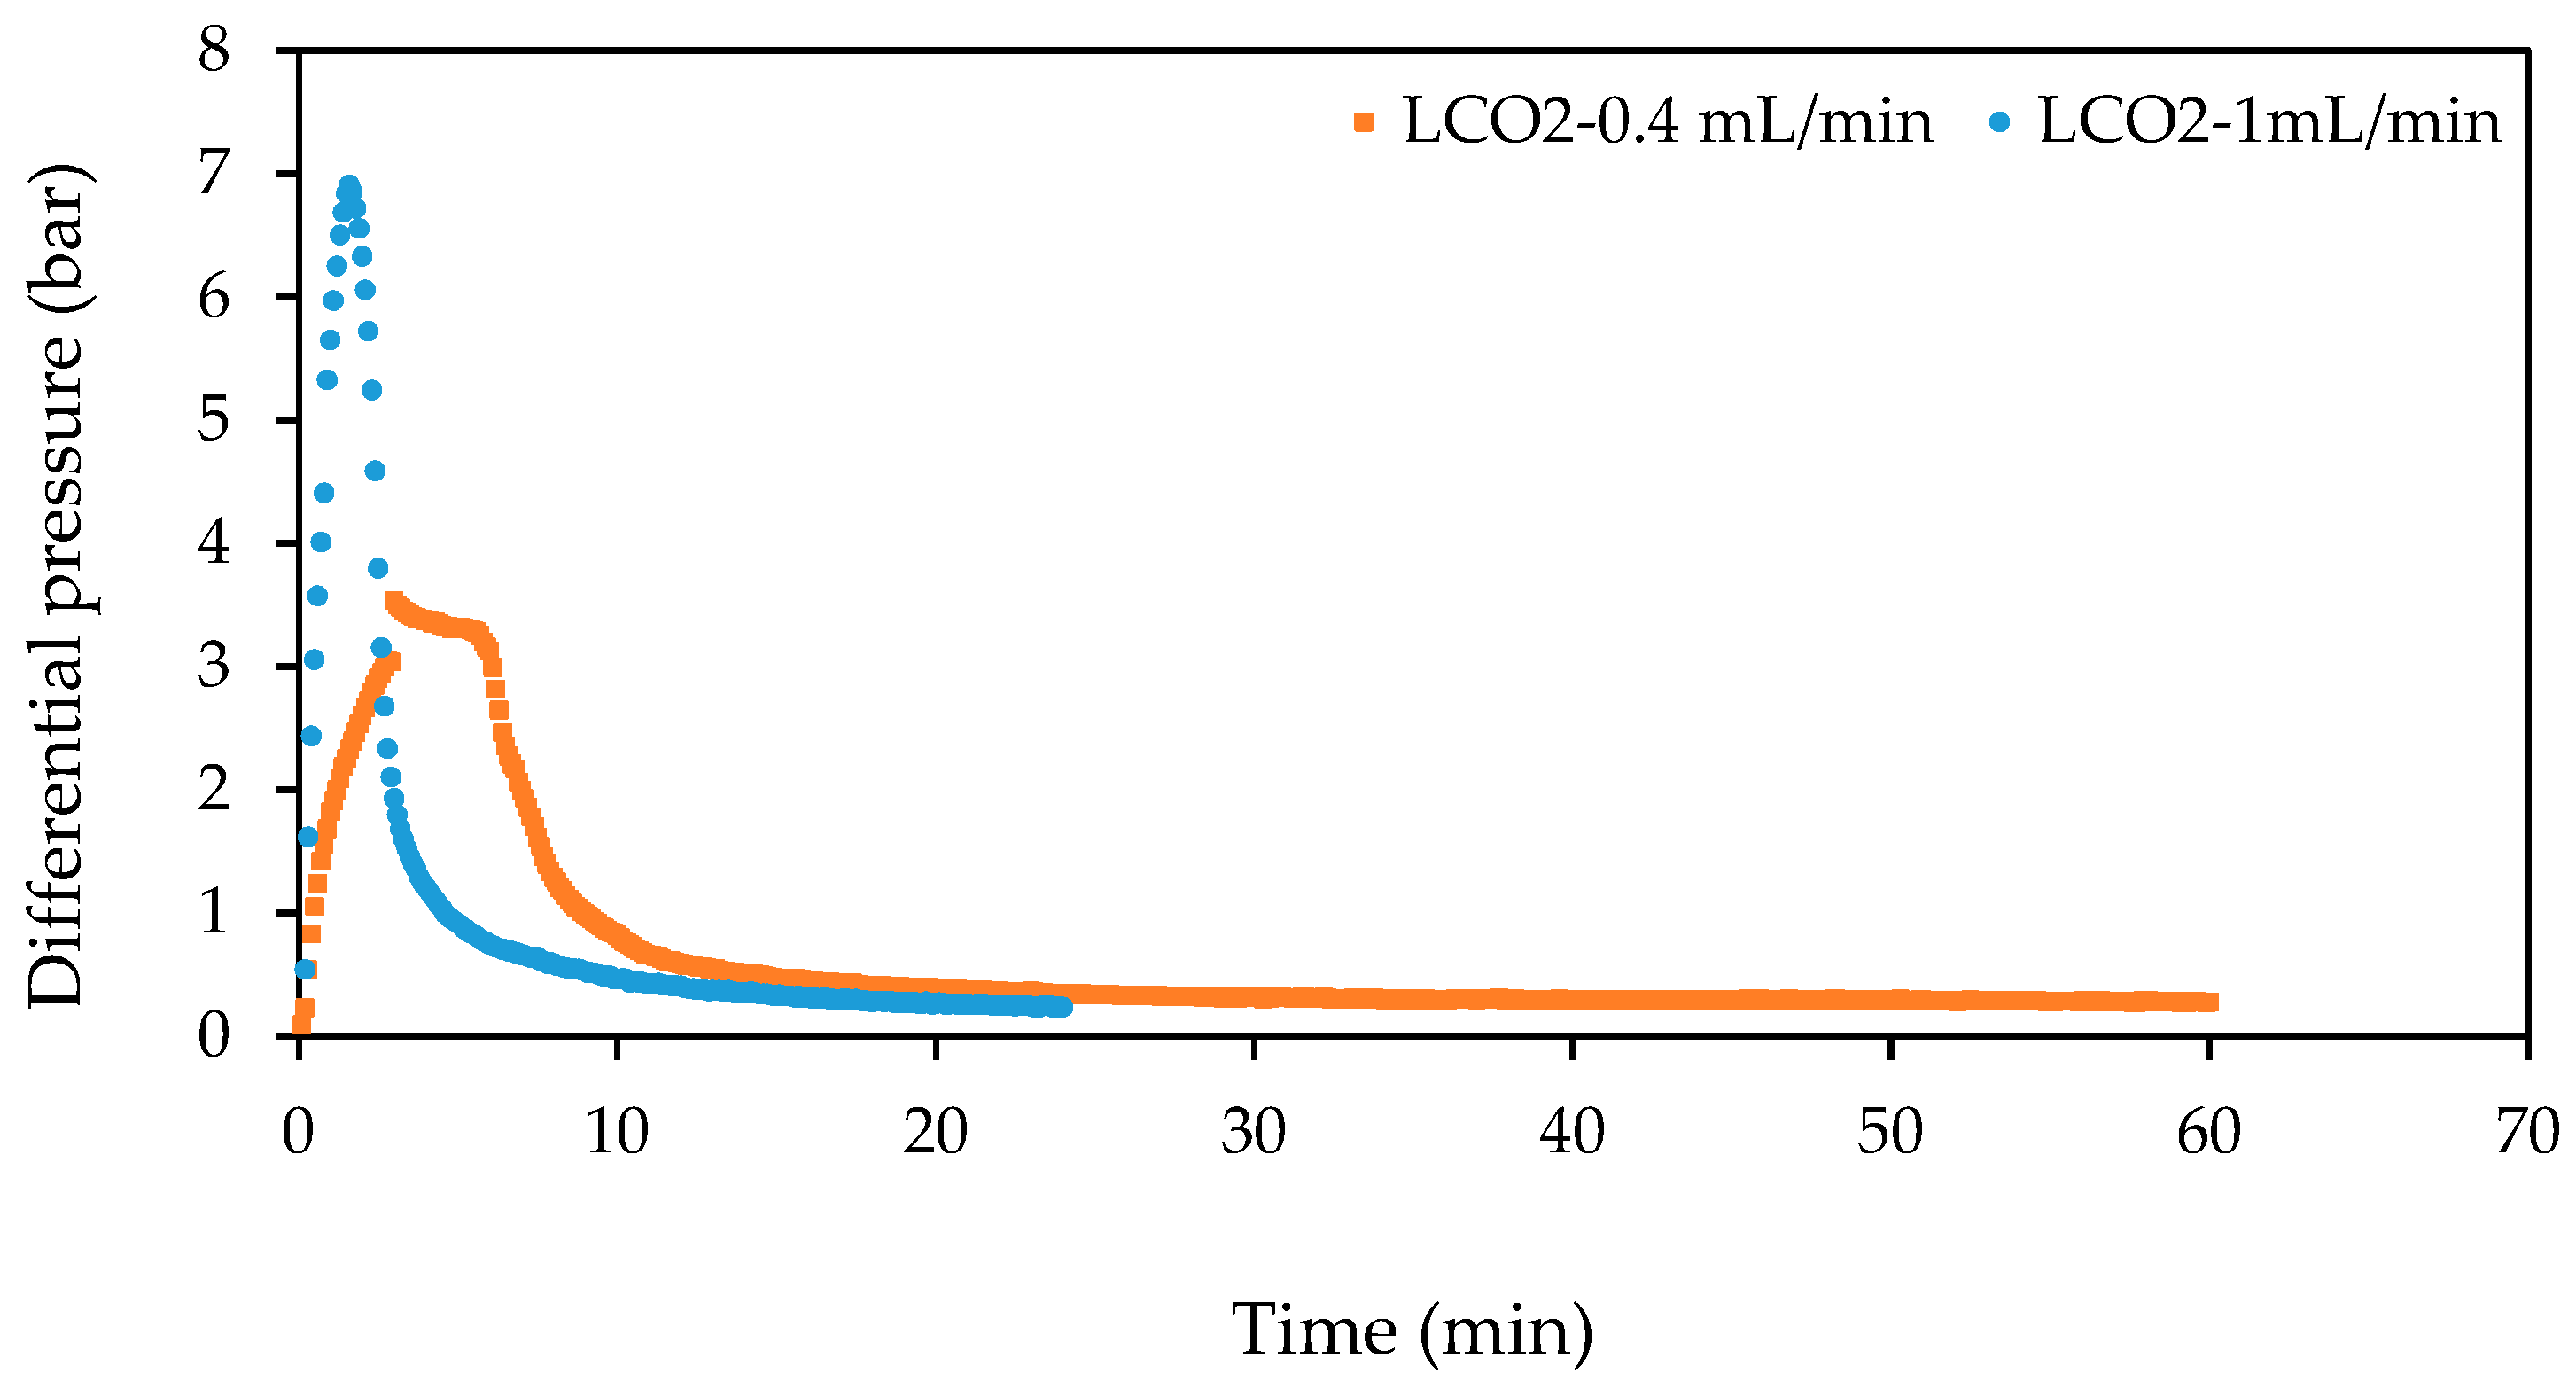
Figure 16.
Effect of injection rate on the differential pressure profile of ScCO2–oil displacements conducted at 90 bar and 33 °C.
Figure 16.
Effect of injection rate on the differential pressure profile of ScCO2–oil displacements conducted at 90 bar and 33 °C.

Figure 17.
Effect of fluid pressure on the cumulative produced volumes of oil and CO2 for low-fluid-pressure GCO2–oil displacements conducted at 33 °C and 0.4 mL/min.
Figure 17.
Effect of fluid pressure on the cumulative produced volumes of oil and CO2 for low-fluid-pressure GCO2–oil displacements conducted at 33 °C and 0.4 mL/min.
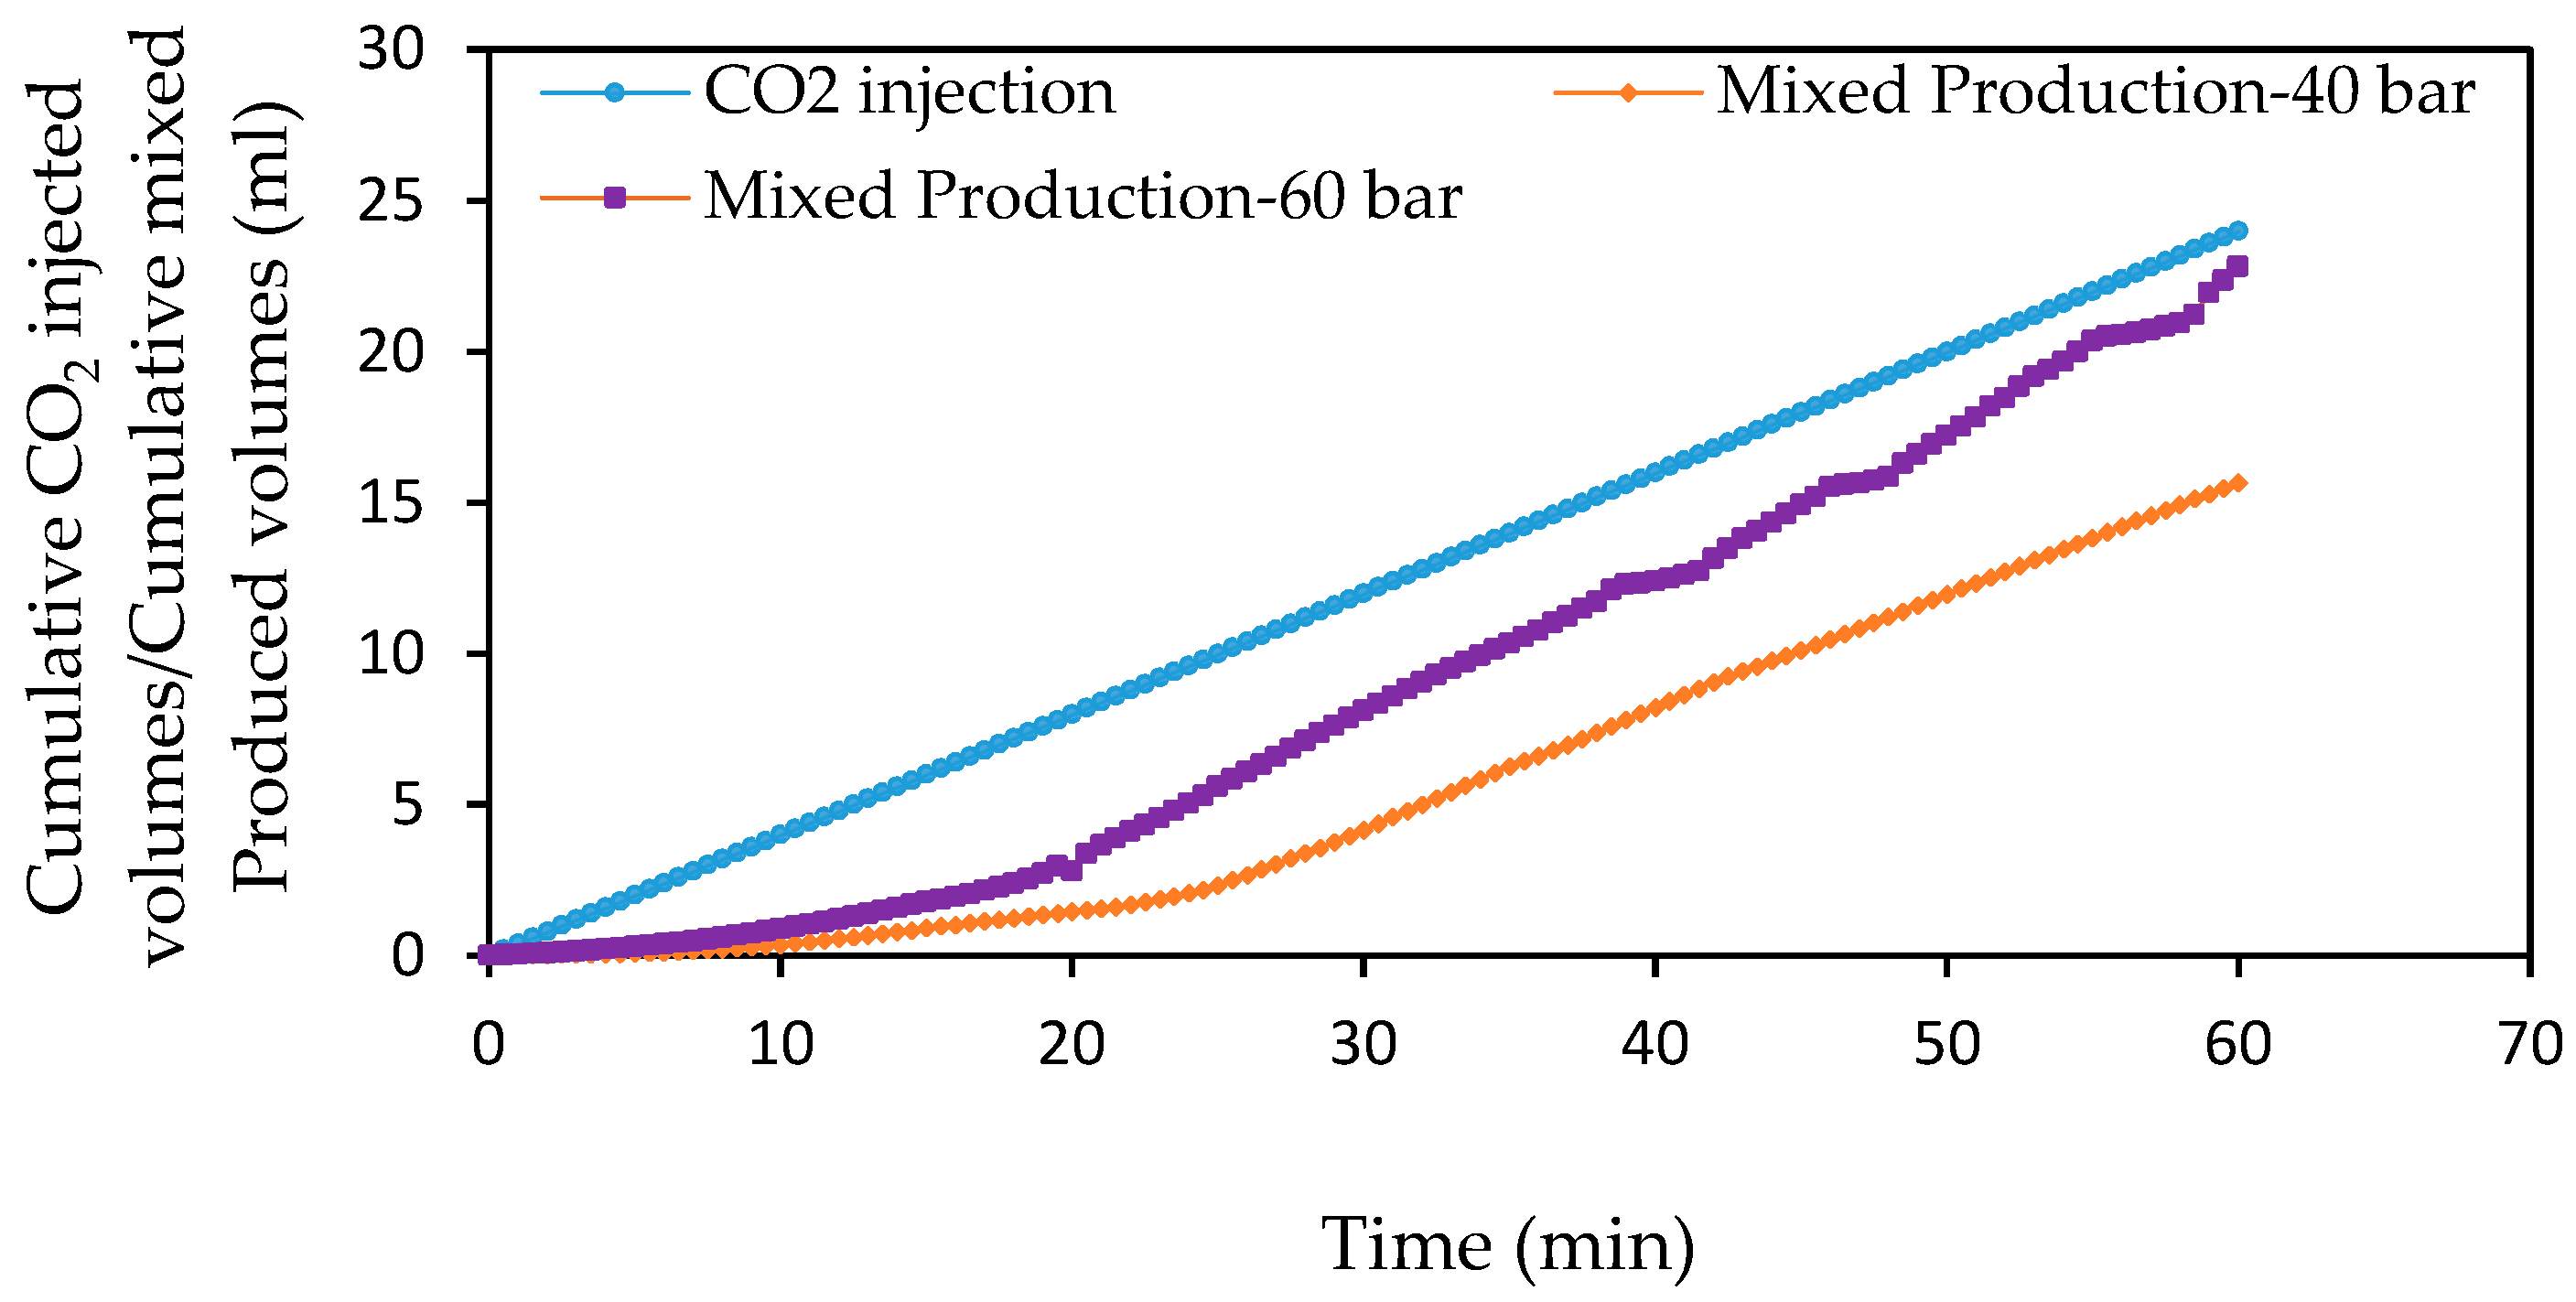
Figure 18.
Effect of fluid pressure on the cumulative produced volumes of oil and CO2 for high-fluid-pressure GCO2–oil displacements conducted at 33 °C and 0.4 mL/min.
Figure 18.
Effect of fluid pressure on the cumulative produced volumes of oil and CO2 for high-fluid-pressure GCO2–oil displacements conducted at 33 °C and 0.4 mL/min.
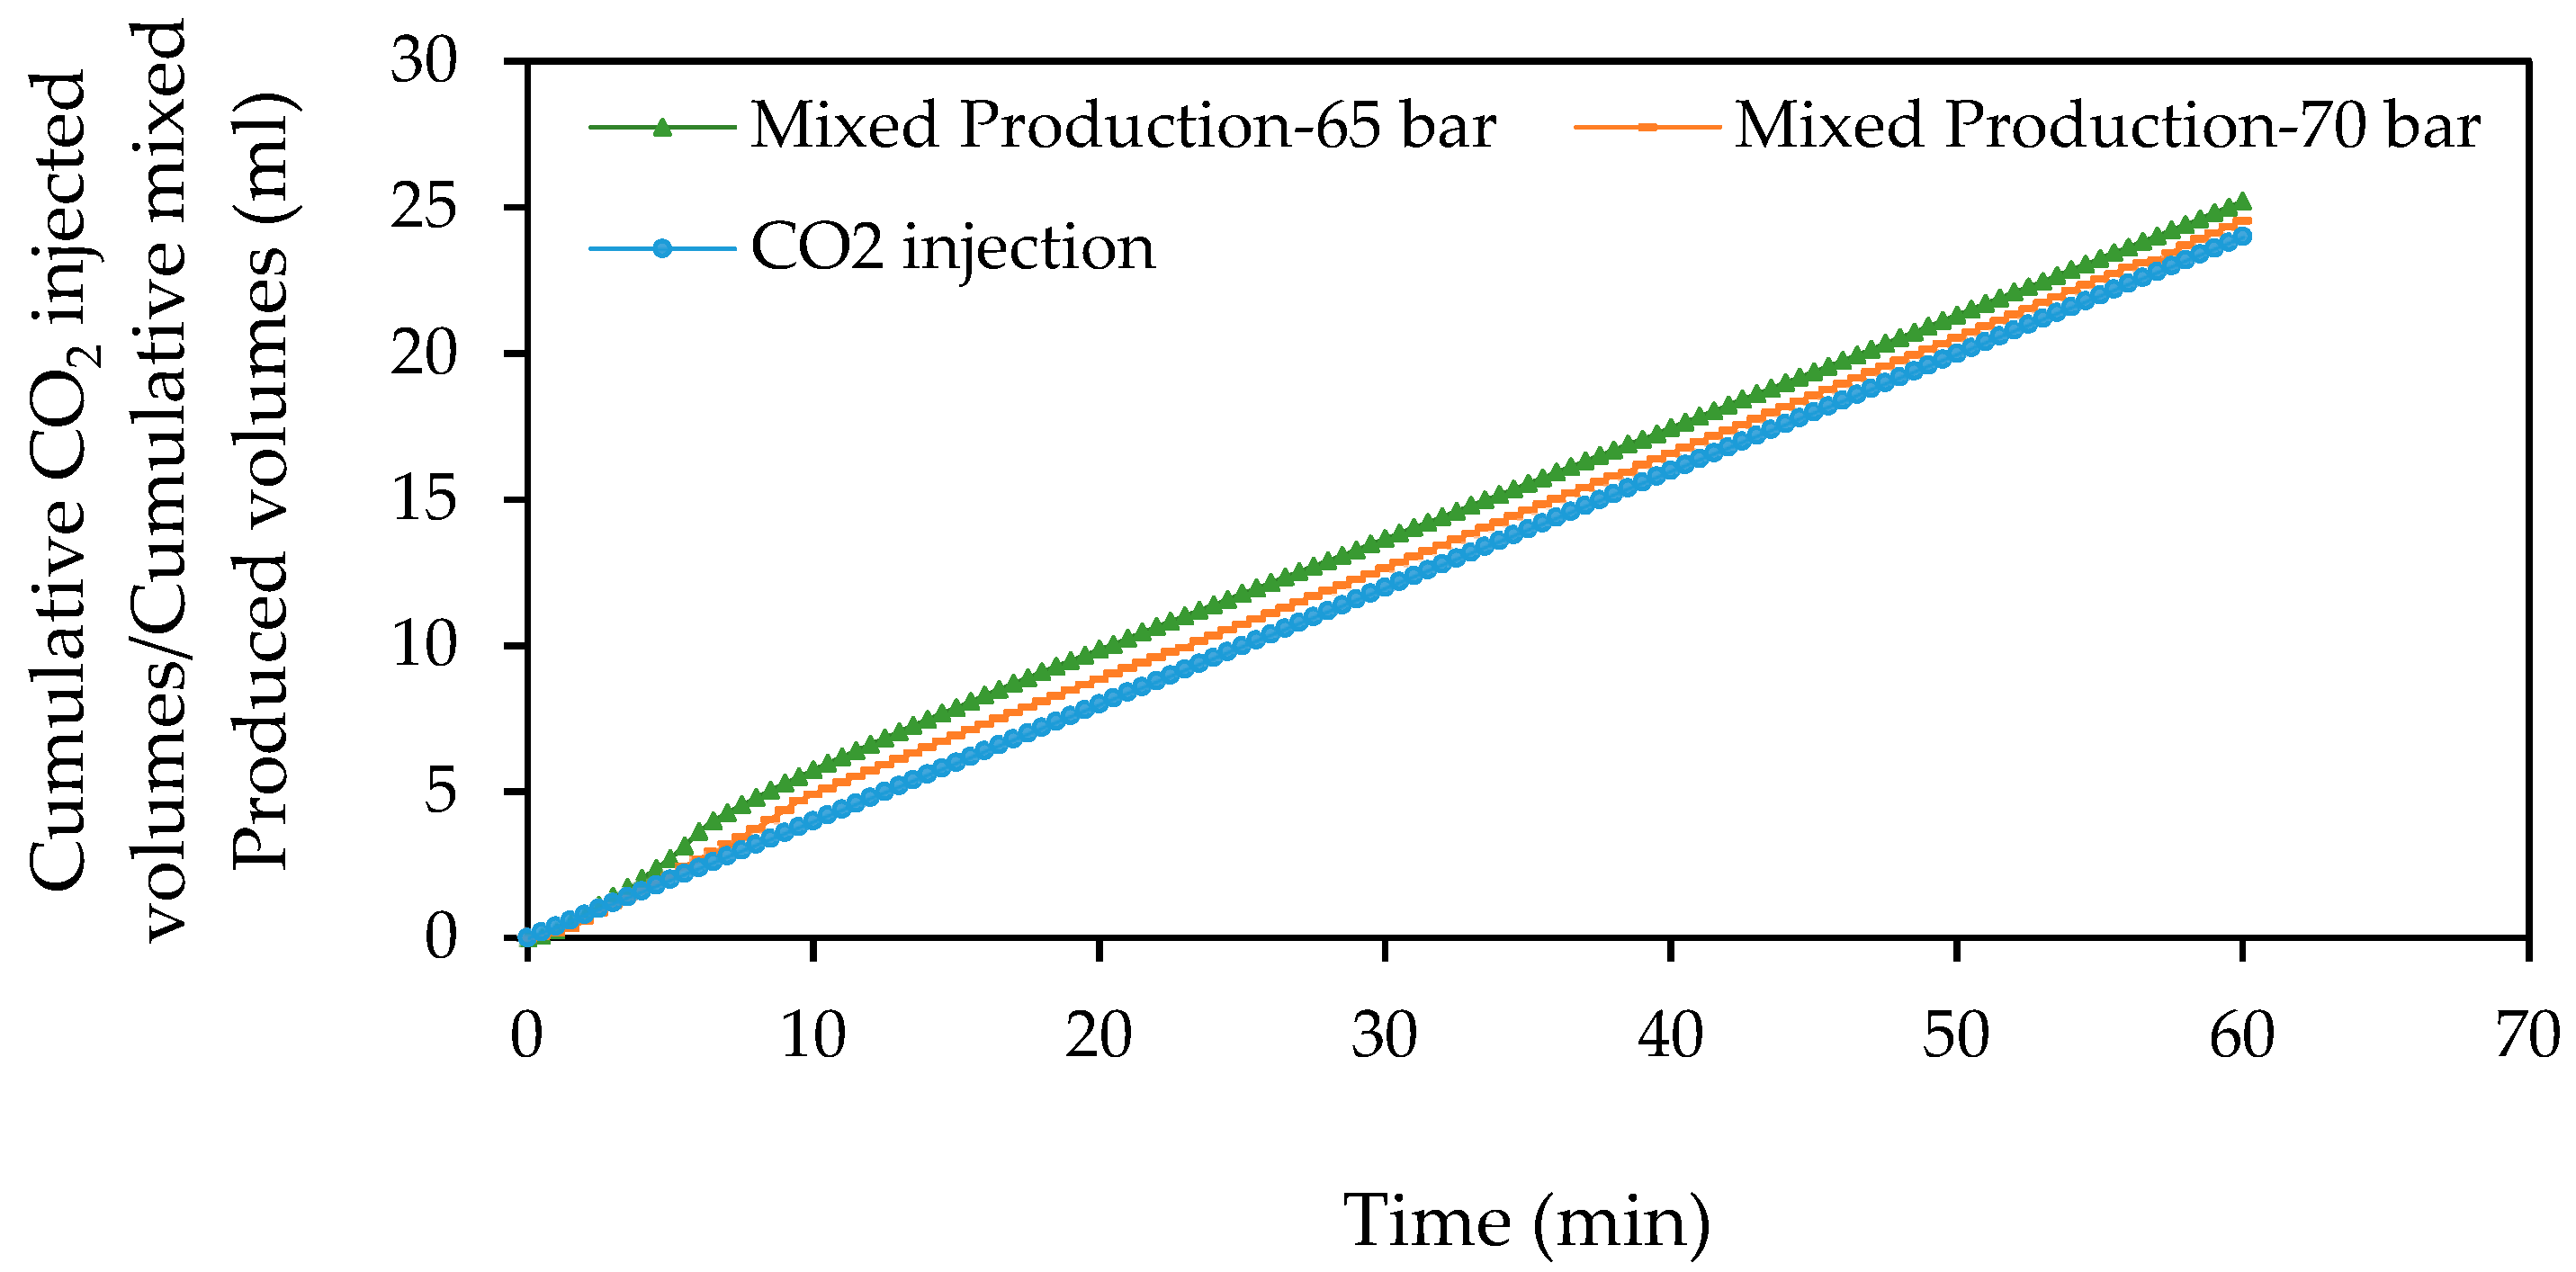
Figure 19.
Effect of fluid pressure on the cumulative produced volumes of oil and CO2 for LCO2–oil displacements conducted at 20 °C and 0.4 mL/min.
Figure 19.
Effect of fluid pressure on the cumulative produced volumes of oil and CO2 for LCO2–oil displacements conducted at 20 °C and 0.4 mL/min.

Figure 20.
Effect of fluid pressure on the cumulative produced volumes of oil and CO2 for ScCO2–oil displacements conducted at 33 °C and 0.4 mL/min.
Figure 20.
Effect of fluid pressure on the cumulative produced volumes of oil and CO2 for ScCO2–oil displacements conducted at 33 °C and 0.4 mL/min.

Figure 21.
Effect of experimental temperature on the cumulative produced volumes of oil and CO2 for low-pressure GCO2–oil displacements conducted at 40 bar and 0.4 mL/min.
Figure 21.
Effect of experimental temperature on the cumulative produced volumes of oil and CO2 for low-pressure GCO2–oil displacements conducted at 40 bar and 0.4 mL/min.
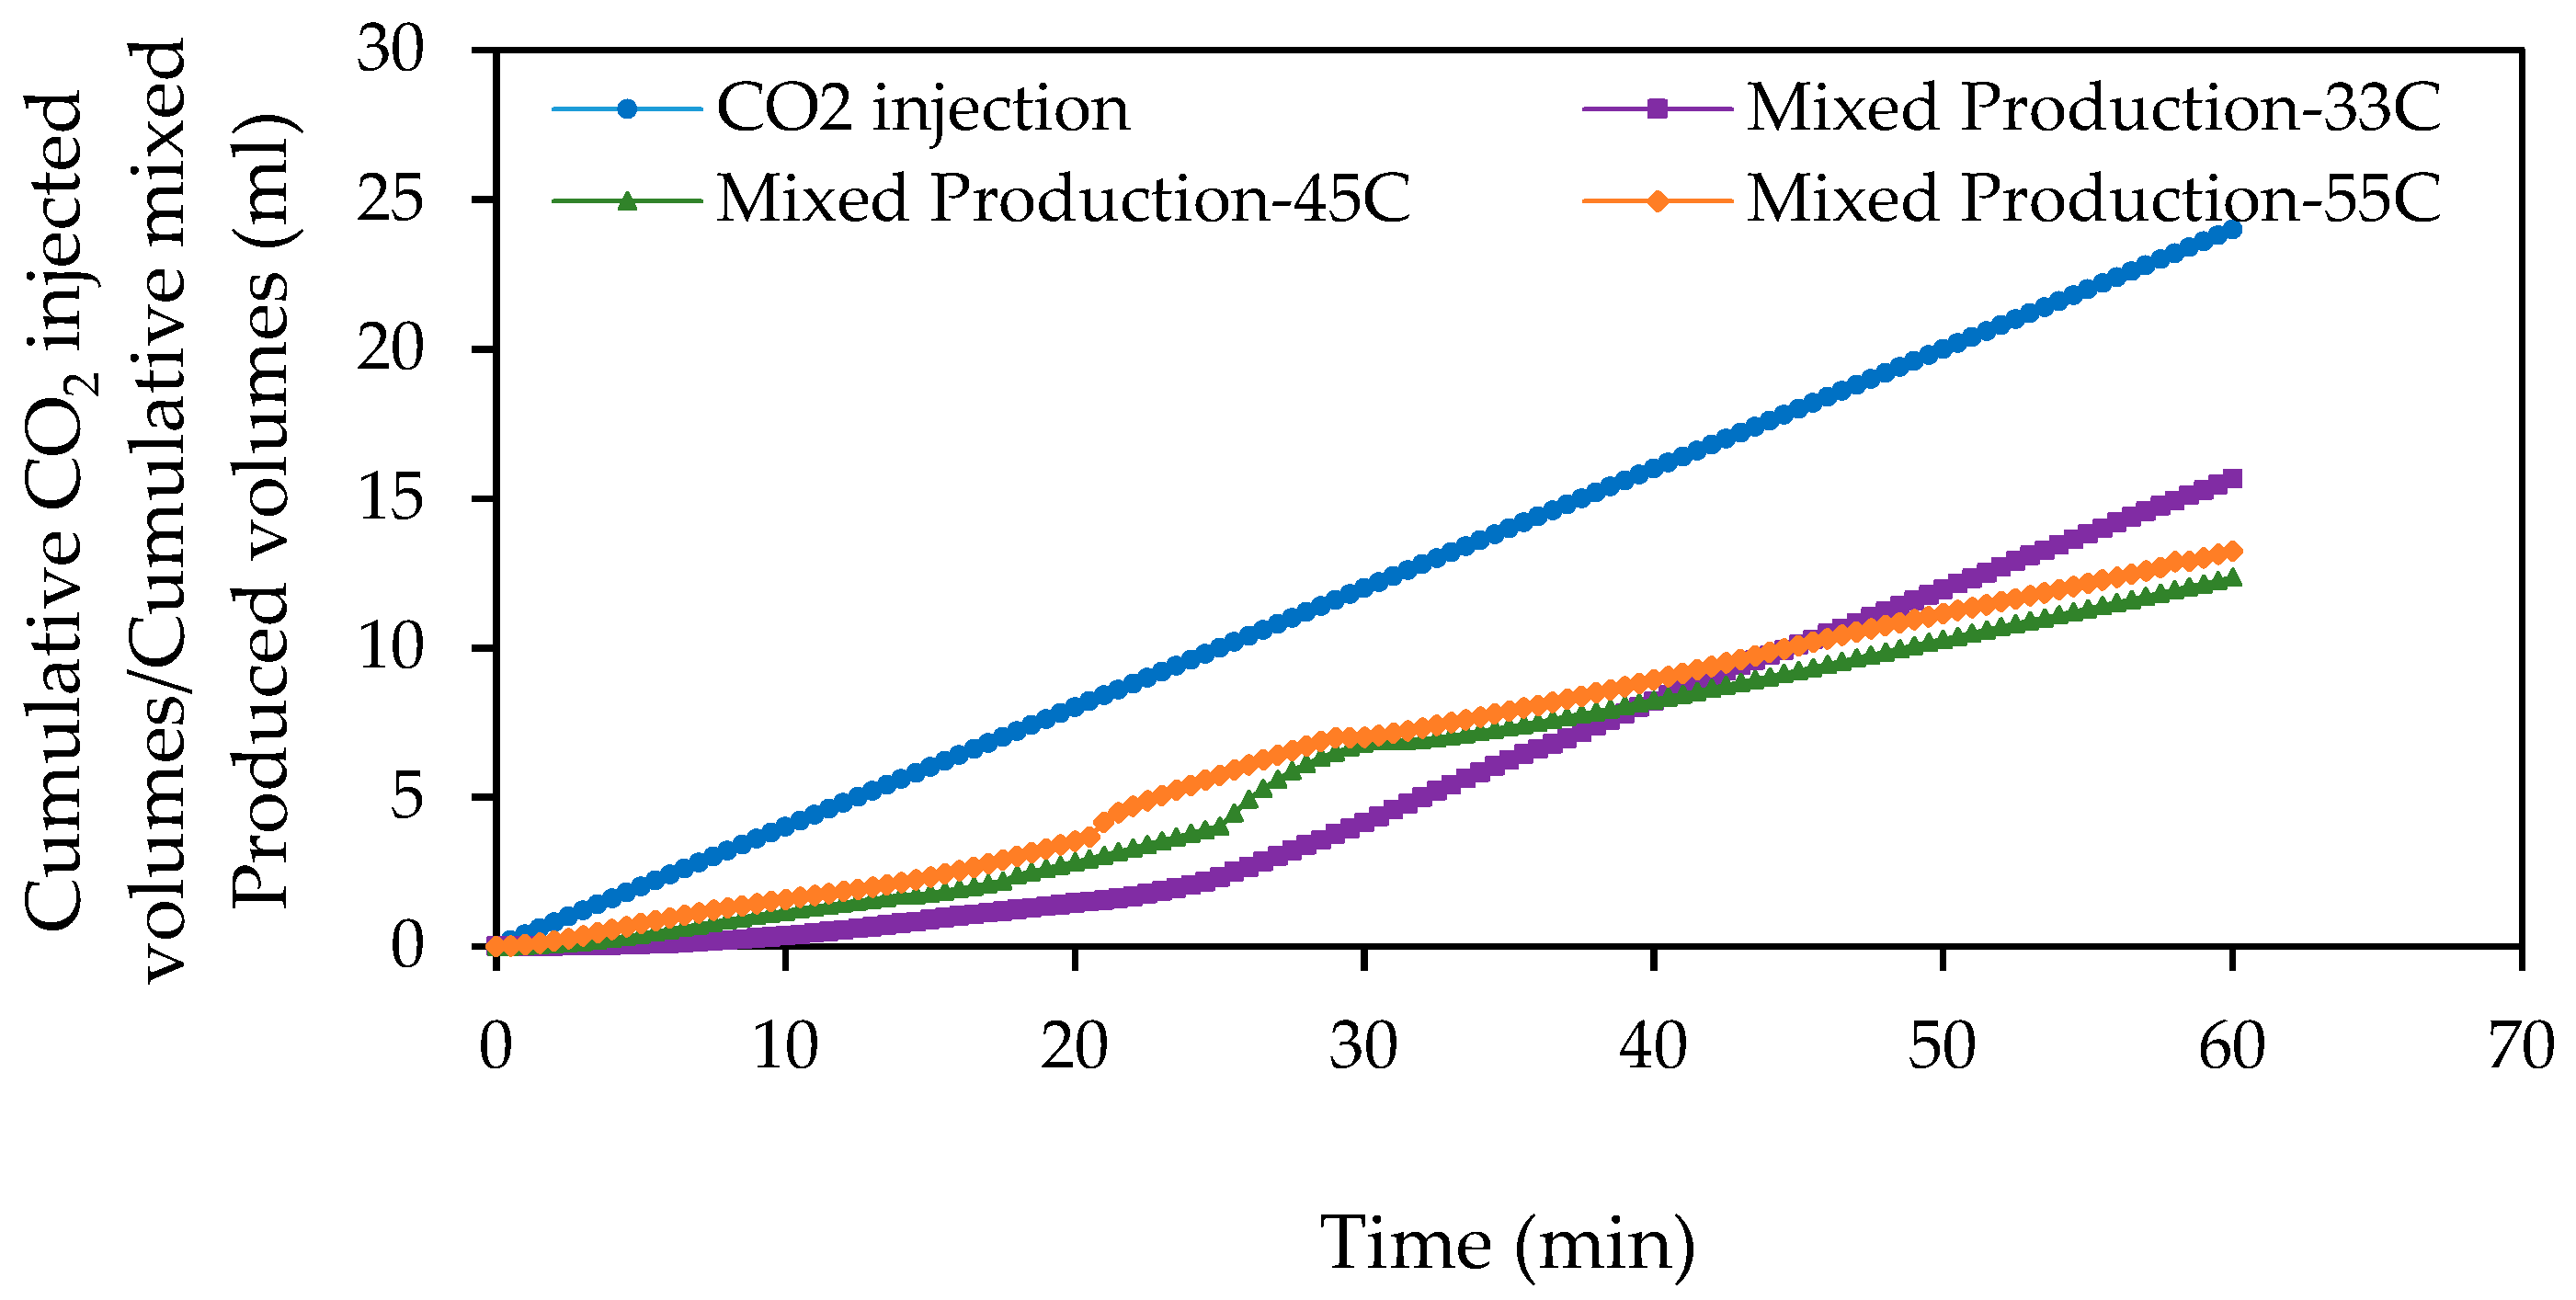
Figure 22.
Effect of experimental temperature on the cumulative produced volumes of oil and CO2 for high-pressure GCO2–oil displacements conducted at 70 bar and 0.4 mL/min.
Figure 22.
Effect of experimental temperature on the cumulative produced volumes of oil and CO2 for high-pressure GCO2–oil displacements conducted at 70 bar and 0.4 mL/min.

Figure 23.
Effect of experimental temperature on the cumulative produced volumes of oil and CO2 for LCO2–oil displacements conducted at 90 bar and 0.4 mL/min.
Figure 23.
Effect of experimental temperature on the cumulative produced volumes of oil and CO2 for LCO2–oil displacements conducted at 90 bar and 0.4 mL/min.
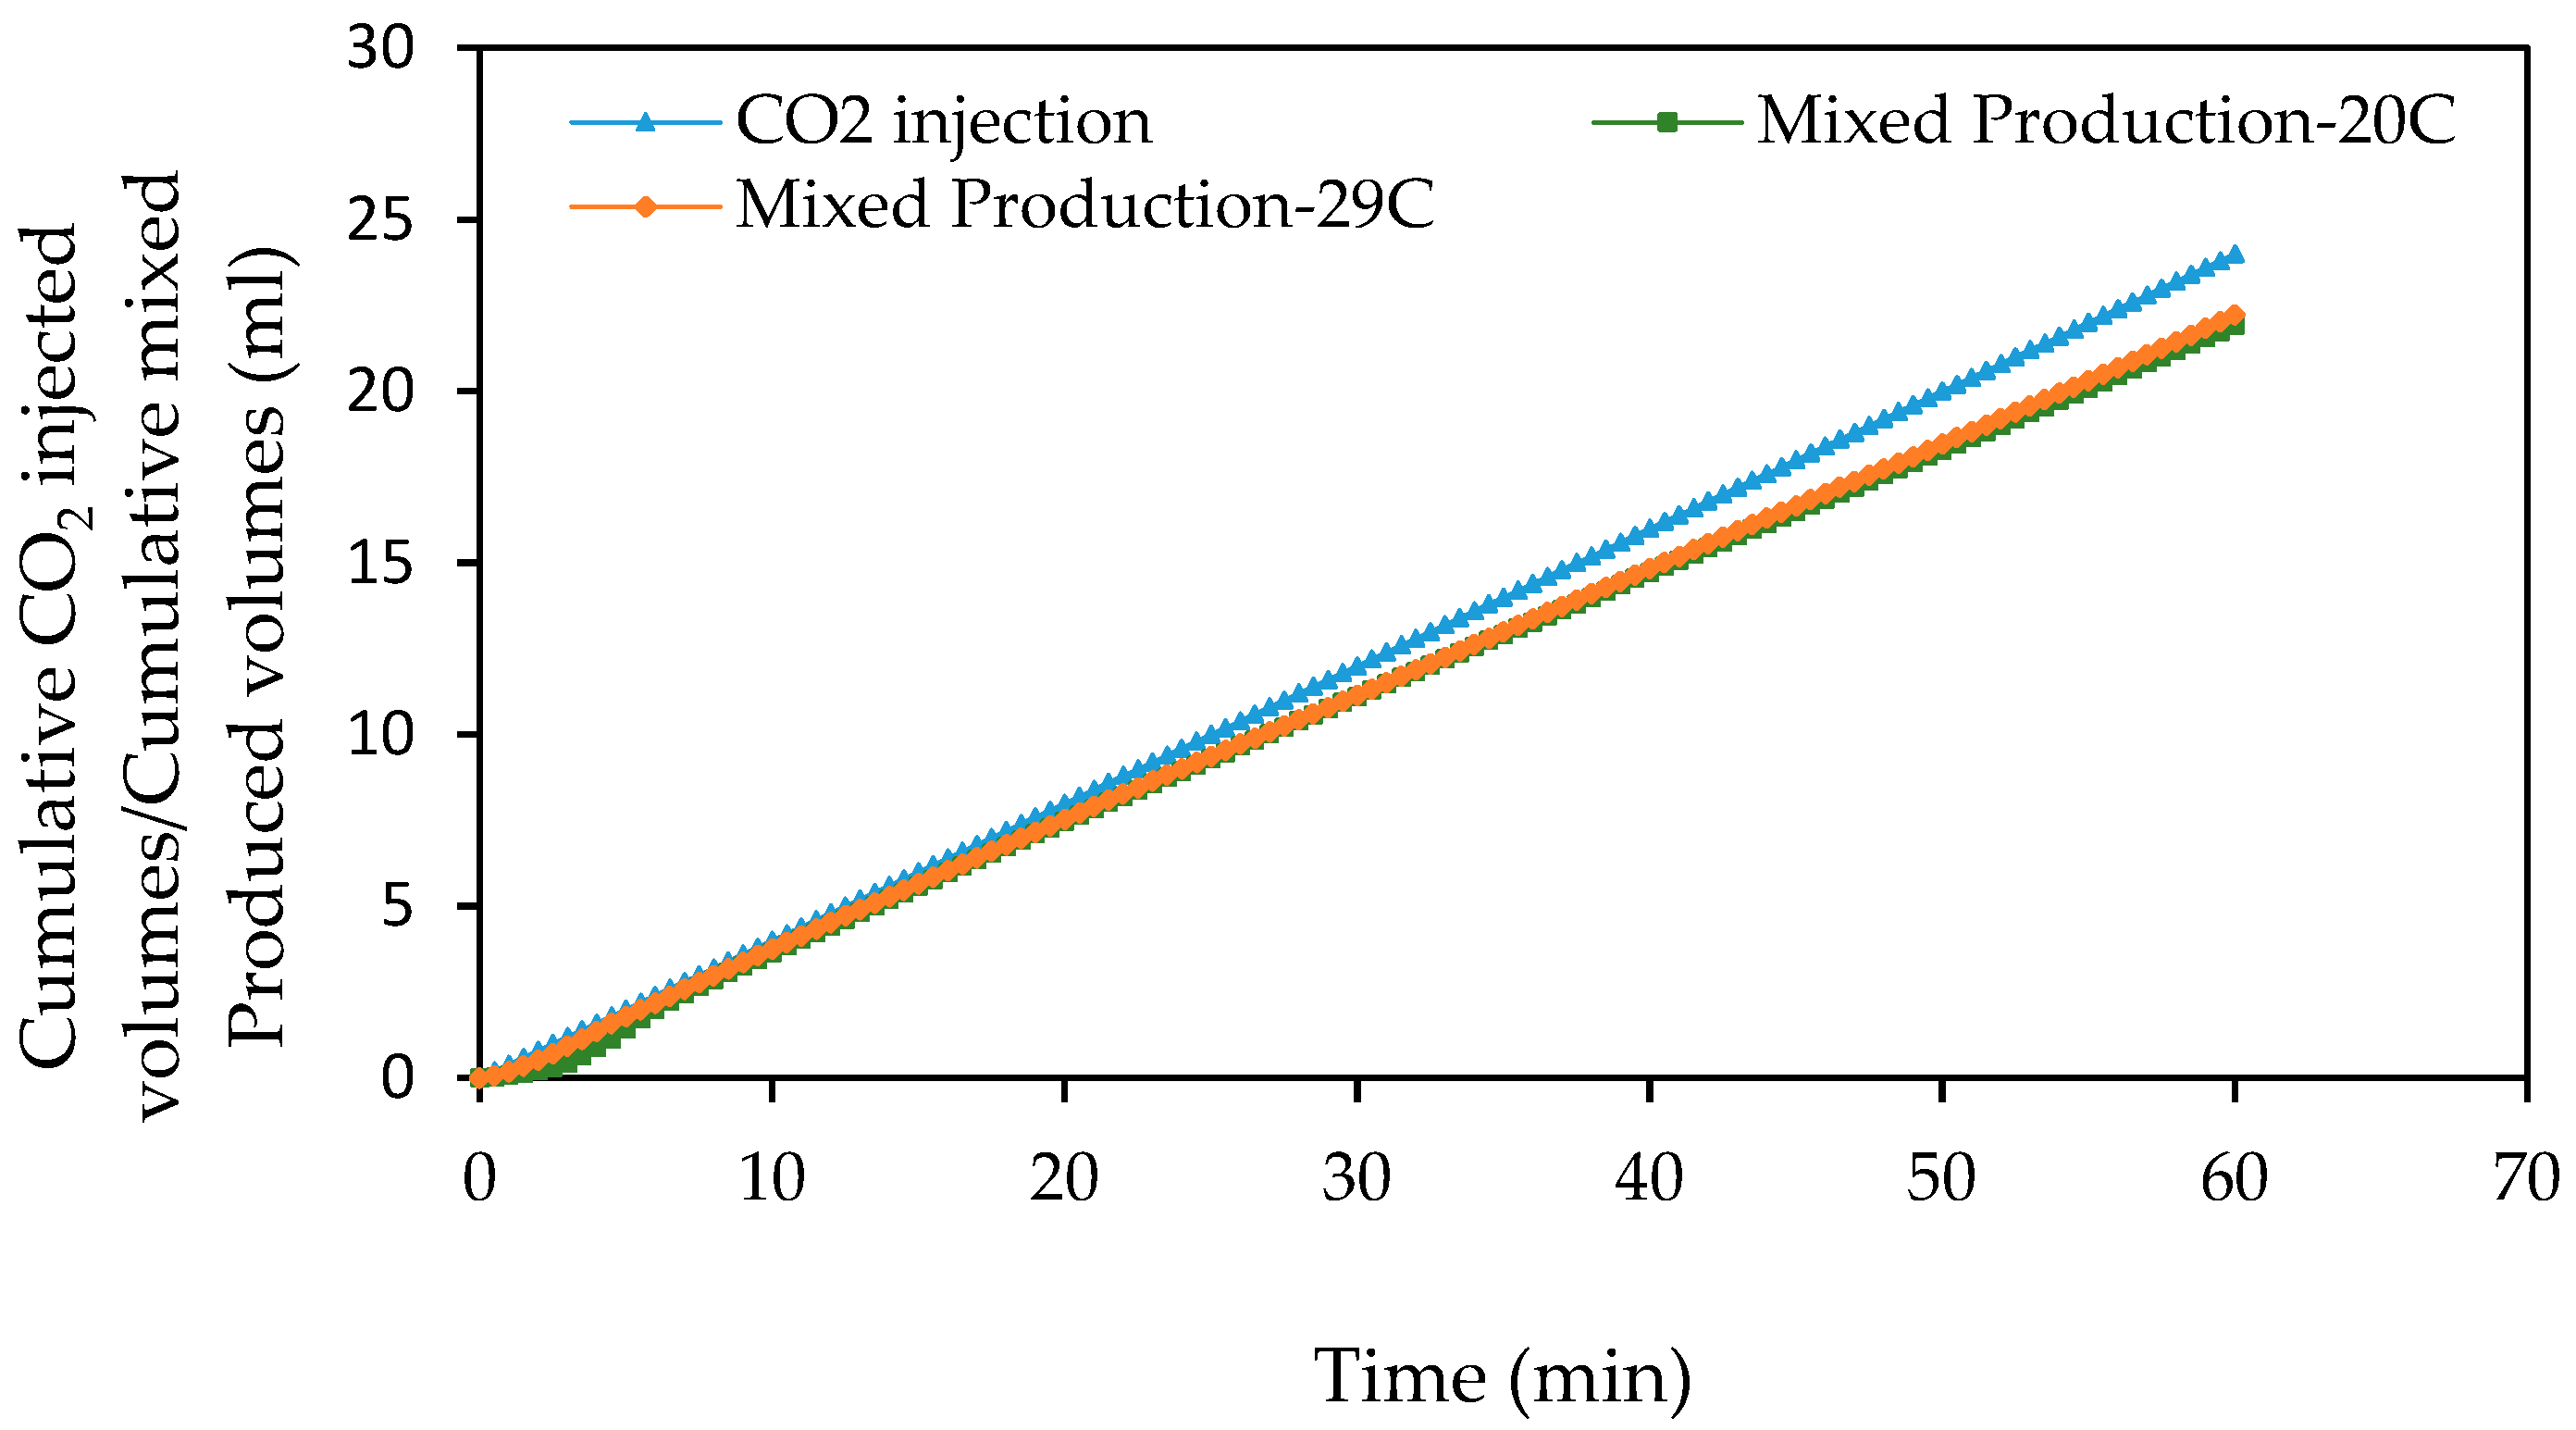
Figure 24.
Effect of experimental temperature on the cumulative produced volumes of oil and CO2 for ScCO2–oil displacements conducted at 90 bar and 0.4 mL/min.
Figure 24.
Effect of experimental temperature on the cumulative produced volumes of oil and CO2 for ScCO2–oil displacements conducted at 90 bar and 0.4 mL/min.
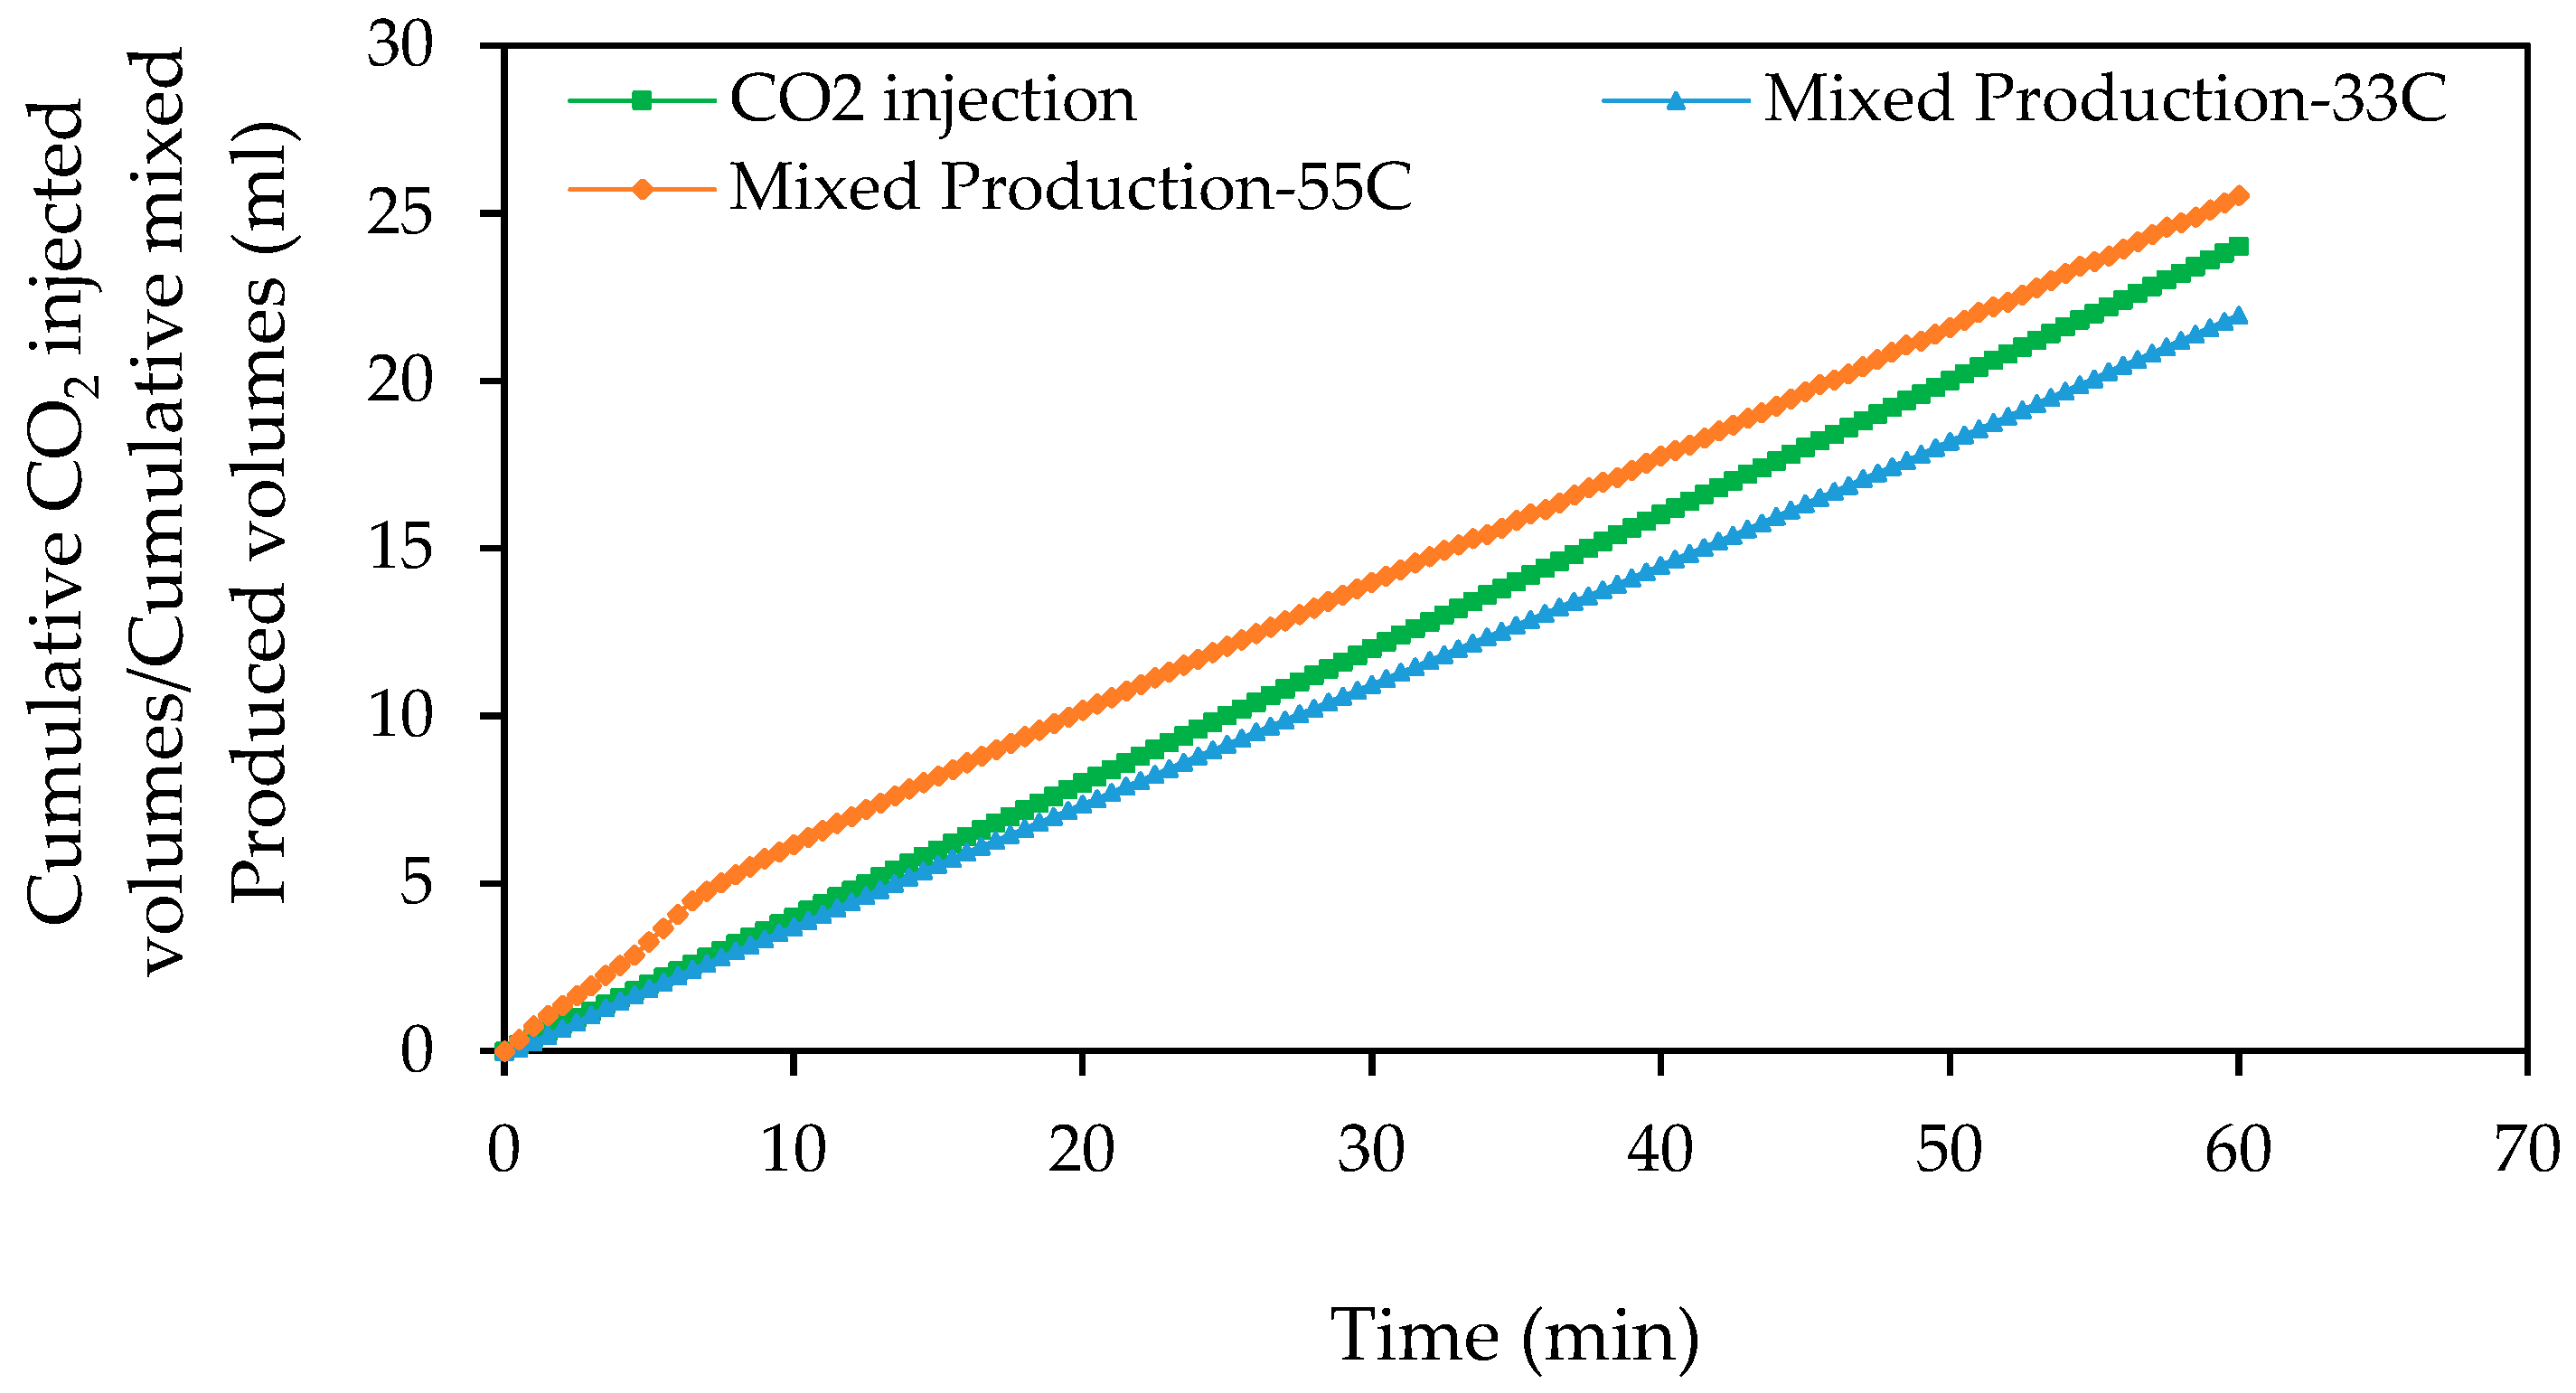

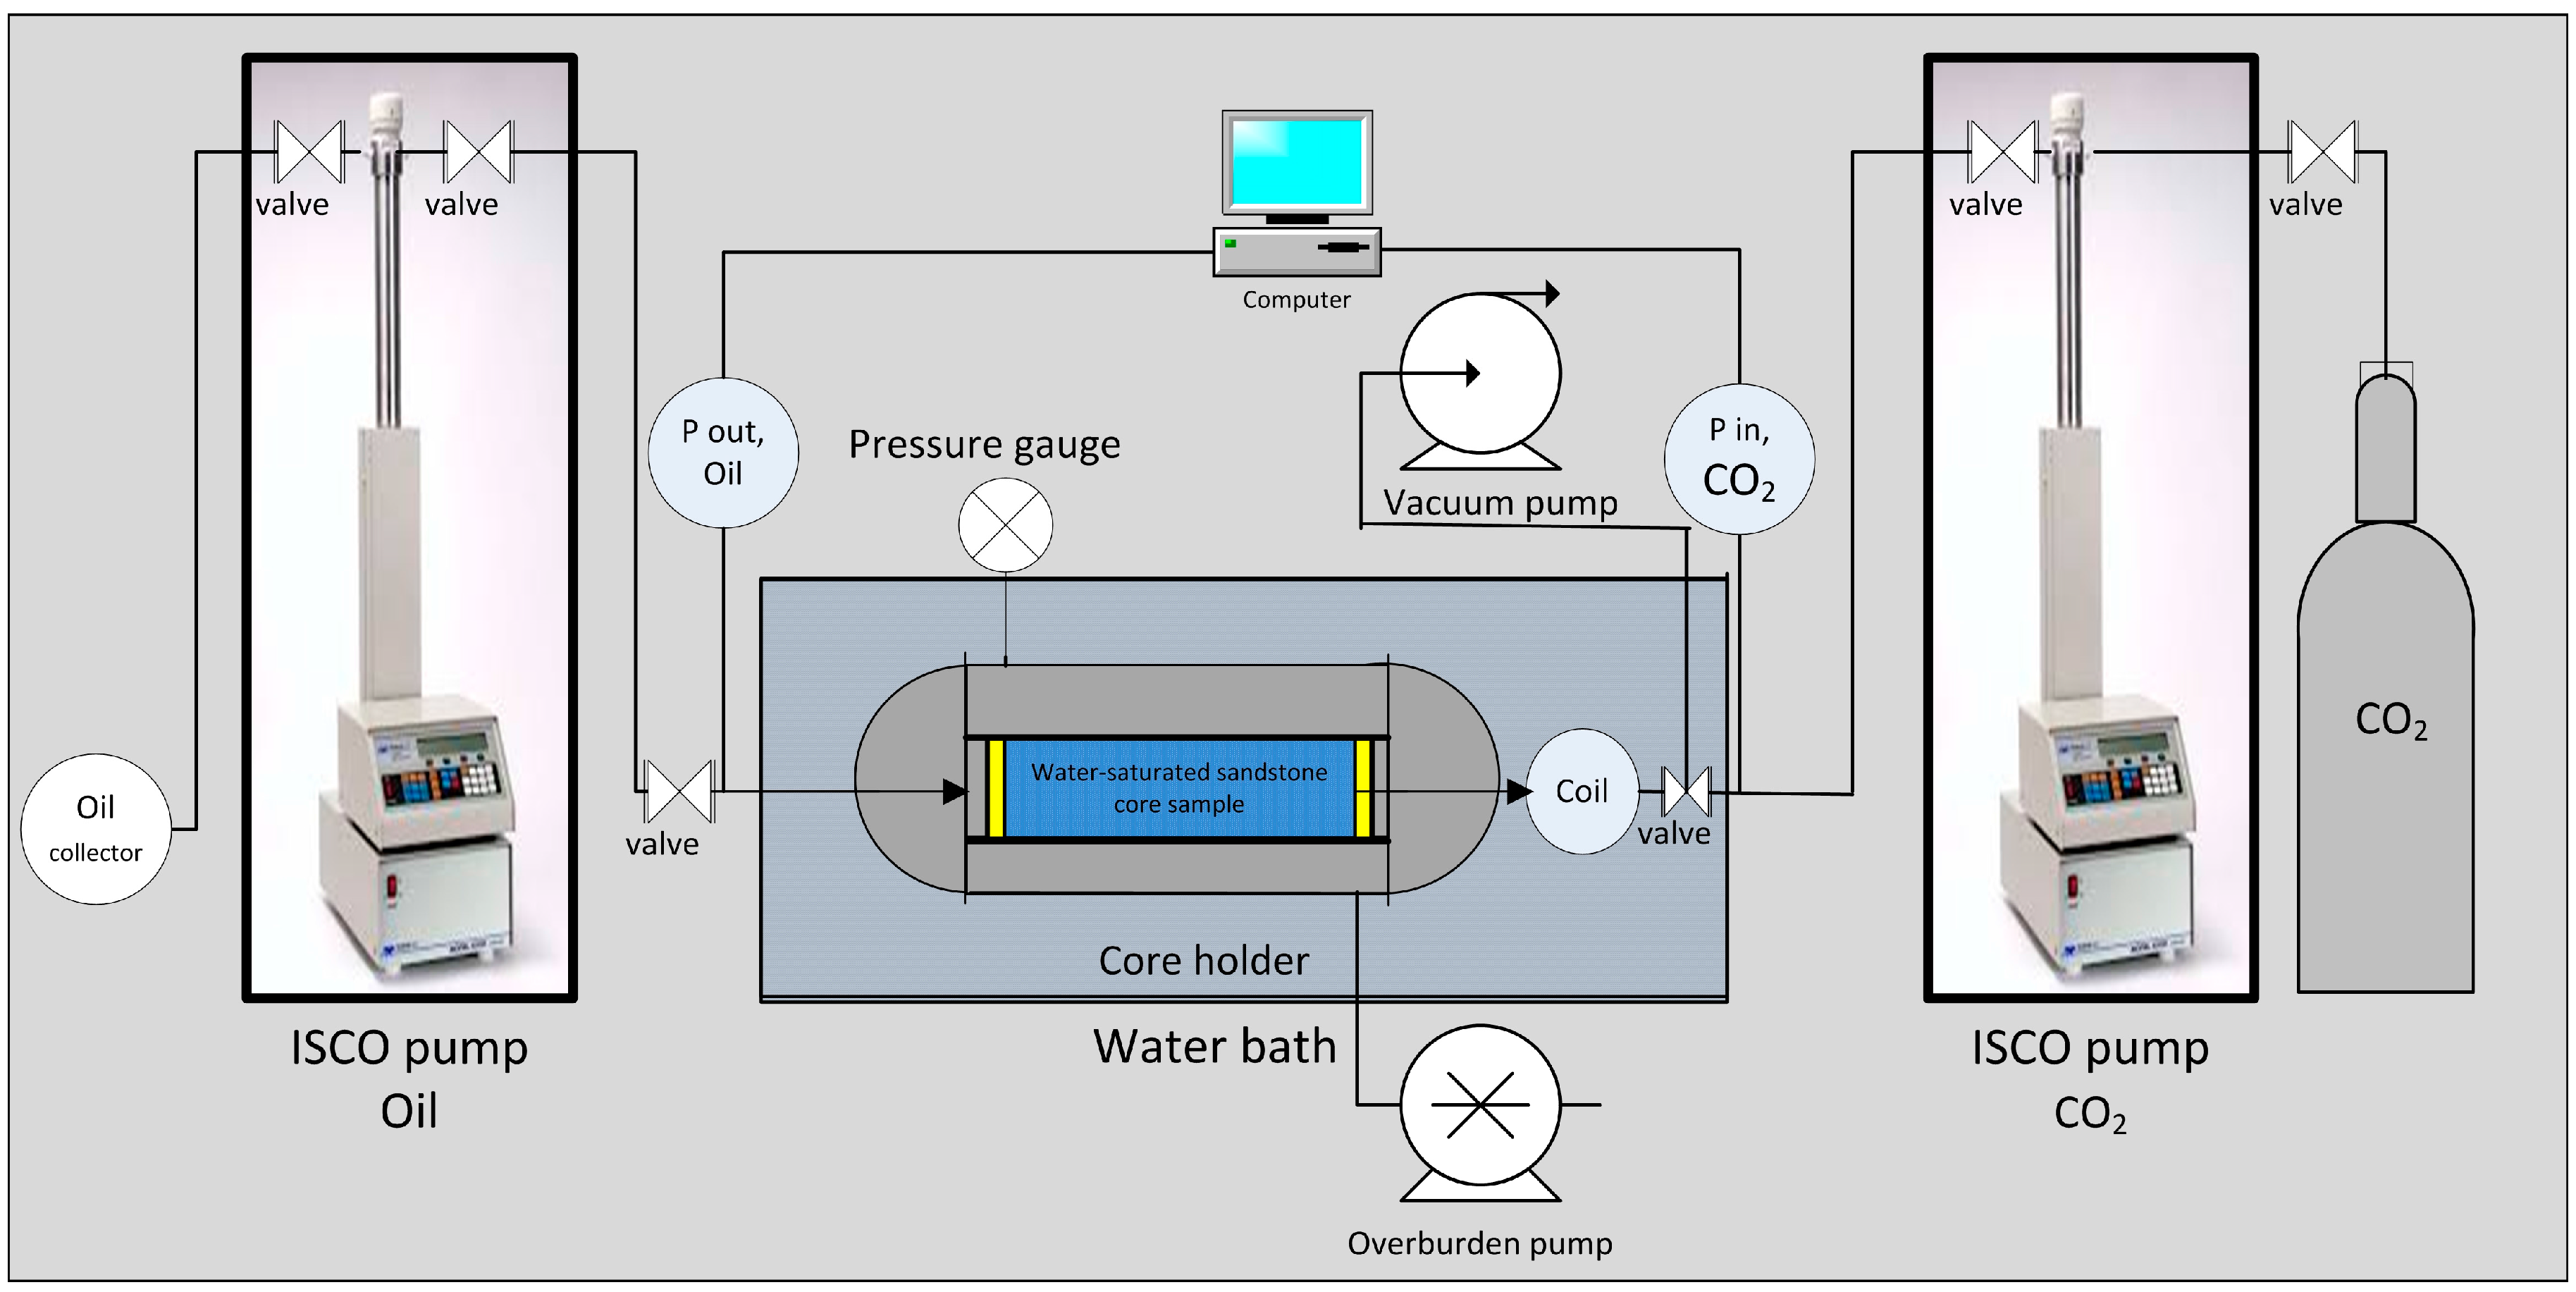
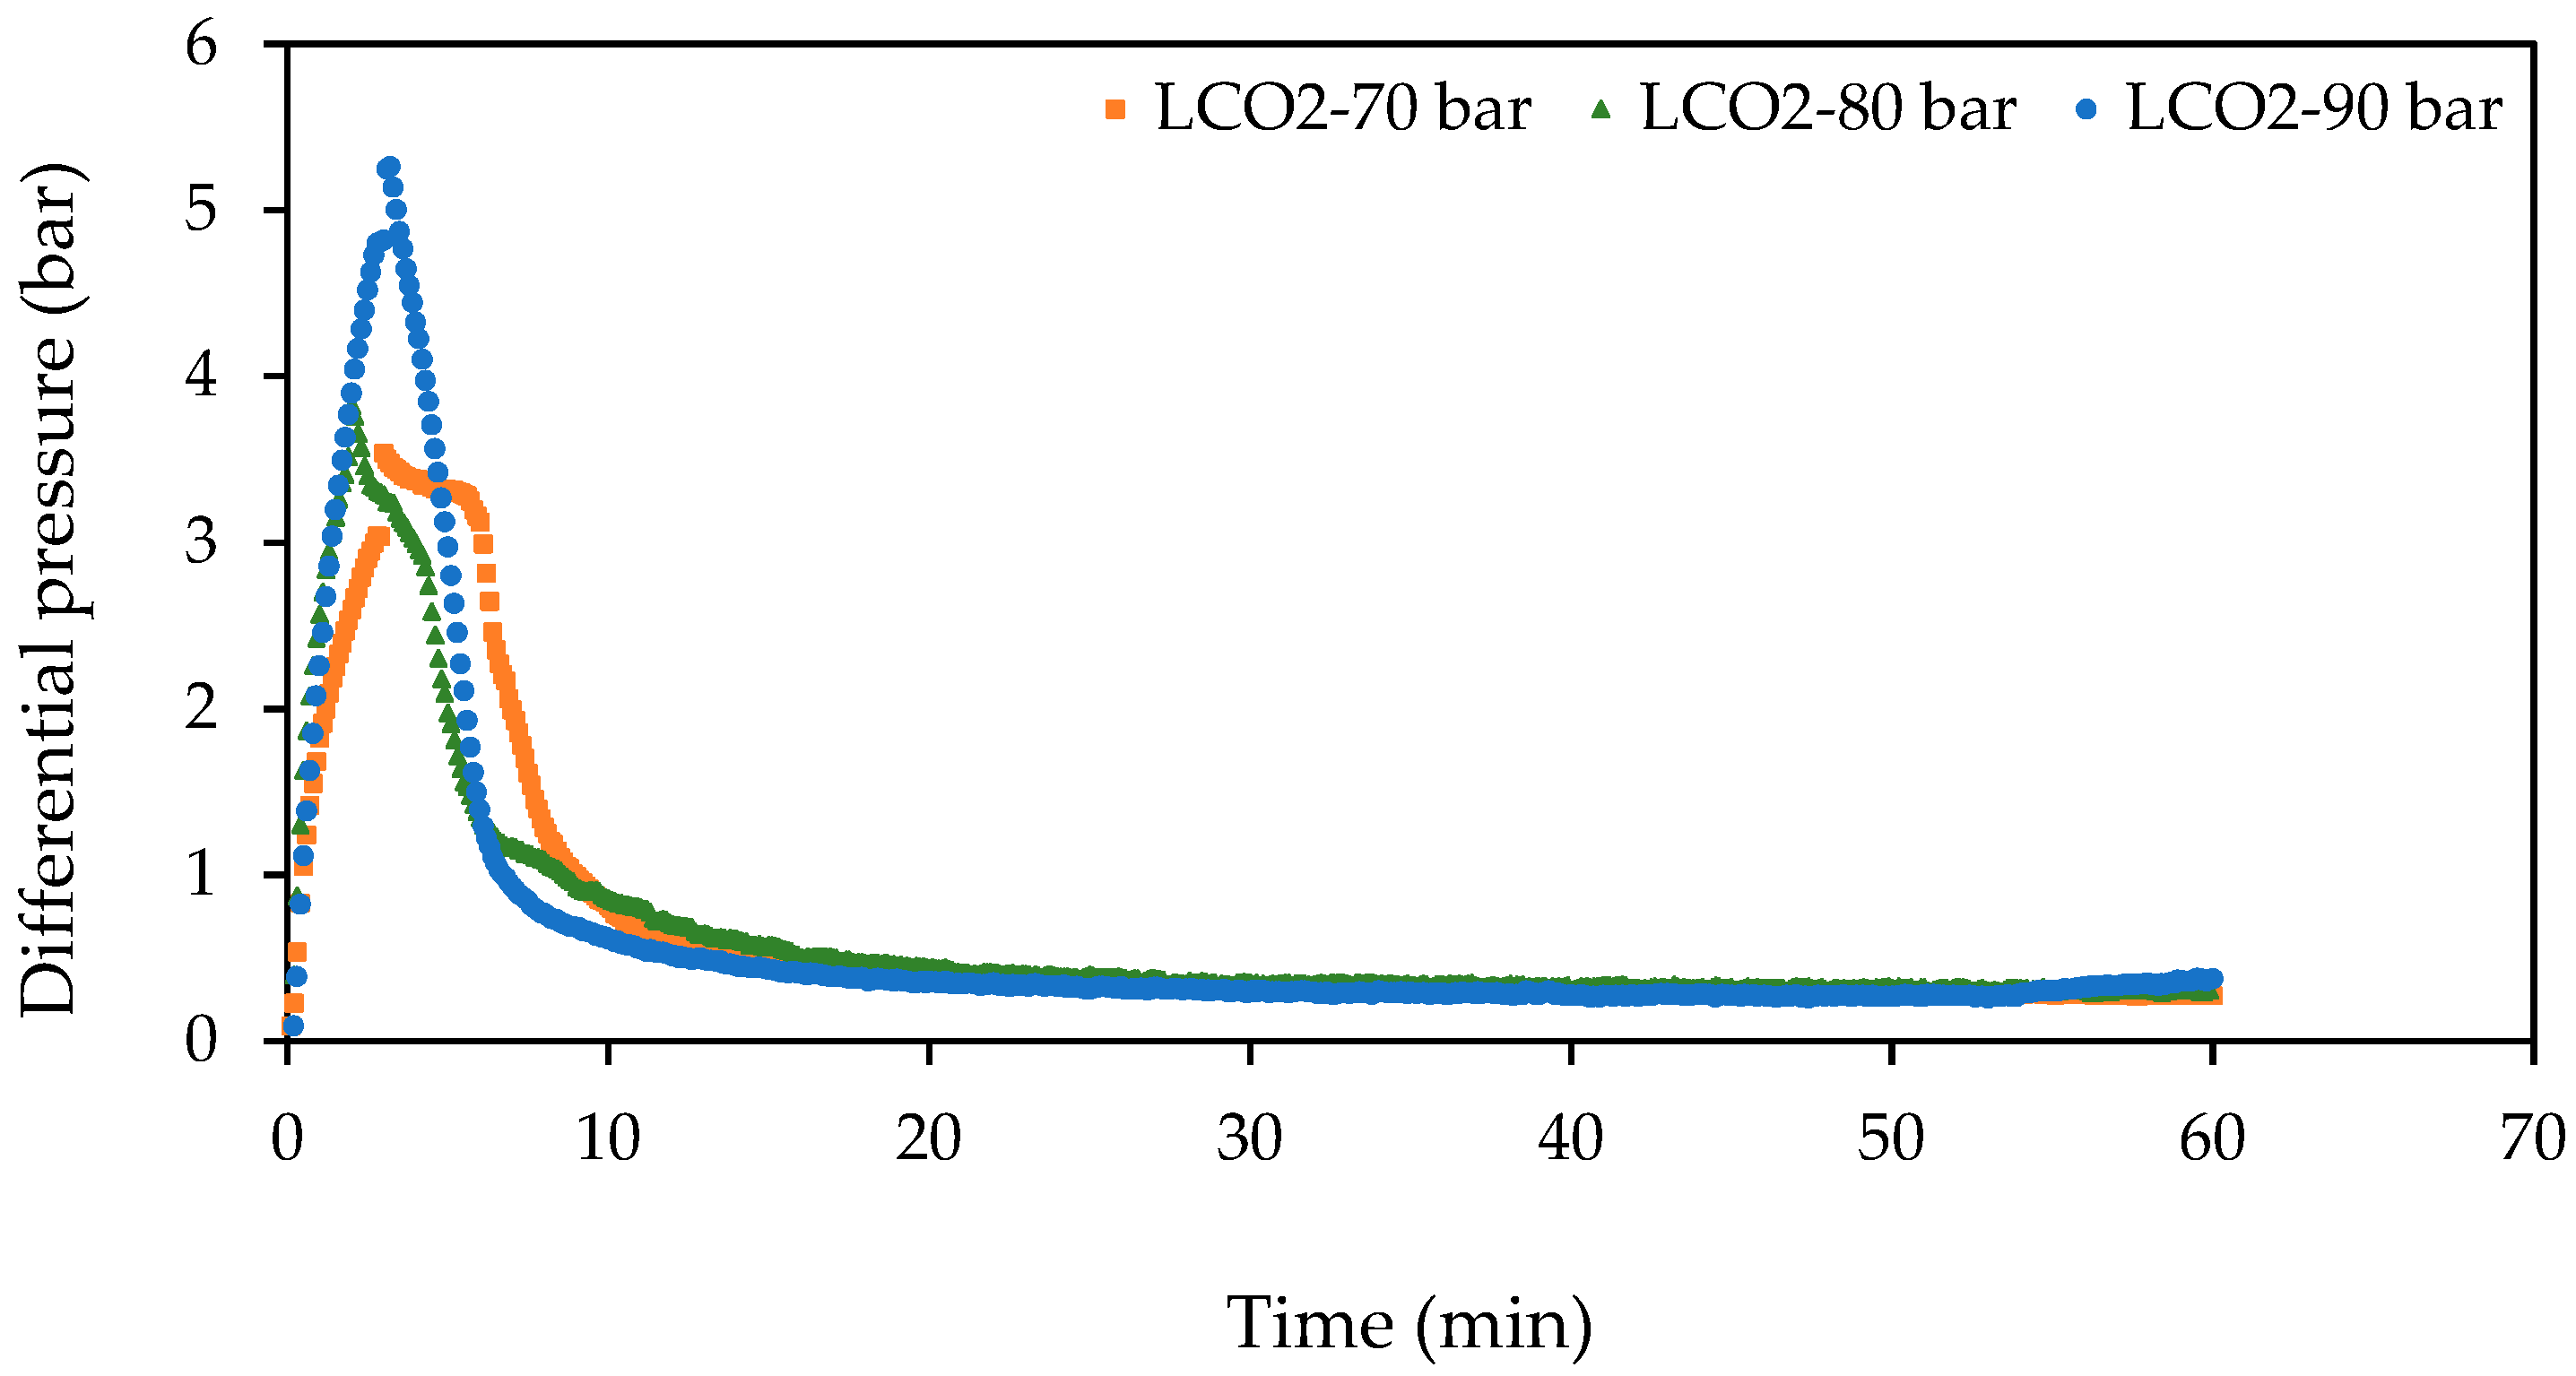
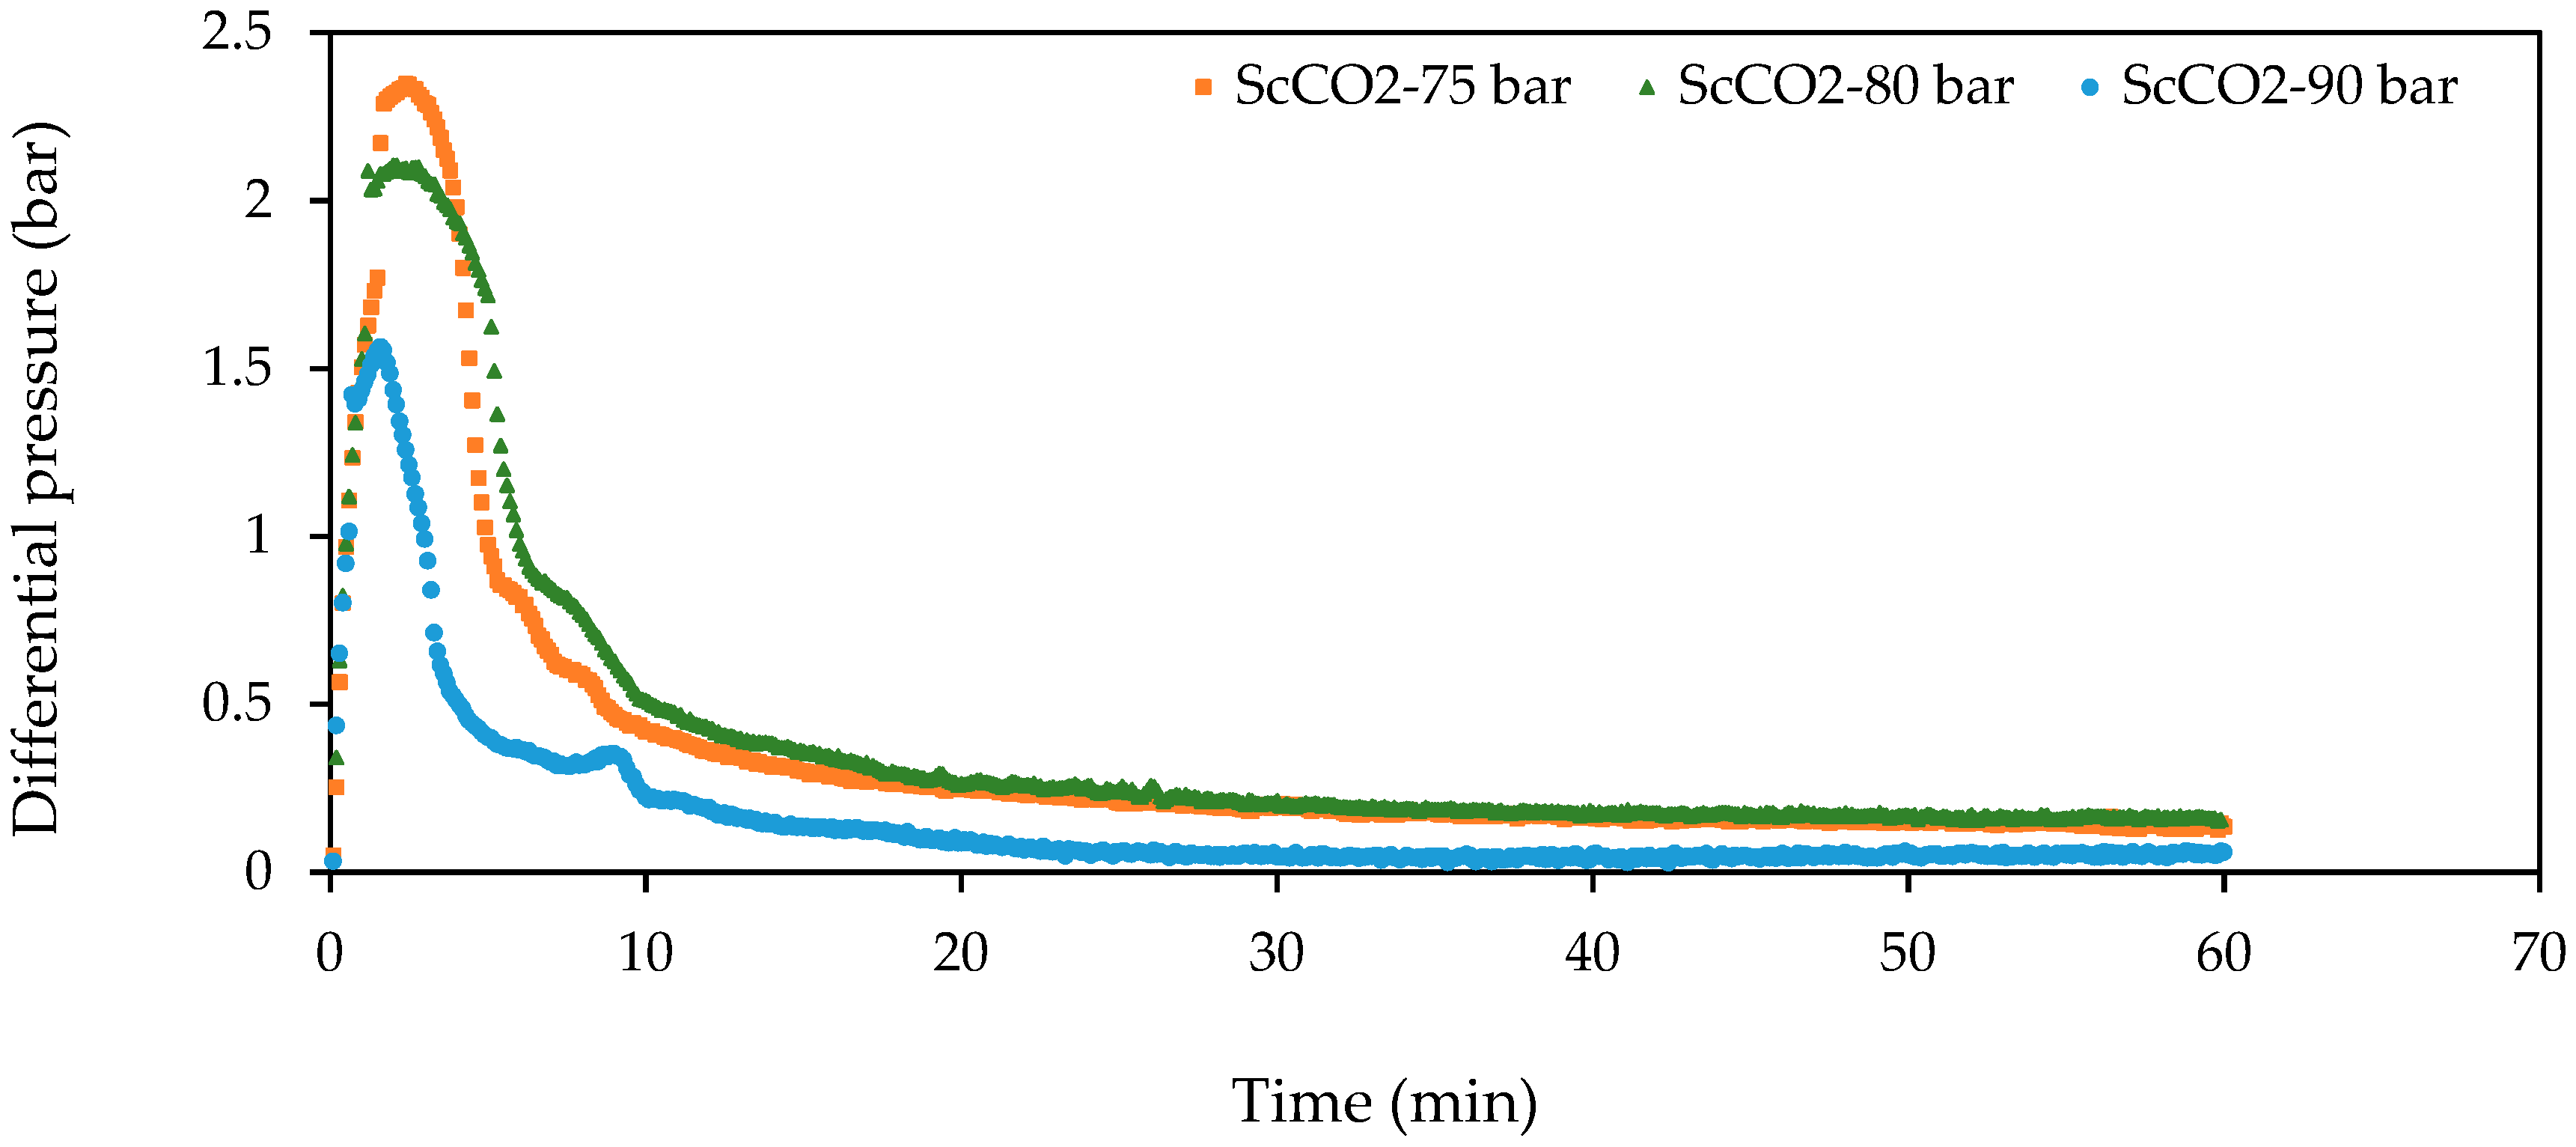
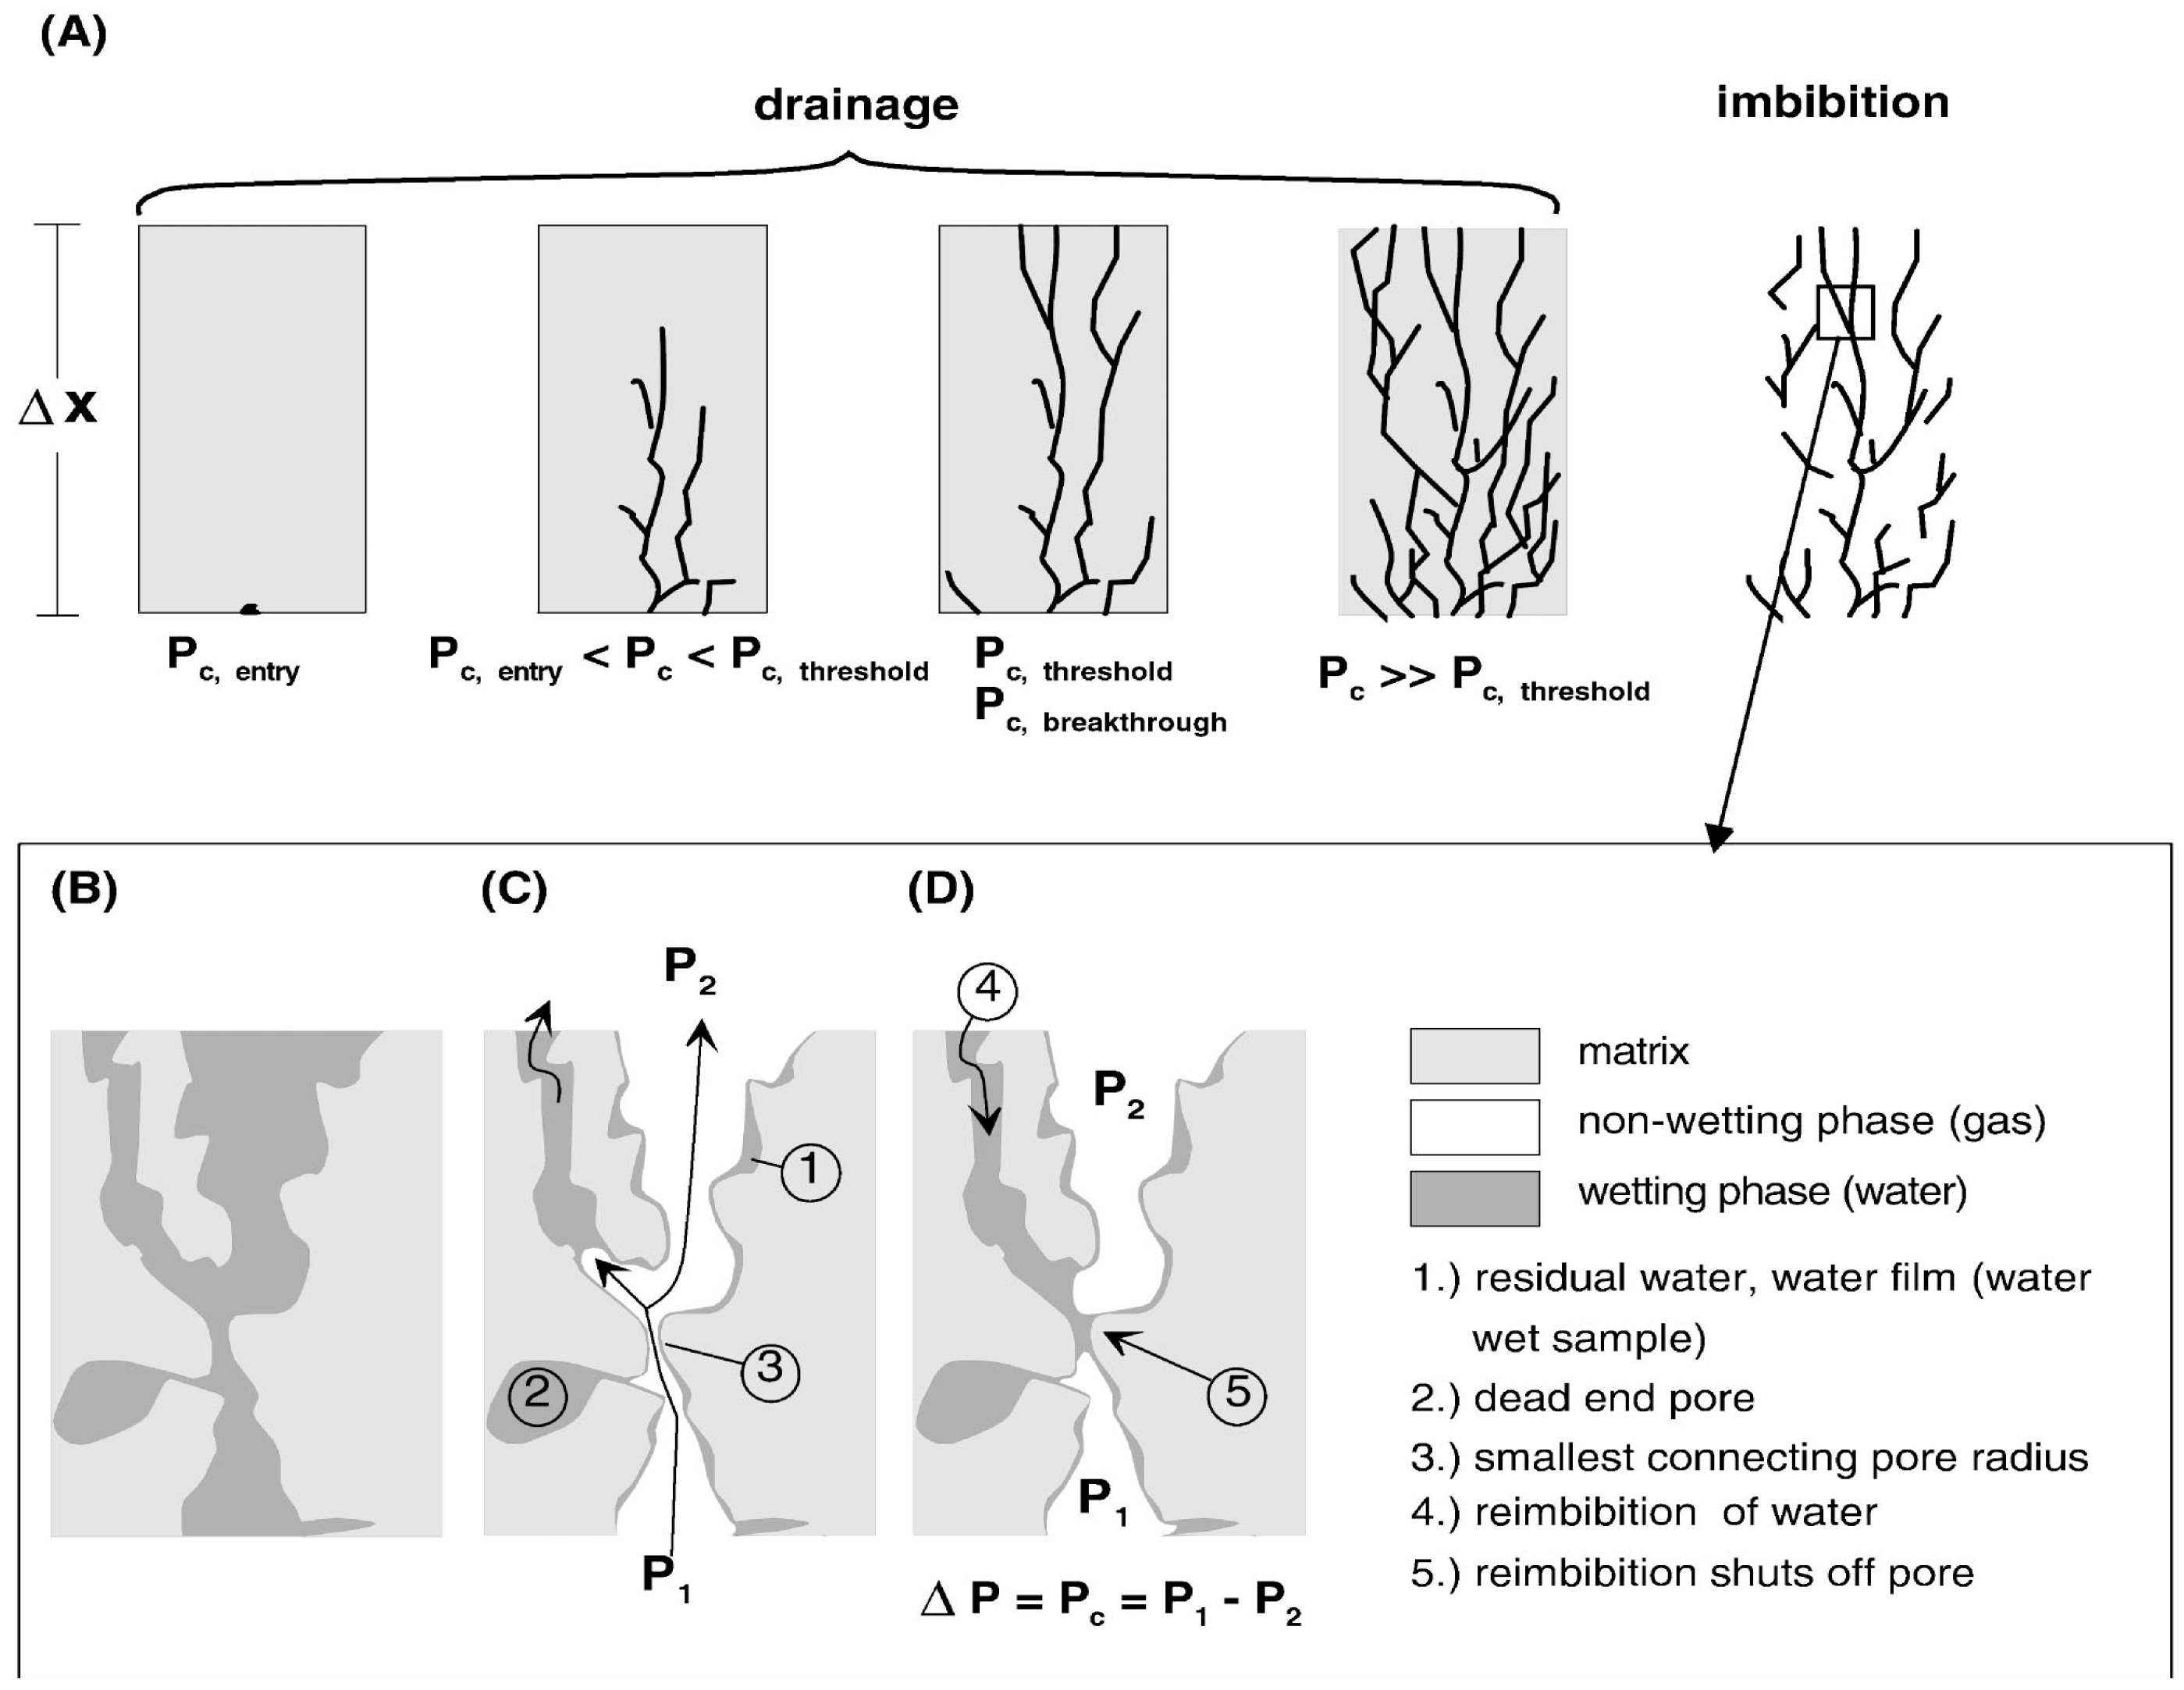
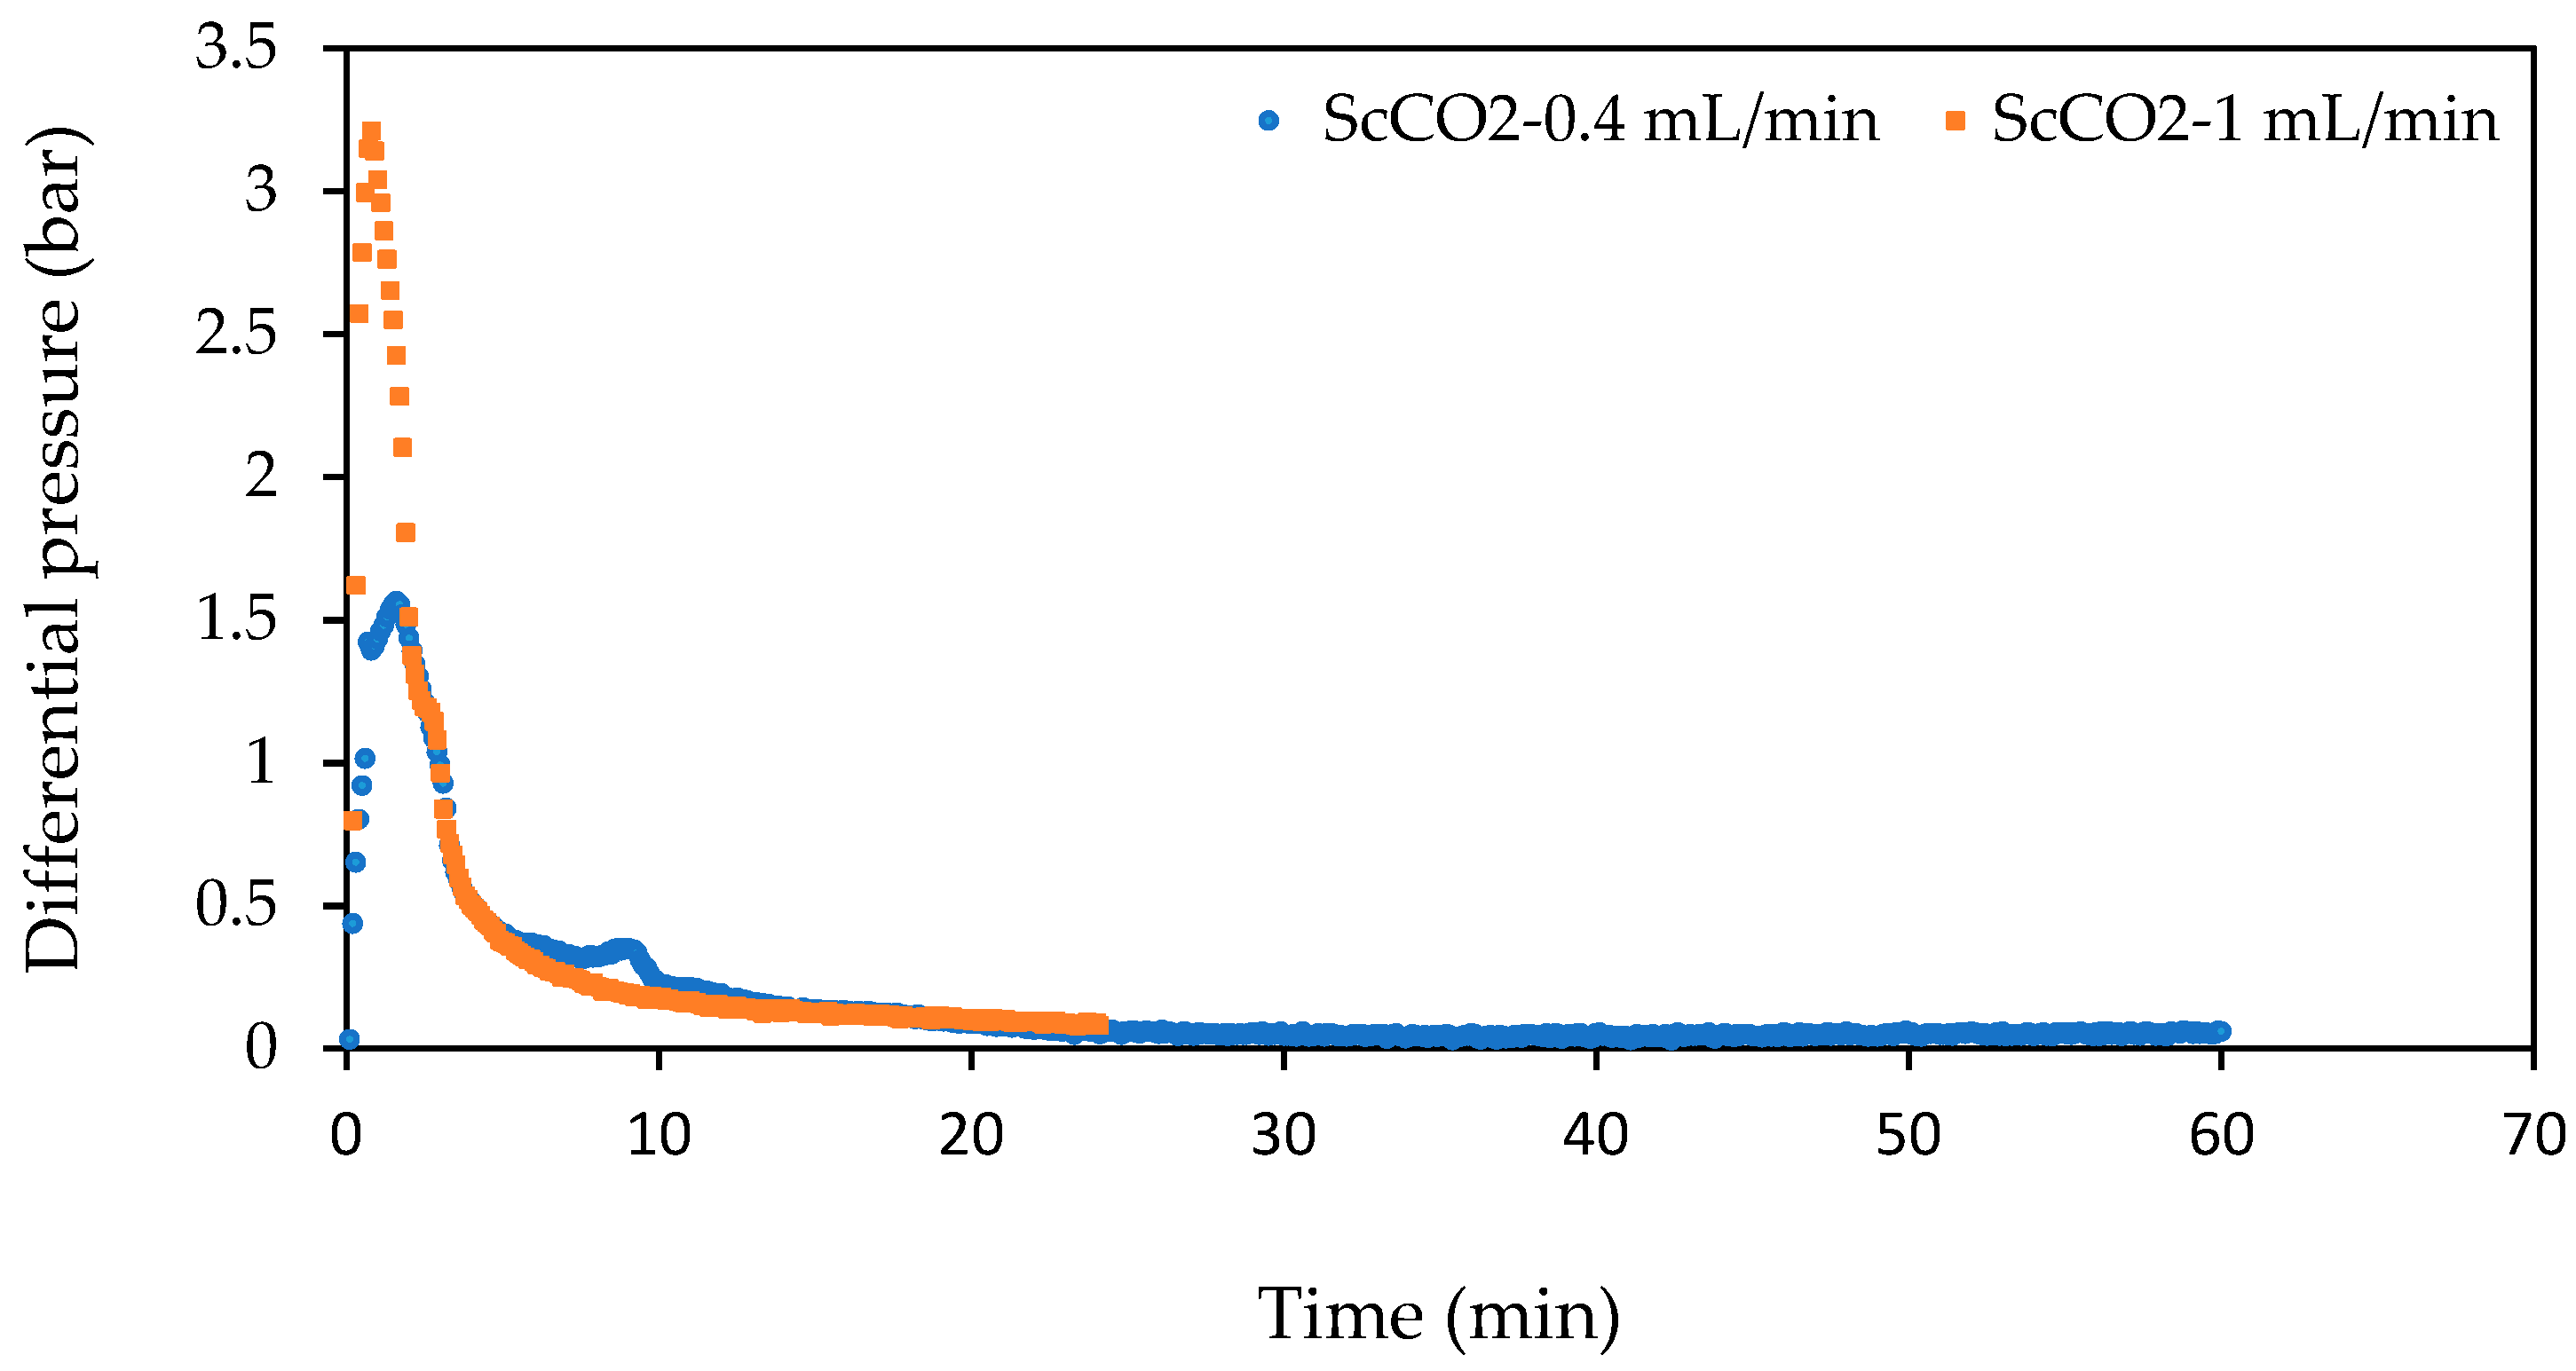
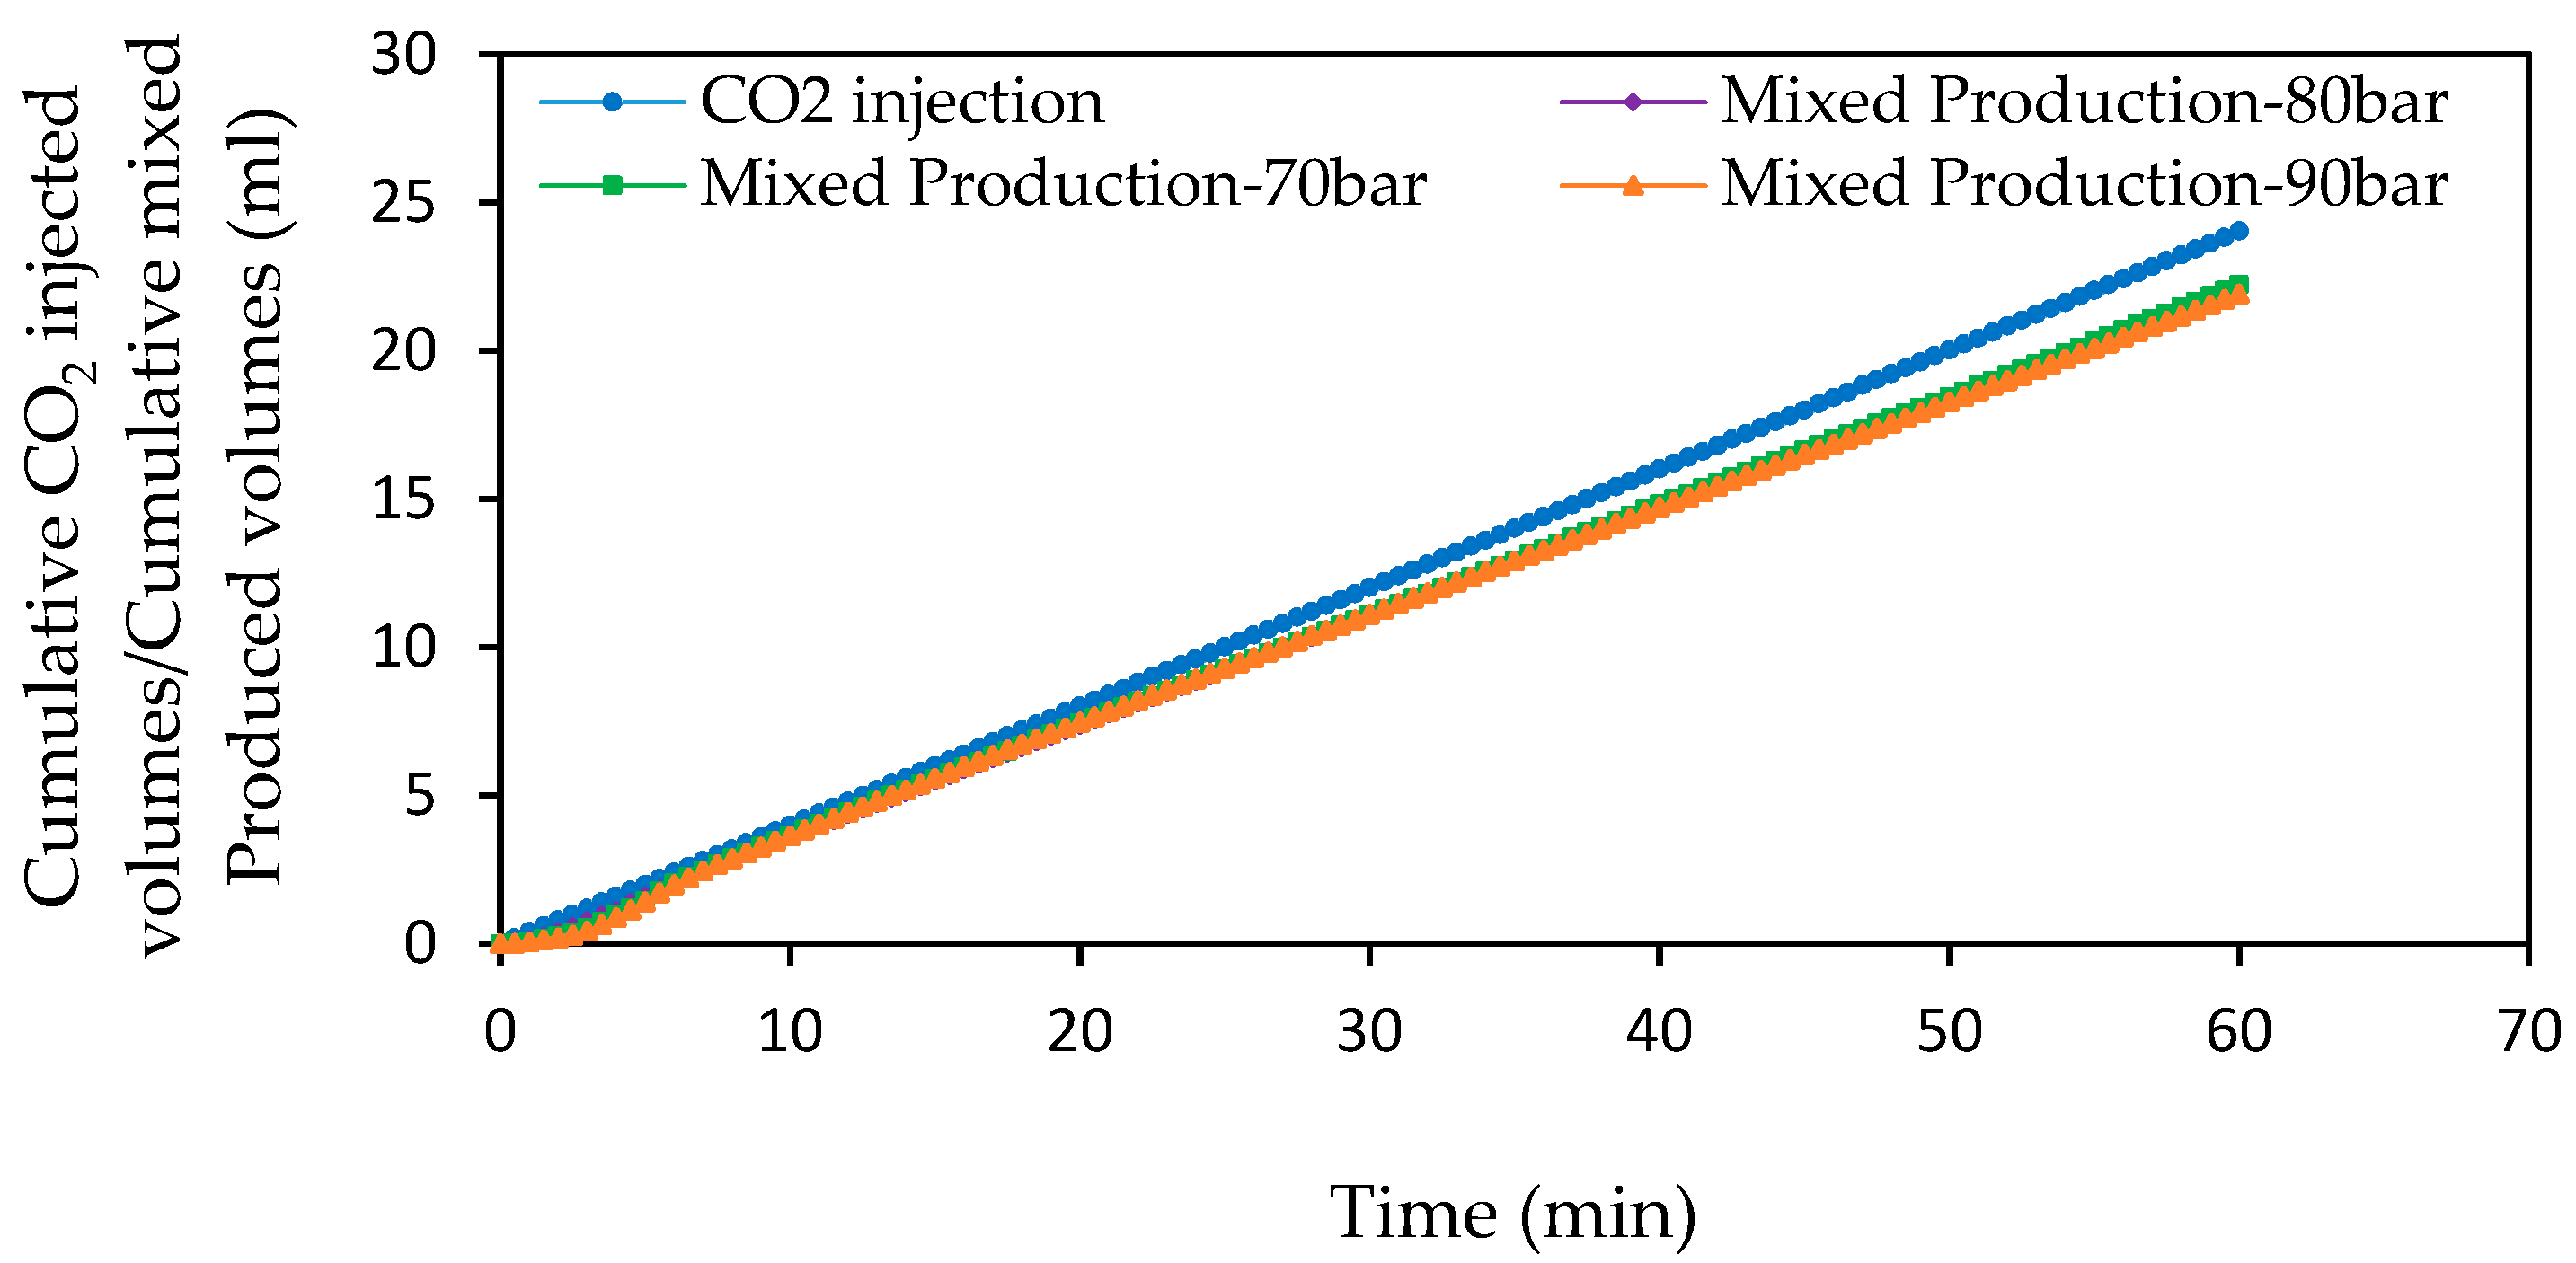
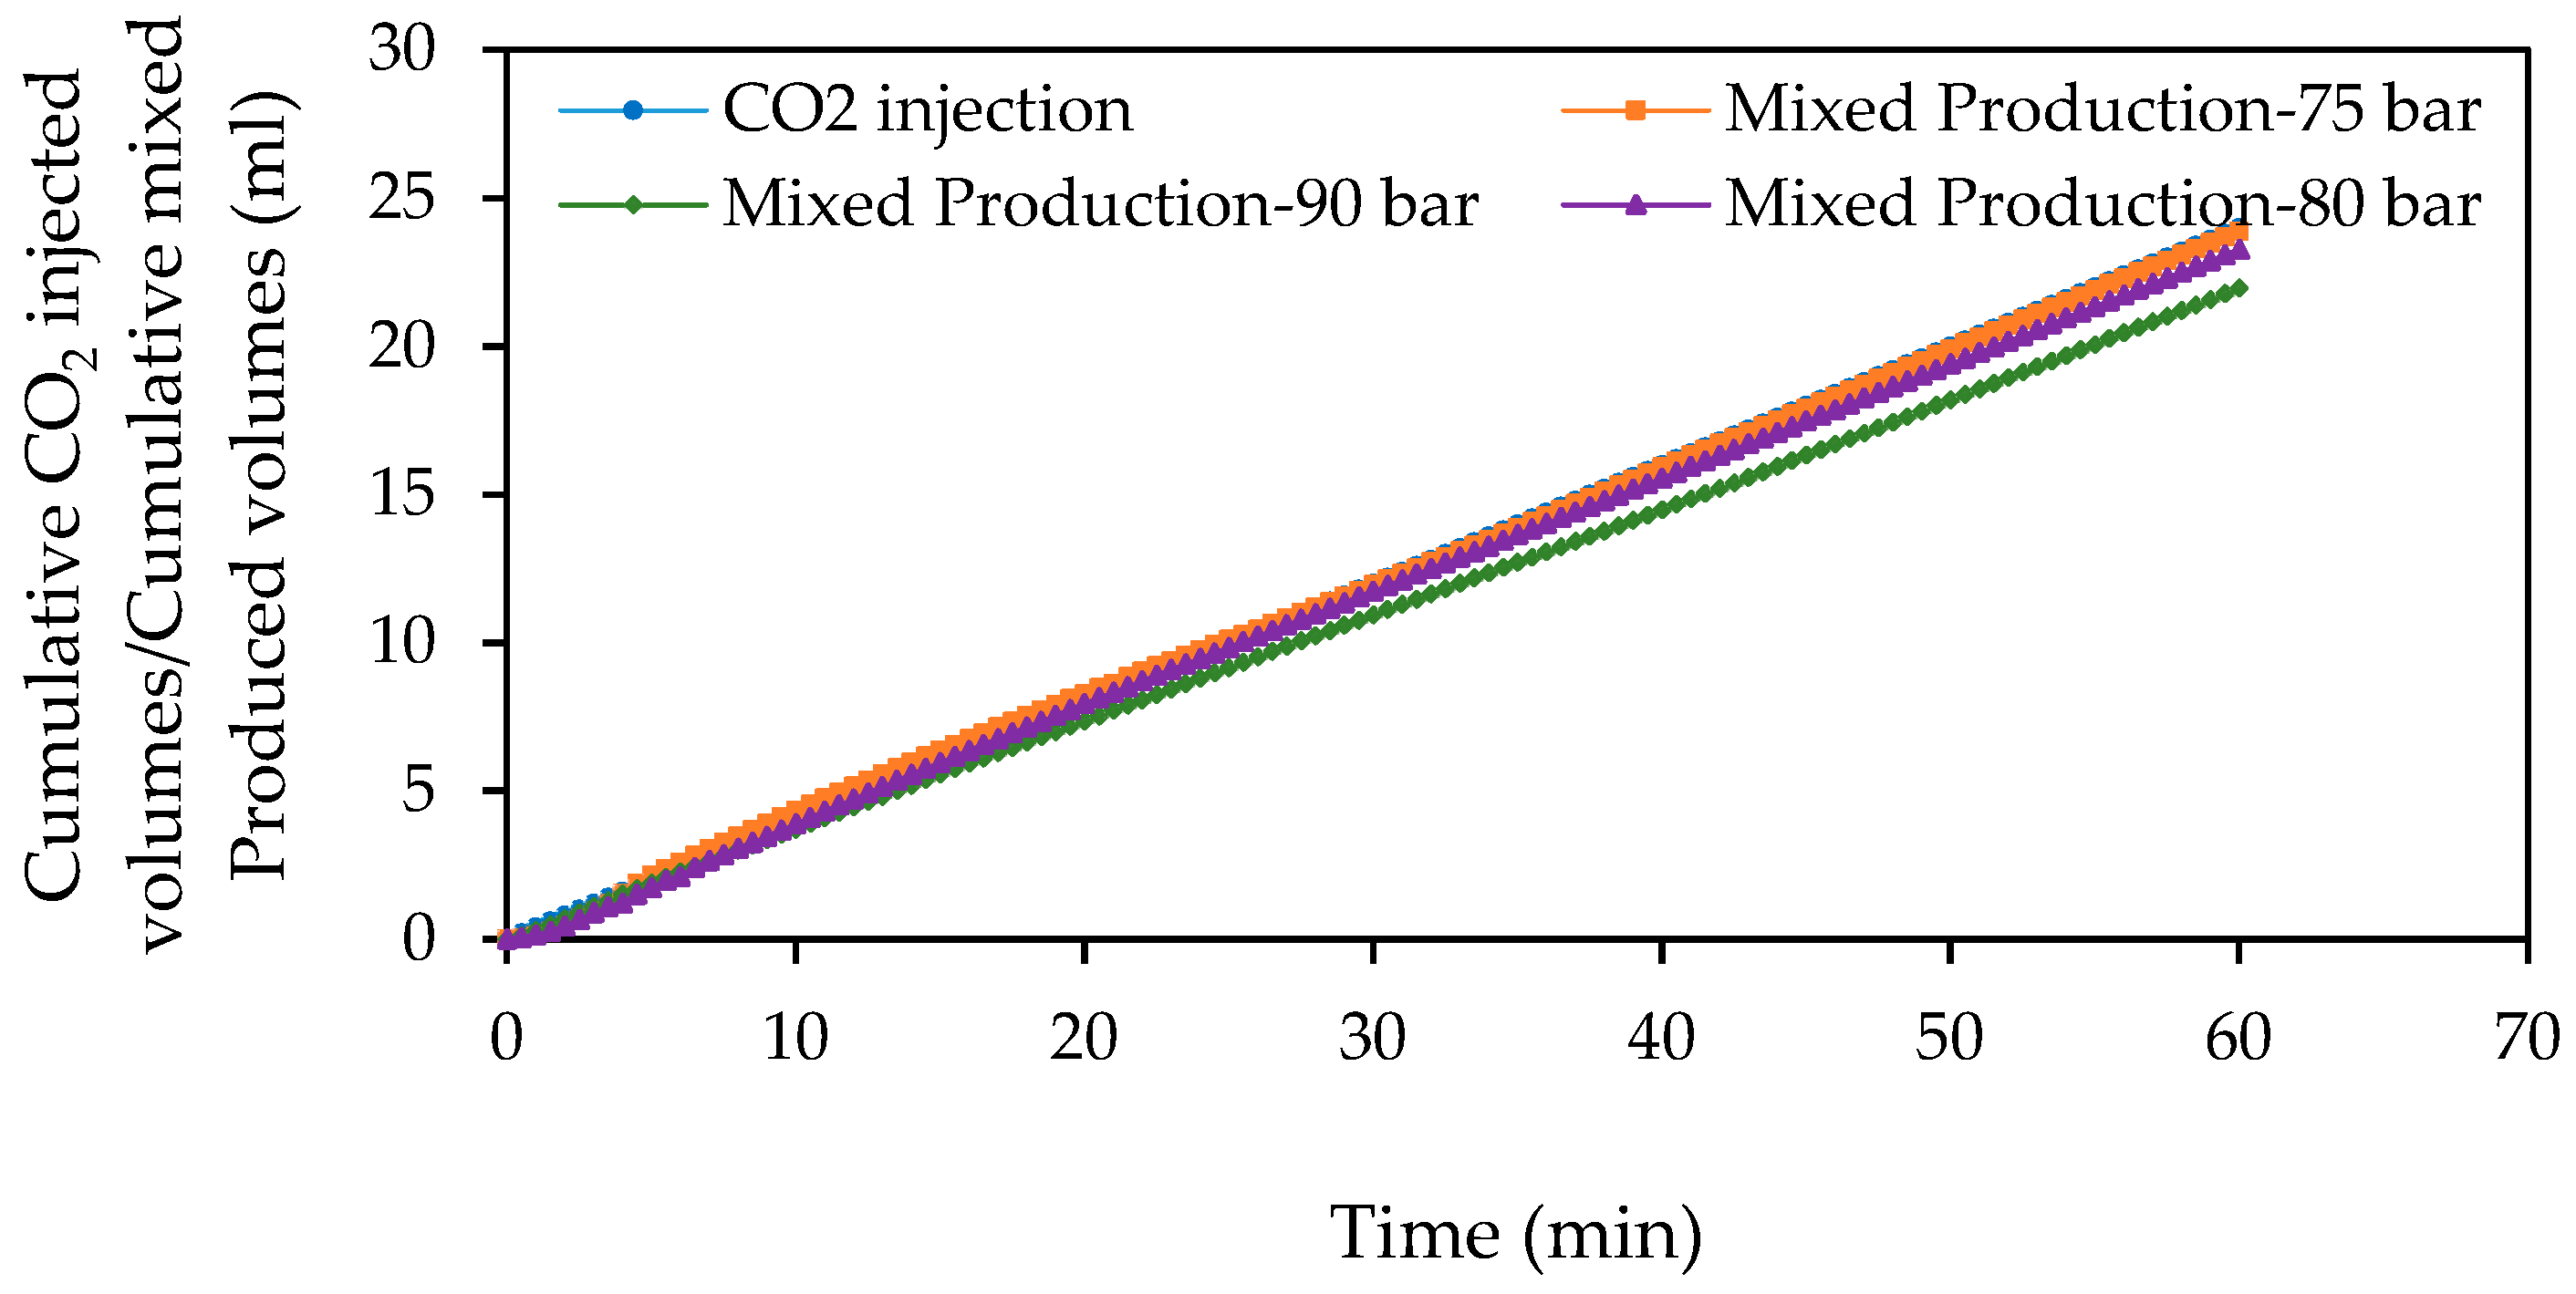
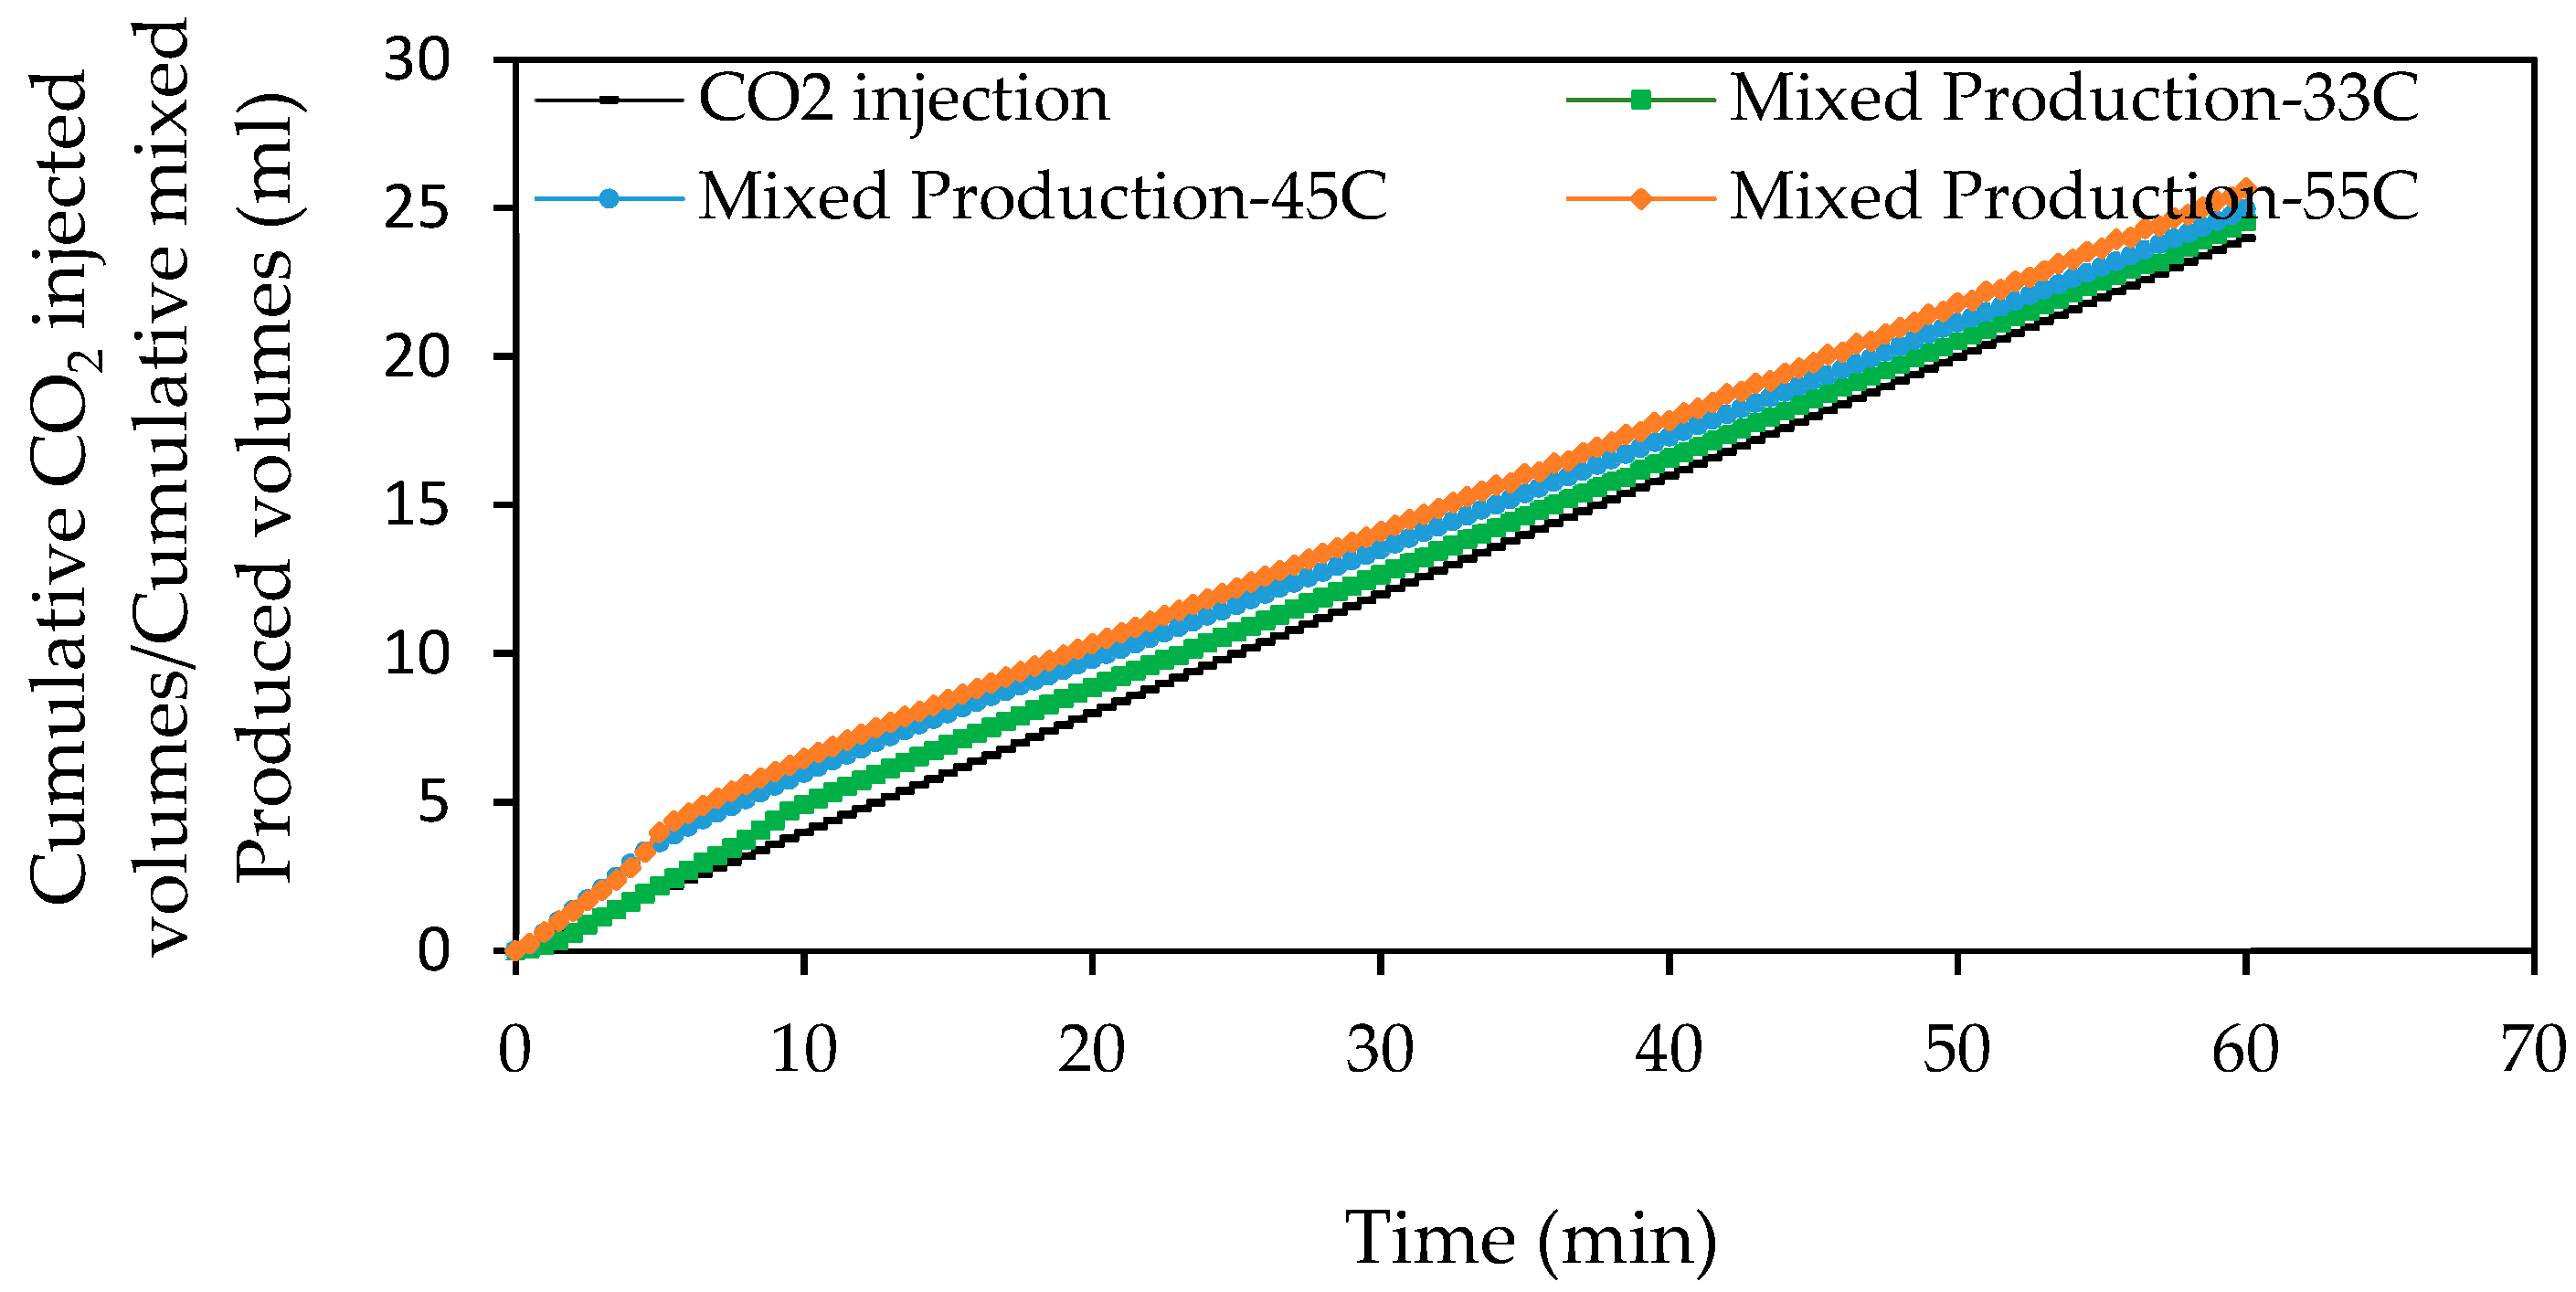
Table 1.
Effect of fluid pressure, temperature and injection rate on the endpoint CO2 effective (relative) permeability and oil recovery as a function of CO2 phase.
Table 1.
Effect of fluid pressure, temperature and injection rate on the endpoint CO2 effective (relative) permeability and oil recovery as a function of CO2 phase.
| Parameter | Experiment | KfCO2 (mD) | KrCO2 | Oil Recovery | Sor |
|---|---|---|---|---|---|
| Fluid Pressure Effect | LCO2–oil; 70 bar; 0.4 mL/min; 20 °C | 2.782 | 0.096 | 0.44 | 0.56 |
| LCO2–oil; 90 bar; 0.4 mL/min; 20 °C | 2.287 | 0.079 | 0.56 | 0.44 | |
| GCO2–oil; 40 bar; 0.4 mL/min; 33 °C | 0.446 | 0.015 | 0.30 | 0.70 | |
| GCO2–oil; 60 bar; 0.4 mL/min; 33 °C | 0.822 | 0.028 | 0.35 | 0.65 | |
| GCO2–oil; 65 bar; 0.4 mL/min; 33 °C | 1.417 | 0.049 | 0.40 | 0.60 | |
| GCO2–oil; 70 bar; 0.4 mL/min; 33 °C | 0.991 | 0.034 | 0.41 | 0.59 | |
| ScCO2–oil; 75 bar; 0.4 mL/min; 33 °C | 4.996 | 0.173 | 0.45 | 0.55 | |
| ScCO2–oil; 80 bar; 0.4 mL/min; 33 °C | 4.167 | 0.144 | 0.51 | 0.49 | |
| ScCO2–oil; 90 bar; 0.4 mL/min; 33 °C | 11.717 | 0.406 | 0.41 | 0.59 | |
| Temperature Effect | LCO2–oil; 90 bar; 0.4 mL/min; 20 °C | 2.287 | 0.079 | 0.56 | 0.44 |
| LCO2–oil; 90 bar; 0.4 mL/min; 29 °C | 4.710 | 0.163 | 0.44 | 0.56 | |
| GCO2–oil; 40 bar; 0.4 mL/min; 33 °C | 0.446 | 0.015 | 0.30 | 0.70 | |
| GCO2–oil; 40 bar; 0.4 mL/min; 45 °C | 1.572 | 0.054 | 0.33 | 0.67 | |
| GCO2–oil; 40 bar; 0.4 mL/min; 55 °C | 2.895 | 0.1 | 0.35 | 0.65 | |
| GCO2–oil; 70 bar; 0.4 mL/min; 33 °C | 0.991 | 0.034 | 0.41 | 0.59 | |
| GCO2–oil; 70 bar; 0.4 mL/min; 45 °C | 11.906 | 0.412 | 0.40 | 0.60 | |
| GCO2–oil; 70 bar; 0.4 mL/min; 55 °C | 9.870 | 0.342 | 0.43 | 0.57 | |
| ScCO2–oil; 90 bar; 0.4 mL/min; 33 °C | 11.717 | 0.405 | 0.41 | 0.59 | |
| ScCO2–oil; 90 bar; 0.4 mL/min; 55 °C | 12.413 | 0.430 | 0.47 | 0.53 | |
| Injection Rate Effect | LCO2–oil; 70 bar; 0.4 mL/min; 20 °C | 2.782 | 0.096 | 0.44 | 0.56 |
| LCO2–oil; 70 bar; 1 mL/min; 20 °C | 8.120 | 0.218 | 0.51 | 0.49 | |
| GCO2–oil; 40 bar; 0.4 mL/min; 33 °C | 0.446 | 0.015 | 0.30 | 0.70 | |
| GCO2–oil; 40 bar; 1 mL/min; 33 °C | 0.420 | 0.015 | 0.32 | 0.68 | |
| GCO2–oil; 70 bar; 0.4 mL/min; 33 °C | 0.991 | 0.034 | 0.41 | 0.59 | |
| GCO2–oil; 70 bar; 1 mL/min; 33 °C | 3.599 | 0.125 | 0.44 | 0.56 | |
| ScCO2–oil; 90 bar; 0.4 mL/min; 33 °C | 11.717 | 0.405 | 0.41 | 0.59 | |
| ScCO2–oil; 90 bar; 1 mL/min; 33°C | 18.992 | 0.657 | 0.51 | 0.49 |
© 2018 by the authors. Licensee MDPI, Basel, Switzerland. This article is an open access article distributed under the terms and conditions of the Creative Commons Attribution (CC BY) license (http://creativecommons.org/licenses/by/4.0/).
Share and Cite
MDPI and ACS Style
Al-Zaidi, E.; Fan, X.; Edlmann, K. The Effect of CO2 Phase on Oil Displacement in a Sandstone Core Sample. Fluids 2018, 3, 23. https://doi.org/10.3390/fluids3010023
AMA Style
Al-Zaidi E, Fan X, Edlmann K. The Effect of CO2 Phase on Oil Displacement in a Sandstone Core Sample. Fluids. 2018; 3(1):23. https://doi.org/10.3390/fluids3010023
Chicago/Turabian StyleAl-Zaidi, Ebraheam, Xianfeng Fan, and Katriona Edlmann. 2018. "The Effect of CO2 Phase on Oil Displacement in a Sandstone Core Sample" Fluids 3, no. 1: 23. https://doi.org/10.3390/fluids3010023