Review

A Short Review of Advances in the Modelling of Blood Rheology and Clot Formation

by
Mohan Anand
1 and
Kumbakonam Ramamani Rajagopal
2,*
1
Department of Chemical Engineering, Indian Institute of Technology Hyderabad, Kandi, Sangareddy 502285, Telangana, India
2
Department of Mechanical Engineering, Texas A&M University, College Station, TX 77843, USA
*
Author to whom correspondence should be addressed.
Fluids 2017, 2(3), 35; https://doi.org/10.3390/fluids2030035
Submission received: 21 May 2017 / Revised: 19 June 2017 / Accepted: 20 June 2017 / Published: 28 June 2017

Abstract

:
Several advances have taken place since the early 2000s in the field of blood flow modelling. These advances have been driven by the development of assist devices such as Left Ventricular Assist Devices (LVADs), etc., and by the acceptance of in silico tests for the generation of hypotheses concerning clot formation and lysis. We give an overview of the developments in modelling of blood rheology and clot formation/lysis in the last 10 to 15 years. In blood rheology, advances are increasingly supplemented by flow simulation studies. In clot formation (or coagulation), advances have taken place in both single-scale modeling under quiescent conditions as well as in multi-scale modeling in the presence of flow. The future will possibly see more blood flow simulations in complex geometries and, simultaneously, development and simulation of multi-scale models for clot formation and lysis.

1. Introduction

Constitutive models for blood play a critical role in the computational simulations used in the design of cardiovascular devices such as ventricular assist devices (see, for instance, their role in the Living Heart Project [1], and the SIMULIA® Living Heart Human Model). Prediction of clot/plaque formation and growth in regions of flow recirculation and stagnation in such devices requires reliable models that can be integrated in computational simulations of blood flow. In an earlier review article [2], the salient features and microstructural underpinnings of the rheology of blood and clots, the prominent features and biochemical reactions underlying the formation, growth and lysis of clots, and the various pathologies that are a consequence of clotting, were summarized. We also posited an integrated framework for the study of blood flow with clot formation. In this review article, we summarize the constitutive models in both the field of blood rheology and that of clot formation and growth, and bring the reader abreast of the developments since the appearance of [2].

2. Advances in Modelling

Blood is a complex biochemically reacting mixture of Plasma, Lipoproteins, Red and White blood cells, Platelets, a variety of ions, etc. Characterizing the properties of such a complex mixture is a most daunting task. Recent, experimental investigation of blood rheology has revealed increasing complexity with regard to the mechanisms of clotting and lysis, with the progress of time. The shear-thinning characteristics of blood were first documented in 1965 by Charm and Kurland [3]. The viscoelastic properties of blood were documented in 1972 by Thurston [4]; Thurston also recorded that the viscoelastic behavior becomes less prominent at higher shear rates [5]. Blood was identified as being thixotropic, that is, the properties of blood change with changes in the structural arrangements at the microscopic level with time (see Thurston [6]), and its thixotropic characteristics were measured carefully by McMillan in 1986 [7]. Rheometry has thus led to the conclusion that blood (homogenized and considered as a fluid) is shear-thinning, viscoelastic (in a shear rate-dependent manner), and thixotropic.

2.1. Constitutive Models for Blood

The development of constitutive models for blood has proceeded alongside the experimental characterization of blood rheology. The classical Navier–Stokes model was used initially but once the shear thinning behavior of blood, especially in smaller blood vessels, was recognized, the model of choice was a non-Newtonian constitutive relation that was capable of describing shear-thinning. This was followed in turn by more complex shear-thinning, viscoelastic models. An early study of the flow of blood is that by Womersley [8] who obtained an analytical solution for the oscillatory pressure gradient-driven flow of blood-modeled as a Navier–Stokes fluid through a straight pipe.
The earliest Non-Newtonian continuum model for blood was the 1-D Casson model originally proposed for ink in 1959 [9], and shortly after adapted for blood. The popular Power-law model—usable in 1-D flow simulations—was fitted for blood data by Liepsch and Moravec [10]. The 1-D Cross model and the 1-D Carreau–Yasuda model—popular choices for relating the viscosity to the shear-rate in a shear-thinning fluid—were adapted for blood by Cho and Kensey [11]. A list of other popular 1-D Generalized Newtonian models—the Carreau model, the Powell–Eyring model, and the modified Cross model—adapted to capture the shear-thinning behavior of blood can also be found in [11].
Viscoelastic models for blood were initially developed only in 1-D: the earliest was the shear-thinning viscoelastic Maxwell-type model proposed by Thurston in [6]. Later attempts include the 1-D Maxwell-type model with a shear-thinning internal variable proposed by Quemada in [12], and that proposed by Sharp et al. in [13]. The earliest 3-D frame invariant viscoelastic model was the Oldroyd-B model proposed by Phillips and Deutsch in 1975 [14]. This was followed by a 3-D frame invariant model developed by Yeleswarapu in 1996 [15], and was a shear-thinning Oldroyd-B model. The uniqueness of this model lay in the fact that the shear-thinning function for viscosity was fit to rheometry data for human blood over a shear rate range of 0.05 s - 1 to 600 s - 1 . A 3-D shear-thinning Maxwell model was proposed for blood by Sun and De Kee in [16]: this model had more parameters than the Yeleswarapu model but still had the same limitation in that the relaxation time did not depend on the shear rate. A shear-thinning viscoelastic model with relaxation times depending on the shear rate was first proposed by Anand and Rajagopal in 2004 [17]. This model, which is a generalization of the Oldroyd-B model, is developed within a thermodynamic framework that recognizes that a viscoelastic fluid can remain stress-free in several, and not just one, configurations. Owens proposed a model in 2006 [18] using a different approach based on the theory of polymer network formation. The Owens model had different relaxation times for RBC aggregates of different sizes: overall, though, the model came up with a single relaxation time for blood. The difference between the models of Anand and Rajagopal [17] and Owens [18] has been described in [19]. A second-grade fluid model which shear-thins, but which by definition cannot exhibit stress-relaxation, was used to study pulsatile flow of blood in a rigid artery by Massoudi and Phuoc [20]. Recently, Massoudi, Antaki and co-workers developed a two-constituent mixture theory model for blood described in [21] which was able to predict near-wall enrichment of platelets during flow in a channel by solving diffusion equations for platelets along with the blood flow equations.
The model in [17] has been numerically studied in 3-D simulations by Bodnar et al. [22]: they obtained results for steady flow in a curved and in a stenosed (stenosed = narrowed) tube. They found that, compared to the Navier–Stokes fluid: (i) the model necessitated higher pressure drop; (ii) the magnitude of difference in axial velocity increased with the reduction of the flow rate. Further, compared to the shear-thinning Oldroyd-B fluid (with constant relaxation times), the shear-rate dependent viscoelasticity played a less significant role in axial velocity difference compared to shear-thinning. A shortcoming in the model developed by Anand and Rajagopal is that the viscosity has a discontinuous first derivative at low shear rates, making it unsuitable for high-fidelity finite element methods. This shortcoming was addressed by Anand et al. [23] who developed a shear-thinning viscoelastic fluid model that can be used with such computational schemes in complex geometries such as bent and branched tubes through which blood is likely to flow.

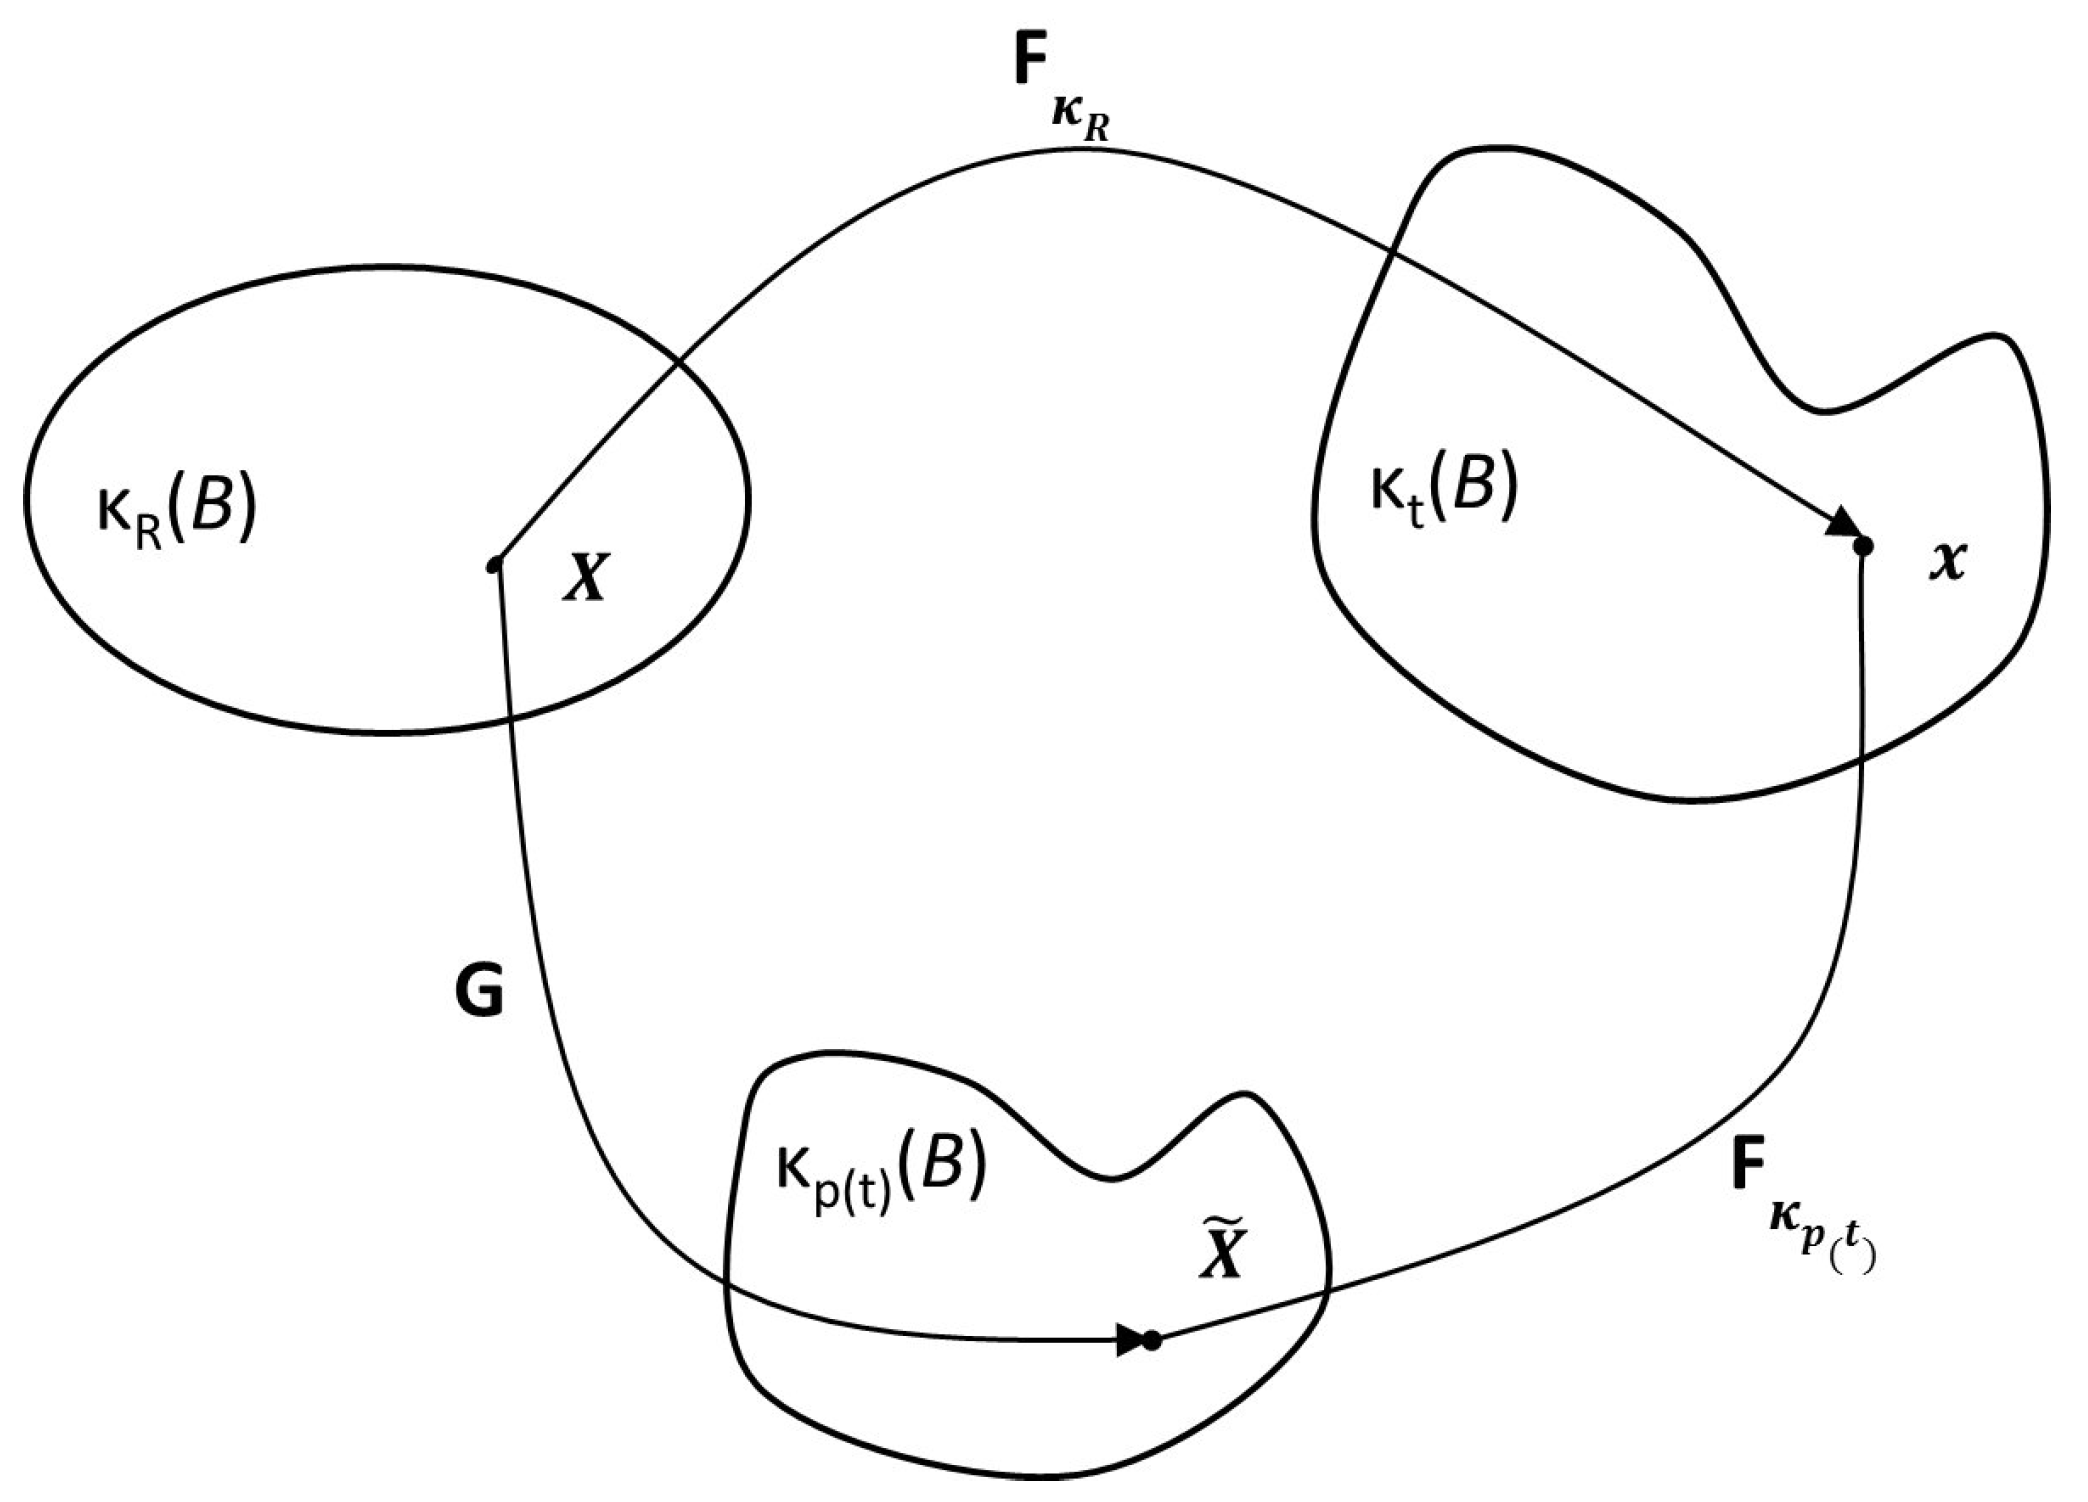
2.1.1. Model of Anand et al. (2013)

The model (The material in this subsection is based on the work in [23]) in Anand et al. [23] is that of a viscoelastic fluid with a single relaxation mechanism characterized by instantaneous elastic response: the deformation of such a fluid is shown in Figure 1. Three configurations are seen in Figure 1: κ R ( B ) denotes the reference configuration of the body B, κ t ( B ) denotes the current configuration of B at time t, while κ p ( t ) ( B ) refers to the stress-free (natural) configuration that is reached by instantaneous elastic unloading of the body from the current configuration.
The motion of the body is a one-to-one mapping between each point ( X ) in the reference configuration ( κ R ( B ) ) and a corresponding point ( x ) in the current configuration ( κ t ( B ) ) so that:
x = χ κ R ( X , t ) .
Assuming the motion to be sufficiently smooth, and suppressing B in the notation for configurations, we define the deformation gradient F κ R as:
F κ R = χ κ R ( B ) X κ R .
The left Cauchy–Green stretch tensor B κ R is subsequently defined as:
B κ R = F κ R F κ R T .
Provided the deformation is homogeneous, the deformation gradient F κ p ( t ) , between the instantaneous natural configuration (see Rajagopal [24] for a detailed discussion of the notion of natural configurations) and the current configuration, can be defined. The left Cauchy–Green stretch tensor associated with the instantaneous elastic response from the natural configuration κ p ( t ) is then defined as:
B κ p ( t ) = F κ p ( t ) F κ p ( t ) T .
The mapping G shown in Figure 1 is then defined by:
G = F κ R κ p ( t ) = F κ p ( t ) - 1 F κ R .
The velocity gradient L is defined by:
L = F ˙ κ R F κ R - 1 ,
where the dot represents the material time derivative. The material time derivative for a tensor variable, say F , is given by:
D F D t = F t + ( grad F ) v ,
with v being the velocity vector.
The symmetric part of L is defined as:
D = L + L T 2 .
The upper-convected Oldroyd derivative of B κ p ( t ) , B κ p ( t ) is defined as:
B κ p ( t ) = B ˙ κ p ( t ) - L B κ p ( t ) - B κ p ( t ) L T .
Based on a thermodynamic framework that ensures that the second law of themodynamics is met, one can systematically develop implicit rate type constitutive theories that can describe the response of viscoelastic fluids (see Rajagopal and Srinivasa [25] for a discussion of the thermodynamic framework and Rajagopal [26] for a discussion of implicit constitutive theories.) Using the above notation, the Cauchy stress tensor T of the viscoelastic fluid model in Anand et al. [23] is written as:
T = - p 1 + S ,
S = μ B κ p ( t ) + η 1 D ,
B κ p ( t ) = - 2 μ η B κ p ( t ) - λ 1 ,
η = α t r B κ p ( t ) - m , m > 0
λ = 3 t r B κ p ( t ) - 1 .
Here, the term η , which (along with η 1 = constant) quantifies the rate of dissipation in the fluid, contains a power-law dependence on the instantaneous elastic stretch B κ p ( t ) ; it is adapted ( m > 0 ) to capture the shear-thinning behavior of blood.

2.2. Models for Clot Formation and Lysis

The appearance of a clot during blood flow complicates the flow patterns in blood due to the appearance of a new material with much higher viscosity. The traditional view of clot formation and growth developed from in vitro biochemical experiments is the “cascade model”, wherein clot formation is the end result of a sequence of enzymatic reactions that are facilitated on the membrane surface of “activated platelets”. Three key biochemical changes: platelet activation and aggregation, coagulation, and fibrinolysis: underlie the appearance, growth, and dissolution of clots. The biochemical changes that occur in the cascade model of coagulation are detailed in Mann [27], and they are summarized in [2] as well. An extensive review of the literature pertaining to mathematical/mechanistic models of the cascade model of coagulation, and the various hypotheses explored by individual groups, can be found in [2].
The cascade model is now understood to be restricted in applicability to in vitro experiments. The in vivo progress of blood coagulation was initially described by Orfeo et al. [28] to occur in three stages (initiation, propagation, and termination) in three distinct compartments (extravascular space exposed by injury, the region enclosed by the clot, and surrounding intravascular space) that are spatially disjoint. This view has been further expanded, and it is now recognized that, in vivo, the various reactions of blood coagulation occur at different sites on different cell surfaces which are part of different tissues making flow, transport, and diffusion—of participating enzymes and platelets—the important factors that link the distinct compartments into a single functional system [29]. Succinctly put, the new understanding of coagulation necessitates models that capture spatio-temporal changes, as opposed to temporal changes alone, and those which span interactions at multiple scales (sub-cellular coagulation reactions and fibril generation, cellular interactions of platelets with each other and with the flow, and macro-scale vessel wall-level blood flow and reactant transport) as opposed to single scale (macro-scale continuum level) alone. We will review the advances in single-scale modelling of coagulation, and then proceed to review those that incorporate the new understanding.

2.2.1. Single-Scale Models

Single-scale continuum level models of coagulation consist either of reaction–diffusion equations or simply reaction equations that govern the generation/depletion and motion of the biochemical participants (zymogens, enzymes, enzyme complexes, and inhibitors) of coagulation. These models consist of reaction equations in the case that motion is ignored, i.e., in quiescent conditions. Single-scale models for coagulation consisting of reaction–diffusion equations are formulated as partial differential equations (PDEs), whereas they are formulated as ordinary differential equations (ODEs) if only reactions are present. Reaction–diffusion models for coagulation have the typical form:
[ X i ] t = D i 2 [ X i ] z 2 + G i ,
where [ X i ] is the concentration of reactant X i , D i is the diffusion coefficient governing its motion in the absence of flow, G i represents the net rate of production (by generation and depletion reactions) of X i , and t , x are time and spatial variables, respectively. On the other hand, reaction models for coagulation have the typical form:
d [ X i ] d t = G i .
The most widely studied (single-scale continuum level) model for coagulation is the one developed by Hockin et al. [30]: this model is classified as a homogeneous model in terms of its treatment of platelets (See Diamond [31] for basis of classification of a model as homogeneous, pseudo-homogeneous, or heterogeneous.) Kuharsky and Fogelson [32] developed a model for coagulation that focussed on the progress of reactions which occured in a thin layer whose thickness was determined by the flow: this model was single-scale and heterogeneous. Panteleev et al. [33] developed a single scale heterogeneous model for coagulation that incorporated competitive binding of fXa and fIIa on activated platelets: the model predicted that spatial propagation of coagulation was regulated by the intrinsic pathway while the Protein C pathway facilitated the localization of coagulation. The single scale homogeneous model of Anand et al. [34] was able to quantitatively predict the effects of antithrombin III (ATIII) deficiency and Protein C (PC) deficiency. Luan et al. [35] used a single scale heterogeneous model to show that mathematically-determined points of fragility coincided with clinical data, and thus advocated the use of such models for determining therapeutic targets. Chatterjee et al. [36] extended the model of [30] and developed a single-scale pseudo-homogeneous model that captured the clot initiation that occurred in blood even when treated with corn trypsin inhibitor (Corn trypsin inhibitor is used to block the contact pathway of coagulation). Susree and Anand [37] combined elements of the models in [30,32,34] to come up with a single scale pseudo-homogeneous model which showed that inhibition of platelet activation by other platelets had a much more significant effect on thrombin production than inhibition of platelet activation by thrombin.

2.2.2. Multi-Scale Models

While single-scale computational models using systems of ODEs and PDEs have become the main stay of in silico tests to improve diagnostics of coagulation, and also in pharmacodynamic studies to determine drug efficacy and suggest targets for drugs, the future of computational modeling (given the advances in the understanding of coagulation) is likely to involve models that incorporate convection, diffusion, and spatial distribution of enzymes [38]. By extension, models which incorporate cellular-level information as well, and illustrated using suitably advanced simulations are likely to play a more important role. In the last few years, work has focused on understanding the role of flow and transport in integrating the different compartments of the hemostatic response. We will briefly review the work that has incorporated the role of flow on clot growth, and vice versa, rather than on individual studies (usually performed in microfluidic devices) that aim to elucidate the effect of flow on each reaction or event (such as platelet aggregation).
Bodnar and Sequeira [39] numerically simulated the framework of models (albeit, slightly simplified) that was posited by Anand et al. [2]: they reported results for the growth of a more viscous clot during blood flow over a finite surface injury on the walls of a cylindrical pipe. This work was preliminary, and was meant to validate the numerical scheme and also the correctness of results obtained using the framework of models. The final results using the complete framework of models in [2] were presented in Sequeira and Bodnar [40]. However, because the models in [2,34] did not have a separate term to track platelets (a limitation that was addressed in [37]), the results of Sequeira and Bodnar [40] do not contain information on the distribution of platelets in the clots, nor on how platelet distribution affects movement of enzymes within the clot: i.e., they do not contain information at the cellular scale, although they incorporate information at sub-cellular and continuum scales. Information at the cellular (platelet) scale, but not the effect of blood/clot rheology, can be found in the studies mentioned hereafter.
Leiderman and Fogelson [41] extended the work of Kuharsky and Fogelson [32], and used platelet concentration profiles in simulations of spatio-temporal platelet-thrombus growth in the presence of flow: they found that increasing shear rate led to increased platelet deposition (and thrombus growth) only if inlet platelet distribution was non-uniform (with pronounced near-wall excess of platelets). Further, apart from thrombus size, density of bound platelets within the thrombus were highest for the highest shear rate (at which the near-wall platelet concentration was also highest). This work was extended to study the effect of hindered transport of proteins within the thrombus in [42]. A review of these works can be found in Leiderman and Fogelson [43]. A more expansive review of multi-scale models by Fogelson and Neeves [44] includes the above works as part of a spectrum of modeling and experimental work aimed at describing the role of fluid mechanics in clot formation and stability.
Separately, Wu et al. [45] developed and simulated growth of a thrombus in a Navier–Stokes fluid using a set of 10 convection–reaction–diffusion equations which allowed for irregular thrombus shape, alteration of flow field due to growth of the thrombus, and thrombus embolization due to shear. These extensions are important when simulating blood flow over blood-wetted devices, and the authors presented illuminating results for the growth of thrombus on an injured blood vessel in vivo, and in a micro-crevice in vitro.
Xu et al. [46] developed a multi-scale model for platelet and red blood cell (RBC) aggregation in two-dimensional flow of a Navier–Stokes fluid with sub-cellular continuum level biochemical reactions. They used a discrete stochastic Cellular Potts Method (CPM) to track the movement of platelets and RBCs, and the homogeneous model of Jones and Mann [47] for the biochemical reactions. Their simulations reproduced some experimentally observed features of platelet thrombi such as quantitative dependence of thrombus growth rate on blood flow rate, and heterogeneity of thrombus structure. Xu et al. [48] extended the model to use the more comprehensive biochemistry model in [30] and included platelet-binding reactions from [32]: they obtained a result consistent with experimental data in that factor VII played an important role in early-stage thrombus development. These, and other single-scale, two-scale, and multi-scale studies were reviewed by Xu et al. [49]. A more recent review by Bessonov et al. [50] cites the presence of multi-scale methods apart from the CPM-PDE method used by Xu et al. [46] to model cellular interactions in blood plasma, and particularly highlights the results obtained using the Dissipative Particle Dynamics-Partial Differential Equation (DPD-PDE) method for flow of plasma with platelets and RBCs.

3. Discussion

We have reviewed the advances in modelling of blood rheology, and of clot formation and lysis, since the appearance of the article [2]. While some new models in blood rheology (notably the ones in [18,20,23]) have appeared, the thrust of development is in simulation of such models in the complex geometries of the vasculature/medical devices through which blood flows. With regard to clot formation, the acceptance of in silico tests for the generation of hypotheses by an influential section of the biochemical community (see Mann [51]) has meant increasingly comprehensive single-scale models of coagulation (notably the ones in [36,37]). Simultaneously, with our understanding of in vivo coagulation evolving from the “cascade” model into a ‘three-stage multi-scale process made functional by flow’, multi-scale models of coagulation have been developed (notably the ones in [40,41,48]), simulated in the presence of flow, and their predictions verified with experimental hypotheses.

Acknowledgments

We thank Keshava Rajagopal for his interactions with us on several papers in the subject matter of this paper.

Author Contributions

Mohan Anand and Kumbakonam Ramamani Rajagopal wrote the paper.

Conflicts of Interest

The authors declare no conflict of interest.

References

  1. Baillargeon, B.; Rebelo, N.; Fox, D.D.; Taylor, R.L.; Kuhl, E. The Living Heart Project: A robust and integrative simulator for human heart function. Eur. J. Mech. A Solids 2014, 48, 38–47. [Google Scholar] [CrossRef] [PubMed]
  2. Anand, M.; Rajagopal, K.; Rajagopal, K.R. A model incorporating some of the mechanical and biochemical factors underlying clot formation and dissolution in flowing blood. J. Theor. Med. 2003, 5, 183–218. [Google Scholar] [CrossRef]
  3. Charm, S.E.; Kurland, G.S. Viscometry of human blood for shear rate of 0–100,000 sec−1. Nature 1965, 206, 617–618. [Google Scholar] [CrossRef] [PubMed]
  4. Thurston, G.B. Viscoelasticity of human blood. Biophys. J. 1972, 12, 1205–1217. [Google Scholar] [CrossRef]
  5. Thurston, G.B. Frequency and shear rate dependence of viscoelasticity of blood. Biorheology 1973, 10, 375–381. [Google Scholar] [PubMed]
  6. Thurston, G.B. Rheological Parameters for the viscosity, viscoelasticity and thixotropy of Blood. Biorheology 1979, 16, 149–162. [Google Scholar] [PubMed]
  7. McMillan, D.E.; Utterback, N.G.; Nasrinasrabadi, M.; Lee, M.M. An Instrument to evaluate the time dependent flow properties of blood at moderate shear rates. Biorheology 1986, 23, 63–74. [Google Scholar] [PubMed]
  8. Womersley, J.R. Method for the calculation of velocity, rate of flow and viscous drag in arteries when the pressure gradient is known. J. Physiol. 1955, 127, 553–563. [Google Scholar] [CrossRef] [PubMed]
  9. Casson, N. A flow equation for pigment-oil suspensions of the printing ink type. In Rheology of Disperse Systems; Mill, C.C., Ed.; Pergamon Press: Oxford, UK, 1959; pp. 84–104. [Google Scholar]
  10. Liepsch, D.; Moravec, S. Pulsatile flow of Non-Newtonian fluids in distensible models of human arteries. Biorheology 1984, 21, 571–586. [Google Scholar] [PubMed]
  11. Cho, Y.I.; Kensey, K.R. Effects of the non-newtonian viscosity of blood on flows in a diseased arterial vessel. Part I: Steady flows. Biorheology 1991, 28, 241–262. [Google Scholar] [PubMed]
  12. Quemada, D. A non-linear Maxwell model of biofluids: Application to normal blood. Biorheology 1993, 30, 253–265. [Google Scholar] [PubMed]
  13. Sharp, M.K.; Thurston, G.B.; Moore, J.E. The effect of blood viscoelasticity on pulastile flow in stationary and axially moving tubes. Biorheology 1996, 33, 185–206. [Google Scholar] [CrossRef]
  14. Phillips, W.M.; Deutsch, S. Toward a constitutive equation for blood. Biorheology 1975, 12, 383–389. [Google Scholar] [PubMed]
  15. Yeleswarapu, K.K. Evaluation of Continuum Models for Characterizing the Constitutive Behavior of Blood. Ph.D. Thesis, University of Pittsburgh, Pittsburgh, PA, USA, 1996. [Google Scholar]
  16. Sun, N.; De Kee, D. Simple shear, hysteresis and yield stress in biofluids. Can. J. Chem. Eng. 2001, 79, 36–41. [Google Scholar]
  17. Anand, M.; Rajagopal, K.R. A shear-thinning viscoelastic fluid model for describing the flow of blood. Int. J. Cardiovasc. Med. Sci. 2004, 4, 59–68. [Google Scholar]
  18. Owens, R.G. A new micro-structure based constitutive model for blood. J. Non-Newton. Fluid Mech. 2006, 40, 57–70. [Google Scholar] [CrossRef]
  19. Capek, M. A Non-Newtonian Model of Blood Capturing Segregation of Erythrocytes. Unpublished, Necas Center for Mathematical Modeling. 2014. [Google Scholar]
  20. Massoudi, M.; Phuoc, T.X. Pulsatile flow of blood using a modified second grade fluid model. Comput. Math. Appl. 2008, 56, 199–211. [Google Scholar] [CrossRef]
  21. Wu, W.T.; Aubry, N.; Massoudi, M.; Antaki, J.F. Transport of platelets induced by red blood cells based on mixture theory. Int. J. Eng. Sci. 2017, 118, 16–27. [Google Scholar] [CrossRef]
  22. Bodnar, T.; Rajagopal, K.R.; Sequeira, A. Simulation of the three-dimensional flow of blood using a shear-thinning viscoelastic fluid model. Math. Model. Nat. Phenom. 2011, 6, 1–24. [Google Scholar] [CrossRef]
  23. Anand, M.; Kwack, J.H.; Masud, A. A new generalized Oldroyd-B model for blood flow in complex geometries. Int. J. Eng. Sci. 2013, 72, 78–88. [Google Scholar] [CrossRef]
  24. Rajagopal, K.R. Multiple Natural Configurations in Continuum Mechanics; Technical Report “Report 6”; Institute of Computational and Applied Mechanics, University of Pittsburgh: Pittsburgh, PA, USA, 1995. [Google Scholar]
  25. Rajagopal, K.R.; Srinivasa, A.R. A thermodynamic framework for rate-type fluids. J. Non-Newton. Fluid Mech. 2000, 88, 207–227. [Google Scholar] [CrossRef]
  26. Rajagopal, K.R. On implicit constitutive theories. Appl. Math. 2013, 48, 279–319. [Google Scholar] [CrossRef]
  27. Mann, K.G. Thrombin formation. Chest 2003, 124, 4S–10S. [Google Scholar] [CrossRef] [PubMed]
  28. Orfeo, T.; Butenas, S.; Brummel-Ziedins, K.E.; Mann, K.G. The tissue factor requirement in blood coagulation. J. Biol. Chem. 2005, 280, 42887–42896. [Google Scholar] [CrossRef] [PubMed]
  29. Panteleev, M.A.; Dashkevich, N.M.; Ataullakhanov, F.I. Hemostasis and thrombosis beyond biochemistry: Roles of geometry, flow and diffusion. Thromb. Res. 2015, 136, 699–711. [Google Scholar] [CrossRef] [PubMed]
  30. Hockin, M.F.; Jones, K.C.; Everse, S.J.; Mann, K.G. A Model for the stoichiometric regulation of blood coagulation. J. Biol. Chem. 2002, 277, 18322–18333. [Google Scholar] [CrossRef] [PubMed]
  31. Diamond, S.L. Systems biology of coagulation. J. Thromb. Haemost. 2013, 11, 224–232. [Google Scholar] [CrossRef] [PubMed]
  32. Kuharsky, A.L.; Fogelson, A.L. Surface-mediated control of blood coagulation: The role of binding site densities and platelet deposition. Biophys. J. 1997, 80, 1050–1074. [Google Scholar] [CrossRef]
  33. Panteleev, M.A.; Ovanesov, M.V.; Kireev, D.A.; Shibeko, A.M.; Sinauridze, E.I.; Ananyeva, N.M.; Butylin, A.A.; Saenko, E.L.; Ataullakhanov, F.I. Spatial propagation and localization of blood coagulation are regulated by intrinsic and protein C Pathways, respectively. Biophys. J. 2006, 90, 1489–1500. [Google Scholar] [CrossRef] [PubMed]
  34. Anand, M.; Rajagopal, K.; Rajagopal, K.R. A model for the formation, growth, and lysis of clots in quiescent plasma. A comparison between the effects of antithrombin III deficiency and protein C deficiency. J. Theor. Biol. 2008, 253, 725–738. [Google Scholar] [CrossRef] [PubMed]
  35. Luan, D.; Zai, M.; Varner, J.D. Computationally derived points of fragility of a human cascade are consistent with current therapeutic strategies. PLoS Comput. Biol. 2007, 3, e142. [Google Scholar] [CrossRef] [PubMed]
  36. Chatterjee, M.S.; Denney, W.S.; Jing, H.; Diamond, S.L. Systems biology of coagulation initiation: Kinetics of thrombin generation in resting and activated human blood. PLoS Comput. Biol. 2010, 6, e1000950. [Google Scholar] [CrossRef] [PubMed]
  37. Susree, M.; Anand, M. A mathematical model for in vitro coagulation of blood: Role of platelet count and inhibition. Sadhana 2017, 42, 291–305. [Google Scholar]
  38. Shibeko, A.M.; Panteleev, M.A. Untangling the complexity of blood coagulation network: Use of computational modelling in pharmacology and diagnostics. Brief. Bioinform. 2016, 17, 429–439. [Google Scholar] [CrossRef] [PubMed]
  39. Bodnar, T.; Sequeira, A. Numerical simulation of the coagulation dynamics of blood. Comput. Math. Methods Med. 2008, 9, 83–104. [Google Scholar] [CrossRef]
  40. Sequeira, A.; Bodnar, T. Blood coagulation simulations using a viscoelastic model. Math. Model. Nat. Phenom. 2014, 9, 34–45. [Google Scholar] [CrossRef]
  41. Leiderman, K.; Fogelson, A.L. Grow with the flow: A spatial-temporal model of platelet deposition and blood coagulation under flow. Math. Med. Biol. 2011, 28, 47–84. [Google Scholar] [CrossRef] [PubMed]
  42. Leiderman, K.; Fogelson, A.L. The influence of hindered transport on the development of platelet thrombi under flow. Bull. Math. Biol. 2013, 75, 1255–1283. [Google Scholar] [CrossRef] [PubMed]
  43. Leiderman, K.; Fogelson, A.L. An overview of mathematical modeling of thrombus formation under flow. Thromb. Res. 2014, 133, S12–S14. [Google Scholar] [CrossRef] [PubMed]
  44. Fogelson, A.L.; Neeves, K.B. Fluid mechanics of blood clot formation. Annu. Rev. Fluid Mech. 2015, 47, 377–403. [Google Scholar] [CrossRef] [PubMed]
  45. Wu, W.T.; Jamiolkowski, M.A.; Wagner, W.R.; Aubry, N.; Massoudi, M.; Antaki, J.F. Multi-Constituent Simulation of Thrombus Deposition. Sci. Rep. 2017, 7, 42720. [Google Scholar] [CrossRef] [PubMed]
  46. Xu, Z.; Chen, N.; Kamocka, M.; Rosen, E.D.; Alber, M.S. A multiscale model of thrombus development. J. R. Soc. Interface 2008, 5, 705–722. [Google Scholar] [CrossRef] [PubMed]
  47. Jones, K.C.; Mann, K.G. A model for the tissue factor pathway to thrombin. II. A mathematical simulation. J. Biol. Chem. 1994, 269, 23367–23373. [Google Scholar] [PubMed]
  48. Xu, Z.; Lioi, J.; Mu, J.; Kamocka, M.M.; Liu, X.; Chen, D.Z.; Rosen, E.D.; Alber, M.S. A multiscale model of venous thrombus formation with surface-mediated control of blood coagulation cascade. Biophys. J. 2010, 98, 1723–1732. [Google Scholar] [CrossRef] [PubMed]
  49. Xu, Z.; Kim, O.; Kamocka, M.M.; Rosen, E.D.; Alber, M.S. Multiscale models of thrombogenesis. Wiley Interdiscip. Rev. Syst. Biol. Med. 2012, 4, 237–246. [Google Scholar] [CrossRef] [PubMed]
  50. Bessonov, N.; Sequeira, A.; Simakov, S.; Vassilevskii, Y.; Volpert, V. Methods of blood flow modelling. Math. Model. Nat. Phenom. 2016, 11, 1–25. [Google Scholar] [CrossRef]
  51. Mann, K.G. Is there value in kinetic modeling of thrombin generation? Yes. J. Thromb. Haemost. 2012, 10, 1463–1469. [Google Scholar] [CrossRef] [PubMed]
Figure 1. Configurations of a viscoelastic fluid body with instantaneous elasticity. Reproduced with permission from Anand, M., et al., International Journal of Engineering Science; published by Elsevier, 2013 [23].
Fluids 02 00035 g001

