

Glucose Sensor Using Sol–Gel Coating Layer Deposited on PMMA Optical Fiber: An Enzyme Activity Measurement System
 , , and
Abstract
:1. Introduction
2. Results and Discussion
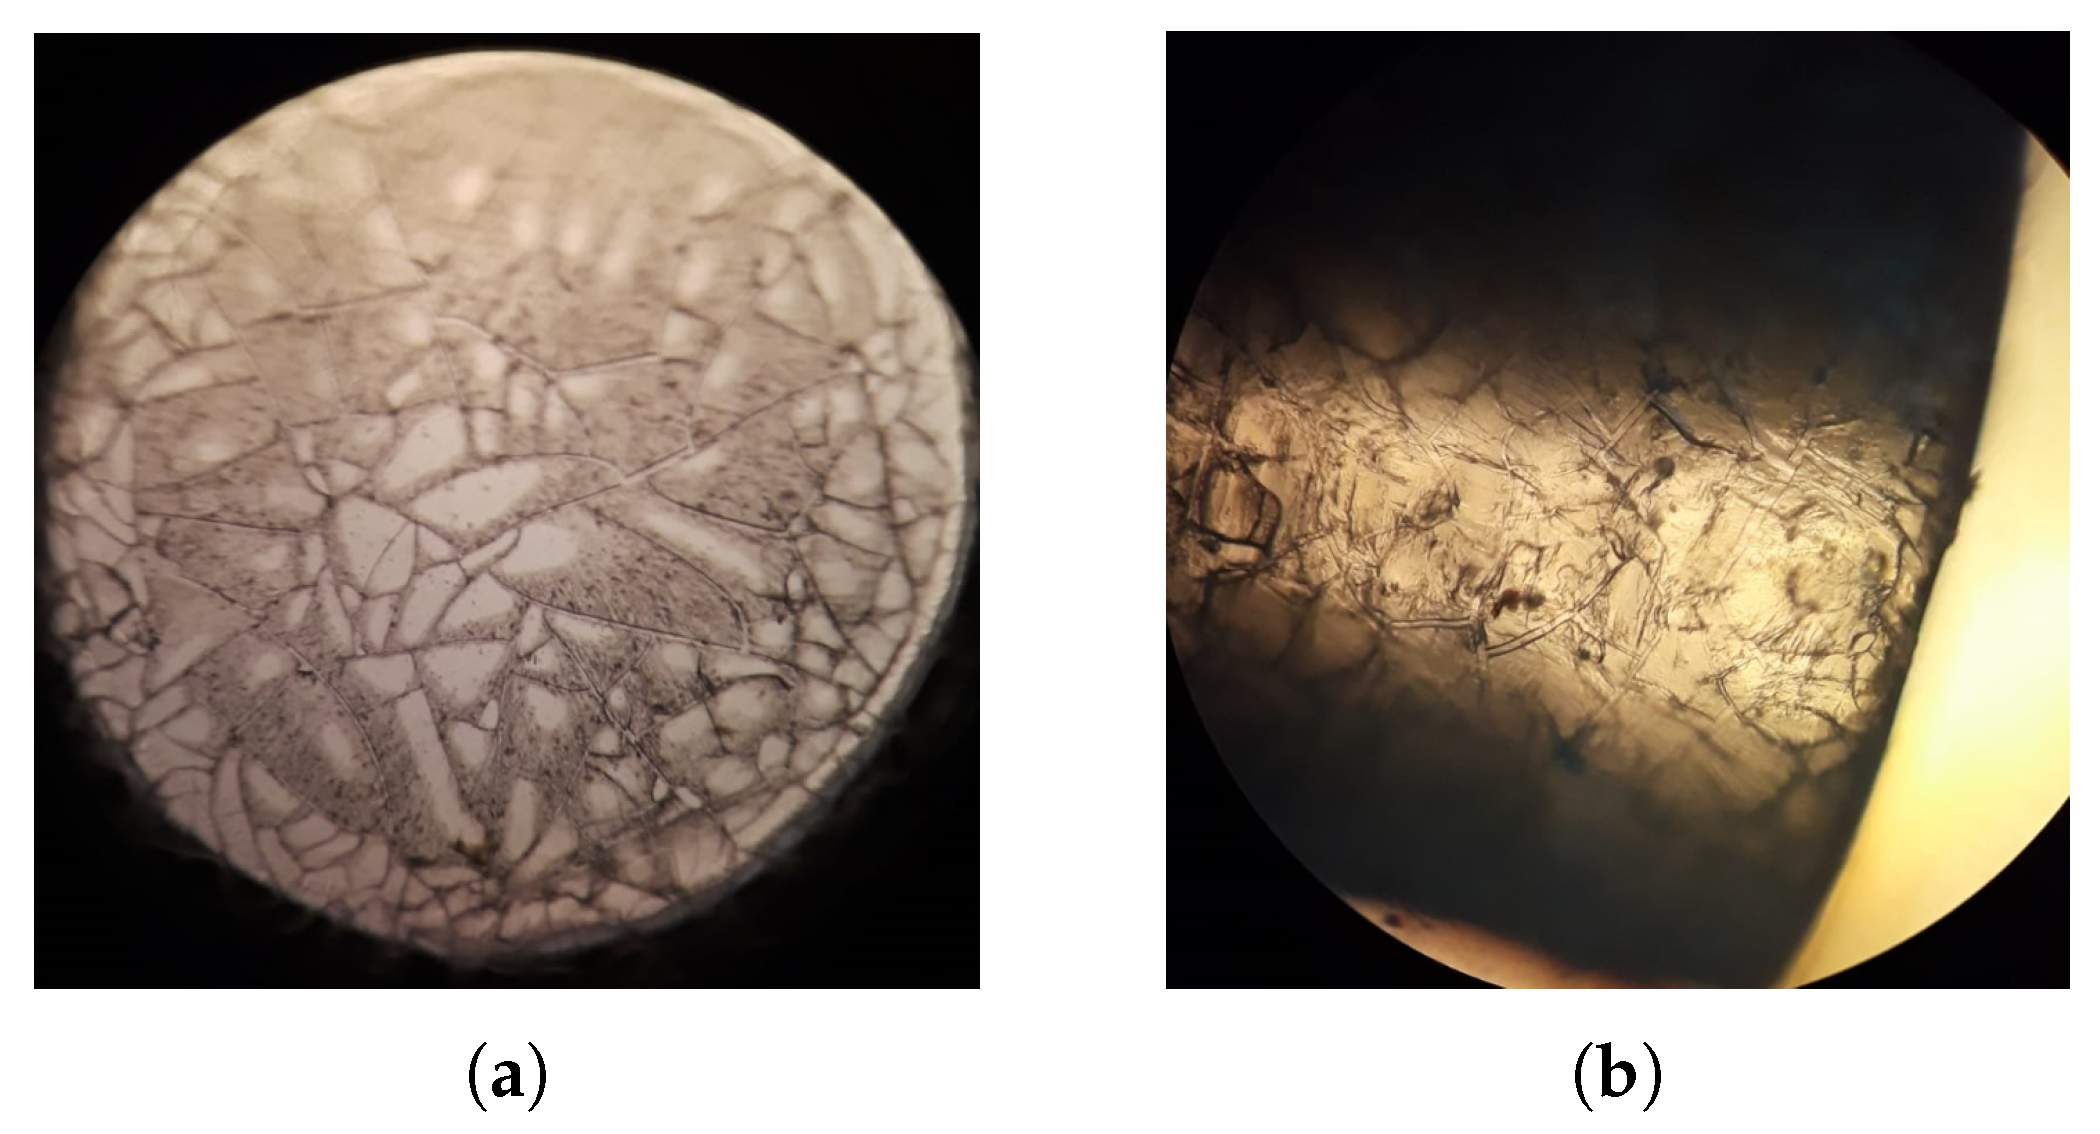
2.1. Coating
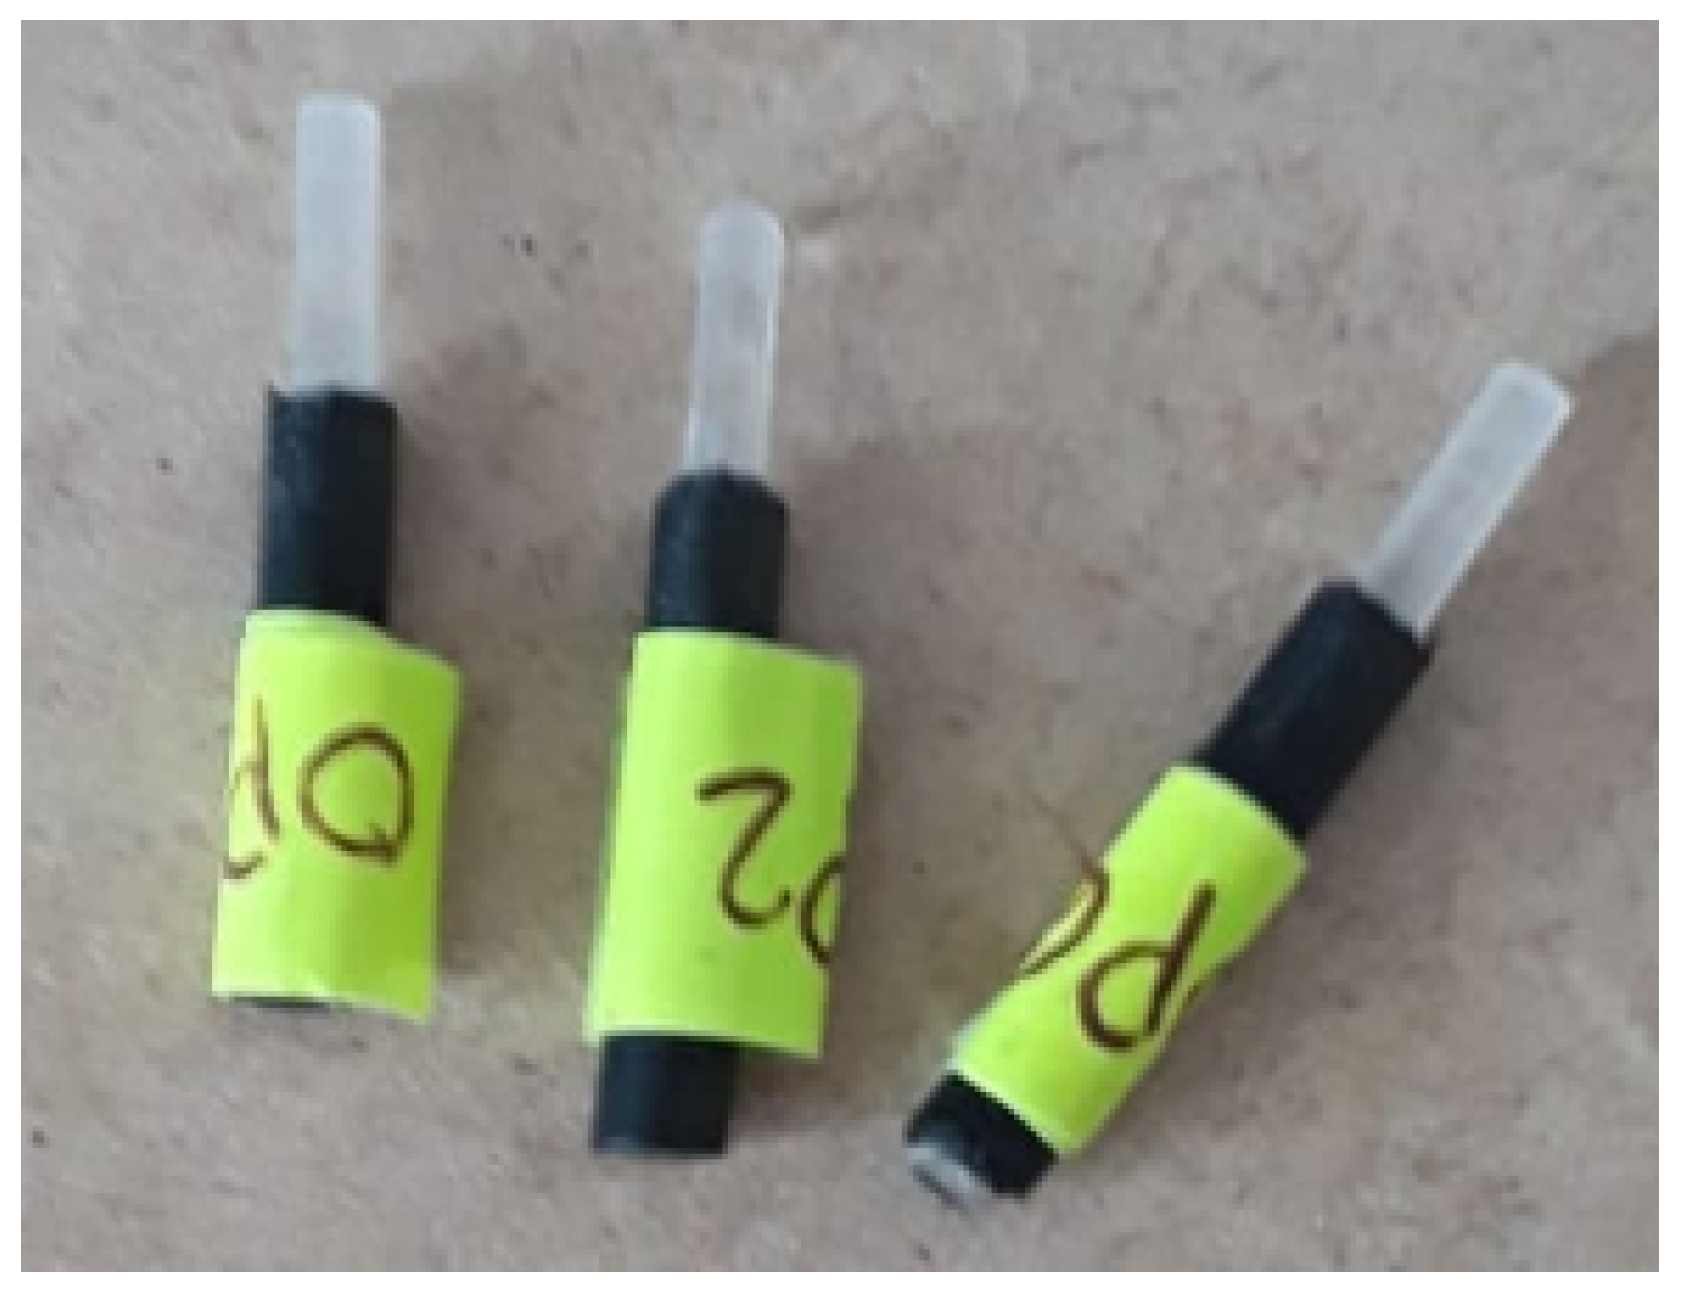
2.2. Adhesion Test
2.3. Colorimetry Assay
2.4. Biosensor Analysis
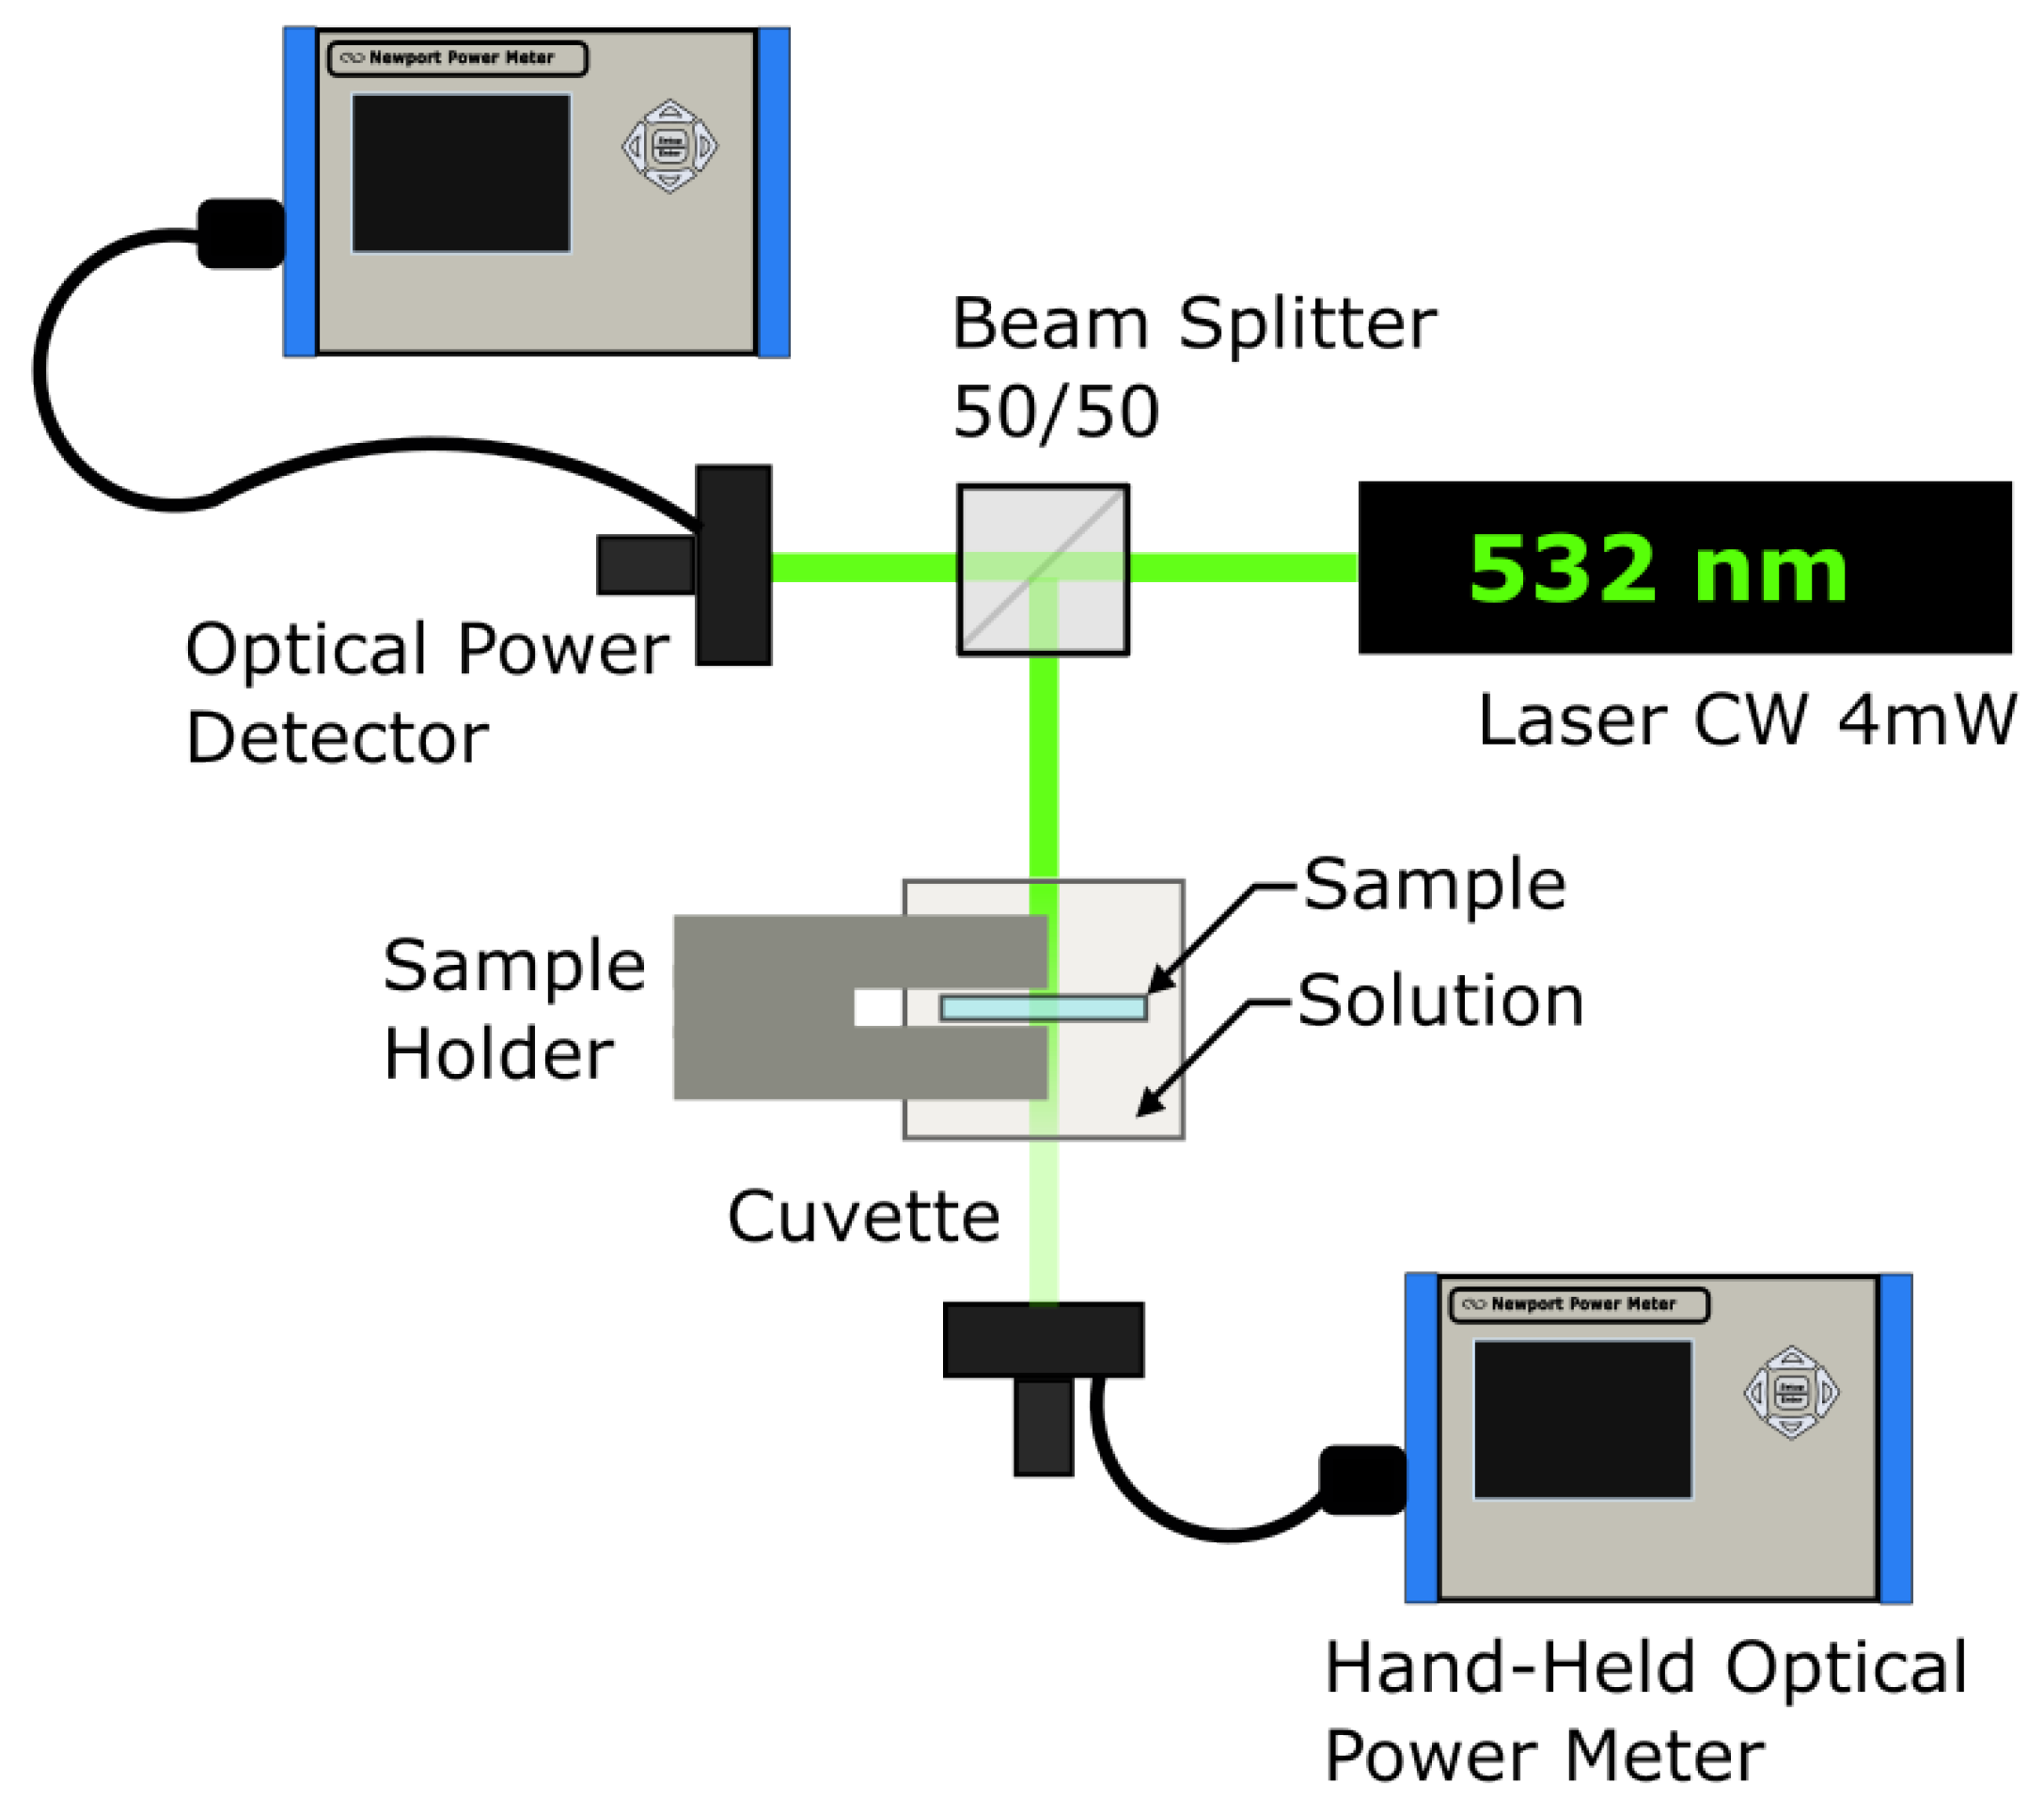
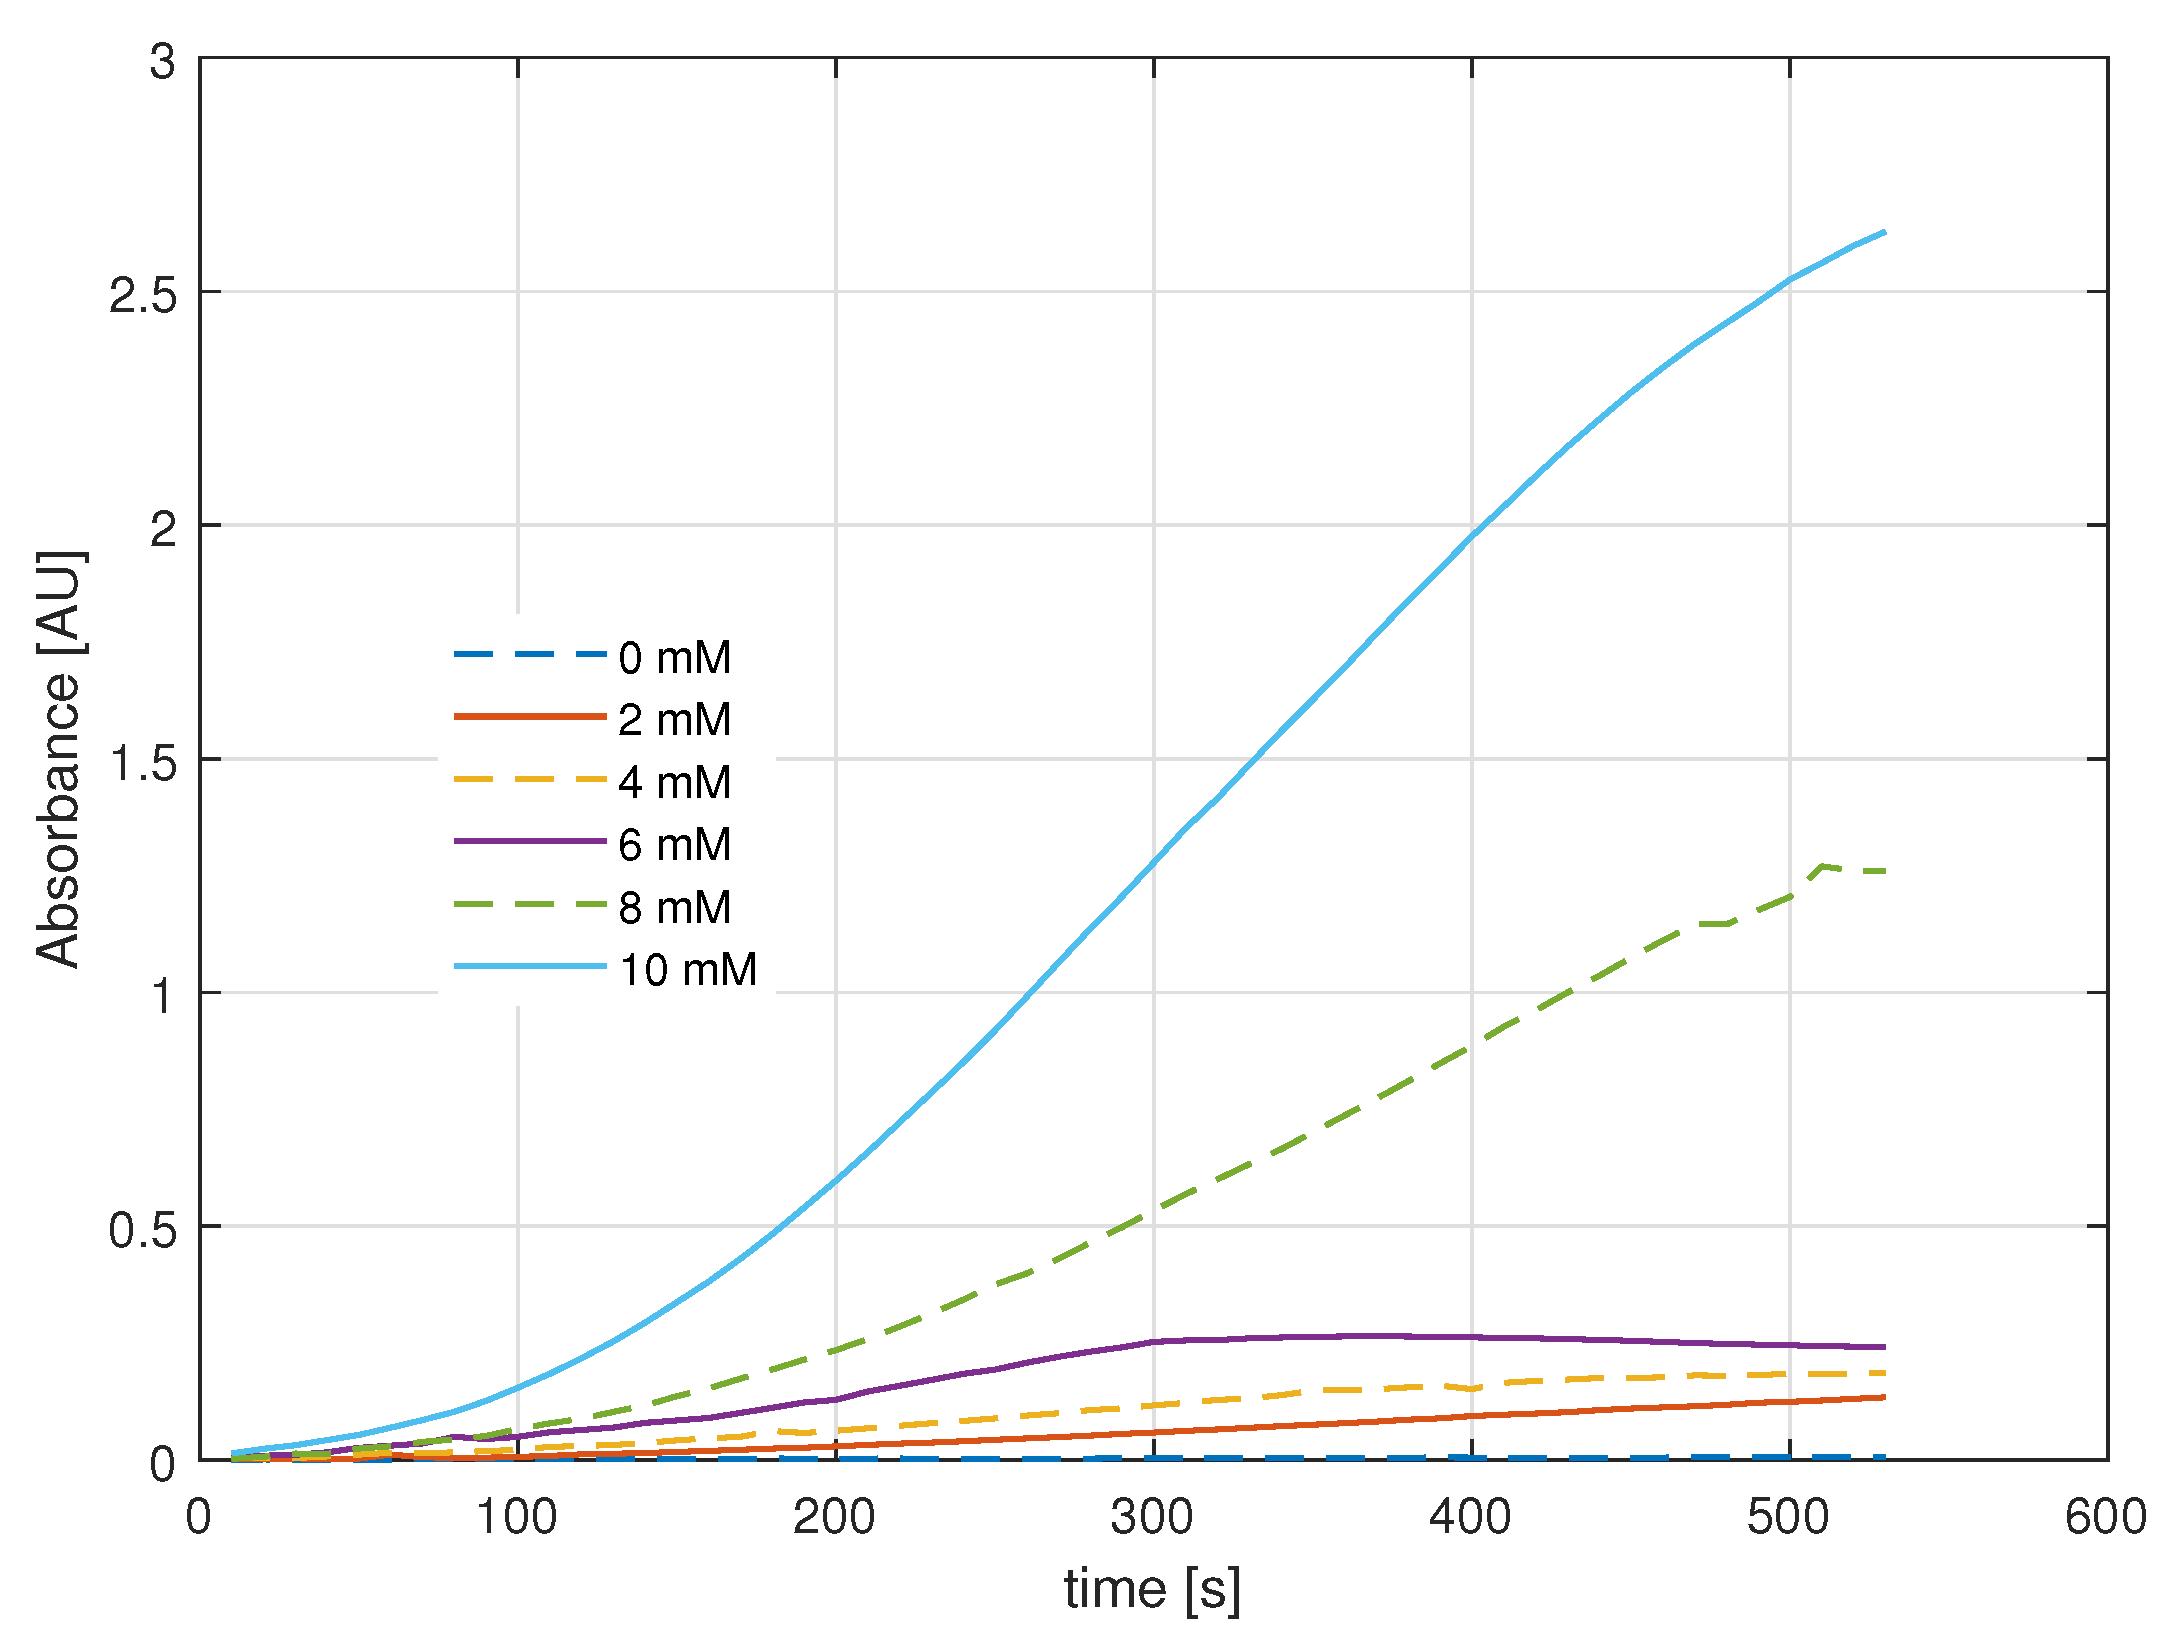
2.5. Spectrophotometry
3. Conclusions
4. Materials and Methods
- Tetraethyl orthosilicate (TEOS) 98%; CAS 78-10-4 (Sigma-Aldrich, St. Louis, MO, USA);
- Glucose oxidase (GOD), type X-S from Aspergillus niger, lyophilized powder; CAS 9000137-0 (Sigma-Aldrich, USA);
- Peroxidase from horseradish; CAS 9003-99-0 (Sigma-Aldrich, USA);
- Ethanol CHCHOH 98%; CAS 64-17-5 (Sigma-Aldrich, USA);
- Chlorhydric acid 37%; CAS 7647-01-0 (Sigma-Aldrich, USA);
- Acetic sodium salt trihydrate, pH 4.6; CAS 6131-90-4 (Hampton Research, USA);
- Distilled water.
- Beaker, 20 mL;
- Magnetic stirrer with hot plate;
- Analytical balance, 0.1 mg precision;
- Adjustable micropipette, 0.1 L–1 mL;
- Hand-held optical power meter, brand Newport, model 1918-C;
- Silicon photodetector, brand Newport, model 918D-SL-OD1R;
- Dip coater.
4.1. Sol–Gel Synthesis
4.2. Immobilization of Enzyme
4.3. Sol–Gel/GOD Deposition
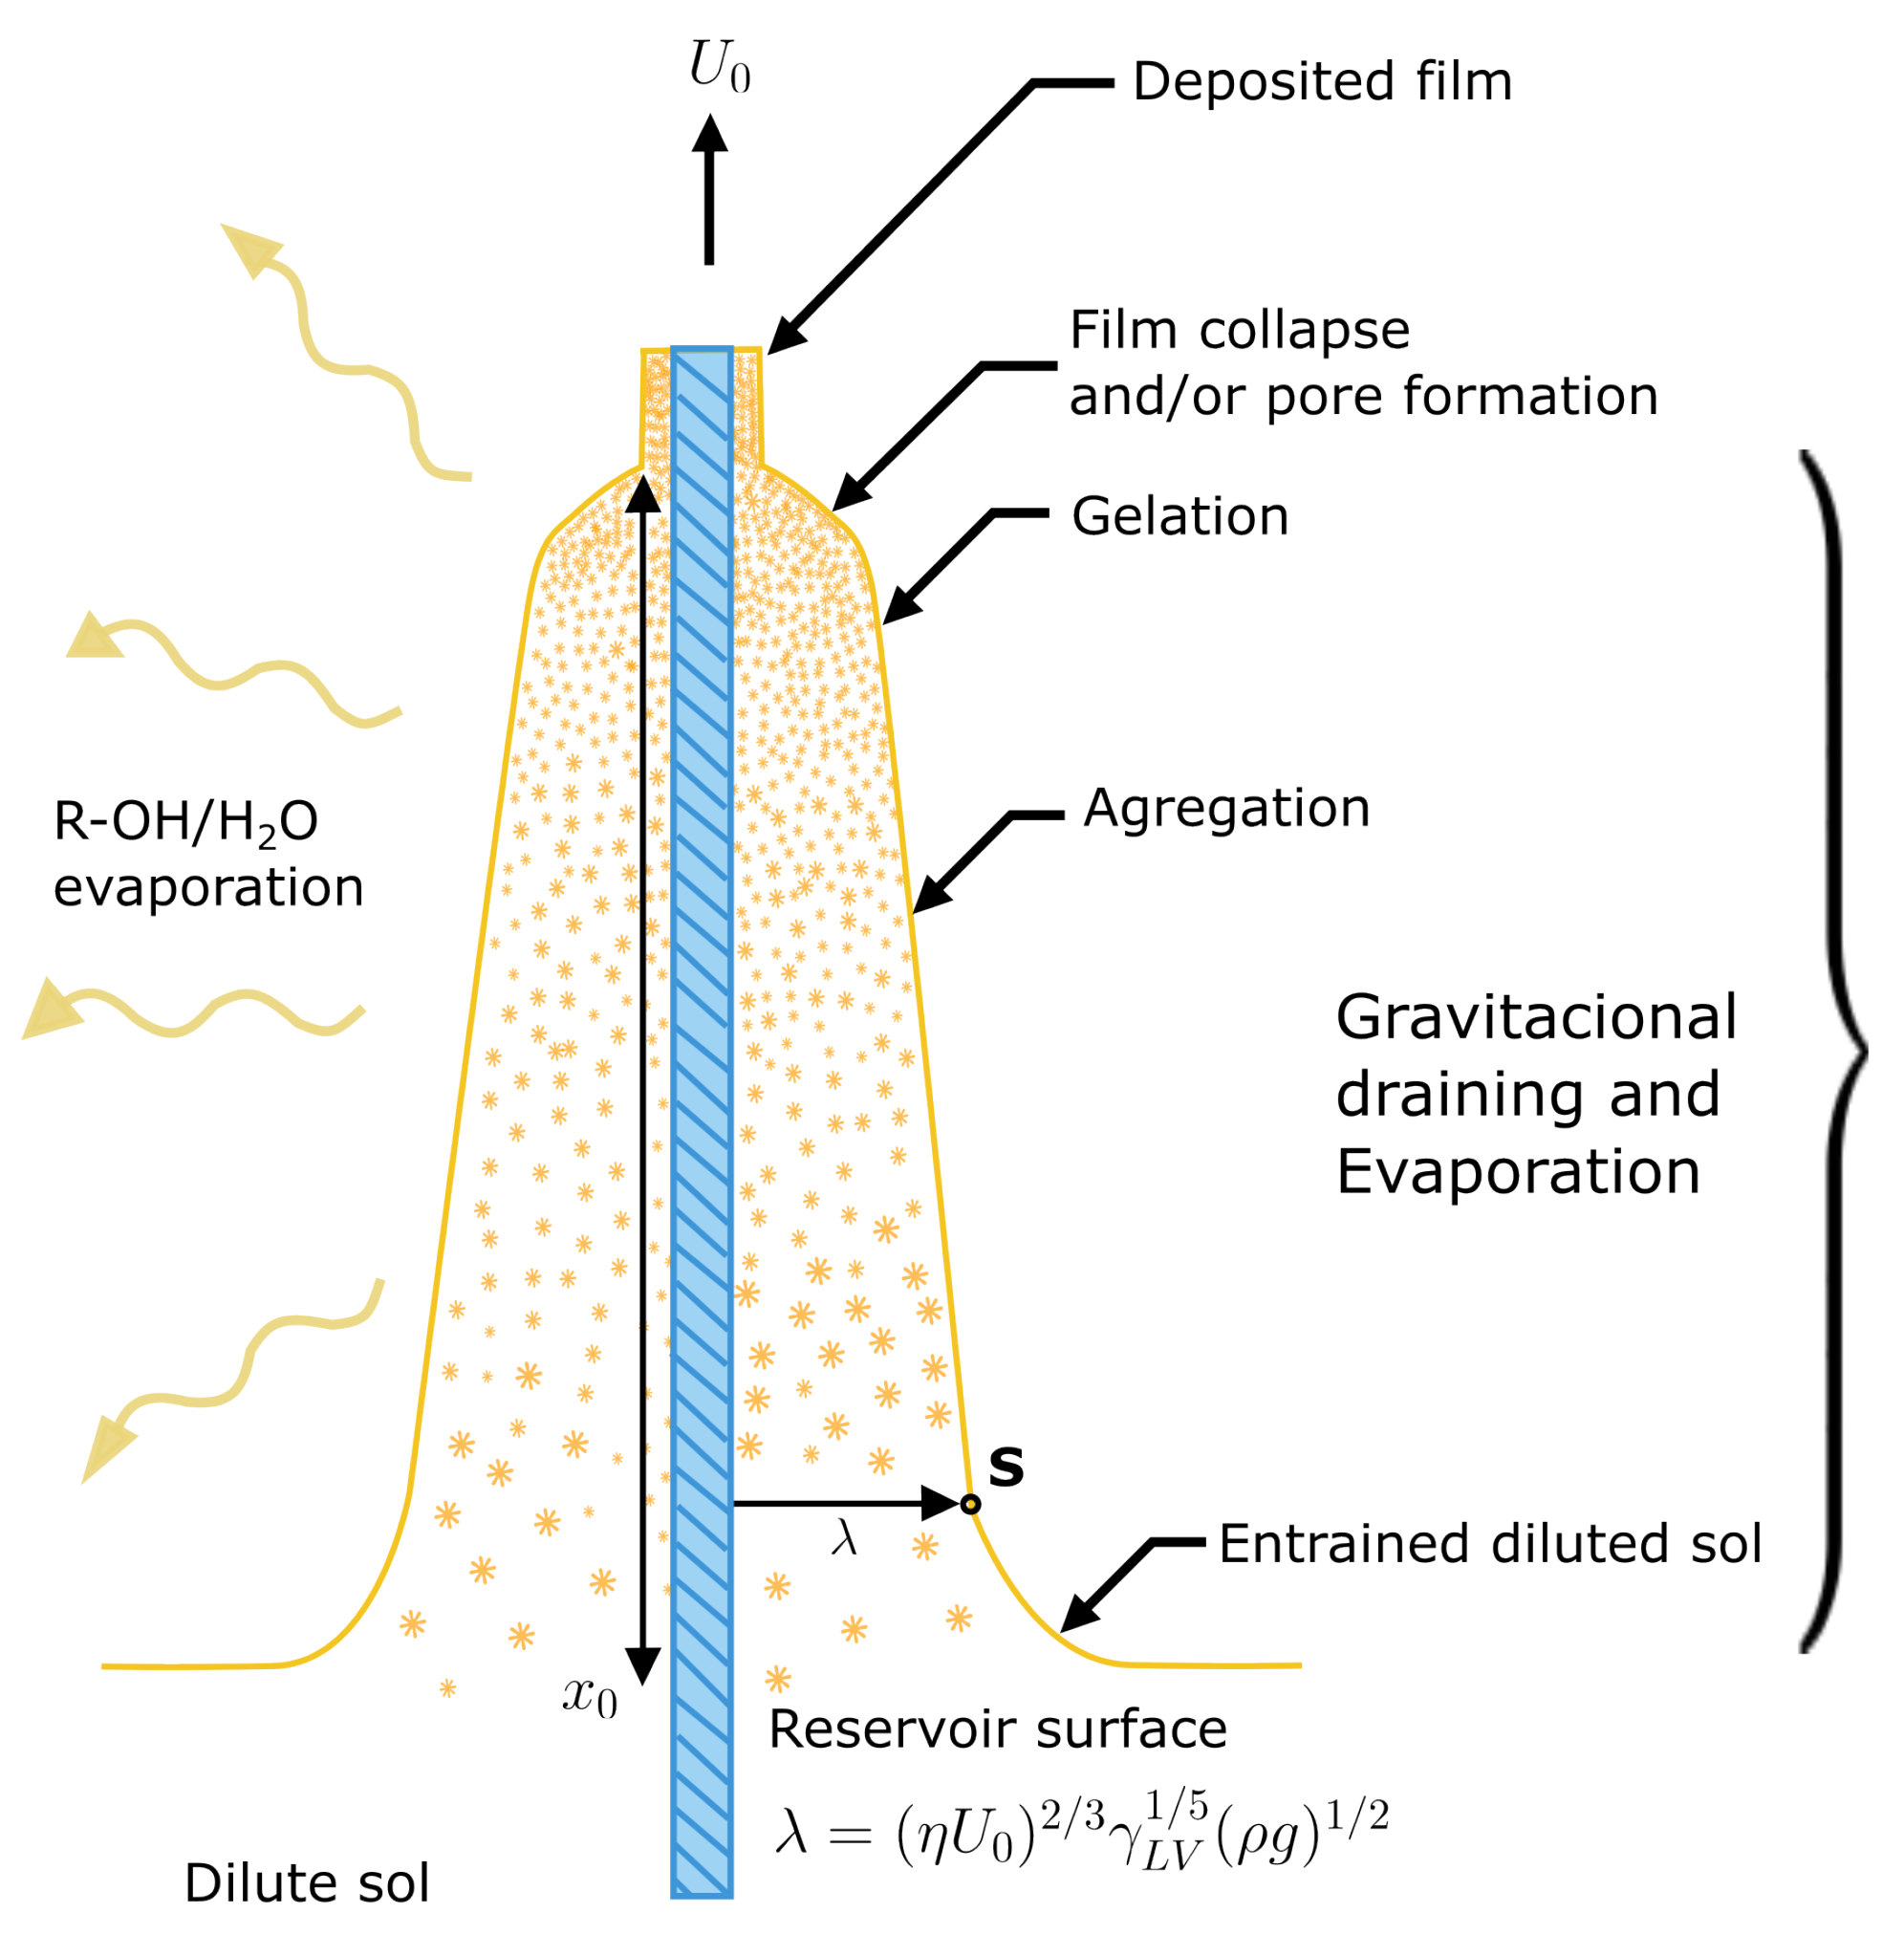
- Immersion: The substrate is immersed in the coating material solution at a constant rate (preferably without fluctuations).
- Start-up: The substrate has been sitting in the solution for a while and rises.
- Deposition: The thin layer is deposited on the substrate while being lifted. The withdrawal is carried out at a constant speed. The speed determines the coating thickness, faster removal provides a thicker coating of material [31].
- Drainage: By gravity, excess liquid is drained from the surface.
- Evaporation: The solvent evaporates from the liquid, forming a thin layer. For volatile solvents, such as alcohols, evaporation begins already during the deposition and drainage steps.
4.4. Fixation of GOD/HRP to Sol–Gel on Coverslips
4.5. Colorimetry Samples
Author Contributions
Funding
Institutional Review Board Statement
Informed Consent Statement
Data Availability Statement
Acknowledgments
Conflicts of Interest
References
- McNaught, A.D.; Wilkinson, A. IUPAC. Compendium of Chemical Terminology, 2nd ed.; Blackwell Scientific Publications: Oxford, UK, 1997; pp. 1–2. [Google Scholar]
- Scouten, W.; Luong, J.; Brown, R.S. Enzyme or protein immobilization techniques for applications in biosensor design. Trends Biotechnol. 1995, 13, 178–185. [Google Scholar] [CrossRef]
- Guisan, J.M. Immobilization of Enzymes and Cells, 3rd ed.; Humana Press: Totowa, NJ, USA, 2013; pp. 18–25. [Google Scholar]
- Brinker, C.J.; Scherer, G.W. Sol-Gel Science “The Physics and Chemistry of Sol-Gel Procesing”, 1st ed.; Academic Press, Inc.: Cambridge, MA, USA, 1990; pp. 32–58. [Google Scholar]
- MacCraith, B.D.; McDonagh, C.M.; O’Keeffe, G.; McEvoy, A.K.; Butler, T.; Sheridan, F.R. Sol-gel coatings for optical chemical sensors and biosensors. Sensors Actuators Chem. 1995, 29, 51–57. [Google Scholar] [CrossRef]
- Nguyen, C.; Rao, S.; Yang, X.; Dubey, S.; Mays, J.; Cao, H.; Chiao, J.C. Sol-Gel Deposition of Iridium Oxide for Biomedical Micro-Devices. Sensors 2015, 15, 4212–4228. [Google Scholar] [CrossRef] [PubMed] [Green Version]
- Pierre, A.C. The sol-gel encapsulation of enzymes. Biocatal. Biotransformation 2004, 22, 145–170. [Google Scholar] [CrossRef]
- Tatsu, Y.; Yamashita, K.; Yamaguchi, M.; Yamamura, S.; Yamamoto, H.; Yoshikawa, S. Entrapment of Glucose Oxidase in Silica Gel by the Sol-Gel Method and Its Application to Glucose Sensor. Chem. Lett. 1992, 21, 1615–1618. [Google Scholar] [CrossRef]
- Avnir, D.; Braun, S.; Lev, O.; Ottolenghi, M. Enzymes and Other Proteins Entrapped in Sol-Gel Materials. Chem. Mater. 1994, 6, 1605–1614. [Google Scholar] [CrossRef]
- Zandi, P.; Hosseini, E.; Rashchi, F. Effect of drying environment on grain size of titanium dioxide nano-powder synthesized via sol-gel method. In Proceedings of the International Biennial Conference on Ultrafine Grained and Nanoestructured Materials, Kish Island, Iran, 12–13 November 2017; AIP Publishing: Melville, NY, USA, 2018. [Google Scholar]
- Isley, S.L.; Penn, R.L. Titanium Dioxide Nanoparticles Effect of Sol-Gel pH on Phase Composition, Particle Size, and Particle Growth Mechanism. J. Phys. Chem. C 2008, 112, 4469–4474. [Google Scholar] [CrossRef]
- Li, J.; Beres, W. Scratch Test for Coating/Substrate Systems: A Literature Review. Can. Metall. Q. 2007, 46, 155–173. [Google Scholar] [CrossRef]
- ASTM Standard D3363-20; Test Method for Film Hardness by Pencil Test. ASTM International: West Conshohocken, PA, USA, 2022.
- Seo, Y. Immunoassays, techniques|enzyme immunoassays. In Encyclopedia of Analytical Science, 2nd ed.; Worsfold, P., Poole, C., Townshed, A., Eds.; Elsevier: Amsterdam, The Netherlands, 2005; pp. 334–352. [Google Scholar]
- Ozyilmaz, G. Glucose Oxidase Applications and Comparison of the Activity Assays. Nat. Eng. Sci. 2019, 4, 253–267. [Google Scholar] [CrossRef] [Green Version]
- Cennamo, N.; Pesavento, M.; Zeni, L. A review on simple and highly sensitive plastic optical fiber probes for bio-chemical sensing. Sensors Actuators B Chem. 2021, 331, 129393. [Google Scholar] [CrossRef]
- Elias, P.; Grey, D.S.; Robinson, D.Z. Fourier Treatment of Optical Processes. J. Opt. Soc. Am. 1952, 42, 127–134. [Google Scholar] [CrossRef]
- Fantini, S.; Franceschini, M.A.; Fishkin, J.B.; Barbieri, B.; Gratton, E. Quantitative determination of the absorption spectra of chromophores in strongly scattering media: A light-emitting-diode based technique. Appl. Opt. 1994, 33, 5204. [Google Scholar] [CrossRef] [PubMed] [Green Version]
- Johnson, M. Photodetection and Measurement: Maximizing Performance in Optical Systems, 1st ed.; McGraw-Hill: New York, NY, USA, 2003; pp. 45–51. [Google Scholar]
- Bastiaens, P.I.H.; Visser, A.J.W.G. Fluoresence Spectroscopy: New Methods and Applications, 1st ed.; Wolfbeis, O., Ed.; Springer: Heidelberg, Germany, 1993; pp. 65–78. [Google Scholar]
- Kim, Y.; Jang, G.; Kim, D.; Kim, J.; Lee, T.S. Fluorescence sensing of glucose using glucose oxidase incorporated into a fluorophore-containing PNIPAM hydrogel. Polym. Chem. 2016, 7, 1907–1912. [Google Scholar] [CrossRef]
- Han, X.; Shen, J.; Yin, P.; Hu, S.; Bi, D. Influences of refractive index on forward light scattering. Opt. Commun. 2014, 316, 198–205. [Google Scholar] [CrossRef]
- Lucarini, V.; Peiponen, K.; Saarinen, J.J.; Vartiainen, E.M. Kramers-Kronig Relations in Optical Materials Research. In Springer Series in Optical Sciences; Rhodes, W.T., Ed.; Springer: Heidelberg, Germany, 2005; Volume 110, pp. 11–21. [Google Scholar]
- Rojas, M.L. Diseño y Síntesis de Materiales “a Medida” Mediante el Método de Sol-Gel, 1st ed.; UNED: Madrid, Spain, 2015; pp. 13–19. [Google Scholar]
- Braun, S.; Rappoport, S.; Shteizer, S.; Zusman, R.; Druckmann, S.; Avnir, D.; Ottolenghi, M. Design and Properties of Enzymes Immobilized in Sol-Gel Glass Matrices. In Biotechnology: Bridging Research and Applications; Kamely, D., Chakrabarty, A.M., Kornguth, S.E., Eds.; Springer Netherlands: Dordrecht, The Netherlands, 1991; pp. 205–218. [Google Scholar]
- Martinek, K.; Mozhaev, V.V. Immobilization of enzymes: An approach to fundamental studies in biochemistry. Adv. Enzymol. Relat. Areas Mol. Biol. 2006, 57, 179–249. [Google Scholar]
- Lee, J.; Dhital, D.; Yoon, D. Investigation of cladding and coating stripping methods for specialty optical fibers. Opt. Lasers Eng. 2011, 49, 324–330. [Google Scholar] [CrossRef]
- Figueira, R.B.; Silva, C.J.R.; Pereira, E.V. Influence of experimental parameters using the Dip-Coating method on the barrier performance of hybrid Sol-Gel coatings in strong alkaline environments. Coatings 2015, 5, 124–141. [Google Scholar] [CrossRef] [Green Version]
- Brinker, C.J.; Hurd, A.J.; Ward, K.J. Sol-gel derived ceramic films: Fundamentals and applications. In Ultrastructure Processing of Advanced Ceramics, 1st ed.; Mackenzie, J.D., Ulrich, D.R., Eds.; Wiley: New York, NY, USA, 1988; pp. 112–151. [Google Scholar]
- Rahaman, M.N. Ceramic Processing, 2nd ed.; CRC Press: Boca Raton, FL, USA, 2017; Volume 10, pp. 262–264. [Google Scholar]
- Quéré, D. Fluid coating on a fiber. Annu. Rev. Fluid Mech. 1999, 31, 347–384. [Google Scholar] [CrossRef]
- Reisfeld, R.; Jørgensen, C.K. Chemistry, Spectroscopy and Applications of Sol-Gel Glasses, 1st ed.; Springer: Berlin/Heidelberg, Germany, 1992; pp. 89–119. [Google Scholar]
- Bergmeyer, H.U.; Gawehn, K.; Grassl, M. Methods of Enzymatic Analysis, 2nd ed.; Academic Press Inc.: New York, NY, USA, 1974; pp. 457–458. [Google Scholar]
- Slein, M.W. d-Glucose. In Methods of Enzymatic Analysis; Bergmeyer, H.U., Ed.; Academic Press: Cambridge, MA, USA, 1965; Volume 1, pp. 117–130. [Google Scholar]


| Sample | CHCHOH | Water | (0.1 M) | |
|---|---|---|---|---|
| R1 | 5 mL | 5 mL | 0 mL | 0.8 mL |
| R2 | 5 mL | 5 mL | 0.4 mL | 0.8 mL |
| R3 | 5 mL | 5 mL | 0.8 mL | 0.8 mL |
| R4 | 5 mL | 5 mL | 1.6 mL | 0.8 mL |
Disclaimer/Publisher’s Note: The statements, opinions and data contained in all publications are solely those of the individual author(s) and contributor(s) and not of MDPI and/or the editor(s). MDPI and/or the editor(s) disclaim responsibility for any injury to people or property resulting from any ideas, methods, instructions or products referred to in the content. |
© 2023 by the authors. Licensee MDPI, Basel, Switzerland. This article is an open access article distributed under the terms and conditions of the Creative Commons Attribution (CC BY) license (https://creativecommons.org/licenses/by/4.0/).
Share and Cite
Ortega-Contreras, J.-A.; Alvarado-Méndez, E.; Almanza-Rodríguez, G.; Hernández, M.d.C.; Celaya-García, L. Glucose Sensor Using Sol–Gel Coating Layer Deposited on PMMA Optical Fiber: An Enzyme Activity Measurement System. Gels 2023, 9, 608. https://doi.org/10.3390/gels9080608
Ortega-Contreras J-A, Alvarado-Méndez E, Almanza-Rodríguez G, Hernández MdC, Celaya-García L. Glucose Sensor Using Sol–Gel Coating Layer Deposited on PMMA Optical Fiber: An Enzyme Activity Measurement System. Gels. 2023; 9(8):608. https://doi.org/10.3390/gels9080608
Chicago/Turabian StyleOrtega-Contreras, Jorge-A., Edgar Alvarado-Méndez, Guillermo Almanza-Rodríguez, María del Carmen Hernández, and Luis Celaya-García. 2023. "Glucose Sensor Using Sol–Gel Coating Layer Deposited on PMMA Optical Fiber: An Enzyme Activity Measurement System" Gels 9, no. 8: 608. https://doi.org/10.3390/gels9080608