
Analysis of the Distribution Pattern of Remaining Oil and Development Potential after Weak Gel Flooding in the Offshore LD Oilfield
 , and
, and
Abstract
:
1. Introduction
2. Results and Discussion
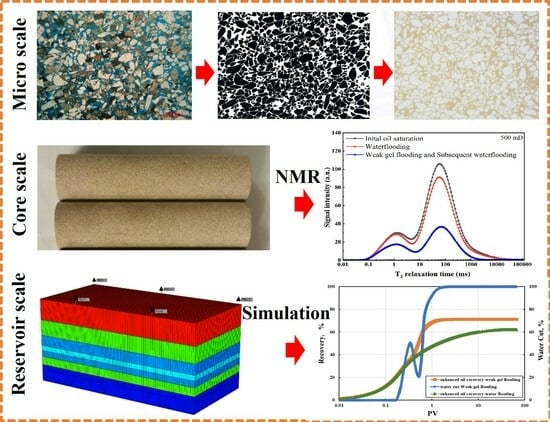
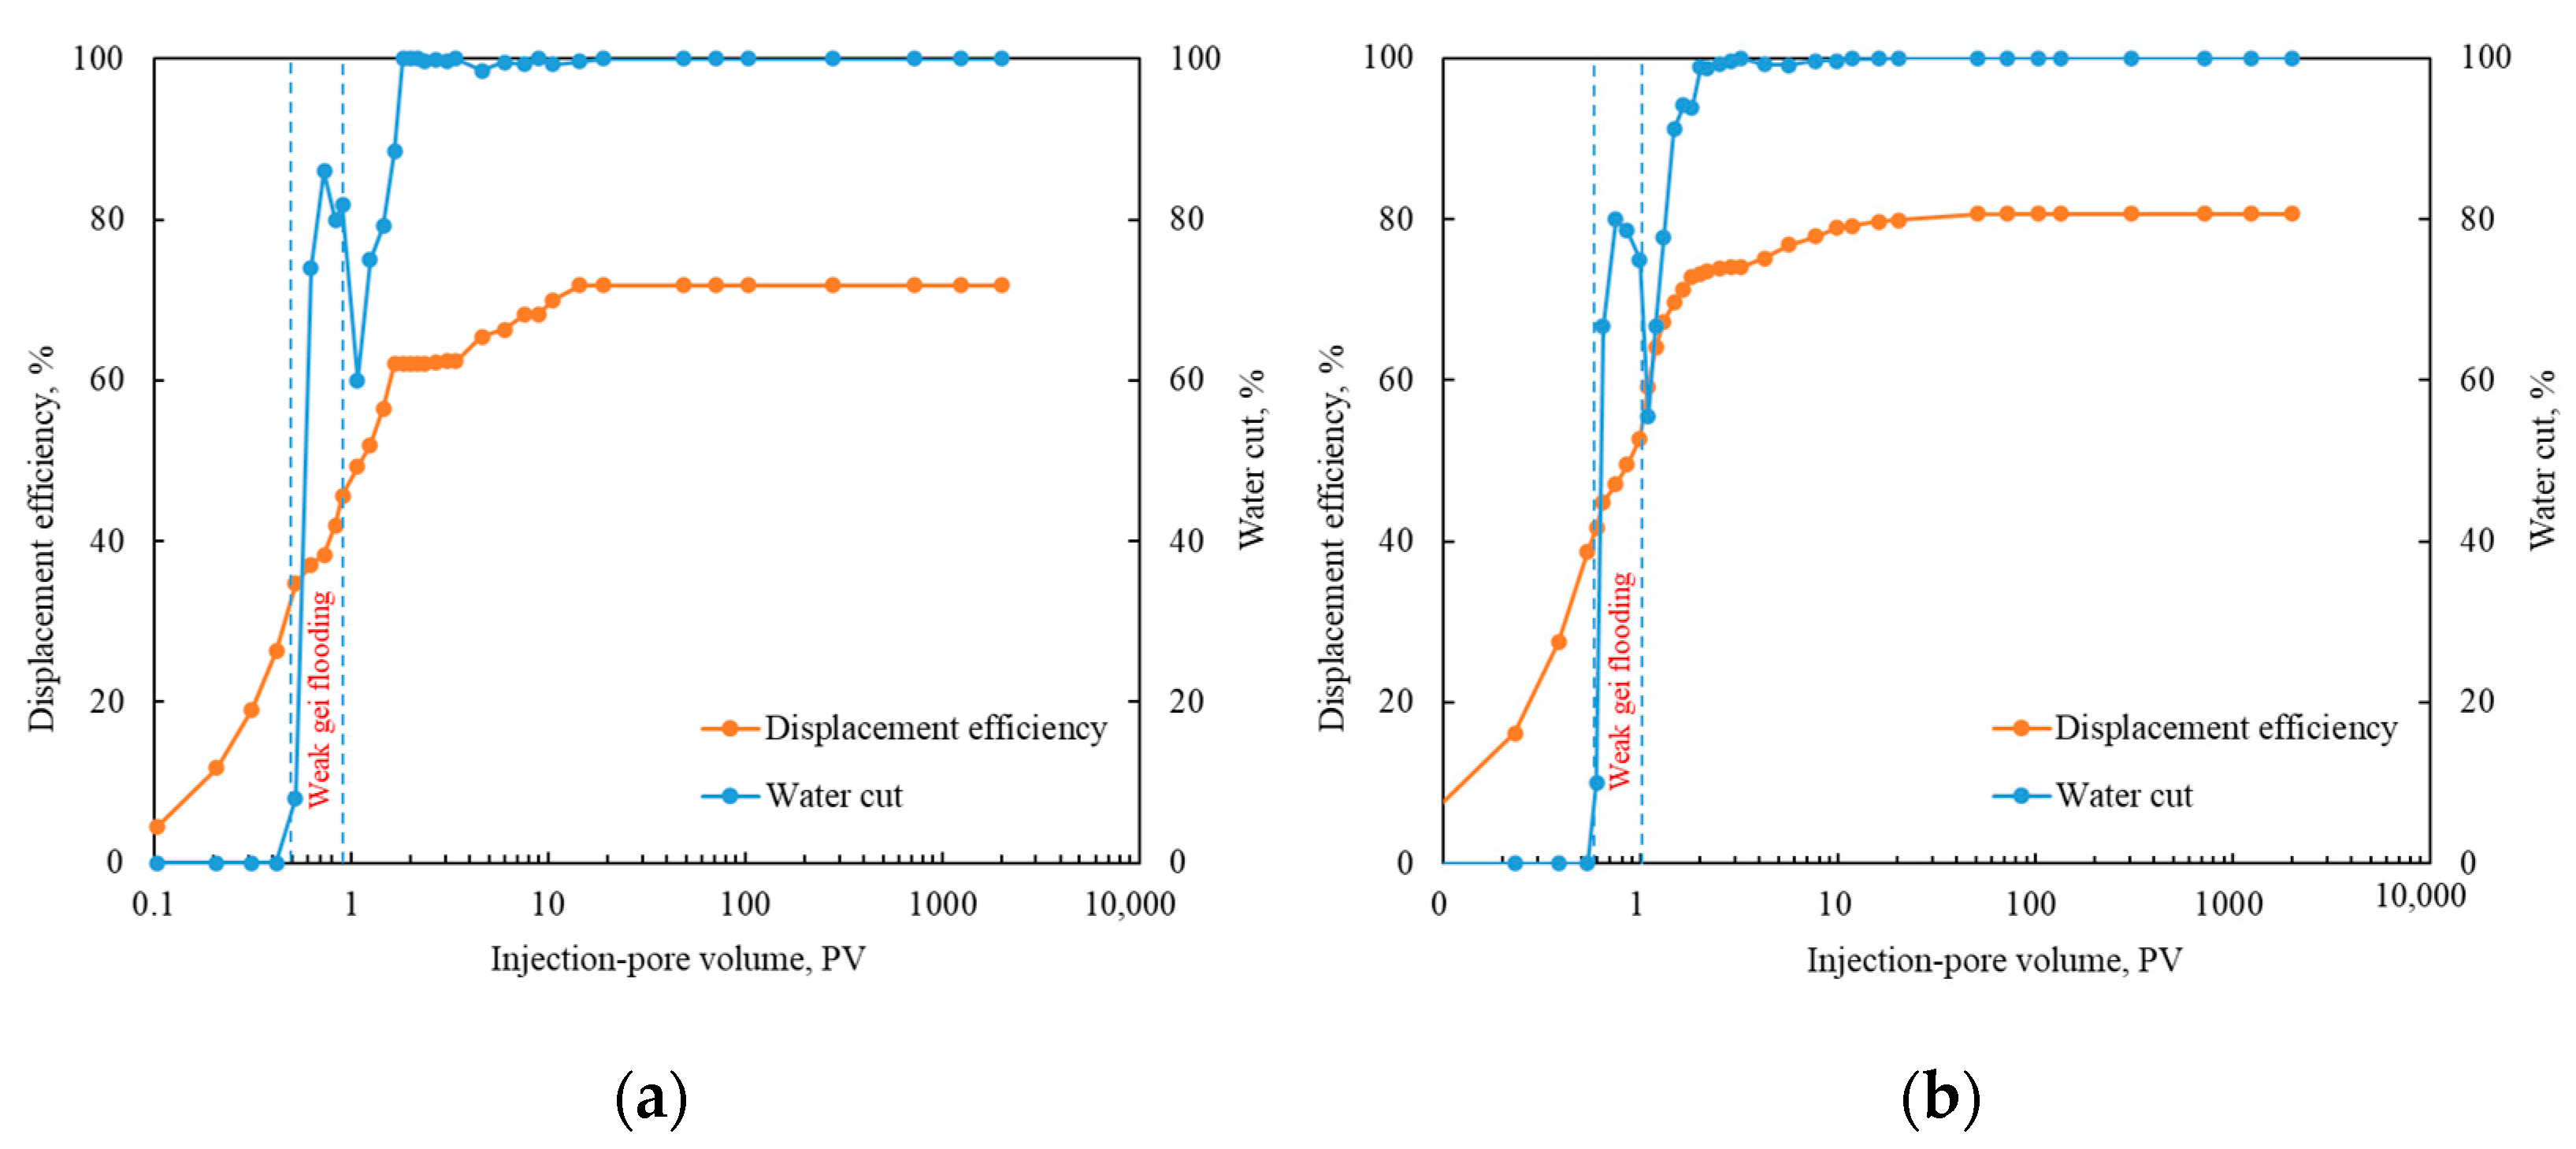
2.1. Evaluation of Weak Gel Flooding Effect
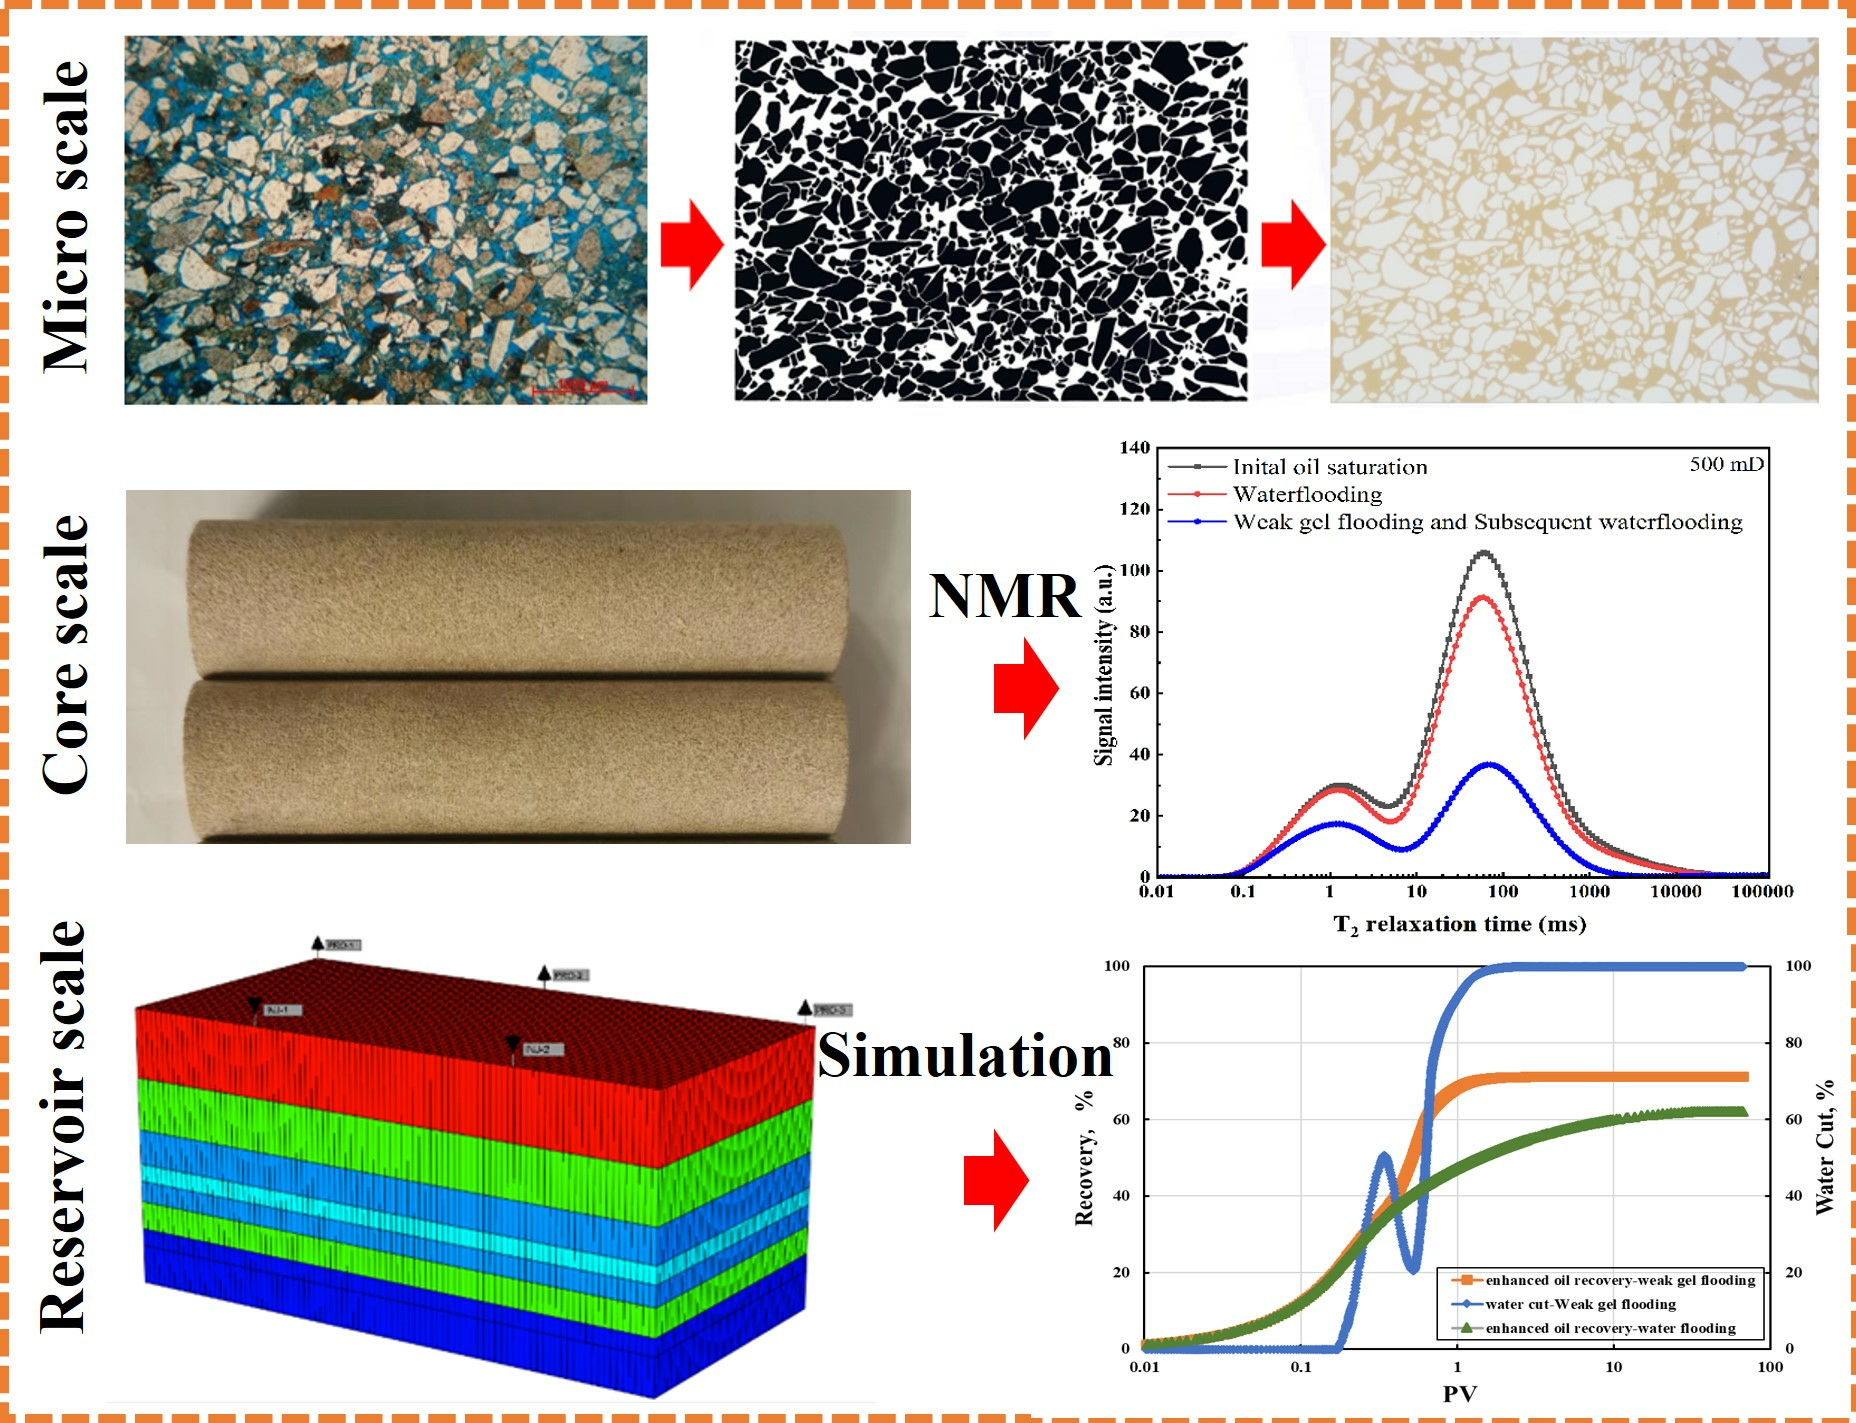
2.1.1. Weak Gel Displacement NMR T2 Spectrum
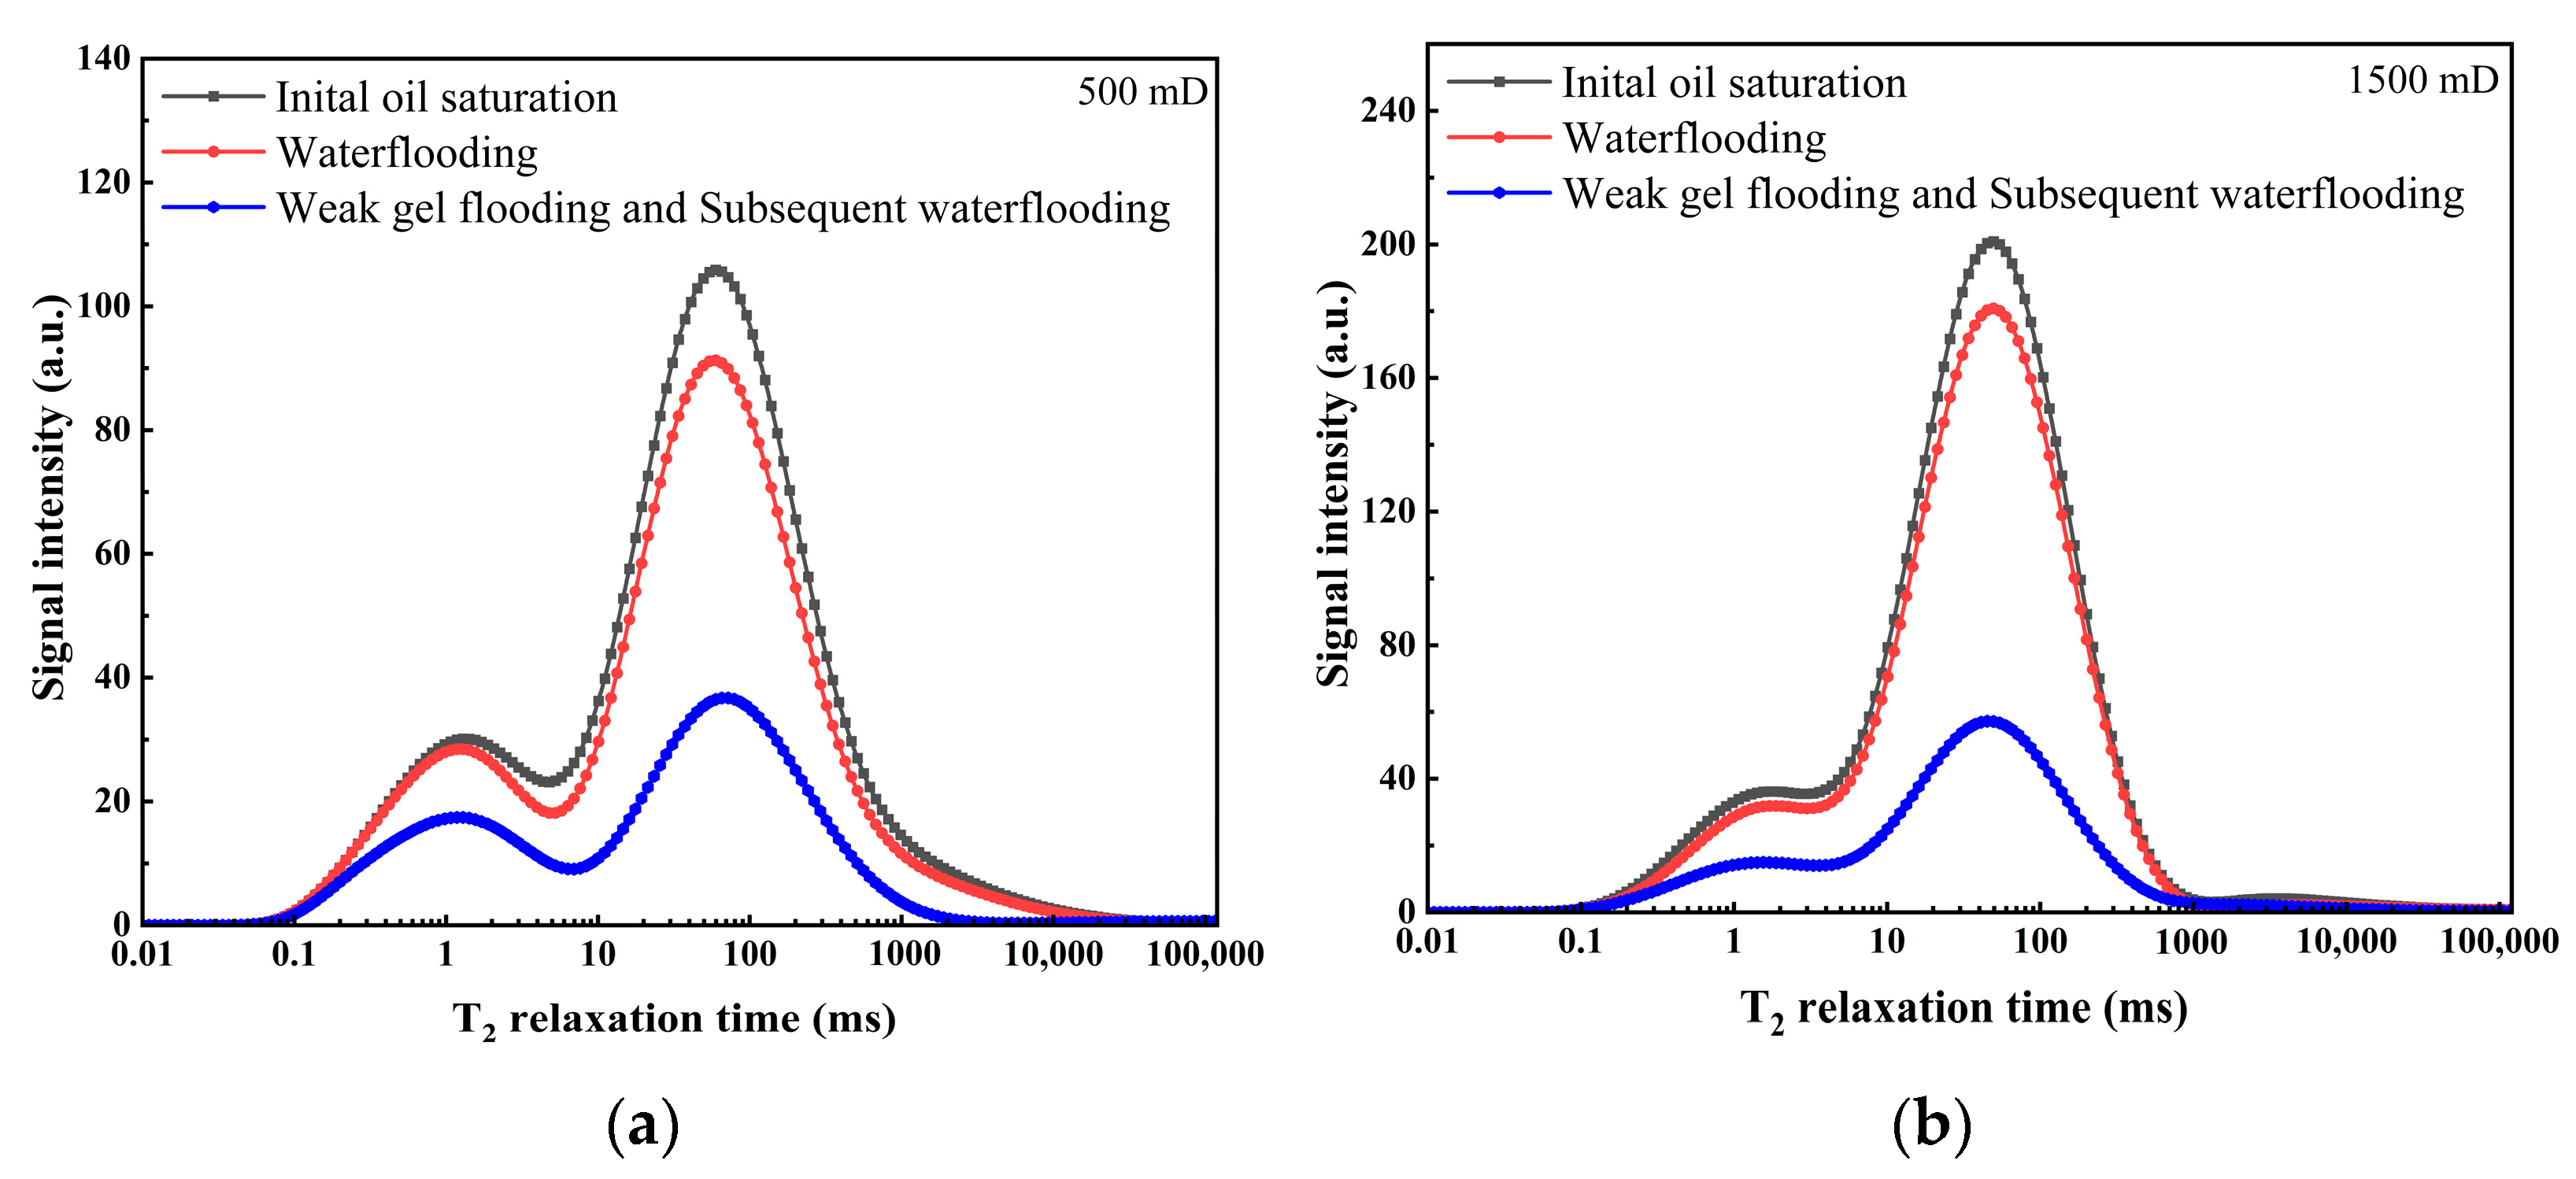
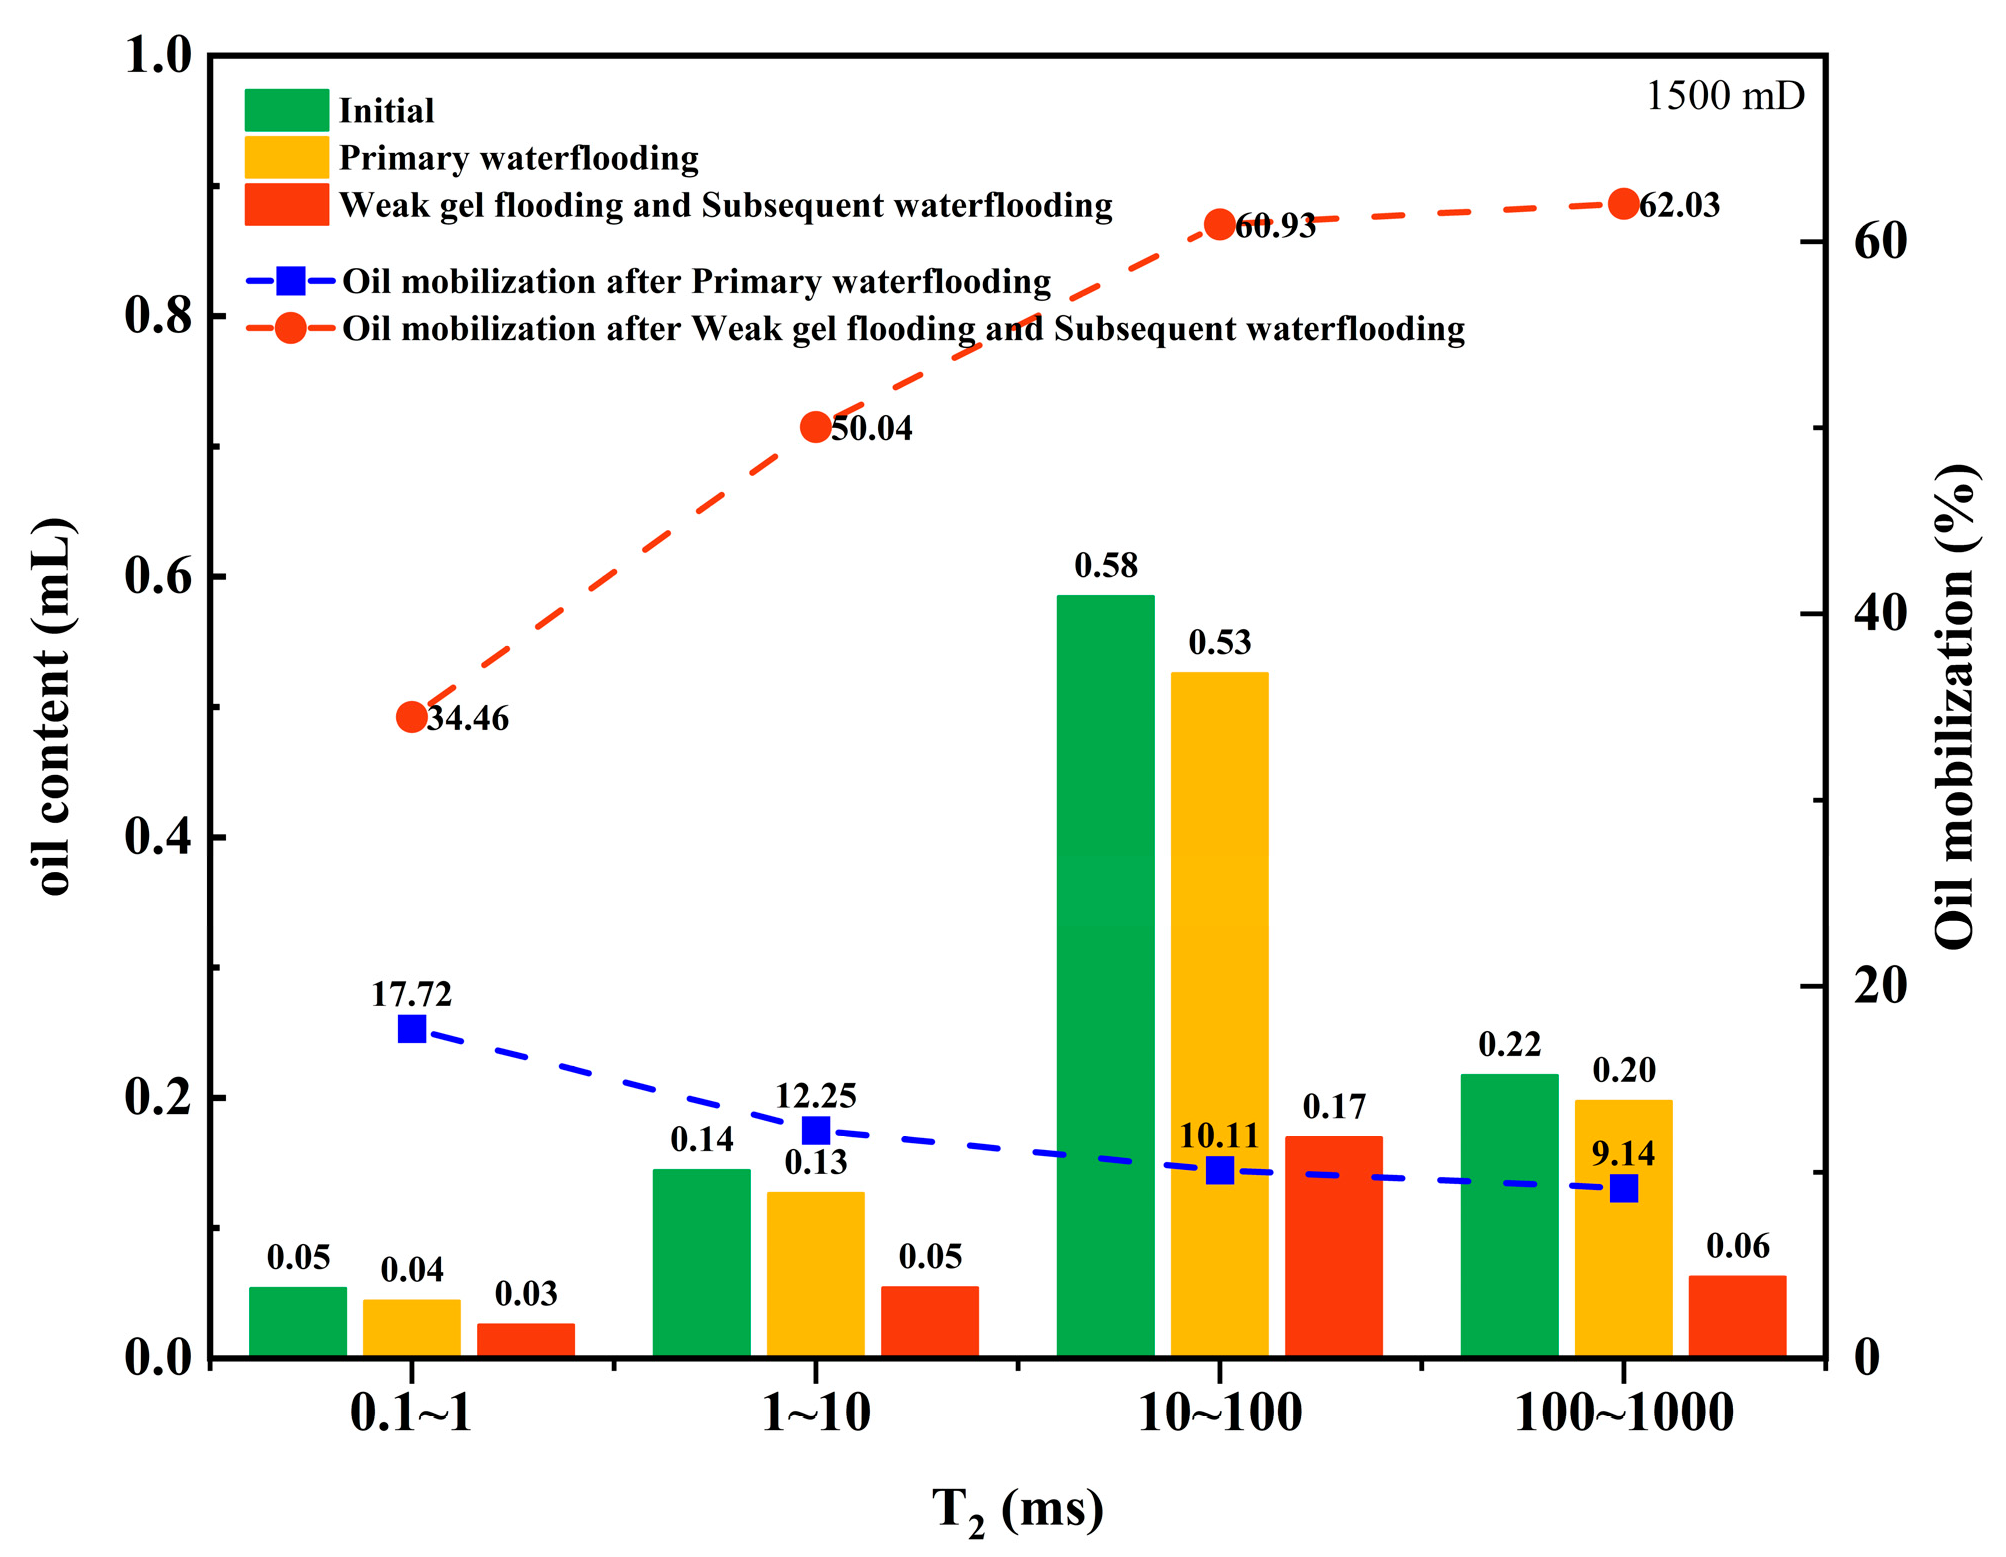
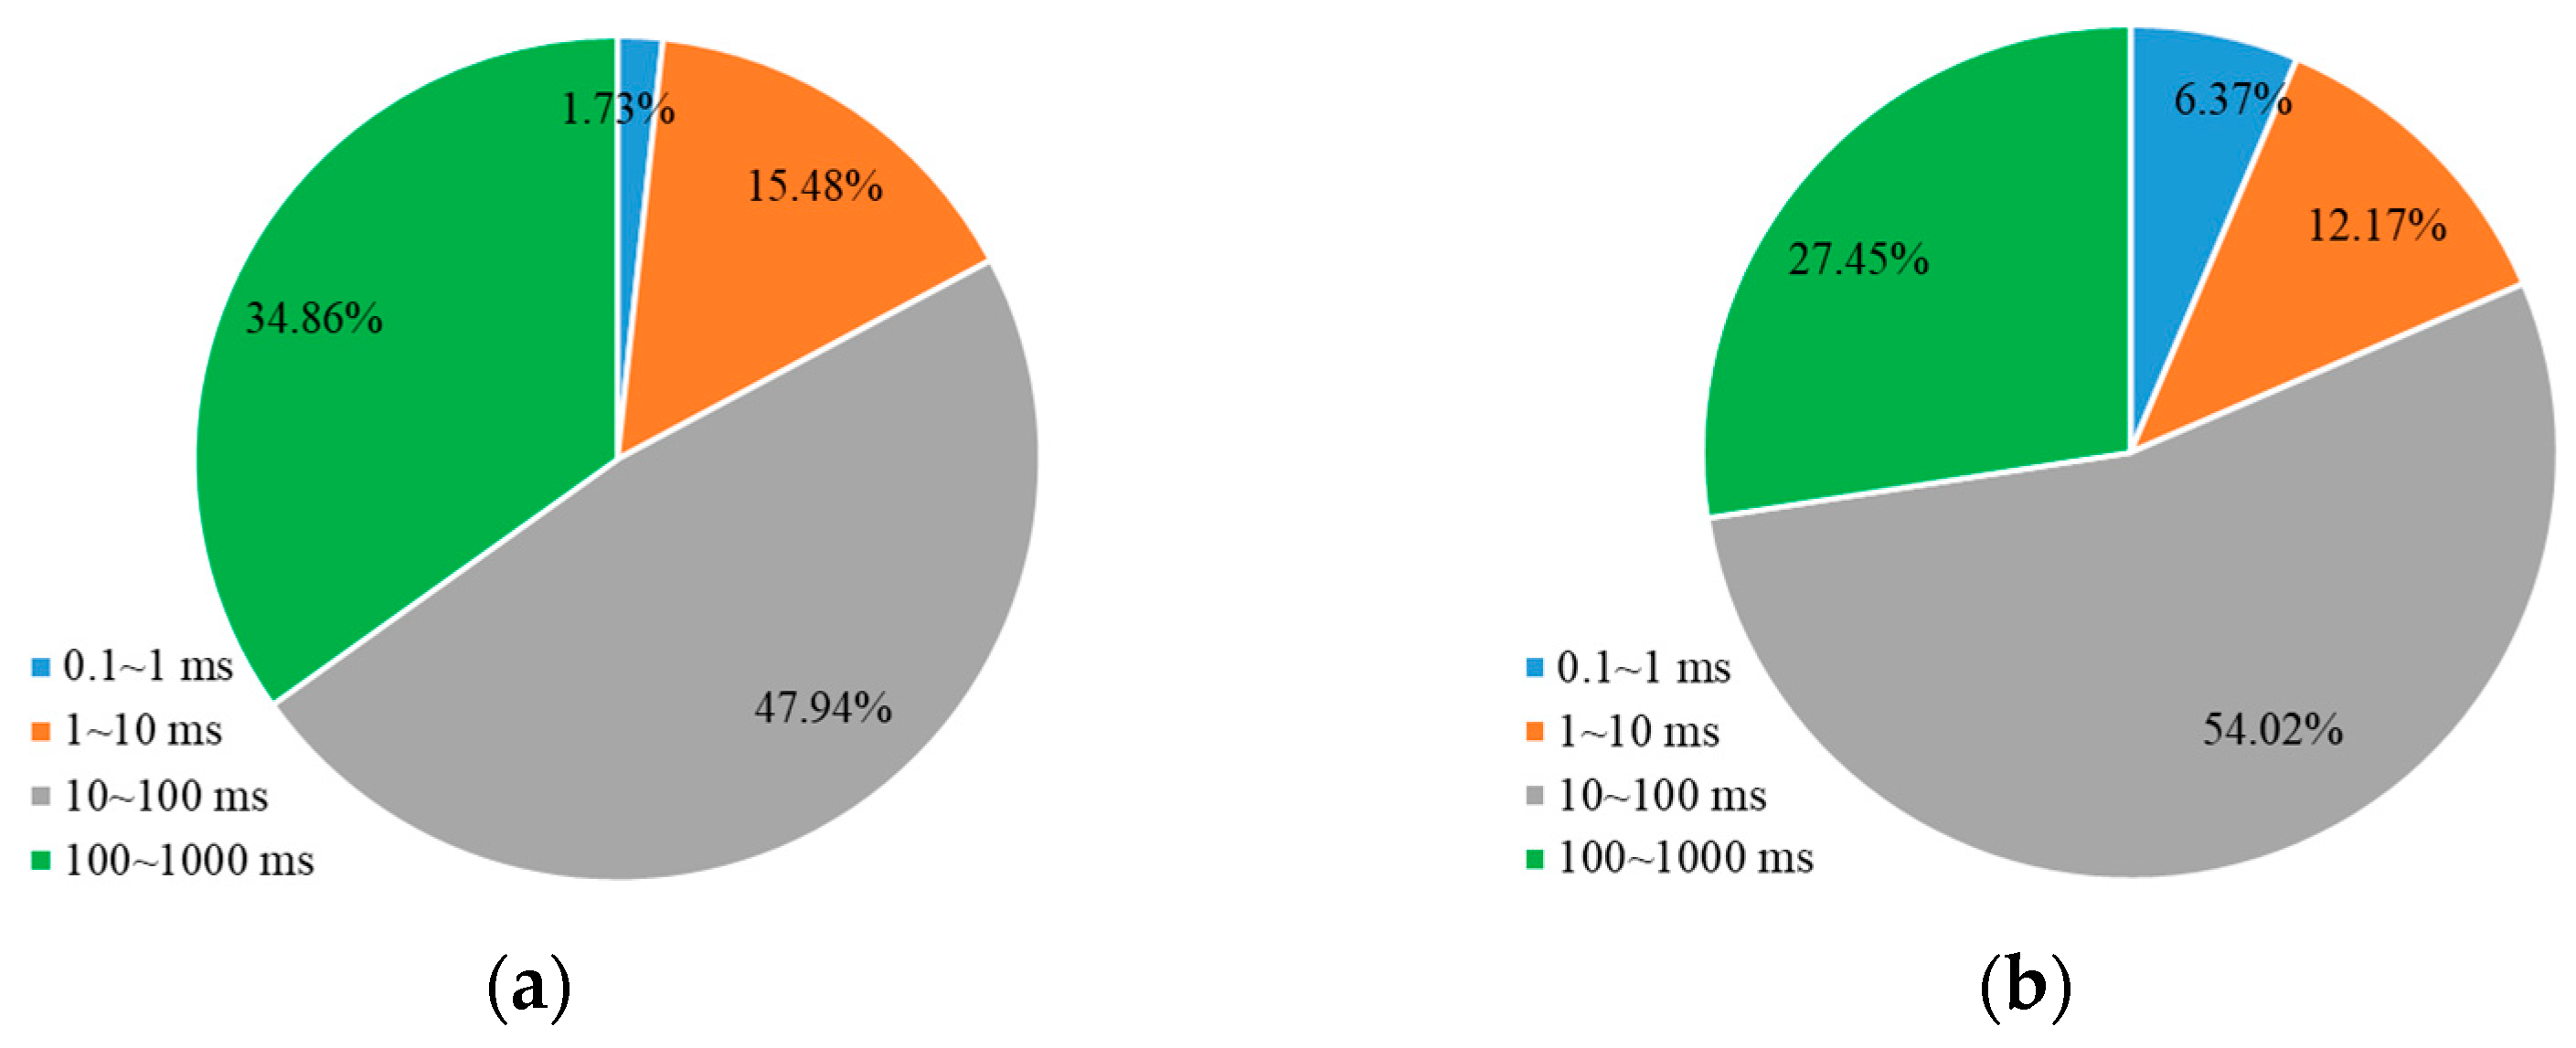
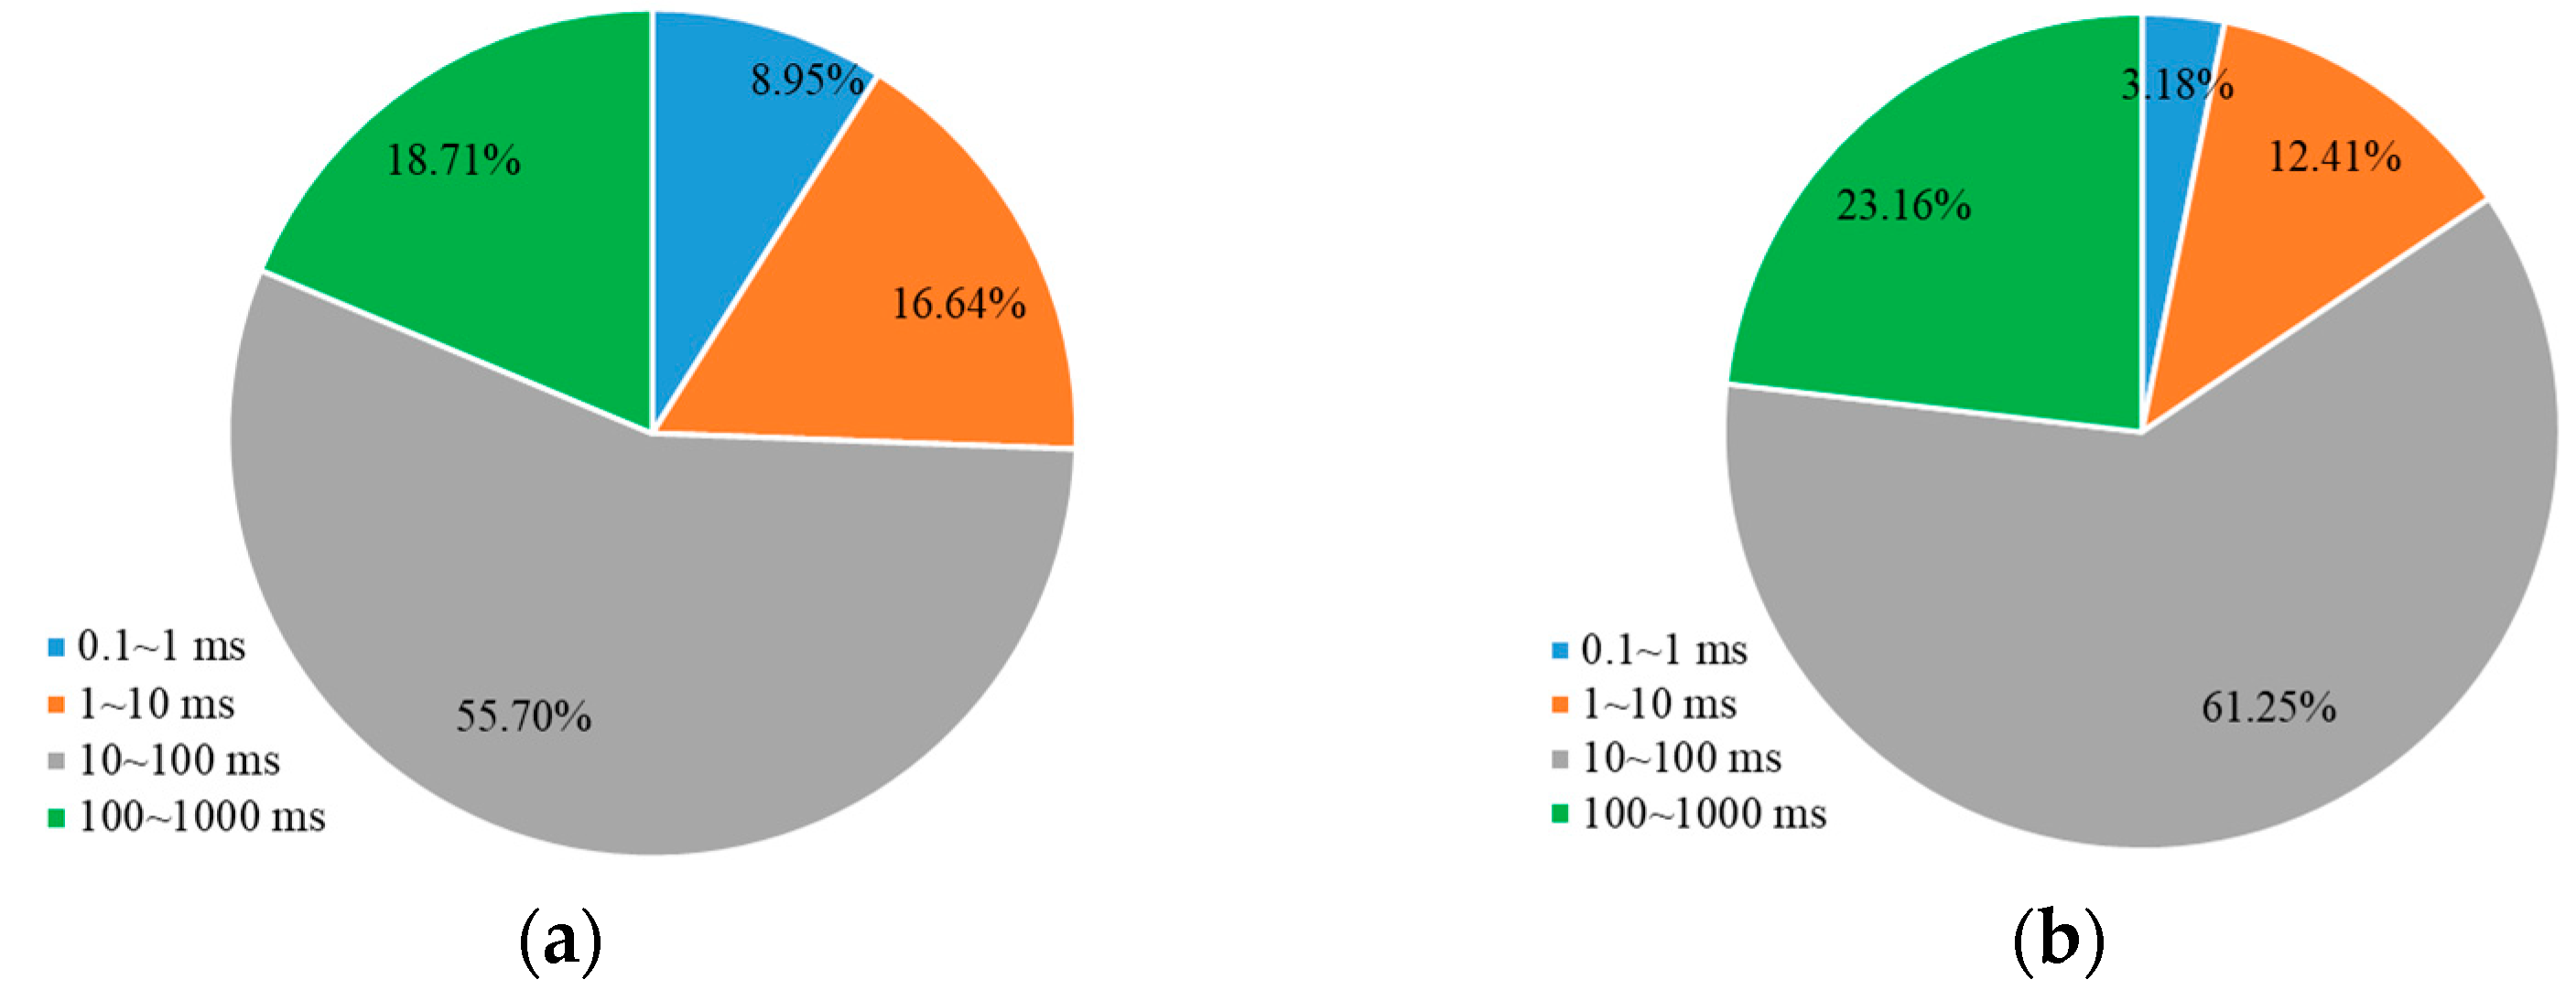
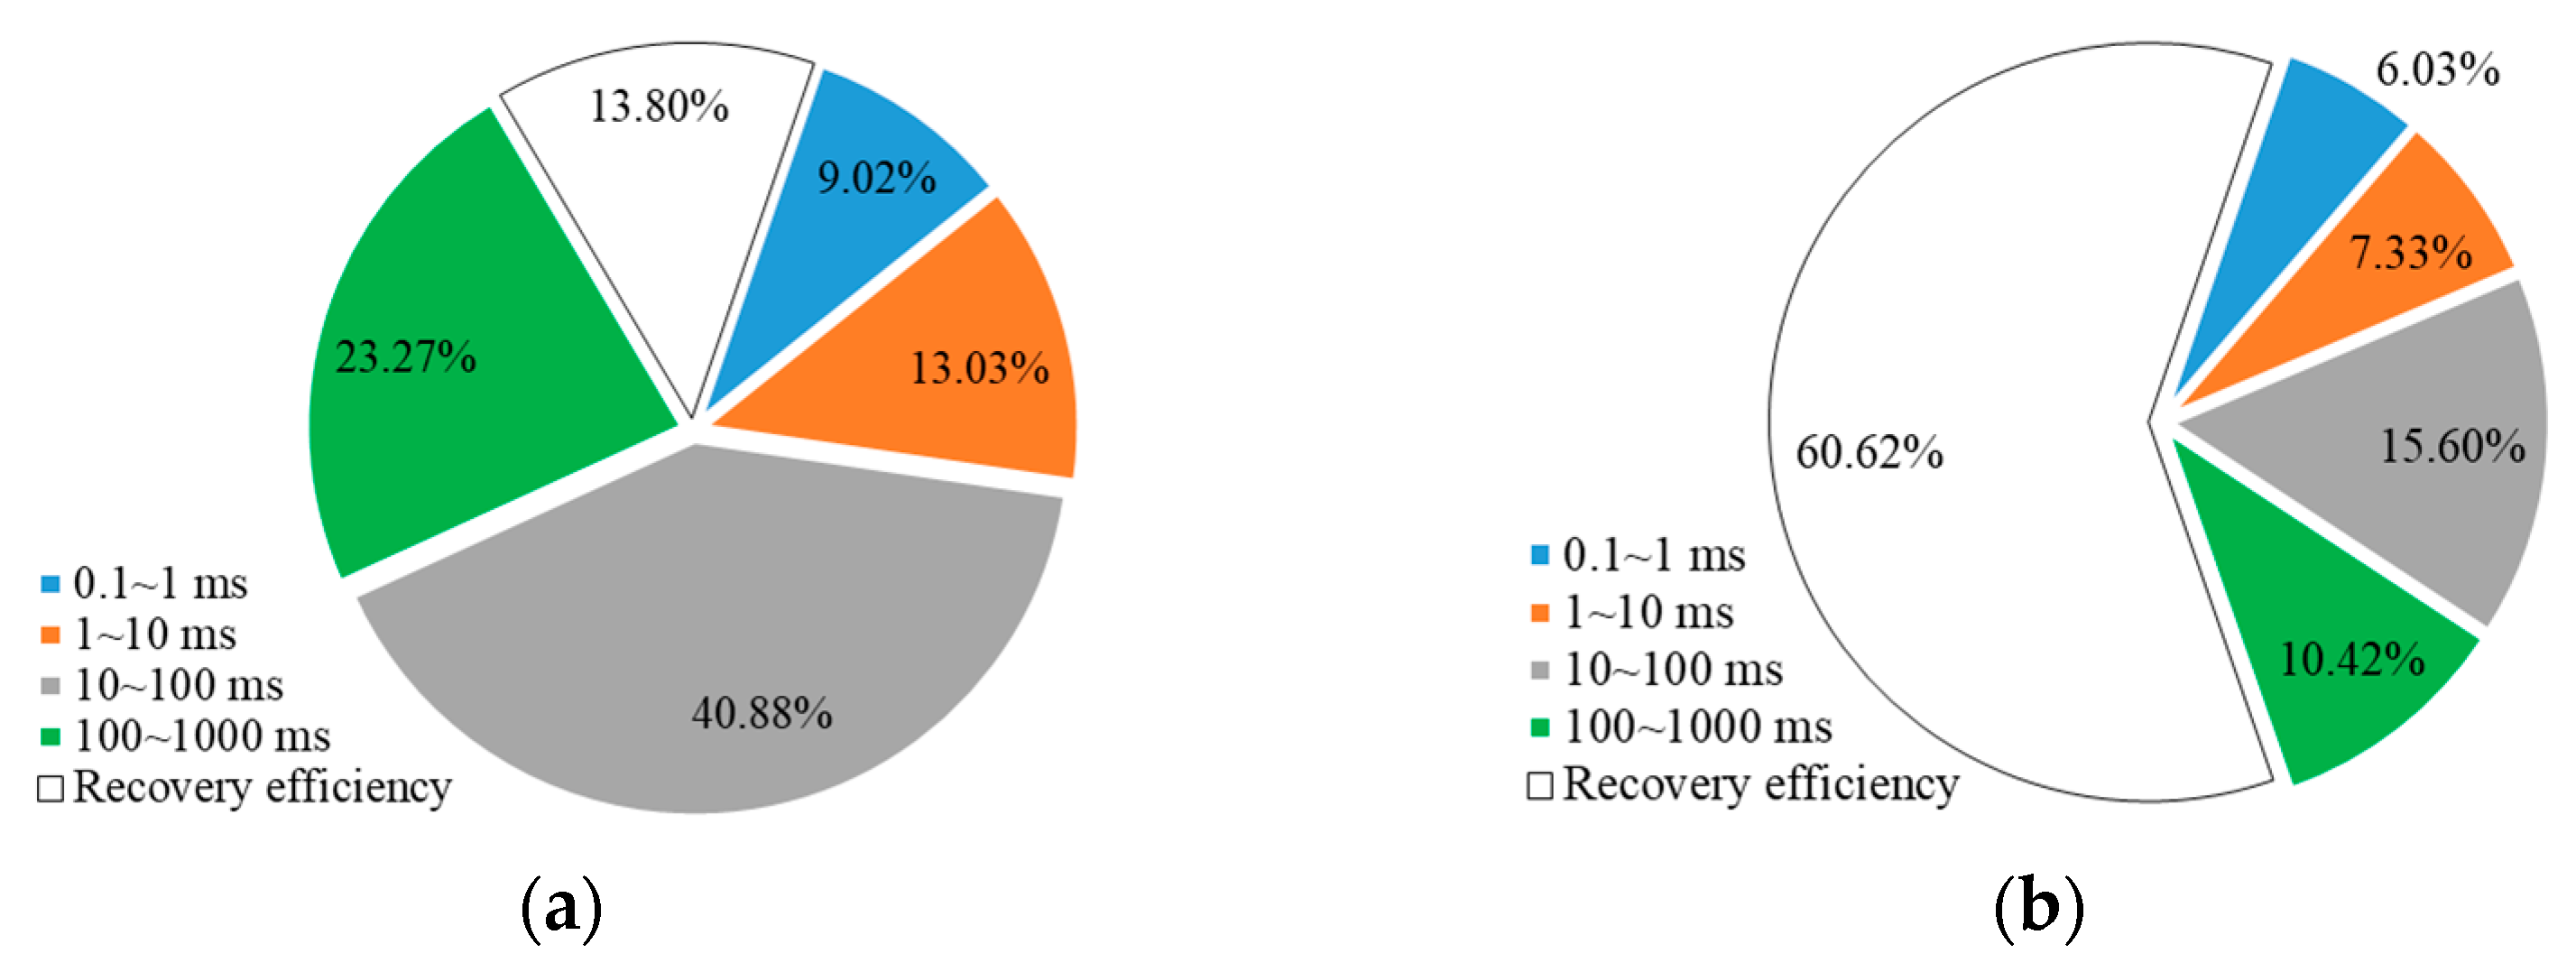
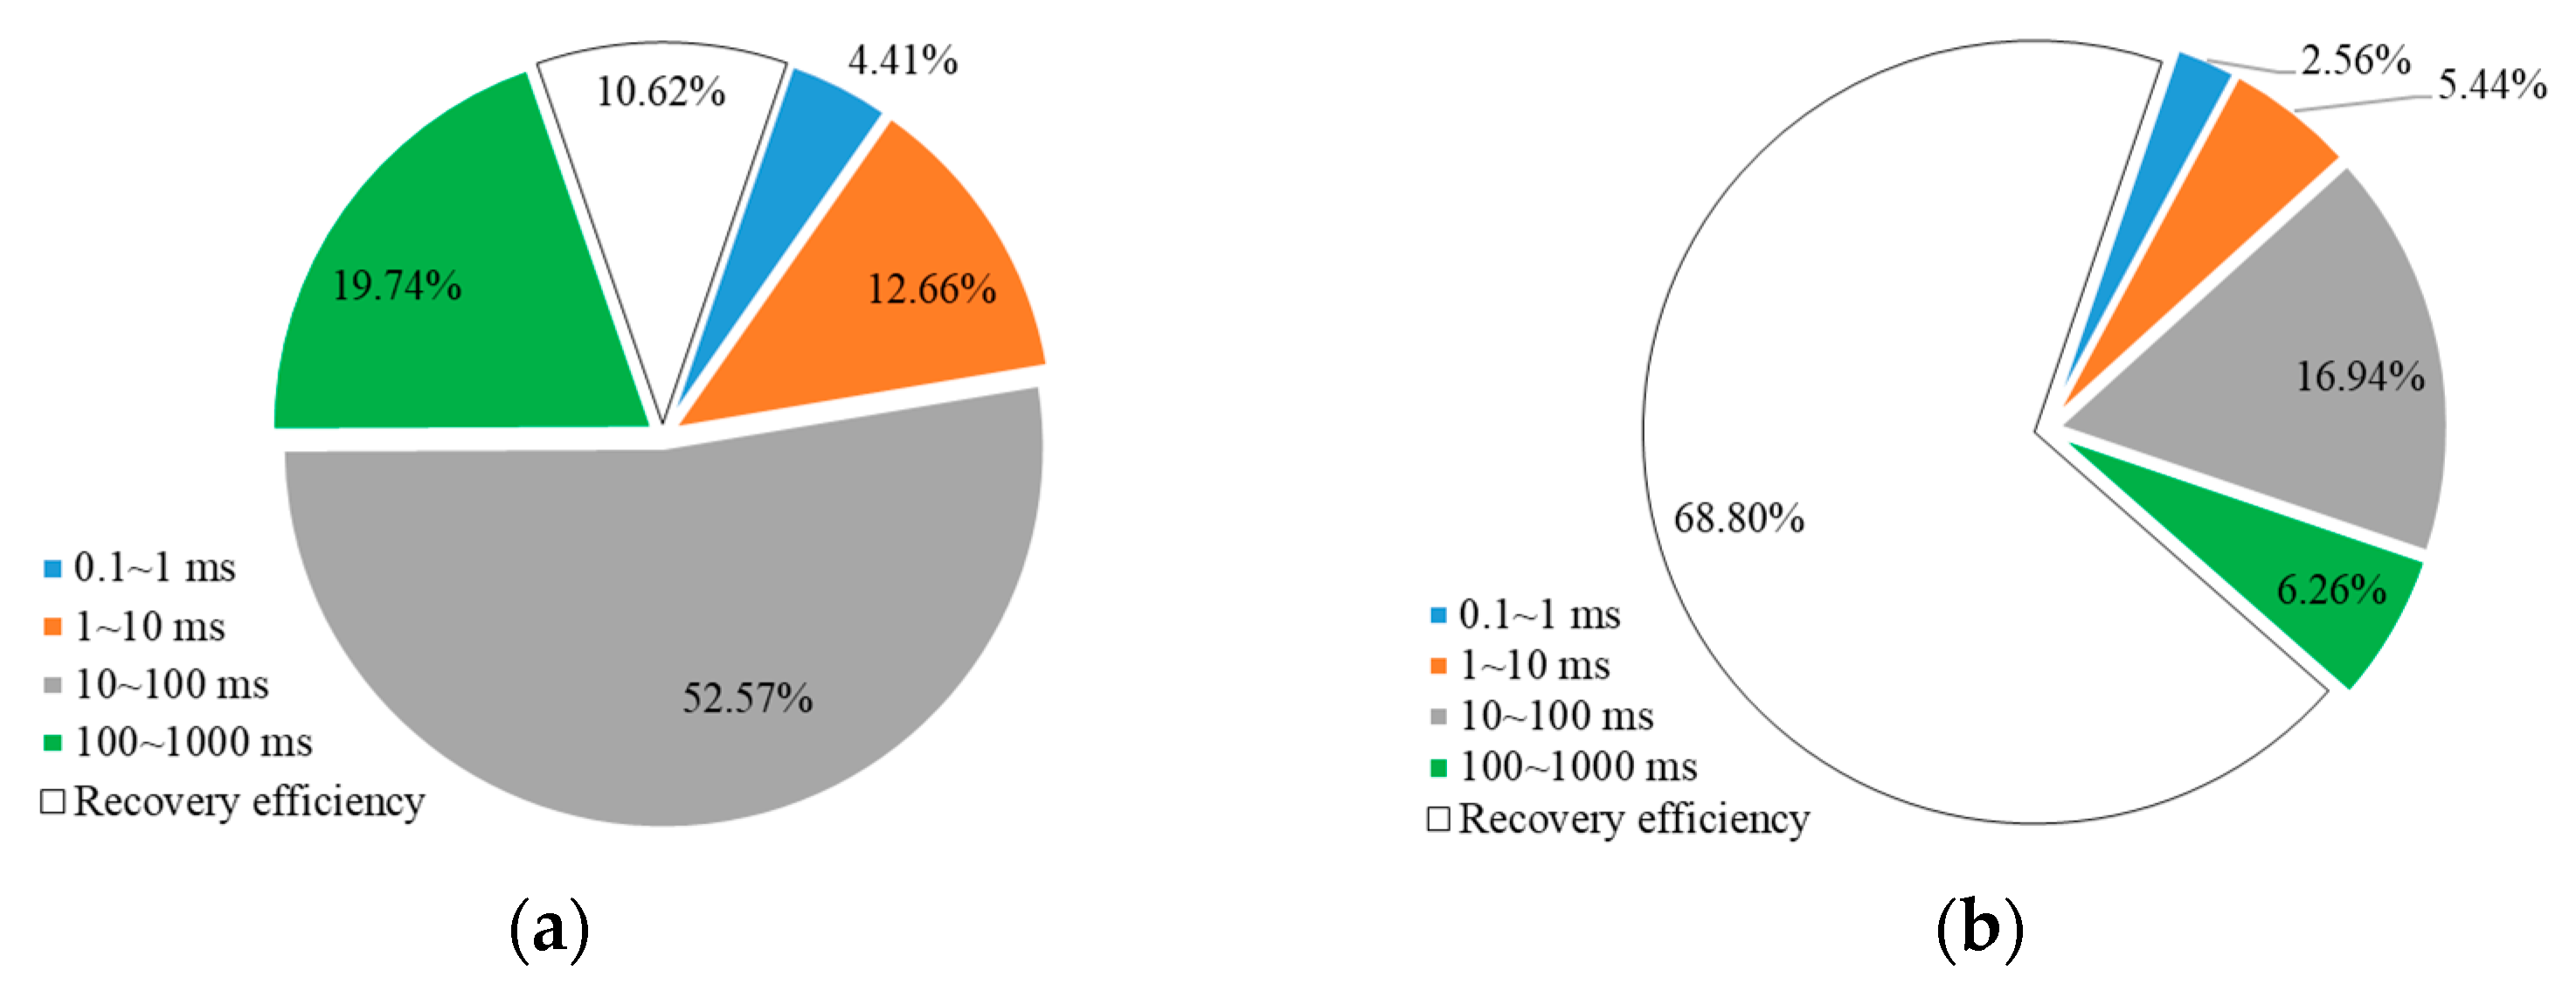
2.1.2. Utilization of Crude Oil in Pores of Different Sizes
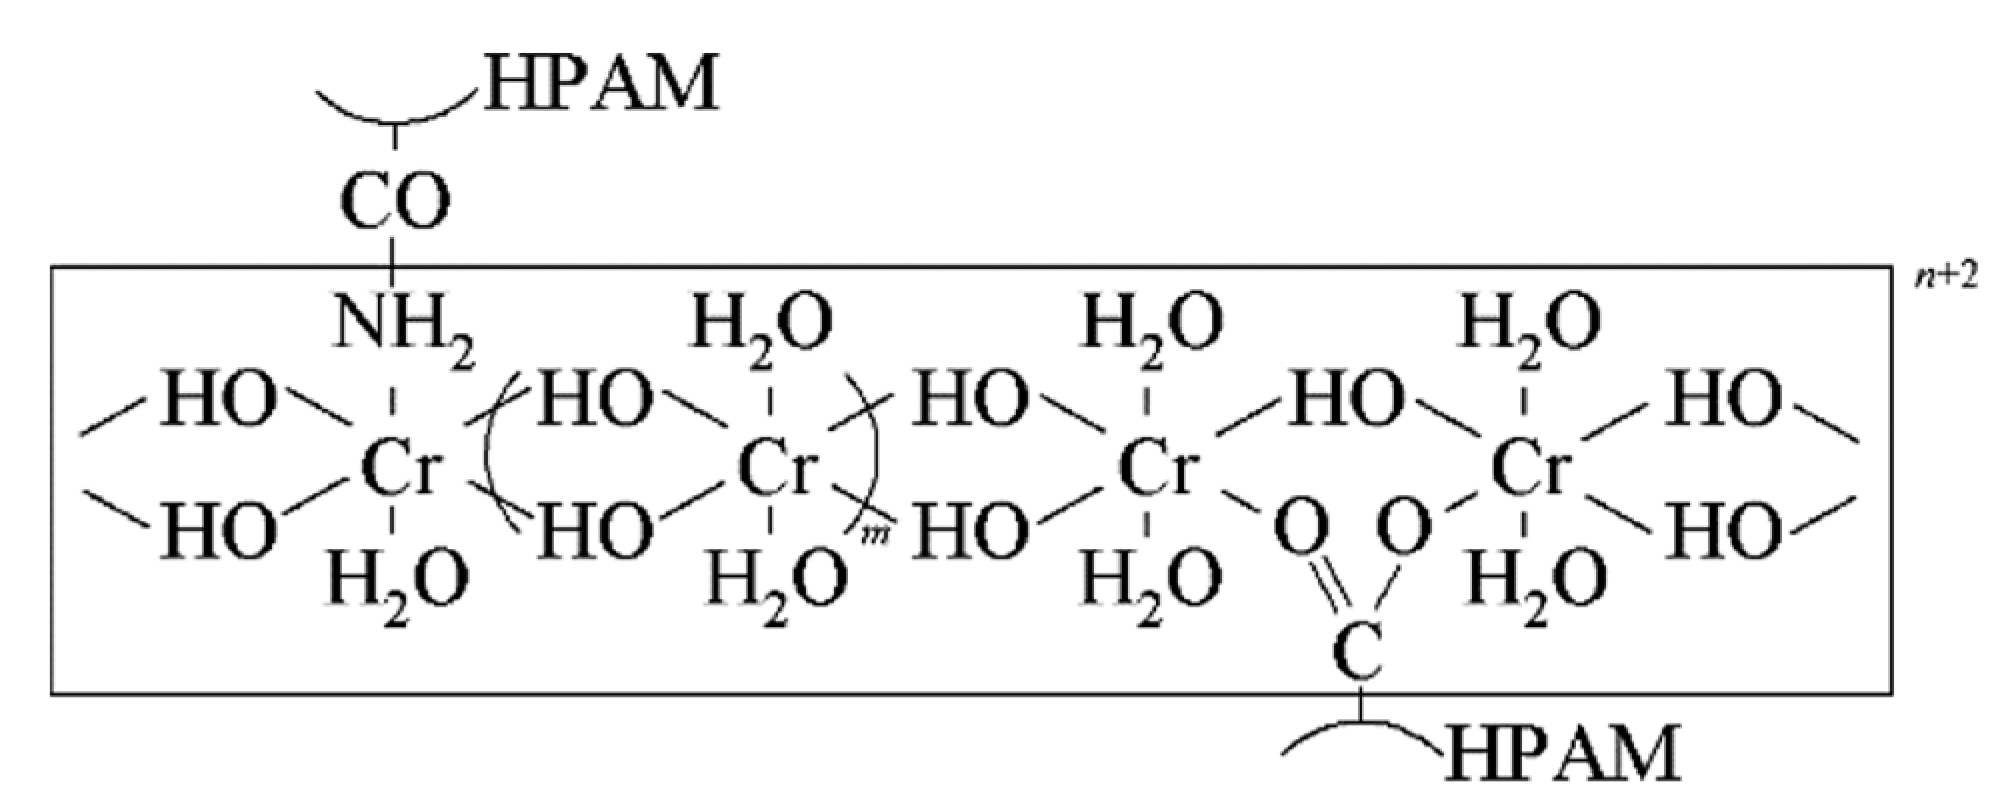
2.2. Mechanism of Weak Gel Flooding
2.2.1. Profile Control
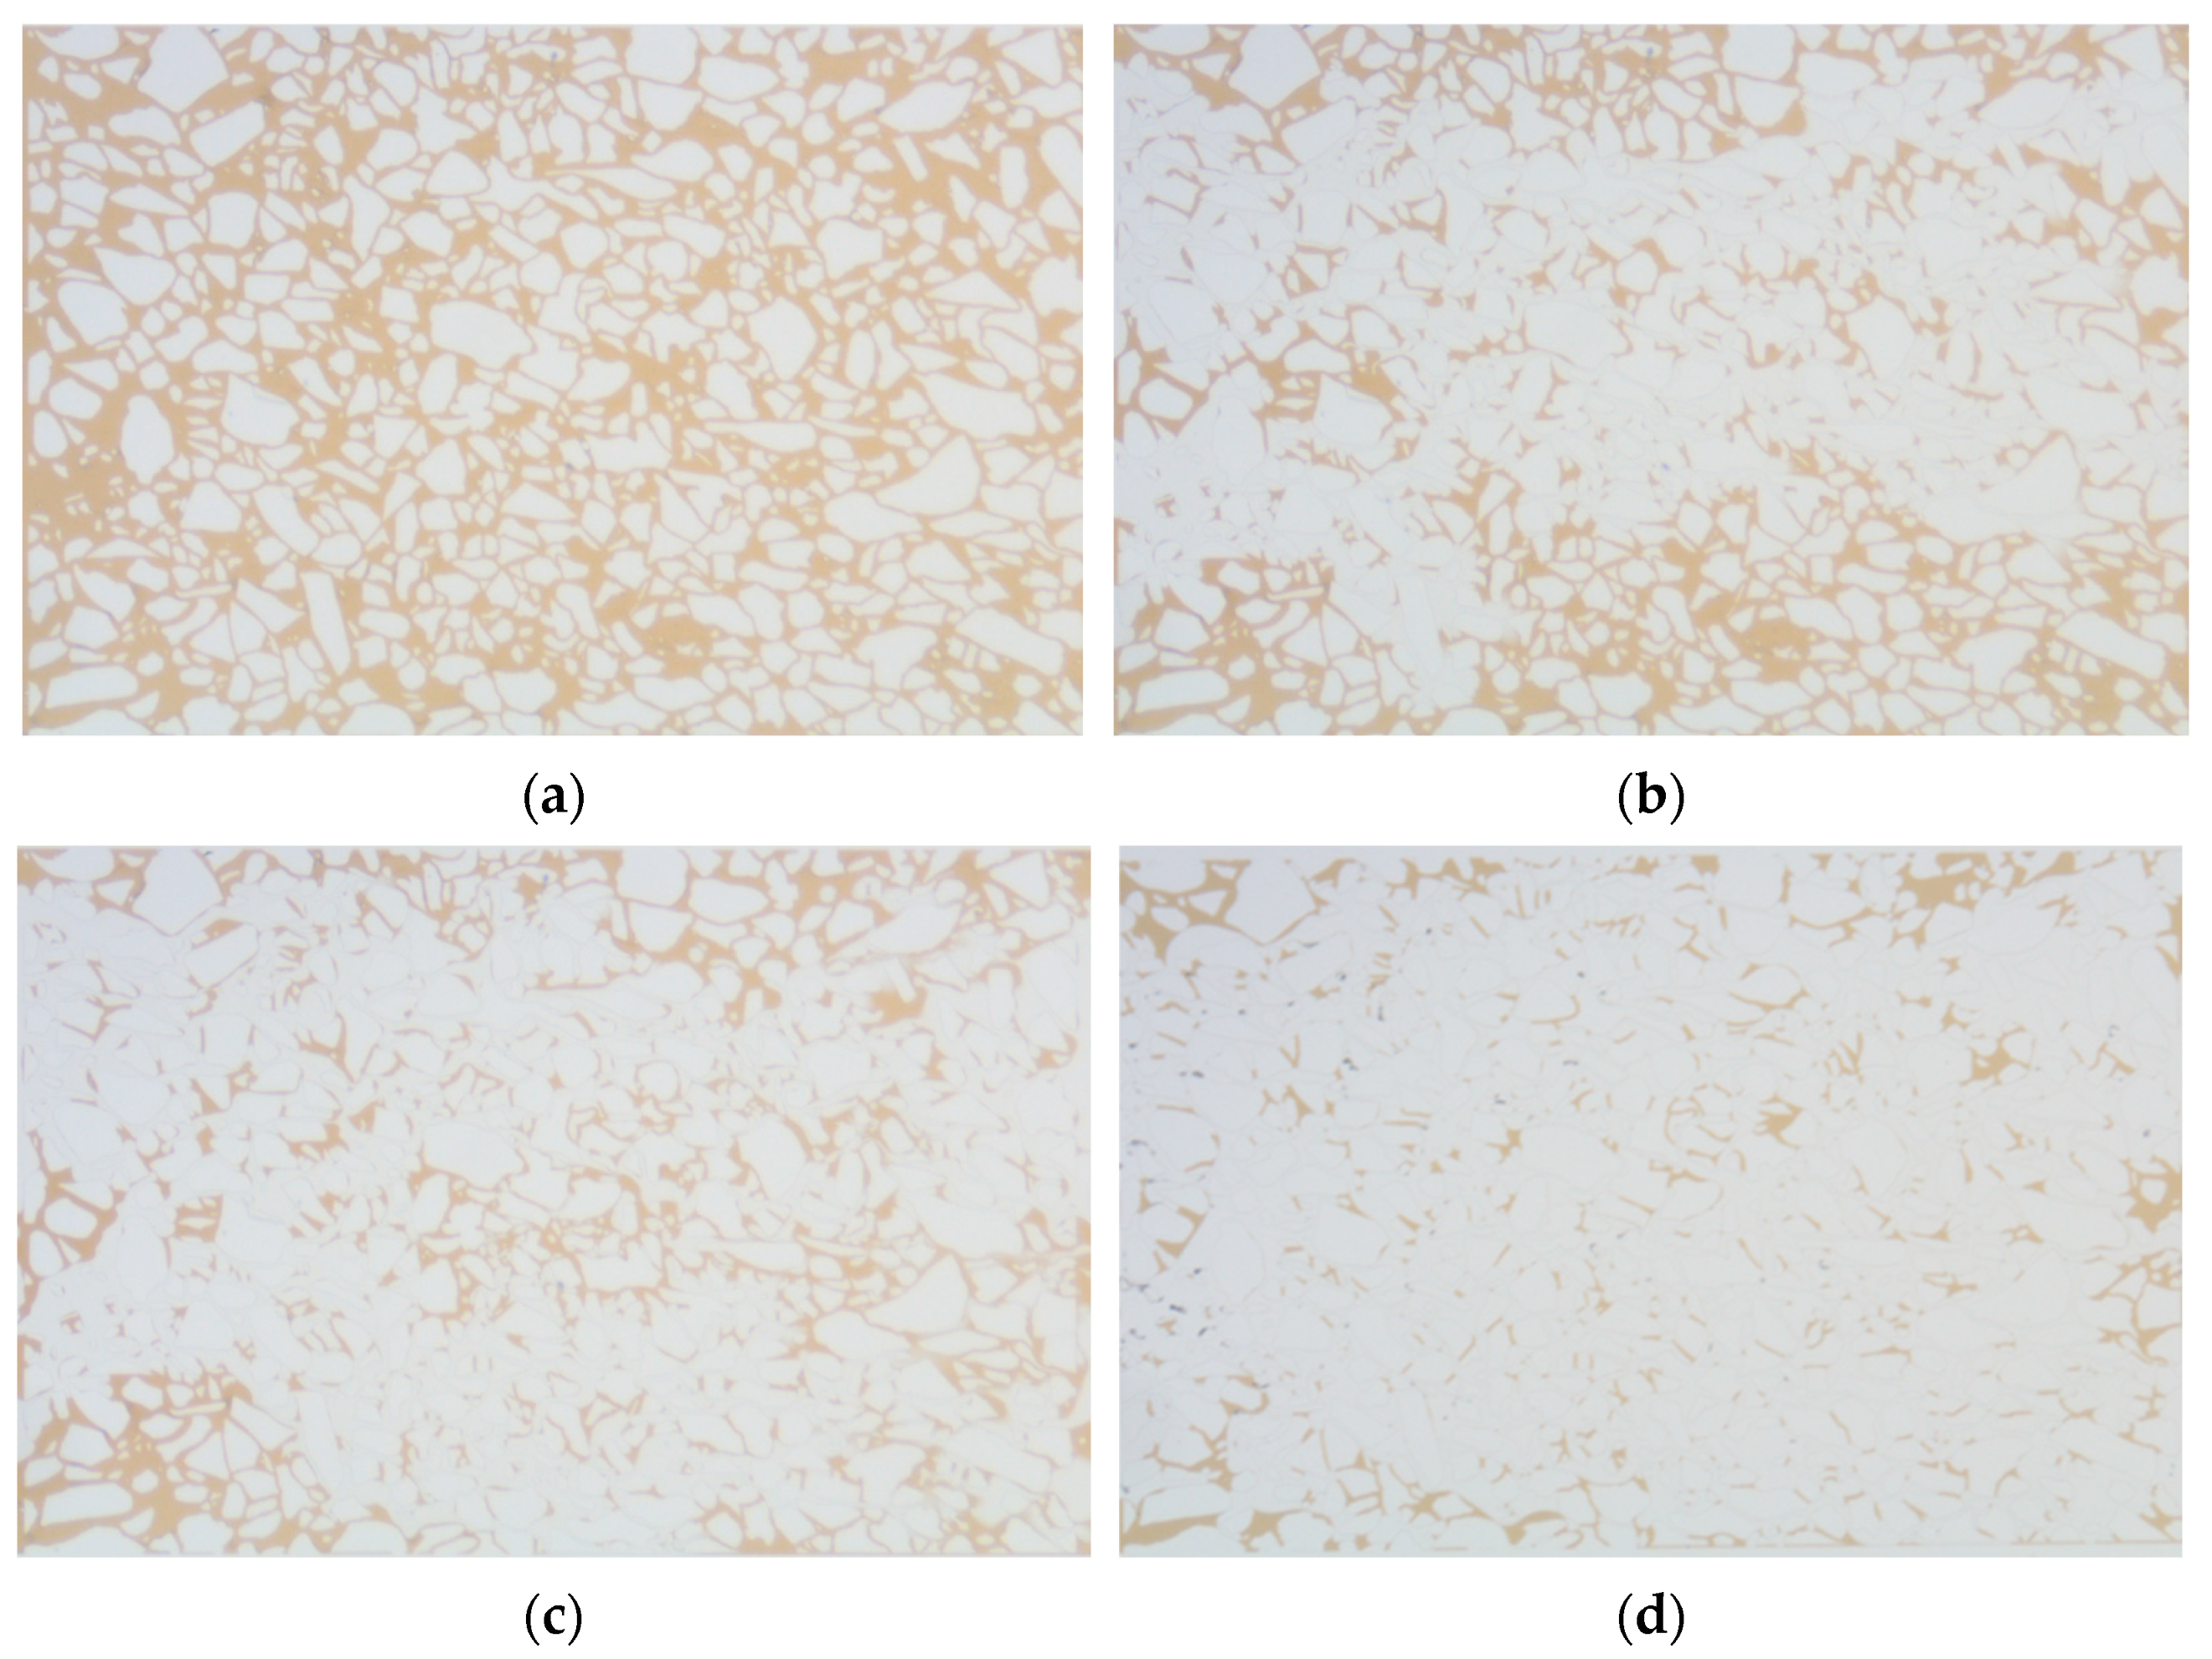
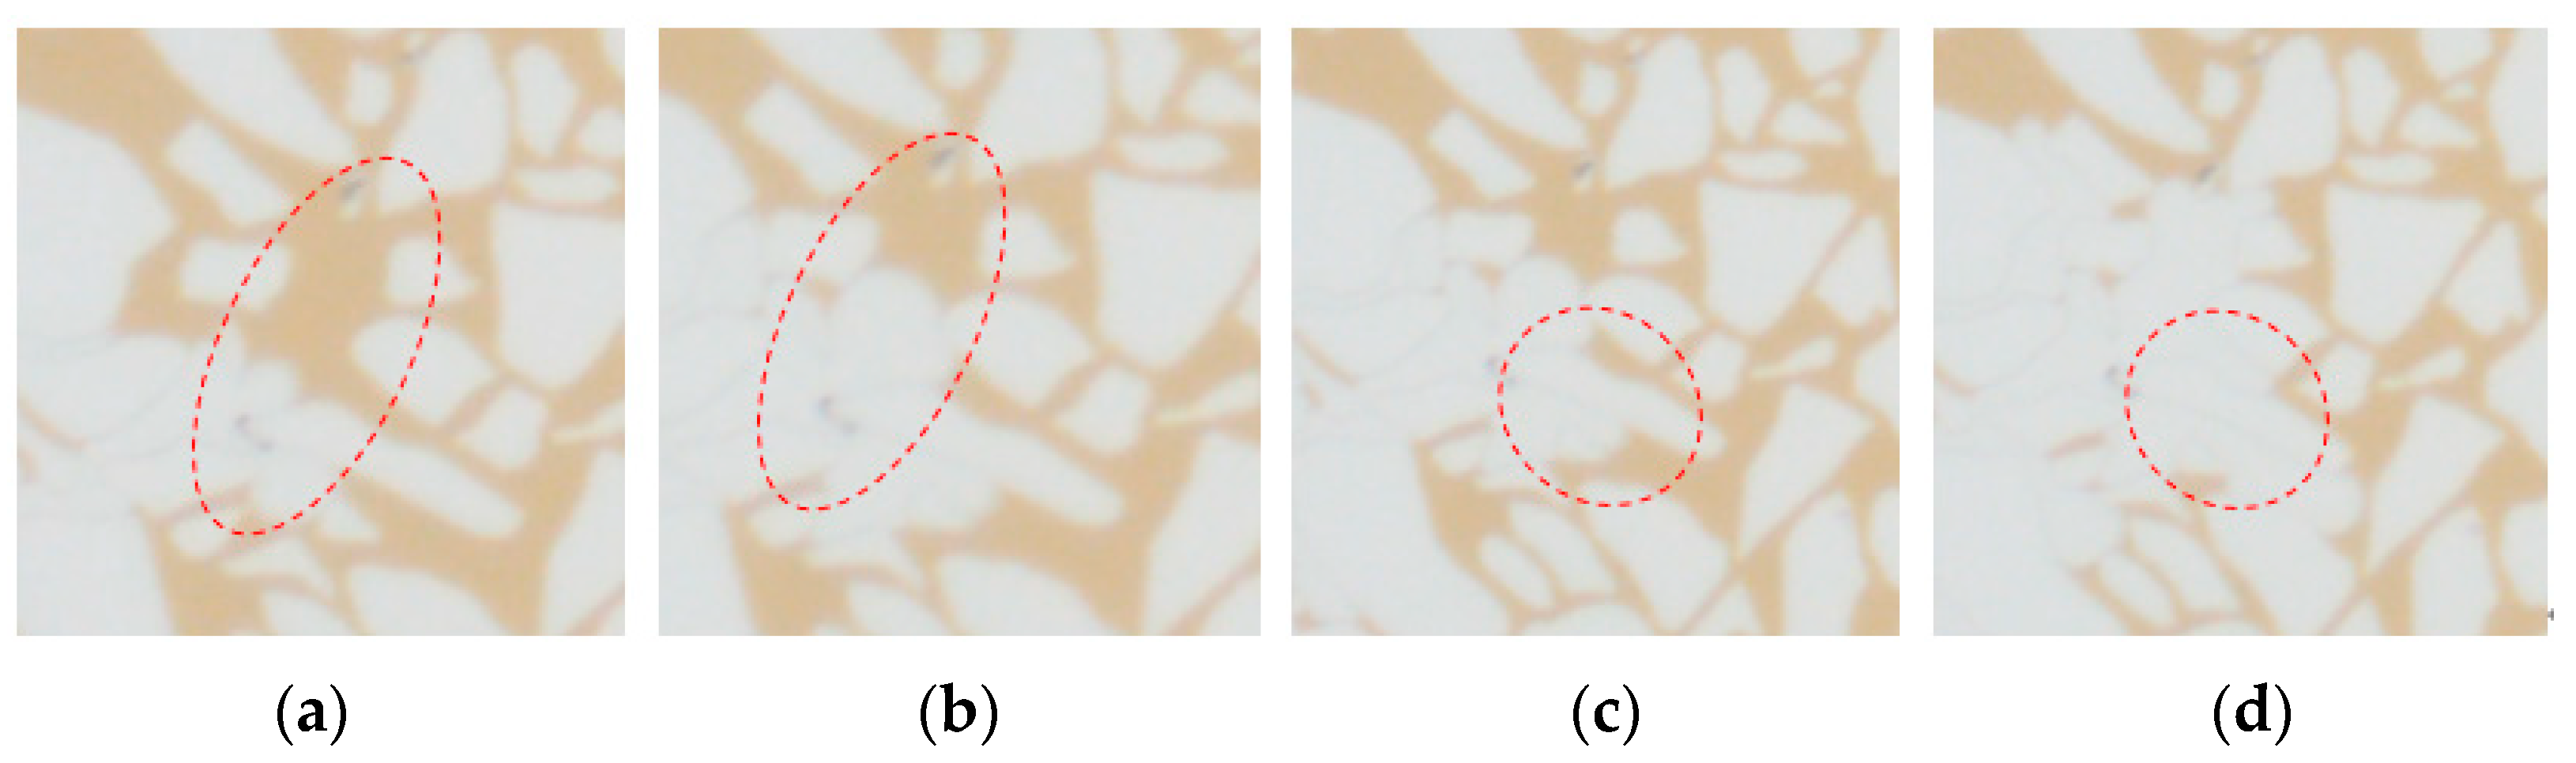
2.2.2. Microscopic Mechanism
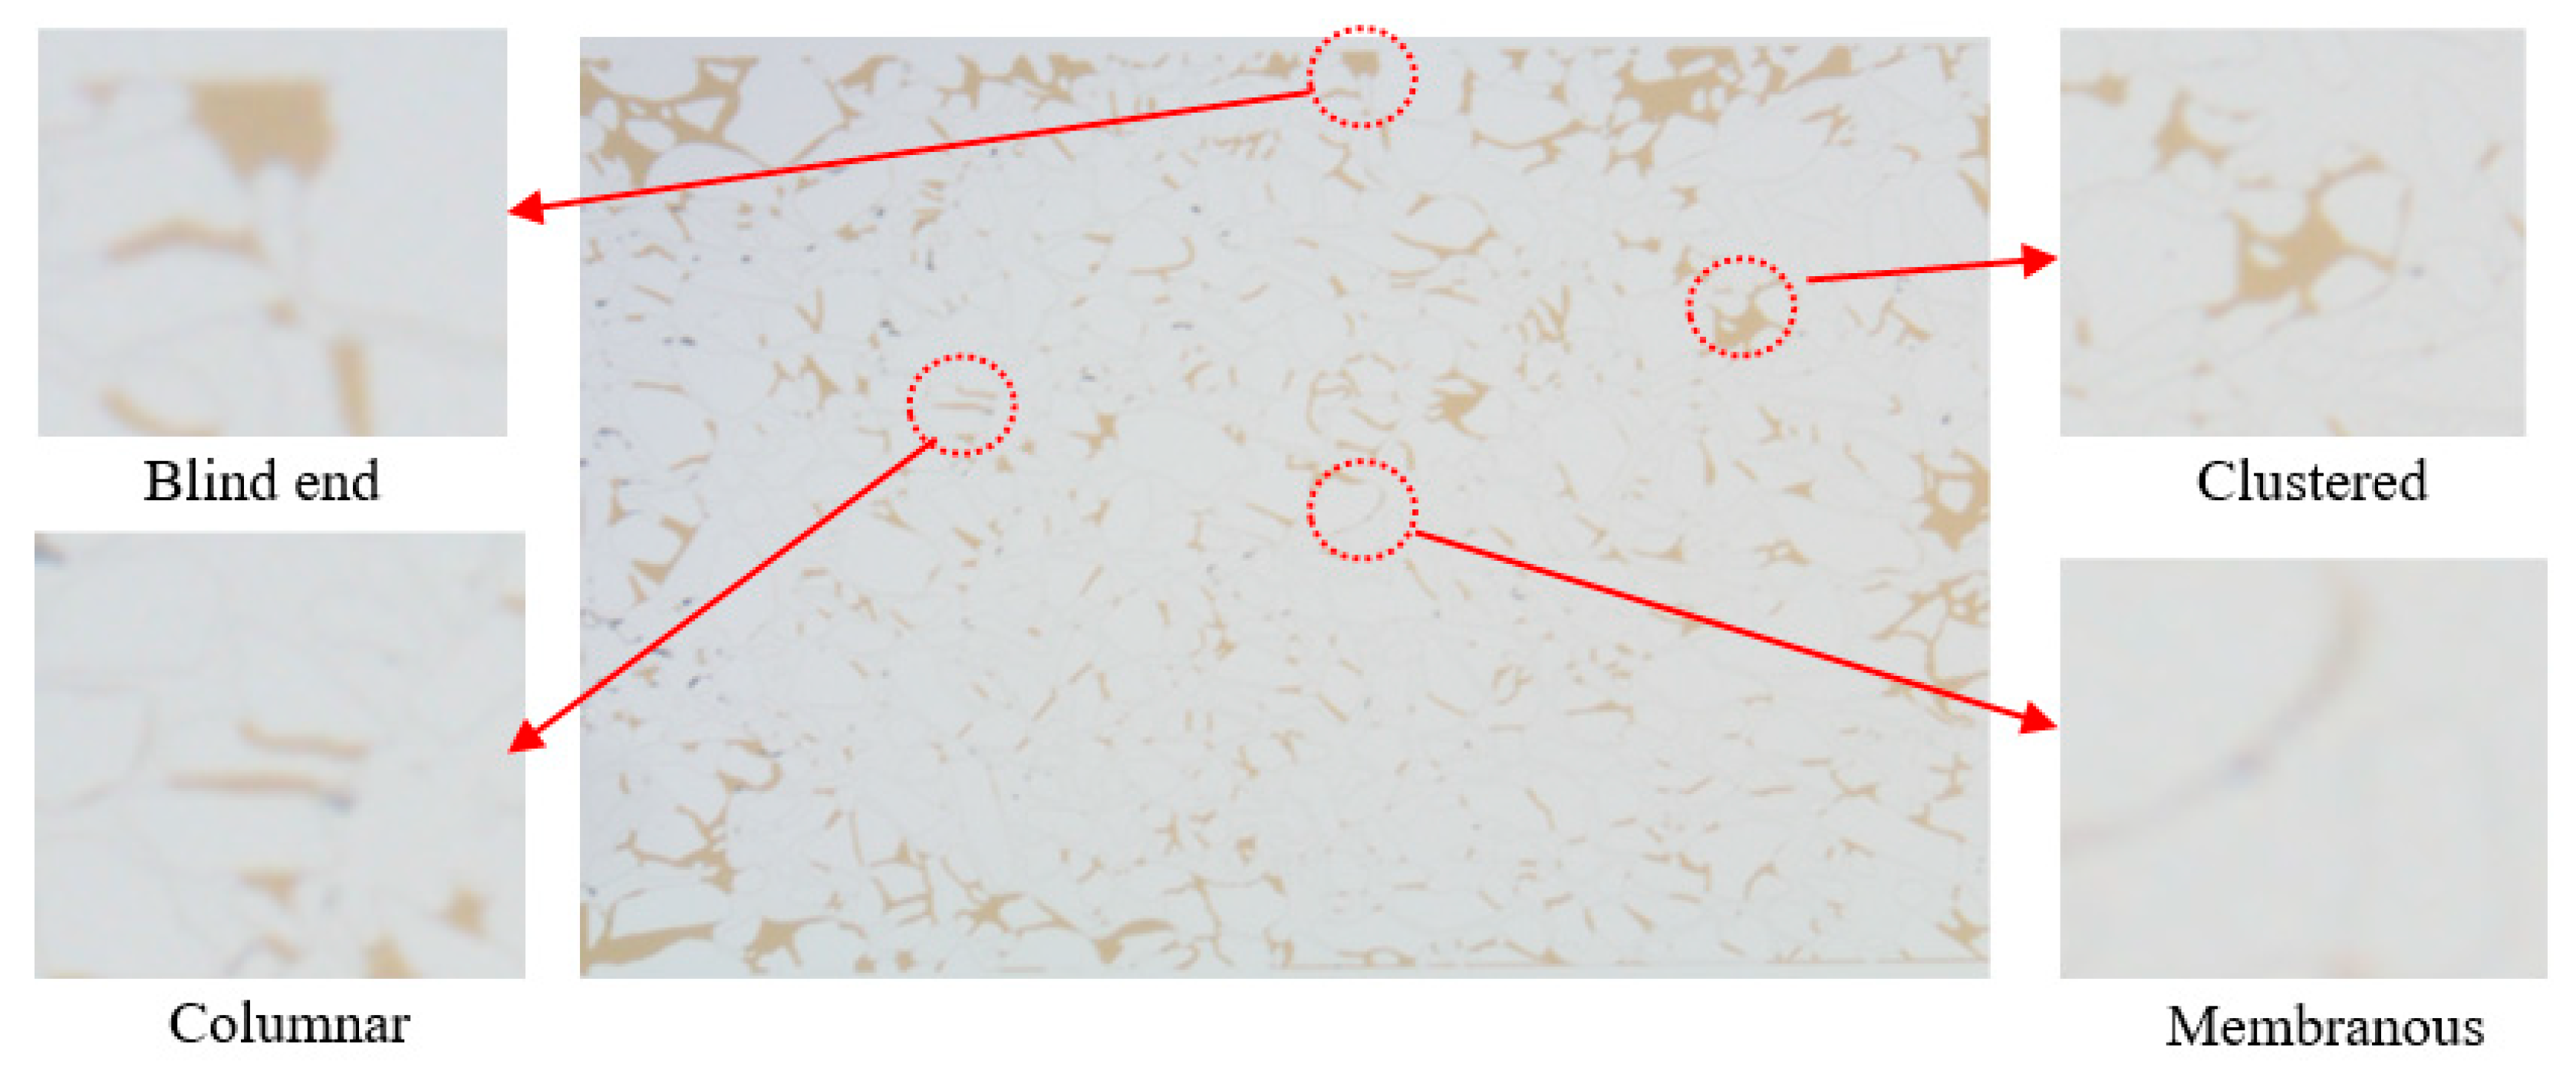
2.3. Distribution Patterns of Remaining Oil after Weak Gel Flooding
2.4. Analysis of Development Potential after Weak Gel Flooding in Offshore LD Oilfield
2.4.1. Evaluation of the Ultimate Oil Displacement Efficiency
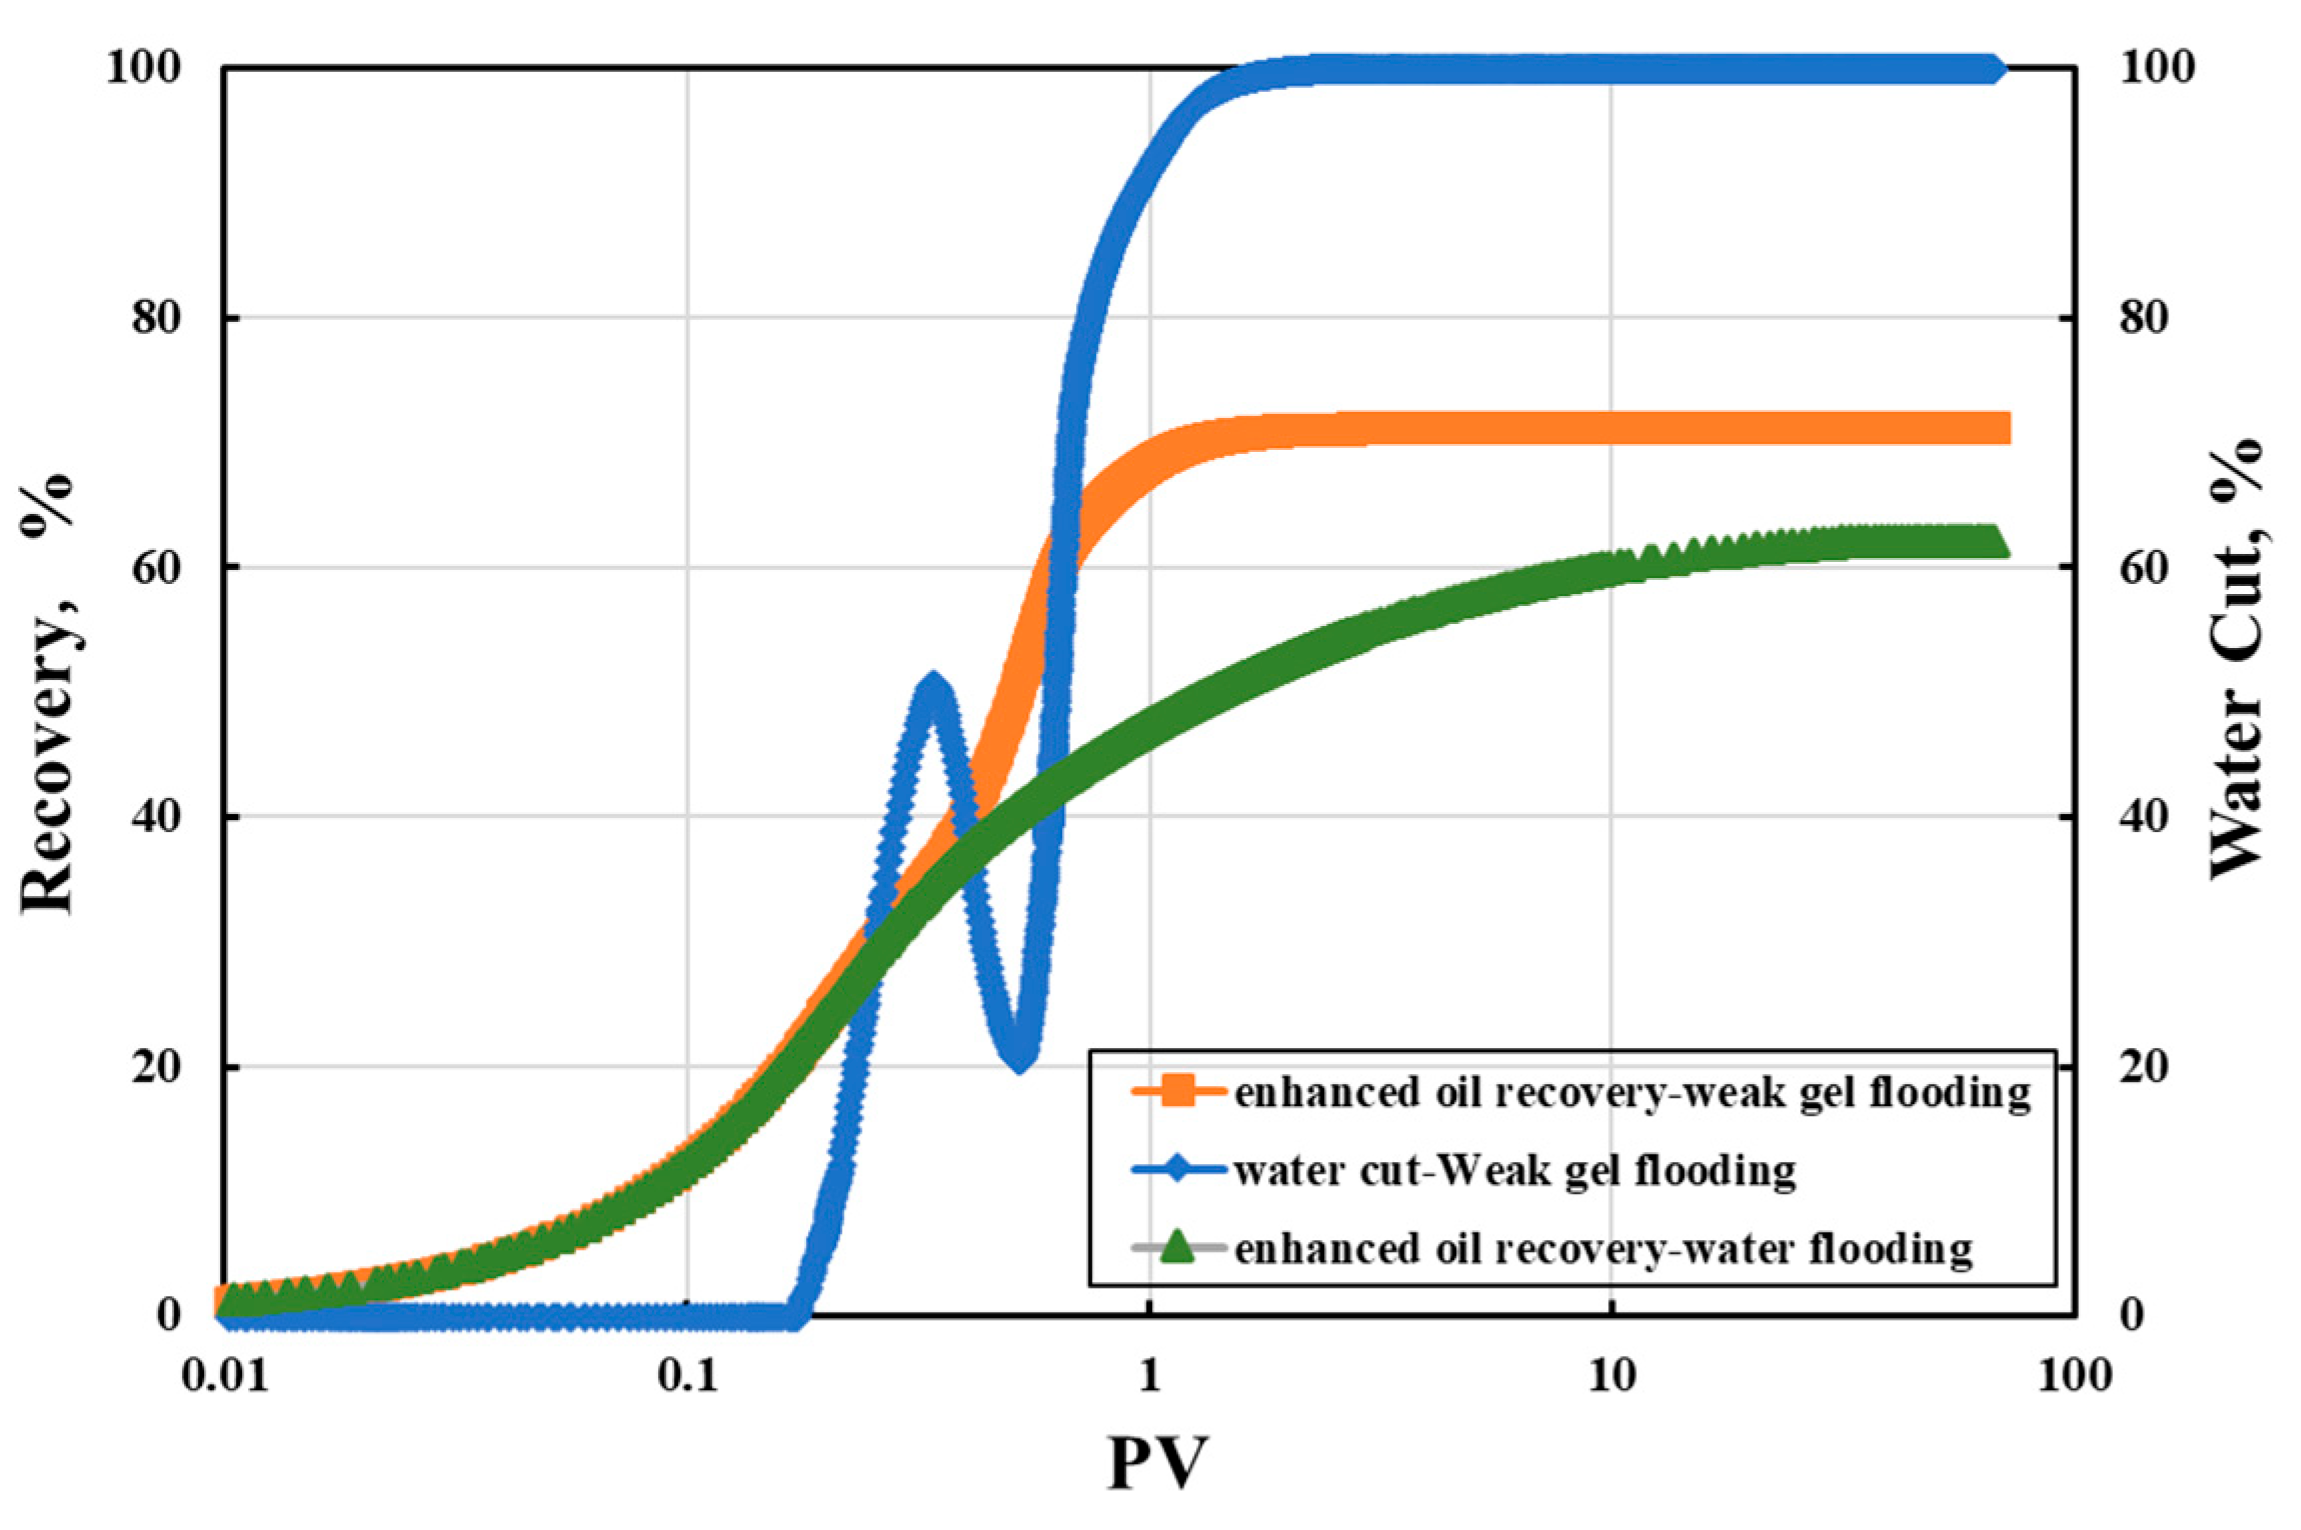
2.4.2. Evaluation of Target Recovery Rate
3. Conclusions
- Experimental findings indicate that weak gel preferentially enters the intermediate to large pores (10~100 ms, 100~1000 ms), amplifying the flow resistance in high-permeability channels. This compels injected fluids to flow towards low-permeability channels, thereby enhancing the utilization of smaller pores (1~10 ms).
- Post-weak gel flooding, the remaining oil is predominantly found in the intermediate to large pores while the distribution of microscopic remaining oil is scattered, predominantly consisting of cluster-shaped oil, accounting for 16.49%, followed by columnar, membranous, and dead-end oil.
- To further increase the oil recovery, the focus should be on exploiting the remaining oil in the intermediate pores or predominantly targeting cluster-shaped and membranous residual oil. In comparison to the current development status of the LD Oilfield, the oil displacement efficiency can be enhanced by approximately 11%.
- Moreover, the maximum target oil recovery can reach 71.3%, indicating that even post-weak gel flooding, the offshore LD oilfield still retains a certain level of development potential.
4. Materials and Methods
4.1. Experimental Materials and Instruments
4.2. Experimental Methods
4.2.1. Online Nuclear Magnetic Resonance (NMR) Oil Displacement Experiment
- Natural core samples were cleaned, dried, and had their basic parameters measured. The cores were subjected to vacuum treatment, followed by saturation with simulated formation water. After saturation, the T2 spectrum of the nuclear magnetic resonance was scanned.
- The cores were displaced with simulated formation water containing Mn2+ ions at a constant rate to thoroughly displace the original water and eliminate the water signal within the cores.
- Simulated formation water was displaced with simulated oil at a constant rate until the oil content at the outlet of the core reached 100%. This established the initial oil saturation, and the nuclear magnetic resonance T2 spectrum was measured to determine the original oil saturation.
- Water flooding was conducted using simulated formation water containing Mn2+ ions at a constant flow rate of 0.2 mL/min, simulating the oil field process. After injecting the weak gel, water flooding was continued until the water saturation reached 98%. The NMR T2 spectrum was measured during the displacement process, alongside recording the liquid production and oil recovery at different time intervals.
4.2.2. Microscopic Displacement Experiment
- Based on the cast thin sections of natural cores from Field LD, pore throat distribution characteristics were extracted to simulate etched microscopic glass models.
- The model was treated with dimethyldichlorosilane for 48 h at 60 °C, treating the pore structure of the microscopic model to alter its wettability.
- The model was saturated with simulated oil at a constant rate of 0.02 mL/min. Subsequently, the simulation of the field displacement process began with a constant injection rate of 0.05 mL/min, involving water flooding, weak gel flooding, and subsequent water flooding.
4.2.3. Evaluation of the Ultimate Oil Recovery Efficiency Experiment
Author Contributions
Funding
Institutional Review Board Statement
Informed Consent Statement
Data Availability Statement
Acknowledgments
Conflicts of Interest
References
- Li, J.; Wang, Z.; Yang, H.; Wu, T.; Wu, H.; Wang, H.; Yu, F.; Jiang, H. Compatibility evaluation of in-depth profile control agents in dominant channels of low-permeability reservoirs. J. Pet. Sci. Eng. 2020, 194, 107529. [Google Scholar] [CrossRef]
- Zhang, X.; Su, Y.; Li, L.; Hao, Y.; Wang, W.; Liu, J.; Gao, X.; Zhao, A.; Wang, K. Microscopic remaining oil initiation mechanism and formation damage of CO2 injection after waterflooding in deep reservoirs. Energy 2022, 248, 123649. [Google Scholar] [CrossRef]
- Hua, Z.; Lin, M.; Dong, Z.; Li, M.; Zhang, G.; Yang, J. Study of deep profile control and oil displacement technologies with nanoscale polymer microspheres. J. Colloid Interface Sci. 2014, 424, 67–74. [Google Scholar] [CrossRef] [PubMed]
- Yang, Z.; Jia, S.; Zhang, L.; Wu, X.; Dou, H.; Guo, Z.; Zeng, L.; Li, H.; Guo, Z.; Jia, Z.; et al. Deep profile adjustment and oil displacement sweep control technique for abnormally high temperature and high salinity reservoirs. Pet. Explor. Dev. 2016, 43, 97–105. [Google Scholar] [CrossRef]
- Cao, W.; Xie, K.; Lu, X.; Liu, Y.; Zhang, Y. Effect of profile-control oil-displacement agent on increasing oil recovery and its mechanism. Fuel 2019, 237, 1151–1160. [Google Scholar] [CrossRef]
- Sun, Z.; Lu, X.; Sun, W. The profile control and displacement mechanism of continuous and discontinuous phase flooding agent. J. Dispers. Sci. Technol. 2017, 38, 1403–1409. [Google Scholar] [CrossRef]
- Cheng, T.; Hou, J.; Yang, Y.; You, Z.; Liu, Y.; Zhao, F.; Li, J. Study on the plugging performance of bilayer-coating microspheres for in-depth conformance control: Experimental study and mathematical modeling. Ind. Eng. Chem. Res. 2019, 58, 6796–6810. [Google Scholar] [CrossRef]
- Skauge, A.; Zamani, N.; Gausdal Jacobsen, J.; Shaker Shiran, B.; Al-Shakry, B.; Skauge, T. Polymer flow in porous media: Relevance to enhanced oil recovery. Colloids Interfaces 2018, 2, 27. [Google Scholar] [CrossRef]
- Nazar, M.F.; Shah, S.S.; Khosa, M.A. Microemulsions in enhanced oil recovery: A review. Pet. Sci. Technol. 2011, 29, 1353–1365. [Google Scholar] [CrossRef]
- Nazar, M.F.; Shah, S.S.; Eastoe, J.; Khan, A.M.; Shah, A. Separation and recycling of nanoparticles using cloud point extraction with non-ionic surfactant mixtures. J. Colloid Interface Sci. 2011, 363, 490–496. [Google Scholar] [CrossRef]
- Nazar, M.F.; Myakonkaya, O.; Shah, S.S.; Eastoe, J. Separating nanoparticles from microemulsions. J. Colloid Interface Sci. 2011, 354, 624–629. [Google Scholar] [CrossRef] [PubMed]
- Xiao, L.; Hou, J.; Wen, Y.; Qu, M.; Wang, W.; Wu, W.; Liang, T. Imbibition mechanisms of high temperature resistant microemulsion system in ultra-low permeability and tight reservoirs. Pet. Explor. Dev. 2022, 49, 1398–1410. [Google Scholar] [CrossRef]
- Al-Shakry, B.; Skauge, T.; Shaker Shiran, B.; Skauge, A. Impact of mechanical degradation on polymer injectivity in porous media. Polymers 2018, 10, 742. [Google Scholar] [CrossRef]
- Liu, S.; Ott, W.K. Sodium silicate applications in oil, gas & geothermal well operations. J. Pet. Sci. Eng. 2020, 195, 107693. [Google Scholar]
- Bai, B.; Leng, J.; Wei, M. A comprehensive review of in-situ polymer gel simulation for conformance control. Pet. Sci. 2022, 19, 189–202. [Google Scholar] [CrossRef]
- Zhu, D.Y.; Fang, X.Y.; Sun, R.X.; Xu, Z.H.; Liu, Y.; Liu, J.Y. Development of degradable pre-formed particle gel (DPPG) as temporary plugging agent for petroleum drilling and production. Pet. Sci. 2021, 18, 479–494. [Google Scholar] [CrossRef]
- Gallo, G.; Erdmann, E.; Cavasotto, C.N. Evaluation of silicone fluids and resins as CO2 thickeners for enhanced oil recovery using a computational and experimental approach. ACS Omega 2021, 6, 24803–24813. [Google Scholar] [CrossRef]
- Smith, J.; Inc, T. Performance of 18 Polymers in Aluminum Citrate Colloidal Dispersion Gels. In Proceedings of the SPE International Symposium on Oilfield Chemistry, San Antonio, TX, USA, 14–17 February 1995. [Google Scholar] [CrossRef]
- Zhu, D.; Bai, B.; Hou, J. Polymer gel systems for water management in high-temperature petroleum reservoirs: A chemical review. Energy Fuels 2017, 31, 13063–13087. [Google Scholar] [CrossRef]
- Kang, W.; Kang, X.; Lashari, Z.A.; Li, Z.; Zhou, B.; Yang, H.; Sarsenbekuly, B.; Aidarova, S. Progress of polymer gels for conformance control in oilfield. Adv. Colloid Interface Sci. 2021, 289, 102363. [Google Scholar] [CrossRef]
- Abdulbaki, M.; Huh, C.; Sepehrnoori, K.; Delshad, M.; Varavei, A. A critical review on use of polymer microgels for conformance control purposes. J. Pet. Sci. Eng. 2014, 122, 741–753. [Google Scholar] [CrossRef]
- Formanek, M.; Rovigatti, L.; Zaccarelli, E.; Francesco, S.; Angel, J. Moreno Gel formation in reversibly cross-linking polymers. Macromolecules 2021, 54, 6613–6627. [Google Scholar] [CrossRef]
- Zhao, G.; Dai, C.; You, Q. Characteristics and displacement mechanisms of the dispersed particle gel soft heterogeneous compound flooding system. Pet. Explor. Dev. 2018, 45, 481–490. [Google Scholar] [CrossRef]
- Elsharafi, M.O.; Bai, B. Effect of weak preformed particle gel on unswept oil zones/areas during conformance control treatments. Ind. Eng. Chem. Res. 2012, 51, 11547–11554. [Google Scholar] [CrossRef]
- Wu, W.X.; Song, X.; Fu, Y.; Yuan, P.F. Priority selection of weak gel flooding formula on heterogeneous reservoir. Adv. Mater. Res. 2015, 1073, 2248–2251. [Google Scholar] [CrossRef]
- Wang, W.; Gu, Y.; Liu, Y. Applications of weak gel for in-depth profile modification and oil displacement. J. Can. Pet. Technol. 2003, 42, 54–61. [Google Scholar] [CrossRef]
- Seright, R. Impact of dispersion on gel placement for profile control. SPE Reserv. Eng. 1991, 6, 343–352. [Google Scholar] [CrossRef]
- Cheng, H.; Zheng, X.; Wu, Y.; Zhang, J.; Zhao, X.; Li, C. Experimental and numerical investigation on oil displacement mechanism of weak gel in waterflood reservoirs. Gels 2022, 8, 309. [Google Scholar] [CrossRef] [PubMed]
- Cao, G.; Wu, J.; Bai, Y.; Zhang, N.; Xing, P.; Xu, Q.; Li, D.; Cong, X.; Liu, J. Research on the Formulation System of Weak Gel and the Influencing Factors of Gel Formation after Polymer Flooding in Y1 Block. Processes 2022, 10, 1405. [Google Scholar] [CrossRef]
- Yin, H.; Yin, X.; Cao, R.; Zeng, P.; Wang, J.; Wu, D.; Luo, X.; Zhu, Y.; Zheng, Z.; Feng, Y. In situ crosslinked weak gels with ultralong and tunable gelation times for improving oil recovery. Chem. Eng. J. 2022, 432, 134350. [Google Scholar] [CrossRef]
- Wang, C.; Zhong, L.; Liu, Y.; Han, Y.; Zhao, P.; Yuan, Y.; Han, X. Characteristics of weak-gel flooding and its application in LD10-1 oilfield. ACS Omega 2020, 5, 24935–24945. [Google Scholar] [CrossRef]
- Li, J.; He, Y.; Liu, B.; Zhang, Y.; Hu, Z.; Hong, X. Ultimate Displacement Efficiency of Heavy Oil Reservoir with Bottom Water Formed by Fluvial Deposition in Bohai Oilfiled at Ultra-high Water Cut Stage. Offshore Oil 2022, 42, 24–30. [Google Scholar]
- Zhao, P.; Han, Y.; Meng, X.; Yuan, Y.; Zhang, X.; Zhong, L.; Yu, Z. Experimental investigation on the injection profile variation in the weak gel injection process. J. Phys. Conf. Ser. 2020, 1707, 012020. [Google Scholar] [CrossRef]


| Parameters | Value |
|---|---|
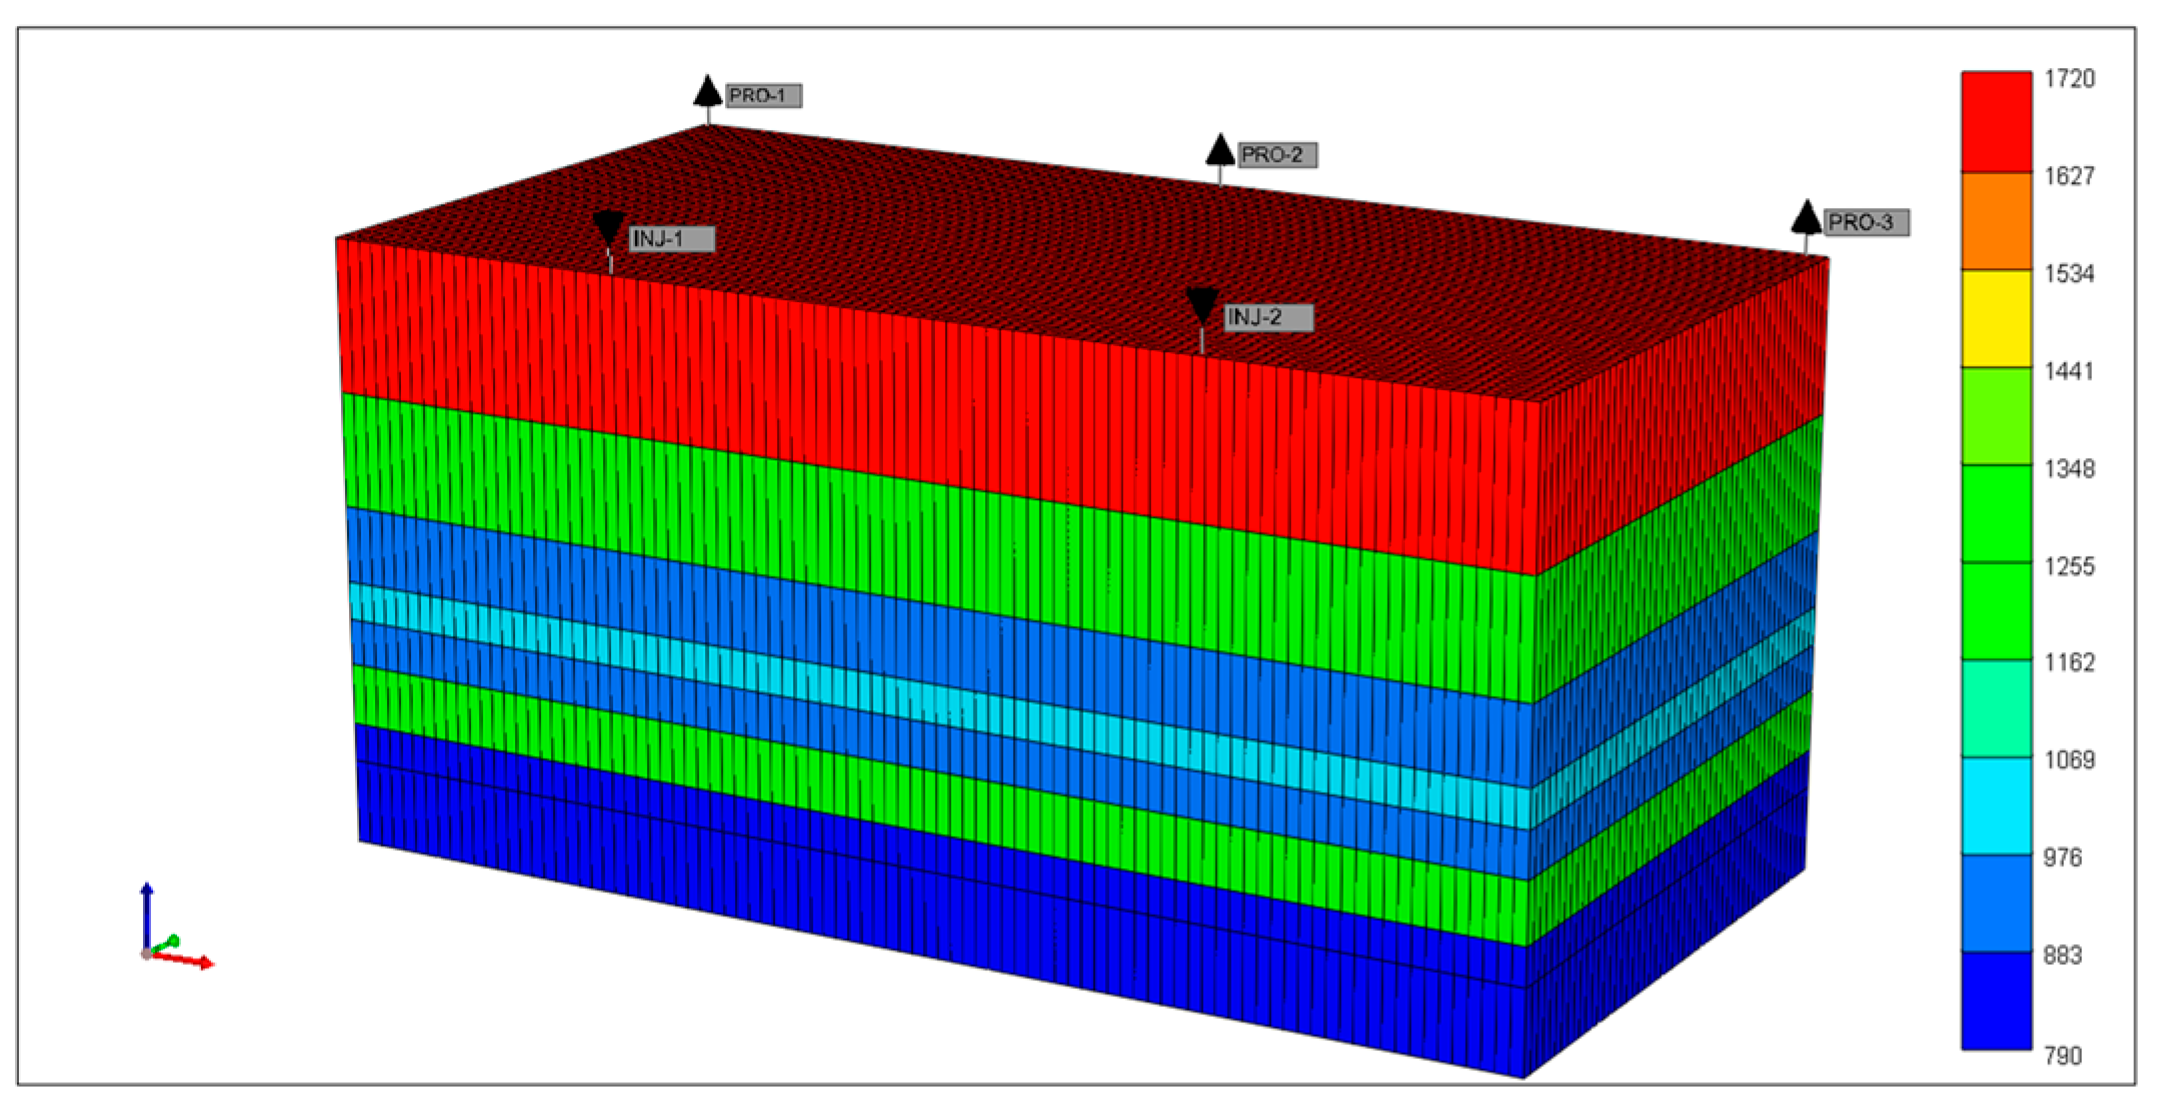
| Grid step size (m) | 1550 × 500 × 80 |
| Number of grids | 91 × 50 × 8 |
| Porosity (%) | 26 |
| Permeability variation coefficient | 0.275 |
| Mean permeability (mD) | 1117.5 |
| Oil saturation | 0.65 |
| Reservoir thickness (m) | 80 |
| Crude oil viscosity (mPa·s) | 14 |
| Formation water viscosity (mPa·s) | 0.46 |
| Weak gel injection (PV) | 0.4 |
Disclaimer/Publisher’s Note: The statements, opinions and data contained in all publications are solely those of the individual author(s) and contributor(s) and not of MDPI and/or the editor(s). MDPI and/or the editor(s) disclaim responsibility for any injury to people or property resulting from any ideas, methods, instructions or products referred to in the content. |
© 2024 by the authors. Licensee MDPI, Basel, Switzerland. This article is an open access article distributed under the terms and conditions of the Creative Commons Attribution (CC BY) license (https://creativecommons.org/licenses/by/4.0/).
Share and Cite
Ge, L.; Chen, X.; Wang, G.; Zhang, G.; Li, J.; Liu, Y.; Xiao, L.; Wen, Y.; Yuan, W.; Qu, M.; et al. Analysis of the Distribution Pattern of Remaining Oil and Development Potential after Weak Gel Flooding in the Offshore LD Oilfield. Gels 2024, 10, 236. https://doi.org/10.3390/gels10040236
Ge L, Chen X, Wang G, Zhang G, Li J, Liu Y, Xiao L, Wen Y, Yuan W, Qu M, et al. Analysis of the Distribution Pattern of Remaining Oil and Development Potential after Weak Gel Flooding in the Offshore LD Oilfield. Gels. 2024; 10(4):236. https://doi.org/10.3390/gels10040236
Chicago/Turabian StyleGe, Lizhen, Xiaoming Chen, Gang Wang, Guohao Zhang, Jinyi Li, Yang Liu, Lixiao Xiao, Yuchen Wen, Weifeng Yuan, Ming Qu, and et al. 2024. "Analysis of the Distribution Pattern of Remaining Oil and Development Potential after Weak Gel Flooding in the Offshore LD Oilfield" Gels 10, no. 4: 236. https://doi.org/10.3390/gels10040236