
The Effect of Sub-Lethal Successive Applications of Photodynamic Therapy on Candida albicans Biofilm Depends on the Photosensitizer
 , , , ,
Abstract
:1. Introduction
2. Materials and Methods
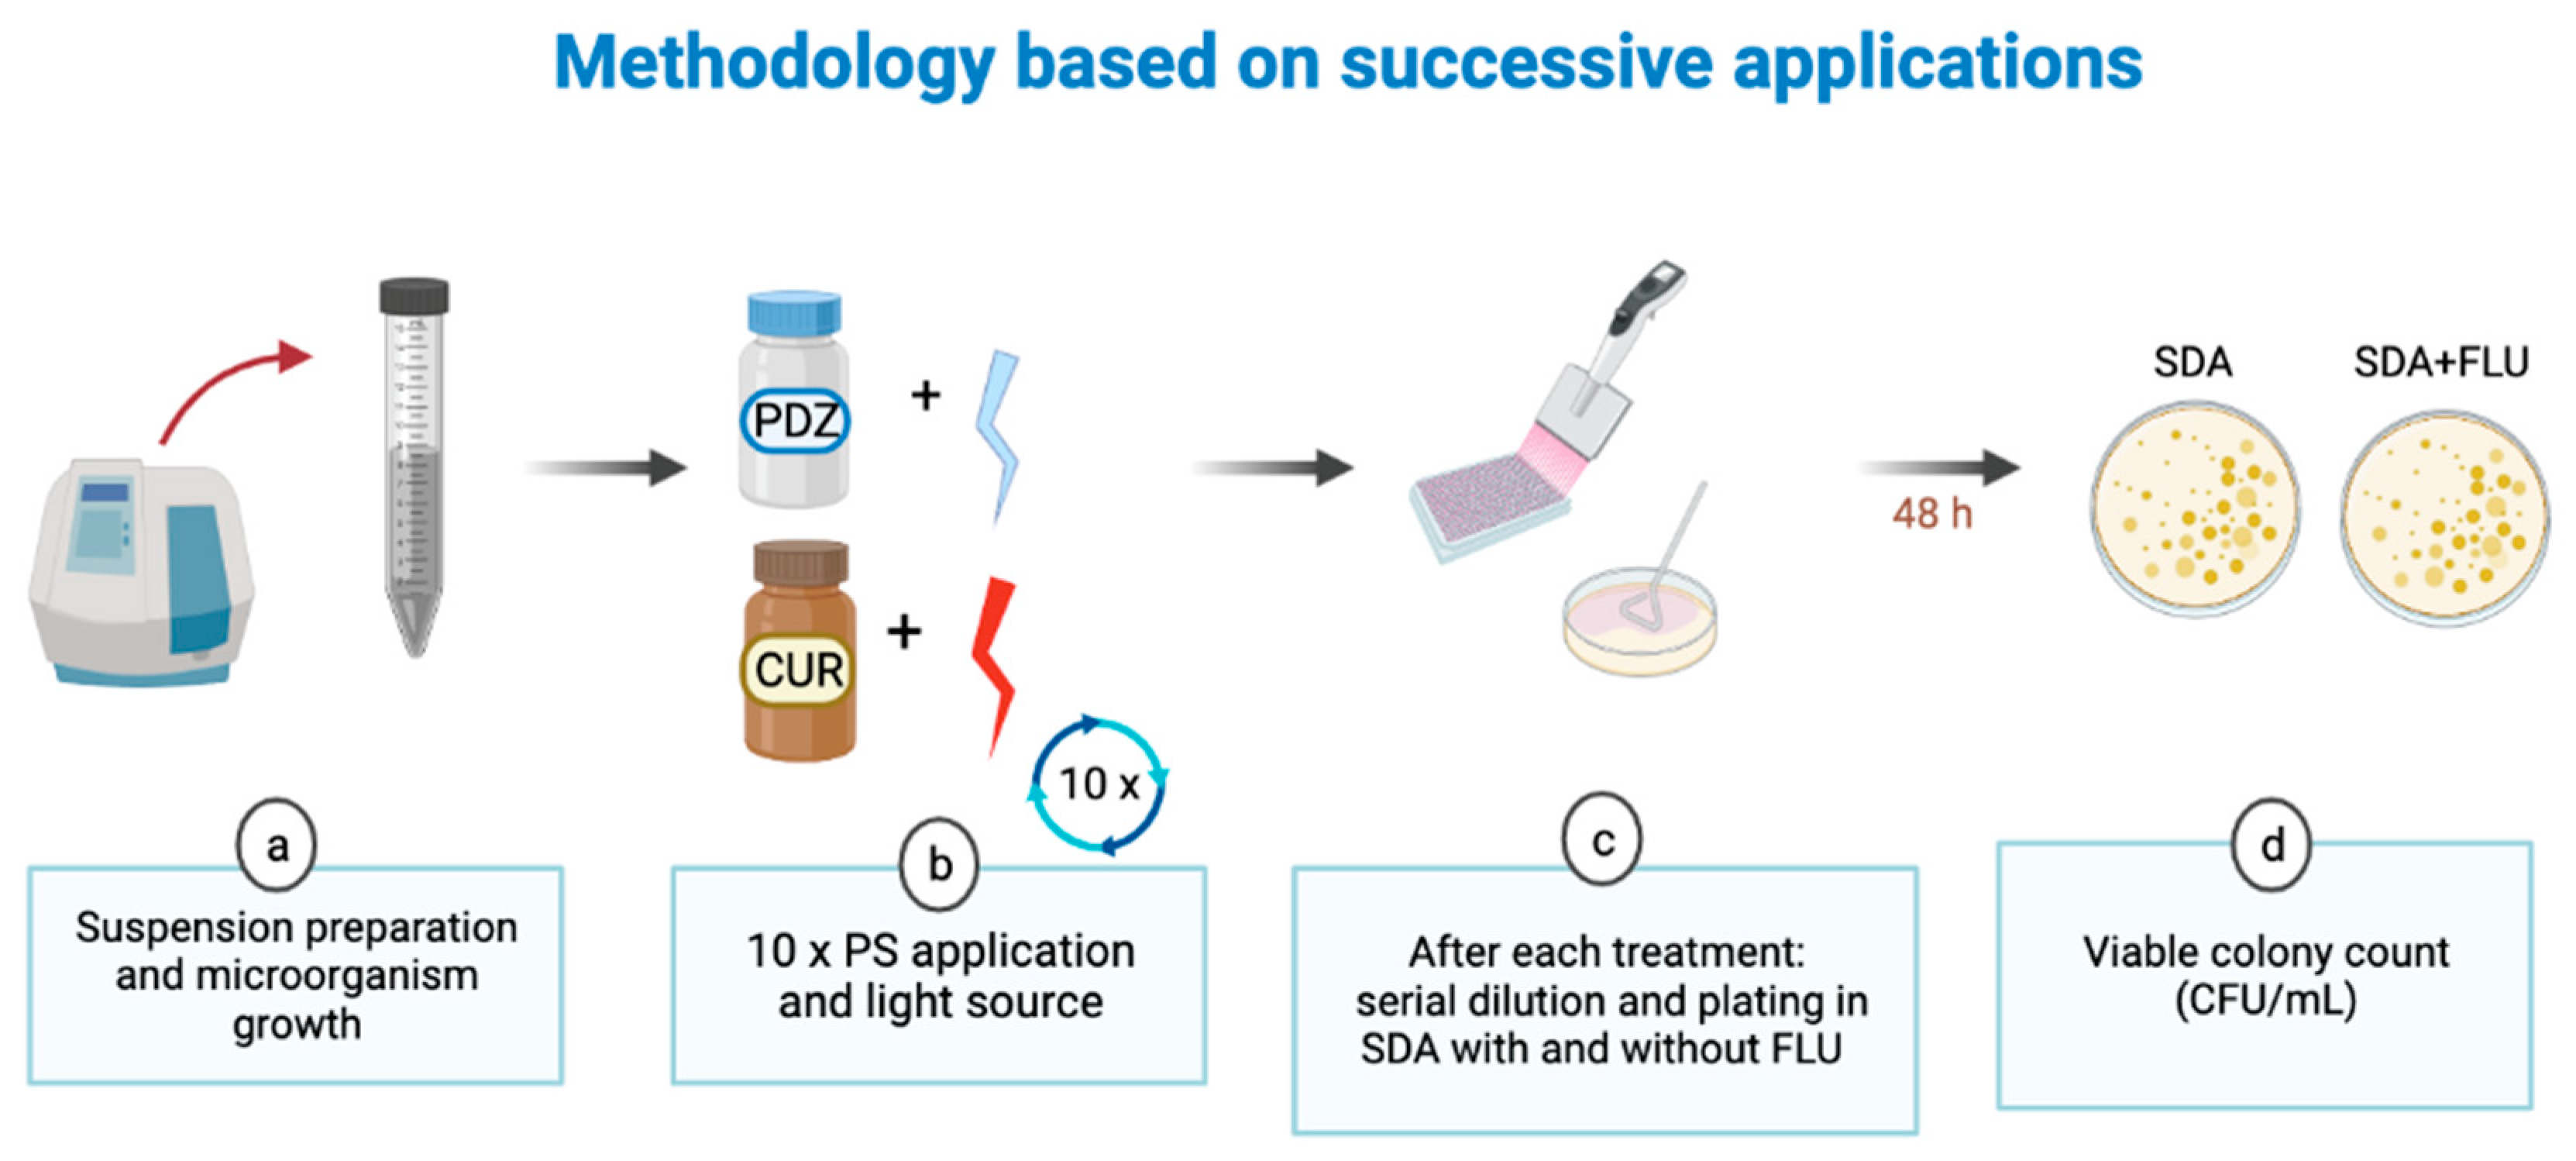
2.1. Preparation of PS and Irradiation Conditions
2.2. C. albicans Cultures and Treatments
2.2.1. Growth of the Microorganism in Planktonic Culture
2.2.2. C. albicans Biofilm Formation and Treatments
2.3. Cell Viability Analysis (CFU/mL)
2.4. Quantification of ROS Production after aPDT
2.5. RT-qPCR Analysis
2.6. Statistical Analysis
3. Results
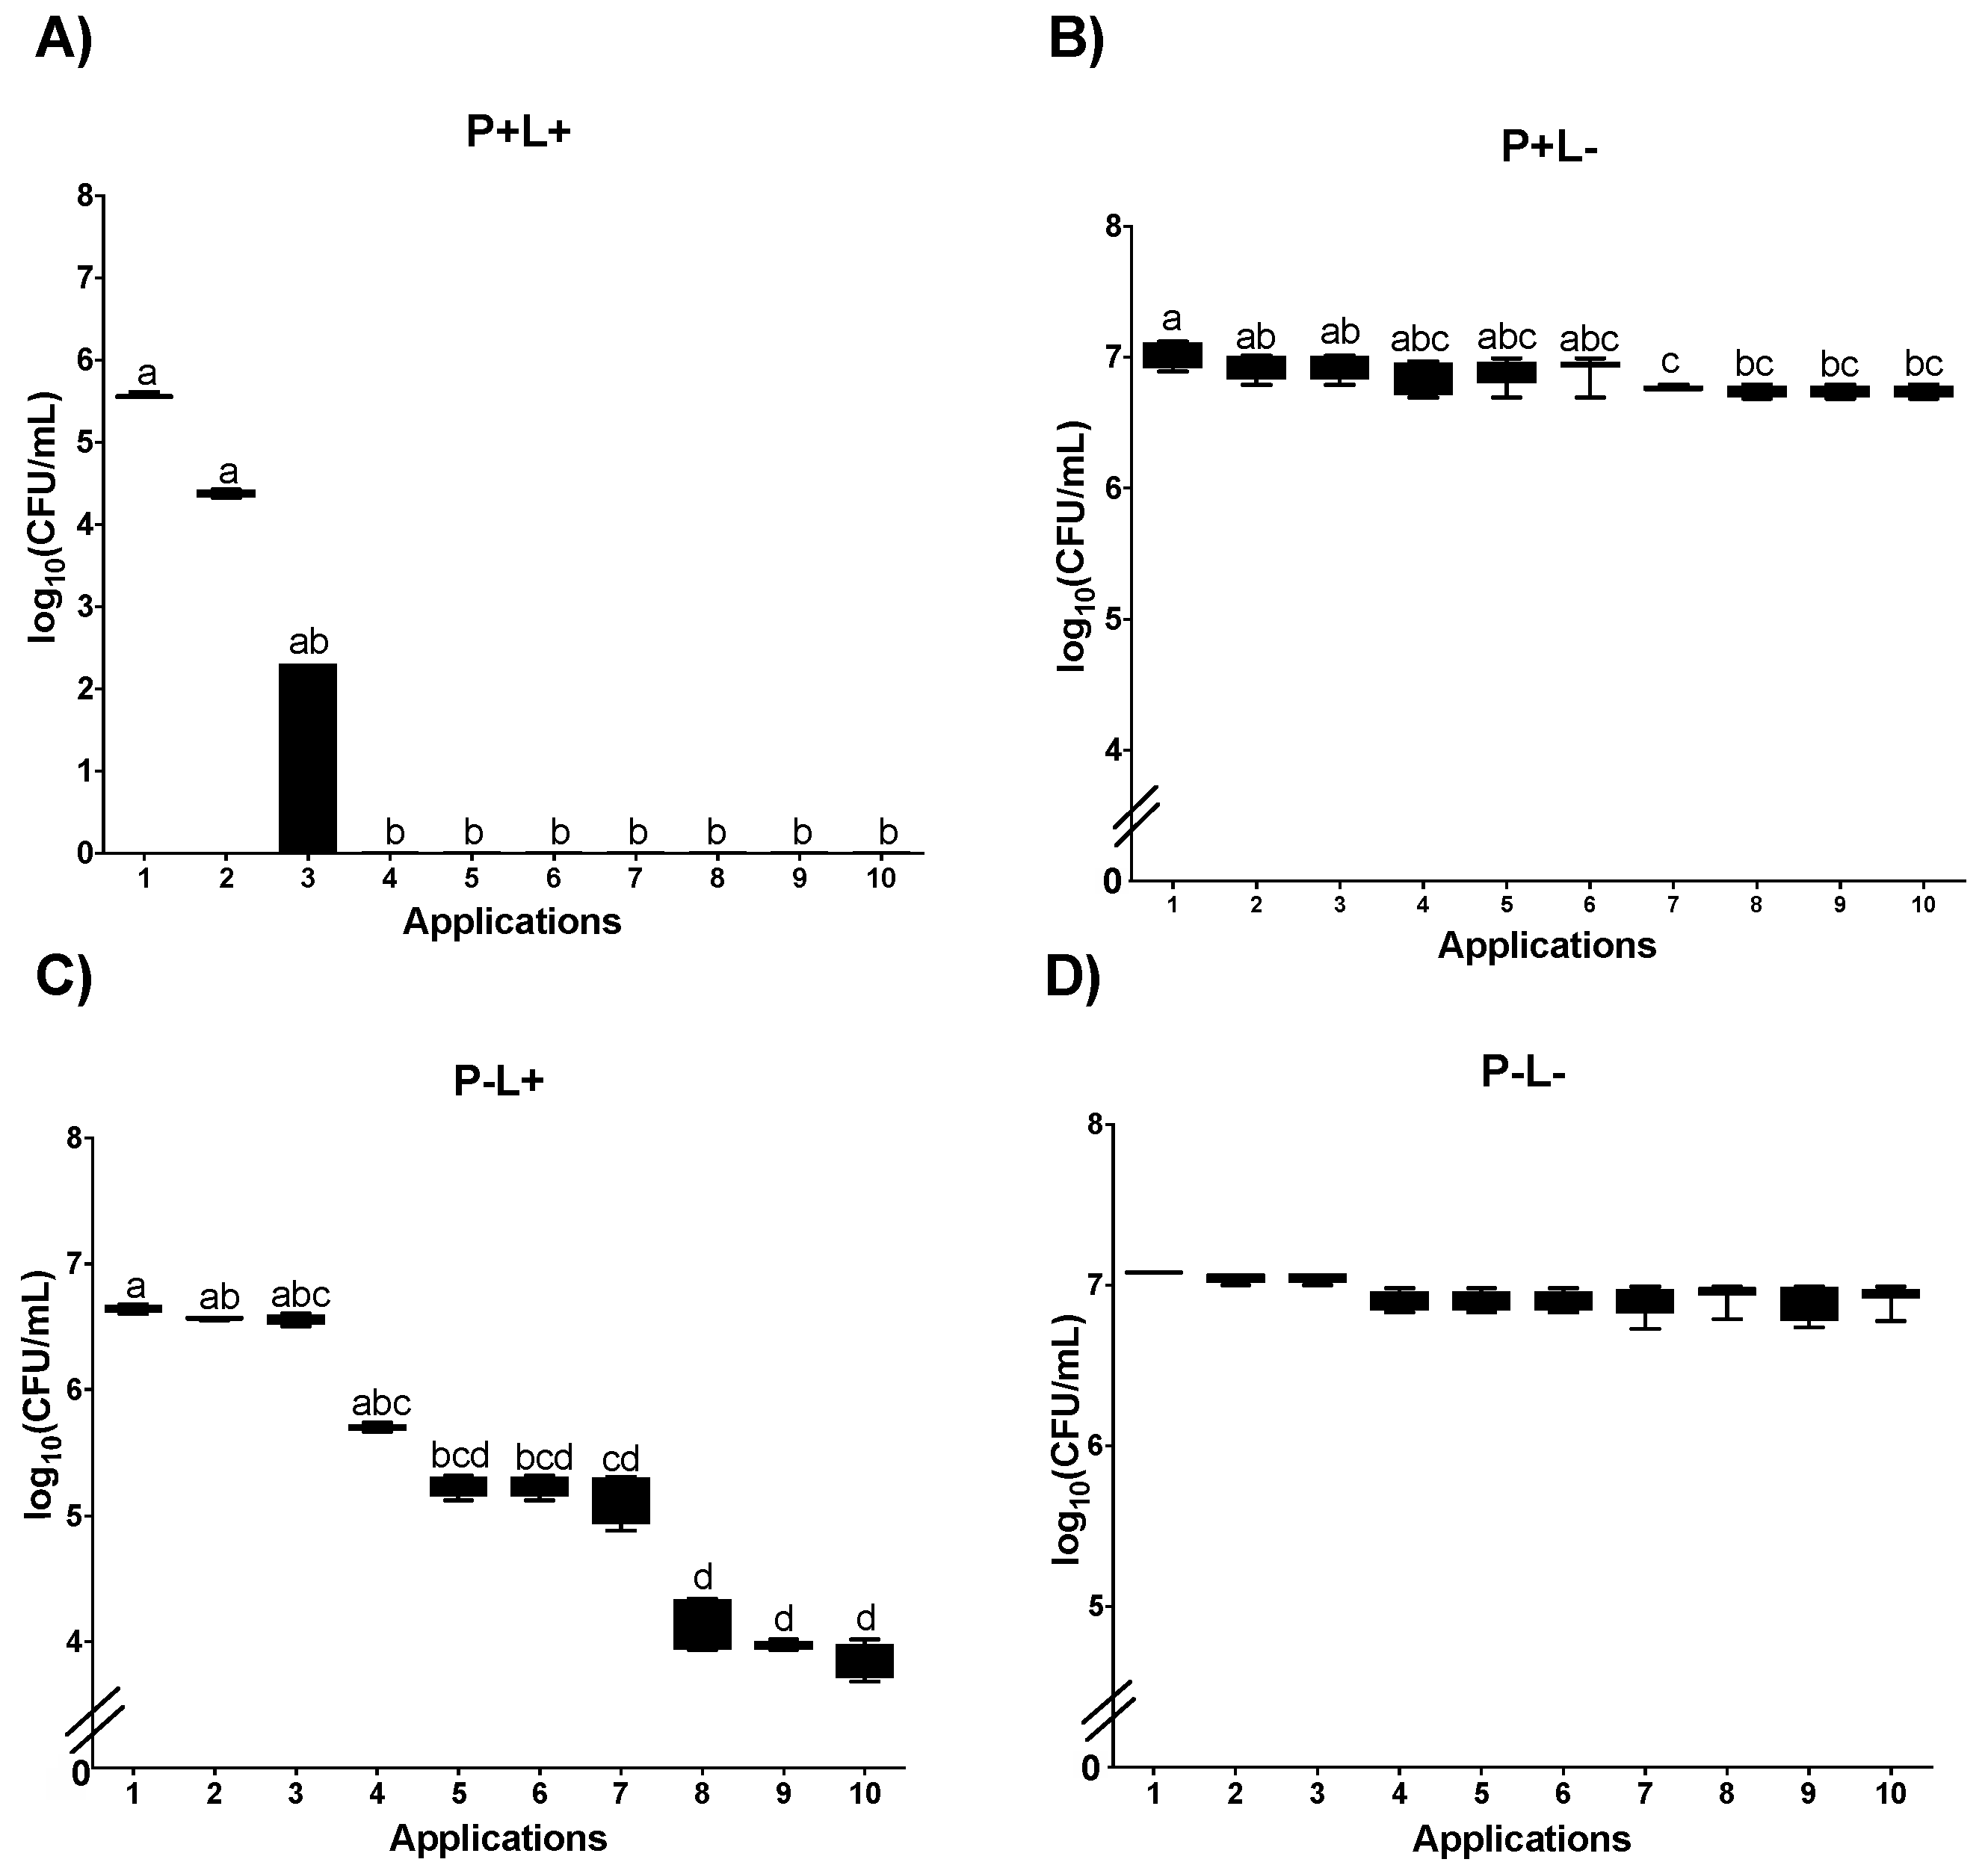
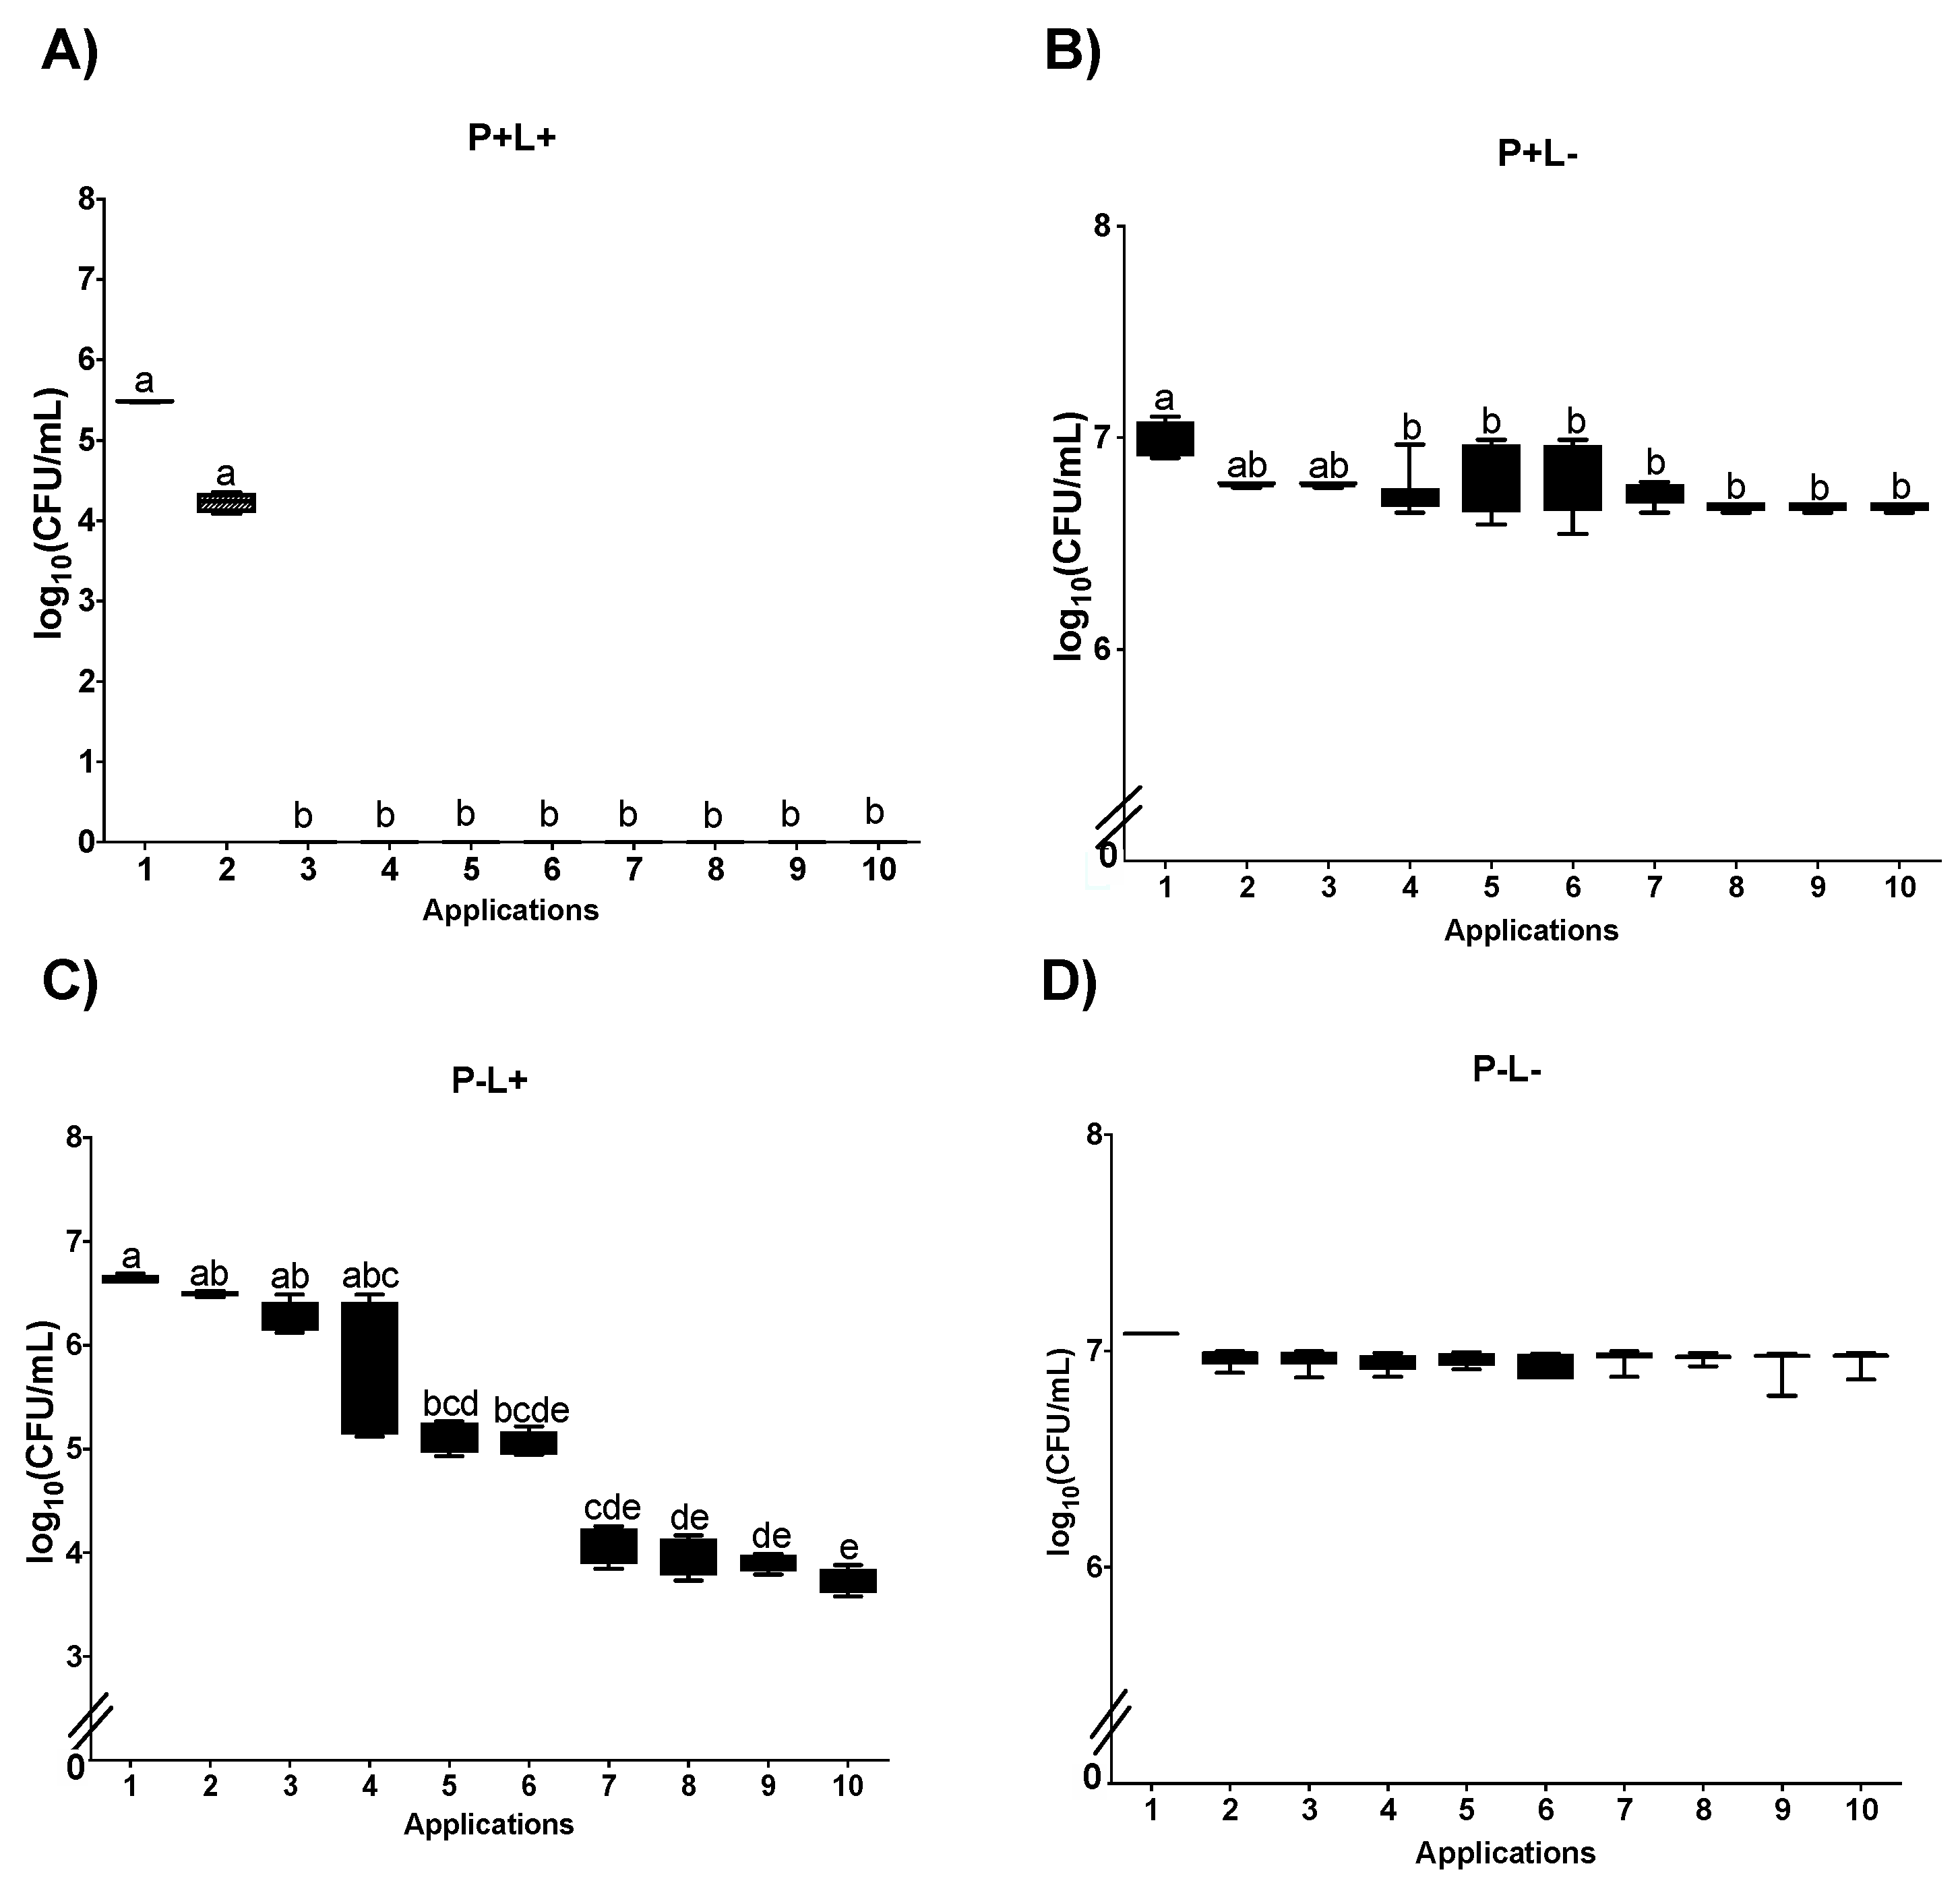
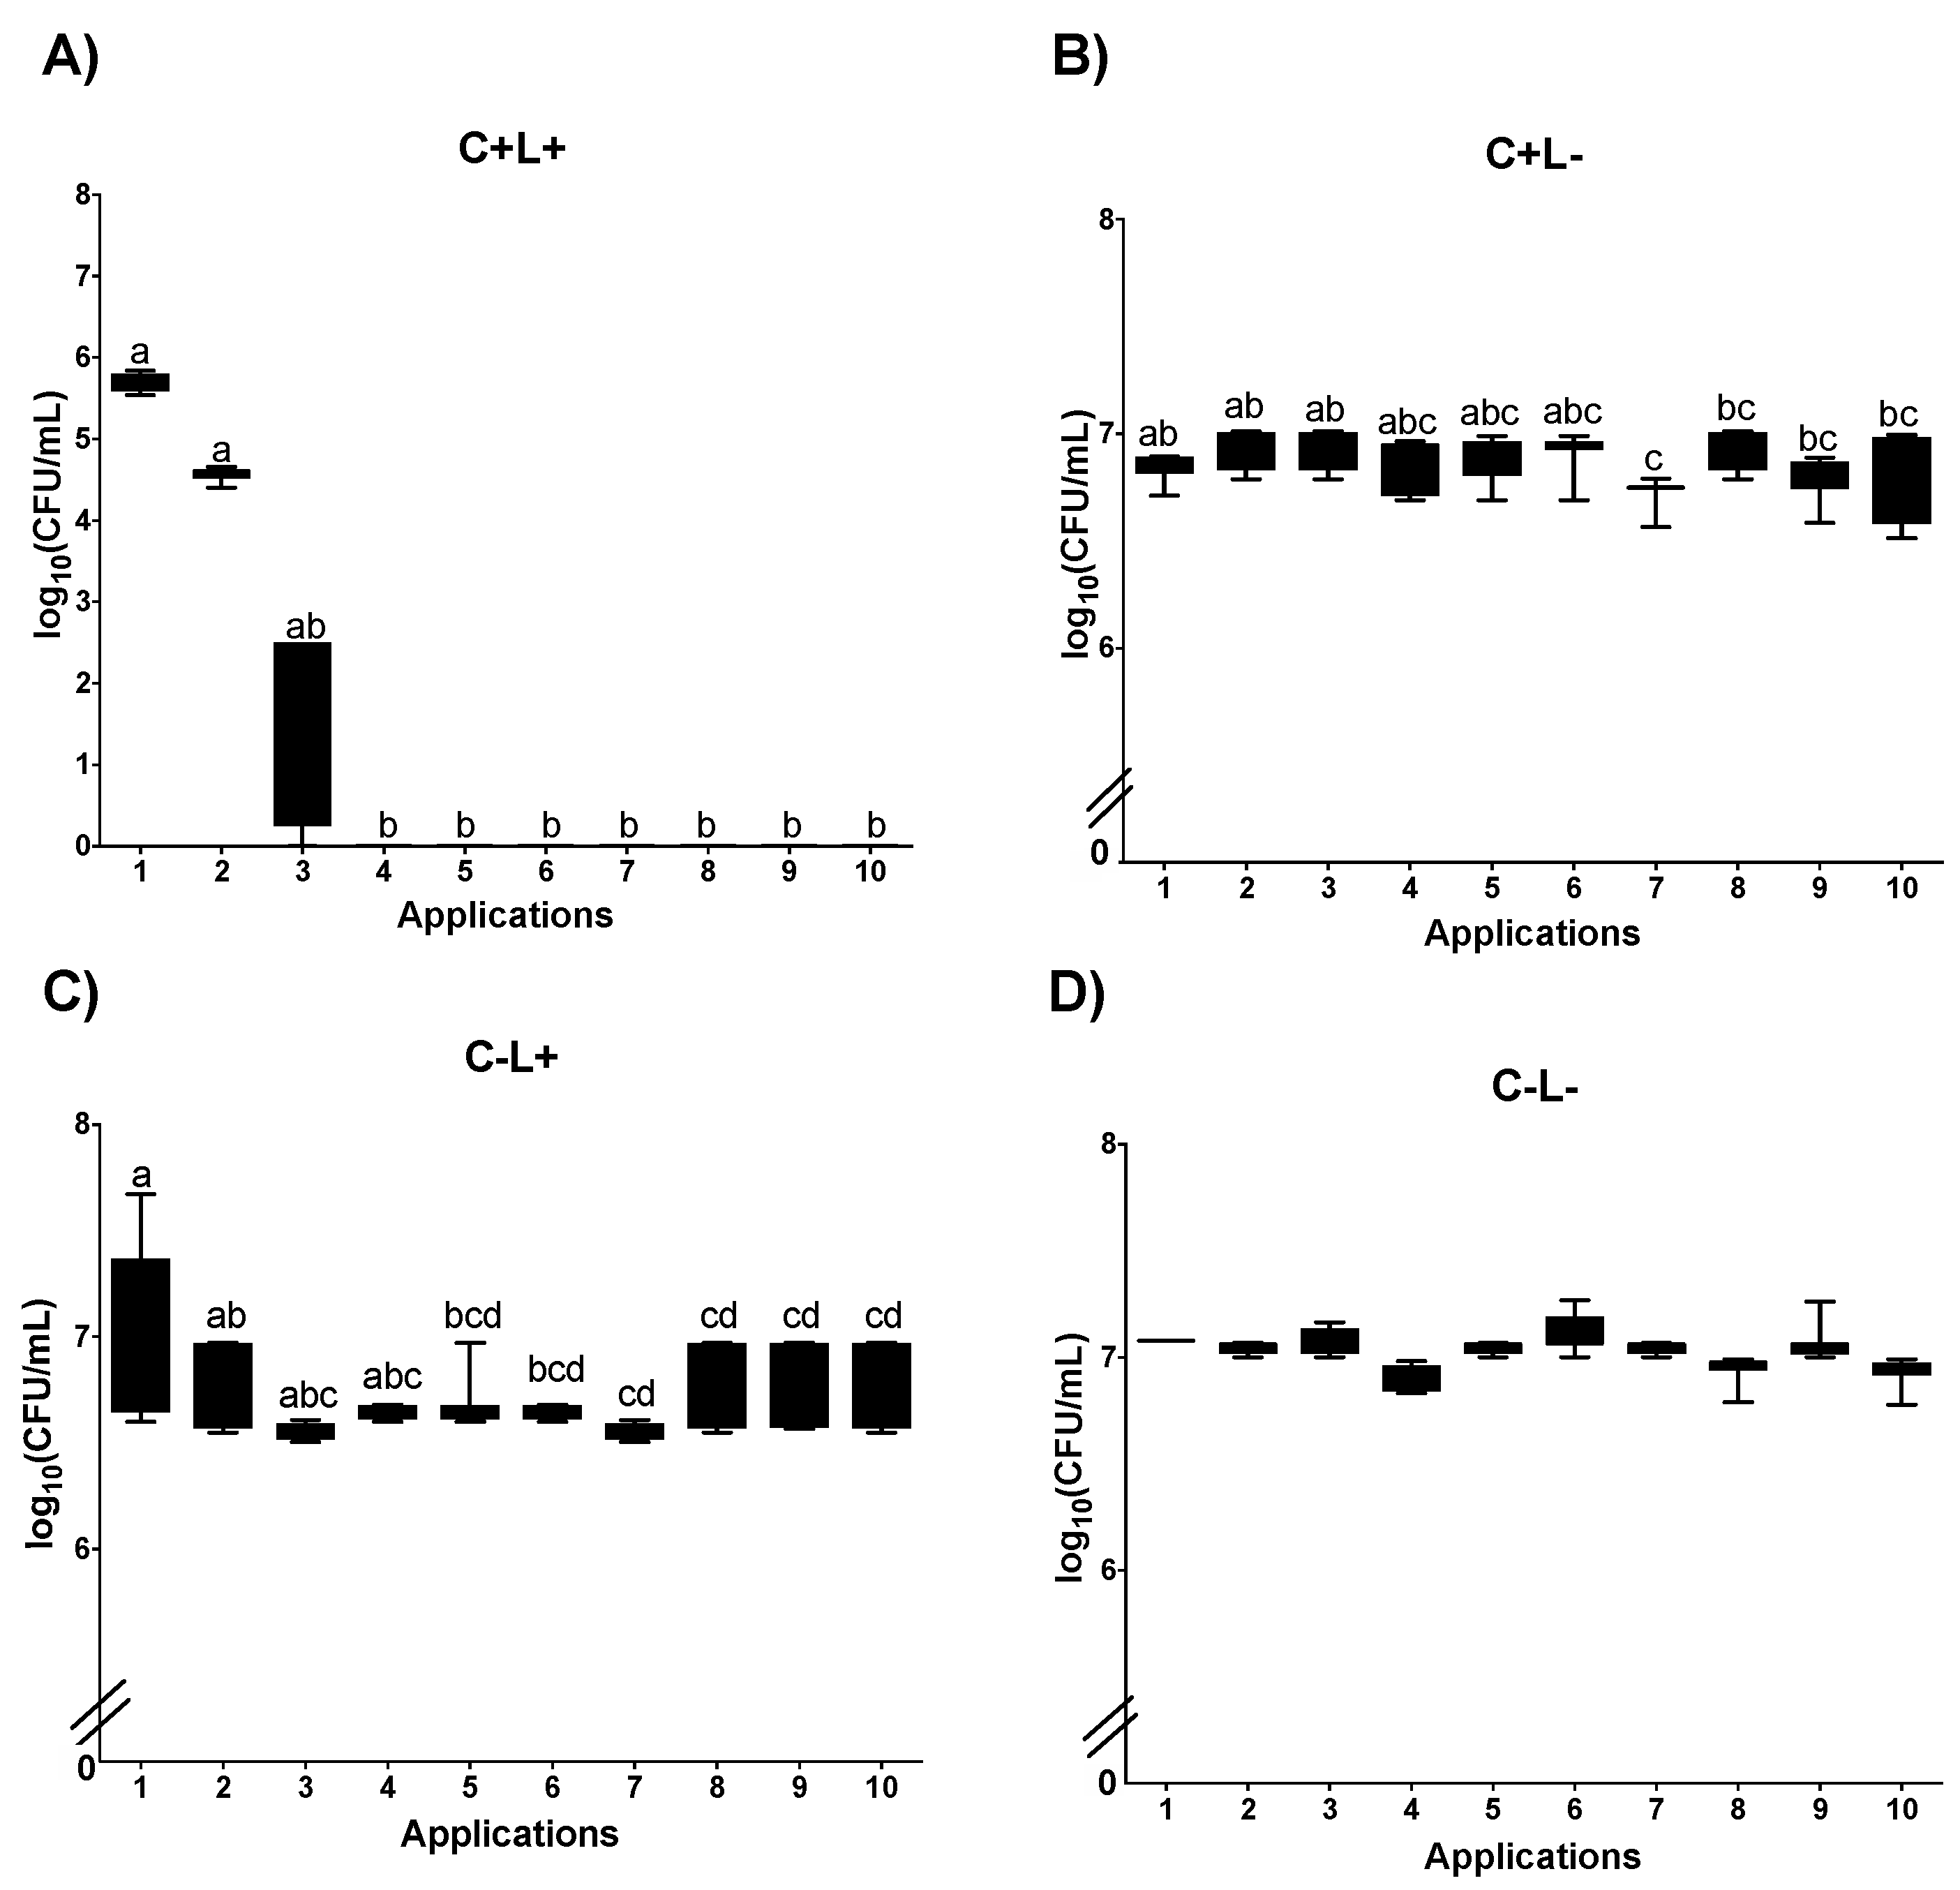
3.1. Cell Viability
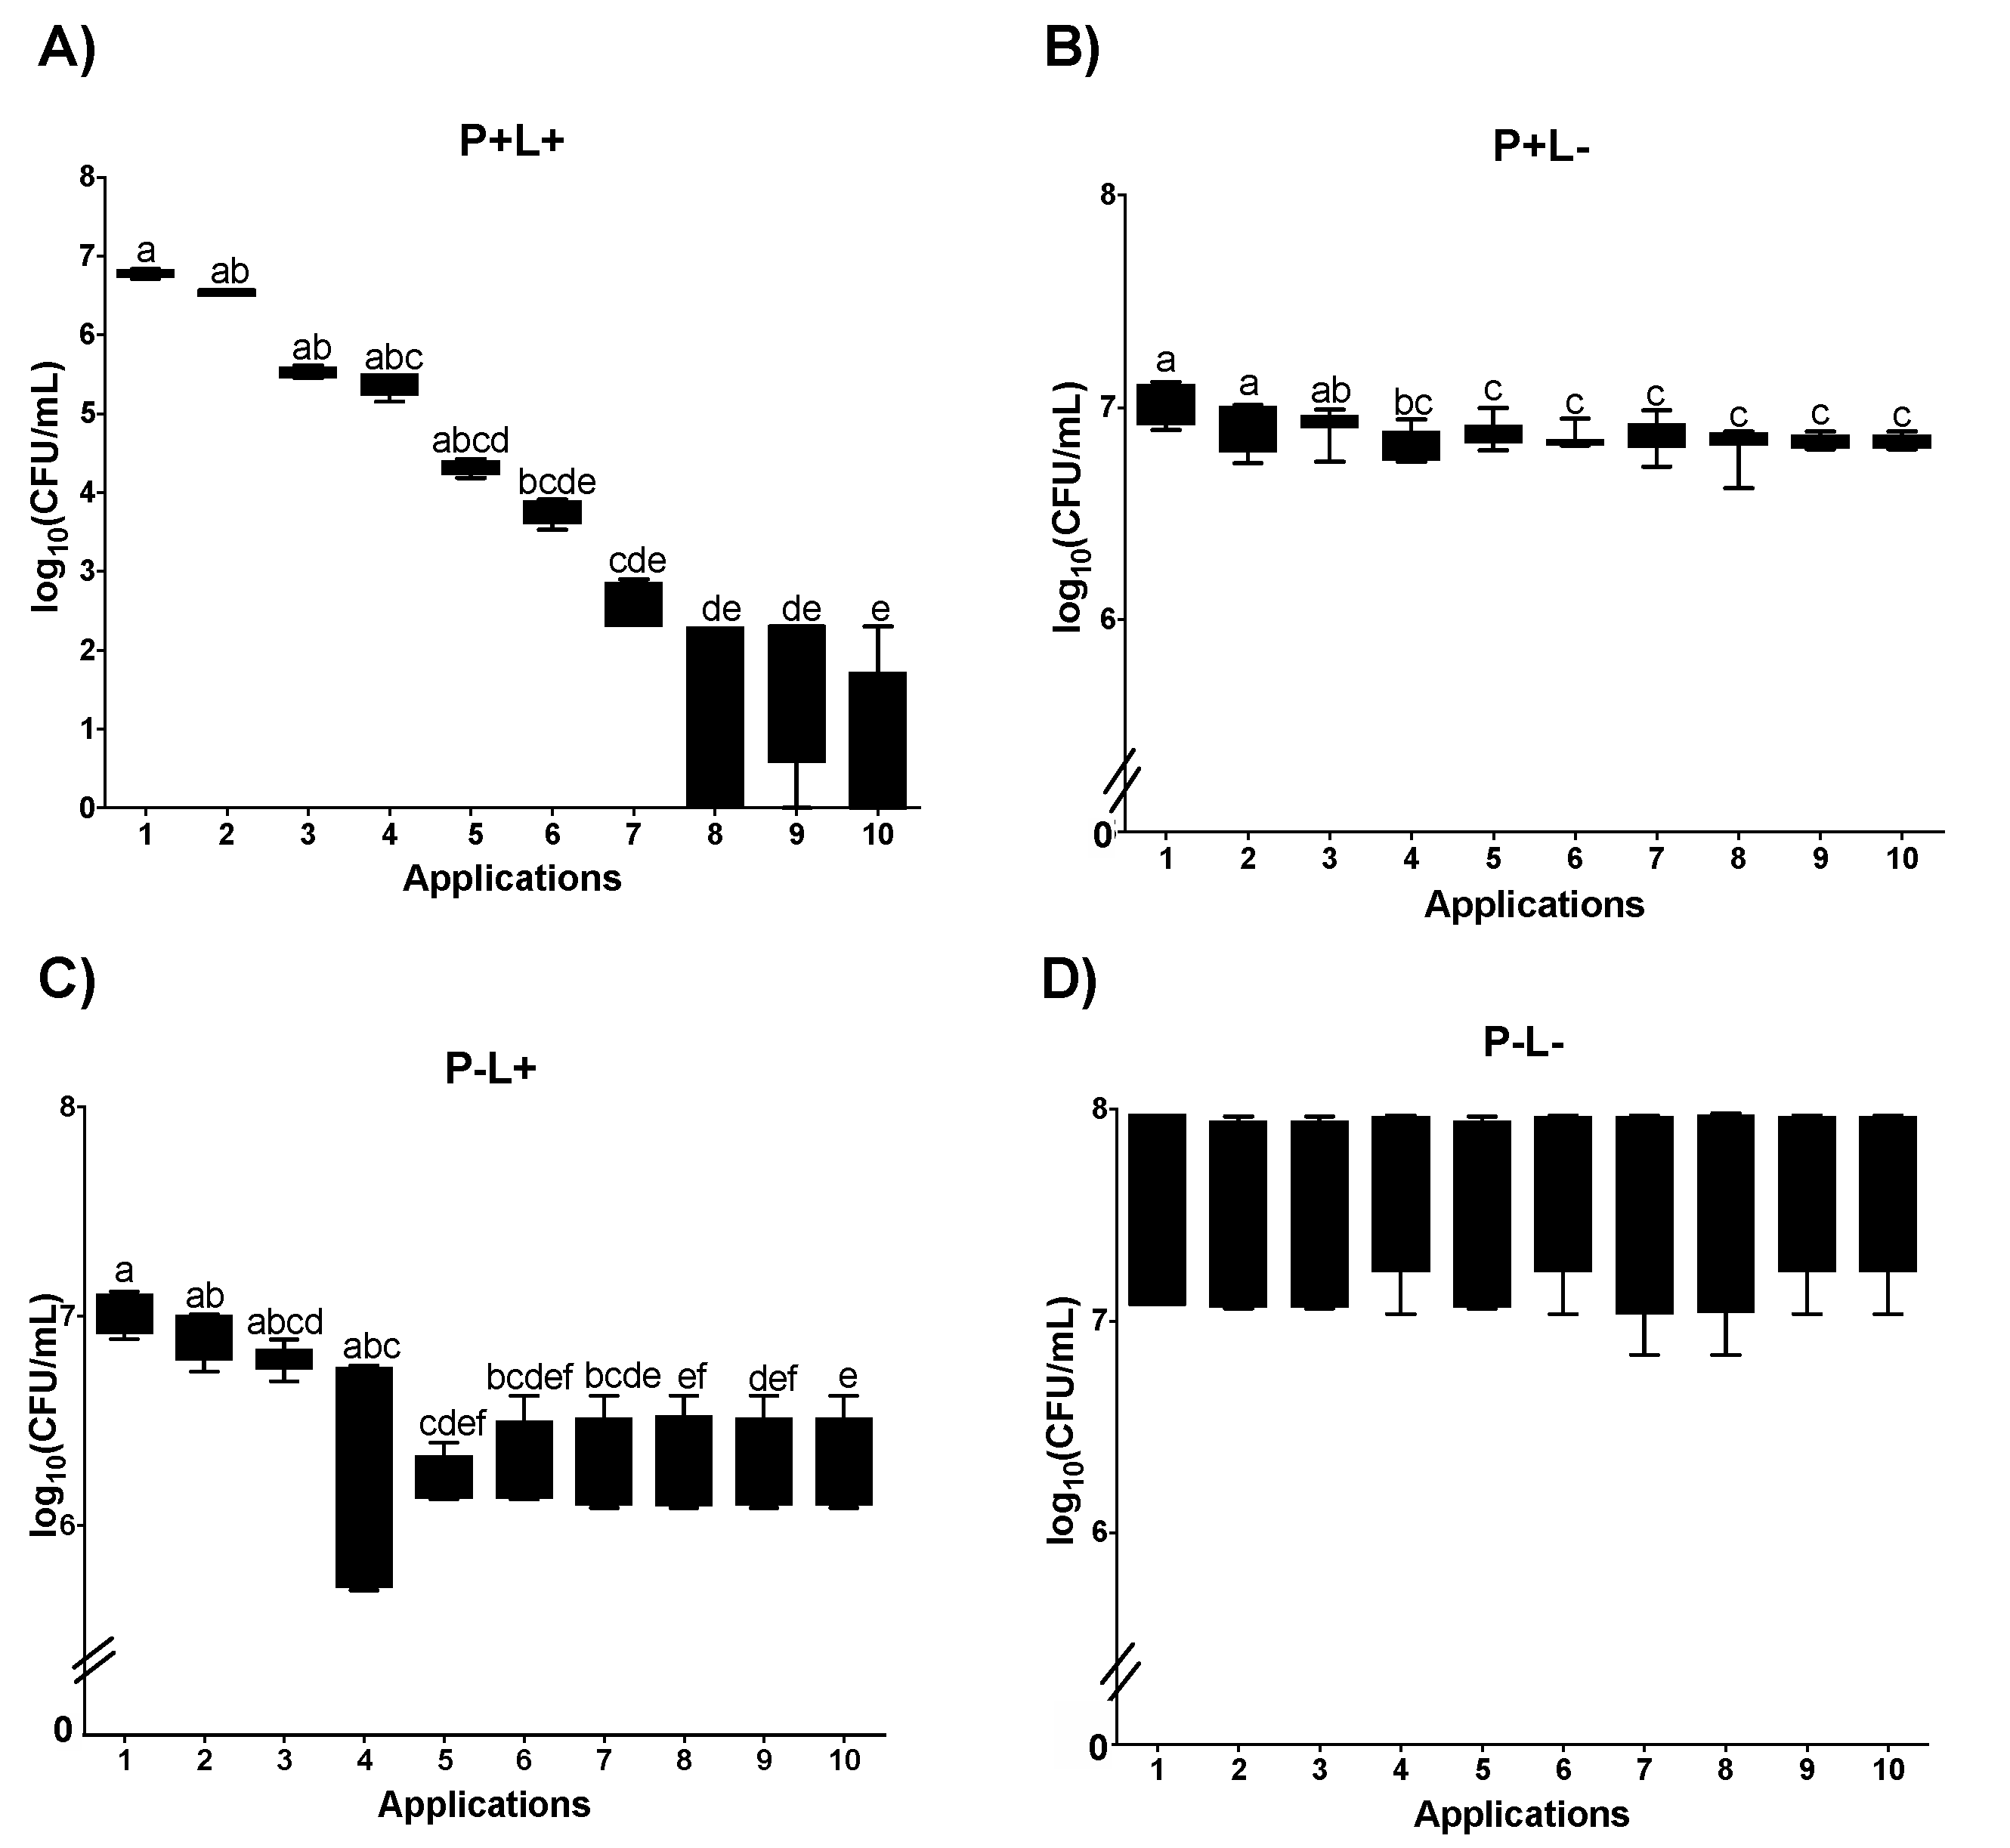
3.1.1. Cell Viability of Candida albicans in the Planktonic Phase
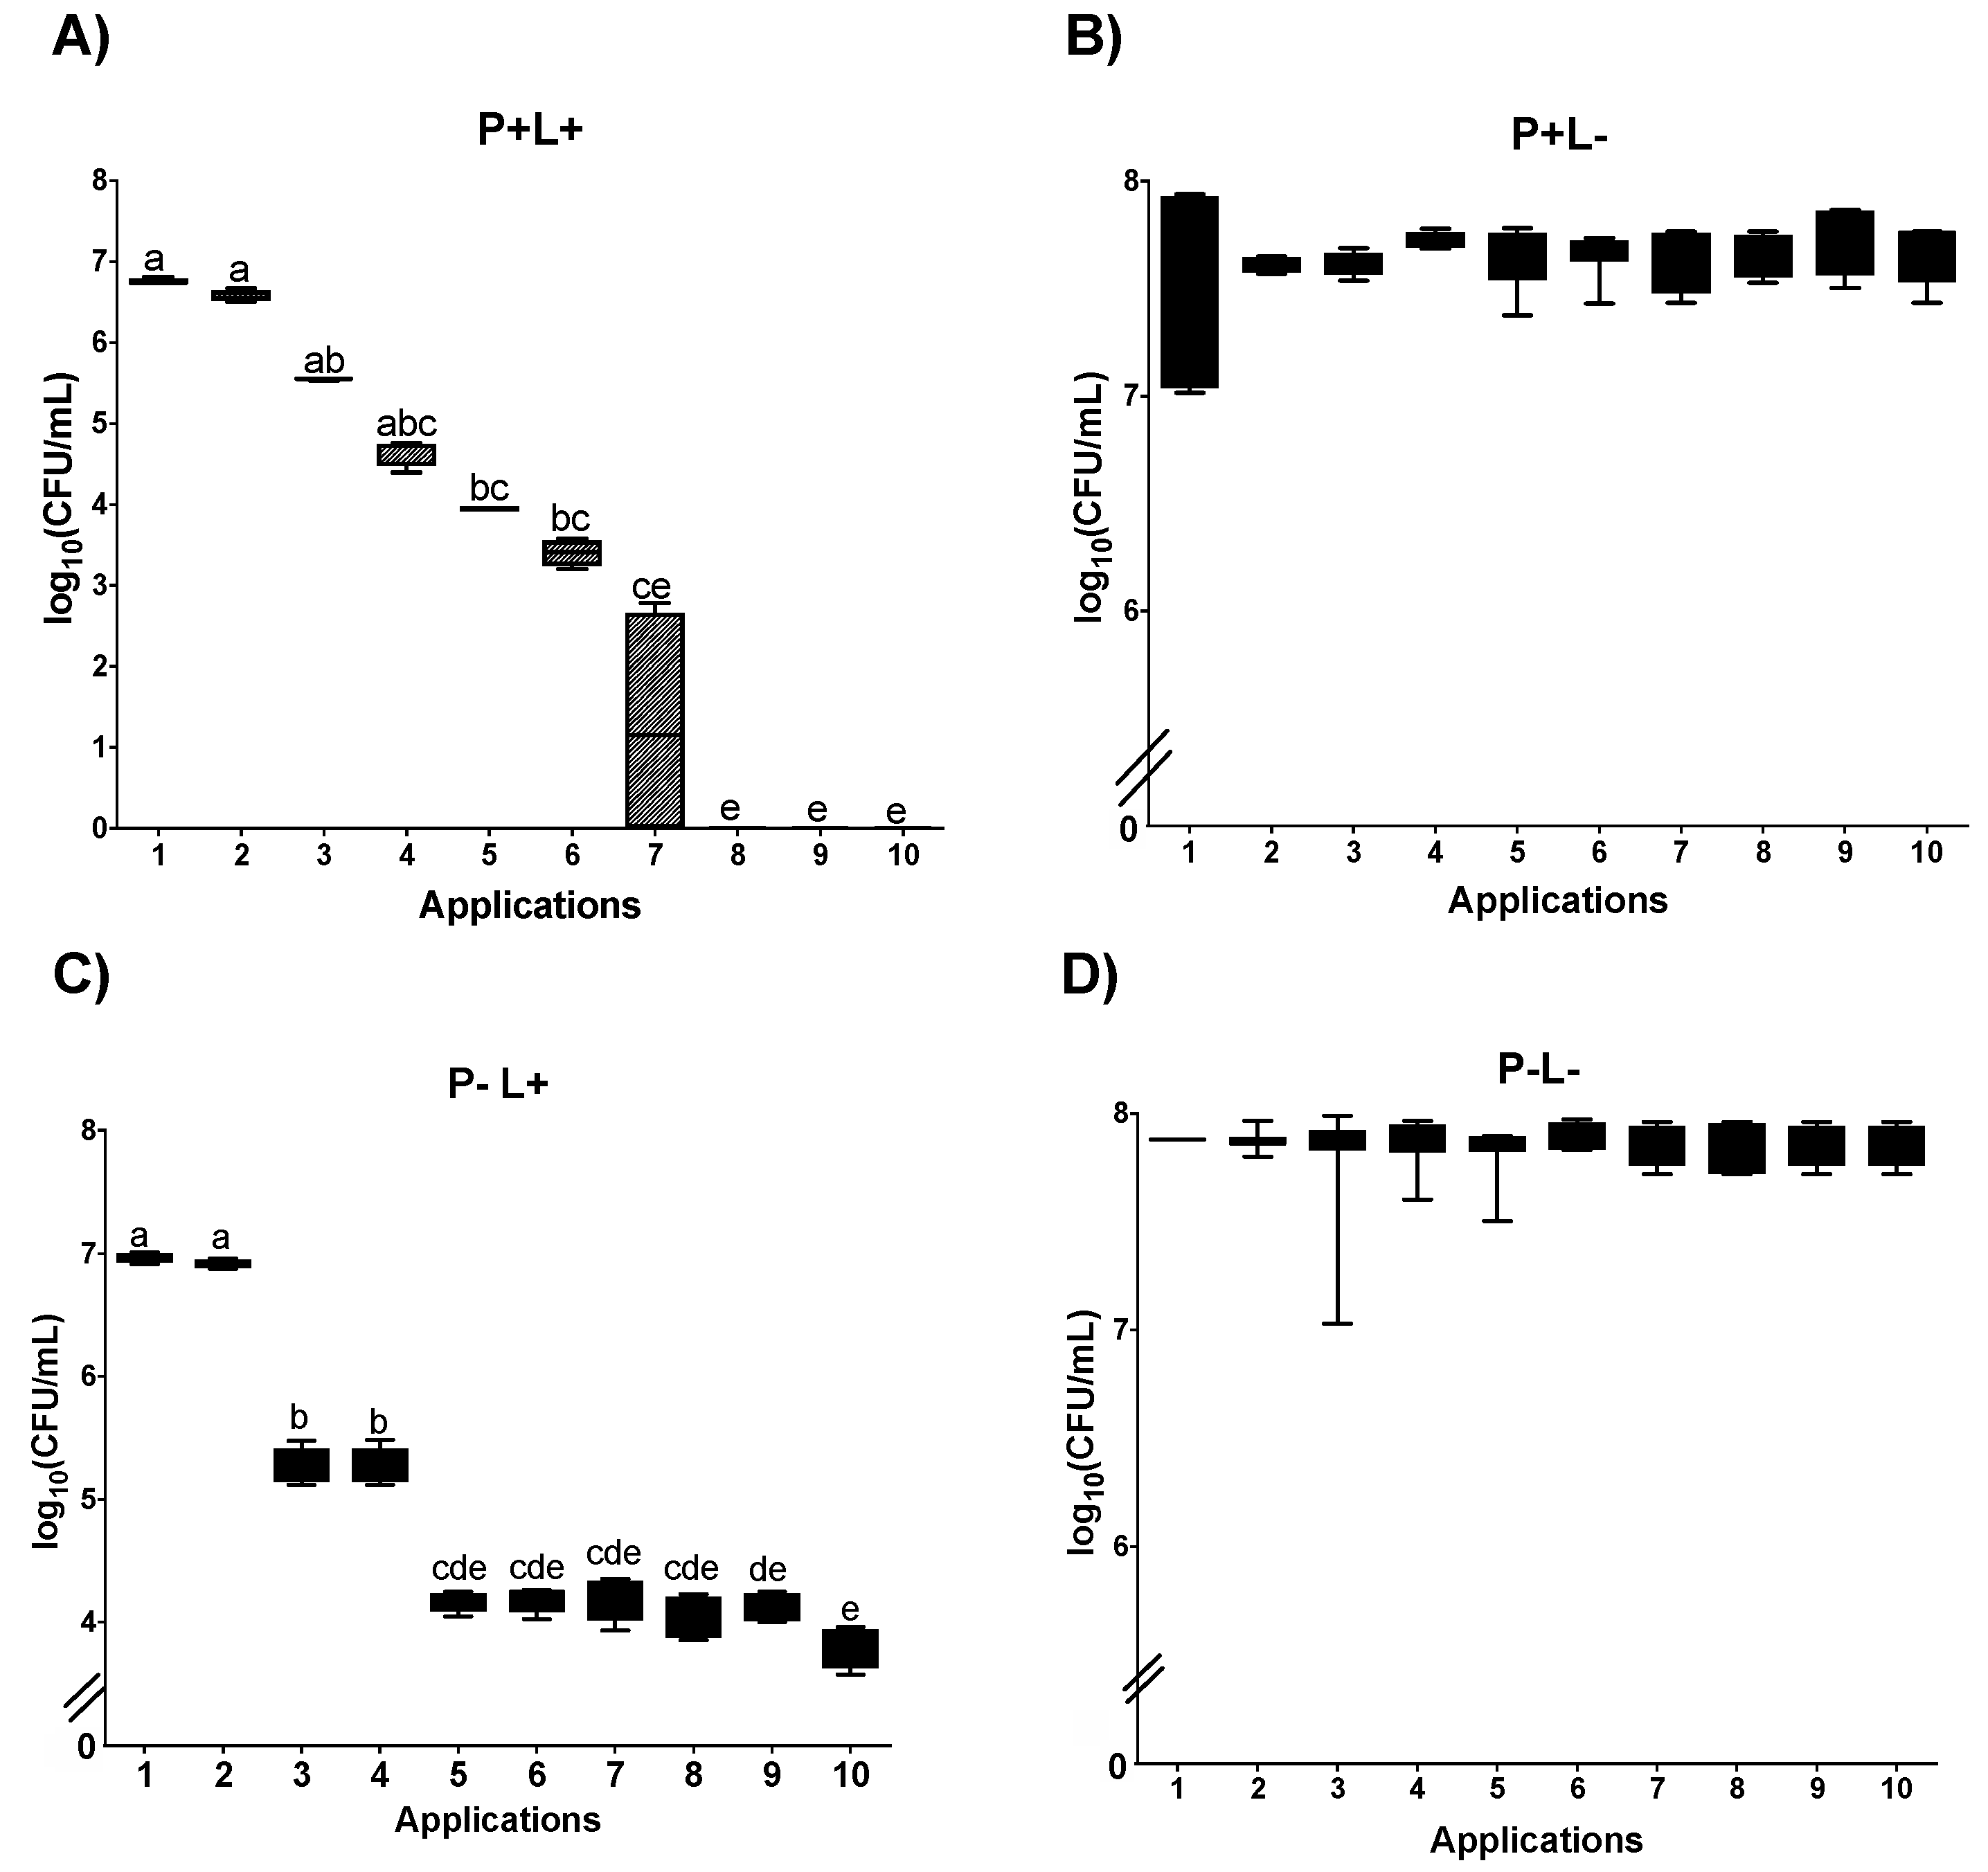
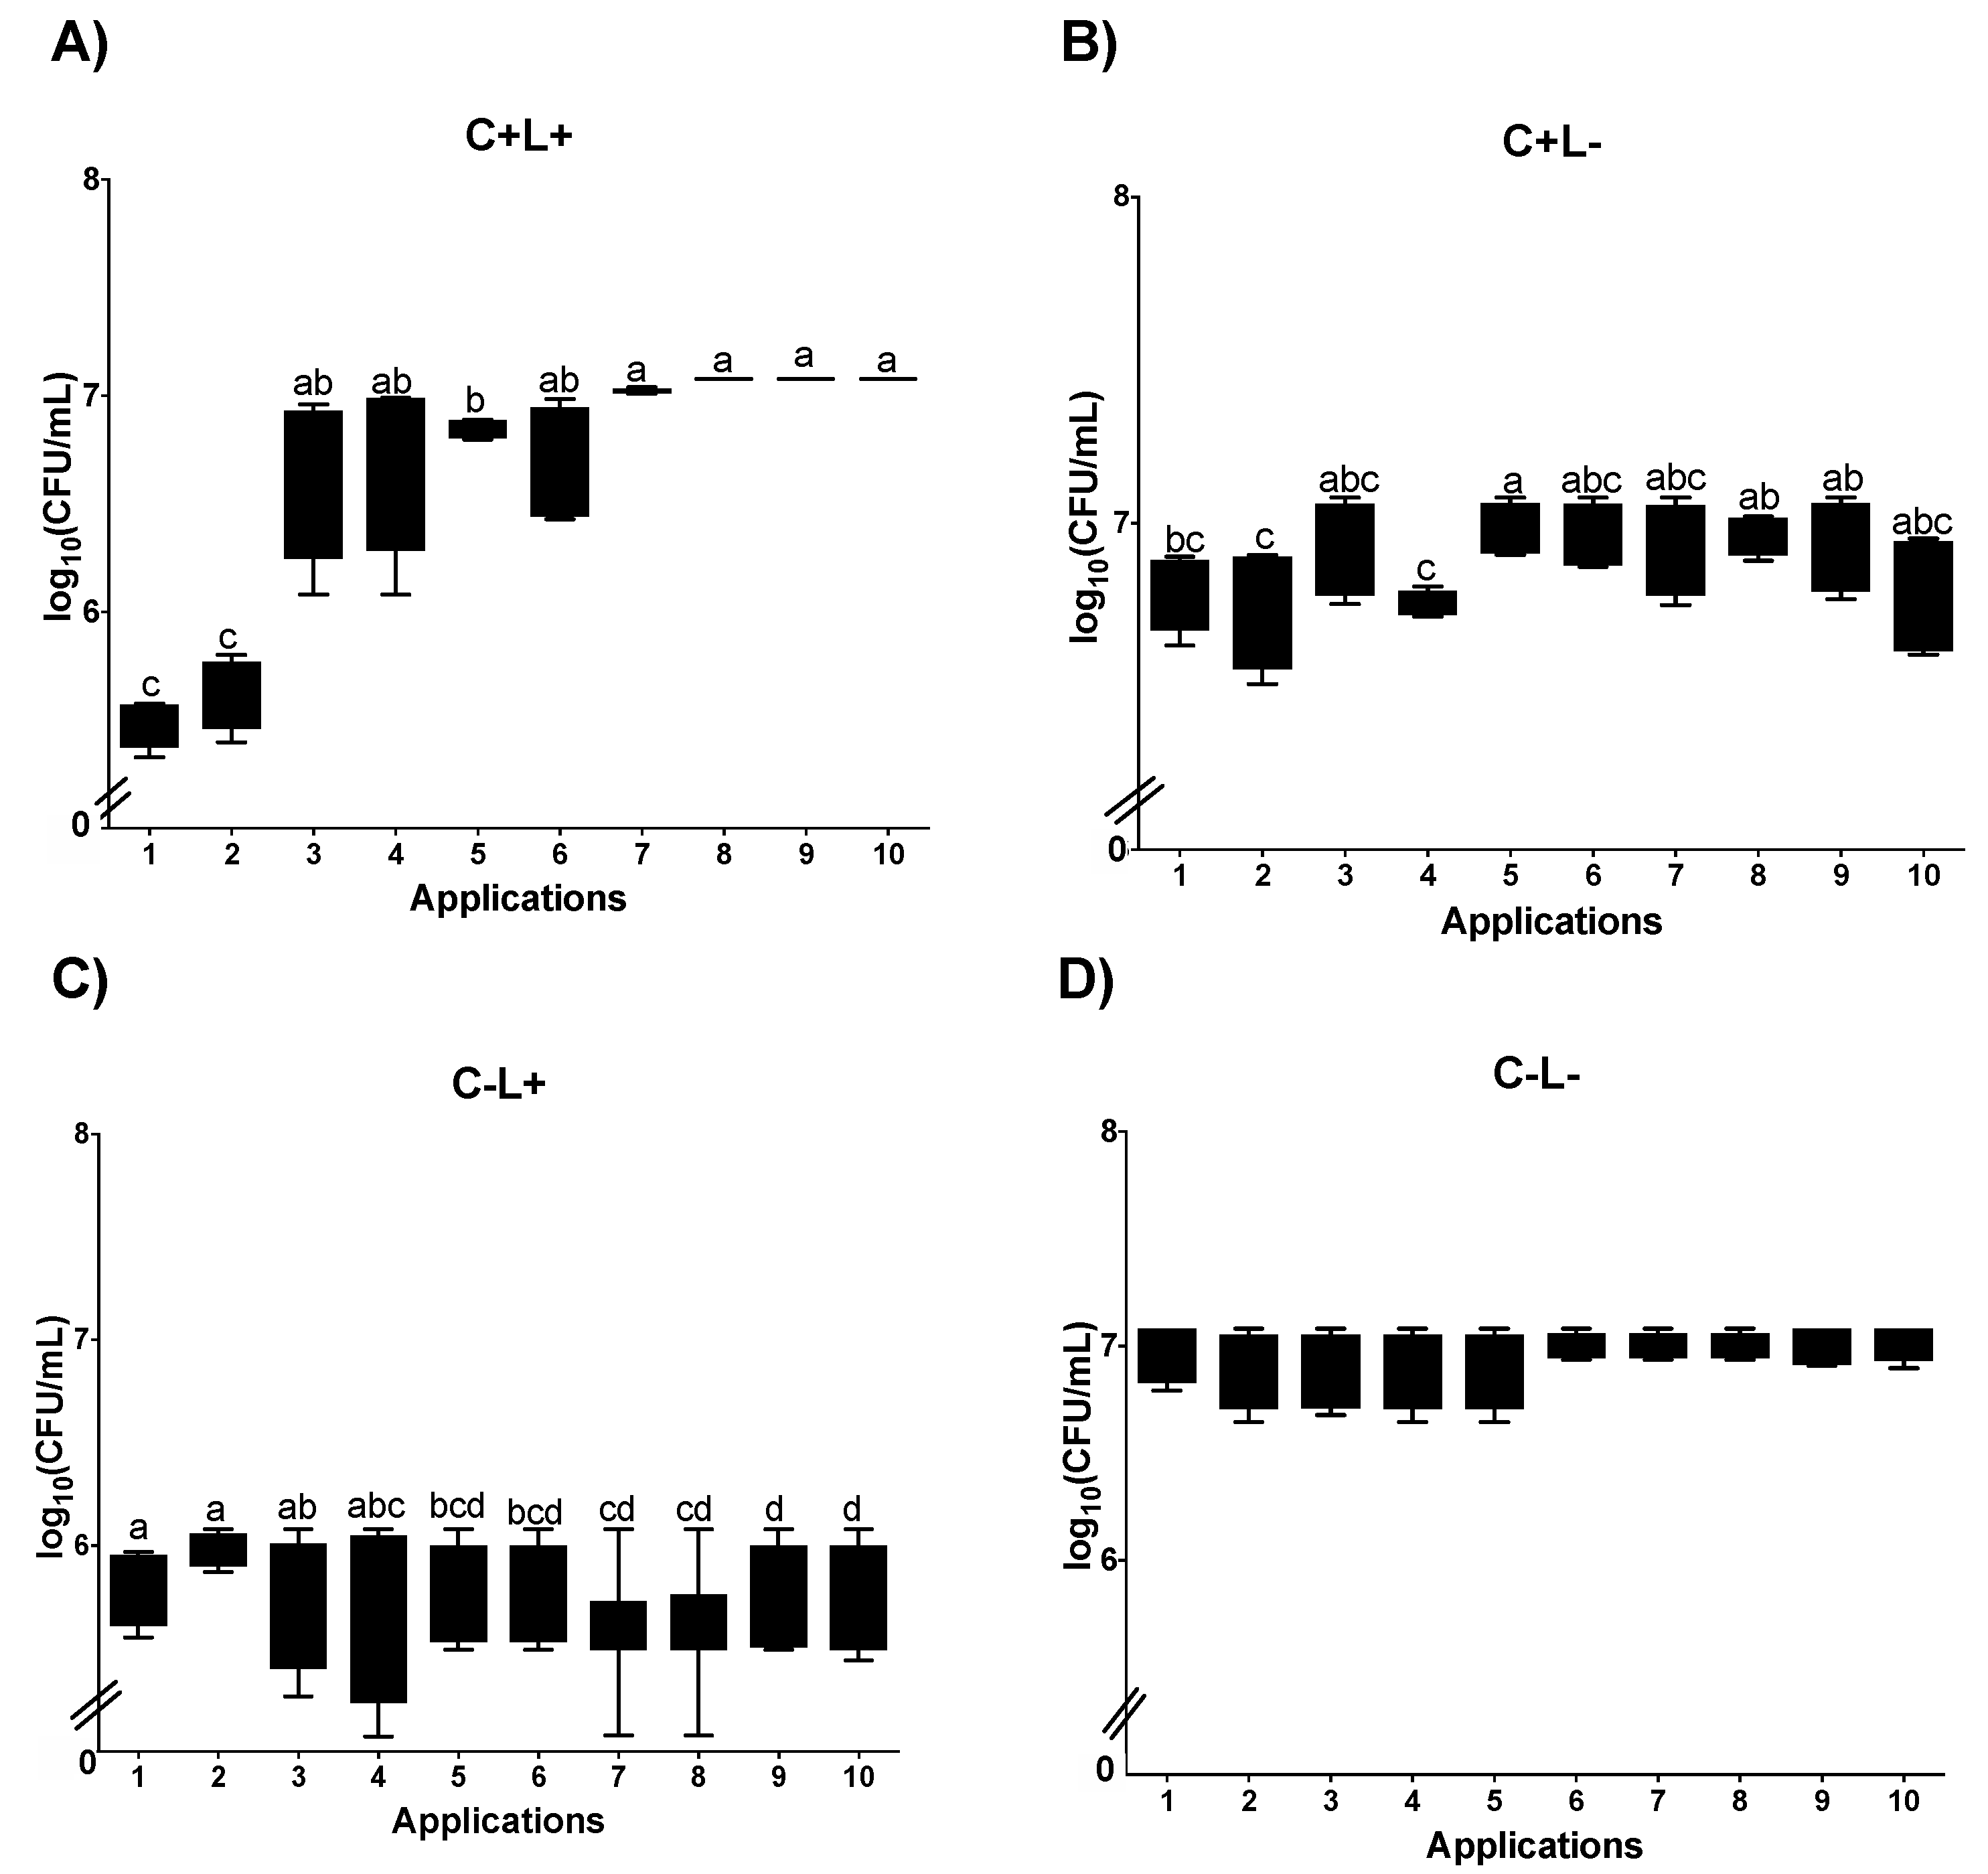
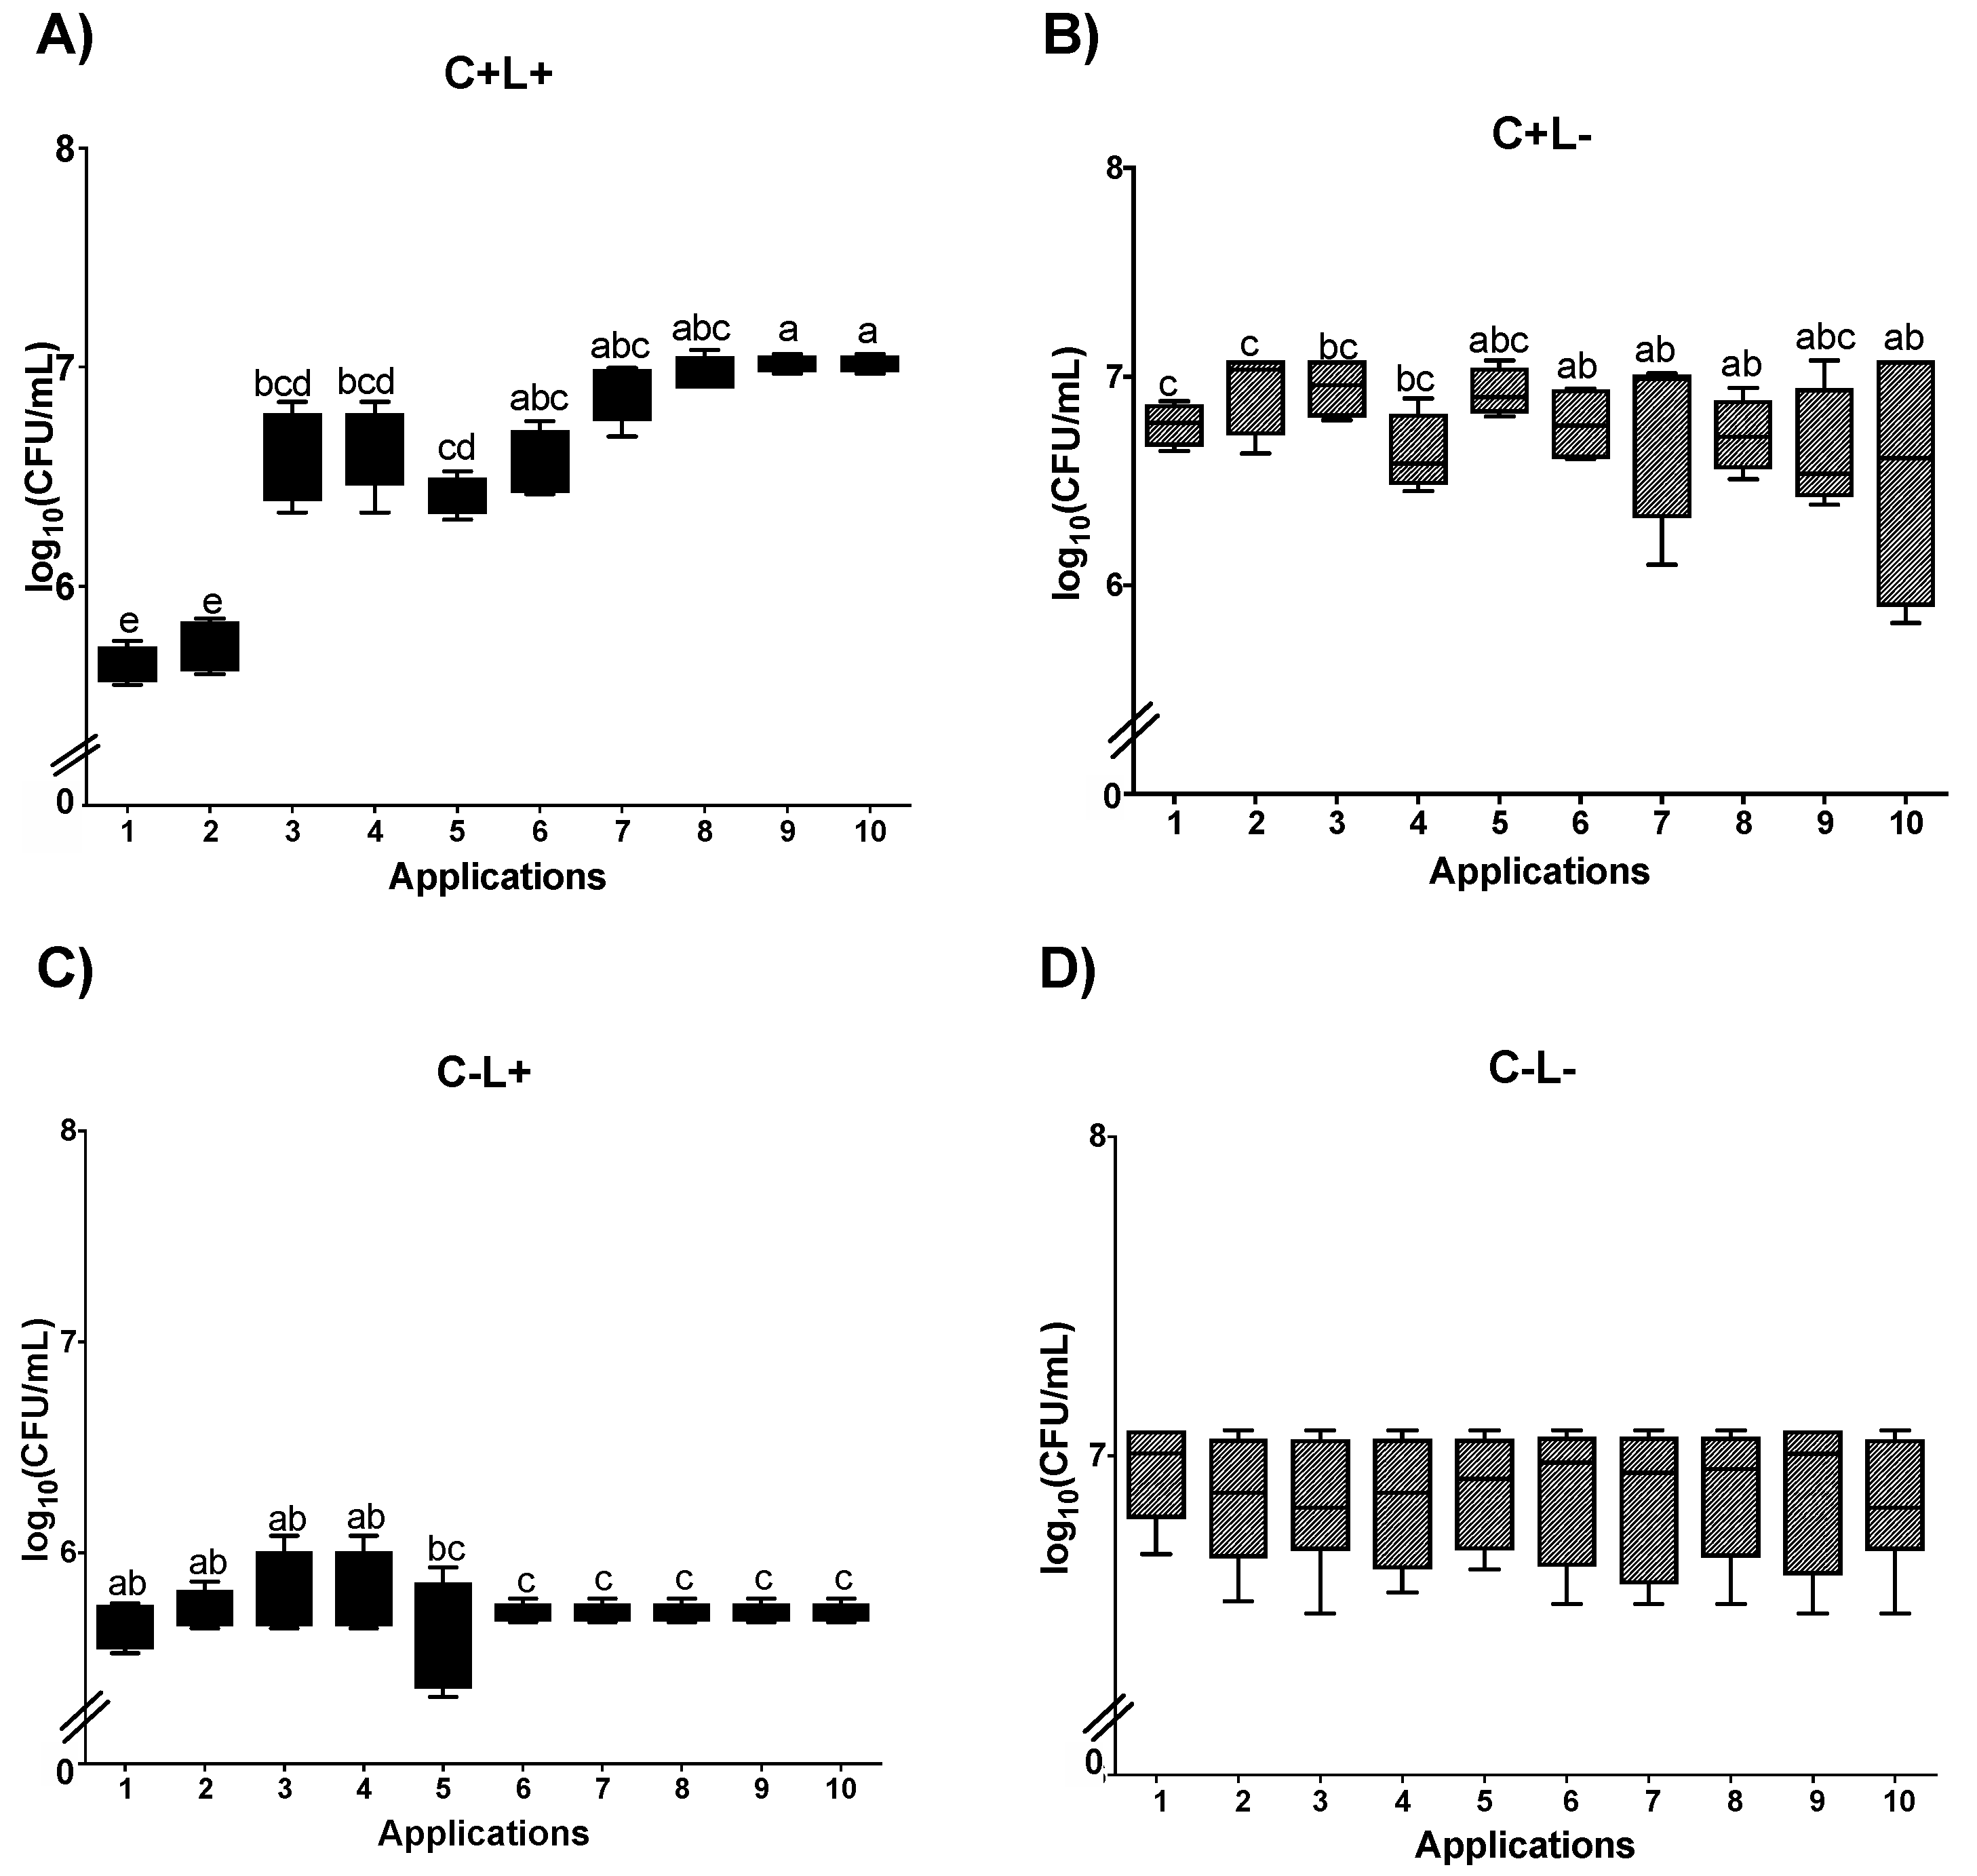
3.1.2. Cell Viability of C. albicans in Biofilm
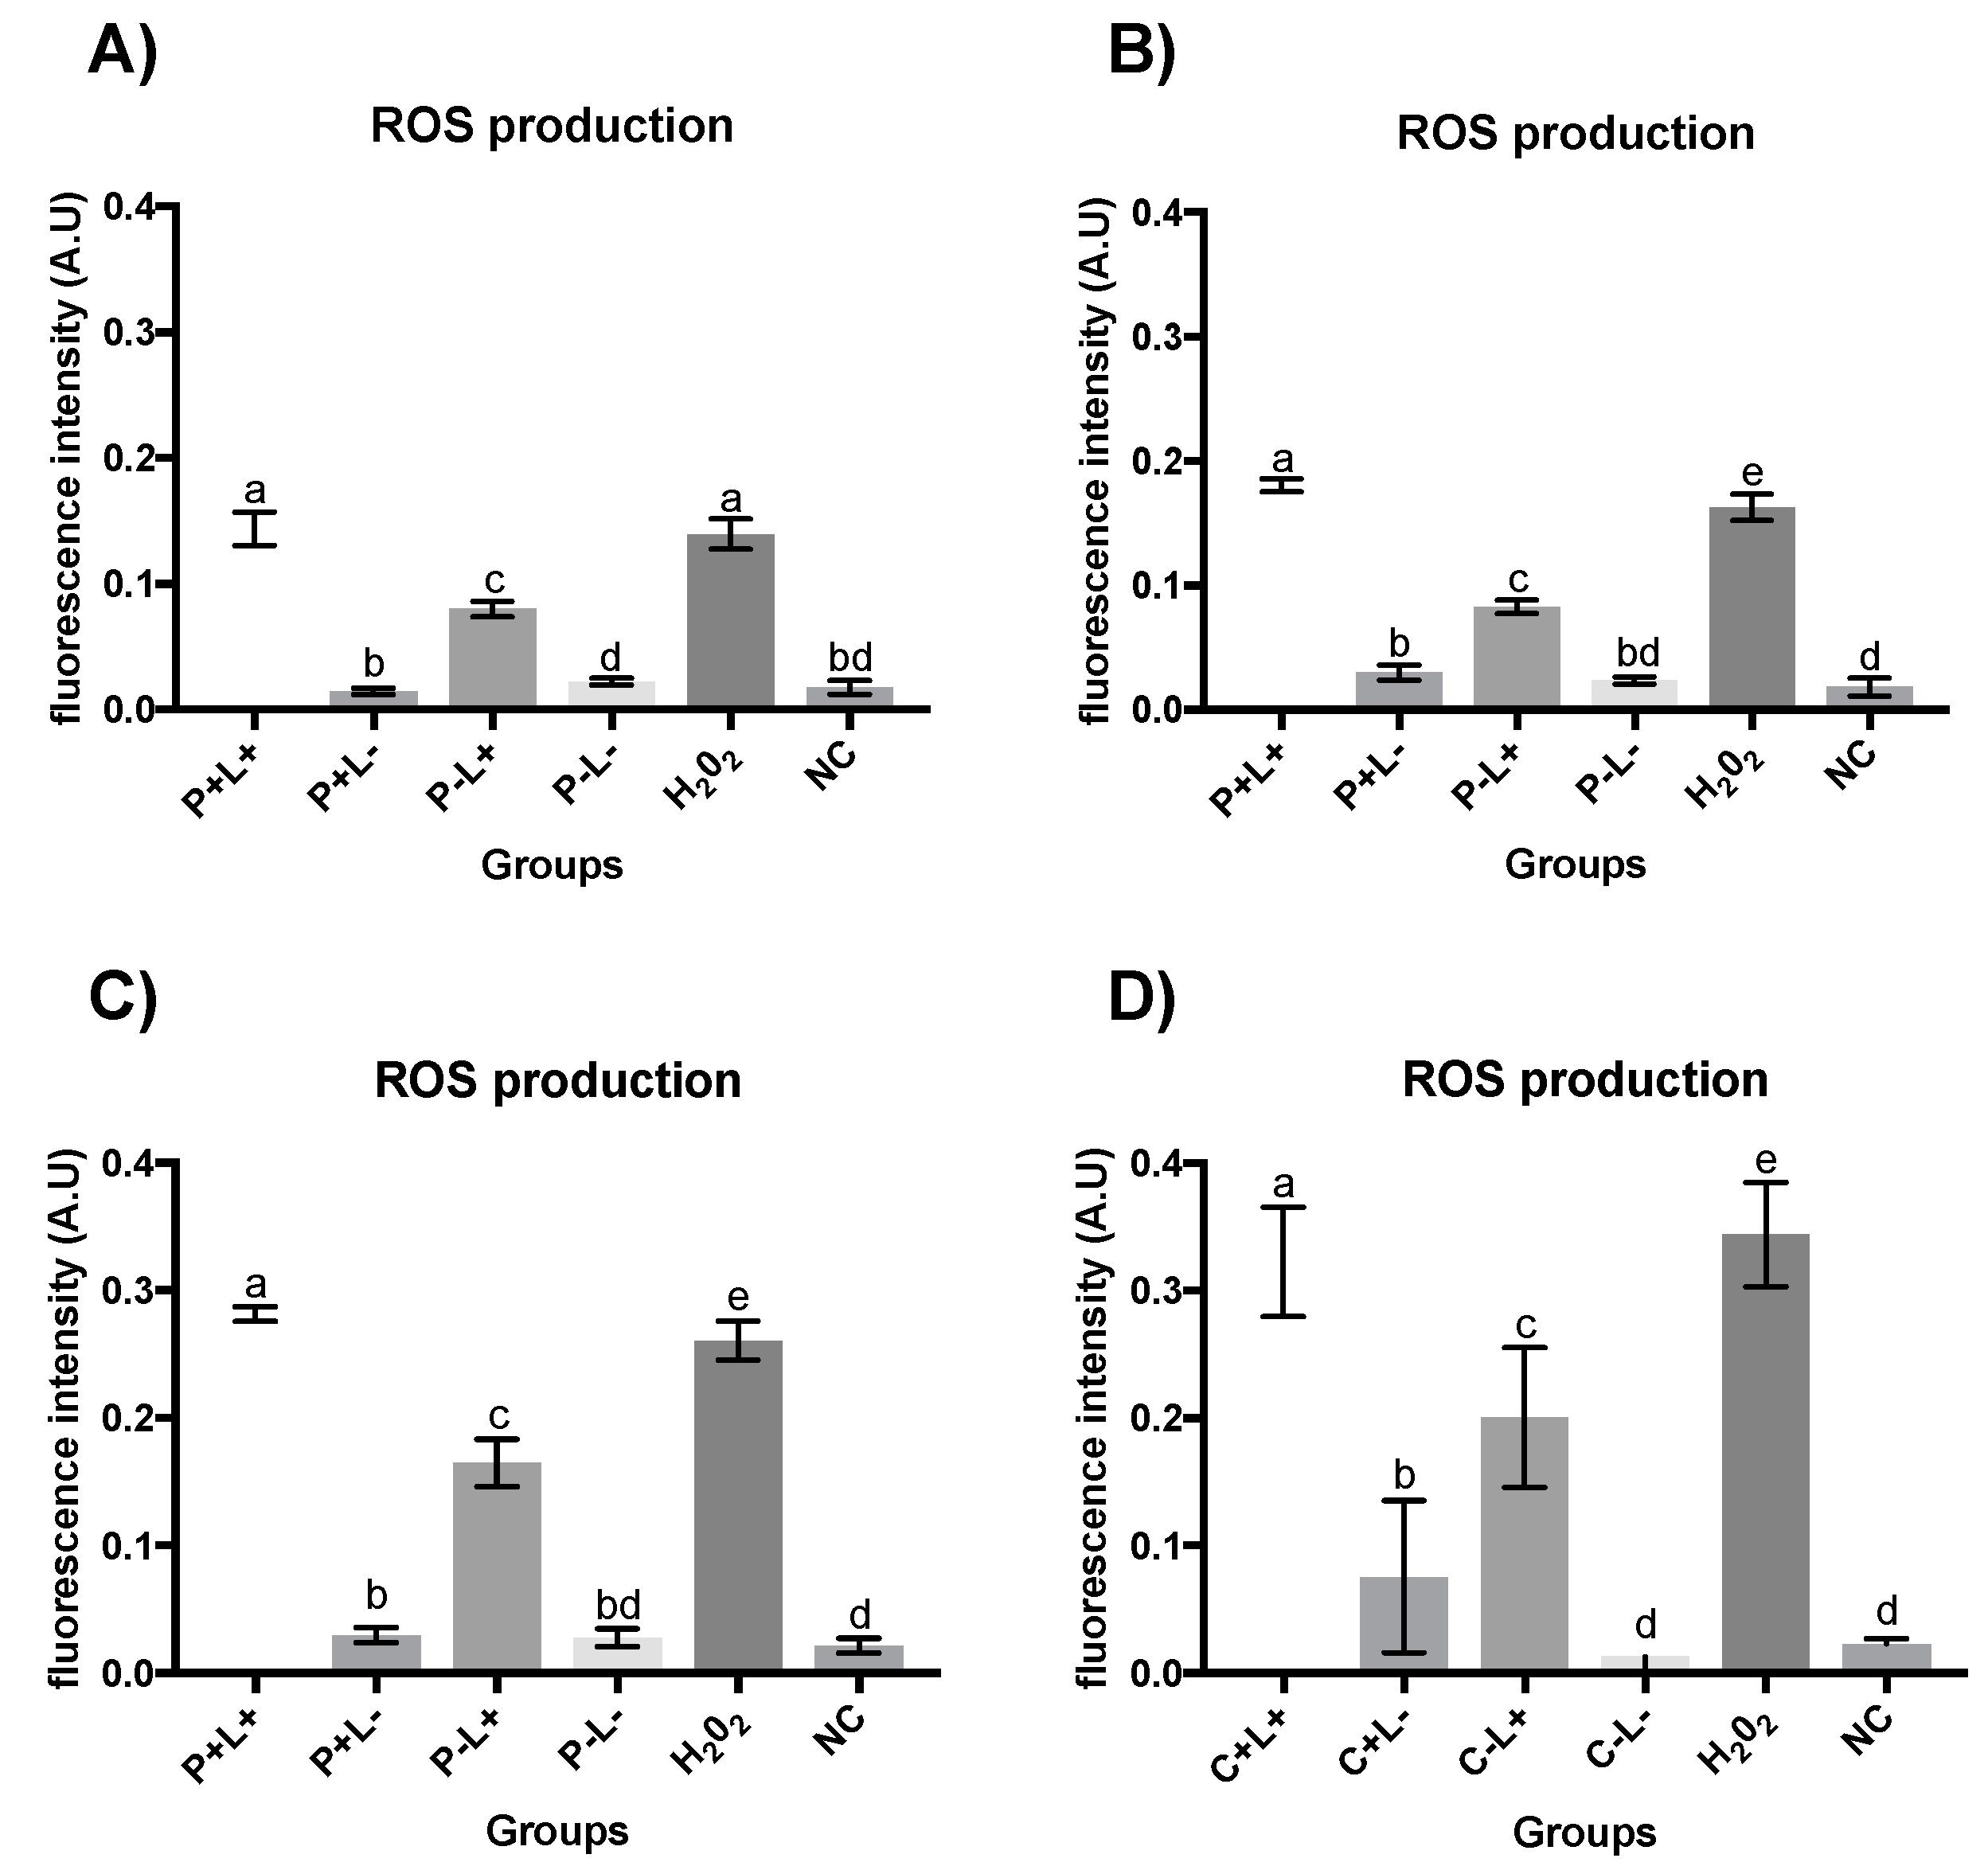
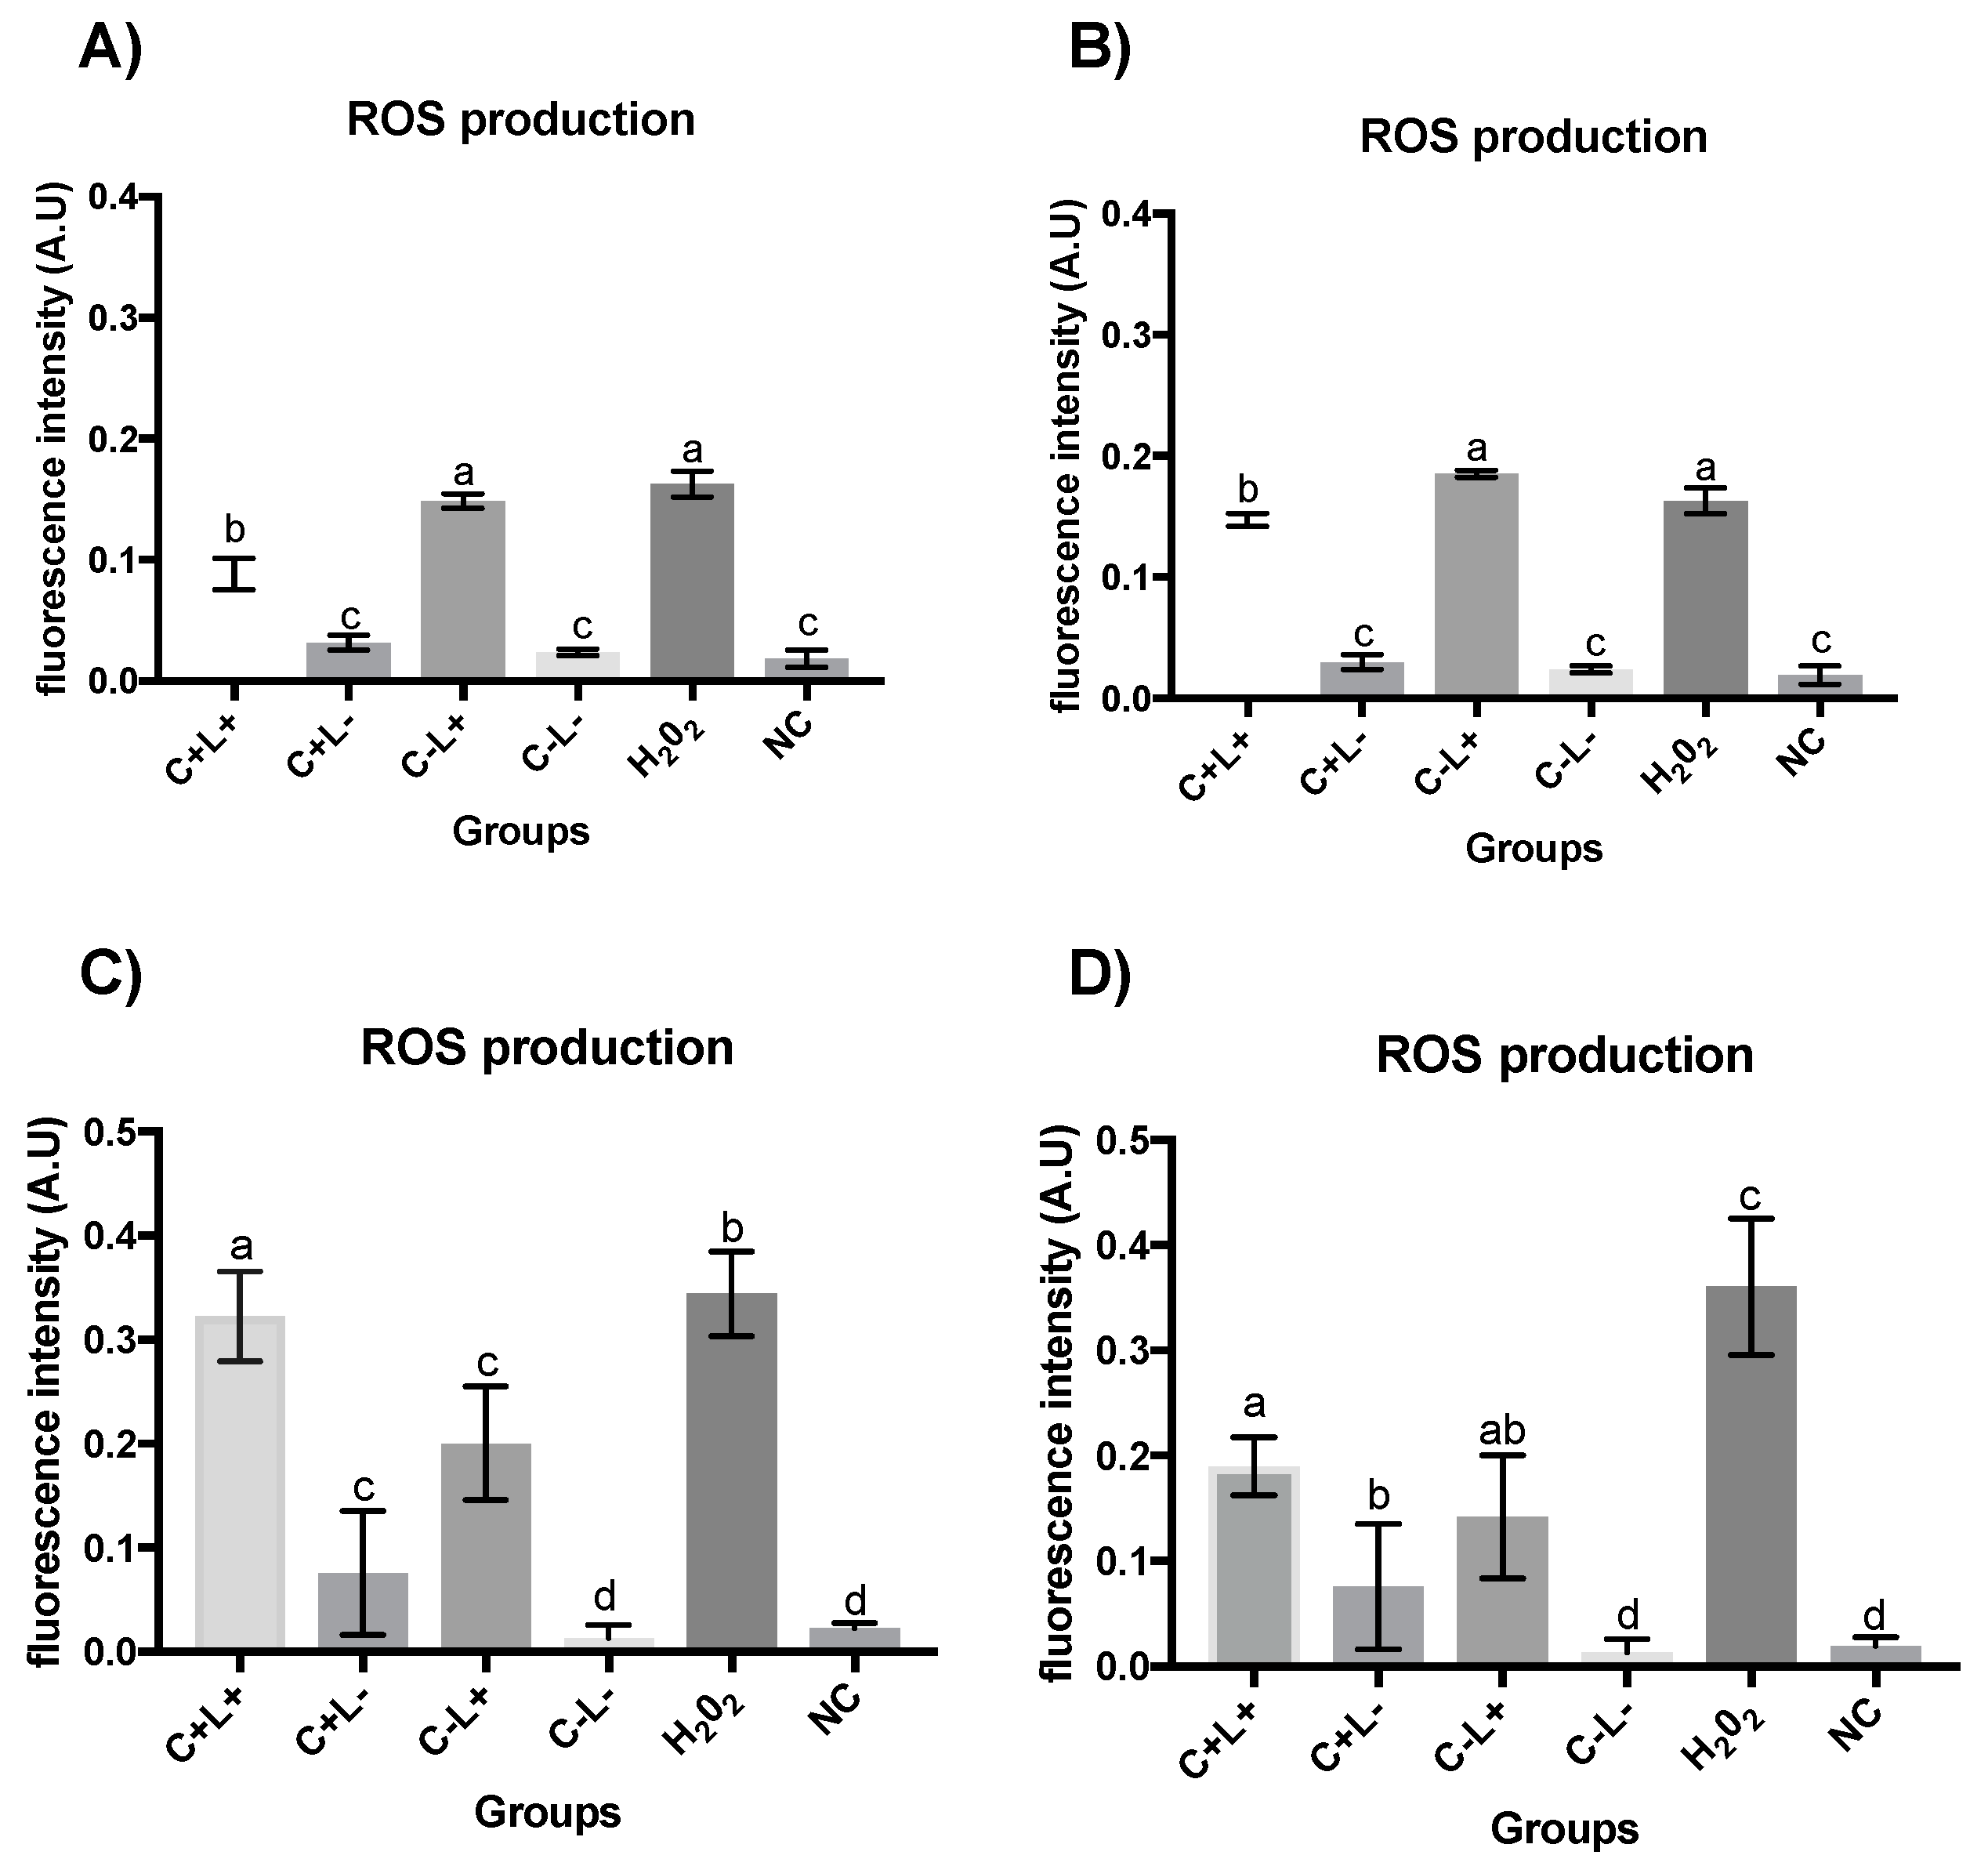
3.2. Quantification of ROS
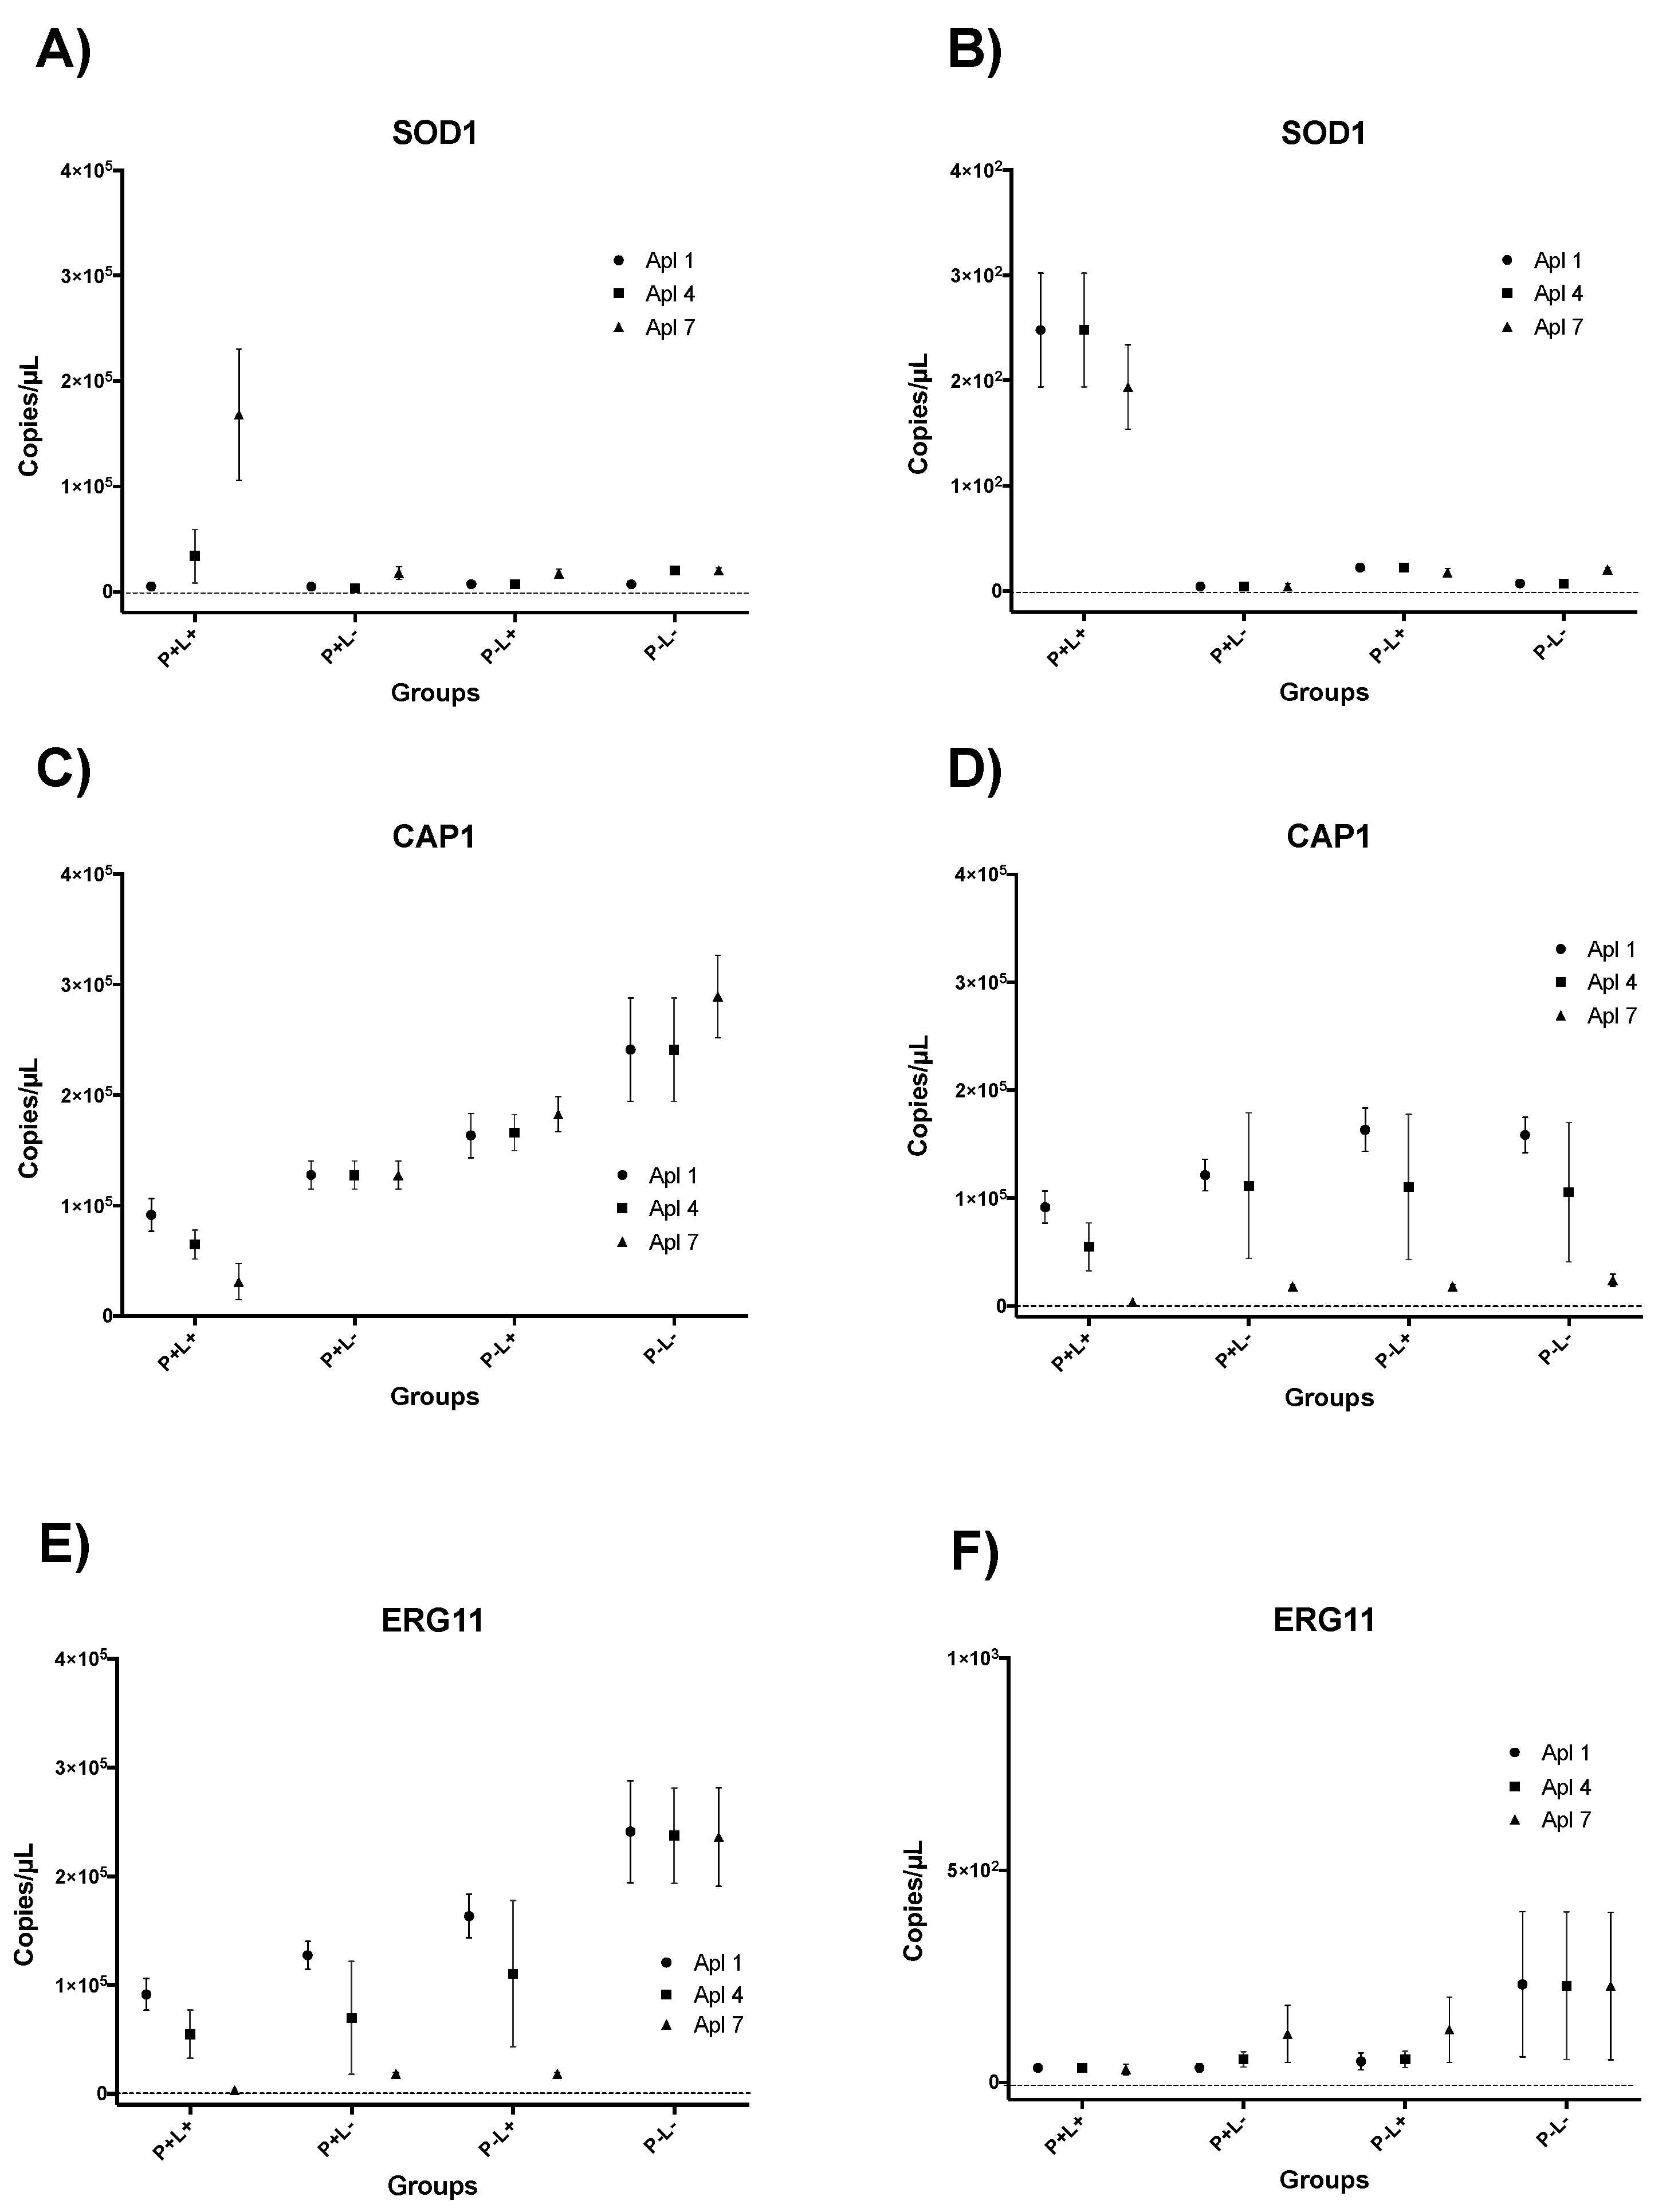
3.3. Results of RT-qPCR for aPDT Mediated by PDZ
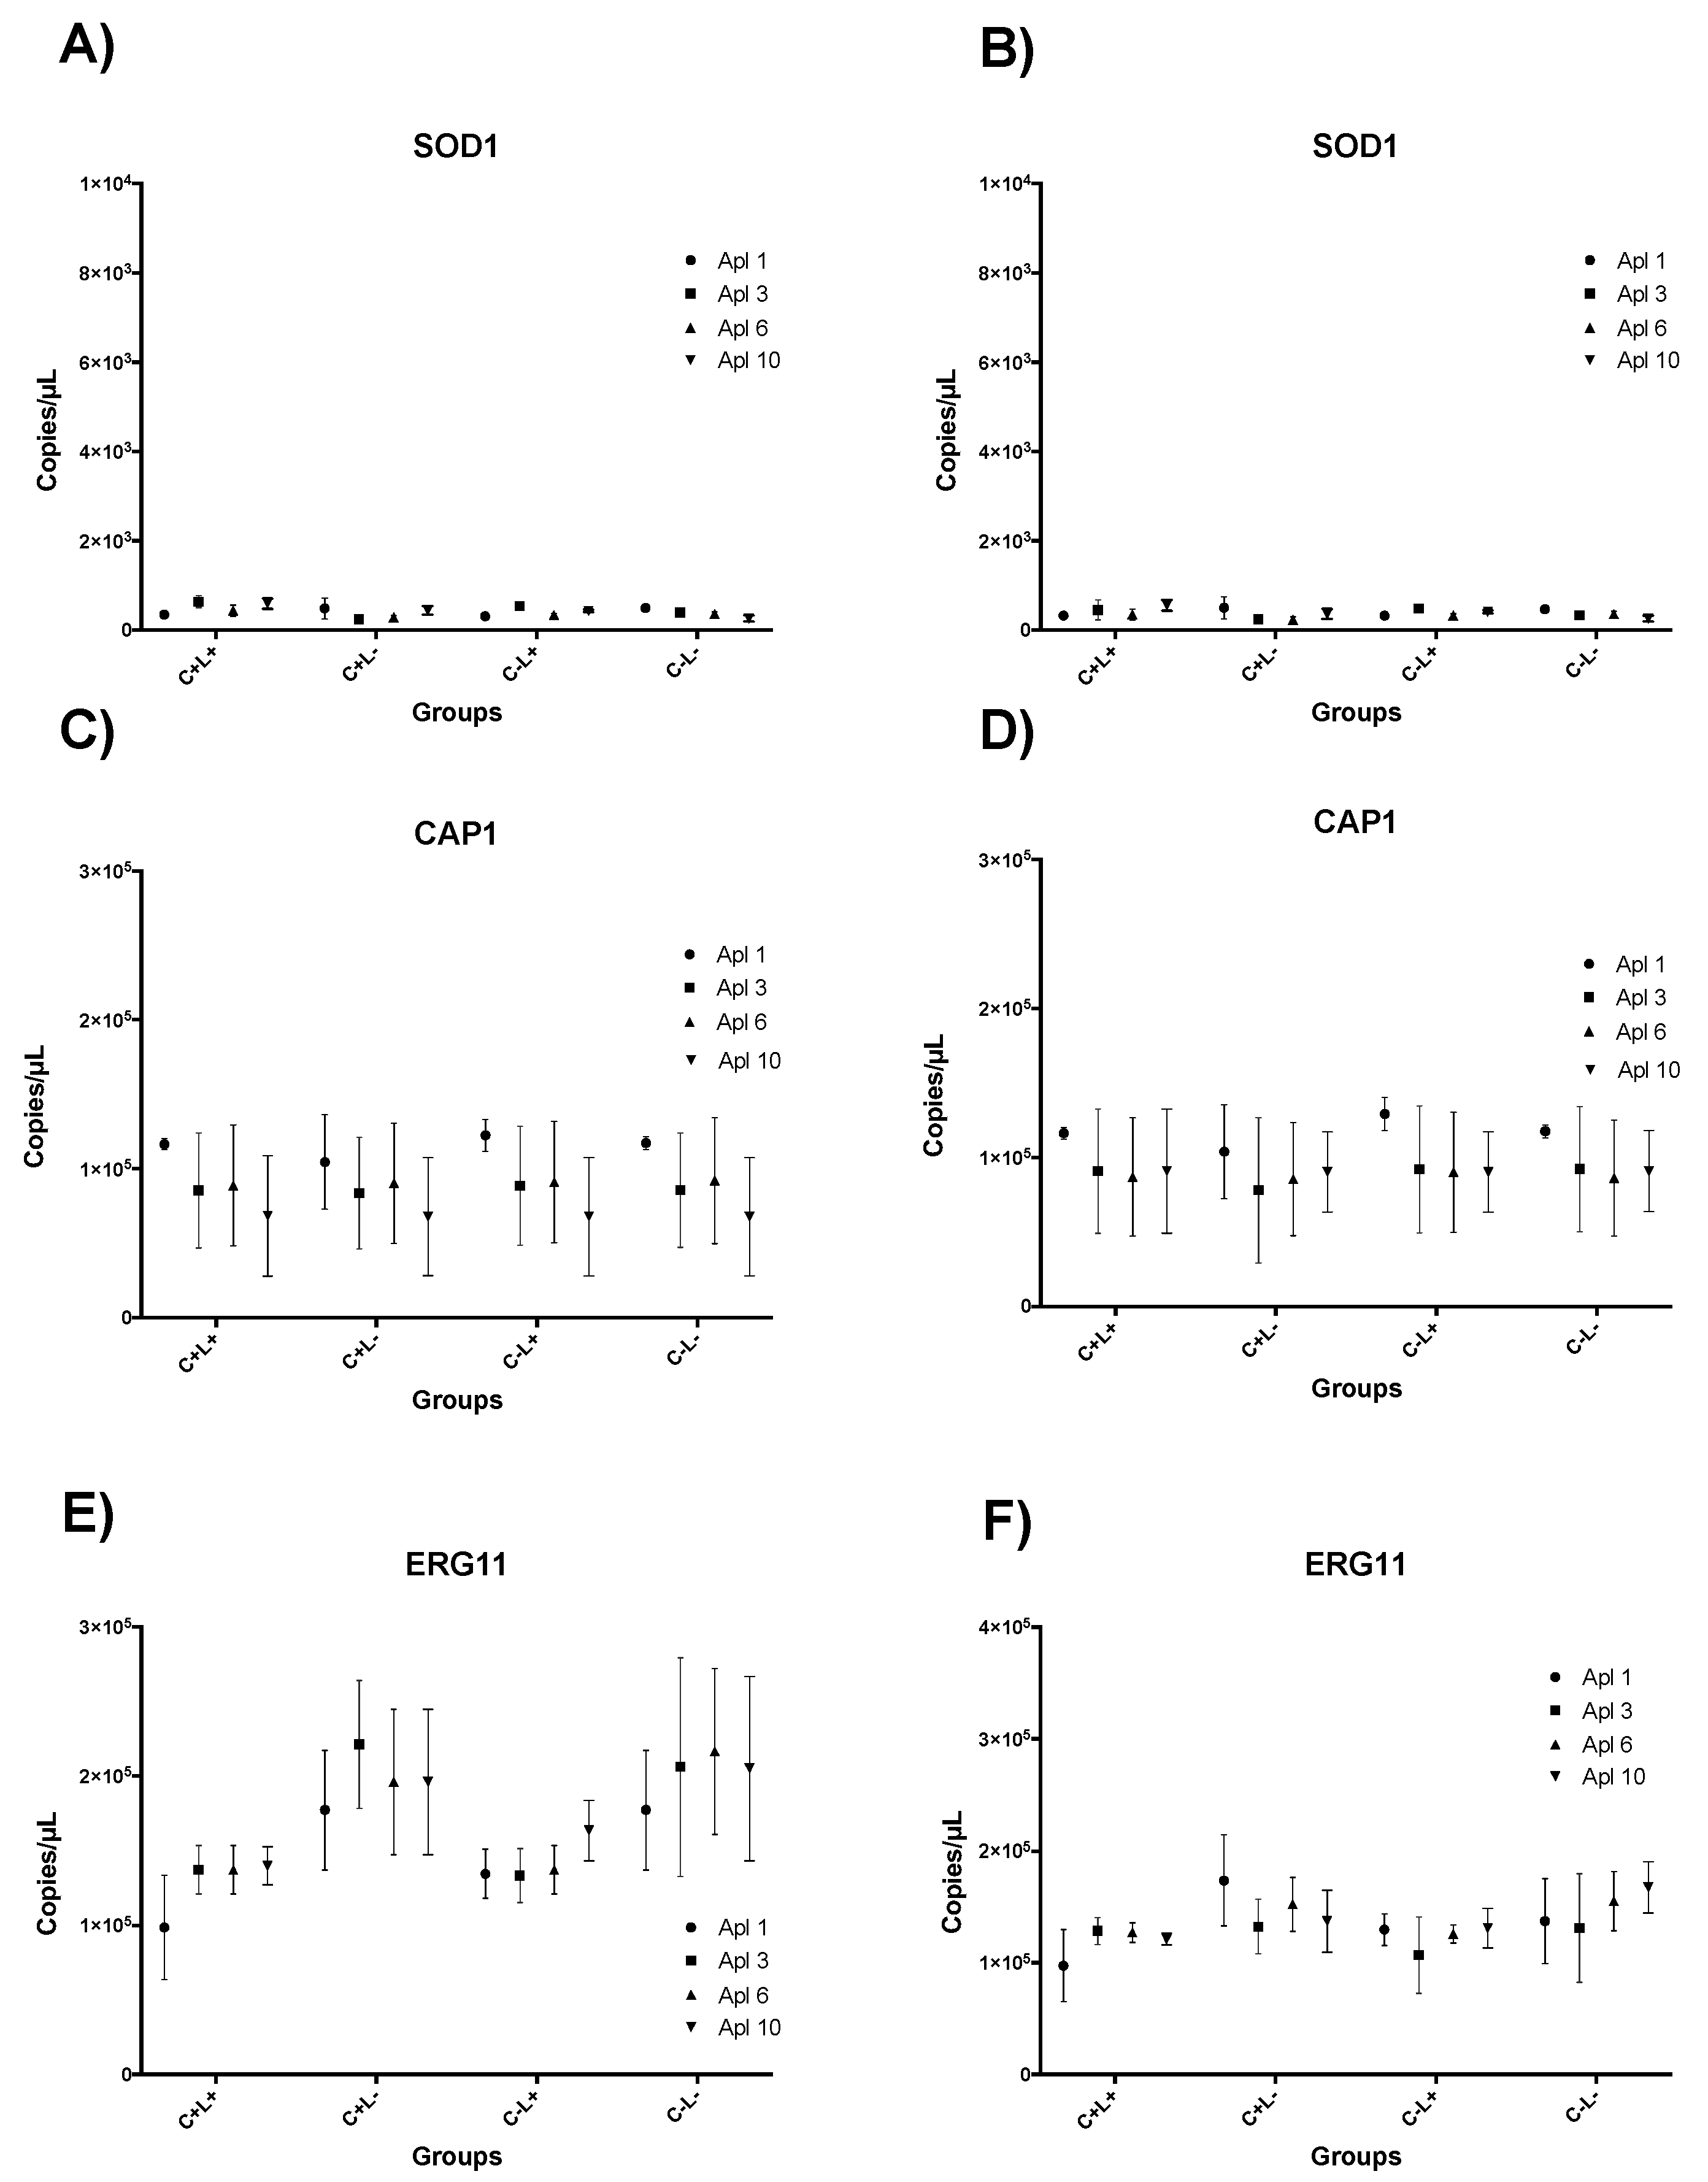
3.4. Results of RT-qPCR for aPDT Mediated by CUR
4. Discussion
Author Contributions
Funding
Institutional Review Board Statement
Informed Consent Statement
Data Availability Statement
Conflicts of Interest
References
- Mukaremera, L.; Lee, K.K.; Mora-Montes, H.M.; Gow, N.A.R. Candida albicans yeast, pseudohyphal, and hyphal morphogenesis differentially affects immune recognition. Front. Immunol. 2017, 8, 1. [Google Scholar] [CrossRef] [Green Version]
- Gow, N.A.R.; Yadav, B. Microbe Profile: Candida albicans: A shape-changing, opportunistic pathogenic fungus of humans. Microbiology 2017, 163, 1145–1147. [Google Scholar] [CrossRef]
- Figueiredo-Godoi, L.M.A.; Garcia, M.T.; Pinto, J.G.; Ferreira-Strixino, J.; Faustino, E.G.; Pedroso, L.L.C.; Junqueira, J.C. Antimicrobial Photodynamic Therapy Mediated by Fotenticine and Methylene Blue on Planktonic Growth, Biofilms, and Burn Infections of Acinetobacter baumannii. Antibiotics 2022, 11, 619. [Google Scholar] [CrossRef]
- Dovigo, L.N.; Pavarina, A.C.; Carmello, J.C.; Machado, A.L.; Brunetti, I.L.; Bagnato, V.S. Susceptibility of clinical isolates of Candida to photodynamic effects of curcumin. Lasers Surg. Med. 2011, 43, 927–934. [Google Scholar] [CrossRef]
- Dovigo, L.N.; Pavarina, A.C.; Ribeiro, A.P.; Brunetti, I.L.; Costa, C.A.; Jacomassi, D.P.; Bagnato, V.S.; Kurachi, C. Investigation of the photodynamic effects of curcumin against Candida albicans. Photochem. Photobiol. 2011, 87, 895–903. [Google Scholar] [CrossRef]
- Dovigo, L.N.; Carmello, J.C.; Carvalho, M.T.; Mima, E.G.; Vergani, C.E.; Bagnato, V.S.; Pavarina, A.C. Photodynamic inactivation of clinical isolates of Candida using Photodithazine®. Biofouling 2013, 29, 105767. [Google Scholar] [CrossRef]
- Dias, L.M.; Klein, M.I.; Jordão, C.C.; Carmello, J.C.; Bellini, A.; Pavarina, A.C. Successive applications of Antimicrobial Photodynamic Therapy effects the susceptibility of Candida albicans grown in medium with or without fluconazole. Photodiagn. Photodyn. Ther. 2020, 32, 102018. [Google Scholar] [CrossRef]
- Jori, G.; Fabris, C.; Soncin, M.; Ferro, S.; Coppellotti, O.; Dei, D.; Fantetti, L.; Chiti, G.; Roncucci, G. Photodynamic therapy in the treatment of microbial infections: Basic principles and perspective applications. Lasers Surg. Med. 2006, 38, 468–481. [Google Scholar] [CrossRef]
- Detty, M.R.; Gibson, S.L.; Wagner, S.J. Current clinical and preclinical photosensitizers for use in photodynamic therapy. J. Med. Chem. 2004, 16, 3897–3915. [Google Scholar] [CrossRef]
- Akbik, D.; Ghadiri, M.; Chrzanowski, W.; Rohanizadeh, R. Curcumin as a wound healing agent. Life Sci. 2014, 116, 1–7. [Google Scholar] [CrossRef]
- Carmello, J.C.; Pavarina, A.C.; Oliveira, R.; Johansson, B. Genotoxic effect of photodynamic therapy mediated by curcumin on Candida albicans. FEMS Yeast Res. 2015, 15, fov018. [Google Scholar] [CrossRef]
- Berman, J.; Krysan, D.J. Drug resistance and tolerance in fungi. Nat. Rev. Microbiol. 2020, 18, 319–331. [Google Scholar] [CrossRef]
- Demidova, T.N.; Hamblin, M.R. Effect of cell-photosensitizer binding and cell density on microbial photoinactivation. Antimicrob. Agents Chemother. 2005, 49, 2329–2335. [Google Scholar] [CrossRef] [Green Version]
- McMahon, M.A.; Tunney, M.M.; Moore, J.E.; Blair, I.S.; Gilpin, D.F.; McDowell, D.A. Changes in antibiotic susceptibility in staphylococci habituated to sub-lethal concentrations of tea tree oil (Melaleuca alternifolia). Lett. Appl. Microbiol. 2008, 47, 263–268. [Google Scholar] [CrossRef]
- Rapacka-Zdonczyk, A.; Wozniak, A.; Nakonieczna, J.; Grinholc, M. Development of Antimicrobial Phototreatment Tolerance: Why the Methodology Matters. Int. J. Mol. Sci. 2021, 22, 2224. [Google Scholar] [CrossRef]
- Giuliani, F.; Martinelli, M.; Cocchi, A.; Arbia, D.; Fantetti, L.; Roncucci, G. In vitro resistance selection studies of RLP068/Cl, a new Zn (II) phthalocyanine suitable for antimicrobial photodynamic therapy. Antimicrob. Agents Chemother. 2010, 54, 637–642. [Google Scholar] [CrossRef] [Green Version]
- Tavares, A.; Carvalho, C.; Faustino, M.A.; Neves, M.G.; Tomé, J.P. Antimicrobial photodynamic therapy: Study of bacterial recovery viability and potential development of resistance after treatment. Mar. Drugs 2010, 8, 91–105. [Google Scholar] [CrossRef] [Green Version]
- Cassidy, C.M.; Donnelly, R.F.; Tunney, M.M. Effect of sub-lethal challenge with Photodynamic Antimicrobial Chemotherapy (PACT) on the antibiotic susceptibility. J. Photochem. Photobiol. 2010, 99, 62–66. [Google Scholar] [CrossRef]
- Pourhajibagher, M.; Boluki, E.; Chiniforush, N.; Pourakbari, B.; Farshadzadeh, Z.; Ghorbanzadeh, R.; Aziemzadeh, M.; Bahador, A. Modulation of virulence in Acinetobacter baumannii cells surviving photodynamic treatment with toluidine blue. Photodiagn. Photodyn. Ther. 2016, 15, 202–212. [Google Scholar] [CrossRef]
- Panariello, B.H.D.; Klein, M.I.; Mima, E.G.O.; Pavarina, A.C. Fluconazole impacts the extracellular matrix of fluconazole-susceptible and -resistant Candida albicans and Candida glabrata biofilms. J. Oral Microbiol. 2018, 10, 1476644. [Google Scholar] [CrossRef]
- Cury, J.A.; Seils, J.; Koo, H. Isolation and purification of total RNA from Streptococcus mutans in suspension cultures and biofilms. Braz. Oral Res. 2008, 22, 216–222. [Google Scholar] [CrossRef] [PubMed] [Green Version]
- Alonso, G.C.; Pavarina, A.C.; Sousa, T.V.; Klein, M.I. A quest to find good primers for gene expression analysis of Candida albicans from clinical samples. J. Microbiol. Methods 2018, 147, 1–13. [Google Scholar] [CrossRef] [PubMed] [Green Version]
- Yin, J.L.; Shackel, N.A.; Zekry, A.; McGuinness, P.H.; Richards, C.; Putten, K.V. Real-time reverse transcriptase-polymerase chain reaction (RT-PCR) for measurement of cytokine and growth factor mRNA expression with fluorogenic probes or SYBR Green, I. Immunol. Cell Biol. 2001, 79, 213–221. [Google Scholar] [CrossRef] [PubMed] [Green Version]
- Jordão, C.C.; Klein, M.I.; Carmello, J.C.; Dias, L.M.; Pavarina, A.C. Consecutive treatments with photodynamic therapy and nystatin altered the expression of virulence and ergosterol biosynthesis genes of a fluconazole-resistant Candida albicans in vivo. Photodiagn. Photodyn. Ther. 2021, 33, 102155. [Google Scholar] [CrossRef] [PubMed]
- Jordão, C.C.; Viana de Sousa, T.; Inêz Klein, M.; Mendonça Dias, L.; Pavarina, A.C.; Carmello, J.C. Antimicrobial photodynamic therapy reduces gene expression of Candida albicans in biofilms. Photodiagn. Photodyn. Ther. 2020, 31, 101825. [Google Scholar] [CrossRef] [PubMed]
- Zhu, J.; Krom, B.P.; Sanglard, D.; Intapa, C.; Dawson, C.C.; Peters, B.M. Farnesol-induced apoptosis in Candida albicans is mediated by Cdr1-p extrusion and depletion of intracellular glutathione. PLoS ONE 2011, 6, e28830. [Google Scholar] [CrossRef] [Green Version]
- Kashef, N.; Karami, S.; Djavid, G.E. Phototoxic effect of hypericin alone and in combination with acetylcysteine on Staphylococcus aureus biofilms. Photodiagn. Photodyn. 2015, 12, 186–192. [Google Scholar] [CrossRef]
- Snell, S.B.; Foster, T.H.; Haidaris, C.G. Miconazole induces fungistasis and increases killing of Candida albicans subjected to photodynamic therapy. Photochem. Photobiol. 2012, 88, 596–603. [Google Scholar] [CrossRef] [PubMed] [Green Version]
- Boiteux, S.; Guillet, M. Abasic sites in DNA: Repair and biological consequences in Saccharomyces cerevisiae. DNA Repair 2004, 3, 1–12. [Google Scholar] [CrossRef] [PubMed]
- Garcia, B.A.; Panariello, B.H.D.; Freitas-Pontes, K.M.; Duarte, S. Candida biofilm matrix as a resistance mechanism against photodynamic therapy. Photodiagn. Photodyn. Ther. 2021, 36, 102525. [Google Scholar] [CrossRef]
- Gad, F.; Zahra, T.; Hasan, T.; Hamblin, M.R. Effects of growth phase and extracellular slime on photodynamic inactivation of gram- positive pathogenic bacteria. Antimicrob. Agent Chemother. 2004, 48, 2173–2178. [Google Scholar] [CrossRef] [Green Version]
- Hassan, H.M.; Moody, C.S. Regulation of manganese-containing superoxide dismutasein Escherichia coli. Anaerobic induction by nitrate. J. Biol. Chem. 1987, 262, 17173–17177. [Google Scholar] [CrossRef]
- Chien, C.T.; Chen, Y.C.; Liu, Y.C.; Liang, S.H.; Lin, H.H.; Lin, C.H. The antimicrobial photodynamic inactivation resistance of Candida albicans is modulated by Hog1 pathway and the Cap1 transcription factor. Med. Mycol. 2019, 57, 618–627. [Google Scholar] [CrossRef] [PubMed]
- Komalapriya, C.; Kaloriti, D.; Tillmann, A.T.; Yin, Z.; Herrero-de-Dios, C.; Jacobsen, M.D.; Belmonte, R.C.; Cameron, G.; Haynes, K.; Grebogi, C.; et al. Integrative Model of Oxidative Stress Adaptation in the Fungal Pathogen Candida albicans. PLoS ONE 2015, 10, e0137750. [Google Scholar] [CrossRef] [Green Version]
- Wu, Y.; Wu, M.; Wang, Y.; Chen, Y.; Gao, J.; Ying, C. ERG11 couples oxidative stress adaptation, hyphal elongation and virulence in Candida albicans. FEMS Yeast Res. 2018, 1, 18. [Google Scholar] [CrossRef]
- Asai, K.; Tsuchimori, N.; Okonogi, K.; Perfect, J.R.; Gotoh, O.; Yoshida, Y. Formation of azole-resistant Candida albicans by mutation of sterol 14-demethylase P450. Antimicrob. Agents Chemother. 1999, 43, 1163–1169. [Google Scholar] [CrossRef] [Green Version]
- Whaley, S.G.; Berkow, E.L.; Rybak, J.M.; Nishimoto, A.T.; Barker, K.S.; Rogers, P.D. Azole antifungal resistance in Candida albicans and emerging non-albicans Candida species. Front. Microbiol. 2017, 7, 2173. [Google Scholar] [CrossRef] [Green Version]
- Silver, P.M.; Oliver, B.G.; White, T.C. Role of Candida albicans transcription factor Upc2p in drug resistance and sterol metabolism. Eukaryot. Cell. 2004, 3, 1391–1397. [Google Scholar] [CrossRef] [Green Version]
- Hsieh, Y.H.; Zhang, J.H.; Chuang, W.C.; Yu, K.H.; Huang, X.B.; Lee, Y.C.; Lee, C.I. An in vitro study on the effect of combined treatment with photodynamic and chemical therapies on Candida albicans. Int. J. Mol. Sci. 2018, 24, 337. [Google Scholar] [CrossRef] [Green Version]
- Mirani, Z.A.; Jamil, N. Effect of sub-lethal doses of vancomycin and oxacillin on biofilm formation by vancomycin intermediate resistant Staphylococcus aureus. J. Basic Microbiol. 2011, 51, 191–195. [Google Scholar] [CrossRef]
- Eichler, M.; Lavi, R.; Shainberg, A.; Lubart, R. Flavins are source of visible-light-induced free radical formation in cells. Lasers Surg. Med. 2005, 37, 314–319. [Google Scholar] [CrossRef] [PubMed]
- Hamblin, M.R.; Abrahamse, H. Can light-based approaches overcome antimicrobial resistance? Drug Dev. Res. 2019, 80, 48–67. [Google Scholar] [CrossRef] [PubMed]


| Gene | Primers | Optimal Concentration (nM) | Tm (°C) Cycle qPCR |
|---|---|---|---|
| SOD1 | F—TTG AAC AAG AAT CCG AAT CC R—AGC CAA TGA CAC CAC AAG CAG (Zhu et al., 2011) [26] | 400 | 60 |
| CAP1 | F—AGT CAA TTC AAT GTT CAA G R—AAT GGT AAT GTC CTC AAG (Alonso et al., 2018) [22] | 400 | 50 |
| ERG11 | F—CCC CTA TTA ATT TTT TCC CTA ATT AC R—CAC GTT CTT TTC TCA CTT TAA TTT CTT TC (Jordão et al., 2021) [24] | 300 | 58 |
Disclaimer/Publisher’s Note: The statements, opinions and data contained in all publications are solely those of the individual author(s) and contributor(s) and not of MDPI and/or the editor(s). MDPI and/or the editor(s) disclaim responsibility for any injury to people or property resulting from any ideas, methods, instructions or products referred to in the content. |
© 2023 by the authors. Licensee MDPI, Basel, Switzerland. This article is an open access article distributed under the terms and conditions of the Creative Commons Attribution (CC BY) license (https://creativecommons.org/licenses/by/4.0/).
Share and Cite
Dias, L.M.; Klein, M.I.; Ferrisse, T.M.; Medeiros, K.S.; Jordão, C.C.; Bellini, A.; Pavarina, A.C. The Effect of Sub-Lethal Successive Applications of Photodynamic Therapy on Candida albicans Biofilm Depends on the Photosensitizer. J. Fungi 2023, 9, 111. https://doi.org/10.3390/jof9010111
Dias LM, Klein MI, Ferrisse TM, Medeiros KS, Jordão CC, Bellini A, Pavarina AC. The Effect of Sub-Lethal Successive Applications of Photodynamic Therapy on Candida albicans Biofilm Depends on the Photosensitizer. Journal of Fungi. 2023; 9(1):111. https://doi.org/10.3390/jof9010111
Chicago/Turabian StyleDias, Luana Mendonça, Marlise Inêz Klein, Túlio Morandin Ferrisse, Karine Sousa Medeiros, Cláudia Carolina Jordão, Amanda Bellini, and Ana Claudia Pavarina. 2023. "The Effect of Sub-Lethal Successive Applications of Photodynamic Therapy on Candida albicans Biofilm Depends on the Photosensitizer" Journal of Fungi 9, no. 1: 111. https://doi.org/10.3390/jof9010111