Article

Selection of Polymorphic Patterns Obtained by RAPD-PCR through Qualitative and Quantitative Analyses to Differentiate Aspergillus fumigatus

by
Omar E. Valencia-Ledezma
1,
Carlos A. Castro-Fuentes
1,
Esperanza Duarte-Escalante
1,
María Guadalupe Frías-De-León
2 and
María del Rocío Reyes-Montes
1,*
1
Unidad de Micología, Facultad de Medicina, Departamento de Microbiología y Parasitología, Universidad Nacional Autónoma de México, Mexico City 04510, Mexico
2
Hospital Regional de Alta Especialidad de Ixtapaluca, Carretera Federal México-Puebla Km. 34.5, Pueblo de Zoquiapan, Ixtapaluca 56530, Mexico
*
Author to whom correspondence should be addressed.
J. Fungi 2022, 8(3), 296; https://doi.org/10.3390/jof8030296
Submission received: 26 January 2022 / Revised: 5 March 2022 / Accepted: 11 March 2022 / Published: 13 March 2022
(This article belongs to the Special Issue Molecular Markers for Fungal Detection and Identification)

Abstract

:
The objective of this work was to use the random amplification of the polymorphic DNA–polymerase chain reaction (RAPD-PCR) technique to select polymorphic patterns through qualitative and quantitative analyses to differentiate the species A. flavus, A. fumigatus, A. niger and A. tubingensis. Twenty-seven Aspergillus isolates from different species were typified using phenotypic (macro- and micromorphology) and genotypic (partial BenA gene sequencing) methods. Thirty-four primers were used to obtain polymorphic patterns, and with these a qualitative analysis was performed to select the primers that presented species-specific patterns to distinguish each species. For the quantitative selection, a database was built from the polymorphic patterns and used for the construction of logistic regression models; later, the model that presented the highest value of sensitivity against specificity was evaluated through ROC curves. The qualitative selection showed that the primers OPA-19, P54, 1253 and OPA-02 could differentiate the species. A quantitative analysis was carried out through logistic regression, whereby a species-specific correlation of sensitivity and specificity greater than 90% was obtained for the primers: OPC-06 with a 96.32% match to A. flavus; OPF-01 with a 100% match to A. fumigatus; OPG-13 with a 98.01% match to A. tubingensis; and OPF-07 with a 99.71% match to A. niger. The primer OPF-01 discriminated the four species as well as closely related species. The quantitative methods using the selected primers allowed discrimination between species and showed their usefulness for genotyping some of the species of medical relevance belonging to the genus Aspergillus.

1. Introduction

Within the genus Aspergillus, more than 400 species are recognized [1], and the most important ones from a pathogenic point of view are included in the sections Fumigati, Flavi and Nigri, representing more than 95% of the pathogenic Aspergillus species. It is important to mention that, in the last two decades, there has been a significant increase in invasive fungal infections, particularly invasive aspergillosis (IA) [2]. Among the most relevant opportunistic pathogenic species within the Fumigati section are A. fumigatus, A. lentulus, A. fumigatiaffinis, A. fumisynnematus, A. novofumigatus and A. laciniosa [3]. Due to the life-threatening nature of these infections and their drug resistance, accurate identification of Aspergillus spp. is necessary [4,5]. The diagnosis of invasive aspergillosis is challenging, particularly in immunocompromised patients [6]. The signs and symptoms are nonspecific, colonization is difficult to distinguish from an invasive disease, blood cultures are commonly negative and patients are often unable to undergo invasive diagnostic procedures [7]. Culture and microscopic examination remain the “gold standard” but lack sensitivity, while immunoassays with antigens such as galactomannan and glucan detection systems are frequently used but vary in sensitivity and specificity depending on the patient population involved [6,7]. On the other hand, molecular tests have been proven to be useful. However, they have not yet been clinically validated. Due to these discrepancies, [8] suggested using a polyphasic approach as the standard for the identification—that is, using a set of criteria, including morphological characterization, physiological tests, ecological data, extrolite analysis and DNA sequences. In particular, with regard to DNA sequences, the use of multi-locus sequences, such as β-tubulin (BenA), calmodulin (CaM), actin (Act) or internal transcribed spacers (ITS) sequences, has been suggested. Comparative sequence analysis of the ITS regions, specifically the non-coding regions ITS1 and ITS2 flanking the 5.8S ribosomal DNA, allows the identification of Aspergillus at the subgenus/section level, while the amplification and sequencing of some genes, such as actin, calmodulin, rodlet A and/or β-tubulin, allow the distinction of A. fumigatus from related species within the same section [9]. However, these methodologies are time-consuming, labor-intensive and, therefore, impractical for most clinical laboratories and can be very expensive when used to study collections of large numbers of isolates. To solve this problem, various methodologies have been used for the identification of Aspergillus spp. One of these tools is the random amplification of polymorphic DNA (RAPD-PCR), which has been used with good results in the identification and typing of pathogenic fungi since it has proven to be a fast, simple, low-cost and discriminatory method [10,11,12,13]. [11] re-evaluated the identification of species from a collection of strains of A. fumigatus sensu lato to identify atypical species based on the new concept of species delimitation. These authors used the RAPD-PCR technique and sequence analysis of the β-tubulin gene, which identified A. fumigatus sensu stricto; A. lentulus; A. viridinutans; Neosartorya udagawae and N. cf. nishimurae. Likewise, [13] identified environmental isolates of Aspergillus spp. in Tehran through phenotypic methods and RAPD-PCR, and the identified species were A. niger; A. flavus; A. tubingensis; A. japonicus; A. ochraceus; A. nidulans; A. amstelodami; A. oryzae; A. terreus; A. versicolor; A. flavipes and A. fumigatus. On the other hand, isolates of A. fumigatus sensu lato obtained from raw cows’ milk using morphological and molecular techniques (RAPD-PCR and sequencing of the BenA gene) were identified and their genetic variability was estimated [14]. The species identified were A. novofumigatus; A. fumigatiaffinis; A. udagawae; A. lentulus and A. fumigatus, the latter being the most abundant and the one that presented intraspecific variability. Similarly, these techniques have also been used to identify species of other pathogenic fungi, such as Candida [15] and Sphorotrix [16]. This background indicates that RAPD-PCR may be useful in differentiating Aspergillus spp.
The increase in immunocompromised patients associated with invasive aspergillosis, as well as new Aspergillus spp., points to the need to identify the causative agents at the species level, and a rapid and reliable diagnosis is necessary, so the objective of this work was to select polymorphic patterns obtained by RAPD-PCR through qualitative and quantitative analyses to differentiate the species A. flavus, A. fumigatus, A. niger and A. tubingensis, which are the species of medical importance.

2. Materials and Methods

2.1. Fungal Isolates

Twenty-seven fungal isolates corresponding to the sections Flavi, Fumigati and Nigri were used in addition to five reference strains from the American Type Culture Collection (Manassas, VA, USA) (Table 1), and fifteen partial sequences of the gene BenA obtained from GenBank were used. All isolates were obtained from the collection of the Molecular Mycology Laboratory, Department of Microbiology and Parasitology, Faculty of Medicine, National Autonomous University of Mexico (UNAM). All isolates were cultured on potato dextrose agar (PDA) plates (Bioxon, CDMX, MX) at 28 °C for 4–7 days and identified according to their macro- and micromorphological characteristics. The macro- and micromorphological identification was carried out as previously described [8,17]. Micromorphological identification was carried out through microcultures [18], and the microscopic characteristics of the isolates were recorded using a digital camera.

2.2. Monosporic Cultures

From each isolate grown in PDA (Bioxon) for 4–7 days at 28 °C, a conidia suspension was prepared with 1 mL of phosphate buffer (pH 7.4) and 0.05% Tween 20 (PBST). This suspension was diluted 1:1000 with PBST, and 50 μL was taken and inoculated in Petri dishes with PDA (Bioxon), which were incubated at 28 °C. An isolated colony was selected from each plate and cultured in a tube with the same medium at 28 °C. The conidia of the monosporic cultures were conserved in sterile water at 4 °C.

2.3. DNA Extraction

From each monosporic culture of Aspergillus spp. seeded in PDA (Bioxon), a conidial suspension was obtained that was inoculated in tubes with 50 mL of YEPG culture medium (1% yeast extract, 2% peptone, 2% dextrose) and incubated at 37 °C in an orbital shaker for three days until mycelial growth was observed. The mycelial biomass of each isolate was harvested by filtration and frozen at −20 °C until use. Fungal DNA was extracted using a DNeasy® Plant Mini Kit (Qiagen, Austin, TX, USA). Total extracted DNA was quantified by 1% agarose gel electrophoresis and compared with different concentrations (10, 30 and 50 ng/µL) of phage λ (Gibco BRL®, San Francisco, CA, USA) stained with GelRed ™ nucleic acid gel stain 10,000× by Biotium (Fremont, CA, USA). Furthermore, it was also quantified by UV spectrophotometry using a NanoDrop 2000 spectrophotometer (Thermo Fisher Scientific, Waltham, MA, USA).

2.4. Amplification of the Partial Sequence of the BenA Gene

PCR amplification of the BenA gene was carried out as described by [19], and the oligonucleotides used were Bt2a (5′-GGTAACCAAATCGGTGCTGCTTTC-3′) and Bt2b (5′-ACCCTCAGTGTAGTGACCCTTGGC-3′). A volume of 25 µL was used for the reaction mixture, with 10 mM of MgCl2, 100 µM of each dNTP, 1U/µL Taq DNA polymerase, 10 µM of each primer and 20 ng/µL of DNA. Amplification was carried out in a thermocycler Bio-Rad (Hercules, CA, USA) with the following conditions: 95 °C for 8 min; 35 cycles of 95 °C for 15 s; 55 °C for 20 s and 72 °C for 1 min and a cycle of 72 °C for 5 min. The PCR products were sent for sequencing in both directions by Macrogen USA (Rockville, MD, USA), using the Sanger method.

2.5. Sequence Analysis

For the analysis of the sequences, the BioEdit program ver. 7.1.9 was used (www.mbio.ncsu.edu/BioEdit/bioedit.html, 10 May 2021), which allowed us to manually corroborate the sequences obtained in the sequencing process (forward and reverse) of each sample and generate a consensus sequence. Each sequence was analyzed with the Basic Local Alignment Search Tool (BLAST) program [20] (www.blast.ncbi.nlm.nih.gov/blast.cgi, 10 May 2021) to confirm its identity. Subsequently, the sequences were aligned with the MAFFT program (http://mafft.cbrc.jp/alignment/server/, 10 May 2021) [21], and the best evolutionary model applied to this alignment was chosen with the JModelTest 2 program (www.github.com./ddarriba/jmodeltest2, 10 May 2021) [22].

2.6. Phylogenetic Analysis

Phylogenetic analysis of the sequences was carried out using the maximum likelihood method. The support values of the internal branches were evaluated by a bootstrap method with 1000 repetitions (values equal to or greater than 70% were considered significant) and the GTR + G + I evolutionary model; the nearest neighbor interchange (NNI) heuristic method was applied. A maximum likelihood (ML) analysis was performed with the MEGA software v.10.1.7 [23]. Reference sequences obtained from GenBank were included in the phylogenetic analysis (Table 2).

2.7. RAPD-PCR

The RAPD-PCR method was used following two variants: with a primer according to [24,25] and with a double primer according to [26]. Thirty-four primers were tested (Table 3), as described below. Briefly, the RAPD-PCR was carried out in a 25-microliter volume containing 1X buffer, 2.5 mM MgCl2, 20 ng of DNA, a 200 μM concentration of each dNTP Applied Biosystems Inc. (Waltham, MA, USA), 1 U of Taq DNA polymerase Invitrogen (Carlsbad, CA, USA) and 100 pmol/μL of each primer. The PCR conditions were as follows: 1 cycle of 7 min at 94 °C; followed by 45 cycles of 1 min at 92 °C; 1 min at 35 °C and 1 min at 72 °C and a final extension of 5 min at 72 °C. The products were subjected to 1.5% agarose gel electrophoresis and then stained with GelRed ™ 10,000× Biotium (Fremont, CA, USA); DNA ladders of 100 and 1000 bp (molecular size marker) Invitrogen (Carlsbad, CA, USA) were used. Images of the gels were captured in a Synoptics Photodocumenter Syngene (Frederick, MD, USA).

2.8. Qualitative and Quantitative Analyses of Polymorphic Patterns Generated by RAPD-PCR

2.8.1. Qualitative Selection

Species-specific polymorphic patterns were selected for each of the six species studied by RAPD-PCR with the 34 primers. For the selection, the following inclusion criteria were taken into account: number of bands (more than three bands); molecular size (>500 bp) and the definition of the pattern presented by each of the isolates of the studied species.

2.8.2. Quantitative Selection

From the qualitative analysis of the polymorphic patterns, a database was built considering the number of bands per isolate, the molecular size (bp per band) and the intensity of each band in the following ranges: 0.5 (very faint); 1.0 (faint); 2.0 (intense) and 3.0 (very intense). The database obtained was used for the construction of logistic regression models, considering the number of bands, molecular size, intensity and their interaction as dependent variables and the species of the fungus for each of the 34 primers as the independent variable, using the JMP®Pro 13 program (SAS Institute Inc., Cary, NC, USA, for Windows). Subsequently, the significance of the models and the study variables was evaluated to select the model that presented the highest value of sensitivity vs. specificity, represented by graphs of receiver operating characteristic (ROC) curves [27,28]. Using the results of the curves, the primers that generated the band patterns were selected, which had areas greater than 0.9 of selectivity vs. specificity for each of the evaluated species (A. flavus, A. fumigatus, A. niger and A. tubingensis). The model obtained from the selected primers generated a mathematical equation that allowed the estimation of the most probable species.

2.9. Application of Mathematical Models to Identify Aspergillus spp.

To corroborate the identification of the Aspergillus spp., polymorphic patterns were obtained by RAPD-PCR with other isolates of different geographical origin and the primers OPC-06, OPF-01, OPF-07 and OPG-13. Information on the number of bands, molecular size and intensity was obtained to compare these data with those previously obtained for the construction of the logistic regression model and obtain the correlation data of association to the most probable species.

3. Results

3.1. Macro- and Micromorphology

The isolates used in this work presented the typical macro- and micromorphology described for the Aspergillus genus. In terms of macromorphology, for the Fumigati section, velvety colonies with a green-blue color (front) and cream color (back) were identified; for the Nigri section, dark brown to black, powdery (front) and cream-yellow (back) colonies were observed. Greenish to yellowish colonies were identified in the Flavi section. Regarding the micromorphology, for the Fumigati section bluish-green conidia without metula, spatulate vesicles and smooth conidiophores were observed; the average size of the conidia was in the range of 1.7–2.1 µm, while the length and width of the vesicles were 15.1–24.1 and 12.8–18.4 µm, respectively. The Nigri section presented dark brown to black conidia, occasionally metula, globose vesicles and smooth conidiophores; the length and width of the vesicles were 30.77–51.79 and 31.54–51.28 μm, respectively, while the diameter of the conidia was in the range of 2.20–4.23 μm. Finally, the Flavi section presented green conidia, brown globose vesicles and rough conidiophores; the diameter of the conidia was 2.78–4.88 μm, and the length and width of the vesicles were 25.64–31.79 and 27.95–31.79 μm, respectively (Supplementary Figure S1).

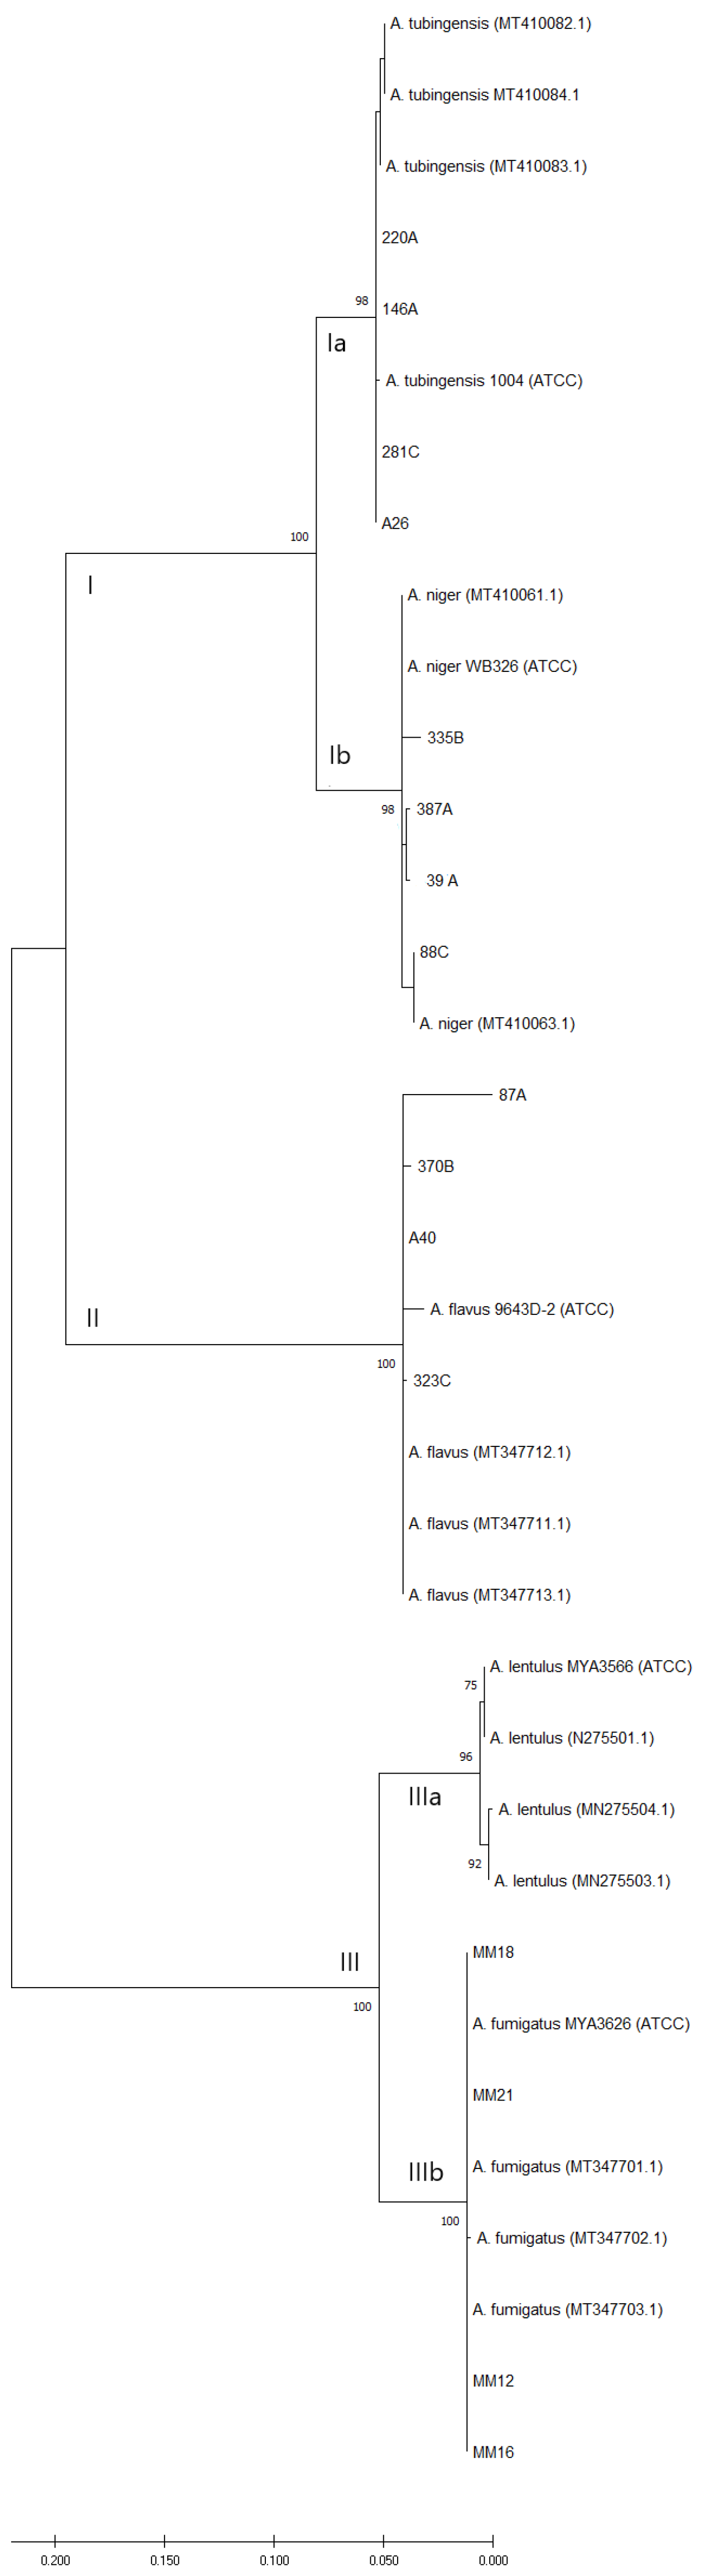
3.2. Phylogenetic Analysis

A phylogenetic tree was constructed through the maximum likelihood method; three groups were formed. Group I included two subgroups: subgroup Ia included isolates 146A; 220A; 281C and A28 and ATCC reference strain 1004 corresponding to A. tubingensis, which were associated with reference strains of A. tubingensis (MT410083.1, MT410082.1 and MT410084.1) with a bootstrap of 91%. Subgroup Ib included the reference strain WB326 of A. niger (ATCC) and the isolates 335B, 88C, 387A and 39A, which were grouped with the reference strains of A. niger (MT410061.1 and MT410063.1) with a bootstrap of 94%. Group II included isolates 87A, 370B, A15 and 323C and the A. flavus strain 9643D-2 (ATCC); they were associated with reference strains of A. flavus (MT347712.1, MT347711.1 and MT347713.1) with a bootstrap of 100%. Finally, group III formed two subgroups. Subgroup IIIa was formed with the A. lentulus strain MYA3566 (ATCC) and reference strains of A. lentulus (MN275501.1, MN275504.1 and MN257703.1) with a bootstrap of 90%. Subgroup IIIb included the isolates MM12, MM16, MM18 and MM21 and the reference strains of A. fumigatus (MT347703.1, MT347702.1 and NT347701.1) with a bootstrap of 100% (Figure 1).

3.3. RAPD-PCR

The polymorphic patterns generated with each of the 34 primers included in the study showed a greater number of polymorphic haplotypes generated with the primers 1253; OPG-01; OPG-03; OPM-12; OPH-18; OPF-01; OPF-09; P54; P160; PELF; OPM-12; T3B and OPA-02, followed by the primers 1281; 1283; OPA-08; OPC-07; OPG-13; OPG-15; OPC-06; OPG-05; OPH-03; OPG-07; OPF-07; OPE-02 and OPA-03. Meanwhile, the primers that generated a lower number of haplotypes were R108; OPA-19; OPA-16; OPB-12; OPA-17; OPA-15; B04 and OPH-17 (Supplementary Figure S2 (1–43)).

3.4. Qualitative Selection

Based on the reproducibility of the patterns and considering the inclusion criteria (number of bands, molecular size and definition of the pattern obtained) for each of the species, the species-specific primers were identified (Figure 2), as shown in Table 4.
The primer OPA-19 generated a unique pattern for A. fumigatus, while, for the rest of the species, the patterns obtained with this same primer showed a lower number of bands, as in the case of A. tubingensis, which presented two bands of 500 and 1600 bp.
The primer 1253 generated a unique pattern for A. niger, while the pattern of bands generated for A. fumigatus showed intense bands with molecular sizes of 650, 900 and 1000 bp. On the other hand, the pattern generated for A. flavus showed a band pattern similar to that of A. niger. However, the characteristic bands of the A. flavus pattern were between 400 and 500 bp in size.
The primer OPA-02 generated different polymorphic patterns for all the isolates of A. tubingensis; however, it generated unique patterns for the species A. flavus, A. fumigatus and A. niger, which were characterized by intense bands and molecular sizes of 190–2300, 220–2400 and 200–2000 bp, respectively, showing the usefulness of this primer to discriminate the three species.
The primer P54 generated unique polymorphic patterns for A. flavus, A. niger, A. fumigatus and A. tubingensis; however, the pattern of A. fumigatus was the most defined.

3.5. Quantitative Selection

From the database obtained, which included 15,000 pieces of data (number of bands, molecular size and intensity of each band), and from the models generated with the 34 primers, ROC curves were constructed, and based on the results of the species-specific correlation values > 0.95, the following primers were selected, OPC-06, OPF-01, OPF-07 and OPG-13.
Figure 3 shows the results of the ROC curves obtained for the selected primers, where a species-specific correlation was observed with areas greater than 0.95 for the following primers: OPC-06, with an area of 0.9632 for A. flavus; OPF-01, with an area of 1.0000 for A. fumigatus; OPF-07, with an area of 0.9971 for A. niger and OPG-13, with an area of 0.9810 for A. tubingensis.

3.6. Qualitative and Quantitative Comparison of the Selected Primers

To carry out the qualitative and quantitative comparison between the selected isolates, a sensitivity vs. specificity graph was constructed based on the data obtained from the ROC curves. The graph shows that the percentages of sensitivity vs. specificity vary regarding the qualitatively selected primers compared with those selected quantitatively. The following values were obtained for each of the evaluated species: for A. flavus, the primer P54 showed 91.58%, while for OPC-06, 96.32% was obtained; for A. fumigatus, the primer OPA-19 presented 75.42% against the primer OPF-01, which was 100%; for A. niger, the primer 1253 showed 45.45%, while the primer OPF-07 obtained 99.71% and finally, for A. tubingensis, the primer OPA-02 presented 66.07%, while for the primer OPG-13, 98.10% was obtained. Figure 4 shows the percentages of sensitivity vs. specificity of the qualitatively and quantitatively selected primers concerning the Aspergillus spp. evaluated.
Figure 4 shows that the qualitatively selected primers showed a lower percentage of sensitivity (ROC area) against specificity compared to those selected quantitatively through logistic regression analysis. This same analysis revealed that the variables used (number of bands, molecular size and intensity of each band) and total bands have a different effect on the mathematical models and on the 34 different primers analyzed. That is, it is capable of making a statistical difference based on this analysis, which allows a more precise selection of the useful primers to identify the different species studied. In addition, the probability value obtained in each of the evaluated polymorphic patterns was statistically significant at p < 0.0001. Likewise, to corroborate these results, the corresponding probability formulas were obtained for each primer selected to identify other Aspergillus isolates of different geographical origin and assign the most probable species (Supplementary Figure S3 (1–15)).

3.7. Application of Mathematical Models to Identify Aspergillus spp.

Supplementary Table S1 (1–3) shows the results obtained from the logistic regression model using other Aspergillus isolates of different geographical origin, which showed 100% correspondence between the primers OPC-06, OPF-01 and OPG-13, and the previously identified species (A. flavus, A. fumigatus and A. tubingensis).
The strongest associations were obtained with the following primers: OPC-06 for A. flavus with an association correlation of >0.82; OPF-01 for A. fumigatus with >0.99, OPG-13 for A. tubingensis with >0.96 and the primer OPF-07 for A. niger. The correlation results to identify these species were not consistent regarding the areas obtained in this model; the percentage of sensitivity against specificity was 98.9% for the isolates of A. fumigatus and 99.71% for the isolates of A. niger, generating conflict in the assignment of species. In addition, A. niger showed a high polymorphism with most of the primers used and a low specificity.
The primer OPC-06 allowed for obtaining defined patterns only for A. flavus and A. fumigatus. However, the intensity of the bands was much higher in the A. fumigatus isolates (450, 800, 1100 and 1700 bp). With the primer OPF-01 for A. fumigatus, nine bands were obtained, whose molecular sizes were in the range of 300–1900 bp (Figure 5). On the other hand, A. fumigatus and A. flavus showed very similar polymorphic patterns, with one of the differences being that the A. fumigatus pattern showed bands of 1700 and 1900 bp, but they were absent in A. flavus. Furthermore, A. niger and A. tubingensis differed in the number and intensity of the polymorphic bands that they presented. Thus, the primer OPF-01 can be considered useful to discriminate the four species.
In the case of the primer OPF-07, an absence of bands was noticeable in the isolates of A. flavus, A. niger and A. tubingensis. However, A. fumigatus showed a distinctive pattern due to the presence of an intense 650-bp band in all isolates of the species. Therefore, this primer was not considered to have a high discriminatory power. The primer OPG-13, like OPF-07, presented a poor polymorphic pattern for most of the A. tubingensis isolates. The isolates of A. fumigatus presented a variable polymorphic pattern in the number and intensity of polymorphic bands.

4. Discussion

In this study, the RAPD-PCR technique was used to obtain polymorphic patterns and, based on these, perform qualitative and quantitative selections that would allow the identification of specific primers for the species A. flavus, A. fumigatus and A. tubingensis. The isolates included in the study were identified by macro- and micromorphology at the section level, and, through the sequencing of the partial region of the BenA gene and phylogenetic analysis, the identification of the species was confirmed.
The partial sequence of the BenA gene has proven useful for studies of the phylogenetic relationships of Aspergillus and related species [29]. In addition, the BenA marker has been used in other works to identify species within the genus Aspergillus, which allows a comparative analysis [30]. Ref. [8] have used other genes for the identification of Aspergillus spp., such as CaM and the ITS region, although the ITS region has proved to be useful only for identification at the genus/section level. In the present work, the phylogenetic analysis with the BenA gene sequences could identify the isolates included in the study among the species A. flavus, A. fumigatus, A. niger and A. tubingensis (Figure 1).
On the other hand, fungal typing through RAPD-PCR offers the best potential in terms of obtaining discriminatory data quickly, easily and profitably. This technique has been used for a wide variety of species and has proven to be fast, easy and reproducible when the conditions and reagents of the RAPD-PCR are kept under control [31]. In this work, the RAPD-PCR protocol was carried out under strict conditions so that the tests were reproducible, and the handling of reagents, equipment and areas was always the same to ensure consistent results.
The number of primers used in genotypic variability studies is variable. For example, Ref. [32] used 100 primers to determine that the virulence of A. fumigatus is variable from one strain to another. However, Ref. [33] mentioned that as the number of primers increases, the interpretation of the profiles and the control of the reaction conditions become more difficult, which reduces the reproducibility. Therefore, in this study, 34 primers were used to obtain the polymorphic patterns, which was considered sufficient for the analysis.
Initially, the analysis of the polymorphic patterns was carried out qualitatively, by selecting only three primers per species and taking those that provided defined patterns with a high number of bands and species’ specificity. Among the selected qualitative primers, the most representative ones for the polymorphic patterns generated were OPA-19 for A. fumigatus and P54 for A. flavus, which also presented a specific pattern for all the species studied. The aforementioned agrees with the results reported by [13] when using the P54 primer and obtaining polymorphic patterns for the typing of 38 Aspergillus isolates from air samples in Tehran, Iran. In addition, this and other primers used in this study showed high discriminatory capacity and showed wide genetic diversity among the collected isolates.
The polymorphic patterns obtained for A. tubingensis and A. niger with the primer 1253 are similar, probably because they are species that belong to the same section (Nigri); however, the band pattern of A. tubingensis presents a band of 1700 bp, which is absent in A. niger, so this primer allows us to differentiate between the two species. Thus, the quantitative selection of the primers that generated specific polymorphic patterns for each Aspergillus sp. was useful. In their study, Ref. [34] carried out a quantitative analysis of polymorphic patterns generated by RAPD-PCR and statistically compared data obtained from the amplification, taking the values of each of the bands based on their molecular weights (high, medium and low) to weigh the results and thus eliminate the ambiguity that is generated in the qualitative analysis. Thus, taking these parameters into account, in this work a logistic regression analysis was carried out, which gave us a result of species vs. primer association which was selective and specific with the numerical function and thus useful to discriminate between species of the same genus. Furthermore, the database was validated with the statistical program JMP®Pro 13 and was built through visual analysis without using programs such as GelCompar II [35], PyElph [36], Quantity One [37] and Image Master [38], among others, which minimize the bias generated when obtaining data from polymorphic patterns; the data were also not normalized, as recommended in the literature [39]. The logistic regression model allowed the obtaining of ROC curves, which evaluated the sensitivity against the specificity of each primer for the different Aspergillus spp. evaluated. From the graphs obtained, the primers that presented an area greater than 0.9 were selected. In turn, it was possible to differentiate with those primers that were qualitatively selected in which lower percentages were obtained, as is the case of the primers OPA-19 with 75.42% and OPA-02 with 66.07% sensitivity against specificity compared to 100% obtained in the primer OPF-01, which was selected as a result of the logistic regression. This evidenced that the selection of primers without operative characteristics does not allow adequate identification.
Additionally, the application of the logistic regression model was evaluated using isolates of different geographical origins for their identification. It was observed that the primers OPC-06, OPF-01 and OPG-13 identified and differentiated previously defined isolates at the species level, which corroborated the ability of the models to discriminate between the species A. flavus, A. fumigatus and A. tubingensis. Regarding A. niger, the models of each primer were not able to discriminate this species due to factors that had a high weight in the statistical model, including the intensity and the similarity of banding with other species. Therefore, the use of other primers was suggested, such as those proposed by [40] that were able to distinguish between species of the same section.
In the group of primers selected quantitatively, OPF-01 showed a discriminatory capacity for the four species used in this work, with a particular discriminatory ability between closely related species such as A. fumigatus and A. lentulus, since the two belonged to the same section. The difference between these species was that the number of bands obtained for A. fumigatus was nine bands with molecular weights between 500 and 1800 bp, while for A. lentulus, there were only six bands, with molecular sizes between 300 and 1600 bp. It is worth mentioning that the use of the primer OPF-01 for RAPD-PCR has been reported for other species, such as Paracoccidioides brasiliensis [41], but does not allow discrimination between species. These results demonstrate that the application of a quantitative model for the selection of useful primers in the identification of Aspergillus spp. allows a more appropriate level of discrimination than commonly used qualitative analysis. This is the first proposal to achieve a methodology of quantitative selection.

5. Conclusions

This work shows that quantitative methods, rather than qualitative ones, are useful to select species-specific primers to discriminate between species.
The use of a quantitative method, namely logistic regression analysis, for the selection of primers, used in this study to generate polymorphic patterns through RAPD-PCR, allowed the identification of Aspergillus spp. The primers OPC-06, OPF-01 and OPG-13 generated specific polymorphic patterns for A. flavus, A. fumigatus and A. tubingensis, respectively, which, due to their operational characteristics, were specific and selective for each species. This analysis is the first to achieve a quantitative evaluation with mathematical models to determine the primer species-specific association.
The RAPD-PCR technique allowed the identification of Aspergillus spp. quickly and easily, without the need for sequencing methods, which can be very useful to improve the diagnostic methods of aspergillosis.

Supplementary Materials

The following supporting information can be downloaded at: https://www.mdpi.com/article/10.3390/jof8030296/s1, Figure S1: Macro- and micromorphological characteristics of the isolates used; Figure S2 (1–43): Polymorphic patterns obtained by RAPD-PCR for the four species with the 34 oligonucleotides; Figure S3 (1–14): Probability equation of the selected primers; Table S1 (1–3): Evaluation of the probability equation with primers OPC-06, OPF-01 and OPG-13 of Cuban isolates to determine the most probable species with the statistical analysis.

Author Contributions

Conceptualization, M.d.R.R.-M. and O.E.V.-L.; methodology, O.E.V.-L., C.A.C.-F. and M.G.F.-D.-L.; formal analysis, O.E.V.-L. and E.D.-E.; investigation, O.E.V.-L., C.A.C.-F., E.D.-E. and M.d.R.R.-M.; writing—original draft preparation, O.E.V.-L., C.A.C.-F., E.D.-E. and M.d.R.R.-M.; writing—review and editing, M.d.R.R.-M., O.E.V.-L., C.A.C.-F., E.D.-E. and M.G.F.-D.-L.; supervision, M.d.R.R.-M.; funding acquisition, M.d.R.R.-M. All authors have read and agreed to the published version of the manuscript.

Funding

The present research was funded by a grant from the “Programa de Apoyo a Proyectos de Investigación e Innovación Tecnológica-Dirección General de Asuntos del Personal Académico” from UNAM-Mexico (PAPIIT-DGAPA/UNAM-MX, Reference number-IT201318).

Acknowledgments

Valencia-Ledezma acknowledges the Dirección General de Asuntos de Personal Académico (DGAPA) for the support in the postdoctoral scholarship program at UNAM and for the realization of the Aspergillus research project. Castro-Fuentes appreciates the support provided by the Posgrado en Ciencias Biológicas de la Universidad Nacional Autónoma de México (UNAM) for the completion of this article.

Conflicts of Interest

The authors declare no conflict of interest.

References

  1. Sklenár, F.; Jurievic, Z.; Peterson, S.W.; Kolarík, M.; Novakova, A.; Flieger, M.; Stodulkova, E.; Kubátová, A.; Hubka, V. Increasing the species diversity in the Aspergillus section Nidulantes: Six novel species mainly from the indoor environment. Mycologia 2020, 112, 342–370. [Google Scholar] [CrossRef] [PubMed]
  2. Schabereiter-Gurtner, C.; Selitsch, B.; Rotter, M.L.; Hirschl, A.M.; Willinger, B. Development of novel real-time PCR assays for detection and differentiation of eleven medically important Aspergillus and Candida species in clinical specimens. J. Clin. Microbiol. 2007, 45, 906–914. [Google Scholar] [CrossRef] [PubMed] [Green Version]
  3. Samson, R.A.; Hong, S.B.; Frisvad, J.C. Old and new concepts of species differentiation in Aspergillus. Med. Mycol. 2006, 44, 133–148. [Google Scholar] [CrossRef] [PubMed] [Green Version]
  4. Espinel-Ingroff, A. Clinical relevance of fungal susceptibility testing and antifungal resistance. Clin. Microbiol. Newsl. 2000, 22, 137–140. [Google Scholar] [CrossRef]
  5. Garcia-Effron, G.; Dilger, A.; Alcazar-Fuoli, L.; Park, S.; Mellado, E.; Perlin, D.S. Rapid detection of triazole 132 N.M. Ashtiani; et al. antifungal resistance in Aspergillus fumigatus. J. Clin. Microbiol. 2008, 46, 1200–1206. [Google Scholar] [CrossRef] [PubMed] [Green Version]
  6. Ullmann, A.J.; Aguado, J.M.; Arikan-Akdagli, S.; Denning, D.W.; Groll, A.H.; Lagrou, K.; Lass-Florl, C.; Lewis, R.E.; Munoz, P.; Verweij, P.E.; et al. Diagnosis and management of Aspergillus diseases: Executive summary of the 2017 ESCMID-ECMM-ERS guideline. Clin. Microbiol. Infect. 2018, 24, e1–e38. [Google Scholar] [CrossRef] [PubMed] [Green Version]
  7. Schelenz, S.; Barnes, R.A.; Barton, R.C.; Cleverley, J.R.; Lucas, S.B.; Kibbler, C.C.; Denning, D.W.; British Society for Medical Mycology. British Society for Medical Mycology best practice recommendations for the diagnosis of serious fungal diseases. Lancet Infect. Dis. 2015, 15, 461–474. [Google Scholar] [CrossRef]
  8. Samson, R.A.; Visagie, C.M.; Houbraken, J.; Hong, S.B.; Hubka, V.; Klaassen, C.H.; Perrone, G.; Seifert, K.A.; Susca, A.; Tanney, J.B.; et al. Phylogeny, identification and nomenclature of the genus Aspergillus. Stud. Mycol. 2014, 78, 141–173. [Google Scholar] [CrossRef] [PubMed] [Green Version]
  9. Fernandez-Molina, J.V.; Abad-Díaz-de-Cerio, A.; Sueiro-Olivares, M.; Pellon, A.; Ramirez-Garcia, A.; Garaizar, J.; Pemán, J.; Hernando, F.L.; Rementeria, A. Rapid and specific detection of section Fumigati and Aspergillus fumigatus in human samples using a new multiplex real-time PCR. Diagn. Microbiol. Infect. Dis. 2014, 80, 111–118. [Google Scholar] [CrossRef] [PubMed]
  10. Jewtuchowicz, V.M.; Mujica, M.T.; Malzone, M.C.; Cuesta, A.; Nastri, M.L.; Iovannitti, C.A.; Rosa, A.C. Genetic relatedness of subgingival and buccal Candida dubliniensis isolates in immunocompetent subjects assessed by RAPD-PCR. J. Oral Microbiol. 2009, 15, 1. [Google Scholar] [CrossRef] [Green Version]
  11. Hong, S.B.; Kim, D.H.; Park, I.C.; Choi, Y.J.; Shin, H.D.; Samson, R.A. Re-identification of Aspergillus fumigatus sensu lato based on a new concept of species delimitation. J. Microbiol. 2010, 48, 607–615. [Google Scholar] [CrossRef] [PubMed]
  12. Bertone, A.M.; Rosa, A.C.; Nastri, N.; Santillán, H.D.; Ariza, Y.; Iovannitti, C.A.; Jewtuchowicz, V.M. Genetic-relatedness of peri-implants and buccal Candida albicans isolates determined by RAPD-PCR. Acta Odontol. Latinoam. 2016, 29, 197–205. [Google Scholar] [PubMed]
  13. Kermani, F.; Shams-Ghahfarokhi, M.; Gholami-Shabani, M.; Razzaghi-Abyaneh, M. Diversity, molecular phylogeny and fingerprint profiles of airborne Aspergillus species using random amplified polymorphic DNA. World J. Microbiol. Biotechnol. 2016, 32, 96. [Google Scholar] [CrossRef] [PubMed]
  14. Pena, G.A.; Alonso, V.; Manini, M.V.; Pellegrino, M.; Cavaglieri, L.R. Molecular characterization of Aspergillus fumigatus isolated from raw cow milk in Argentina: Molecular typing of A. fumigatus from raw cow milk. Int J. Food Microbiol. 2018, 20, 1–7. [Google Scholar] [CrossRef] [PubMed]
  15. Thanos, M.; Schonian, G.; Meyer, W.; Schweynoch, C.; Graser, Y.; Mitchell, T.G.; Presber, W.; Tietz, H.J. Rapid identification of Candida species by DNA fingerprinting with PCR. J. Clin. Microbiol. 1996, 34, 615–621. [Google Scholar] [CrossRef] [PubMed] [Green Version]
  16. Oliveira, M.M.E.; Almeida-Paes, R.; Muniz, M.M.; Gutierrez-Galhardo, M.C.; Zancope-Oliveira, R.M. Phenotypic and molecular identification of Sporothrix isolates from an epidemic area of sporotrichosis in Brazil. Mycopathologia 2011, 172, 257–267. [Google Scholar] [CrossRef] [PubMed]
  17. Pitt, J.I.; Hocking, A.D. Fungi and Food Spoilage, 2nd ed.; Springer: New York, NY, USA, 1997; pp. 377–385. [Google Scholar]
  18. Riddell, R.W. Permanent stained mycological preparations obtained by slide culture. Mycologia 1950, 42, 265–270. [Google Scholar] [CrossRef]
  19. Glass, N.L.; Donaldson, G.C. Development of primer sets designed for use with the PCR to amplify conserved genes from filamentous ascomycetes. Appl. Environ. Microbiol. 1995, 61, 1323–1330. [Google Scholar] [CrossRef] [PubMed] [Green Version]
  20. Altschul, S.F.; Madden, T.L.; Schäffer, A.A.; Zhang, J.; Zhang, Z.; Miller, W.; Lipman, D.J. Gapped BLAST and PSI-BLAST: A new generation of protein database search programs. Nucleic Acids Res. 1997, 25, 3389–3402. [Google Scholar] [CrossRef] [PubMed] [Green Version]
  21. Katoh, K.; Standley, D.M. MAFFT multiple sequence alignment software version 7: Improvements in performance and usability. Mol. Biol. Evol. 2013, 30, 772–780. [Google Scholar] [CrossRef] [PubMed] [Green Version]
  22. Darriba, D.; Taboada, G.L.; Doallo, R.; Posada, D. jModelTest 2: More models, new heuristics and parallel computing. Nat. Methods 2012, 9, 772. [Google Scholar] [CrossRef] [Green Version]
  23. Kumar, S.; Stecher, G.; Tamura, K. MEGA7: Molecular evolutionary genetics analysis version 7.0 for bigger datasets. Mol. Biol. Evol. 2016, 33, 1870–1874. [Google Scholar] [CrossRef] [PubMed] [Green Version]
  24. Kersulyte, D.; Woods, J.P.; Keath, E.J.; Goldman, W.E.; Berg, D.E. Diversity among clinical isolates of Histoplama capsulatum detected by polymerase chain reaction with arbitrary primers. J. Bacteriol. Res. 1992, 174, 7075–7079. [Google Scholar] [CrossRef] [PubMed] [Green Version]
  25. Woods, J.P.; Kersulyte, D.; Goldman, W.E.; Berg, D.E. Fast DNA isolation from Histoplasma capsulatum: Methodology for arbitrary primer polymerase chain reaction-based epidemiological and clinical studies. J. Clin. Microbiol. 1993, 31, 463–464. [Google Scholar] [CrossRef] [Green Version]
  26. Hu, J.; van Eysden, J.; Quiros, C.F. Generation of DNA-based markers in specific genome regions by two-primer RAPD reactions. PCR Methods Appl. 1995, 4, 346–351. [Google Scholar] [CrossRef]
  27. Fiuza, P.M.; Rodríguez, P.J.C. La regresión logística: Una herramienta versátil. Nefrología 2000, 20, 495–500. [Google Scholar]
  28. Fawcett, T. ROC graphs: Notes and practical considerations for researchers. Mach. Learn. 2004, 31, 1–38. [Google Scholar]
  29. Geiser, D.M.; Frisvad, J.C.; Taylor, J.W. Evolutionary relationships in Aspergillus section Fumigati inferred from partial β-tubulin and hydrophobin DNA sequences. Mycologia 1998, 90, 831–845. [Google Scholar] [CrossRef]
  30. Duarte-Escalante, E.; Frías-De-León, M.G.; Martínez-Herrera, E.; Acosta-Altamirano, G.; Rosas de Paz, E.; Reséndiz-Sánchez, J.; Refojo, N.; Reyes-Montes, M.R. Identification of CSP types and genotypic variability of clinical and environmental isolates of Aspergillus fumigatus from different geographic origins. Microorganisms 2020, 8, 688. [Google Scholar] [CrossRef] [PubMed]
  31. Lasker, B.A. Evaluation of Performance of Four Genotypic Methods for Studying the Genetic Epidemiology of Aspergillus fumigatus Isolates. J. Clin. Microbiol. 2002, 40, 2886–2892. [Google Scholar] [CrossRef] [Green Version]
  32. Mondon, P.; Thélu, J.; Lebeau, B.; Ambroise-Thomas, P.; Grillot, R. Virulence of Aspergillus fumigatus strains investigated by random amplified polymorphic DNA analysis. J. Med. Microbiol. 1995, 42, 299–303. [Google Scholar] [CrossRef] [PubMed] [Green Version]
  33. Lin, D.; Lehmann, P.F.; Hamory, B.H.; Padhye, A.A.; Durry, E.; Pinner, R.W.; Lasker, B.A. Comparison of three typing methods for clinical and environmental isolates of Aspergillus fumigatus. J. Clin. Microbiol. 1995, 33, 1596–1601. [Google Scholar] [CrossRef] [PubMed] [Green Version]
  34. Becerril, C.; Acevedo, H.; Llorente, M.T.; Castaño, E. Detección in vivo mediante RAPD de alteraciones en el ADN producidas por benzo (a) pireno. Rev. Toxicol. 2004, 21, 16–22. [Google Scholar]
  35. Munive, M.G.R.; González, G.A.; Aguirre, D.X. ADN polimórfico amplificado al azar (RAPD) y regiones intermedias entre secuencias simples repetidas. In Herramientas Moleculares Aplicadas en Ecología: Aspectos Teóricos y Prácticos, 1st ed.; Cornejo, R.A., Serrato, D.A., Rendón, A.B., Rocha, M.G., Eds.; Instituto Nacional de Ecología y Cambio Climático: Mexico City, Mexico, 2014; pp. 117–135. [Google Scholar]
  36. Pavel, A.B.; Vasile, C.I. PyElph-a software tool for gel images analysis and phylogenetics. BMC Bioinform. 2012, 13, 9. [Google Scholar] [CrossRef] [PubMed] [Green Version]
  37. Treviño-Castellano, M.; Rodríguez-Nóvoa, S.; Llovo-Taboada, J.; García-Zabarte, Á.; García-Riestra, C.; Regueiro-García, B.J. Uso combinado de amplificación aleatoria de polimorfismo del ADN (RAPD) y reacción en cadena de la polimerasa (touchdown PCR) en el estudio epidemiológico de Aspergillus fumigatus. Enferm. Infecc. Microbiol. Clin. 2003, 21, 472–476. [Google Scholar] [CrossRef]
  38. Granados, Z.S.J. Frecuencia de Neospora caninum en Bovinos Lecheros de 4 Distritos del Valle del Mantaro (Junín). Bachelor’s Thesis, Universidad Nacional Mayor de San Marcos, Lima, Peru, 2012. [Google Scholar]
  39. Ausina, V.; Catalán, V.; Cercenado, E.; Pelaz, A.C. Recomendaciones de la Sociedad Española de Enfermedades Infecciosas y Microbiología Clínica. In Procedimientos en Microbiología Clínica; Cercenado, E., Cantón, R., Eds.; McGraw-Hill Interamericana de España: Madrid, Spain, 2005; p. 20. [Google Scholar]
  40. Palumbo, J.D.; O’Keeffe, T.L. Detection and discrimination of four Aspergillus section Nigri species by PCR. Lett Appl. Microbiol. 2015, 60, 188–195. [Google Scholar] [CrossRef] [PubMed]
  41. De Moraes Borba, C.; Correia, J.; Vinhas, E.; Martins, A.; Costa Aguiar Alves, B.; Unkles, S.; Robertson Kinghorn, J.; Lucena-Silva, N. Genetic characterization of morphologically variant strains of Paracoccidioides brasiliensis. Memórias Inst. Oswaldo Cruz 2008, 103, 306–309. [Google Scholar] [CrossRef] [PubMed] [Green Version]
Figure 1. Phylogenetic tree based on the BenA gene sequence. The maximum likelihood analysis (ML) was performed with MEGA software v.10.1.7, using the substitution model general time reversible (GTR) model and gamma distributed (+G) with invariant sites (+I) (= GTR + G + I). All positions containing gaps and missing data were included for analysis. Clade supports were calculated based on 1000 bootstrap re-samplings. This analysis involved 35 taxa. The sequences analyzed were in the range of 439–566 bp.
Jof 08 00296 g001
Figure 2. Polymorphic patterns were obtained by RAPD-PCR with the primer OPA-19. Conditions were as described in the Materials and Methods section.
Jof 08 00296 g002
Figure 3. ROC curves of the quantitatively selected primers: (a) primer OPC-06; (b) primer OPF-01; (c) primer OPF-07 and (d) primer OPG-13. ROC-receiver operating characteristic.
Jof 08 00296 g003
Figure 4. Percentage of sensitivity vs. specificity of the primers selected qualitatively (P54, OPA-19, 1253 and OPA-02) and quantitatively (OPC-06, OPF-01, OPF-07 and OPG-13) for each species of Aspergillus analyzed.
Jof 08 00296 g004
Figure 5. RAPD-PCR was performed for A. fumigatus, A. niger, A. tubingensis and A. flavus with the primer OPF-01.
Jof 08 00296 g005
Table 1. Source and geographical origin of the isolates and reference strains.
SpeciesIsolate/Access NumberSourceGeographical Origin
A. flavus9343D-2ATCCND
323C/OM89286EnvironmentalMX
87A/OM892858EnvironmentalMX
A40/OM892868EnvironmentalMX
370B/OM892869EnvironmentalMX
MM-234/MT347712.1 EnvironmentalCU
MM-224/MT347711.1EnvironmentalCU
MM-243/MT347713.1EnvironmentalCU
A. fumigatusMYA3626ATCCND
MM12/OM892862ClinicalAR
MM16/OM89286ClinicalAR
MM18/OM892864ClinicalAR
MM21/OM892865ClinicalAR
MM-263/MT347701.1EnvironmentalCU
MM-265/MT347702.1EnvironmentalCU
MM-308/MT347703.1EnvironmentalCU
A. lentulusMYA3566ATCCND
A. nigerWB326ATCCND
387A/OM892858EnvironmentalMX
39A/OM892859EnvironmentalMX
335B/OM892860EnvironmentalMX
88C/OM892861EnvironmentalMX
MM-274/MT410062.1EnvironmentalCU
MM-291/MT410063.1EnvironmentalCU
A. tubingensis1004Reference strainMX
281C/OM892871EnvironmentalMX
146A/OM892872EnvironmentalMX
A26/OM892870EnvironmentalMX
220A/OM892873EnvironmentalMX
MM-251/MT410082EnvironmentalCU
MM-267/MT410083.1EnvironmentalCU
MM-342/MT410084.1EnvironmentalCU
ATCC: American Type Culture Collection; ND: not known; MX: Mexico; AR: Argentina; CU: Cuba.
Table 2. Reference sequences obtained from GenBank.
SpeciesAccess Number
A. nigerMT410061.1
MT410062.1
MT410063.1
A. tubingensisMT410082.1
MT410083.1
MT410083.1
A. flavusMT347712.1
MT347711.1
MT347711.1
A. fumigatusMT347701.1
MT347702.1
MT347703.1
A. lentulusMN275504.1
MN275503.1
N275501.1
Table 3. Primers used for the RAPD-PCR technique.
PrimerSequence 5′-3′
1281AACGCGCAAC
1283CGGATCCCCA
R108GTATTGCCCT
1253GTTTCCGCCC
OPA-19CAAACGTCGG
OPA-16AGCCAGCGAA
OPB-12CCTTGACGCA
OPA-17GACCGCTTGT
OPA-15TTCCGAACCC
OPF-05CCGAATTCCC
OPA-08GTGACGTAGG
OPC-07GTCCCGATGA
OPG-01CTACGGAGGA
OPG-03GAGCCCTCCA
OPG-13CTCTCCGCCA
OPG-15ACTGGGACTC
OPC-06GAACGGACTC
OPG-05CTGAGACGGA
OPM-12GGGACGTTGG
OPH-03AGACGTCCAC
OPG-07GAACCTGCGG
OPH-18GAATCGGCCA
OPF-01ACGGATTCTG
OPF-07CCGATATCCC
OPF-09CCAAGCTTCC
OPE-02GGTGCGGGAA
P54GGCGATTTTTGCCG
P160CATGGCCACC
PELFATATCATCGAAGCCGC
B-04TGCCATCAGT
OPH-17CACTCTCCTC
T3BAGGTCGCGGGTTCGAATCC
OPA-02TGCCGAGCTG
OPA-03AGTCAGCCAC
Table 4. Species-specific primers qualitatively selected for each species.
Species-Specific PrimersIdentified SpeciesNumber of Bands GeneratedMolecular Size (pb)
OPA-19A. fumigatus3–5200–2400
1253A. niger13190–16,002
OPA-02A. tubingensis2500–1600
P54A. flavus13190–2300
Publisher’s Note: MDPI stays neutral with regard to jurisdictional claims in published maps and institutional affiliations.

