
Sesquiterpenoids and Xanthones from the Kiwifruit-Associated Fungus Bipolaris sp. and Their Anti-Pathogenic Microorganism Activity


National Demonstration Center for Experimental Ethnopharmacology Education, School of Pharmaceutical Sciences, South-Central University for Nationalities, Wuhan 430074, China
*
Author to whom correspondence should be addressed.
J. Fungi 2022, 8(1), 9; https://doi.org/10.3390/jof8010009
Submission received: 13 December 2021
/
Revised: 21 December 2021
/
Accepted: 21 December 2021
/
Published: 23 December 2021
(This article belongs to the Special Issue Secondary Metabolites from Fungi—in Honour of Prof. Dr. Ji-Kai Liu's 60th Birthday)
Abstract
:Nine previously undescribed sesquiterpenoids, bipolarisorokins A–I (1–9); two new xanthones, bipolarithones A and B (10 and 11); two novel sativene-xanthone adducts, bipolarithones C and D (12 and 13); as well as five known compounds (14–18) were characterized from the kiwifruit-associated fungus Bipolaris sp. Their structures were elucidated by extensive spectroscopic methods, electronic circular dichroism (ECD), 13C NMR calculations, DP4+ probability analyses, and single crystal X-ray diffractions. Many compounds exhibited anti-pathogenic microorganism activity against the bacterium Pseudomonas syringae pv. actinidiae and four pathogenic microorganisms.
1. Introduction
Kiwifruit (Actinidia chinensis Planch., Actinidiaceae) is an emerging, healthy, and economical fruit which has become increasingly popular worldwide owing to its flavor and nutritional properties [1]. It is an excellent source of vitamin C and provides balanced nutritional components of minerals, dietary fiber, folate, and health-promoting metabolites [2,3]. China is the leading kiwifruit producer in the world, followed by Italy and New Zealand. The cultivation area and annual output reached 243,000 hm2 and 2,500,000 tons at the end of 2020 [4]. Nevertheless, as the cultivation of kiwifruit expands rapidly, many serious diseases such as bacterial canker, soft rot, bacterial blossom blight, brown spot, and root rot are a serious and ongoing threat to kiwifruit production [5,6,7,8,9,10,11,12]. Particularly, the destructive bacterial canker disease, which is associated with an infection by P. syringae pv. actinidiae (Psa), has led to reduced kiwifruit production and huge economic losses worldwide [13,14]. Although the application of copper-based chemicals and streptomycin have played a positive role in the prevention and treatment of bacterial canker, these chemical residues are extremely threatening to human health and the ecological environment [15,16]. Additionally, chemical fungicides easily induce pathogen resistance [17,18]. Thus, it is urgent to develop safer and more effective biological pesticides.
Endophytic microorganisms reside within different tissues of the host plant without causing any disease symptoms and produce various metabolites with different activities [19,20]. Therefore, the endophytic fungi have been proved to be valuable sources of important natural products [21,22]. Some natural products from endophytic fungi play important roles in plant defense systems. Therefore, we carried out the excavation of anti-Psa active substances from metabolites of kiwifruit endophytes and harvested a number of bioactive molecules. For instance, 3-decalinoyltetramic acids and cytochalasins from the kiwifruit endophytic fungus Zopfiella sp showed anti-Psa activity [23,24], while imidazole alkaloids ether were characterized as anti-Psa agents from Fusarium tricinctum [25]. These discoveries prompted us to search for more novel and bioactive metabolites from kiwifruit-associated fungi. In the current study, a total of eighteen compounds have been isolated from the large-scale fermentation of the kiwifruit-associated fungus Bipolaris sp. (Figure 1), which included nine new sativene or longifolene sesquiterpenoids, bipolarisorokins A–I (1–9); two new xanthones, bipolarithones A and B (10 and 11); two novel sativene-xanthone adducts, bipolarithones C and D (12 and 13); as well as five known ones (14–18). Their structures were established by means of spectroscopic methods, namely, ECD and 13C NMR calculations, DP4+ probability analyses, and single crystal X-ray diffractions. All compounds were evaluated for their inhibitory activities against Psa. Additionally, their inhibitory activity against four phytopathogens (Phytophthora infestans, Alternaria solani, Rhizoctonia solani, and Fusarium oxysporum) were assessed. Here, the details of isolation, structural elucidation, and bioactivity evaluations for 1–18 are reported.
2. Materials and Methods
2.1. General Experimental Procedures
Melting points were obtained on an X-4 micro melting point apparatus. Optical rotations were measured with an Autopol IV polarimeter (Rudolph, Hackettstown, NJ, USA). UV spectra were obtained using a double beam spectrophotometer UH5300 (Hitachi High-Technologies, Tokyo, Japan). IR spectra were obtained by a Shimadzu IRTracer-100 spectrometer using KBr pellets. 1D and 2D NMR spectra were run on a Bruker Avance III 600 MHz spectrometer with TMS as an internal standard. Chemical shifts (δ) were expressed in ppm with references to the solvent signals. High resolution electrospray ionization mass spectra (HR-ESIMS) were recorded on a LC-MS system consisting of a Q Exactive™ Orbitrap mass spectrometer with an HRESI ion source (ThermoFisher Scientific, Bremen, Germany) used in ultra-high-resolution mode (140,000 at m/z 200) and a UPLC system (Dionex UltiMate 3000 RSLC, ThermoFisher Scientific, Bremen, Germany). Column chromatography (CC) was performed on silica gel (200–300 mesh, Qingdao Marine Chemical Ltd., Qingdao, China), RP-18 gel (20–45 µm, Fuji Silysia Chemical Ltd., Kasugai, Japan), and Sephadex LH-20 (Pharmacia Fine Chemical Co. Ltd., Uppsala, Sweden). Medium-pressure liquid chromatography (MPLC) was performed on a Büchi Sepacore System equipped with a pump manager C-615, pump modules C-605, and a fraction collector C-660 (Büchi Labortechnik AG, Flawil, Switzerland). Preparative high-performance liquid chromatography (prep-HPLC) was performed on an Agilent 1260 liquid chromatography system equipped with Zorbax SB-C18 columns (5 μm, 9.4 mm × 150 mm, or 21.2 mm × 150 mm) and a DAD detector. Chiral resolution was achieved by HPLC equipped with a Daicel AD-H column. Fractions were monitored by TLC (GF 254, Qingdao Haiyang Chemical Co. Ltd. Qingdao, China), and spots were visualized by heating silica gel plates sprayed with 10% H2SO4 in EtOH.
2.2. Fermentation, Extraction, and Isolation
The fungus Bipolaris sp. was isolated from fresh and healthy stems of kiwifruit plants (Actinidia chinensis Planch., Actinidiaceae), which were collected from the Cangxi county of the Sichuan Province (GPS: N 31°12′, E 105°76′) in July 2018. Each fungus was obtained simultaneously from at least three different healthy tissues. The fungus was identified as one species of the genus Bipolaris by observing the morphological characteristics and analysis of the internal transcribed spacer (ITS) regions. A living culture (internal number HFG-20180727-HJ32) has been deposited at the School of Pharmaceutical Sciences, South-Central University for Nationalities, China.
This fungal strain was cultured on a potato dextrose agar (PDA) medium at 24 °C for 10 days. The agar plugs were inoculated in 500 mL Erlenmeyer flasks, each containing 100 mL potato dextrose media. Flask cultures were incubated at 28 °C on a rotary shaker at 160 rpm for two days as the seed culture. Four hundred 500 mL Erlenmeyer flasks, each containing 150 mL potato dextrose broth (PDB), were individually inoculated with 25 mL of seed culture and were incubated at 25 °C on a rotary shaker at 160 rpm for 25 days.
The cultures of Bipolaris sp. (60 L) were extracted four times by EtOAc to afford a crude extract (32.0 g) which was subjected to CC over silica gel eluted with a gradient of CHCl3-MeOH (a gradient from 1:0 to 0:1) to give six fractions, A–F. Fraction B (13.0 g) was fractionated by MPLC CC over RP-18 eluted with MeOH–H2O (from 10:90 to 100:0, v/v) to give twelve sub-fractions (B1–B12). Fraction B3 (1.2 g) was applied to Sephadex LH-20 eluting with CHCl3–MeOH (1:1, v/v) and was further purified by preparative HPLC with MeCN–H2O (19:81, v/v, 4.0 mL/min) to obtain compounds 9 (18.6 mg, retention time (tR) = 40 min), 18 (22.6 mg, tR = 15.8 min), 2 (3.3 mg, tR = 32 min), and 1 (5.4 mg, tR = 36 min). Fraction B5 (2.1 g) was separated by CC over silica gel with a gradient elution of the CHCl3–MeOH system (50:1→0:1) and was prepared by HPLC with MeCN–H2O (12:88, v/v, 4.0 mL/min) to obtain 3 (4.9 mg, tR = 36 min), 4 (14.4 mg, tR = 46 min), 17 (28.3 mg, tR = 43 min), and 5 (2.1 mg, tR = 40 min). Fraction B6 (1.8 g) was purified over Sephadex LH-20 eluted with MeOH to give four subfractions (B6.1–B6.4). Fraction B6.2 (210 mg) was purified using semipreparative HPLC with MeOH-H2O (28:72, v/v, 3.0 mL/min) to afford 8 (8.8 mg, tR = 17.8 min) and 7 (9.6 mg, tR = 21.1 min). Fraction B6.3 (170 mg) was purified by preparative HPLC with MeCN–H2O (23:77, v/v, 4 mL/min) to yield 6 (4.3 mg, 26 min). Fraction C (4.3 g) was separated by CC over silica gel with a gradient elution of PE-acetone (50:1→0:1) to afford subfractions C1–C8. Fraction C2 (340 mg) was purified by preparative HPLC with MeCN-H2O (55:45, v/v, 4 mL/min) to give 12 (10.3 mg, tR = 38 min), 13 (3.7 mg, tR = 39 min), 14 (3.1 mg, tR = 36 min) and 15 (3.4 mg, tR = 34 min). Fraction C5 (230 mg) was isolated by CC over Sephadex LH-20 (MeOH) and was prepared by HPLC (32:68, v/v, 4 mL/min) to give 10 (3.7 mg, tR = 28 min), 11 (4.2 mg, tR = 29 min), and 16 (5.1 mg, tR = 24 min).
Bipolarisorokin A (1): colorless crystals; mp 145–148 °C; [α]20D + 67.8 (c 0.01, MeOH); UV (MeOH) λmax (log ε) 205 (3.30); IR (KBr) νmax 3360, 2947, 2833, 1651, 1454, 1114, 1031 cm−1; 1H NMR (600 MHz, CDCl3) and 13C NMR (150 MHz, CDCl3) data, see Table 1; positive ion HRESIMS m/z 251.16624 [M–H]+, (calculated for C15H23O3− 251.16527).
Bipolarisorokin B (2): colorless oil; [α]22D − 100.1 (c 0.05, MeOH); UV (MeOH) λmax (log ε) 210 (3.23); 1H NMR (600 MHz, CDCl3) and 13C NMR (150 MHz, CDCl3) data, see Table 1; positive ion HRESIMS m/z 275.16166 [M+Na]+, (calculated for C15H24O3Na+ 275.16177).
Bipolarisorokin C (3): colorless, needle-like crystals (MeOH); mp 135–138 °C; [α]22D − 21.8 (c 0.05, MeOH); UV (MeOH) λmax (log ε) 265 (3.49) nm; 1H NMR (600 MHz, methanol-d4) and 13C NMR (150 MHz, methanol-d4) data, see Table 1; positive ion HRESIMS m/z 253.17971 [M+H]+ (calculated for C15H25O3+ 253.17982).
Bipolarisorokin D (4): colorless oil; [α]25D + 32.0 (c 0.05, MeOH); UV (MeOH) λmax (log ε) 255 (3.65); 1H NMR (600 MHz, methanol-d4) and 13C NMR (150 MHz, methanol-d4) data, see Table 2; positive ion HRESIMS m/z 275.16153 [M+Na]+ (calculated for C15H24NaO3+ 275.16177). Bipolarisorokin E (5): colorless oil; [α]25D − 22.7 (c 0.05, MeOH); UV (MeOH) λmax (log ε) 210 (3.24); 1H NMR (600 MHz, methanol-d4) and 13C NMR (150 MHz, methanol-d4) data, see Table 2; positive ion HRESIMS m/z 221.15529 [M–H]− (calculated for C14H21O2− 221.15470).
Bipolarisorokin F (6): white powder; [α]20D − 3.3 (c 0.04, MeOH); UV (MeOH) λmax (log ε) 215 (3.72); 1H NMR (600 MHz, CDCl3) and 13C NMR (150 MHz, CDCl3) data, see Table 2; positive ion HRESIMS m/z 225.18506 [M+H]+ (calculated for C14H25O2+ 225.18491).
Bipolarisorokin G (7): colorless oil; [α]20D + 17.2 (c 0.02, MeOH); UV (MeOH) λmax (log ε) 230 (3.21); 1H NMR (600 MHz, CDCl3) and 13C NMR (150 MHz, CDCl3) data, see Table 3; positive ion HRESIMS m/z 275.20059 [M+H]+ (calculated for C18H27O2+ 275.20056).
Bipolarisorokin H (8): colorless oil; [α]25D − 136.9 (c 0.05, MeOH); UV (MeOH) λmax (log ε) 225 (3.93); 1H NMR (600 MHz, CDCl3) and 13C NMR (150 MHz, CDCl3) data, see Table 3; positive ion HRESIMS m/z 277.17984 [M+H]+ (calculated for C17H25O3+ 277.17982).
Bipolarisorokin I (9): colorless crystals; mp 191–194 °C; [α]22D + 8.8 (c 0.05, MeOH); UV (MeOH) λmax (log ε) 210 (3.46); 1H NMR (600 MHz, methanol-d4) and 13C NMR (150 MHz, methanol-d4) data, see Table 3; positive ion HRESIMS m/z 251.16621 [M–H]−, (calculated for C21H23O3− 251.16527).
Bipolarithone A (10): colorless oil; [α]23D + 136.0 (c 0.05, MeOH); UV (MeOH) λmax (log ε) 245 (3.30); 1H NMR (600 MHz, CDCl3) and 13C NMR (150 MHz, CDCl3) data, see Table 4; positive ion HRESIMS m/z 349.09143 [M+H]+, (calculated for C17H17O8+ 349.09179).
Bipolarithone B (11): colorless oil; [α]23D − 24.2 (c 0.05, MeOH); UV (MeOH) λmax (log ε) 245 (3.30); 1H NMR (600 MHz, CDCl3) and 13C NMR (150 MHz, CDCl3) data, see Table 4; positive ion HRESIMS m/z 349.09157 [M+H]+, (calculated for C17H17O8+ 349.09179).
Bipolarithone C (12): colorless oil; [α]25D + 52.9 (c 0.5, MeOH); UV (MeOH) λmax (log ε) 245 (4.06); 1H NMR (600 MHz, CDCl3) and 13C NMR (150 MHz, CDCl3) data, see Table 5; positive ion HRESIMS m/z 541.24310 [M+H]+, (calculated for C30H37O9+ 541.24321).
Bipolarithone D (13): colorless oil; [α]25D + 10.2 (c 0.5, MeOH); UV (MeOH) λmax (log ε) 245 (3.88); 1H NMR (600 MHz, CDCl3) and 13C NMR (150 MHz, CDCl3) data, see Table 5; positive ion HRESIMS m/z 541.24316 [M+H]+, (calculated for C30H37O9+ 541.24321).
Crystal data for Cu_1_0m: C15H24O3, M = 252.34, a = 9.7038(6) Å, b = 13.7866(8) Å, c = 16.6333(10) Å, α = 95.329(3)°, β = 104.898(2)°, γ = 102.525(3)°, V = 2073.0(2) Å3, T = 100(2) K, space group P 1, Z = 6, μ(Cu Kα) = 1.54178 mm−1, F(000) = 828, 82979 reflections measured, 16831 independent reflections (Rint = 0.0695). The final R1 values were 0.0437 (I > 2σ(I)). The final wR(F2) values were 0.1047 (I > 2σ(I)). The final R1 values were 0.0531 (all data). The final wR(F2) values were 0.1143 (all data). The goodness of fit on F2 was 1.039. Flack parameter = −0.10(7). CCDC: 2124305. Available online: https://www.ccdc.cam.ac.uk (accessed on 11 December 2021).
Crystal data for Cu_3_0m: C15H24O3, M = 252.34, a = 7.0044(5) Å, b = 10.1468(8) Å, c = 20.1433(14) Å, α = 90.00°, β = 90.00°, γ = 90.00°, V= 1431.63(18) Å3, T = 295(2) K, space group P 21 21 21, with Z = 4, μ(Cu Kα) = 1.54178 mm−1, F(000) = 552, 6263 reflections measured, 2527 independent reflections (Rint = 0.0500). The final R1 values were 0.0519 (I > 2σ(I)). The final wR(F2) values were 0.1538 (I > 2σ(I)). The final R1 values were 0.0719 (all data). The final wR(F2) values were 0.2087 (all data). The goodness of fit on F2 was 1.117. Flack parameter = −0.40(17). CCDC: 2124306. Available online: https://www.ccdc.cam.ac.uk (accessed on 11 December 2021).
Crystal data for Cu_9_0m: C15H24O3, M = 252.34, a = 6.8634(2) Å, b = 15.0872(4) Å, c = 13.5156(3) Å, α = 90.00°, β = 90.4010(10)°, γ = 90.00°,V = 1399.50(6) Å3, T = 295(2) K, space group P 1 21 1, with Z = 4, μ(Cu Kα) = 1.54178 mm−1, F(000) = 552, 32232 reflections measured, 5982 independent reflections (Rint = 0.0279). The final R1 values were 0.0300 (I > 2σ(I)). The final wR(F2) values were 0.0808 (I > 2σ(I)). The final R1 values were 0.0304 (all data). The final wR(F2) values were 0.0812 (all data). The goodness of fit on F2 was 1.057. Flack parameter = −0.01(3). CCDC: 2124307. Available online: https://www.ccdc.cam.ac.uk (accessed on 11 December 2021).
Crystal data for Cu_17_0m: C14H24O2, M = 224.33, a = 13.6388(2) Å, b = 13.6388(2) Å, c = 13.0174(2) Å, α = 90.00°, β = 90.00°, γ = 90.00°, V = 2097.04(7) Å3, T = 296(2) K, space group P 31 2 1, with Z = 6, μ(Cu Kα) = 1.54178 mm−1, F(000) = 744, 39026 reflections measured, 3033 independent reflections (Rint = 0.0459). The final R1 values were 0.0353 (I > 2σ(I)). The final wR(F2) values were 0.0988 (I > 2σ(I)). The final R1 values were 0.0366 (all data). The final wR(F2) values were 0.1003 (all data). The goodness of fit on F2 was 1.047. Flack parameter =0.01(5). CCDC: 2126101. Available online: https://www.ccdc.cam.ac.uk (accessed on 11 December 2021).
Crystal data for Cu_18_0m: C15H26O2, M = 238.36, a = 13.1977(2) Å, b = 13.1977(2) Å, c = 8.49040(10) Å, α = 90.00°, β = 90.00°, γ = 90.00°, V = 1478.85(5) Å3, T = 297(2) K, space group P 43, with Z = 4, μ(Cu Kα) = 1.54178 mm−1, F(000) = 528, 14568 reflections measured, 3063 independent reflections (Rint = 0.0269). The final R1 values were 0.0534 (I > 2σ(I)). The final wR(F2) values were 0.1525 (I > 2σ(I)). The final R1 values were 0.0541 (all data). The final wR(F2) values were 0.1539 (all data). The goodness of fit on F2 was 1.051. Flack parameter =0.12(7). CCDC: 2126105. Available online: https://www.ccdc.cam.ac.uk (accessed on 11 December 2021).
2.3. ECD Calculations
The ECD calculations were carried out using the Gaussian 16 software package [26]. Systematic conformational analyses were performed via SYBYL-X 2.1 using the MMFF94 molecular mechanics force field calculation with 10 kcal/mol of cutoff energy [27,28]. The optimization and frequency of conformers were calculated on the B3LYP/6-31G(d) level in the Gaussian 09 program package. The ECD (TDDFT) calculations were performed on the B3LYP/6-311G(d) level of theory with an IEFPCM solvent model (MeOH). The ECD curves were simulated in SpecDis V1.71 using a Gaussian function [29]. The calculated ECD data of all conformers were Boltzmann averaged by Gibbs free energy.
2.4. NMR Calculations
All the optimized conformers in an energy window of 5 kcal/mol (with no imaginary frequency) were subjected to gauge-independent atomic orbital (GIAO) calculations of their 13C NMR chemical shifts, using density functional theory (DFT) at the mPW1PW91/6-311+G (d,p) level with the PCM model. The calculated NMR data of these conformers were averaged according to the Boltzmann distribution theory and their relative Gibbs free energy. The 13C NMR chemical shifts for TMS were also calculated by the same procedures and used as the reference. After the calculation, the experimental and calculated data were evaluated by the improved probability DP4+ method [30].
2.5. Antibacterial Activity Assay
The bacterium P. syringae pv. actinidiae was donated by Dr. He Yan of Northwest A&F University, China. A sample of each culture was then diluted 1000-fold in fresh Luria-Bertani (LB) (Beijing Solarbio Science & Technology. Co. Ltd., Beijing, China) and incubated with shaking (160 rpm) at 27 °C for 10 h. The resultant mid-log phase cultures were diluted to a concentration of 5 × 10⁵ CFU/mL, then 160 μL was added to each well of the compound-containing plates. Subsequently, 1:1 serial dilutions with sterile PBS of each compound were performed, giving a final compound concentration range from 4 to256 μg/mL. The minimum inhibitory concentration (MIC, with an inhibition rate of ≥90%) was determined by using photometry at OD600 nm after 24 h. Streptomycin was used as the positive control.
2.6. Anti-Phytopathogens Assay
Four phytopathogens (Phytophthora infestane, Alternaria solani, Rhizoctonia solani, and Fusarium oxysporum) were cultured in PDA with micro glass beads at 27 °C for a week, as well as shaking (160 rpm). Ninety microliters of PDA, together with a 10 μL volume of an aqueous test sample solution, was added into each well of the 96-well plate. The test solutions contained different concentrations of the sample being tested. Then, agar plugs (1 mm3) with fresh phytopathogens were inoculated into each well. Subsequently, a two-fold serial dilution in the microplate wells was performed over a concentration range of 4 to 256 μg/mL. Plates were covered and incubated at 27 °C for 24 h. Finally, the minimum inhibitory concentration was determined by observing the plates, with no growth in the well taken as that value. Hygromycin B was used as the positive control.
3. Results and Discussion
Bipolarisorokin A (1) was isolated as colorless crystals. Its molecular formula of C15H24O3 was determined on the basis of the HR-ESIMS data (measured at m/z 251.16624 [M–H]−, calculated for C15H23O3− 251.16527), corresponding to four degrees of unsaturation. The 1H and 13C NMR spectra, in association with the HSQC spectrum, revealed two methyls, four methenes, seven methines, and two quaternary carbons (Table 1). Of them, signals at δC 66.9 (t, C-11), 69.6 (d, C-14), and 74.9 (d, C-15) were identified as the oxygenated methylene and methines. Two olefinic carbons at δC 156.8 (s, C-2) and 103.5 (t, C-12) corresponded to a double bond, which suggested that 1 possessed a tricyclic system. Considering the 15 carbons in 1, as well as those isolates from the same source, compound 1 was suggested to be a tricyclic sesquiterpenoid. In the 1H–1H COSY spectrum, a fragment was revealed, as shown with bold lines in Figure 2. The HMBC correlations from to δH 4.94 (H, s, H-12a) and 4.62 (H, s, H-12b), to δC 156.8 (s, C-2), 54.3 (d, C-1) and 43.0 (s, C-3), established the connections between C-12, C-2, and C-1. Further analyses of 1H–1H COSY, as well as HMBC correlations from δH 0.92 (3H, d, J = 6.8 Hz, H-10) to δC 37.6 (d, C-6), 40.5 (d, C-9) and 66.9 (t, C-11), indicated a hydroxy group at C-11. In addition, the connections of C-8/C-3, C-3/C-4, C-3/C-2, and C-3/C-13 were deduced from HMBC correlations from δH 1.05 (3H, s, H-8) to δC 43.0 (s, C-3), 39.9 (t, C-4), 156.8 (s, C-2), and 58.2 (d, C-13). Moreover, the proton of an oxygenated methine at δH 4.02 (H, d, J = 5.9 Hz, H-14) showed key correlations to C-13, C-3, and δC 42.2 (d, C-7), which indicated that δC 69.6 (d, C-14) should be placed at C-13. The above 2D NMR data analysis suggested that compound 1 possessed a sativene type sesquiterpene backbone. A ROESY experiment was carried out to establish the relative configuration of 1 (Figure 3). The key correlations of H-13/H-8, H-13/H-6, H-8/H-14, and H-7/H-13 suggested that H-6, H-7, H-8, and H-13 were β oriented, while the correlation of H-1/H-9 indicated that H-1 and H-9 were α-oriented. Because of the rigid structure and the ROESY correlation of H-8/H-14, both H-14 and H-15 were assigned as an α orientation [31]. Finally, the single-crystal X-ray diffraction not only confirmed the planar structure, as elucidated above, but also established the absolute configuration of 1 (Flack parameter = −0.10(7), CCDC: 2124305; Figure 4).
The molecular formula of bipolarisorokin B (2) was determined to be C15H24O3 from the HRESIMS data (measured at m/z 275.16166 [M+Na]+, calculated for C15H24O3Na+ 275.16177). Close similarities were observed in the 1D NMR data (Table 1) of compound 1. However, signals for a methyl (δH 0.94, d, J = 6.9 Hz, H-11; δC 16.4, C-11) and an oxygenated quaternary carbon (δC 73.7, C-6) in 2 was suggested to replace the oxymethylene (δH 3.64, overlap, H-11; δC 66.9, C-11) and the methine (δH 1.65, m, H-6; δC 37.6, C-6) in 1. These observations indicated that the hydroxy group at C-10 in 1 migrated to C-6 in 2. The observed 1H−1H COSY cross-peak of H-10 (δH 0.88, 3H, d, J = 6.9 Hz) and H-9 (δH 1.57, 1H, m), and H-9/H-11, along with the HMBC correlations from H-10 to C-6, C-9, and C-11 confirmed the above deduction (Figure 2). Furthermore, ROESY correlations of H-13/H-8, H-8/H-14, H-7/H-13, and H-1/H-9 revealed that compounds 2 and 1 shared the same relative configuration. In consideration of its biosynthetic origin, the absolute configuration of compound 2 was identified the same as that of 1.
Bipolarisorokin C (3) was obtained as colorless needles. Its molecular formula of C15H24O3 was determined on the basis of the HR-ESIMS data (measured at m/z 253.17971 [M+H]+, calculated for C15H25O3+ 253.17982), corresponding to four degrees of unsaturation. The 1H NMR data (Table 1) showed characteristic signals, including three methyls at δH 0.78 (3H, d, J = 6.4 Hz, H-10), 1.06 (3H, d, J = 6.4 Hz, H-11), and 2.13 (3H, s, H-12), and the proton of an aldehyde group at δH 10.02 (H, s, H-15). The 1H and 13C NMR data, in association with the HSQC data, revealed three methyls, four methenes, five methines, and three nonprotonated carbons (Table 1). Preliminary analyses on the 1D NMR data revealed that 3 was likely to be a seco-sativene type sesquiterpenoid. Detailed analyses of the 2D NMR data indicated that the majority of the data of 3 was the same as those of helminthosporol [32], except for a hydroxy group at C-8 (t, δC 64.6) in 3, which was confirmed by the HMBC correlations from δH 3.63 (H, d, J = 11.6 Hz, H-8a) and 3.71 (H, d, J = 11.6 Hz, H-8b) to δC 58.0 (s, C-3), 29.6 (t, C-4), 167.0 (s, C-2), and 60.8 (d, C-13) (Figure 2). A ROESY experiment was carried out to establish the relative configuration of 3 (Figure 3). The cross peaks of H-13/H-8a, H-13/H-4b, H-4b/H-6, and H-7/H-14b were observed, which indicated that H-6, H-7, H-8, and H-13 were β oriented. Furthermore, single crystal X-ray diffraction established the relative configuration (Flack parameter = −0.40(17), CCDC: 2124306; Figure 4), and the absolute configuration of 3 was determined by ECD calculations, as shown in Figure 5.
Bipolarisorokin D (4) was isolated as a colorless oil. The molecular formula was determined to be C15H24O3 according to the HRESIMS spectra (measured at m/z 275.16153 [M+Na]+, calculated for C15H24NaO3+ 275.16177). Compound 4 had the same molecular formula and NMR spectral patterns to that of 3 (Table 2). The key difference was an oxygenated quaternary carbon (δC 73.5, s) in 4 instead of the methine in 3 (δC 46.4, d). The HMBC correlations from H-4a (δH 1.38, m), H-5b (δH 1.61, m), H-7 (δH 3.16, br s), H-10 (δH 1.02, d, J = 6.6 Hz), and H-11 (δH 0.80, d, J = 6.6 Hz) to δC 73.5 established the quaternary carbon to be C-6. In addition, a methyl (s, δH 1.07, H-8; δC 18.7, C-8) in 4 replaced the oxygenated methylene (δC 64.6) of C-8 in 3, which was verified by HMBC correlations from H-8 (δH 1.07, s) to C-2 (δC 170.4, s), C-3 (δC 52.0, s), C-4 (δC 32.4, t), and C-13 (δC 55.3, d). Detailed analyses of 2D NMR (HSQC, HMBC, 1H-1H COSY and ROESY) data confirmed that the other fragments of 4 were the same as those of 3.
Bipolarisorokin E (5) was obtained as a colorless oil. Its molecular formula C14H22O2 was characterized according to HRESIMS (measured at m/z 221.15529 [M–H]-, calculated for C14H21O2− 221.15470), implying four degrees of unsaturation. The general features of its NMR data closely resembled that of 3 (Table 2). Detailed analyses of 1D and 2D NMR data revealed the differences. At first, the loss of the aldehyde group at C-1 was revealed by the chemical shift of C-1 at δC 124.2, along with the data from 1H–1H COSY and HMBC spectra as shown in Figure 2. Second, the hydroxy migrated from C-8 to C-12 (δC 59.8, t) as identified by the HMBC correlation from δH 4.06 (2H, m, H-12) to δC 124.2 (d, C-1), 147.2 (s, C-2), and 47.7 (s, C-3). Third, one double bond between C-9 and C-10 was built by HMBC correlations from δH 4.69 (2H, d, J = 5.1 Hz, H-10) to δC 22.7 (q, C-11) and 45.2 (d, C-6). The other parts of 5 were elucidated as the same as those of 3 by a detailed analysis of 2D NMR data.
Bipolarisorokin F (6) was purified as white powder, and its molecular formula C14H24O2 was determinded according to HRESIMS (measured at m/z 225.18506 [M+H]+, calculated for C14H25O2+ 225.18491). Analyses of the 1D and 2D NMR data (Table 2) suggested that 6 showed structural similarities to 3. The distinction between the two compounds was that the α,β-unsaturated aldehyde group (δC 140.0, C-1; δC 167.0, C-2; δC 190.0, C-15) in 3 was replaced by a carbonyl (δC 212.0, C-1) and a methylene group (δC 50.7, C-2) in 6. It was supported by HMBC correlations from δH 2.70 (H, br s, H-7), 0.96 (3H, q, J = 7.2 Hz, H-12), and 1.72 (H, dd, J = 7.9, 5.0 Hz, H-13) to δC 212.0 (s, C-1), 50.7(d, C-2), and the COSY cross-peak of δH 2.10 (1H, m, H-2) and H-12. The hydroxymethyl group (C-8) in 3 was replaced by a methyl group at C-8 (δC 22.1, q) in 6, as well as the HMBC correlations from δH 1.09 (3H, s, H-8) to C-2, δC 41.8 (s, C-3), δC 36.1 (t, C-4), and δC 54.9 (d, C-13). The key ROESY cross-peak (Figure 3) of H-2/Ha-14 (H, dd, J = 10.7, 5.0 Hz, δH 3.85) suggested that H-2 was β oriented. Other ROESY data revealed the same patterns to 3. Finally, regarding the same origin of 6 and 3, the absolute configuration of 6 was identified to be the same as that of 3, as depicted.
The molecular formula of bipolarisorokin G (7) was assigned as C18H26O2 based on its HRESIMS spectrum (measured at m/z 275.20059 [M+H]+, calculated for C18H27O2+, 275.20056), which contained three more carbon atoms than 3. The interpretation of the 1H and 13C NMR data of 7 (Table 3) indicated the same structure skeleton to that of 3. Analyses of 2D NMR spectra revealed modifications in 7 (Figure 2). HMBC correlations from δH 0.97 (3H, s, H-8) to δC 165.3 (s, C-2), 52.6 (s, C-3), 33.7 (t, C-4), and 63.6 (d, C-13) suggested that a hydroxy group was missing in 7. In addition, an α,β-unsaturated ketone group was identified by the HMBC correlations from δH 6.55 (H, dd, J = 15.9, 9.6 Hz, H-14), 6.08 (H, d, J = 15.9 Hz, H-16), and 2.20 (3H, s, H-18) to δC 198.6 (s, C-17). In the 1H−1H COSY spectrum, correlations from H-14 to δH 2.22 (H, d, J = 9.6 Hz, H-13) and H-16 indicated that the α,β-unsaturated carboxyl moiety was located at C-13. Finally, the absolute configuration of 7 can be fully resolved by the ECD calculation, as shown in Figure 5.
Bipolarisorokin H (8) was obtained as a colorless oil. Its molecular formula, C17H24O3, was inferred from the pseudomolecular ion peak at m/z 277.17984 [M+H]+ in the HRESIMS (calculated for C17H25O3+ 277.17982). The NMR data of 8 (Table 3) resembled that of 7, except for the presence of a carboxyl (δC 171.1, C-17) in 8 instead of a carbonyl (δC 198.6, C-17) in 7, as well as the loss of a methyl group. This was supported by HMBC correlations from δH 6.80 (H, dd, J = 15.4, 9.9 Hz, H-14) and 5.81 (H, d, J = 15.5 Hz, H-16) to δC 171.1 (s, C-17). Detailed analyses of 2D NMR data suggested that the other data were the same as those of 7.
Bipolarisorokin I (9) was isolated as colorless crystals. Its molecular formula was identified as C15H24O3 by HRESIMS (measured at m/z 251.16621 [M–H]−, calculated for C21H23O3− 251.16527). All the spectroscopic data indicated similar patterns to those of longifolene [33]. Detailed analyses of 1D and 2D NMR data revealed the differences. Signals at δC 67.0 (d, C-5), 70.5 (d, C-14), and 74.9 (d, C-15) were identified as the oxygenated methines. Therefore, three hydroxyls were suggested to be placed at C-5, C-14, and C-15, respectively, which were identified by the HMBC and 1H–1H COSY correlations, as shown in Figure 2. Comprehensive analyses of other data suggested that the other parts of 9 were the same as those of longifolene. The relative configuration of 9 was revealed by a ROESY experiment, as shown in Figure 3. The ROESY correlations of Me-10/H-13, H-13/H-5, Me-8/H-13, Me-10/H-9, and Me-10/H-5 indicated these groups were cofacial (assigned as β orientation). In addition, the Me-11/H-1 interaction suggested that H-1 should be α oriented. Moreover, the coupling constant between H-14 and H-15 (J14,15 = 6.2 Hz), as well as the ROESY correlations of Me-8/H-14 and Me-8/H-15, suggested that H-14 and H-15 were α oriented. Finally, the single-crystal X-ray diffraction not only confirmed the planar structure but also established the absolute configuration of 9 (Flack parameter =0.01(3), CCDC: 2124307; Figure 4).
Bipolarithone A (10) was isolated as a yellow oil, and its molecular formula was determined to be C17H16O8 by HRESIMS (measured at m/z 349.09143 [M+H]+, calculated for C17H17O8+ 349.09179). The NMR data (Table 4) of 10 were similar to those of the dechlorinated methyl ester (16) isolated in this study [34]. The major difference was that 10 exhibited a dihydrofuran ring rather than a furan ring. HMBC correlations from H-8 (H, d, J = 3.9 Hz, δH 5.64) to C-8a (δC 114.7, s), C-7 (δC 170.0, s), C-9 (δC 178.3, s), and C-10a (δC 167.7, s), together with H-5 (H, ddd, J = 6.6, 4.4, 3.9 Hz, δH 5.73) to C-10a, C-8a, C-6 (δC 37.7, t), and C-2′ (δC 169.5, s), supported the above assignment. The relative configuration of 10 was identified by the analysis of its ROESY data. The ROESY correlation between H-8 and H-5 indicated that H-8 had the same orientation as H-5 (assigned as an α orientation). The calculated ECD of 10 established the configuration of 10, as shown in Figure 5. Therefore, the structure of 10 was characterized as depicted.
Bipolarithone B (11) was isolated as a yellow oil. The HRESIMS spectrum of 11 suggested a molecular formula of C17H16O8 (measured at m/z 349.09157 [M+H]+, calculated for C17H17O8+ 349.09179), the same as that of 10. The planar structure of 11 was elucidated to be the same as that of 10 by the analysis of its 1D and 2D NMR data. The main difference was suggested as its stereochemistry at C-8 (δC 79.8, d). Analyses of the 1H NMR information showed that the coupling constants of H-8, H-5, and H-6 were significantly different from those of 11, as shown in the Table 4. Furthermore, the ROESY correlation of H-8 (δH 5.63, 1H, d, J = 1.7 Hz)/H-5 (δH 5.62, 1H, ddd, J = 8.4, 3.8, 1.7 Hz) was not observed in 11. These data suggested that 11 was an epimer of 10. The ECD calculation for 11 was performed, and the results of 11 matched well with the experimental ECD curve (Figure 5). Hence, the absolute configuration of 11 can be fully assigned, as shown.
Bipolarithone C (12) was assigned a molecular formula of C30H36O9 based on its HRESIMS data (measured at m/z 541.24310 [M+H]+, calculated for C30H37O9+ 541.24321). The NMR data of 12 were very similar to those of bipolenin I (14) (Table 5), a novel sesquiterpenoid-xanthone adduct isolated from the fungus Bipolaris eleusines [35]. The significant differences were that there was an absence of an aldehyde group and two olefinic carbons, as well as the presence of an additional methine and carbonyl, in 12. These data suggested that the α,β-unsaturated aldehyde moiety disappeared in 12. This assignment was confirmed by the HMBC correlations of δH 2.16 (H, m, H-2), 1.29 (H, m, H-6), 2.56 (1H, br s, H-7), 0.95 (3H, d, J = 7.2 Hz, C-12), and 1.90 (H, m, H-13) to δC 50.6 (d, C-2) and 221.6 (s, C-1). The ROESY spectrum displayed similar patterns to those of 14. Furthermore, a cross peak between H-2 and H-14a (δH 4.05, 1H, dd, J = 11.3, 5.1 Hz) confirmed the relative configuration of C-2, as shown. The absolute configuration of 12 was elucidated by the quantum chemistry calculations. At first, the ECD calculations were conducted on the four possible conformers (12a–d), using time-dependent density functional theory (TDDFT) at the B3LYP/6-311G (d) level in methanol with the PCM model. The overall calculated ECD spectrum of each configuration was then generated according to the Boltzmann weighting of the conformers. As a result, the calculated ECD curves of 12a and 12d matched well with the experimental data (Figure 5). To determine its final structure, the theoretical NMR calculations and DP4+ probabilities were employed. The 13C NMR chemical shifts of 12a and 12d were calculated at the mPW1PW91/6-311+G (d,p) level in the gas phase. According to the DP4+ probability analyses, 12a was assigned with 100% probability (see data in the Supporting Information). Structurally, compound 12 comprised of a seco-sativene sesquiterpenoid unit and a xanthone unit, whose absolute configurations were in accord with compound 6 and compound 10, respectively. Therefore, the structure of 12 was established as depicted.
Bipolarithone D (13) had the same molecular formula (C30H36O9) as that of 12, according to their HRESIMS spectra (measured at m/z 541.24316 [M + H]+, calculated for C30H37O9+ 541.24321). The NMR resonances for 13 (Table 5) resembled those of 12, except that the resonances of C-6′ (ΔδC + 1.5), H-6′a (ΔδH + 0.08), and H-6′b (ΔδH + 0.15) were shifted downfield, while the data H-5′ (ΔδH − 0.08) were shifted upfield. A detailed comparison of the 1D and 2D NMR data of 13 with that of 12 indicated that the two compounds possessed the same planar structure. The main difference was the stereochemistry at C-8′. A key ROESY correlation of H-5′/H-8′ could be detected in 12 but not in 13. In addition, the coupling constants of H-8′ in 13 (J = 1.8 Hz) were different from that in 12 (J = 3.9 Hz). All the data suggested that compound 13 was a C-8′ epimer of 12. Finally, the absolute configuration of 13 was confirmed by ECD calculations (Figure 5).
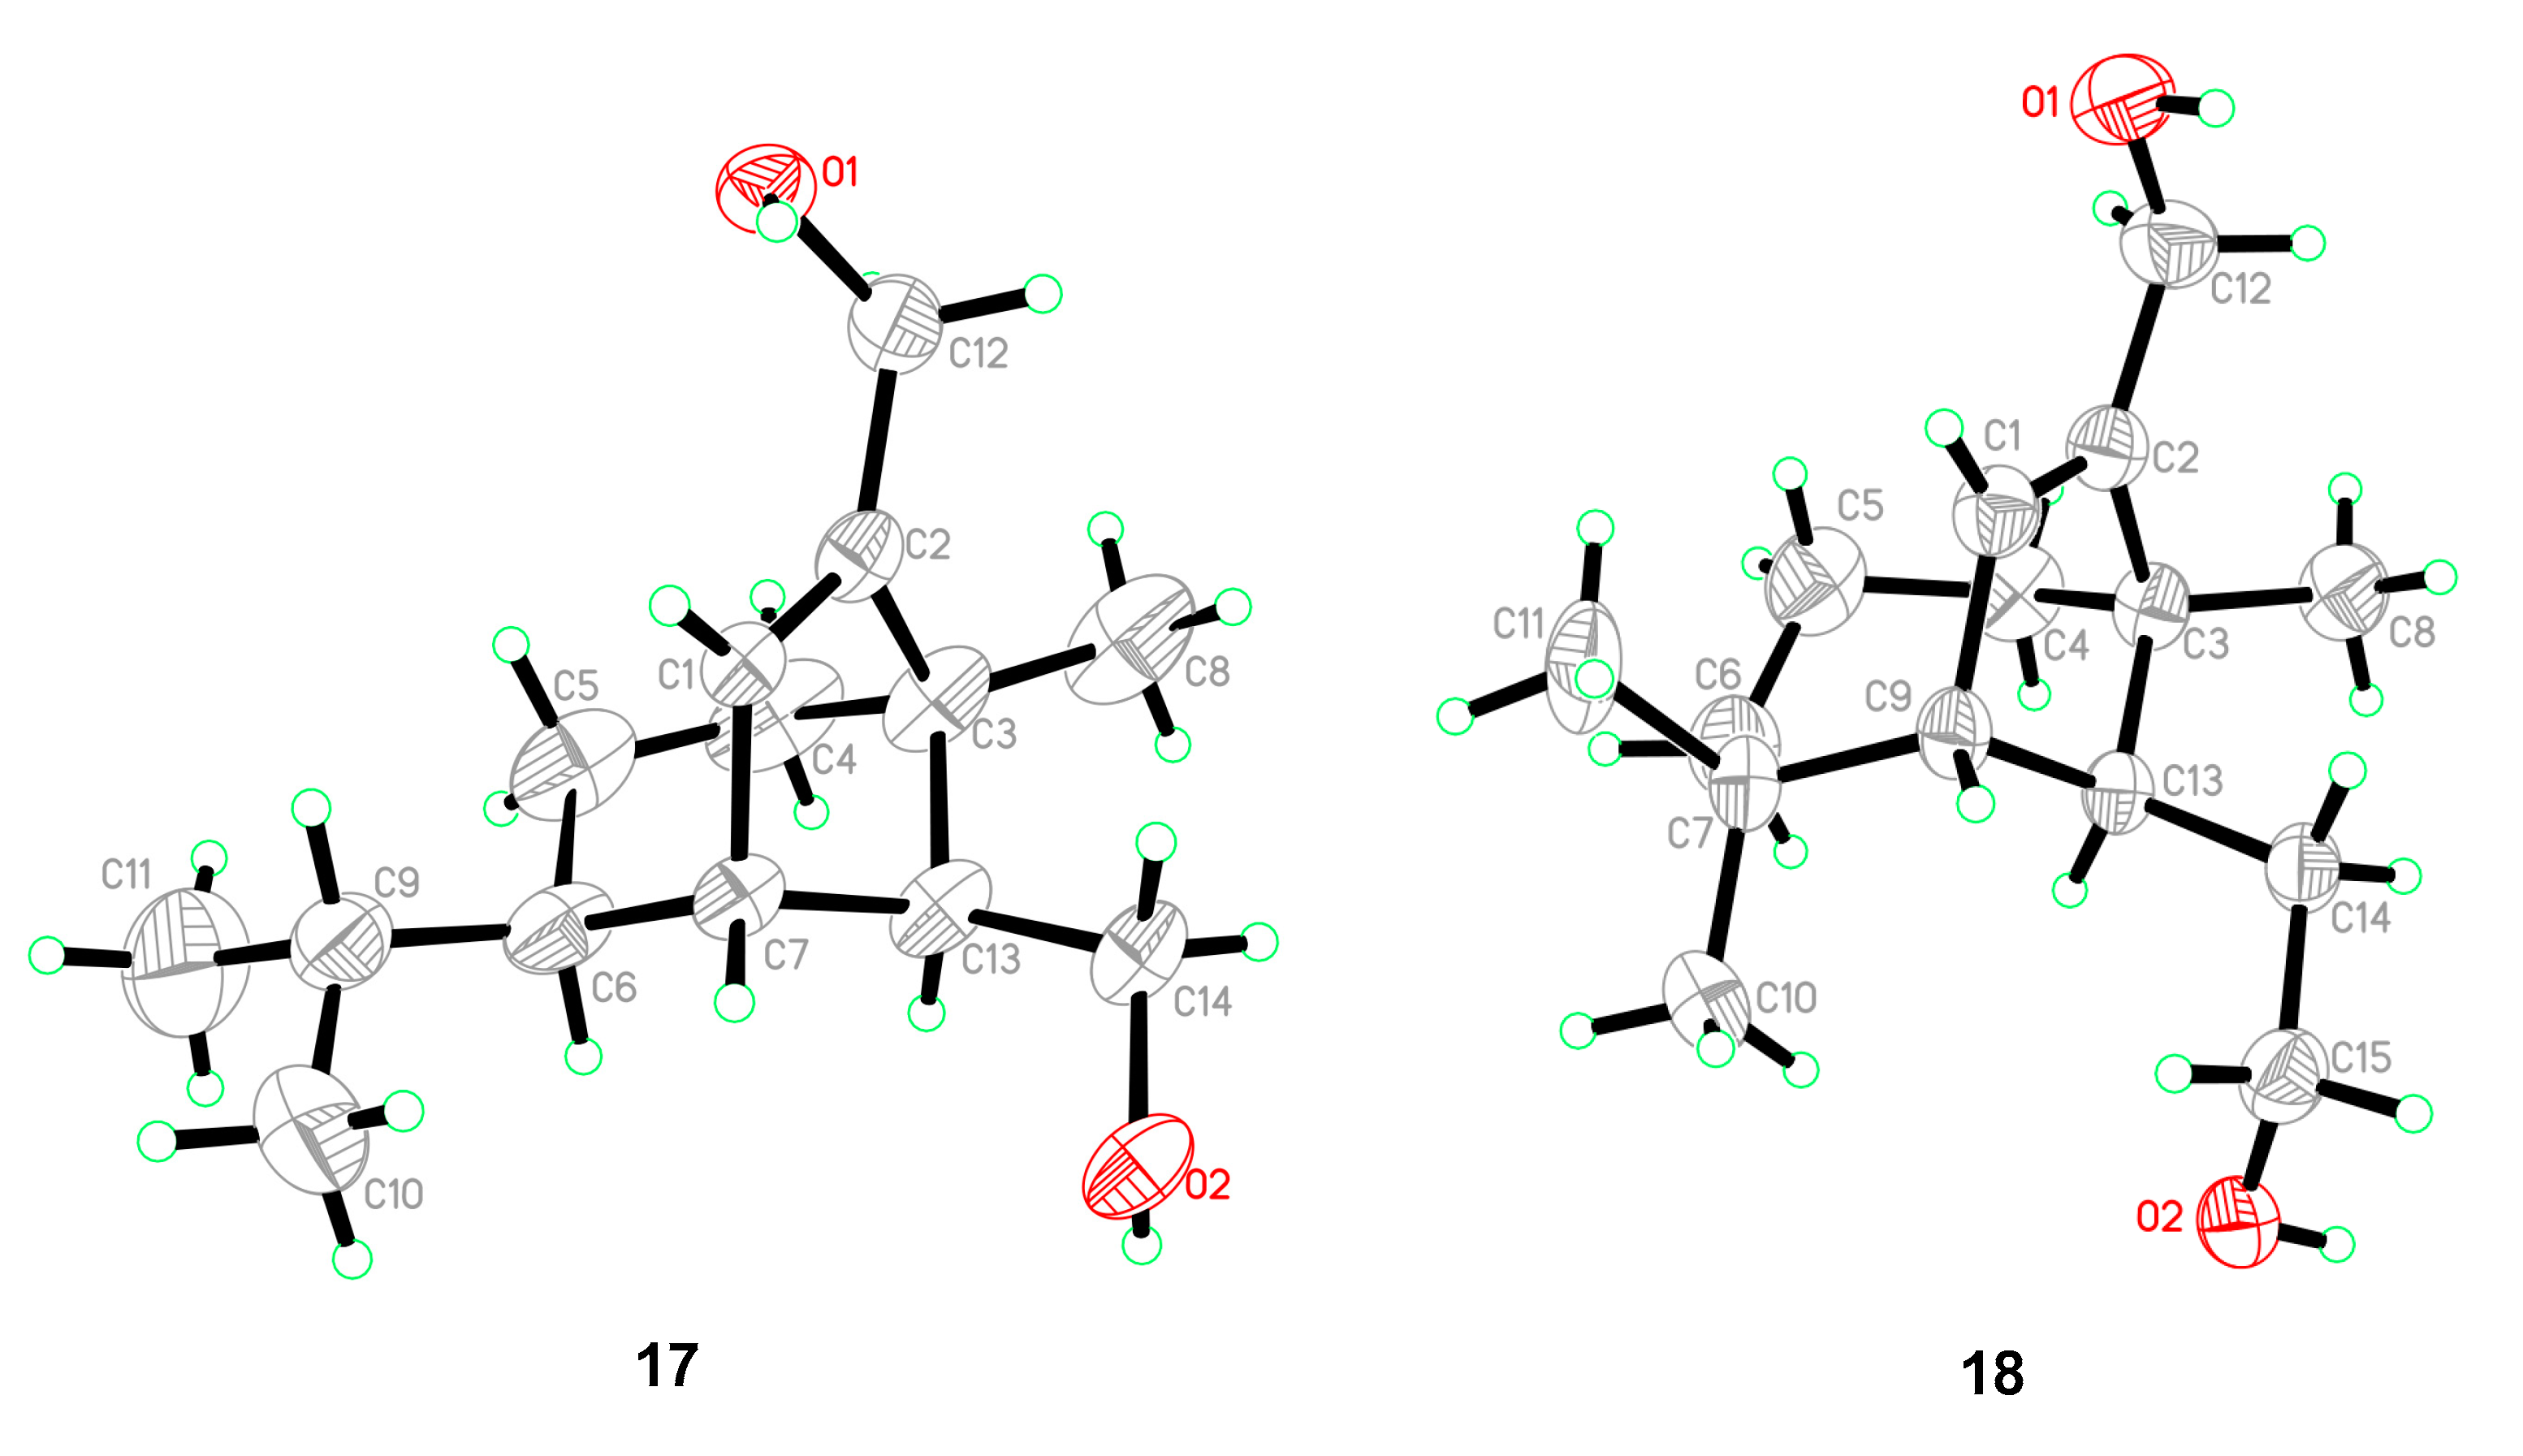
Five known compounds were determined as bipolenins I and J (14 and 15), dechlorinated methyl ester (16), drechslerines A (17), and (+)-secolongifolene diol (18) by the comparison of their spectral data with that reported in the literature [32,34,35]. In this study, the absolute configurations of compounds 17 and 18 were confirmed by single crystal X-ray diffractions (Figure 6), which could support the absolute configurations of 1–9, 12, and 13 as depicted in the text, since they were obtained from the same source.
All compounds (1–18) were evaluated for their anti-Psa activity. As a result, compounds 10 and 15 showed significant inhibitory activity, with MICs of 64 and 16 μg/mL, respectively, while compounds 7, 11, 13, and 16 showed moderate activity, with MICs of 128 μg/mL (Table 6).
In addition, our previous study on chemicals from B. eleusines suggested that sativene-xanthone adducts have promising inhibitory activity against plant pathogenic microorganisms [35]. Therefore, all compounds were evaluated for their inhibitory activity against four plant pathogenic microorganisms, including P. infestane, A. solani, R. solani, and F. oxysporum. As a result, many compounds showed certain inhibitory activity, as given in Table 6.
A brief structure–activity relationship analysis suggested that the aldehyde-containing sativene sesquiterpenoids were more active than the others, while the xanthones or their derivatives showed better inhibitory activities than sativene sesquiterpenoids.
4. Conclusions
A total of 18 compounds, including 13 new ones, were characterized from the kiwifruit-associated fungus Bipolaris sp. Their structures, with absolute configurations, were established by means of spectroscopic methods. Many compounds possessed anti-Psa activity and inhibitory activity against plant pathogens. It is concluded that Bipolaris sp. is rich in sativene sesquiterpenoids and xanthones, and both sativene sesquiterpenoids and xanthones possess potential antimicrobial application prospects. This study also suggested that it is an effective way to find natural anti-Psa agents from kiwifruit-associated fungi.
Supplementary Materials
The following are available online at https://www.mdpi.com/article/10.3390/jof8010009/s1, Section S1: Supplementary of NMR, HRESIMS and CD spectra for 1–13, Section S2: Calculational details for 3, 7, 10, 11, 12 and 13.
Author Contributions
Conceptualization, J.H.; methodology, J.-J.Y., Y.-X.J., S.-S.H. and J.H.; resources, J.H.; data curation, J.-J.Y.; writing—original draft preparation, J.-J.Y.; writing—review and editing, J.H.; project administration, J.H.; funding acquisition, J.H. All authors have read and agreed to the published version of the manuscript.
Funding
This research was funded by the National Natural Science Foundation of China (grant number 22177139).
Institutional Review Board Statement
Not applicable.
Informed Consent Statement
Not applicable.
Data Availability Statement
X-ray crystallographic data of 1, 3, 9, and 18 (CIF) is available free of charge at https://www.ccdc.cam.ac.uk (accessed on 1 December 2021).
Acknowledgments
The authors thank the Analytical & Measuring Centre, South-Central University for Nationalities for the spectra measurements.
Conflicts of Interest
The authors declare no conflict of interest.
References
- Dolly, S.; Kaur, J.; Bhadariya, V.; Sharma, K. Actinidia deliciosa (Kiwi fruit): A comprehensive review on the nutritional composition, health benefits, traditional utilization and commercialization. J. Food Process. Preserv. 2021, 45, e15588. [Google Scholar] [CrossRef]
- Wang, S.N.; Qiu, Y.; Zhu, F. Kiwifruit (Actinidia spp.): A review of chemical diversity and biological activities. Food Chem. 2021, 350, 128469. [Google Scholar] [CrossRef]
- Richardson, D.P.; Ansell, J.; Drummond, L.N. The nutritional and health attributes of kiwifruit: A review. Eur. J. Nutr. 2018, 57, 2659–2676. [Google Scholar] [CrossRef] [PubMed] [Green Version]
- Wang, Q.; Zhang, C.; Long, Y.; Wu, X.; Su, Y.; Lei, Y.; Ai, Q. Bioactivity and control efficacy of the novel antibiotic tetramycin against various kiwifruit diseases. Antibiotics 2021, 10, 289. [Google Scholar] [CrossRef] [PubMed]
- Kim, G.H.; Jung, J.S.; Koh, Y.J. Occurrence and epidemics of bacterial canker of kiwifruit in Korea. Plant Pathol. J. 2017, 33, 351–361. [Google Scholar] [CrossRef] [PubMed] [Green Version]
- Wang, Q.; Zhang, C.; Wu, X.; Long, Y.; Su, Y. Chitosan augments tetramycin against soft rot in kiwifruit and enhances its improvement for kiwifruit growth, quality and aroma. Biomolecules 2021, 11, 1257. [Google Scholar] [CrossRef]
- Lee, Y.S.; Han, H.S.; Kim, G.H.; Koh, Y.J.; Hur, J.S.; Jung, J.S. Causal agents of blossom blight of kiwifruit in Korea. Plant Pathol. J. 2009, 25, 220–224. [Google Scholar] [CrossRef] [Green Version]
- Balestra, G.M.; Mazzaglia, A.; Rossetti, A. Outbreak of bacterial blossom blight caused by Pseudomonas viridiflava on Actinidia chinensis kiwifruit plants in Italy. Plant Dis. 2008, 92, 1707. [Google Scholar] [CrossRef]
- Jeong, I.H.; Lim, M.T.; Kim, G.H.; Han, T.W.; Kim, H.C.; Kim, M.J.; Park, H.S.; Shin, S.H.; Hur, J.S.; Shin, J.S.; et al. Incidences of leaf spots and blights on kiwifruit in Korea. Plant Pathol. J. 2008, 24, 125–130. [Google Scholar] [CrossRef] [Green Version]
- Li, H.H.; Tang, W.; Liu, K.; Zhang, L.; Tang, X.F.; Miao, M.; Liu, Y.S. First report of Fusarium fujikuroi causing brown leaf spot on kiwifruit. Plant Dis. 2020, 104, 1560. [Google Scholar] [CrossRef]
- Polat, Z.; Awan, Q.N.; Hussain, M.; Akgul, D.S. First report of Phytopythium vexans causing root and collar rot of kiwifruit in Turkey. Plant Dis. 2017, 101, 1058. [Google Scholar] [CrossRef]
- Wang, K.X.; Xie, Y.L.; Yuan, G.Q.; Li, Q.Q.; Lin, W. First report of root and collar rot caused by Phytopythium helicoides on kiwifruit (Actinidia chinensis). Plant Dis. 2015, 99, 725. [Google Scholar] [CrossRef]
- McCann, H.C.; Li, L.; Liu, Y.F.; Li, D.W.; Pan, H.; Zhong, C.H.; Rikkerink, E.H.A.; Templeton, M.D.; Straub, C.; Colombi, E.; et al. Origin and evolution of the kiwifruit canker pandemic. Genome Biol. Evol. 2017, 9, 932–944. [Google Scholar] [CrossRef]
- Vanneste, J.L. The scientific, economic, and social impacts of the New Zealand outbreak of bacterial canker of kiwifruit (Pseudomonas syringae pv. actinidiae). Annu. Rev. Phytopathol. 2017, 55, 377–399. [Google Scholar] [CrossRef]
- Wicaksono, W.A.; Jones, E.E.; Casonato, S.; Monk, J.; Ridgway, H.J. Biological control of Pseudomonas syringae pv. actinidiae (Psa), the causal agent of bacterial canker of kiwifruit, using endophytic bacteria recovered from a medicinal plant. Biol. Control 2018, 116, 103–112. [Google Scholar] [CrossRef]
- Scortichini, M. Aspects still to solve for the management of kiwifruit bacterial canker caused by Pseudomonas syringae pv. actinidiae biovar 3. Eur. J. Hortic. Sci. 2018, 83, 205–211. [Google Scholar] [CrossRef]
- Bardas, G.A.; Veloukas, T.; Koutita, O.; Karaoglanidis, G.S. Multiple resistance of botrytis cinerea from kiwifruit to SDHIs, QoIs and fungicides of other chemical groups. Pest Manag. Sci. 2010, 66, 967–973. [Google Scholar] [CrossRef] [PubMed]
- Colombi, E.; Straub, C.; Kunzel, S.; Templeton, M.D.; McCann, H.C.; Rainey, P.B. Evolution of copper resistance in the kiwifruit pathogen Pseudomonas syringae pv. actinidiae through acquisition of integrative conjugative elements and plasmids. Environ. Microbiol. 2017, 19, 819–832. [Google Scholar] [CrossRef]
- Gupta, S.; Chaturvedi, P.; Kulkarni, M.G.; van Staden, J. A critical review on exploiting the pharmaceutical potential of plant endophytic fungi. Biotechnol. Adv. 2020, 39, 107462. [Google Scholar] [CrossRef]
- Kusari, S.; Hertweck, C.; Spitellert, M. Chemical ecology of endophytic fungi: Origins of secondary metabolites. Chem. Biol. 2012, 19, 792–798. [Google Scholar] [CrossRef] [Green Version]
- Strobel, G.; Daisy, B.; Castillo, U.; Harper, J. Natural products from endophytic microorganisms. J. Nat. Prod. 2004, 67, 257–268. [Google Scholar] [CrossRef] [PubMed]
- Helaly, S.E.; Thongbai, B.; Stadler, M. Diversity of biologically active secondary metabolites from endophytic and saprotrophic fungi of the ascomycete order Xylariales. Nat. Prod. Rep. 2018, 35, 992–1014. [Google Scholar] [CrossRef]
- Zhang, J.Y.; He, J.; Li, Z.H.; Feng, T.; Liu, J.K. Zopfiellasins A–D, two pairs of epimeric cytochalasins from kiwi-associated fungus Zopfiella sp. and their antibacterial assessment. Molecules 2021, 26, 5611. [Google Scholar] [CrossRef]
- Yi, X.W.; He, J.; Sun, L.T.; Liu, J.K.; Wang, G.K.; Feng, T. 3-Decalinoyltetramic acids from kiwi-associated fungus Zopfiella sp. and their antibacterial activity against Pseudomonas syringae. RSC Adv. 2021, 11, 18827–18831. [Google Scholar] [CrossRef]
- Ma, J.T.; Du, J.X.; Zhang, Y.; Liu, J.K.; Feng, T.; He, J. Natural imidazole alkaloids as antibacterial agents against Pseudomonas syringae pv. actinidiae isolated from kiwi endophytic fungus Fusarium tricinctum. Fitoterapia 2022, 156, 105070. [Google Scholar] [CrossRef]
- Frisch, M.J.T.; Trucks, G.W.; Schlegel, H.B.; Scuseria, G.E.; Robb, M.A.; Cheeseman, J.R.; Scalmani, G.; Barone, V.; Mennucci, B.; Petersson, G.A.; et al. Gaussian 09; Revision D. 01; Gaussian Inc.: Wallingford, CT, USA, 2010. [Google Scholar]
- Shao, Y.; Molnar, L.F.; Jung, Y.; Kussmann, J.; Ochsenfeld, C.; Brown, S.T.; Gilbert, A.T.B.; Slipchenko, L.V.; Levchenko, S.V.; O’Neill, D.P.; et al. Advances in methods and algorithms in a modern quantum chemistry program package. Phys. Chem. Chem. Phys. 2006, 8, 3172–3191. [Google Scholar] [CrossRef] [PubMed]
- Hehre, W.J. A Guide to Molecular Mechanics and Quantum Chemical Calculations; Wavefunction Inc.: Irvine, CA, USA, 2003; Volume 51, pp. 1–812. [Google Scholar] [CrossRef]
- Bruhn, T.; Schaumlöffel, A.; Hemberger, Y.; Bringmann, G. SpecDis: Quantifying the comparison of calculated and experimental electronic circular dichroism spectra. Chirality 2013, 25, 243–249. [Google Scholar] [CrossRef] [PubMed]
- Grimblat, N.; Zanardi, M.M.; Sarotti, A.M. Beyond DP4: An improved probability for the stereochemical assignment of isomeric compounds using quantum chemical calculations of NMR shifts. J. Org. Chem. 2015, 80, 12526–12534. [Google Scholar] [CrossRef] [PubMed]
- Nukina, M.; Hattori, H.; Marumo, S. Cis-Sativenediol, a plant growth promotor, produced by fungi. J. Am. Chem. Soc. 1975, 97, 2542–2543. [Google Scholar] [CrossRef]
- Osterhage, C.; König, G.M.; Höller, U.; Wright, A.D. Rare sesquiterpenes from the algicolous fungus Drechslera dematioidea. J. Nat. Prod. 2002, 65, 306–313. [Google Scholar] [CrossRef]
- Dorn, F.; Arigoni, D. Ein bicyclischer Abkömmling von (−) longifolen aus Helminthosporium sativum und H. victoriae. Experientia 1974, 30, 851–852. [Google Scholar] [CrossRef]
- Han, J.; Zhang, J.; Song, Z.; Liu, M.; Hu, J.; Hou, C.; Zhu, G.; Jiang, L.; Xia, X.; Quinn, R.; et al. Genome- and MS-based mining of antibacterial chlorinated chromones and xanthones from the phytopathogenic fungus Bipolaris sorokiniana strain 11134. Appl. Microbiol. Biotechnol. 2019, 103, 5167–5181. [Google Scholar] [CrossRef] [PubMed]
- He, J.; Yang, M.S.; Wang, W.X.; Li, Z.H.; Elkhateeb, W.; Wen, T.C.; Ai, H.L.; Feng, T. Anti-phytopathogenic sesquiterpenoid-xanthone adducts from potato endophytic fungus Bipolaris eleusines. RSC Adv. 2019, 9, 128–131. [Google Scholar] [CrossRef] [Green Version]
Figure 1.
Structures of compounds 1–18.

Figure 2.
Key 1H–1H COSY and HMBC correlations for 1, 3, 5, 6, 7, and 9–13.
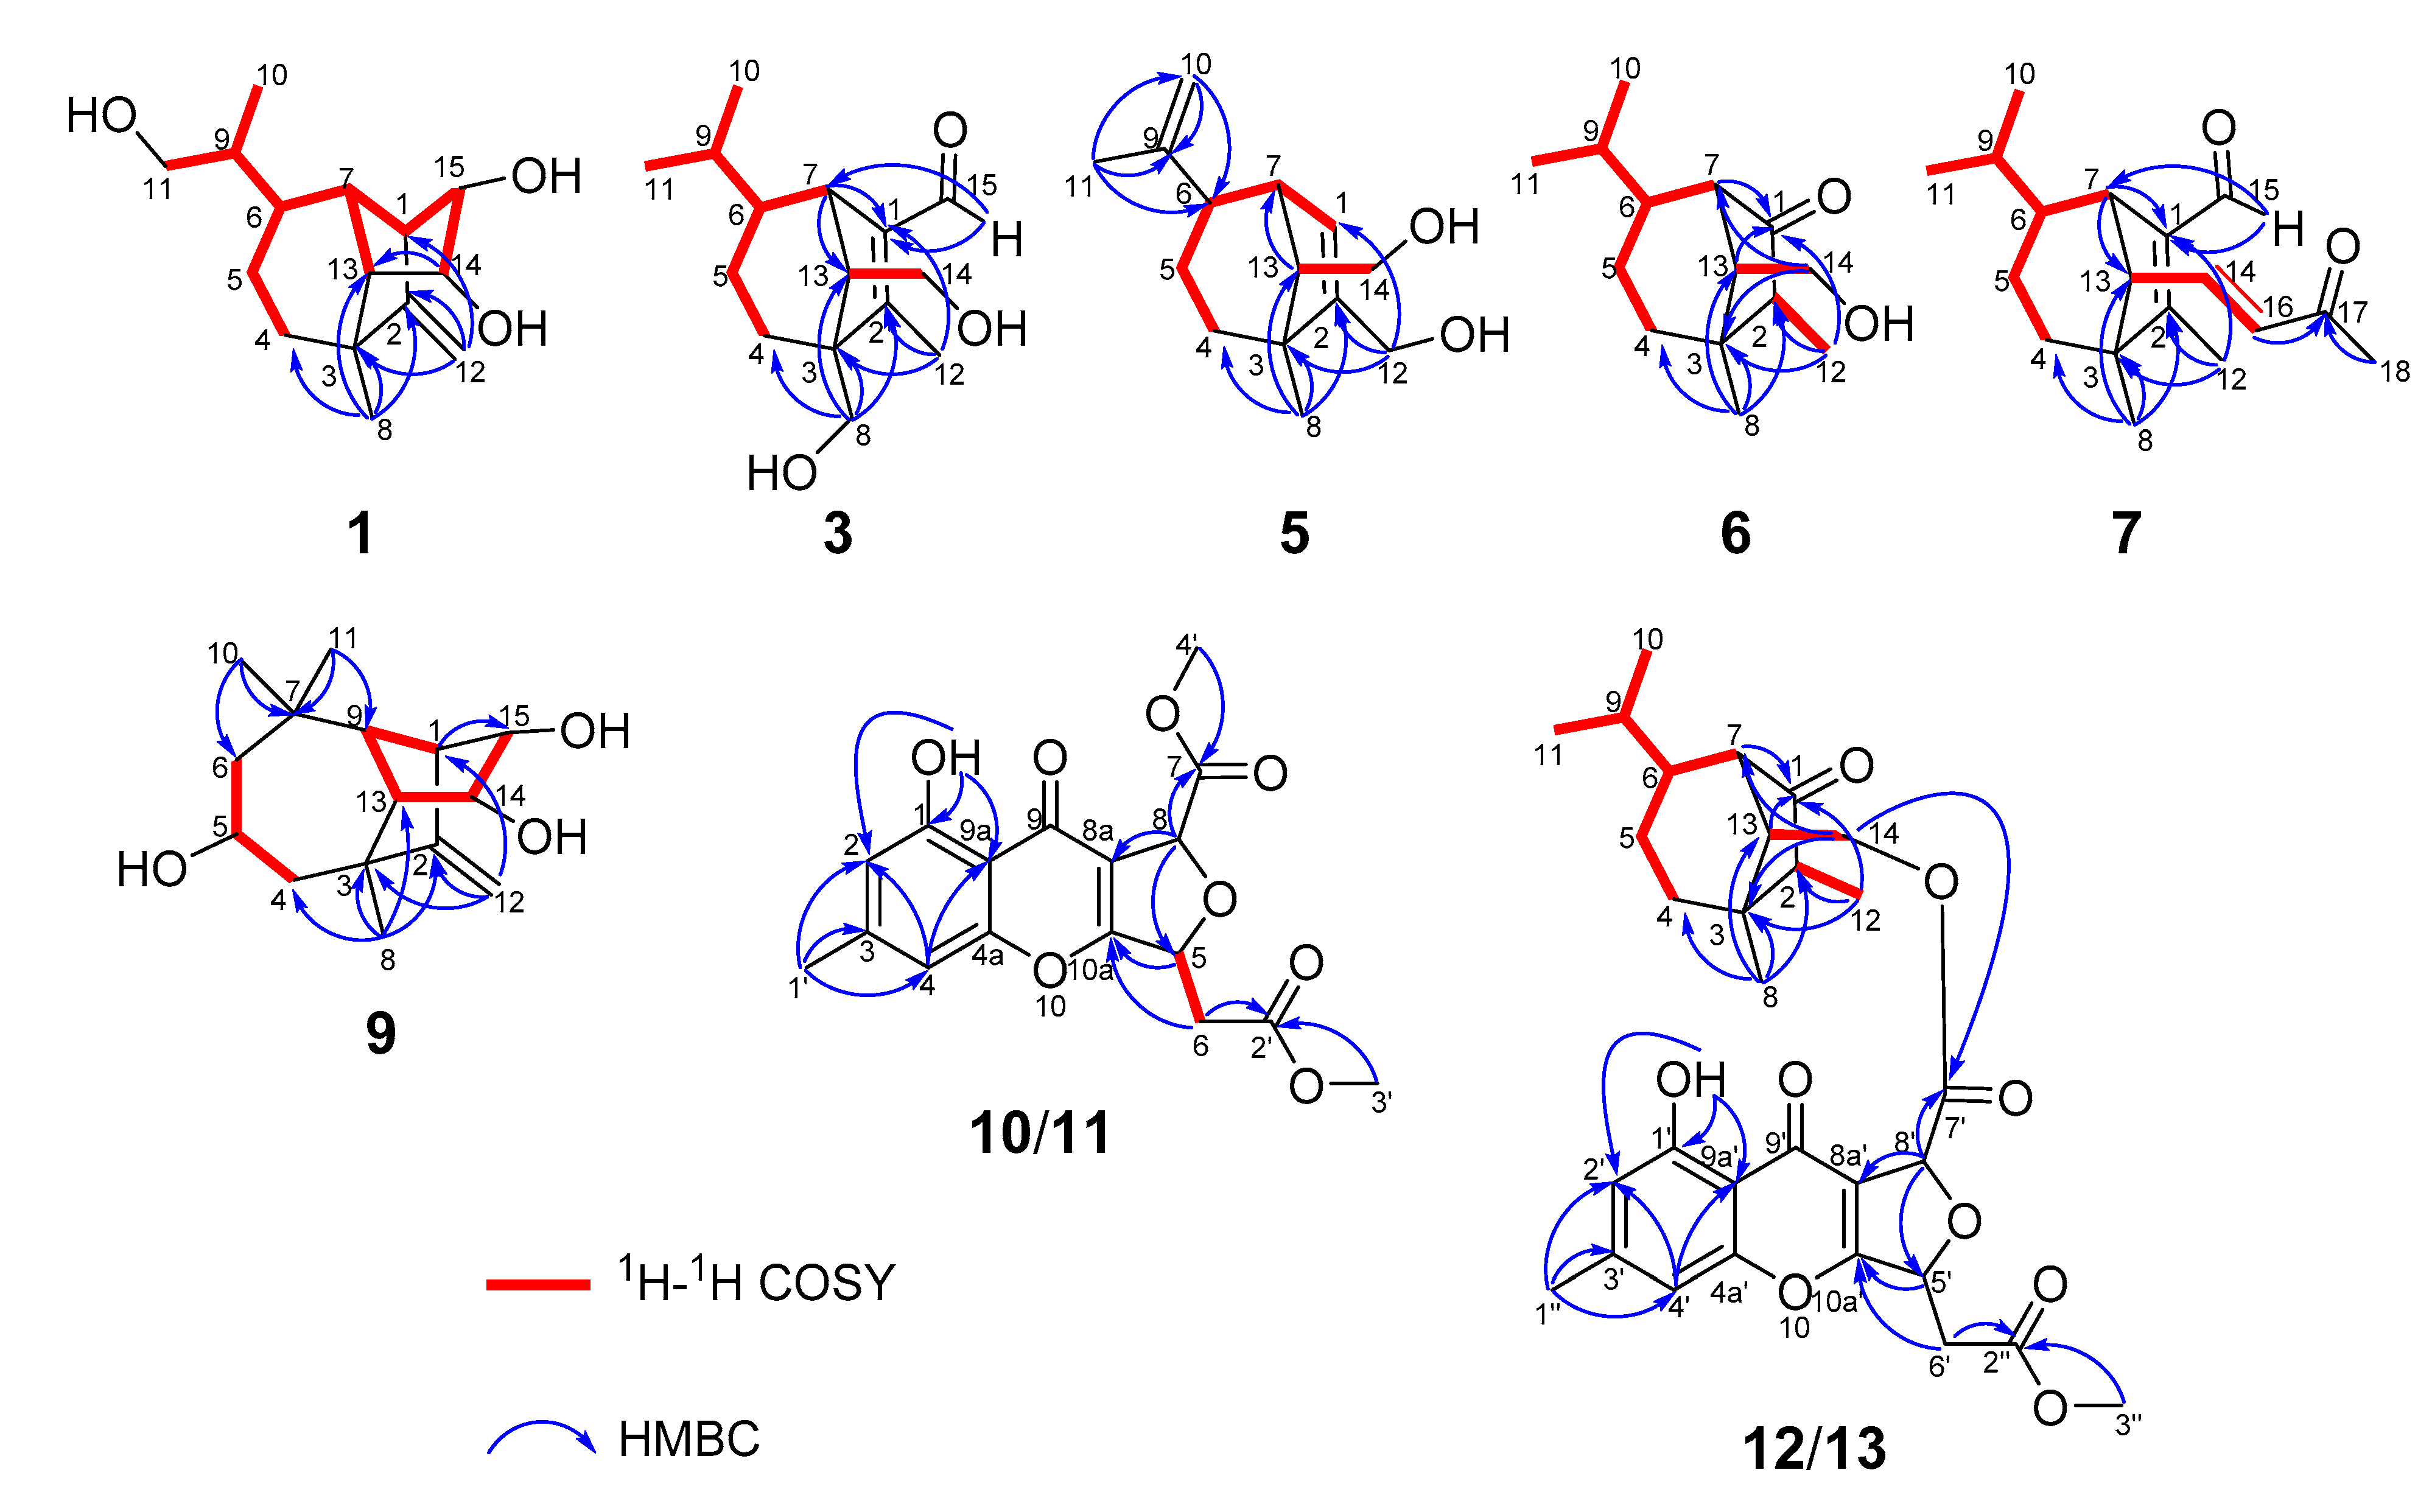
Figure 3.
Key ROESY correlations for 1, 3, 5, 6, 7, 9, 10, and 12.
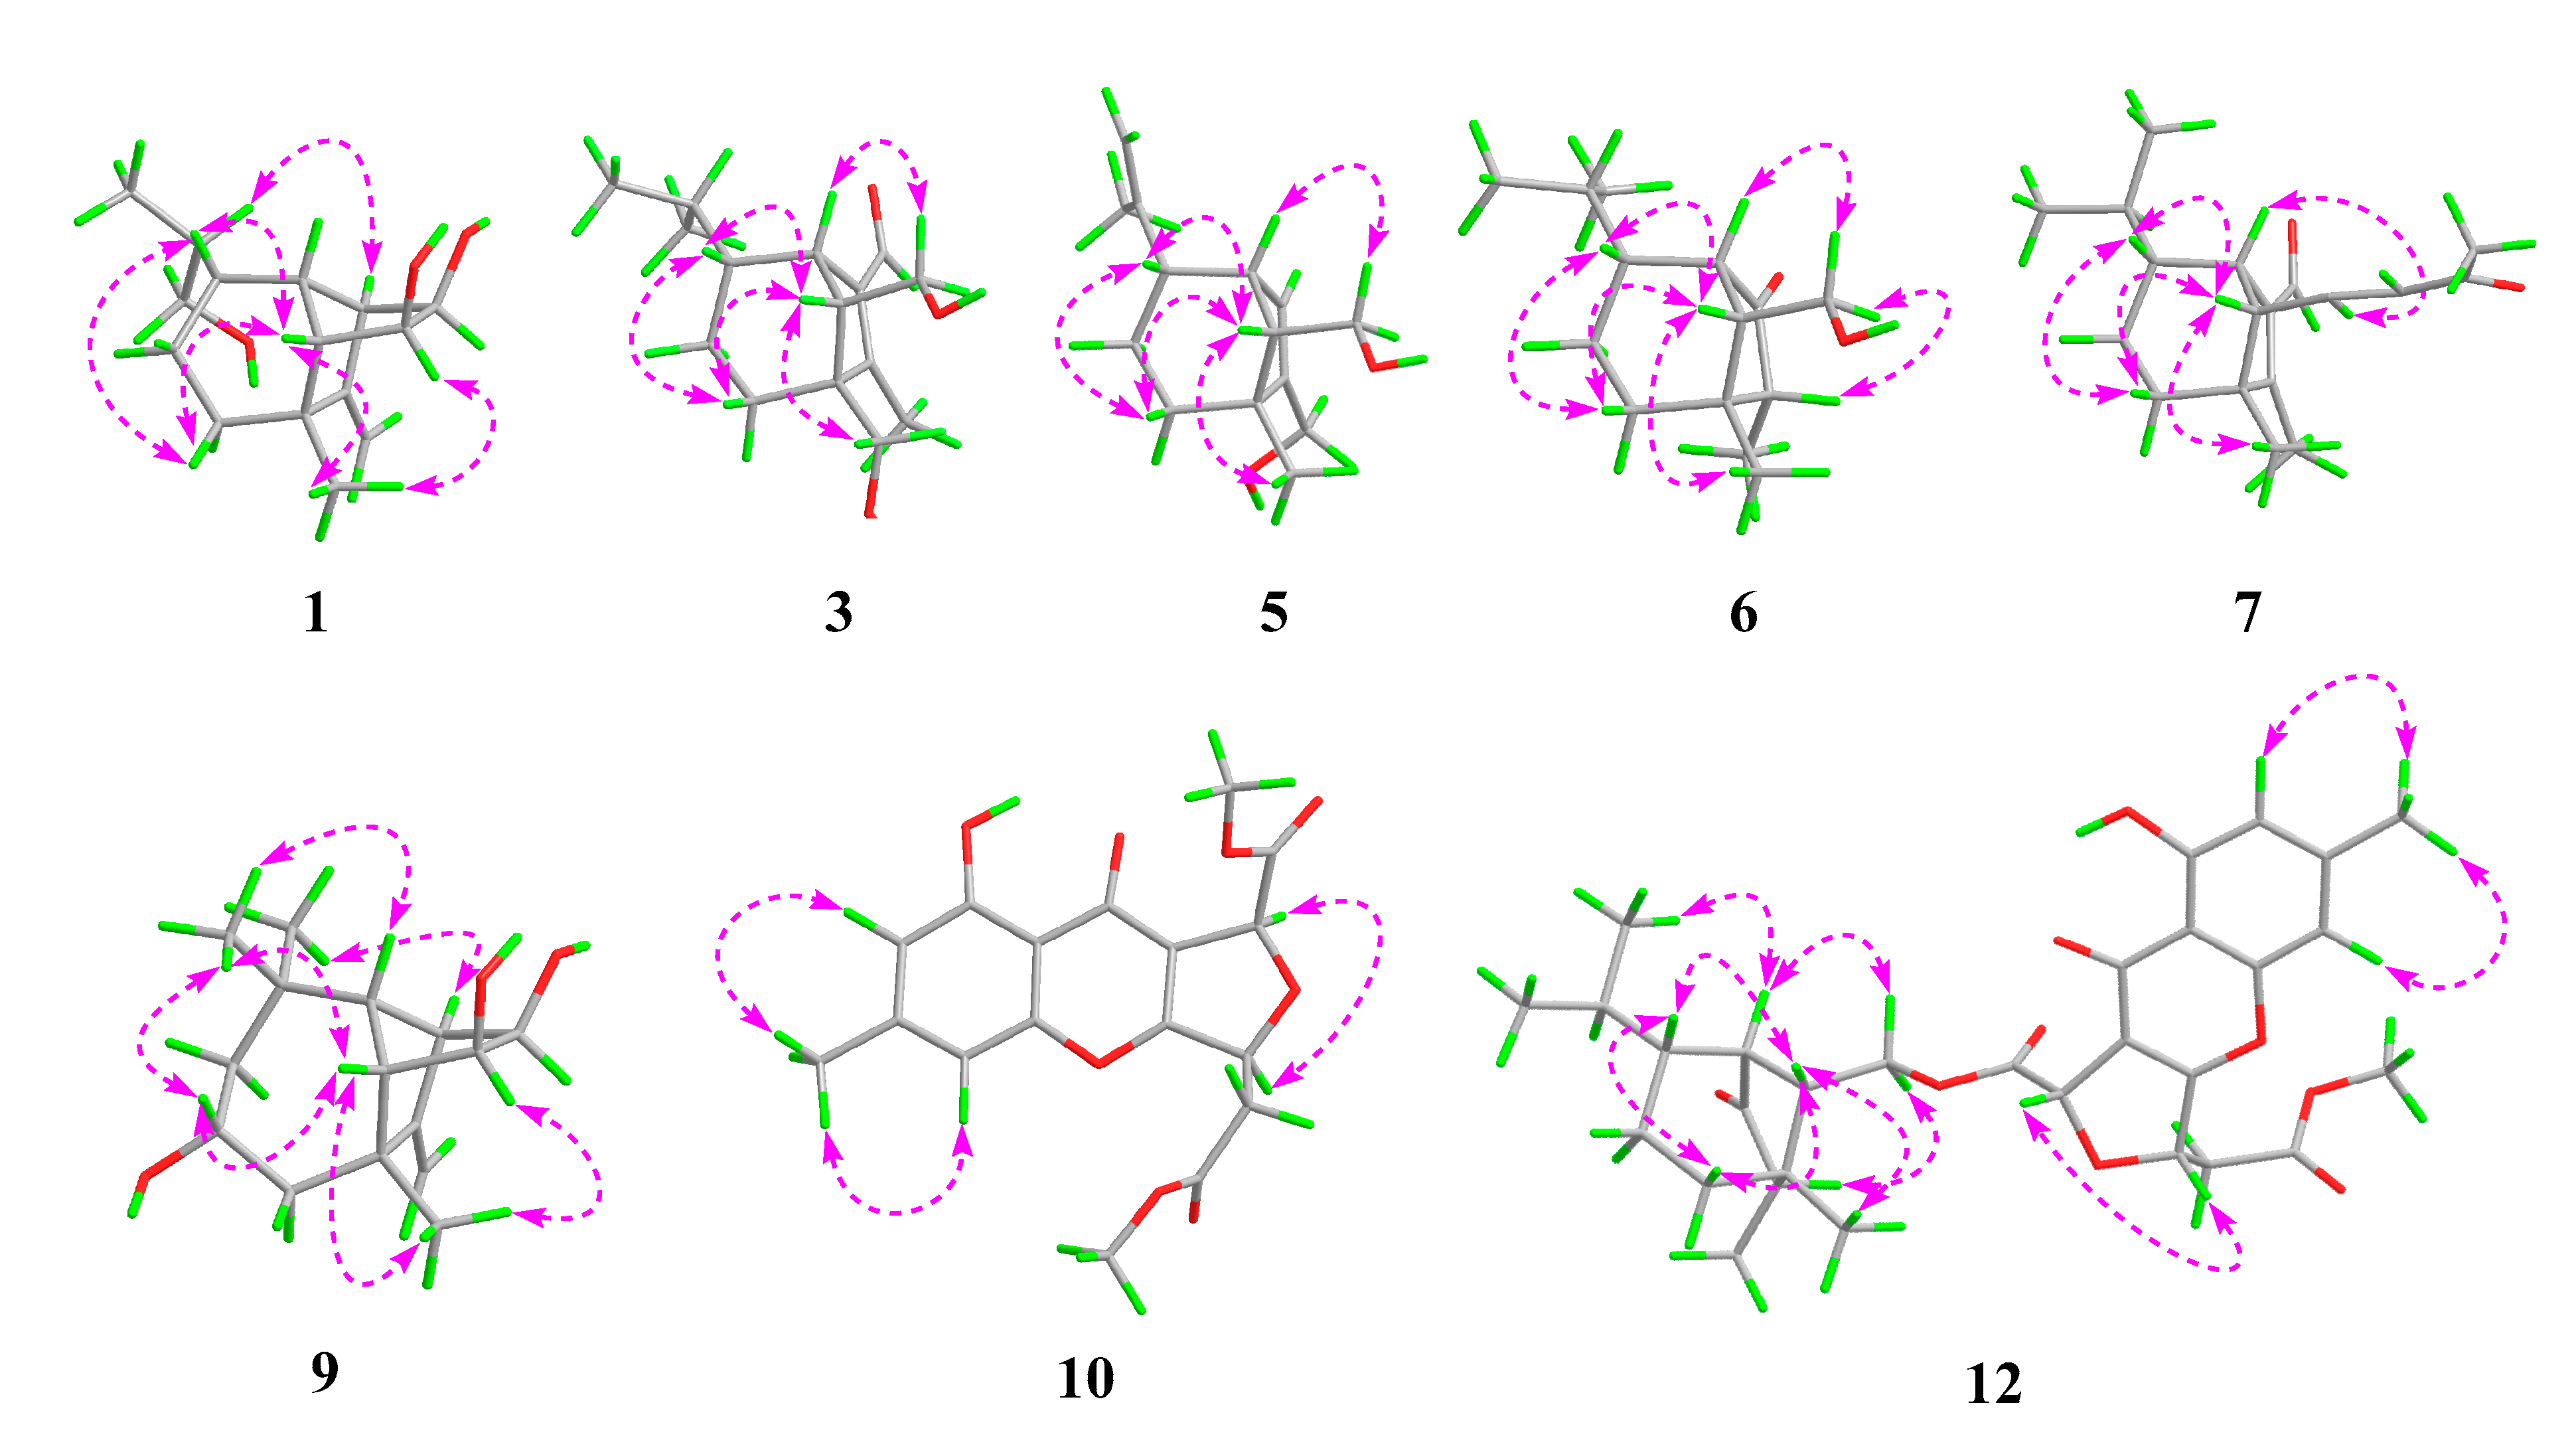
Figure 4.
ORTEP diagrams of 1, 3, and 9.

Figure 5.
ECD calculations for 3, 7, and 10–13.
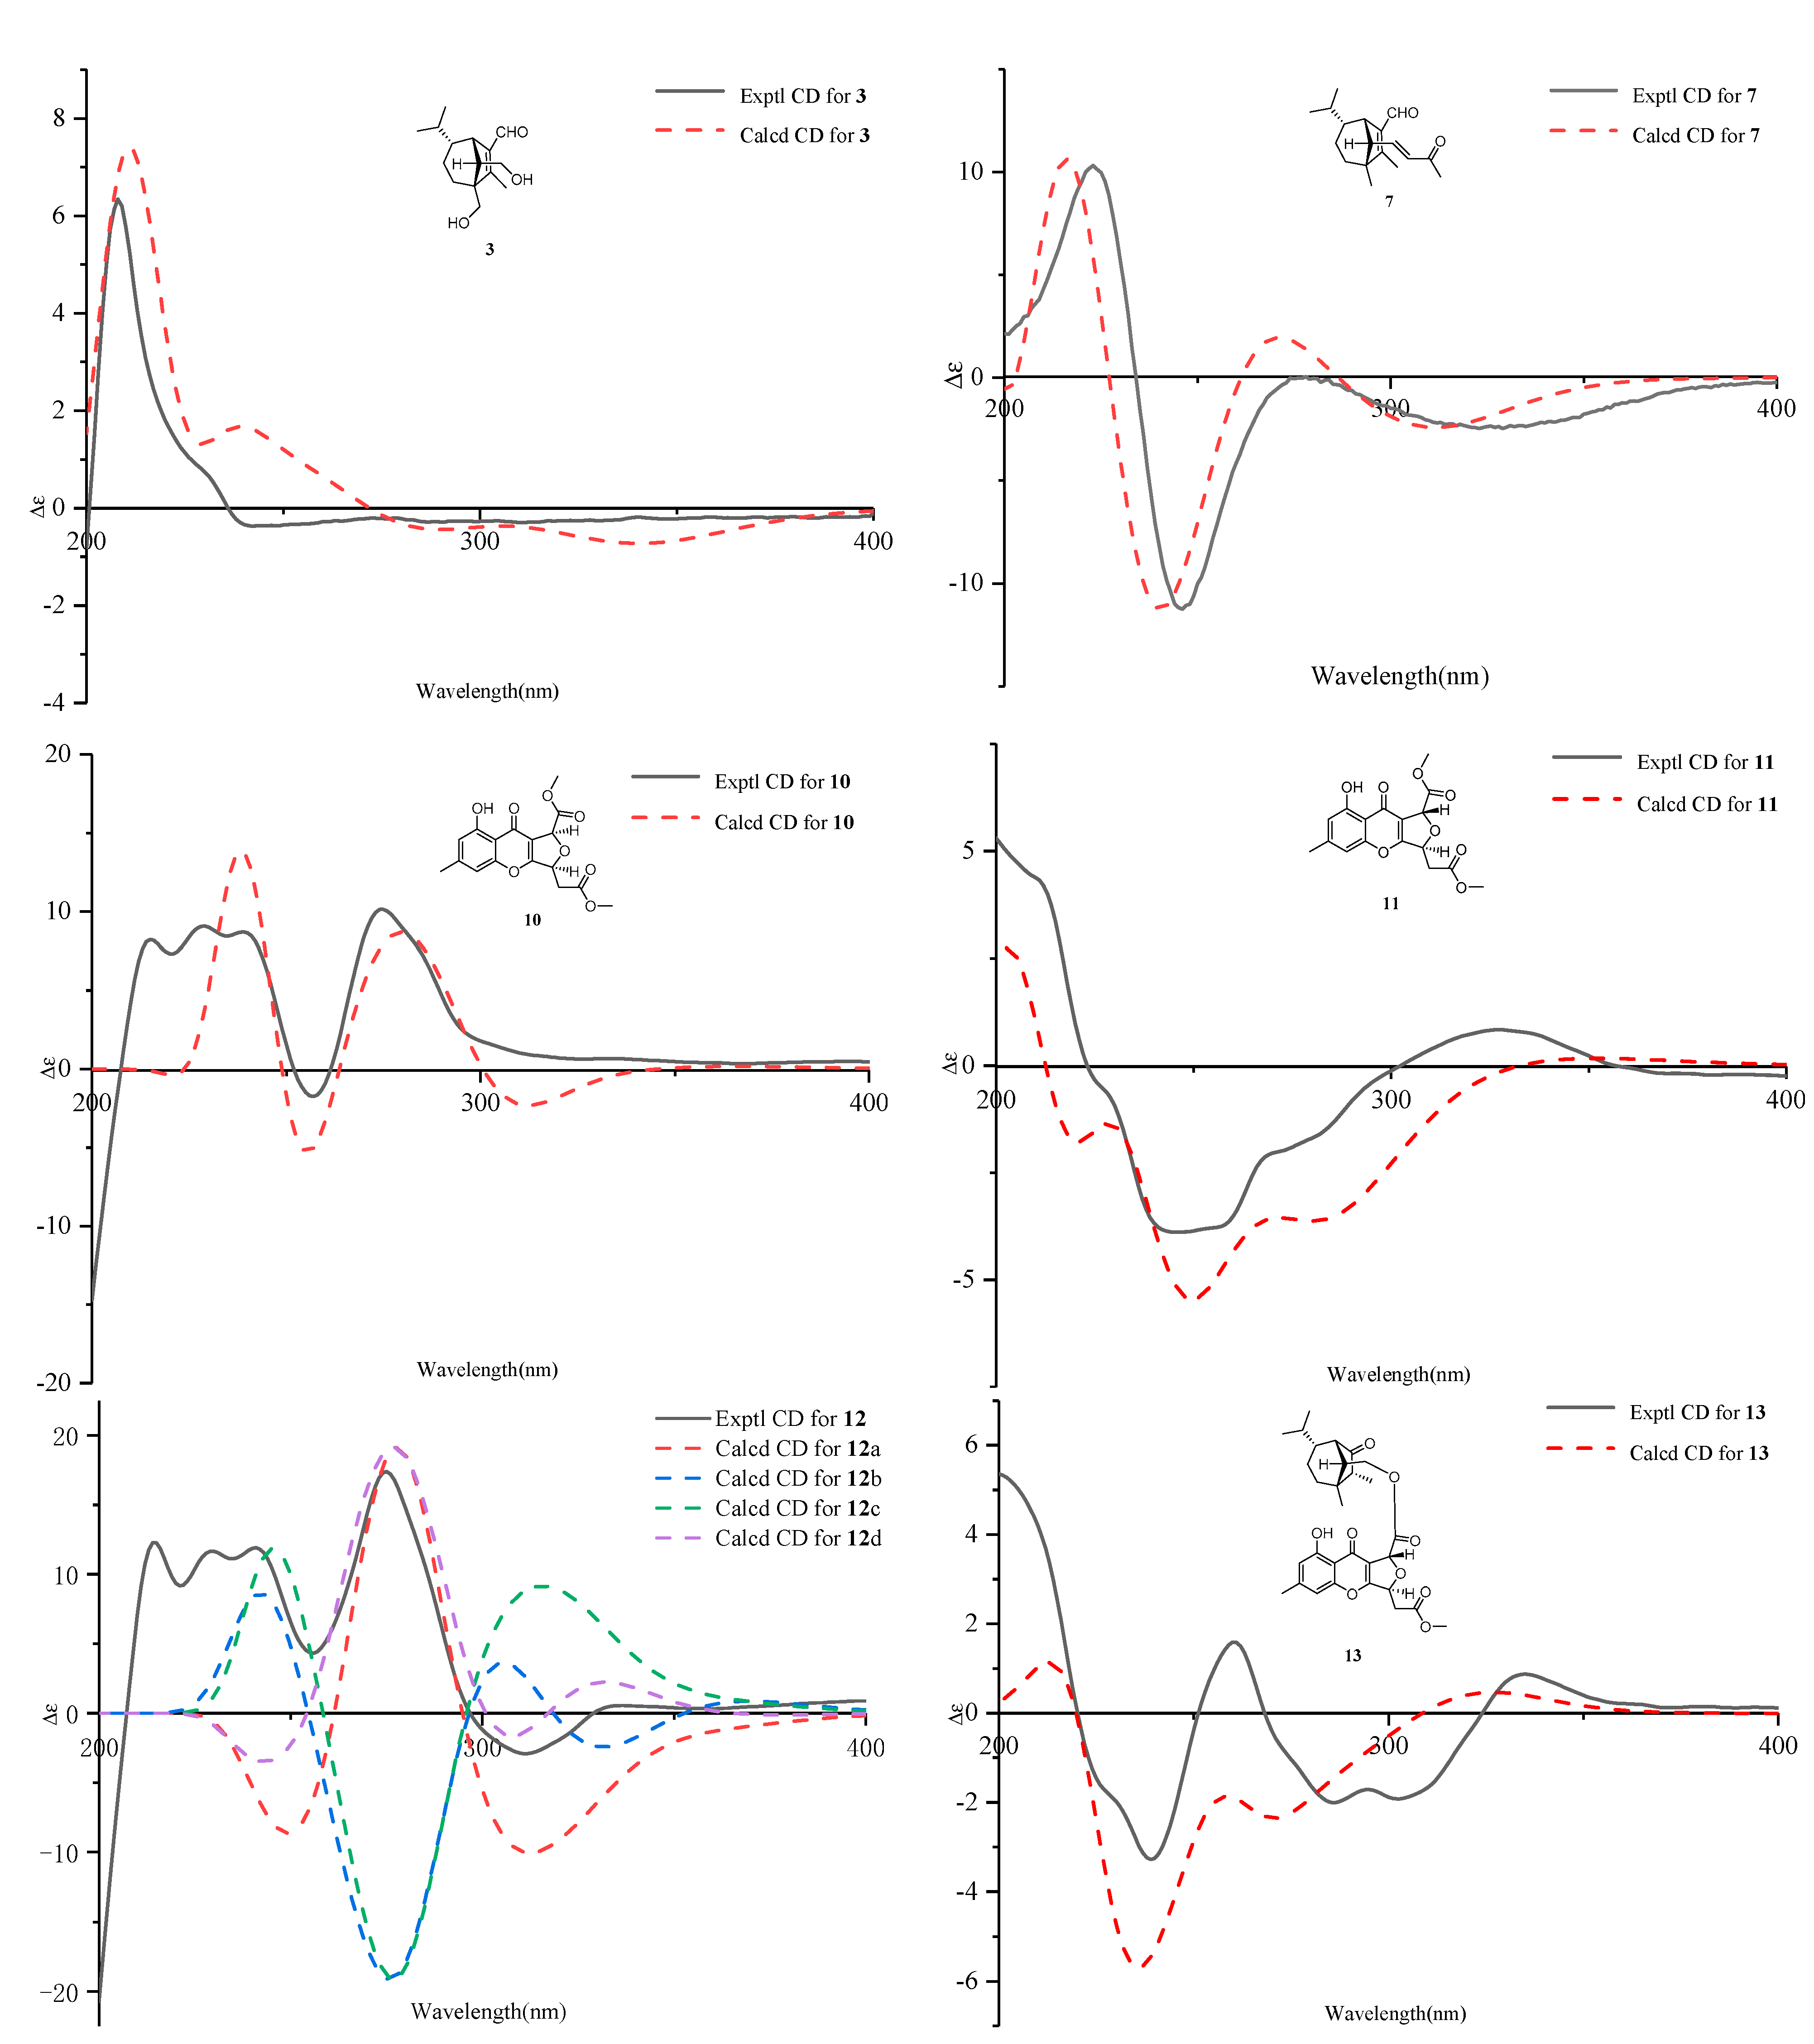
Figure 6.
ORTEP diagrams of 17 and 18.

Table 1.
1H (600 MHz) and 13C (150 MHz) NMR Spectroscopic Data for 1–3.
| No. | 1 a | 2 a | 3 b | |||
|---|---|---|---|---|---|---|
| δC, Type | δH (J in Hz) | δC, Type | δH (J in Hz) | δC, Type | δH (J in Hz) | |
| 1 | 54.3, CH | 2.71, s | 55.4, CH | 2.59, br s | 140,0, C | |
| 2 | 156.8, C | 155.7, C | 167.0, C | |||
| 3 | 43.0, C | 42.8, C | 58.0, C | |||
| 4a | 39.9, CH2 | 1.50, m | 36.7, CH2 | 1.23, m | 29.6, CH2 | 1.42, dd (13.2, 6.0) |
| 4b | 1.36, m | 1.74, m | 1.55, dd (12.8, 6.0) | |||
| 5a | 25.2, CH2 | 1.58, m | 32.3, CH2 | 1.44, m | 25.9, CH2 | 0.90, m |
| 5b | 1.24, m | 1.55, m | 1.80, m | |||
| 6 | 37.6, CH | 1.65, m | 73.7, C | 46.4, CH | 1.05, m | |
| 7 | 42.2, CH | 2.46, s | 47.8, CH | 2.44, br s | 42.7, CH | 3.06, br s |
| 8a | 20.8, CH3 | 1.05, s | 20.8, CH3 | 1.06, s | 64.6, CH2 | 3.63, d (11.6) |
| 8b | 3.71, d (11.6) | |||||
| 9 | 40.5, CH | 1.46, m | 36.9, CH | 1.57, m | 32.9, CH | 1.02, m |
| 10 | 15.4, CH3 | 0.92, d (6.8) | 16.2, CH3 | 0.88, d (6.9) | 21.1, CH3 | 0.78, d (6.4) |
| 11 | 66.9, CH2 | 3.64, overlap | 16.4, CH3 | 0.94, d (6.9) | 22.1, CH3 | 1.06, d (6.4) |
| 12a | 103.5, CH2 | 4.94, s | 105, CH2 | 4.69, s | 11.0, CH3 | 2.13, s |
| 12b | 4.62, s | 4.97, s | ||||
| 13 | 58.2, CH | 1.70, br s | 54.7, CH | 1.97, br s | 60.8, CH | 1.82, m |
| 14a | 69.6, CH | 4.02, d (5.9) | 69.5, CH | 4.07, d (6.1) | 62.9, CH2 | 3.34, dd (11.0, 6.8) |
| 14b | 3.61, dd (11.2, 6.8) | |||||
| 15 | 74.9, CH | 3.65, overlap | 74.8, CH | 3.68, d (6.1) | 190.0, CH | 10.02, s |
a Measured in CDCl3; b Measured in methanol-d4.
Table 2.
1H (600 MHz) and 13C (150 MHz) NMR Spectroscopic Data for 4–6.
| No. | 4 b | 5 b | 6 a | |||
|---|---|---|---|---|---|---|
| δC, Type | δH (J in Hz) | δC, Type | δH (J in Hz) | δC, Type | δH (J in Hz) | |
| 1 | 140.5, C | 124.2, CH | 5.56, br s | 212.0, C | ||
| 2 | 170.4, C | 147.2, C | 50.7, CH | 2.10, m | ||
| 3 | 52.0, C | 47.7, C | 41.8, C | |||
| 4a | 32.4, CH2 | 1.38, m | 35.2, CH2 | 1.34, m | 36.1, CH2 | 1.44, m |
| 4b | 1.71, m | 1.41, dd (12.5, 5.2) | 1.66, dd (13.7,5.7) | |||
| 5a | 32.8, CH2 | 1.25, m | 26.0, CH2 | 1.56, m | 26.0, CH2 | 1.80, m |
| 5b | 1.61, m | 0.87, m | ||||
| 6 | 73.5, C | 45.2, CH | 2.03, m | 50.1, CH | 1.33, m | |
| 7 | 47.9, CH | 3.16, br s | 45.3, CH | 2.74, br s | 51.3, CH | 2.70, brs |
| 8 | 18.7, CH3 | 1.07, s | 18.9, CH3 | 0.99, s | 22.1, CH3 | 1.09, s |
| 9 | 37.2, CH | 1.28, m | 150.3, C | 29.9, CH | 1.55, m | |
| 10 | 17.1, CH3 | 1.02, d (6.6) | 109.2, CH2 | 4.69, d (5.1) | 20.3, CH3 | 1.03, d (6.5) |
| 11 | 16.4, CH3 | 0.80, d (6.6) | 22.7, CH3 | 1.74, s | 21.4, CH3 | 0.86, d (6.5) |
| 12 | 11.3, CH2 | 2.06, s | 59.8, CH2 | 4.06, m | 6.3, CH3 | 0.96, d (7.2) |
| 13 | 55.3, CH | 2.43, dd (9.1, 5.4) | 64.3, CH | 1.64, dd (9.6, 4.9) | 54.9, C | 1.72, dd (7.9, 5.0) |
| 14a | 62.3, CH2 | 3.19, dd (10.5, 9.1) | 62.5, CH2 | 3.38, m | 62.0, CH2 | 3.85, dd (10.7, 5.0) |
| 14b | 3.61, dd (10.5, 5.4) | 3.65, dd (10.5, 5.0) | 3.50, dd (10.7, 7.9) | |||
| 15 | 189.7, CH | 9.97, s | ||||
a Measured in CDCl3; b Measured in methanol-d4.
Table 3.
1H (600 MHz) and 13C (150 MHz) NMR Spectroscopic Data for 7–9.
| No. | 7 a | 8 b | 9 b | |||
|---|---|---|---|---|---|---|
| δC, Type | δH (J in Hz) | δC, Type | δH (J in Hz) | δC, Type | δH (J in Hz) | |
| 1 | 137.5, C | 137.4, C | 57.5, CH | 2.54, br s | ||
| 2 | 165.3, C | 165.3, C | 163.7, C | |||
| 3 | 52.6, C | 52.5, C | 41.8, C | |||
| 4a | 33.7, CH2 | 1.41, dd (13.4, 5.9) | 33.6, CH2 | 1.40, dd (13.3, 5.9) | 53.2, CH2 | 1.66, dd (13.2, 10.4) |
| 4b | 1.50, dd (13.4, 6.4) | 1.48, dd (13.3, 6.5) | 2.10, dd (13.2, 10.4) | |||
| 5a | 25.2, CH2 | 0.91, m | 25.2, CH2 | 0.90, m | 67.0, CH | 3.84, m |
| 5b | 1.80, m | 1.78, m | ||||
| 6a | 44.3, CH | 1.06, m | 44.2, CH | 1.06, m | 47.2, CH2 | 1.21, m |
| 6b | 1.98, m | |||||
| 7 | 44.7, CH | 3.06, br s | 44.5, CH | 3.04, br s | 32.2, C | |
| 8 | 19.7, CH3 | 0.97, s | 19.6, CH3 | 0.96, s | 28.7, CH3 | 0.99, s |
| 9 | 31.6, CH | 1.03, m | 31.6, CH | 1.03, m | 55.0, CH | 2.02, br s |
| 10 | 21.7, CH3 | 1.06, d (5.9) | 21.7, CH3 | 1.04, d (5.8) | 30.3, CH3 | 1.09, s |
| 11 | 20.8, CH3 | 0.77, d (5.9) | 20.8, CH3 | 0.76, d (5.8) | 31.7, CH3 | 0.95, s |
| 12a | 11.0, CH3 | 2.06, s | 10.9, CH3 | 2.04, s | 103.9, CH2 | 4.75, br s |
| 12b | 4.97, br s | |||||
| 13 | 63.6, CH | 2.22, d (9.6) | 63.4, CH | 2.23, d (9.8) | 53.2, CH | 2.01, br s |
| 14 | 147.9, CH | 6.55, dd (15.9, 9.6) | 151.5, CH | 6.80, dd (15.4, 9.9) | 70.5, CH | 4.13, d (6.2) |
| 15 | 188.1, CH | 10.08, s | 188.1, CH | 10.05, s | 74.9, CH | 3.59, d (6.2) |
| 16 | 132.2, CH | 6.08, d (15.9) | 122.1, CH | 5.81, d (15.5) | ||
| 17 | 198.6, C | 171.1, C | ||||
| 18 | 27.5, CH3 | 2.20, s | ||||
a Measured in CDCl3; b Measured in methanol-d4.
Table 4.
1H (600 MHz) and 13C (150 MHz) NMR Spectroscopic Data for 10 and 11.
| No. | 10 a | 11 a | ||
|---|---|---|---|---|
| δC, Type | δH (J in Hz) | δC, Type | δH (J in Hz) | |
| 1 | 161.1, C | 161.1, C | ||
| 2 | 113.7, CH | 6.68, s | 113.7, CH | 6.69, s |
| 3 | 147.7, C | 147.8, C | ||
| 4 | 108.1, CH | 6.75, s | 108.1, CH | 6.76, s |
| 4a | 157.4, C | 157.4, C | ||
| 5 | 78.2, CH | 5.73, ddd (6.6, 4.4, 3.9) | 78.6, CH | 5.62, ddd (8.4, 3.8, 1.7) |
| 6a | 37.7, CH2 | 3.01, dd (16.2, 4.4) | 39.3, CH2 | 3.10, dd (16.3, 8.4) |
| 6b | 2.85, dd (16.2, 6.6) | 2.99, dd (16.3, 3.8) | ||
| 7 | 170.0, C | 170.2, C | ||
| 8 | 79.4, CH | 5.64, d (3.9) | 79.8, CH | 5.63, d (1.7) |
| 8a | 114.7, C | 114.6, C | ||
| 9 | 178.3, C | 178.2, C | ||
| 9a | 109.0, C | 109.0, C | ||
| 10a | 167.7, C | 167.4, C | ||
| 1′ | 22.5, CH3 | 2.41, s | 22.5, CH3 | 2.42, s |
| 2′ | 169.5, C | 170.1, C | ||
| 3′ | 52.4, CH3 | 3.73, s | 52.5, CH3 | 3.78, s |
| 4′ | 53.0, CH3 | 3.81, s | 53.1, CH3 | 3.83, s |
| 1-OH | 12.06, s | 12.01, s | ||
a Measured in CDCl3; b Measured in methanol-d4.
Table 5.
1H (600 MHz) and 13C (150 MHz) NMR Spectroscopic Data for 12 and 13.
| No. | 12 a | 13 a | ||
|---|---|---|---|---|
| δC, Type | δH (J in Hz) | δC, Type | δH (J in Hz) | |
| 1 | 221.6, C | 221.4, C | ||
| 2 | 50.6, CH | 2.16, m | 50.6, CH | 2.13, m |
| 3 | 42.1, C | 42.0, C | ||
| 4a | 36.0, CH2 | 1.45, m | 36.1, CH2 | 1.47, m |
| 4b | 1.66, m | 1.67, m | ||
| 5a | 26.0, CH2 | 0.84, m | 26.0, CH2 | 0.83, m |
| 5b | 1.78, m | 1.79, m | ||
| 6 | 50.2, CH | 1.29, m | 50.1, CH | 1.28, m |
| 7 | 51.5, CH | 2.56, br s | 51.5, CH | 2.62, br s |
| 8 | 22.1, CH3 | 1.08, s | 22.1, CH3 | 1.09, s |
| 9 | 29.9, CH | 1.41, m | 30.0, CH | 1.43, m |
| 10 | 20.4, CH3 | 0.77, d (6.6) | 20.4, CH3 | 0.78, d (6.7) |
| 11 | 21.3, CH3 | 0.89, d (6.4) | 21.3, CH3 | 0.92, d (6.5) |
| 12 | 6.5, CH3 | 0.95, d (7.2) | 6.5, CH3 | 0.96, d (7.2) |
| 13 | 51.6, CH | 1.90, m | 51.6, CH | 1.94, m |
| 14a | 65.3, CH2 | 4.05, dd (11.3, 5.1) | 65.5, CH2 | 4.04, dd (11.3, 5.2) |
| 14b | 4.35, dd (11.3, 5.1) | 4.37, dd (11.3, 5.2) | ||
| 1′ | 161.1, C | 161.1, C | ||
| 2′ | 113.6, CH | 6.67, s | 113.7, CH | 6.68, s |
| 3′ | 147.6, C | 147.8, C | ||
| 4′ | 108.1, CH | 6.75, s | 108.1, CH | 6.75, s |
| 4a′ | 157.3, C | 157.4, C | ||
| 5′ | 78.2, CH | 5.67, ddd (6.4, 4.3, 3.9) | 78.5, CH | 5.59, ddd (8.2, 3.9, 1.8) |
| 6′a | 37.7, CH2 | 2.99, dd (16.1, 4.3) | 39.2, CH2 | 3.07, dd (16.3, 8.2) |
| 6′b | 2.84, dd (16.1, 6.4) | 2.99, dd (16.3, 3.9) | ||
| 7′ | 169.5, C | 170.0, C | ||
| 8′ | 79.5, CH | 5.59, d (3.9) | 79.9, CH | 5.58, d (1.8) |
| 8a′ | 114.5, C | 114.5, C | ||
| 9′ | 178.2, C | 178.2, C | ||
| 9a′ | 109.0, C | 109.0, C | ||
| 10a′ | 167.7, C | 167.3, C | ||
| 1″ | 22.5, CH3 | 2.40, s | 22.5, CH3 | 2.41, s |
| 2″ | 169.4, C | 169.7, C | ||
| 3″ | 52.4, CH3 | 3.72, s | 52.5, CH3 | 3.72, s |
| 1′-OH | 12.06, s | 12.06, s | ||
a Measured in CDCl3; b Measured in methanol-d4.
Table 6.
Inhibitory effects of the isolates against five plant pathogens (MIC, μg/mL) a.
| Compd | Psa | P. infestans | A. solani | R. solani | F. oxysporum |
|---|---|---|---|---|---|
| 3 | 256 | NA | 128 | 256 | NA |
| 4 | NA c | 128 | NA | NA | NA |
| 7 | 128 | NA | 64 | 128 | 256 |
| 8 | 256 | NA | 256 | NA | NA |
| 9 | NA | 128 | NA | NA | NA |
| 10 | 64 | 128 | NA | NA | NA |
| 11 | 128 | 64 | NA | NA | NA |
| 12 | 256 | 64 | NA | 64 | NA |
| 13 | 128 | 32 | NA | NA | NA |
| 14 | NA | NA | 8 | NA | 128 |
| 15 | 16 | NA | 16 | NA | NA |
| 16 | 128 | 128 | 128 | 256 | NA |
| Streptomycin b | 8 | − | − | − | − |
| Hygromycin B b | − | 8 | 4 | 16 | 32 |
a Compounds without any bioactivity are not listed; b Positive controls; c NA = no activity at 256 μg/mL.
Publisher’s Note: MDPI stays neutral with regard to jurisdictional claims in published maps and institutional affiliations. |
© 2021 by the authors. Licensee MDPI, Basel, Switzerland. This article is an open access article distributed under the terms and conditions of the Creative Commons Attribution (CC BY) license (https://creativecommons.org/licenses/by/4.0/).
Share and Cite
MDPI and ACS Style
Yu, J.-J.; Jin, Y.-X.; Huang, S.-S.; He, J. Sesquiterpenoids and Xanthones from the Kiwifruit-Associated Fungus Bipolaris sp. and Their Anti-Pathogenic Microorganism Activity. J. Fungi 2022, 8, 9. https://doi.org/10.3390/jof8010009
AMA Style
Yu J-J, Jin Y-X, Huang S-S, He J. Sesquiterpenoids and Xanthones from the Kiwifruit-Associated Fungus Bipolaris sp. and Their Anti-Pathogenic Microorganism Activity. Journal of Fungi. 2022; 8(1):9. https://doi.org/10.3390/jof8010009
Chicago/Turabian StyleYu, Jun-Jie, Ying-Xue Jin, Shan-Shan Huang, and Juan He. 2022. "Sesquiterpenoids and Xanthones from the Kiwifruit-Associated Fungus Bipolaris sp. and Their Anti-Pathogenic Microorganism Activity" Journal of Fungi 8, no. 1: 9. https://doi.org/10.3390/jof8010009
Note that from the first issue of 2016, this journal uses article numbers instead of page numbers. See further details here.