Wi-Fi Crowdsourced Fingerprinting Dataset for Indoor Positioning
by
 , , , ,
Elena Simona Lohan
1,*,† ,
,
Joaquín Torres-Sospedra
2,† ,
,
Helena Leppäkoski
1 ,
,
Philipp Richter
1,
Zhe Peng
1 and
Joaquín Huerta
2 1
Department of Electronics and Communications Engineering, Tampere University of Technology, Korkeakoulunkatu 3, Tampere 33720, Finland
2
Institute of New Imaging Technologies, Universitat Jaume I, Av. Vicente Sos Baynat s/n, 12071 Castellón de la Plana, Spain
*
Author to whom correspondence should be addressed.
†
These authors contributed equally to this work
Data 2017, 2(4), 32; https://doi.org/10.3390/data2040032
Submission received: 12 September 2017
/
Revised: 28 September 2017
/
Accepted: 29 September 2017
/
Published: 3 October 2017
Abstract
:Abstract
Benchmark open-source Wi-Fi fingerprinting datasets for indoor positioning studies are still hard to find in the current literature and existing public repositories. This is unlike other research fields, such as the image processing field, where benchmark test images such as the Lenna image or Face Recognition Technology (FERET) databases exist, or the machine learning field, where huge datasets are available for example at the University of California Irvine (UCI) Machine Learning Repository. It is the purpose of this paper to present a new openly available Wi-Fi fingerprint dataset, comprised of 4648 fingerprints collected with 21 devices in a university building in Tampere, Finland, and to present some benchmark indoor positioning results using these data. The datasets and the benchmarking software are distributed under the open-source MIT license and can be found on the EU Zenodo repository.
Data Set
10.5281/zenodo.889798
Data Set License
MIT License
1. Introduction and Motivation
Wireless Local Area Networks (WLANs), also called Wi-Fi, are widespread in urban scenarios in order to enable and support broadband communications. Wi-Fi urban positioning, and especially Wi-Fi indoor positioning, has already become a mature positioning technology due to its simplicity, ease of access to the Wi-Fi Received Signal Strength (RSS) measurements on a vast majority of devices and systems and the low cost of implementation. A huge amount of research has been dedicated to Wi-Fi-based indoor positioning. Excellent surveys can be found for example in [1,2,3,4].
While there is a general understanding in the research community that Wi-Fi-based positioning can reach a positioning accuracy down to a few meters, very few comparative studies of algorithms tested under various datasets exist, and very few benchmark open-source Wi-Fi datasets for indoor positioning purposes have been made available to the research community so far, to the best of the authors’ knowledge. As a result, the typical approach is that any newly proposed Wi-Fi positioning algorithm is tested with one’s own, proprietary and undisclosed data, and the reported results are usually hard or impossible to compare between them due to four main factors:
- Non-standardized measurement spaces, ranging from one or two rooms to multi-floor multi-corridor buildings, or even multiple multi-story buildings
- Non-standardized conventions regarding the stored data, for example referring to: how to store the RSS of heard Access Points (AP) in a certain measurement point (dBm versus linear scale, conventions for non-heard AP, etc.), how many RSS and AP values to store per measurement point (all heard versus some truncation rule), how often to collect the measurements and with which spacing or grid, etc.
- Non-standardized localization hardware, having many different AP models and many possible strategies to deploy the Wi-Fi network infrastructure
- Non-unified understanding regarding the available data, for example: how to treat an AP heard over multiple floors (if separately per floor or in a 3D space), how to interpret the data stored floor by floor where the height dimension is missing, etc.
One of the solutions to address this current lack of benchmarks for indoor positioning is to offer open-source data collected from multi-floor multi-corridor buildings freely to the research community and to add some illustrative results obtained with such a data, in order to create a starting point, or baseline, for comparison of various indoor positioning algorithms. This solution is addressed in our paper with a dataset collected during January–August 2017 at Tampere University of Technology, based on an Android application created specifically for this purpose and involving several volunteers with various Android devices to collect the data. Our data includes 4648 fingerprints, which were then split randomly (uniform distribution) into (or 697 fingerprints) for the training data and (or 3951 fingerprints) for the test or estimation data. Twenty one different Android devices were used in collecting the data, and the devices were used with different orientations and by different persons during the data collection stage. Sometimes, the same device was used by multiple persons, in such a way so as to mimic a crowdsourced data gathering scenario. The data description, the provided open files (measurement data and software analysis tools) and results based on these data are described in what follows.
To the best of the authors’ knowledge, there is no open-source Wi-Fi database with the following features: collected in a full crowdsourced mode (i.e., different devices, different users and no main indications), well documented with good data description, tested with many different algorithms (comprehensive benchmarking) and providing collection and utility software. Some representative available Wi-Fi datasets are summarized in Table 1. Our paper addresses this lack in the current literature, by providing a full measurement package with crowdsourced Wi-Fi fingerprints and a comprehensive benchmark software.
2. Dataset Description
This section described the database and supporting software, which have been deposited in the Zenodo repository, created within the EU-funded project OpenAIRE (Open Access Infrastructure for Research in Europe) and initially meant for EU-funded projects, but now used also for wider scopes by the entire research community in various research fields, such as telecommunication, physics, chemistry, etc. The choice of the Zenodo repository was based on its ease of access and use, its reliability, its supportive attitude towards BigScience tools and its policy-oriented towards eliminating barriers towards adopting data-sharing practices.
Our data can be found at the following link [15]. To ensure wider availability, a mirror has been established at TUT’s research team web page [10] and another one at UJI’s research team web page [16,17].
2.1. Fingerprinting Dataset
The database is provided as ‘csv’ files to enhance the interoperability, and no specific software is required to read them. Four ‘csv’ files for the training data and four ‘csv’ files for the test data are available, each of them with a number of rows equal to the number of measurements in that dataset (4648), as follows:
- Coordinates file: Each row shows the coordinate (in meters) where the measurements were done. These are the local coordinates, not the GPS coordinates (WGS84 or similar), so that they can be directly used for positioning studies. Example: for the first measurement in the test fingerprints.
- RSS file: This is a large file with columns, showing the RSS level at which each of the MAC addresses were heard in each measurement point. Each row corresponds to one measurement. The non-heard APs are set to dBm, which is a fixed bogus value. If an MAC address is heard, then it is heard at a negative level (in dBm). For example, in the training RSS file, Access Point 2 was not heard (i.e., value of 100); Access Point 420 was heard at dBm; and Access Point 489 was heard with dBm.
- Date file: This is a single column file, where each row shows the date at which each measurement from the corresponding training or test sets was done. For example, the measurement indexed one from the test data was taken on 18 August 2017 at 11:59:23. The measurement dates are not sorted chronologically; they were stored in a non-chronological order on the cloud server when the measurements were done. However, the four training data files are perfectly synchronized, meaning that the n-th row in each of the training file is always matched to the n-th row in the other training files, with . Similarly, the four test data files are also synchronized.
- Device file: This is another single column file, where each row shows what Android device was used for that particular measurement. For example, the third measurement in the training data was collected with a Samsung SM-A10F device, and the 15th measurement in the test data was collected with a Xiaomi MI MAX 2 device.
2.2. Supporting Software
Together with the measurement data, a MATLAB/Octave SW package is provided, which:
- reads the ‘csv’ data and writes it into two MATLAB cell structures, one for the training and one for the test datasets
- shows examples of plots, such as the location of the measurements, the measurements distributions, per floor and per device, etc.
- shows examples of power maps in 2D and 3D views
In addition, also two Python scripts are provided. Their functionality includes:
- reading of the ‘csv’ training- or test data,
- different visualizations of the data, such as the location of the measurements, or examples of power maps in 2D and 3D views and
- position estimation based on two clustering and positioning algorithms described in [20].
Finally, the implementation of the kNN-based algorithm published in [21] is provided as a MATLAB/Octave SW package, which also includes scripts to:
- read the csv data and generate a struct structure with the database data
- implement three alternative representations for RSSI values
- implement eleven custom distance metrics
- remap floors
All SW packages are provided together with a README files.
3. Materials and Methods
3.1. Crowdsourced Data Collection Procedure
The data were collected with an Android client application coded in Java using Android Studio 2.2.3 and a Google Cloud server-based application. The server has been written in Python (version 2.7). The REST API parts of the server used the Flask web development framework. The server used several Google services such as data store and cloud storage by utilizing Python modules implemented in the App Engine SDK. The volunteer users installed the Android application on their devices and reported the correct location (based on a manual input on the map) to the server. The server stored the location reported by the user, the time stamp, the device model, the MAC addresses of the heard Access Points (AP) and the RSS from each AP.
To help the user in his/her manual inputs, also an initial indoor position estimation was provided, by pressing the ESTIMATE button in Figure 1a. The initial position estimate is based on a Gaussian likelihood location fingerprinting, described for example in [20]. Once an initial estimate is shown on the screen (as the three nearest neighbors plus a coverage area estimate shown via a blue circle), the user is asked for feedback as seen in Figure 1b. If the user selects ‘yes’ option, he/she will be able to select his/her exact location on the map, by selecting first the correct floor (shown from 1–5 in Figure 1c) and then the position at that floor (see the orange dot in Figure 1d). Finally, the user is notified that the feedback has been received while the estimated and corrected position remain on the screen (see the notification in Figure 1e). As a manual input is needed from the user during the data collection stage, it means that the Android devices were kept in the user’s hands, with the screen up, at the time of the data collection. The users’ heights and their orientation with respect to the closest access nodes were however not known, and this was a realistic assumption in the context of crowdsourced data gathering.
The measurements were recorded in a five-floor building in Tampere (23.85580° N, 61.44585° E), Finland. The five-floor building has a footprint of about 22,570 m2 (about 208 m length and 108 m width).
The building is a typical university building hosting a few larger lecture halls and several smaller lecture rooms on the first and second floor and many offices and several meeting rooms all over the building. The building floor maps are shown in Figure 2. The building has six floors, but since the basement was not accessible during our measurement campaign, the measurements were taken only at Floors 1–5. A cafeteria and a restaurant occupy roughly one third of the first floor. They also share a larger void with the second floor, which extends along the main hallway of the building. The outer walls and other structurally-important inner walls are reinforced concrete walls, whereas other partitions walls are made of lightweight materials, such as plasterboard or glass. The windows in the facade are double insulation glass windows; the floors are made of reinforced concrete, as well. Typical penetration losses of such materials can be found in [22] and the references therein. Figure 3 shows two examples of the indoor environment where the measurements were done. Our model of the premise contains 822 rooms in total. The rooms’ layouts at the first and second floor can be seen in Figure 7c,d; the layouts at the third and fourth floors are similar, while the fifth floor was accessible from only a few points. The interior of the majority of these rooms consists of furniture and equipment required in typical office spaces and laboratories of a computing and electrical engineering department.
About 8 volunteers collected the data by using different Android devices and by moving randomly in different parts of the building. The measurements were taken at only four out of the five floors, as the basement was not accessible. During the measurements, a total of 991 MAC addresses () were heard. The large amount of MAC addresses can be explained by two facts: first, many of the physical APs in the university building support multiple Service Set Identities (SSID), with an average of 4 or 5 MAC addresses per AP. This means that one physical AP can correspond to 4 or more virtual APs. Secondly, many APs in the residential blocks close to the university building can also be heard (typically at a lower RSS), and also the occasional mobile hotspots in the building can report RSS values. For example, 173 APs from our data were heard in less than 3 measurement points, and 116 APs from the data were heard at a maximum RSS below dBm.
The exact position of the access points in the building is not known, and some of them are in fact mobile access nodes, due to users’ Wi-Fi being in hotspot mode. Some others can come from the residential buildings nearby the university; the RSS measurements coming from the APs located in the nearby buildings are typically at much weaker power than those coming from APs located inside the university building. Nevertheless, coarse estimates of the AP location can be obtained with the weighted centroid estimator described in Section 4.3 and provided with our data at [15]. The Android application used in the data collection does not store any information about the Wi-Fi frequency channels. Every user device registered all the RSS in range on all the Wi-Fi frequency channels supported by his or her device. This means that if the user’s device supported both the 2.4-GHz and 5-GHz frequency range, the RSSs coming from both frequency bands were stored. However, the Android tool for data collection does not make the differentiation between RSS collected in different frequency bands. We would like to point out that the absence of the exact knowledge of the access point location and of the frequency bands is a very realistic situation, typically encountered in any crowd-sensed database.
3.2. Data Processing and Storage
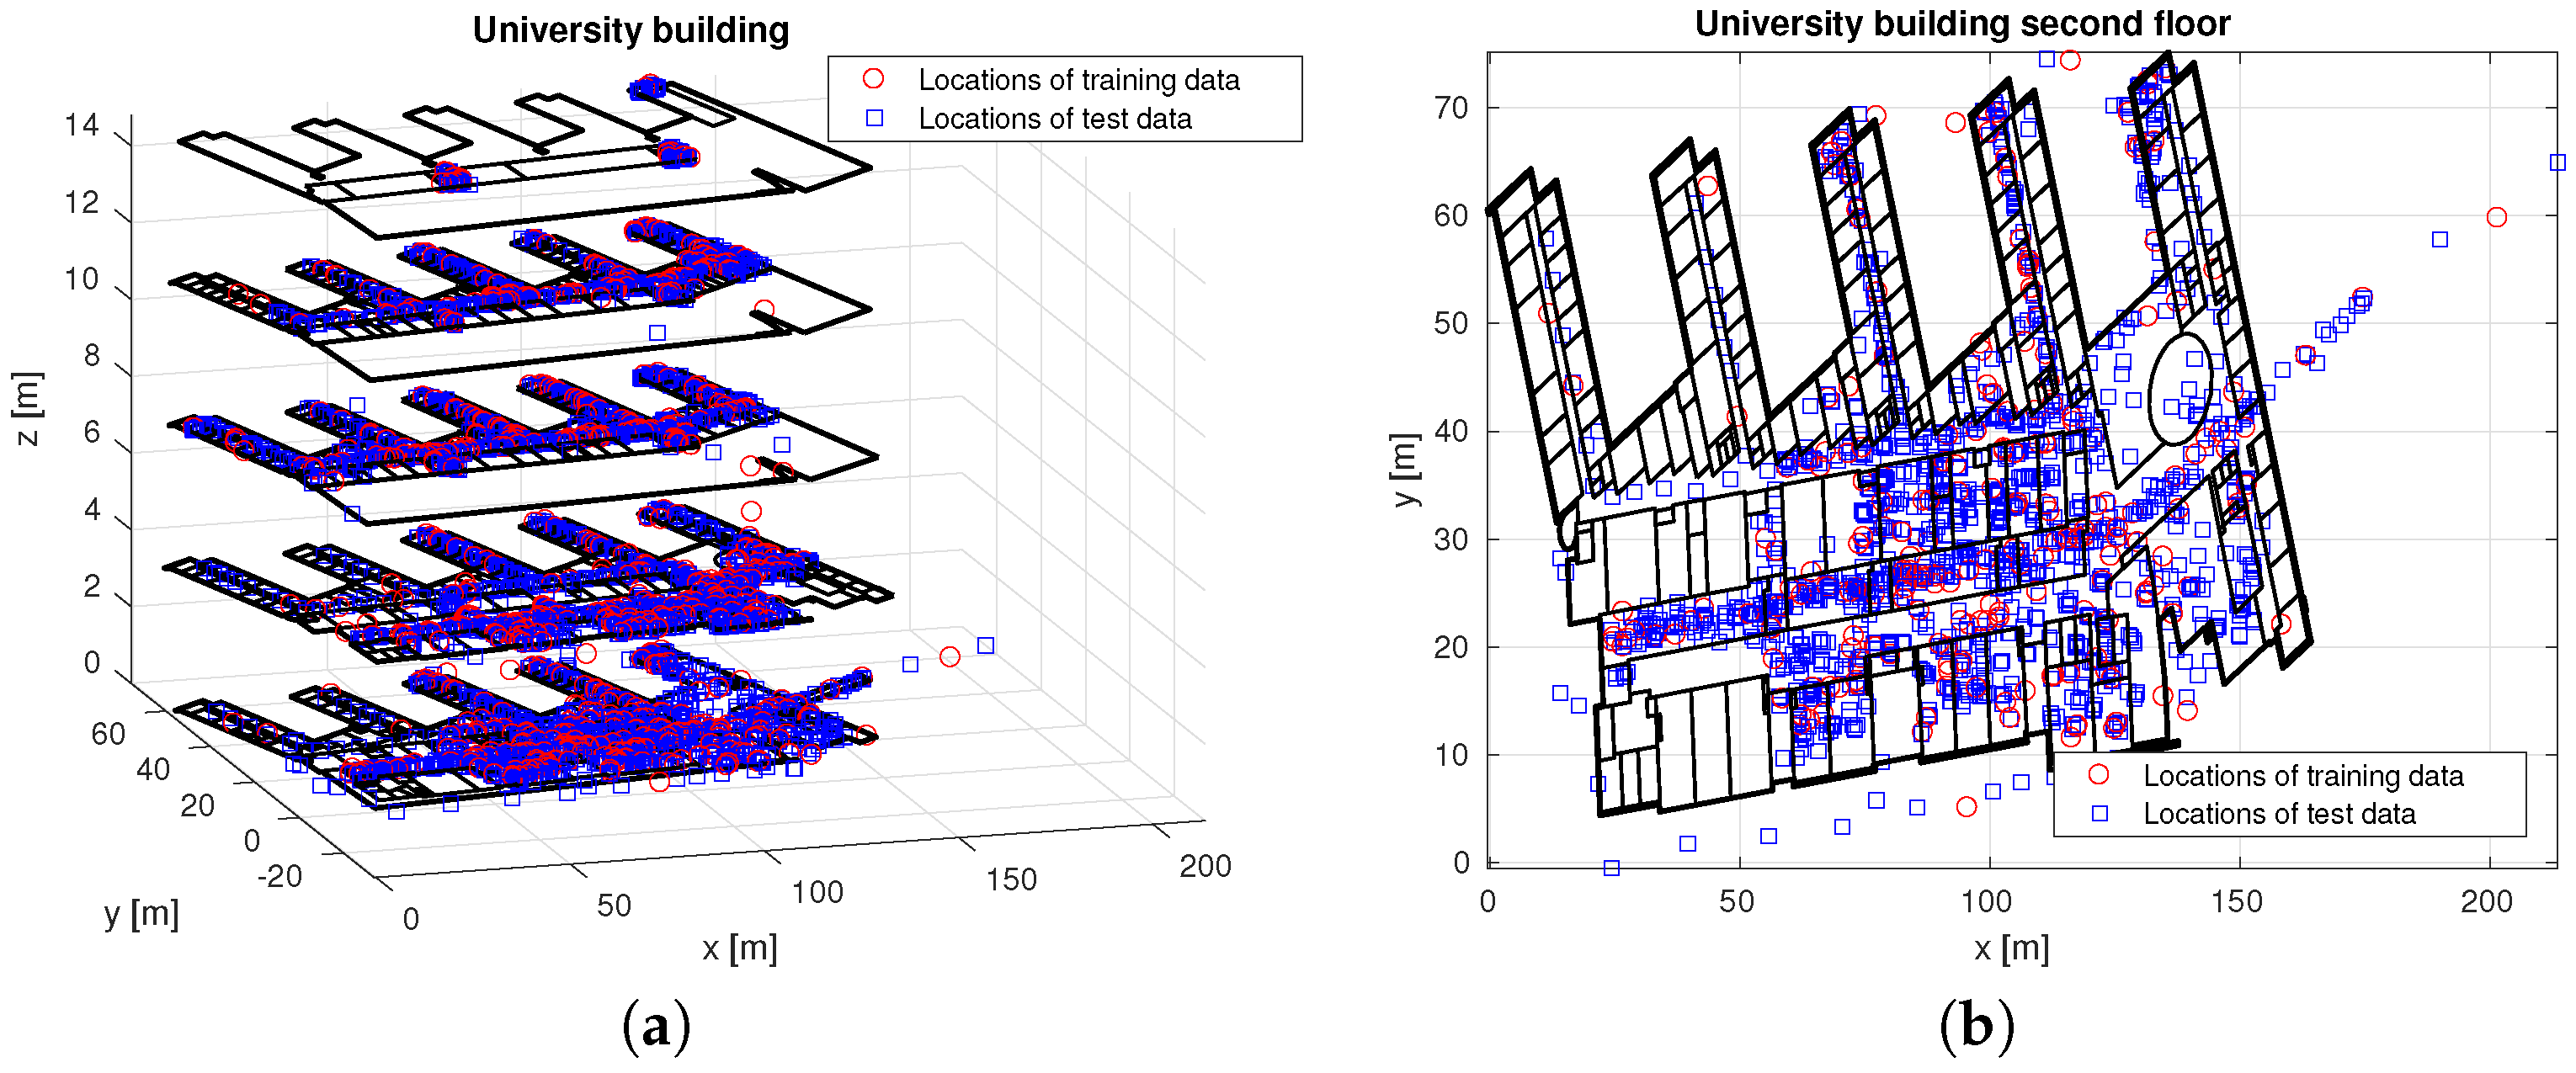
At the end of the measurement campaign, we detected 4648 fingerprints in the cloud database. These fingerprints were then split randomly and in a non-overlapping manner into 697 training fingerprints and 3951 test fingerprints, as shown in Figure 4, in order to enable indoor positioning studies. As seen in the figure, a few measurements were also taken outside the building, but close to it.
The training and test fingerprints were then stored into Comma-separated Values (CSV) format, as described in Section 2.
3.3. Restrictions of the Availability
All the fingerprinting data described here are made available together with the supporting MATLAB/Octave and Python files for the basic benchmark results. Therefore, the research community will have access to the tools that have been used to generate and evaluate the database.
However, the building floor maps of the Tampere University of Technology (which appear in some of the plots in Section 3.2) are not made available in our open-access software due to privacy and IP issues (i.e., the maps shown in Figure 2 were created using proprietary software, and the original pdf maps contain proprietary information such as room numbers, which cannot be disclosed. Furthermore, the MATLAB/Octave files for creating the more advanced algorithms, such as path loss-based estimators [23], Dempster–Shaffer-based estimators [24] or image-based processing [25,26], among others, are not made available due again to IP issues (e.g., calling some functions, which are proprietary code).
Nevertheless, we would like to emphasize the fact that these restrictions do not diminish the use of the dataset we present, as researchers are free to implement their own algorithms or to use algorithms reported in the published literature and to test them with our data. An example to import the ‘csv’ data into MATLAB/Octave and Python is also provided. Moreover, the software provided together with our data is also partly applicable to other datasets found at [16,17,27] and [10] (see the Universitat Jaume I -UJI- and Technical University of Tampere -TUT- repository datasets mentioned in Table 1).
4. Examples of Data Use
4.1. Measurement Distributions
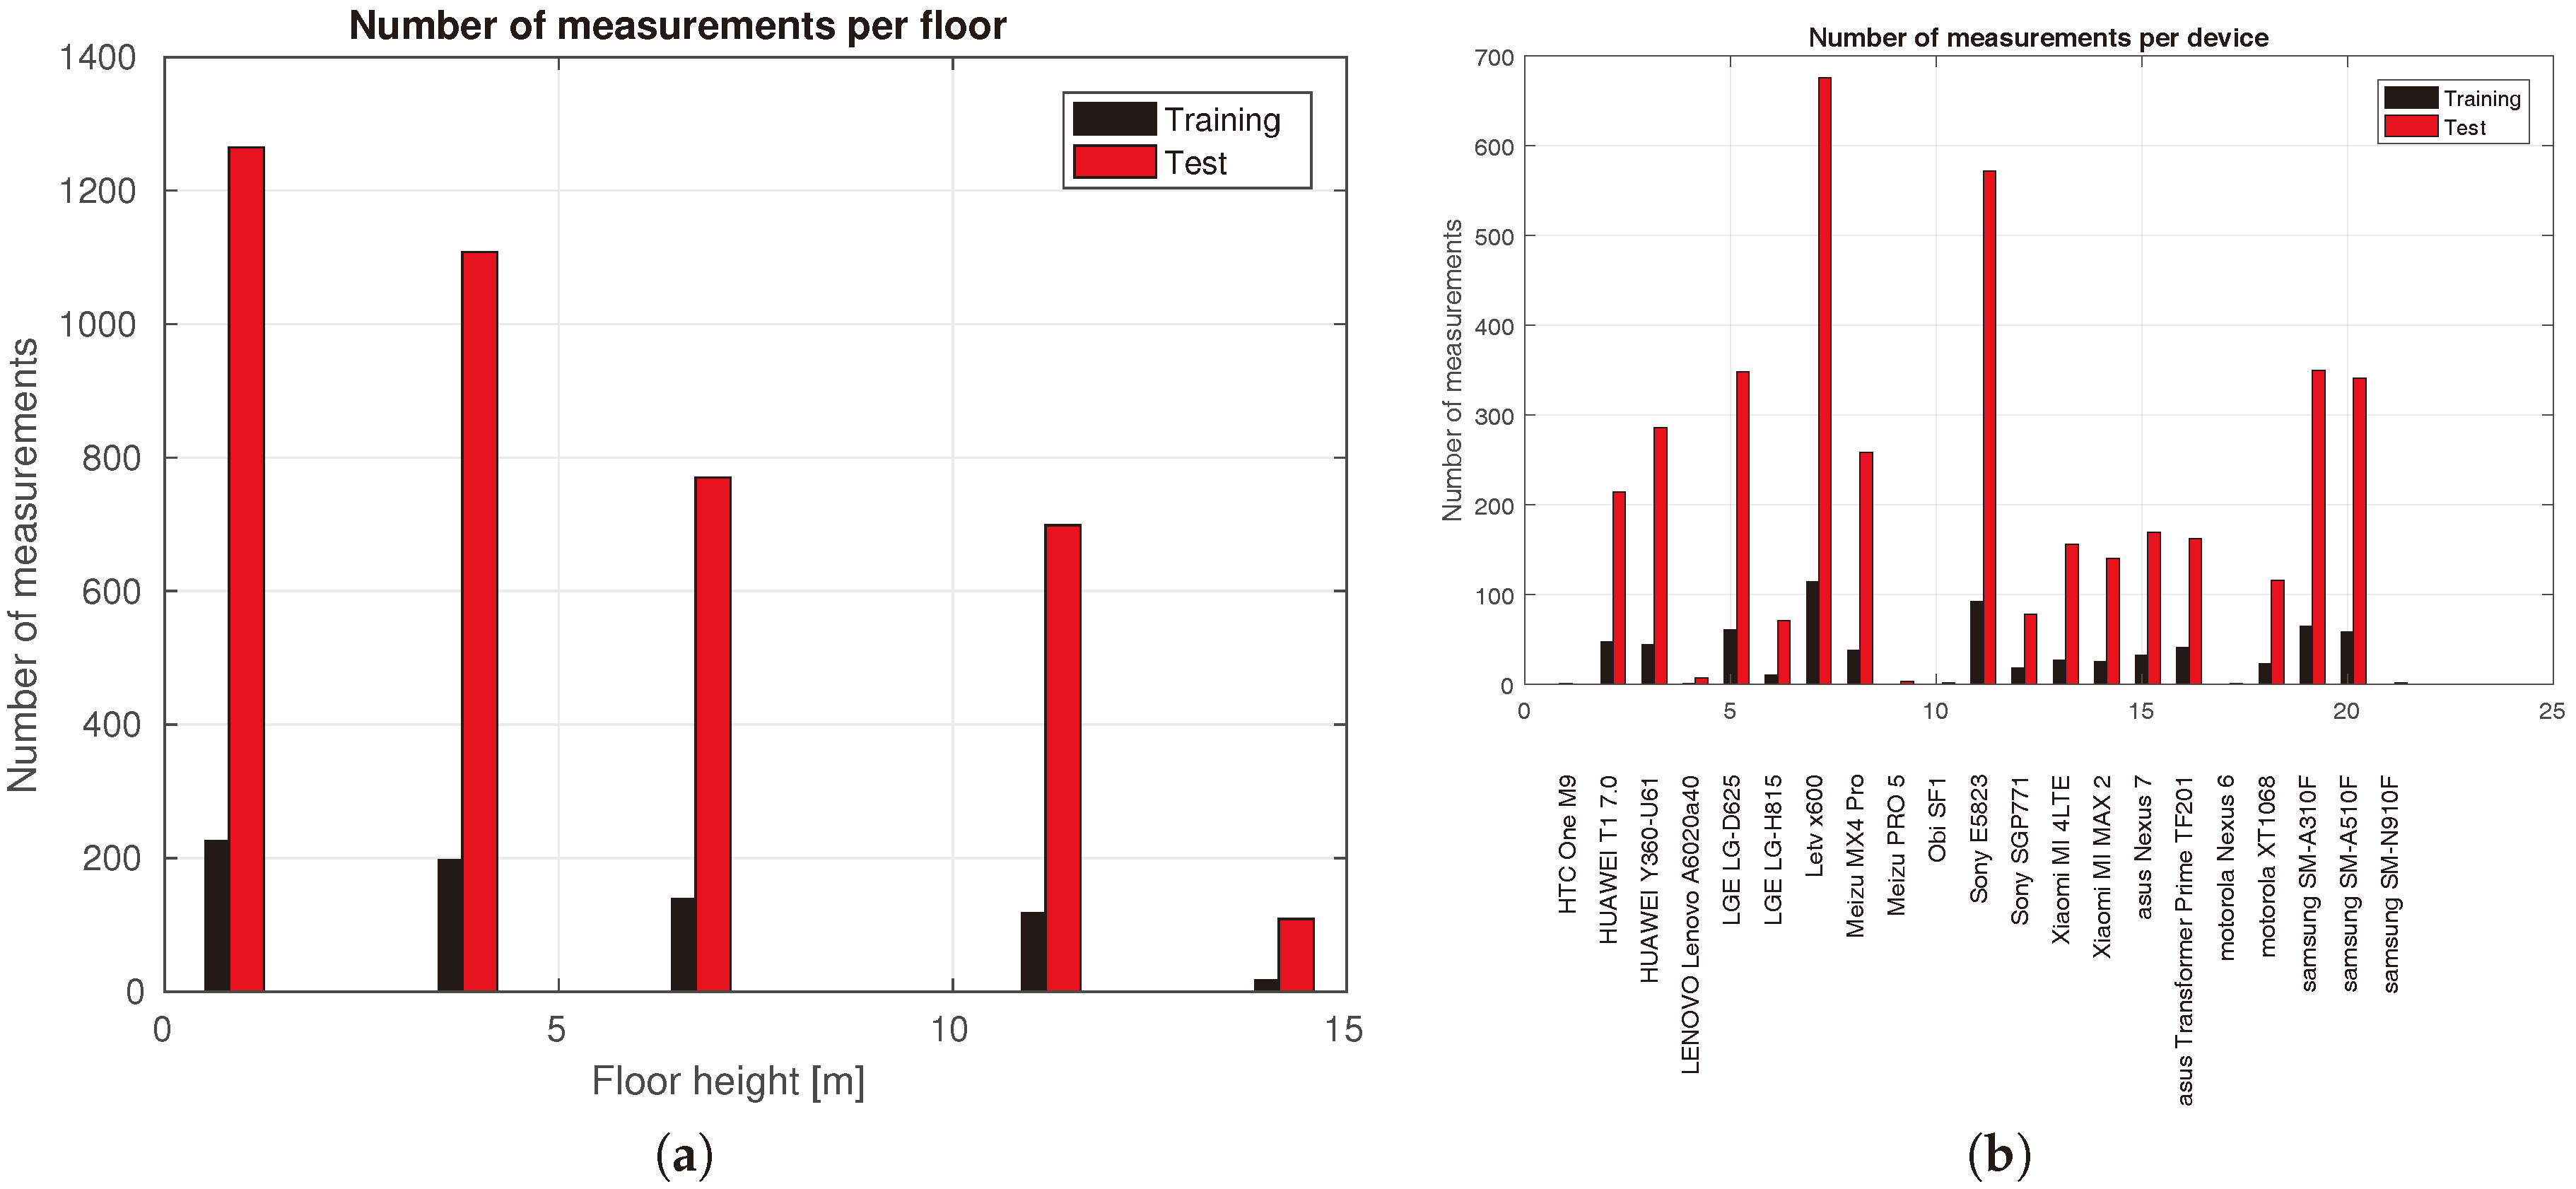
The distribution of the measurements per floor and per device type is shown in Figure 5, for the training and test data, respectively. Among the 21 measurement devices, six of them reported less than 10 measurement points, and four of them reported only one or two measurement points. This happens because, in addition to the volunteers from our research team, a few other anonymous volunteers tested the application with their devices, but probably stopped after one or a few points. From Figure 5, we notice rather similar distributions for training and test data. For example, most of the measurements were done at the first two floors (in both the training and the test data), and the least number of measurements was taken at the fifth floor, which was the least accessible. Furthermore, the highest number of measurements per device in both training and test data was done with a Letv-x600 device.
The amount of measurements per access point is depicted in Figure 6. The number of measurements per access point is related to the location of access points. Access points that are located centrally in the building, e.g., in the center of the building, on floors that are easily accessible and frequently passed by users, are likely to be heard often, whereas access points that are not even in the building and may only be received at a edge of the building are likely to be heard scarcely. An access point that was heard often throughout the measurement campaign is AP 492, which is therefore used as an example in the following section.
4.2. Power Maps
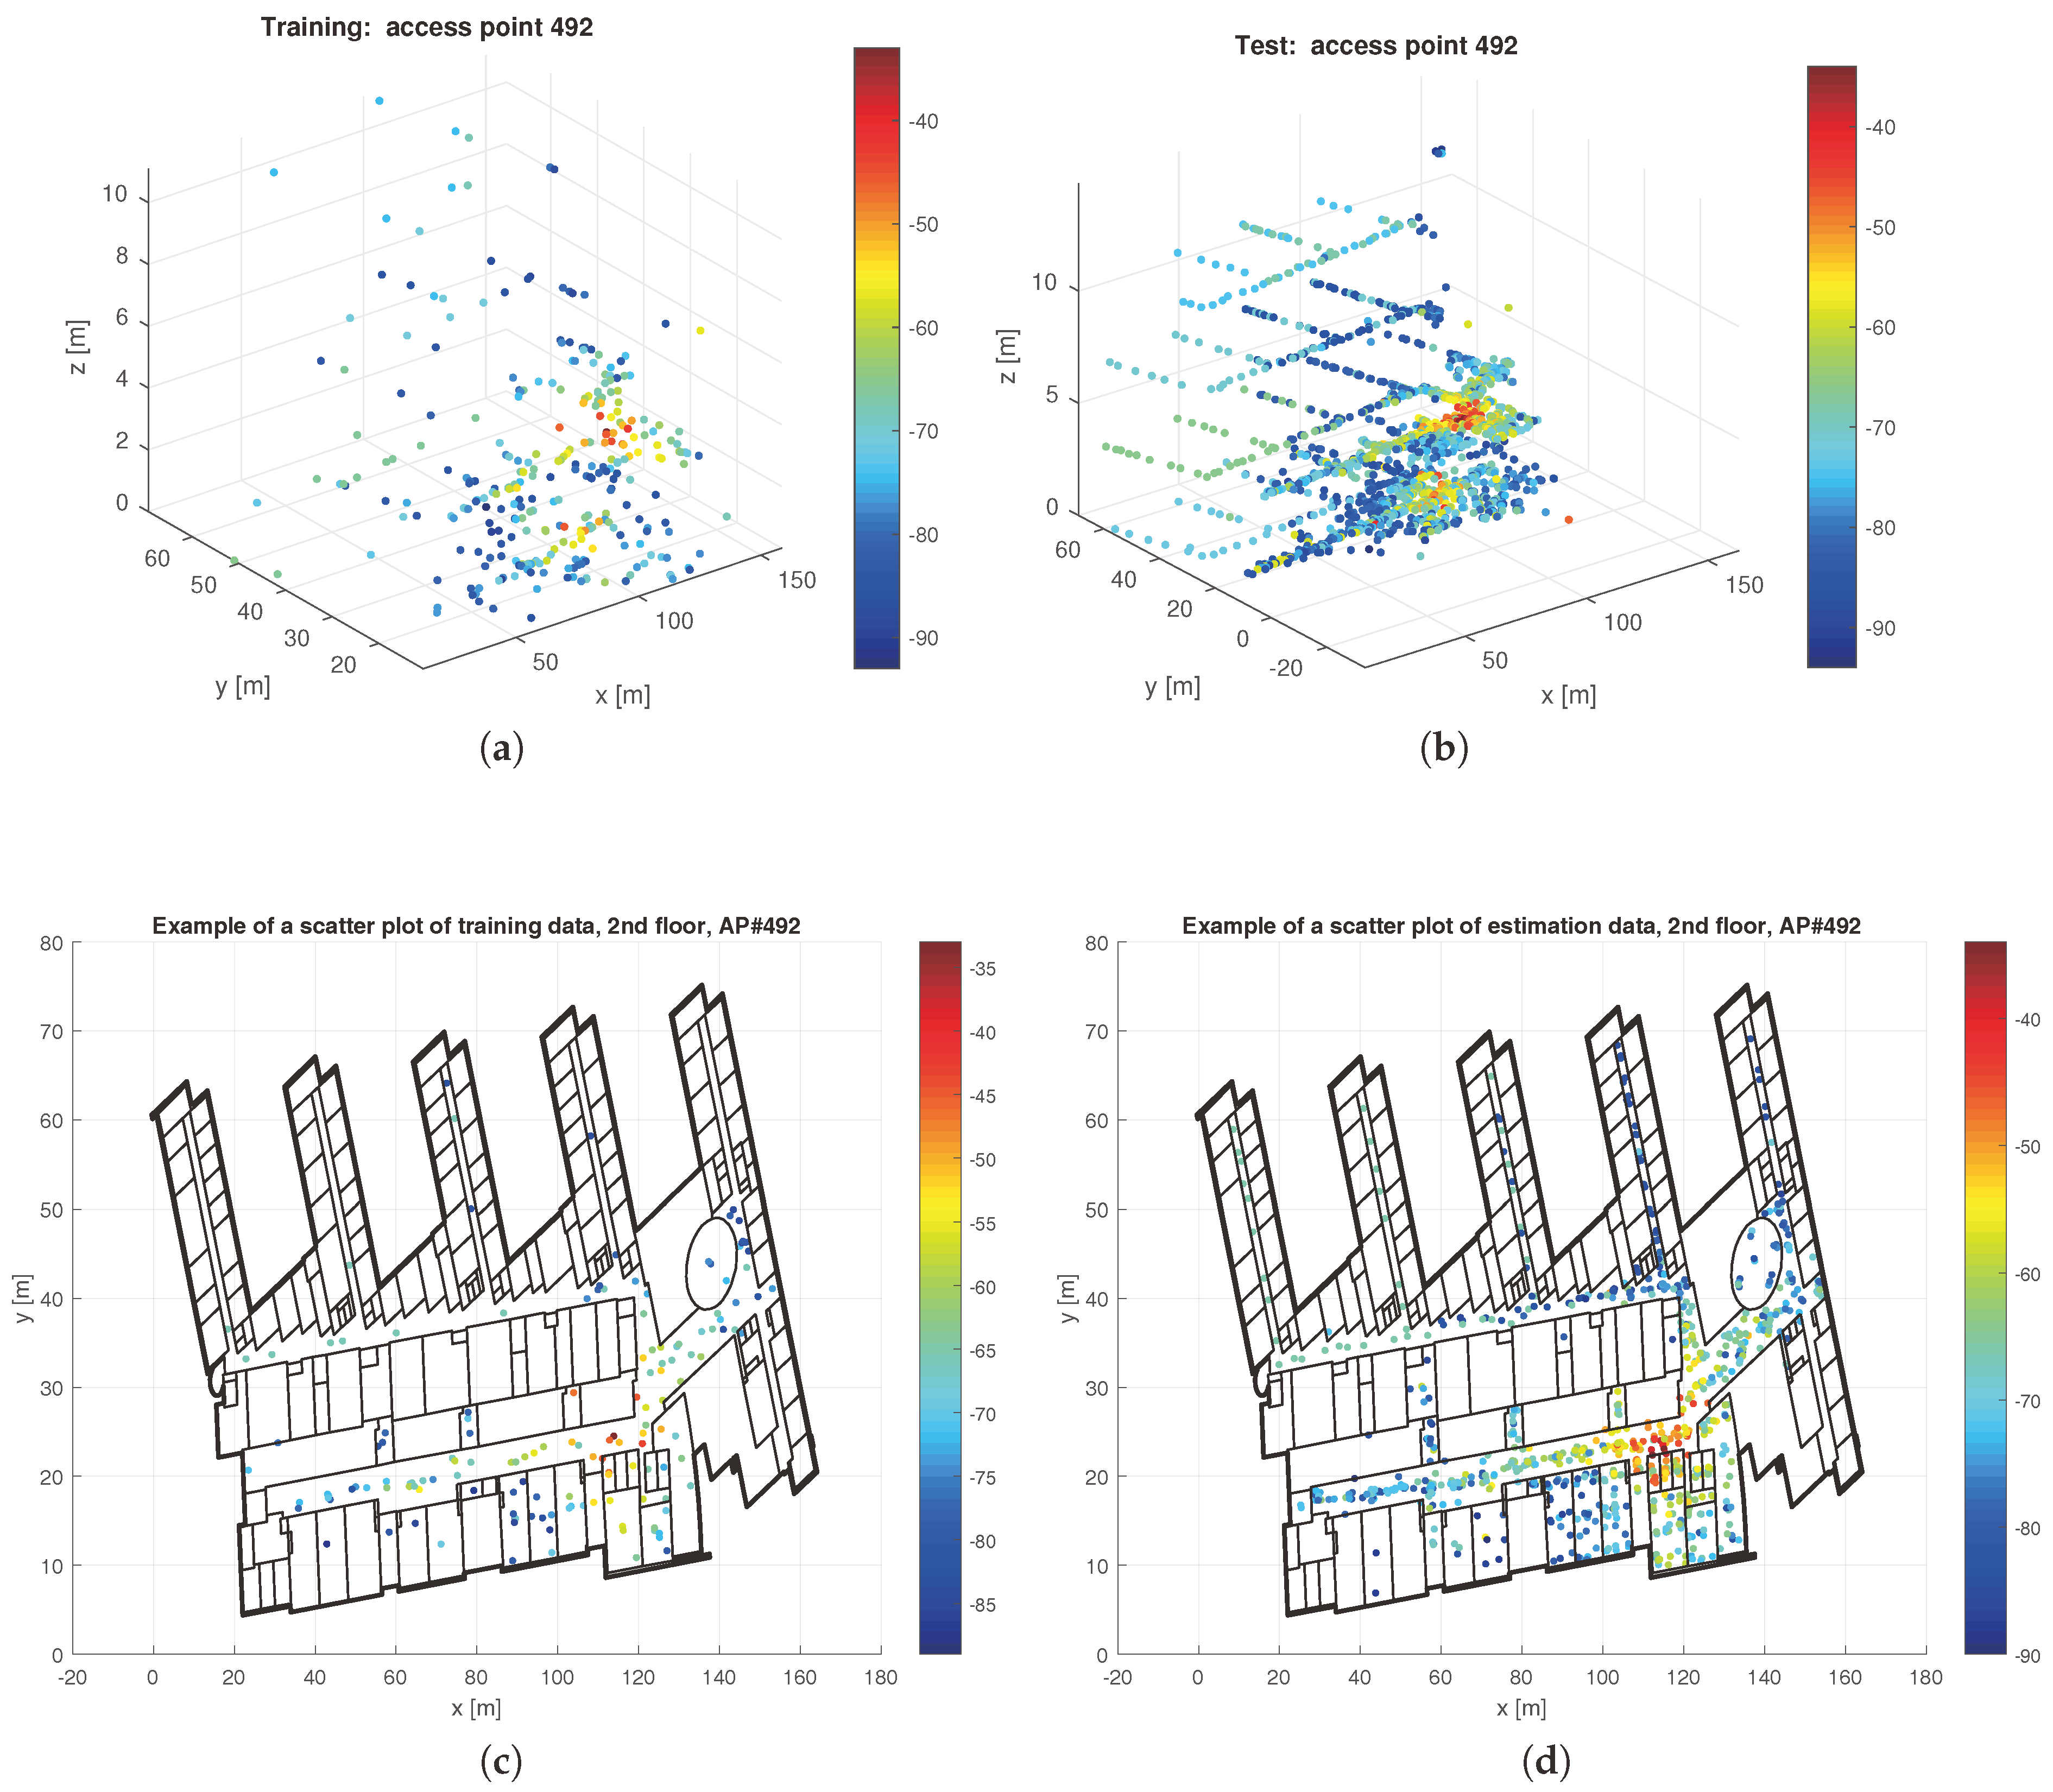
Several examples of 3D and 2D power maps are shown in Figure 7 and Figure 8, based on training and estimation/test data. A power map shows the RSS level with different colors, from strong RSS (red) to weak RSS (blue) values. Each power map is associated with a single AP. We can look at the power maps either in the 3D space (e.g., using a scatter plot) or floor by floor (in 2D space). The 2D power maps can be shown either via a scatter diagram, i.e., non-interpolated values as in the lower plots of Figure 7, or via interpolated values, as in Figure 8. The upper plots in Figure 7 show the 3D power map of the 492nd AP, based on the training and test data, respectively. A first observation is that this AP is heard at the strongest level at the second floor, in both the training and the test data; thus, it is very likely that it was located at the second floor. A second observation is that the training and test data look highly correlated, as expected, since it is the same AP we look at, but at different times and, possibly, with different devices. The lower plots in Figure 7 show the 2D power maps with non-interpolated RSS values, i.e., only those measurement points are shown with their corresponding power intensity on the map.
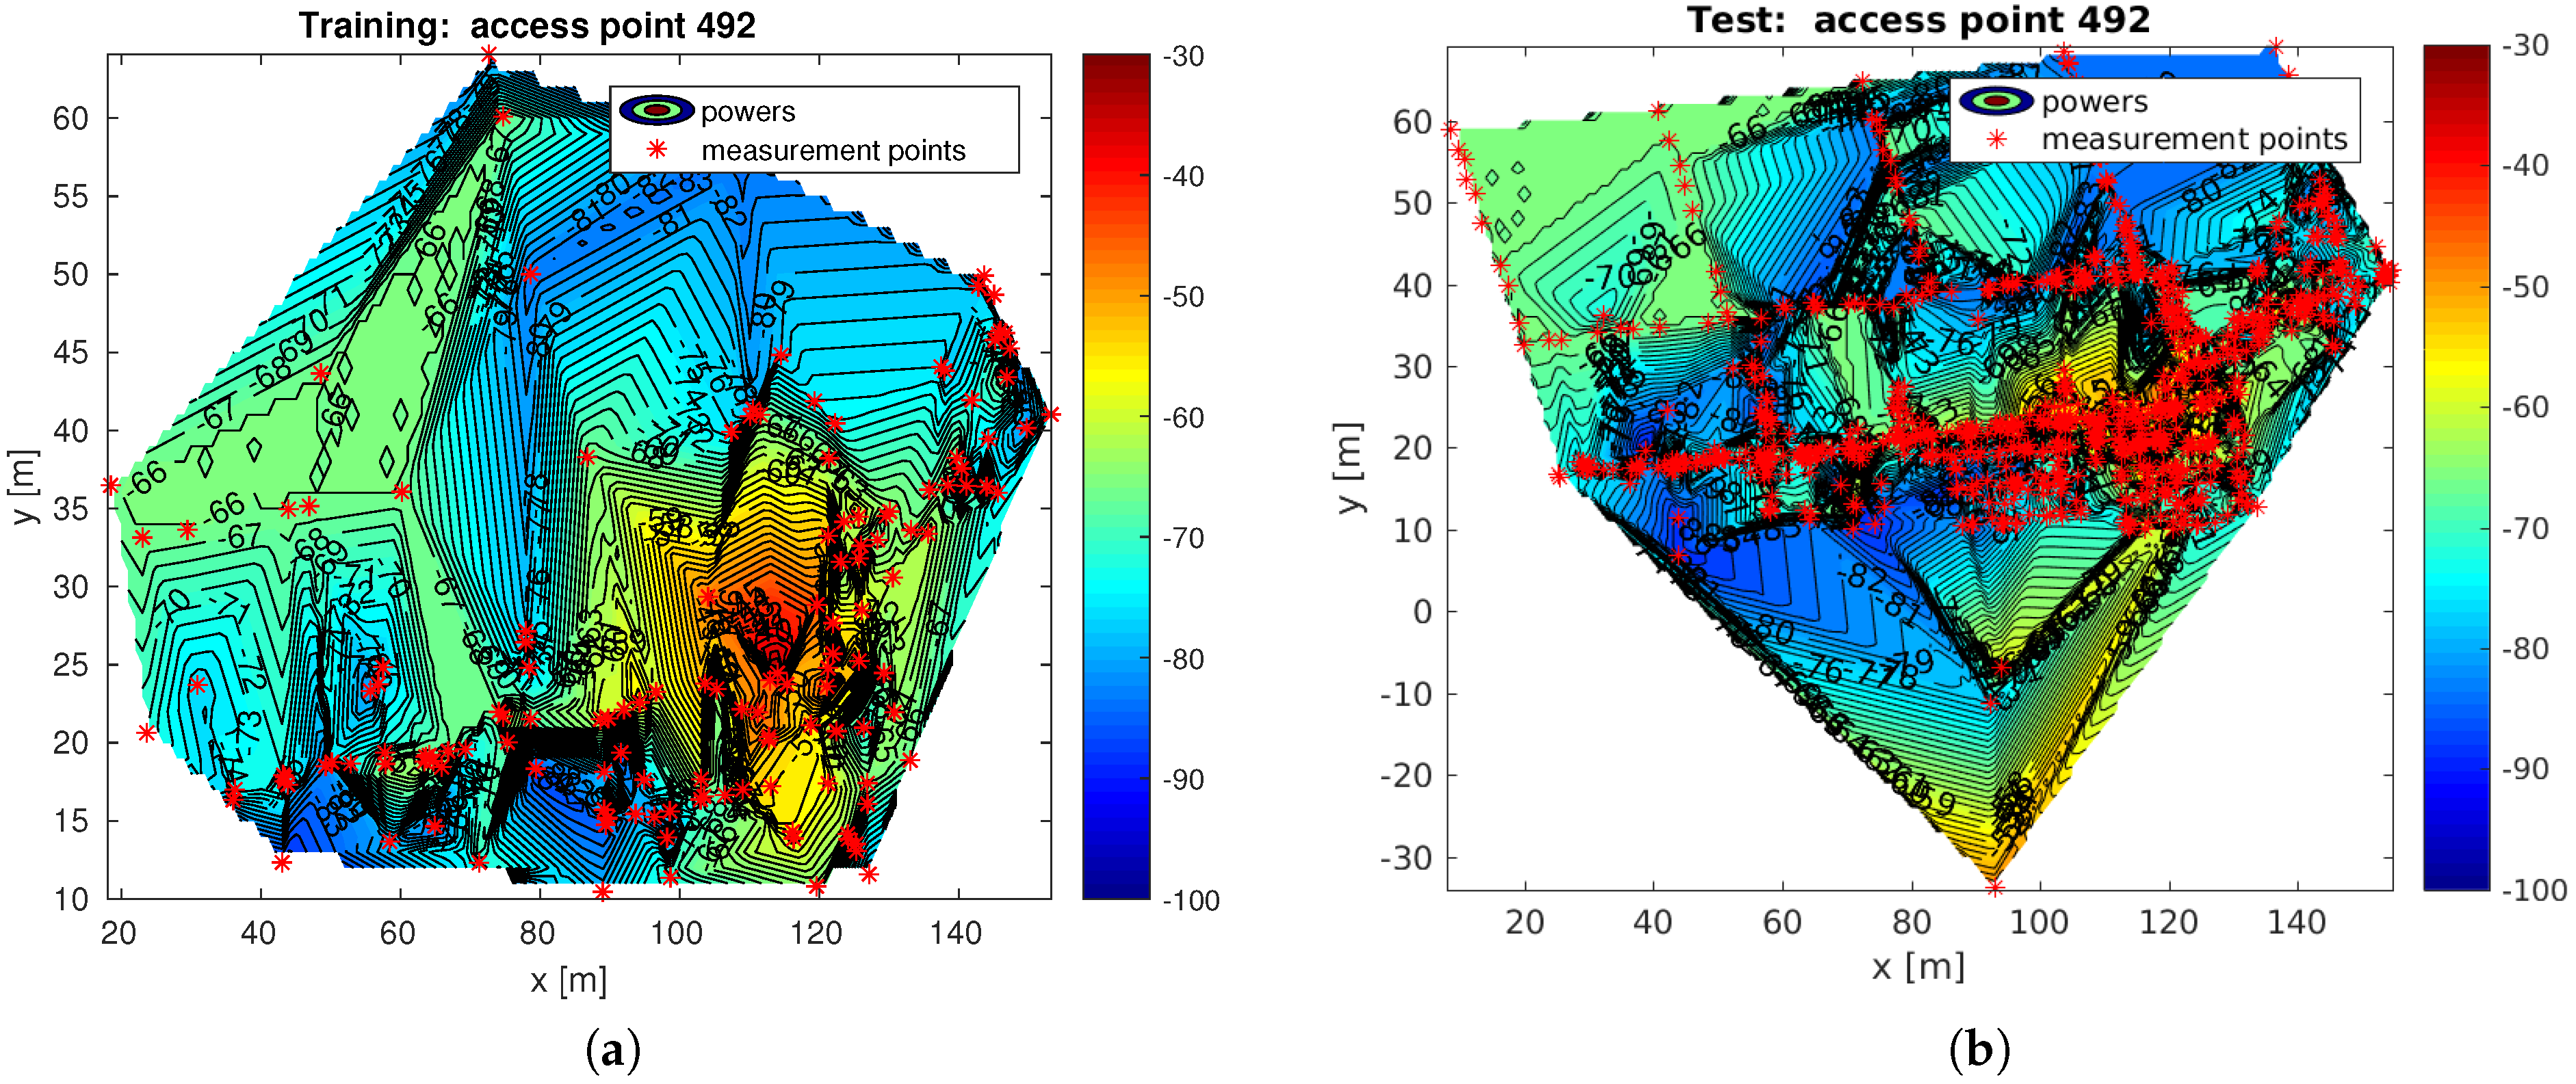
A different way to look at the 2D power maps is to use the interpolated values, as shown in Figure 8. In Figure 8, the interpolated 2D power map is shown also at the second floor of the same 492nd AP as above. The 2D power maps used linear interpolation in order to show also the expected RSS values in between the measurement points. We showed in [28] that, by using linear interpolation, we are able to recreate the missing RSSs with mean errors around 6–7 dBm, which match the typical shadowing standard deviation of RSSs in an indoor multi-floor building. However, linear interpolation of RSS might not always be suitable, and this is an open topic of research, which is enabled by our open-access dataset.
From Figure 8, it is clearer (than in the 3D power maps) that there is a small region where this AP is heard very strongly (i.e., above dBm) and that the measured RSSs at various space-time points are affected by both path losses and shadowing effects. A more thorough description of path losses and shadowing effects can be found for example in [19,29]. Furthermore, details about interpolation and extrapolation methods to recover missing points and gaps in the measurement data can be found for example in [28].
4.3. Benchmark Indoor Positioning Results
This section shows some benchmark positioning results obtained with our training and test datasets. The training data, as the name points out, were used in the initial training phase (e.g., to get information about the environment and build the fingerprint database), and the test data were used for estimating the mobile position in the 3D space. Fingerprinting position estimation consists of comparing a set of observed RSS values (here the RSSs in the test dataset) with the RSS entries in the training set. These comparisons rely on pattern matching methods, the most common one probably being the Nearest Neighbor (NN) algorithm.
As the coordinates of the test data are also known, we could check three types of statistics of our estimators:
- 2D mean error is the error between the estimated position and the true position when the estimate is at the same floor with the true position (incorrect floor estimates are ignored here).
- 3D mean error is the 3D estimation error between the estimated 3D position and the true 3D position.
- Floor detection rate is the percentage of the test points in which the floor was estimated correctly.
The benchmark results compare these statistics for the following algorithms:
- The weighted centroid algorithm described in [18]: This is one of the lowest complexity algorithms for estimating the indoor position, and it relies only on the estimated AP positions. The position estimate is the weighted centroid of the AP positions, where the weights are derived from the observed RSSs. The AP positions are, in their turn, estimated based on the training data.
- Clustering as described in [20]: This method is evaluated in two versions: on the one hand, the RSS clustering with affinity propagation and a modified log-Gaussian metric to match the RSS, and on the other hand, 3D coordinate clustering with the k-means method and the modified log-Gaussian metric. The final position, in both algorithms, is estimated by averaging over the three training positions that correspond to the three best matches.
- The UJI kNN algorithm, which is described in [21]: It is a deterministic rule based on the kNN algorithm, which includes a voting procedure to estimate the floor from the k-nearest fingerprints (or kNN-set) in the feature space. Fingerprints that do not belong to the estimated floor are removed from the kNN-set, and the final estimate is then computed as the geometric centroid of the remaining fingerprints. The algorithm considers different data representations and distance metrics to mimic the nature of radio propagation, avoid the usage of RSSI as unit-less values and consider the physical underpinning as suggested in [30].
- The RTLS@UM system at the EvAAL Competition, which is described in [31,32]: The team from University of Minho (UM), participated in the Evaluating Ambient Assisted Living (EvAAL) competition with their real time location system (RTLS). The proposed base algorithm introduced an iterative procedure to sequentially determine the building, floor and coordinates based on majority rules and kNN/wkNN. Although five slightly different alternatives were proposed, two of them have been tested in this paper according to the results provided in the competition. The proposed diversity devices filter was not applied in this database due to its marginal gain reported by the authors.
- Rank-Based Fingerprinting (RBF) is described in [33]. The RSS values measured at the operational stage are ranked according to their values, where the AP providing the strongest signal is ranked in the first position. Then, the reference ranks are generated by using the operational rank vector and the radio map. Finally, a rank comparison is performed using the Spearman’s footrule as suggested in [33]. The RSS values are replaced by the RSS ranks, since the ranks are invariant to bias and scaling.
- Coverage area-based algorithms rely on the knowledge of which ASs are heard. In their simplest form, they do not require information of the signal strengths. The idea of the pointwise-defined probabilistic coverage map is presented in [34]. The coverage areas defined as distributions were introduced in [35], and the algorithm is described in [36,37]. The location of the distribution-based coverage area is defined by the mean of the points where the AP is heard. The size and shape of the coverage area are defined by fitting the shape or covariance parameters of a probability distribution to these points. For example, Gaussian and Student distributions have an elliptical shape and can be used to define the coverage area.
Table 2 introduces the results of many different indoor positioning systems for the proposed database. The mean positioning errors (2D and 3D) are in the order of 8–10 m in the best cases, which is a range higher than in other works (about 3–6 m). The proposed database is challenging: the testing area is huge (a five-story building); the number of fingerprints per reference point is one; and only of the dataset is used for training (i.e., ≈0.03 fingerprints/m2). By swapping the training and validation sets, the mean positioning error is reduced to a more reasonable range. However, this database encourages the evaluation of IPS in an extreme situation, where the density of fingerprints is low and randomly scattered.
5. Discussion and Conclusions
This paper has introduced a new database for Wi-Fi-based indoor positioning. The database was collected by means of about eight volunteers and 21 different Android devices. The volunteers with the Android devices moved randomly at different parts of a five-floor university building and took measurements on four out of these five floors. Some additional software has also been provided to process and evaluate the RSS data.
Although other public databases also provide RSS samples at university buildings, the introduced one enriches the diversity of the public available databases by:
- Providing samples in a new environment where the AP deployment might highly differ from other available databases, e.g., the difference in the strategies in placing the APs, the hardware selected for APs, radiation regulations and policies about virtual APs, among many other features related to the APs.
- Providing samples in a new building where its geometry, building materials, structural elements and obstacles might highly differ from the buildings in other available databases.
- Providing samples in different conditions, e.g., density of people, and weather, among others.
- Providing samples in a building with a high number of APs (close to 1000 MAC addresses)
- Providing benchmark results with the available dataset.
Furthermore, this database has features that differ from other available datasets:
- Samples are collected at random positions and orientations decided by the user, i.e., no grid-based or pre-established mapping.
- Just one sample for reference point, instead of 10, or 100, as done in other previous works.
- Different devices were used to generate the database.
- Database division is more challenging than other available Wi-Fi datasets, by having only of samples for training/reference, compared to of samples for evaluation.
In general, we consider that this database will benefit the indoor positioning and indoor navigation community and will enable fair comparisons. Most of the current works are based on their own datasets, which have a limited vision of the problem since Wi-Fi fingerprinting relies on many parameters that cannot be controlled in the experiments: AP distribution, building features and user constraints. Significant advances might be done in this research field if many diverse databases, such as the one introduced in this paper, are available to perform comprehensive studies in many different scenarios.
Finally, providing the databases on personal or group websites is the easiest way to publish a database, but it requires maintenance, which often is not done, and continuity of the personal pages, which sometimes is missing. Many databases, for any topic, have been published on personal or group websites, and now, their links are completely broken, and access to the data is no longer available. Therefore, there is a necessity to publish the database in well-known public repositories, such as the chosen EU Zenodo repository, to ensure its long-term availability. However, finding the appropriate repository is a crucial step since the repositories hosting databases have their own policies to donate, publish and access the data. Thus, the repository has to be selected according to the data and project, research group policies and funding agencies’ requirements.
Acknowledgments
This work has been partially supported by the Academy of Finland, Project Number 303576. No specific funds to cover the costs to publish in open access were received. The authors would like to thank the anonymous students who contributed to the crowdsourced data collection and to the team of the following students who helped in building the Android application used in the data collection: Jukka-Pekka Venttola, Jeri Haapavuo, Kalle Immonen, Lauri Laaksonen, Matti Ylinevä and Marko Leppänen.
Author Contributions
E.S.L. and J.T.-S. conceived of the data format, converted the fingerprints into the final format, created some of the MATLAB scripts provided with the dataset and wrote the paper. H.L., P.R. and Z.P. helped in performing the experiments and analyzing the results and gave their inputs during the paper writing process. In addition, H.L. and P.R. created the other software scripts provided with the datasets. J.H. contributed to the results’ interpretation, analysis and presentation.
Conflicts of Interest
The authors declare no conflict of interest. The founding sponsors had no role in the design of the study; in the collection, analyses or interpretation of data; in the writing of the manuscript; nor in the decision to publish the results.
Abbreviations
The following abbreviations are used in this manuscript:
| AP | Access Point |
| EvAAL | Evaluating Ambient Assisted Living |
| FERET | Face Recognition Technology |
| IPS | Indoor Positioning System |
| UCI | University of California, Irvine |
| UJI | Universitat Jaume I |
| RTLS@UM | Real Time Location System at University of Minho |
| TUT | Technical University of Tampere |
| kNN | k-Nearest Neighbors |
| wkNN | weighted k-Nearest Neighbors |
| RSSI | Received Signal Strength Intensity |
References
- He, S.; Chan, S.H.G. Wi-Fi Fingerprint-Based Indoor Positioning: Recent Advances and Comparisons. IEEE Commun. Surv. Tutor. 2016, 18, 466–490. [Google Scholar] [CrossRef]
- Davidson, P.; Piché, R. A Survey of Selected Indoor Positioning Methods for Smartphones. IEEE Commun. Surv. Tutor. 2017, 19, 1347–1370. [Google Scholar] [CrossRef]
- Liu, Q.; Qiu, J.; Chen, Y. Research and development of indoor positioning. China Commun. 2016, 13, 67–79. [Google Scholar] [CrossRef]
- Zhuang, Y.; Syed, Z.; Li, Y.; El-Sheimy, N. Evaluation of Two WiFi Positioning Systems Based on Autonomous Crowdsourcing of Handheld Devices for Indoor Navigation. IEEE Trans. Mob. Comput. 2016, 15, 1982–1995. [Google Scholar] [CrossRef]
- Torres-Sospedra, J.; Montoliu, R.; Usó, A.M.; Avariento, J.P.; Arnau, T.J.; Benedito-Bordonau, M.; Huerta, J. UJIIndoorLoc: A new multi-building and multi-floor database for WLAN fingerprint-based indoor localization problems. In Proceedings of the 2014 International Conference on Indoor Positioning and Indoor Navigation, Busan, Korea, 27–30 October 2014; pp. 261–270. [Google Scholar]
- Bacciu, D.; Barsocchi, P.; Chessa, S.; Gallicchio, C.; Micheli, A. An experimental characterization of reservoir computing in ambient assisted living applications. Neural Comput. Appl. 2014, 24, 1451–1464. [Google Scholar] [CrossRef]
- Torres-Sospedra, J.; Montoliu, R.; Mendoza-Silva, G.M.; Belmonte, O.; Rambla, D.; Huerta, J. Providing Databases for Different Indoor Positioning Technologies: Pros and Cons of Magnetic Field and Wi-Fi Based Positioning. Mob. Inf. Syst. 2016, 2016, 6092618. [Google Scholar] [CrossRef]
- Montoliu, R.; Sansano, E.; Torres-Sospedra, J.; Belmonte, O. IndoorLoc Platform: A Public Repository for Comparing and Evaluating Indoor Positioning Systems. In Proceedings of the 2017 International Conference on Indoor Positioning and Indoor Navigation (IPIN), Sapporo, Japan, 18–21 September 2017. [Google Scholar]
- Torres-Sospedra, J.; Jiménez, A.R.; Knauth, S.; Moreira, A.; Beer, Y.; Fetzer, T.; Ta, V.C.; Montoliu, R.; Seco, F.; Mendoza-Silva, G.M.; et al. The Smartphone-Based Offline Indoor Location Competition at IPIN 2016: Analysis and Future Work. Sensors 2017, 17, 557. [Google Scholar] [CrossRef] [PubMed]
- Lohan, E.; Talvitie, J. TUT Datasets. Available online: http://www.cs.tut.fi/tlt/pos/Software.htm (accessed on 29 September 2017).
- King, T.; Kopf, S.; Haenselmann, T.; Lubberger, C.; Effelsberg, W. CRAWDAD Dataset Mannheim/Compass (v. 2008-04-11). Available online: http://crawdad.org/mannheim/compass/20080411/fingerprint (accessed on 29 September 2017).
- Nahrstedt, K.; Vu, L. CRAWDAD Dataset Uiuc/Uim (v. 2012-01-24). Available online: http://crawdad.org/uiuc/uim/20120124 (accessed on 29 September 2017).
- Parasuraman, R.; Caccamo, S.; Baberg, F.; Ogren, P. CRAWDAD Dataset Kth/Rss (v. 2016-01-05). Available online: http://crawdad.org/kth/rss/20160105 (accessed on 29 September 2017).
- Guillermo, A. AIDE Project WiFi Positioning Dataset. Available online: https://zenodo.org (accessed on 29 September 2017).
- Lohan, E.; Torres-Sospedra, J.; Richter, P.; Leppäkoski, H.; Huerta, J.; Cramariuc, A. Crowdsourced WiFi- fingerprinting Database and Benchmark Software for Indoor Positioning. Available online: https://zenodo.org/record/889798 (accessed on 29 September 2017).
- Torres-Sospedra, J.; Huerta, J. GEOTEC Datasets. Available online: http://indoorloc.uji.es/ (accessed on 29 September 2017).
- Torres-Sospedra, J.; Huerta, J. GEOTEC Datasets (mirror). Available online: http://www3.uji.es/~jtorres/databases.html (accessed on 29 September 2017).
- Razavi, A.; Valkama, M.; Lohan, E.S. K-Means Fingerprint Clustering for Low-Complexity Floor Estimation in Indoor Mobile Localization. In Proceedings of the 2015 IEEE Globecom Workshops (GC Wkshps), San Diego, CA, USA, 6–10 December 2015. [Google Scholar]
- Laitinen, E. Physical Layer Challenges and Solutions in Seamless Positioning via GNSS, Cellular and WLAN Systems. Ph.D. Thesis, Tampere University of Technology, Tampere, Finland, 2017. Available online: https://tutcris.tut.fi/portal/files/10471897/laitinen_1470.pdf (accessed on 29 September 2017).
- Cramariuc, A.; Huttunen, H.; Lohan, E.S. Clustering benefits in mobile-centric WiFi positioning in multi-floor buildings. In Proceedings of the 2016 International Conference on Localization and GNSS (ICL-GNSS), Barcelona, Spain, 28–30 June 2016. [Google Scholar]
- Torres-Sospedra, J.; Montoliu, R.; Trilles, S.; Óscar, B.; Huerta, J. Comprehensive analysis of distance and similarity measures for Wi-Fi fingerprinting indoor positioning systems. Expert Syst. Appl. 2015, 42, 9263–9278. [Google Scholar] [CrossRef]
- Lott, M.; Forkel, I. A multi-wall-and-floor model for indoor radio propagation. In Proceedings of the 53rd Vehicular Technology Conference, Rhodes, Greece, 6–9 May 2001. [Google Scholar]
- Shrestha, S.; Talvitie, J.; Lohan, E.S. Deconvolution-based indoor localization with WLAN signals and unknown access point locations. In Proceedings of the 2013 International Conference on Localization and GNSS (ICL-GNSS), Turin, Italy, 25–27 June 2013. [Google Scholar]
- Lohan, E.S.; Talvitie, J.; Granados, G.S. Data fusion approaches for WiFi fingerprinting. In Proceedings of the 2016 International Conference on Localization and GNSS (ICL-GNSS), Barcelona, Spain, 28–30 June 2016; pp. 1–6. [Google Scholar]
- Talvitie, J.; Renfors, M.; Lohan, E.S. Novel Indoor Positioning Mechanism Via Spectral Compression. IEEE Commun. Lett. 2016, 20, 352–355. [Google Scholar] [CrossRef]
- Talvitie, J.; Renfors, M.; Valkama, M.; Lohan, E.S. Method and Analysis of Spectrally Compressed Radio Images for Mobile-Centric Indoor Localization. IEEE Trans. Mob. Comput. 2017, PP, 1. [Google Scholar] [CrossRef]
- UJI. IndoorLoc Platform. Available online: http://indoorlocplatform.uji.es/ (accessed on 29 September 2017).
- Talvitie, J.; Renfors, M.; Lohan, E.S. Distance-Based Interpolation and Extrapolation Methods for RSS-Based Localization With Indoor Wireless Signals. IEEE Trans. Veh. Technol. 2015, 64, 1340–1353. [Google Scholar] [CrossRef]
- Shrestha, S.; Talvitie, J.; Lohan, E.S. On the fingerprints dynamics in WLAN indoor localization. In Proceedings of the 13th International Conference on ITS Telecommunications (ITST), Tampere, Finland, 5–7 November 2013; pp. 122–126. [Google Scholar]
- Dempster, A.G.; Li, B.; Quader, I. Errors in determinstic wireless fingerprinting systems for localisation. In Proceedings of the 3rd International Symposium on Wireless Pervasive Computing, Santorini, Greece, 7–9 May 2008; pp. 111–115. [Google Scholar]
- Moreira, A.; Nicolau, M.J.; Meneses, F.; Costa, A. Wi-Fi fingerprinting in the real world - RTLS@UM at the EvAAL competition. In Proceedings of the 2015 International Conference on Indoor Positioning and Indoor Navigation (IPIN), Calgary, AB, Canada, 13–16 October 2015. [Google Scholar]
- Torres-Sospedra, J.; Moreira, A.J.C.; Knauth, S.; Berkvens, R.; Montoliu, R.; Belmonte, O.; Trilles, S.; Nicolau, M.J.; Meneses, F.; Costa, A.; et al. A realistic evaluation of indoor positioning systems based on Wi-Fi fingerprinting: The 2015 EvAAL-ETRI competition. JAISE 2017, 9, 263–279. [Google Scholar] [CrossRef]
- Machaj, J.; Brida, P.; Piché, R. Rank based fingerprinting algorithm for indoor positioning. In Proceedings of the 2011 International Conference on Indoor Positioning and Indoor Navigation, Guimaraes, Portugal, 21–23 September 2011. [Google Scholar]
- Leppäkoski, H.; Tikkinen, S.; Takala, J. Optimizing radio map for WLAN fingerprinting. In Proceedings of the 2010 Ubiquitous Positioning Indoor Navigation and Location Based Service, Helsinki, Finland, 14–15 October 2010; pp. 1–8. [Google Scholar]
- Koski, L.; Piché, R.; Kaseva, V.; Ali-Löytty, S.; Hännikäinen, M. Positioning with coverage area estimates generated from location fingerprints. In Proceedings of the 7th Workshop on Positioning, Navigation and Communication, Dresden, Germany, 11–12 March 2010; pp. 99–106. [Google Scholar]
- Piché, R. Robust estimation of a reception region from location fingerprints. In Proceedings of the 2011 International Conference on Localization and GNSS (ICL-GNSS), Tampere, Finland, 29–30 June 2011; pp. 31–35. [Google Scholar]
- Raitoharju, M.; Dashti, M.; Ali-Löytty, S.; Piché, R. Positioning with Multilevel Coverage Area Models. In Proceedings of the 2012 International Conference on Indoor Positioning and Indoor Navigation (IPIN2012), Sydney, Australia, 13–15 November 2012. [Google Scholar]
Figure 1.
Five snapshots, in chronological order, of the interface of the Android application “TUT WiFi Positioning” used to collect the data. (a) initial position estimate; (b) aksing for estimation feedback; (c) selecting the correct floor; (d) selecting the correct location; and (e) notification of received feedback.
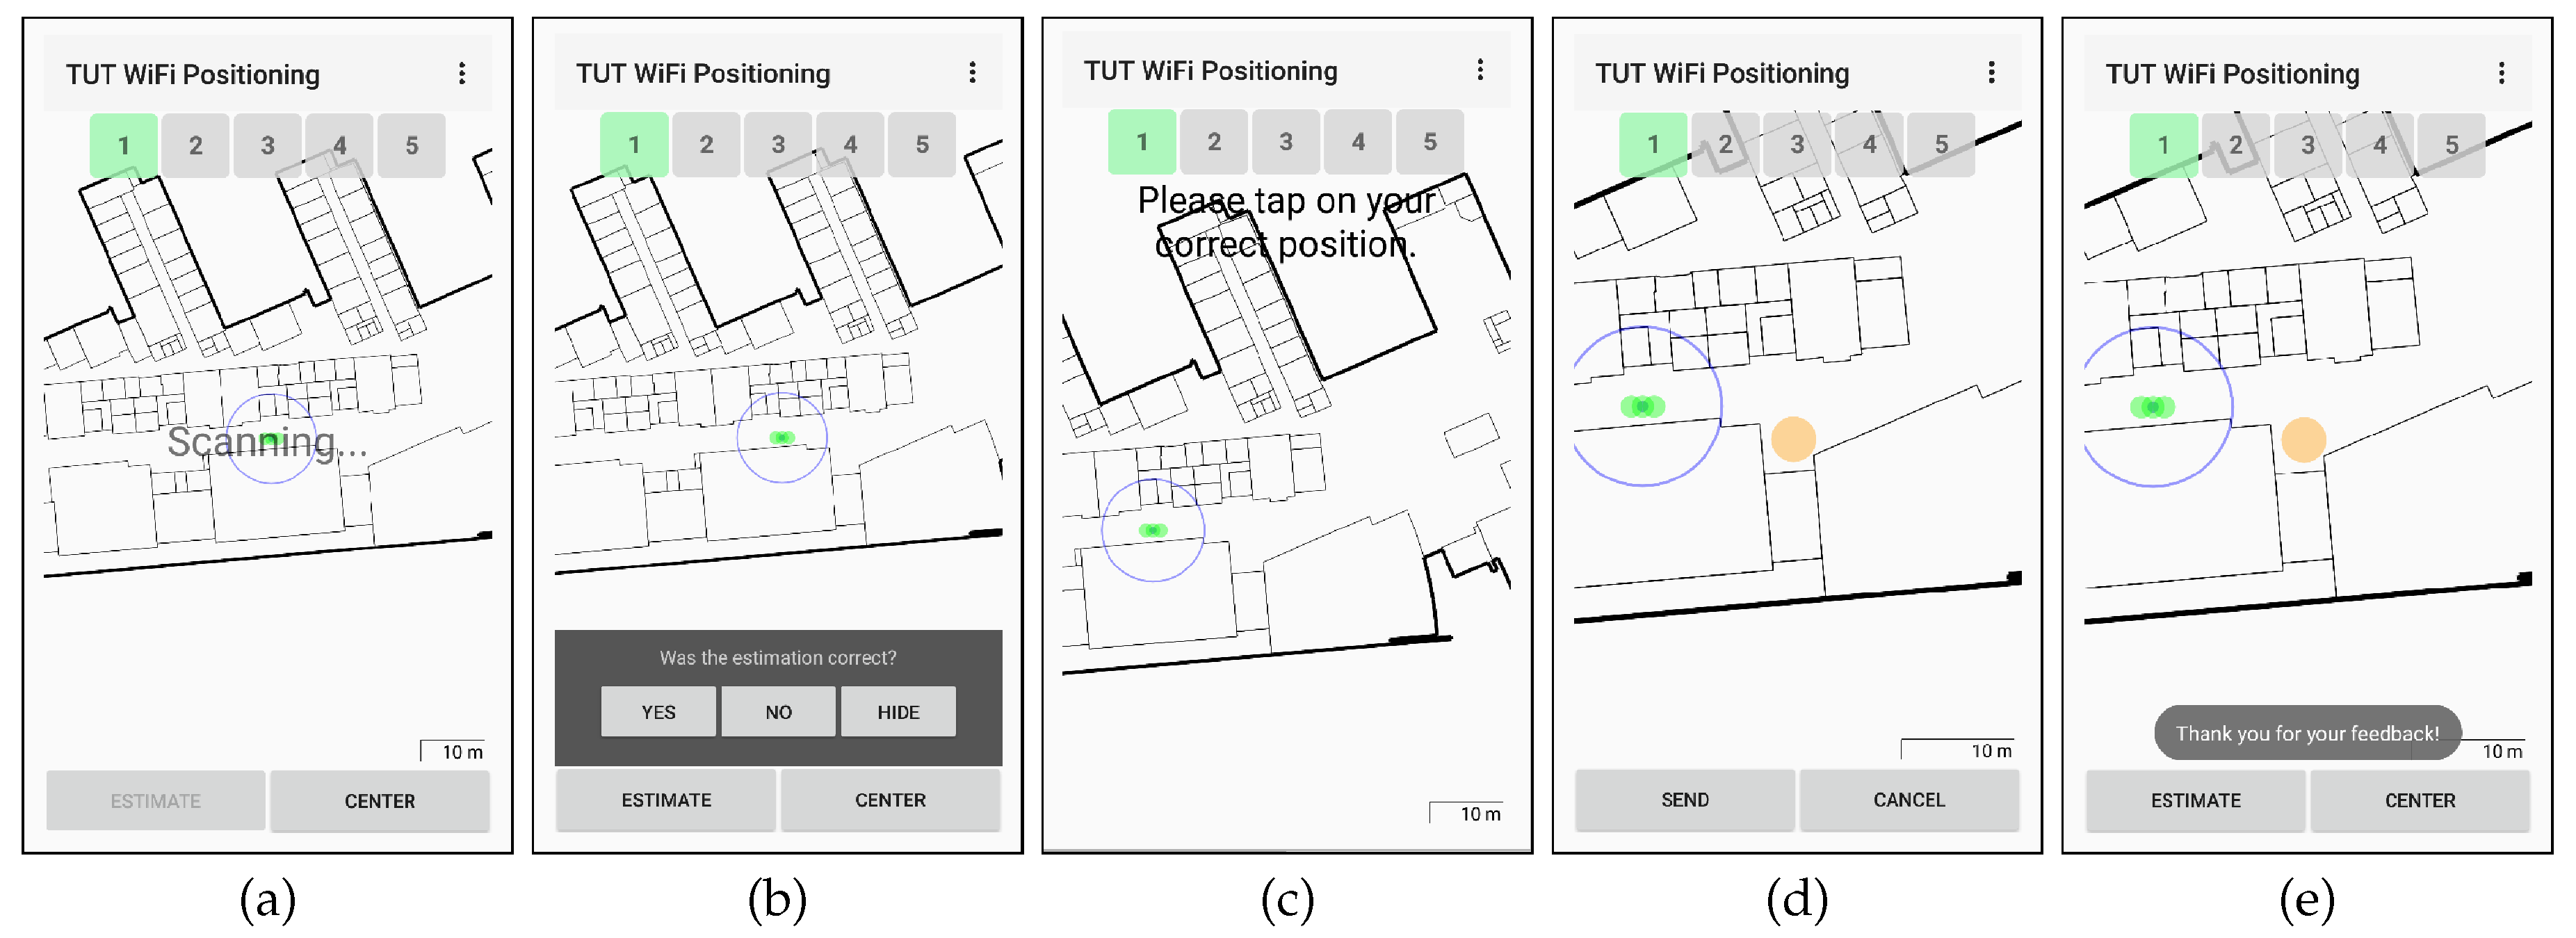
Figure 2.
Floor maps of the 6-floor university building in which the measurements were recorded over five floors.
Figure 2.
Floor maps of the 6-floor university building in which the measurements were recorded over five floors.
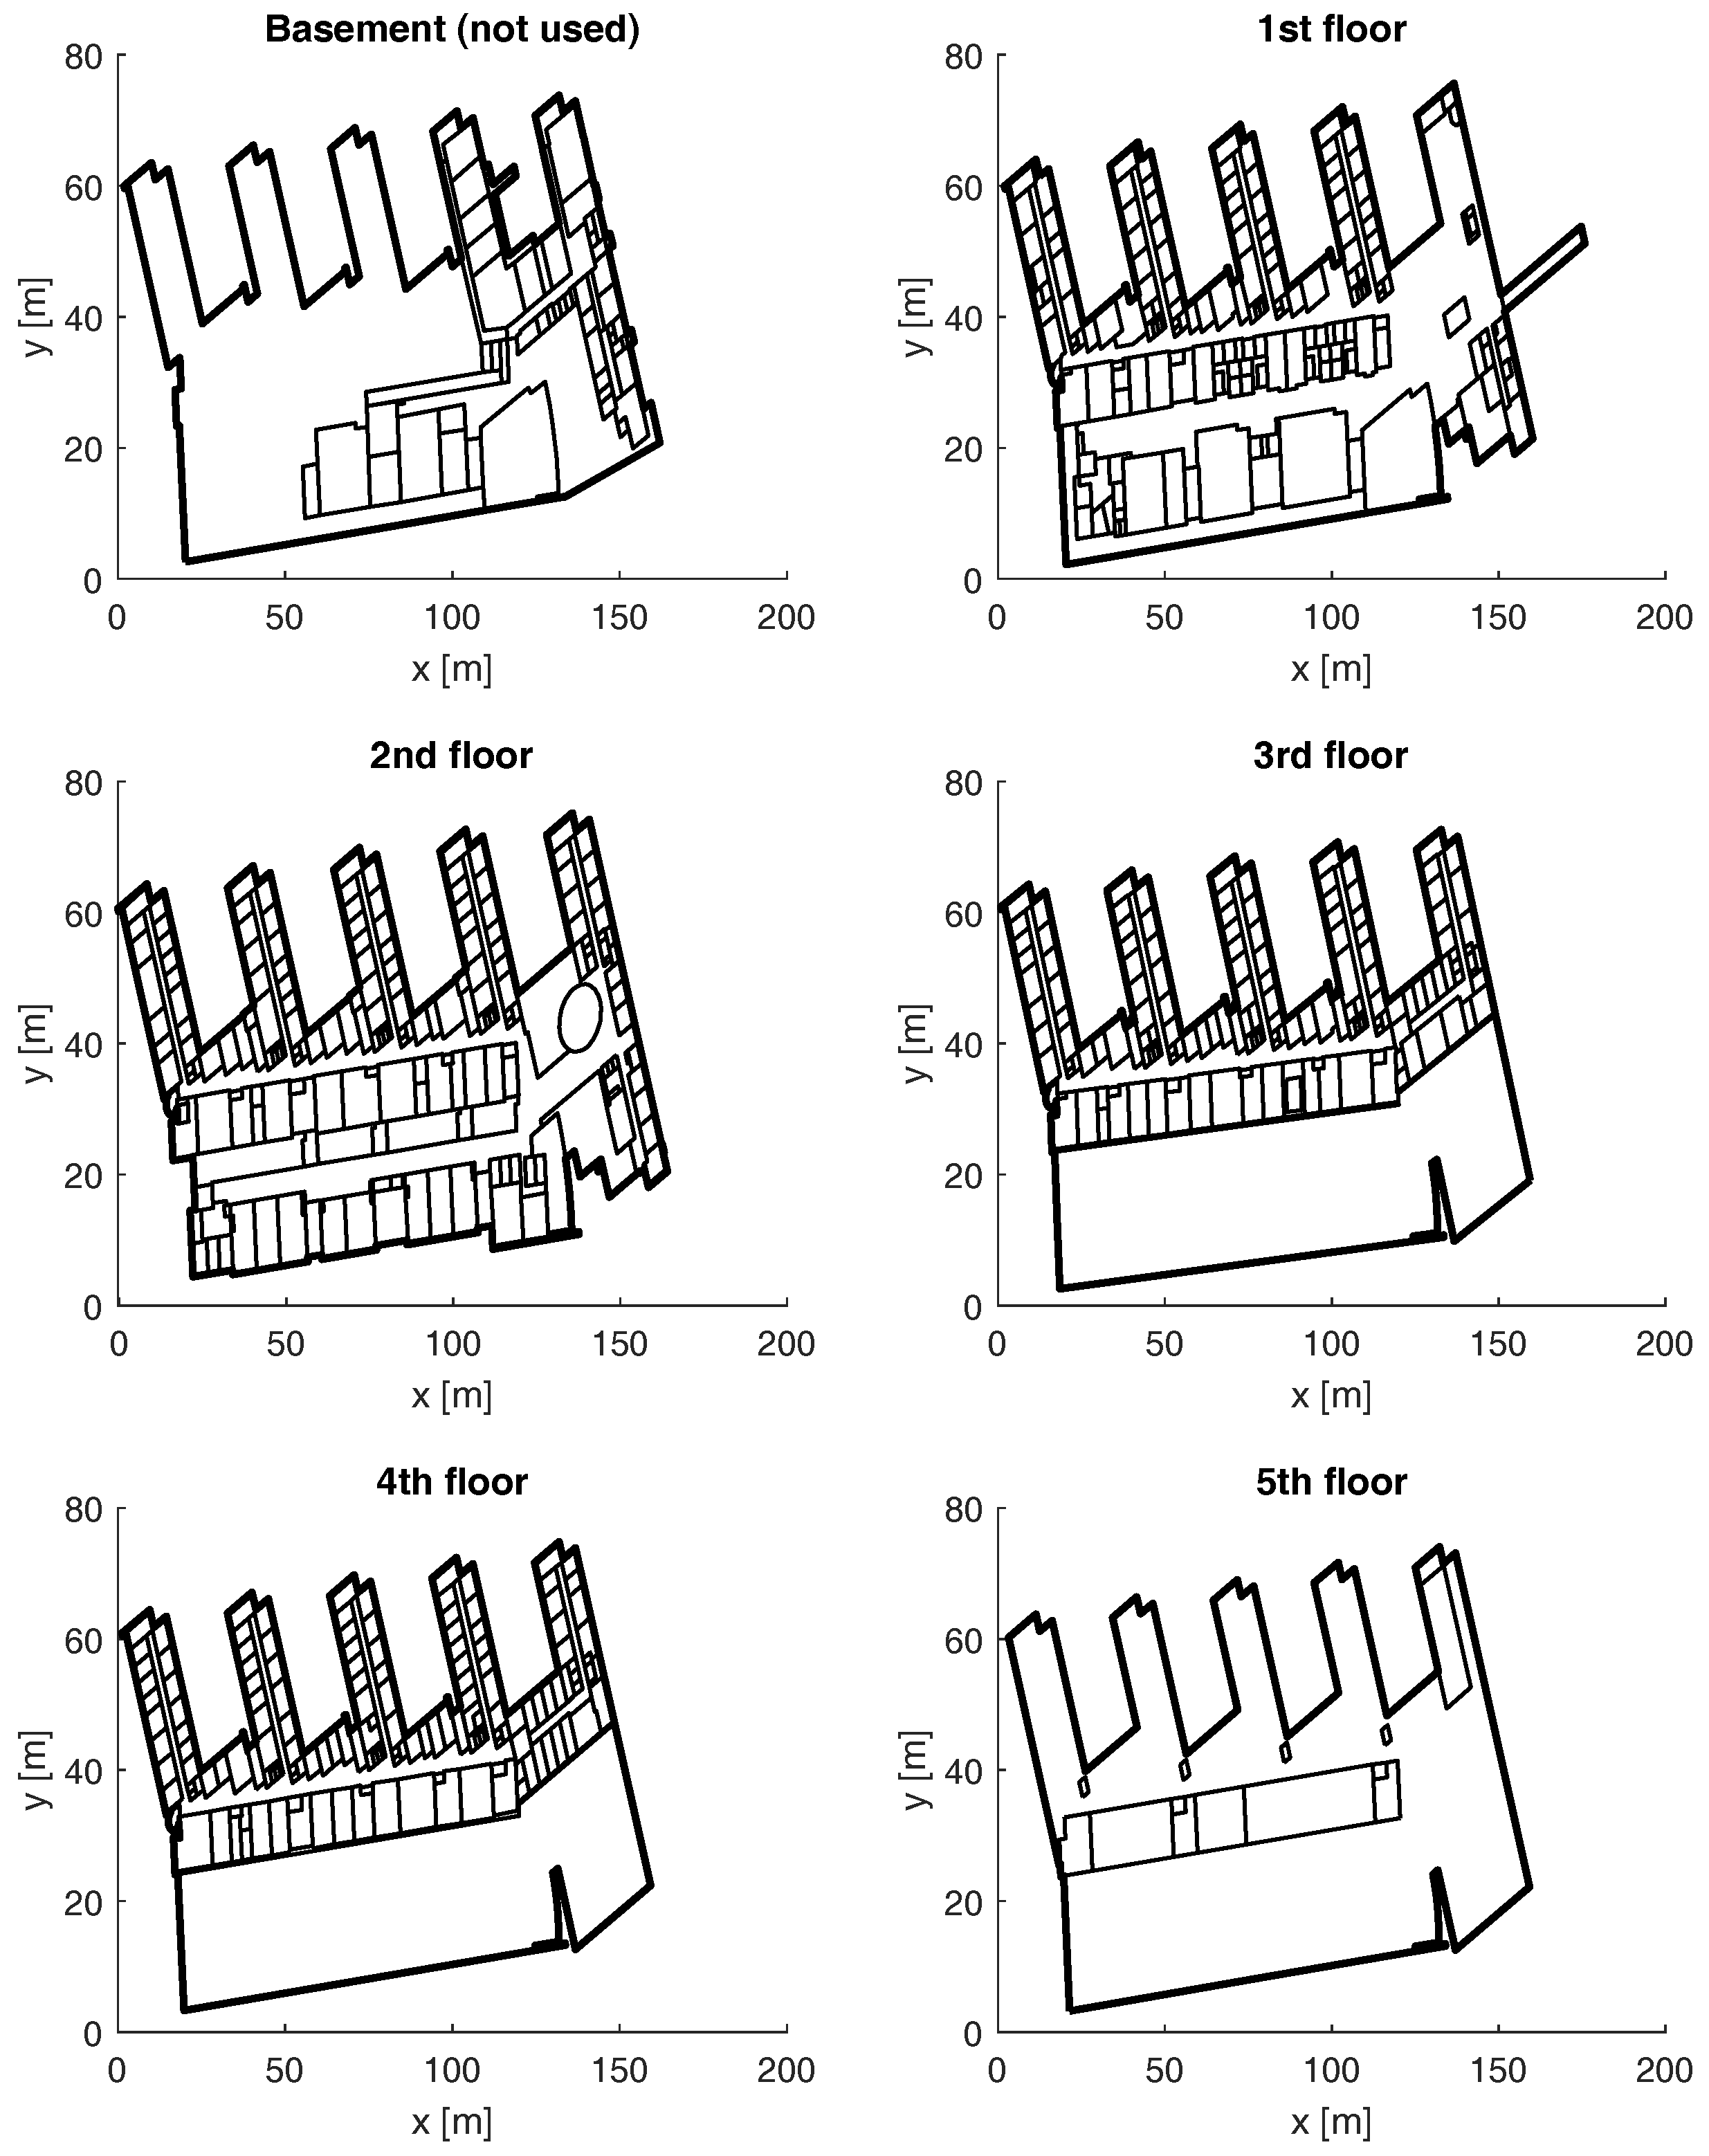
Figure 3.
Environment of the measurements: example images at different floors of the building. (a) Main hallway seen from the second floor; (b) corridor partitioned by glass on the 4th floor; (c) restaurant area on the first floor; (d) corridor connecting different office spaces on the 3rd floor.
Figure 3.
Environment of the measurements: example images at different floors of the building. (a) Main hallway seen from the second floor; (b) corridor partitioned by glass on the 4th floor; (c) restaurant area on the first floor; (d) corridor connecting different office spaces on the 3rd floor.
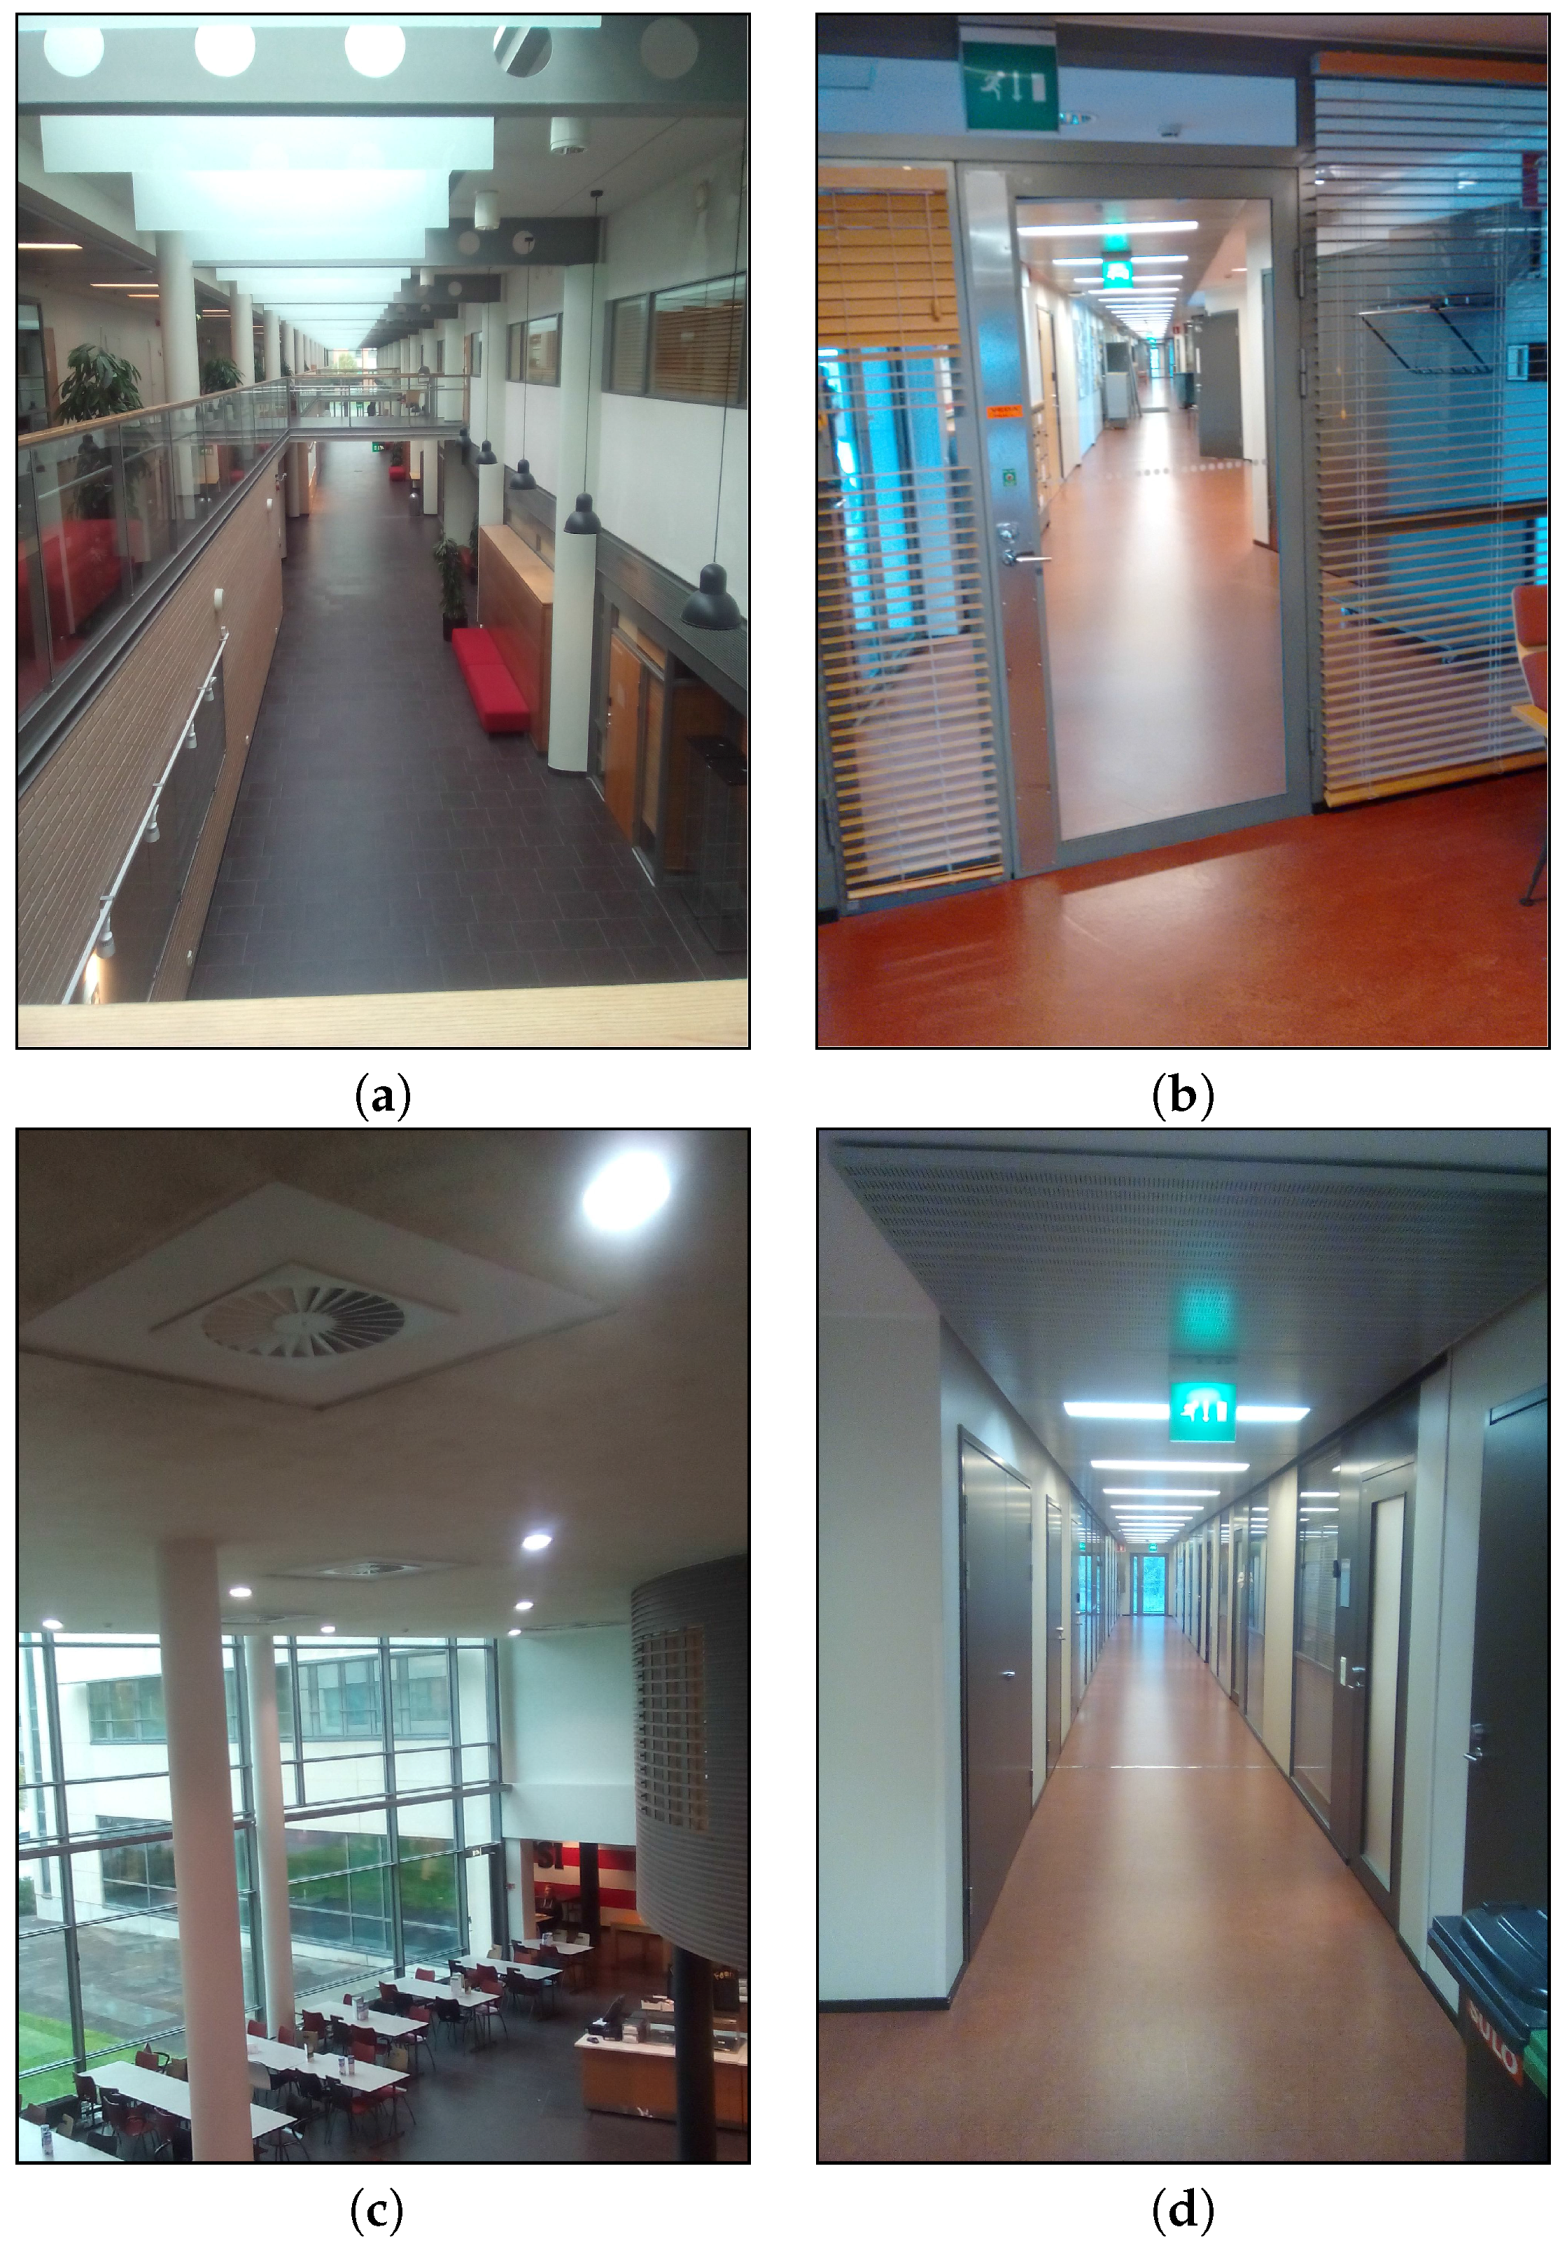
Figure 4.
Collected fingerprints. (a) 3D view, whole building; (b) 2D view, second floor.

Figure 5.
Number of measurements per floor (a) and per device type (b).

Figure 6.
Number of measurements per access point (or MAC address).
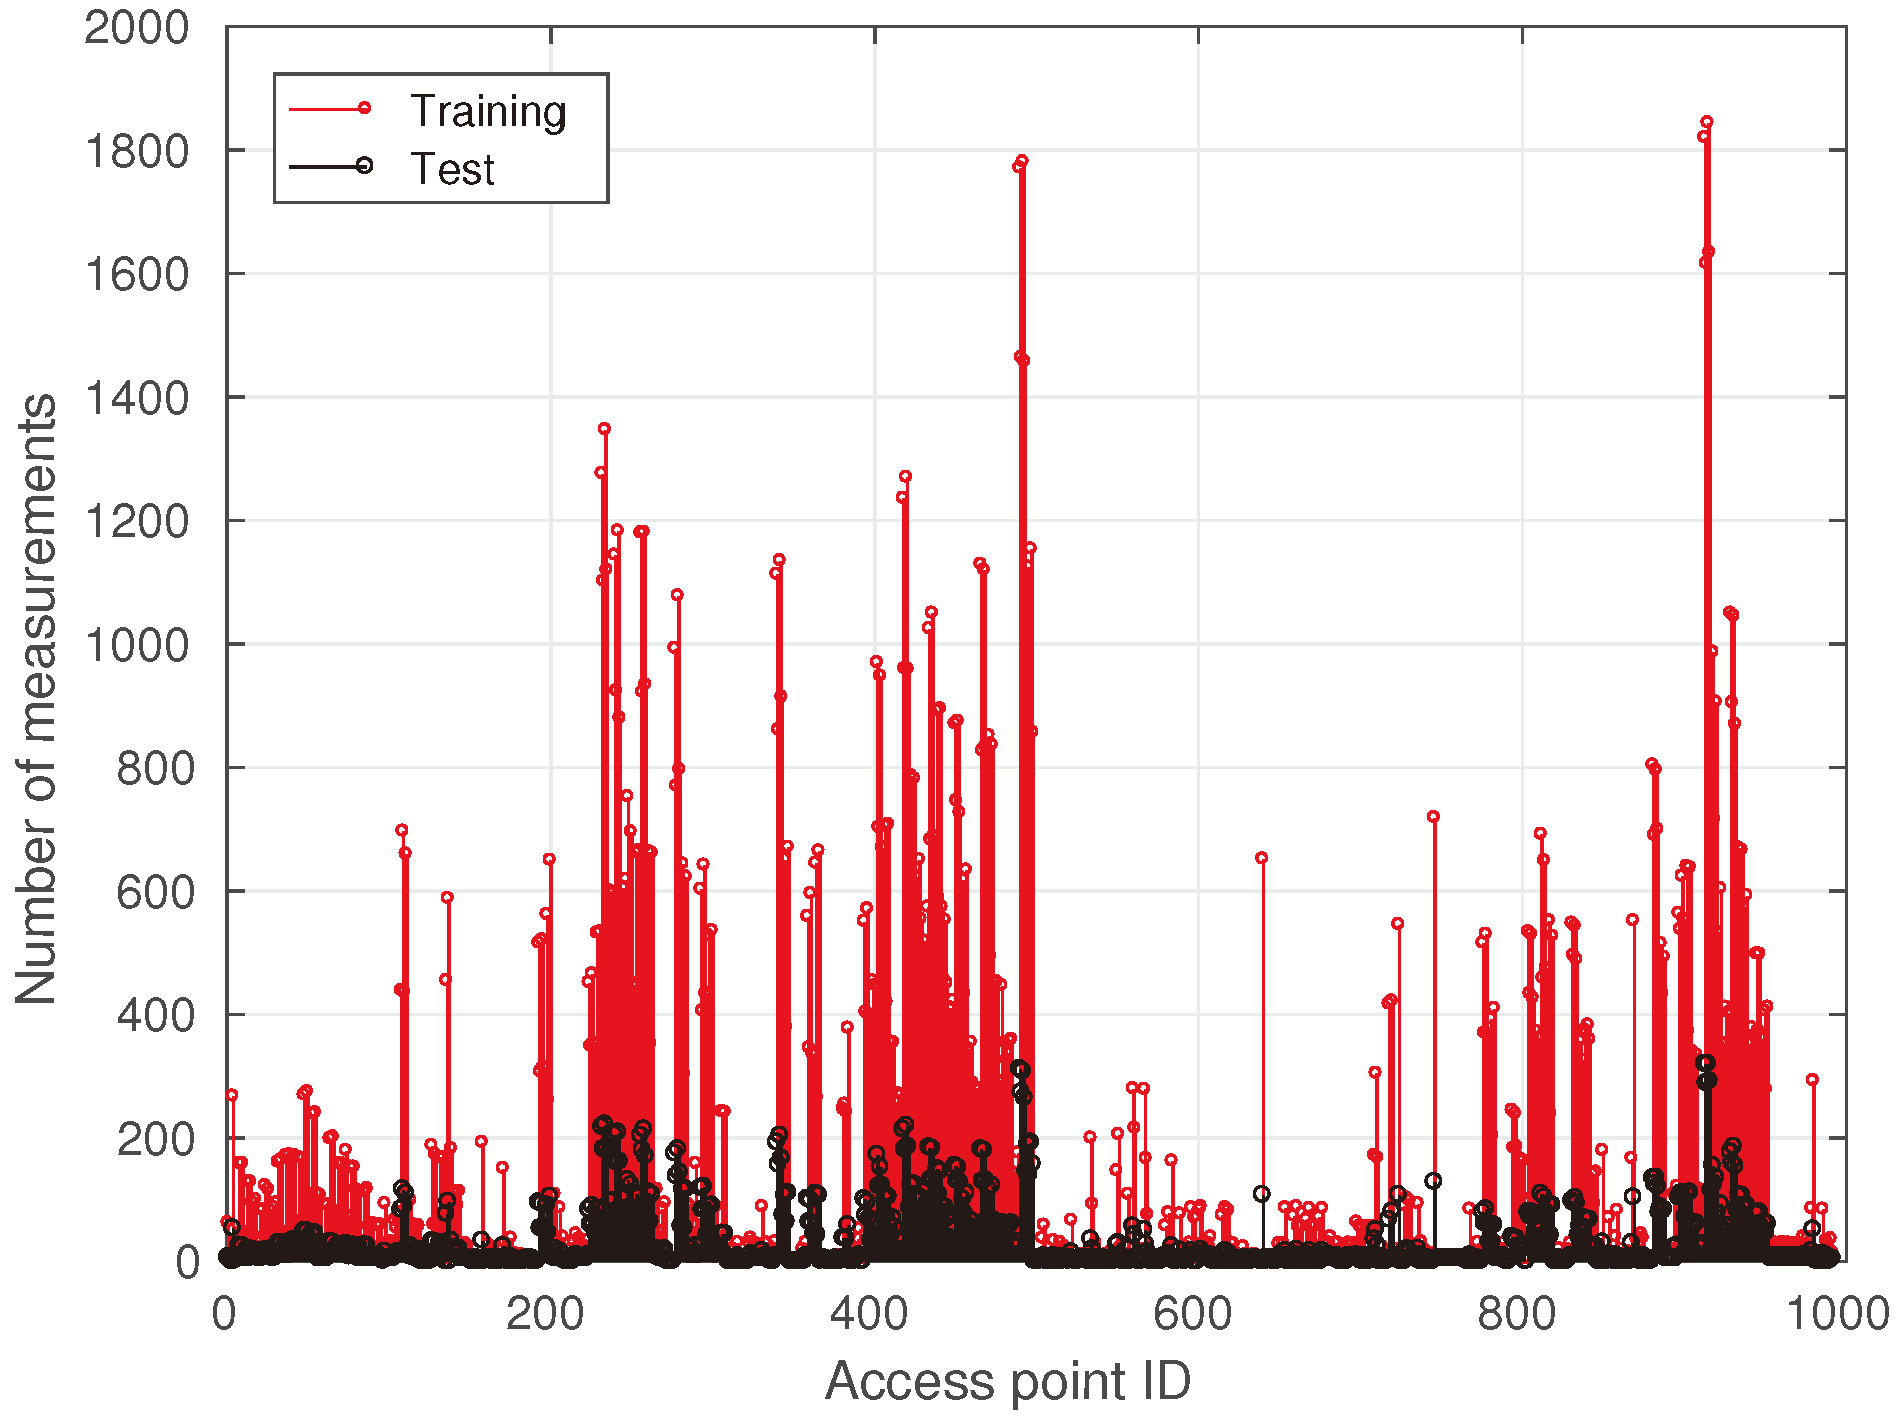
Figure 7.
Examples of the 3D (up) and 2D (down) scatter diagrams (non-interpolated power maps) of AP 492. (a) 3D training data; (b) 3D test data; (c) 2D training data; (d) 2D test data.
Figure 7.
Examples of the 3D (up) and 2D (down) scatter diagrams (non-interpolated power maps) of AP 492. (a) 3D training data; (b) 3D test data; (c) 2D training data; (d) 2D test data.

Figure 8.
Example of interpolated power maps for Access Point 492 at second floor. (a) Training data; (b) test data.
Figure 8.
Example of interpolated power maps for Access Point 492 at second floor. (a) Training data; (b) test data.


Table 1.
Other available indoor Wi-Fi datasets, their limitations and the added value of our paper (I).
Table 1.
Other available indoor Wi-Fi datasets, their limitations and the added value of our paper (I).
| Dataset | Repository | Refs. | Main Features and Limitations |
|---|---|---|---|
| UJIIndoorLoc | UCI | [5] | Database collected at 3 different buildings with 4 floors each. A total of more than 21,000 samples was collected by means of more than 20 devices and people. The database was used in the EvAAL ETRICompetition [32]. Approximately 900 reference points were covered. A comprehensive benchmarking was not provided, but only the results with a simple 1-NN algorithm. |
| Indoor User Movement Prediction from RSS Dataset | UCI | [6] | Real-life benchmark in the area of AAL applications. The binary classification introduced predicts the pattern of user movements in real-world environments. Data, as time-series, generated by a wireless sensor network. |
| Geotec database | Personal | [7] | RSS database collected at an office with just 1 device. It is complemented by a magnetic database. The covered area is not high (≈200 m). |
| IPIN2016 Tutorial | IndoorLoc | [8] | Crowd sourced RSSI database generated by 8 students attending the IPIN 2016 tutorial. Only a small corridor was covered (≈120 m). |
| Alcalá Tutorial | IndoorLoc | [8] | The tutorial took place at the same place as the IPIN 2016 Tutorial where many student collected RSSI samples. Although the database does not contain information about the user who collected the fingerprints, the students results are provided as benchmark. Furthermore, a few RSSI measures might be incorrectly labeled on purpose to test the robustness of IPS. |
| IPIN 2016 Competition | Personal | [9] | Off-site competition that took place at the IPIN 2016 Conference. The samples were collected in 4 buildings by multiple users and multiple devices (less than 10). The database was collected with a dynamic strategy while collecting data from other sensors. Data format is complex (log files), and a parser to read the log files was provided. No SWwas provided to test the accuracy of the database, but competition results were published. |
| IPIN 2017 Competition | Personal | Off-site competition that will take place at the IPIN 2017 Conference, where 3 buildings are covered and more reference data were provided to competitors. Strengths and limitations are similar as for the 2016 competition. | |
| TUTdatasets | TUT repo | [10] | Currently, 3 available small datasets collected with one device each. |
| The Mannheimfingerprinttrace set | Crawdad | [11] | Wi-Fi-based positioning system on the second floor of an office building on the campus of the University of Mannheim. Only 221 square meters were covered, and 13 additional APs were added for localization purposes. |
| uiuc/uimdataset | Crawdad | [12] | The database contains a Wi-Fi trace file collected by 28 people for analyzing human movement. This is not a database for indoor positioning, and traces only include timestamps and hashed detected APs (position is not registered). |
| kth/rssdataset | Crawdad | [13] | The database contains the RSS data collected with a mobile robot. The package does not include a description of stored data to easily re-use them. |
| AIDEprojectrestricted dataset | Not available | [14] | Wi-Fi data for indoor location.Currently restricted to AIDE project members. |
UCI: http://archive.ics.uci.edu/ml; Personal: http://indoorloc.uji.es/ & http://www3.uji.es/~jtorres/datasets.html; IndoorLoc: http://indoorlocplatform.uji.es/; CRAWDAD: http://crawdad.org; TUT repo: http://www.cs.tut.fi/tlt/pos/Software.htm.
Table 2.
Benchmark positioning results based on our dataset. RBF, Rank-Based Fingerprinting.
| Algorithm | Mean 2D Error (m) | Mean 3D Error (m) | Floor Detection (%) | Reference |
|---|---|---|---|---|
| Weighted centroid | [18] | |||
| Log-Gaussian probability () | [20,23] | |||
| Log-Gaussian probability () | [20,23] | |||
| RSS clustering (affinity propagation) | [20] | |||
| 3D clustering (k-means) | [20] | |||
| UJI kNN algorithm (data=positive, dist=sorensen, ,) | [21] | |||
| UJI kNN algorithm (data=exponential, dist=neyman, ,) | [21] | |||
| UJI kNN algorithm (data=powed, dist=sorensen, ,) | [21] | |||
| RTLS@UM () | [31,32] | |||
| RTLS@UM () | [31,32] | |||
| RBF (), | [33] | |||
| Coverage area, pointwise defined (probability of AP match = ) | [34] | |||
| Coverage area, distribution based (Gaussian distribution) | [36,37] |
© 2017 by the authors. Licensee MDPI, Basel, Switzerland. This article is an open access article distributed under the terms and conditions of the Creative Commons Attribution (CC BY) license (http://creativecommons.org/licenses/by/4.0/).
Share and Cite
MDPI and ACS Style
Lohan, E.S.; Torres-Sospedra, J.; Leppäkoski, H.; Richter, P.; Peng, Z.; Huerta, J. Wi-Fi Crowdsourced Fingerprinting Dataset for Indoor Positioning. Data 2017, 2, 32. https://doi.org/10.3390/data2040032
AMA Style
Lohan ES, Torres-Sospedra J, Leppäkoski H, Richter P, Peng Z, Huerta J. Wi-Fi Crowdsourced Fingerprinting Dataset for Indoor Positioning. Data. 2017; 2(4):32. https://doi.org/10.3390/data2040032
Chicago/Turabian StyleLohan, Elena Simona, Joaquín Torres-Sospedra, Helena Leppäkoski, Philipp Richter, Zhe Peng, and Joaquín Huerta. 2017. "Wi-Fi Crowdsourced Fingerprinting Dataset for Indoor Positioning" Data 2, no. 4: 32. https://doi.org/10.3390/data2040032