1. Introduction
Primary rum, known in Cuba as Aguardiente, is a colorless liquid that is aged in barrels of white oak wood during a timed period in order to transform and improve its sensorial characteristics. The ageing process (maturation) results in changes of the Aguardiente: a light amber color appears; taste softens; and a pleasant aroma is produced [
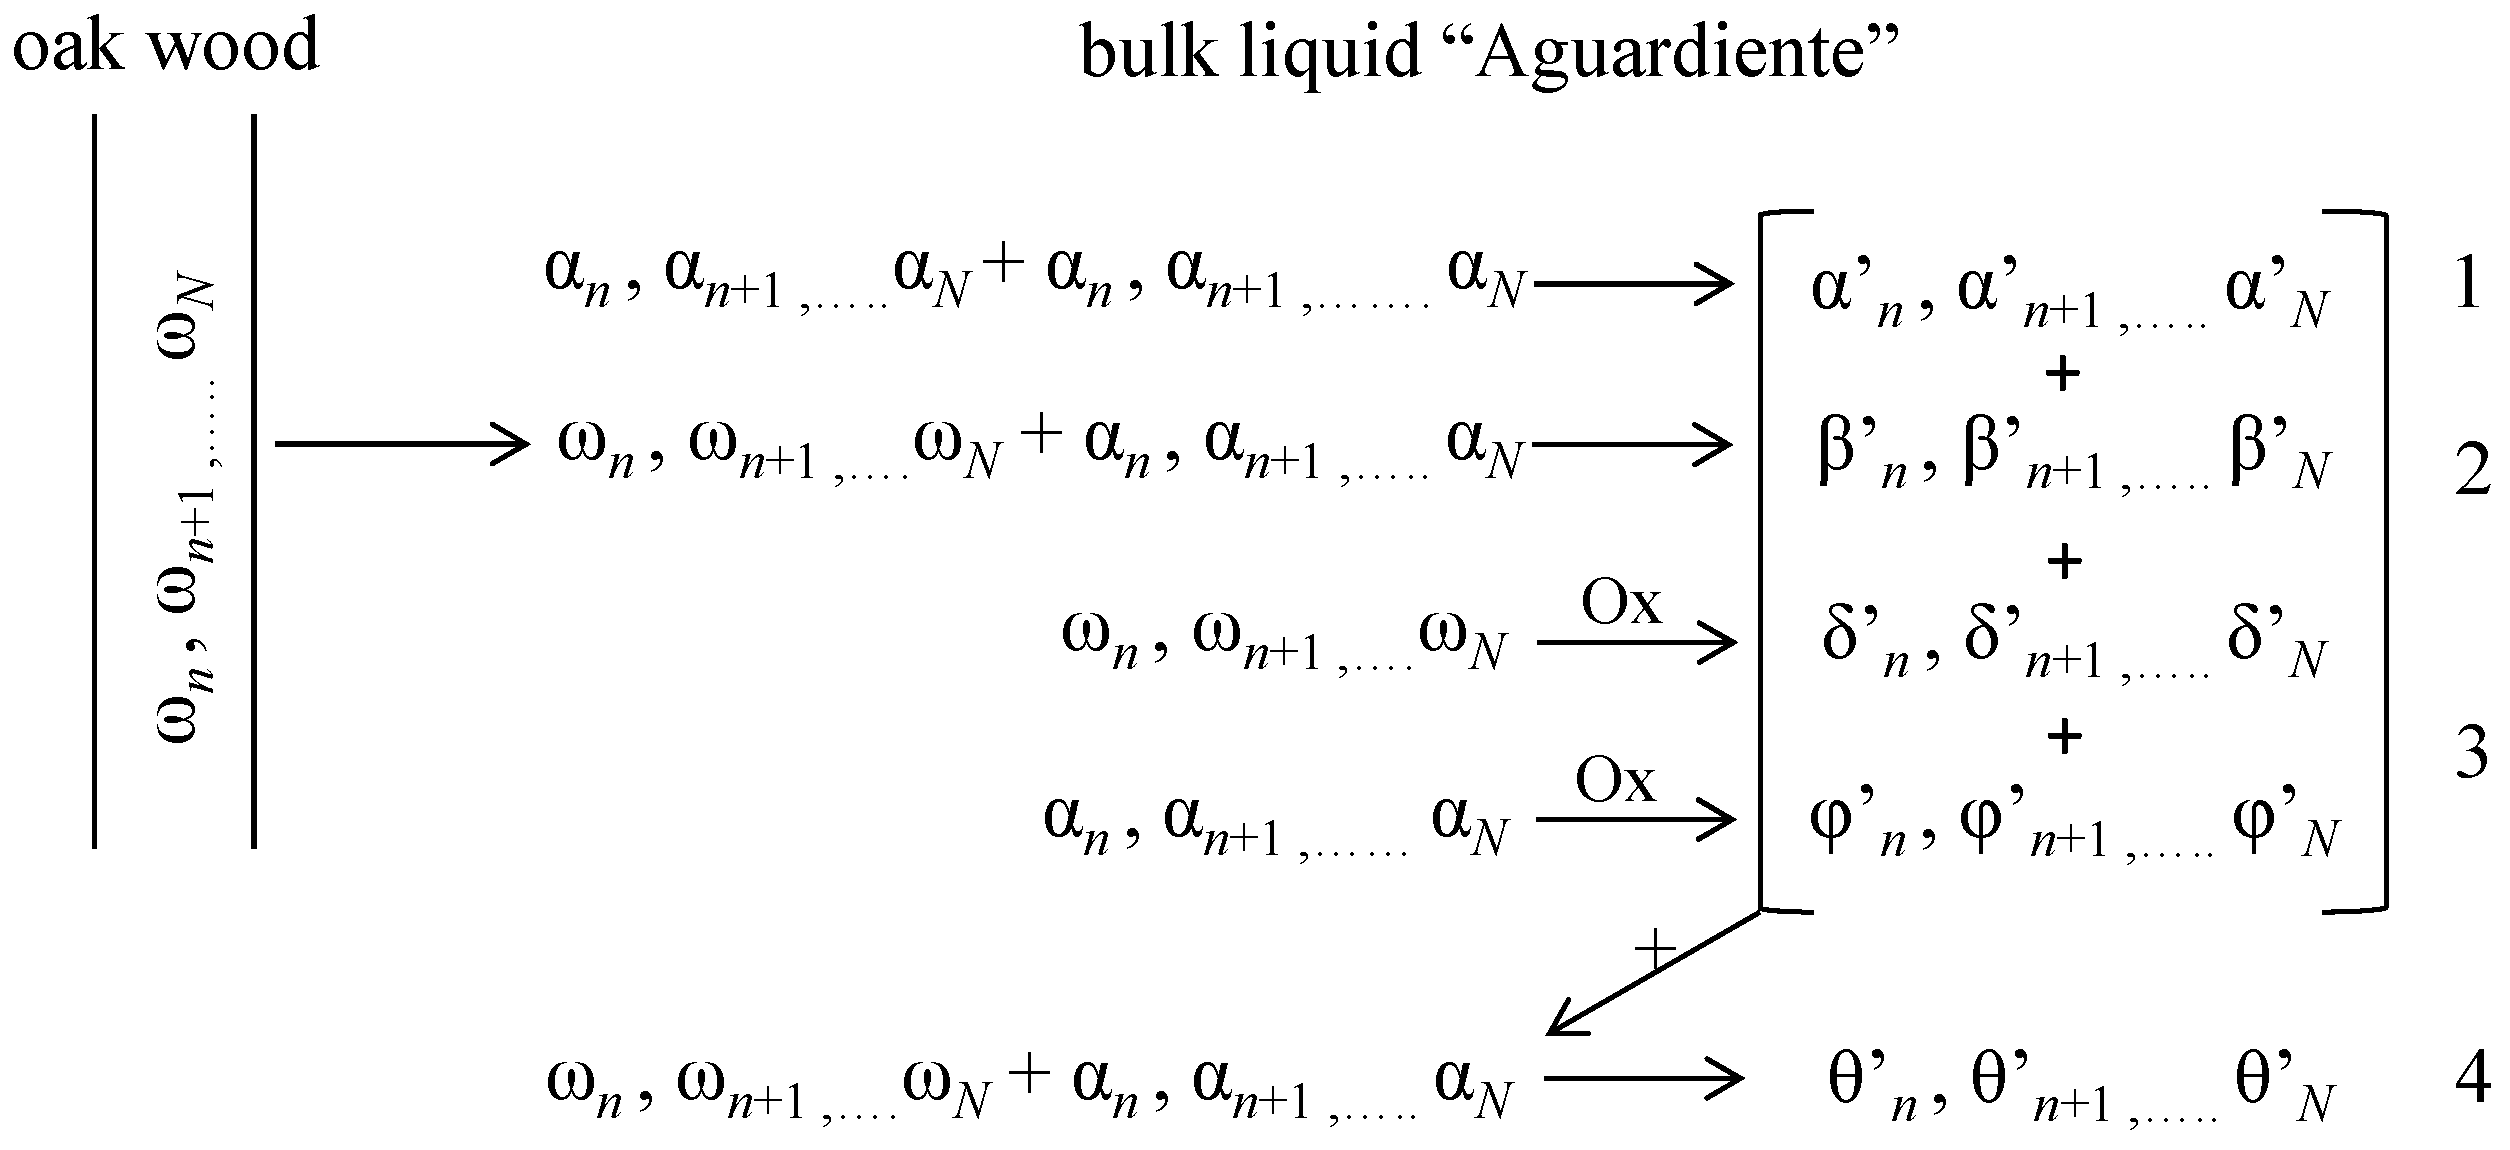
1]. During this stage, these sensorial changes are obtained by complex chemical reactions, which can be summarized in four simultaneous general steps (
Figure 1) [
1,
2,
3,
4]:
However, apart from this general scheme, taking into account the amount of compounds “
n” in each phase and other collateral reactions, an enormous number of possible reaction mechanisms and products can be found. Chemically speaking, the study of the ageing process is really complicated. Rums are a complex mixture of organic substances: 186 organic compounds have been identified [
5,
6,
7,
8,
9,
10,
11]. Additionally, research to understand the sensorial characteristics of rums based on the composition of white oak wood has been performed. The problem is complicated because volatile and non-volatile compounds from the wood have also important contributions. Non-volatile compounds are precursors improving rum’s flavor. Volatile compounds contribute to rum’s aroma [
12,
13,
14,
15].
Table 1 presents the basic composition of white oak wood [
1,
16].
The hemicellulose is constituted by polymers of monosaccharides, mainly represented by pentoses and polyuronics. The last can be easily extracted from the wood and hydrolyzed to pentoses (arabinose, xylose) and hexoses (fructose, glucose and galactose), which improve the flavor of the rum, giving its sweetness [
17]. Extractable compounds are important contributors in the organoleptic features of rums, giving aged rum the typical amber color and odor of oak wood.
Extractable compounds present in rum include: wood resins, fatty acids, terpenes, carbohydrates, polyhydric alcohols, nitrogenized compounds (wood amino-acids and proteins), phenolic compounds and inorganic constituents. The effect of the white oak wood proteins and amino acids on rum taste and color has been studied. In the ageing process, amino acids lose the amino group, which is substituted by a carbonyl group. During the ageing, the pyrocatechol and pyrogallol intensify the dis-amination of the amino acids [
1,
2,
5,
8,
13,
14,
15,
18,
19,
20,
21,
22,
23,
24]. The color increment in aged Cuban rum has been studied and its linear correlation with the ageing time in months presented [
1]. In the ageing process, the total acidity increases, and a close relationship between the improvement of the rum quality and its acidity exists. Oak wood is an important source of non-volatile acids that contributes to the total acidity in rums and other aged beverages [
1,
25].
Activated carbon (AC) adsorption is the most common technique for removing various pollutants due to its extended and specific surface area, high pore volume and well-developed porous structure [
26,
27]. AC can be powdered or granular (0.2–5 mm). Granular activated carbon (GAC) is widely employed for product purification (such as sugar refining, food processing and water treatment) [
28]. In the spirits and liquor production industry, GAC is used to remove organic compounds that affect the sensorial quality of the final product [
1,
28,
29]. When GAC is exhausted, it is replaced and landfilled. However, the landfilled GAC creates a solid waste problem. For this reason, a regeneration process should be considered, and the effectiveness of GAC regeneration must be guaranteed. The AC reactivation process involves an important amount of energy and could be time consuming. The economics of this practice is highly dependent on the characteristics of the regenerated carbon and to any mass losses during the process [
30]. In order to save energy and GAC amounts, as well as increase its efficient use, a detailed assessment of the real exhaustion level of the carbon has to be done before the GAC regeneration process is considered. For determining the exhaustion level of GAC, proper and fast analytical techniques based on the determination of specific surface area and porosity have to be applied [
31,
32]. However, sometimes, the technological facilities of rum producers are limited and need the process to be done quickly. Therefore, an economical way to measure the exhaustion level of GAC is needed.
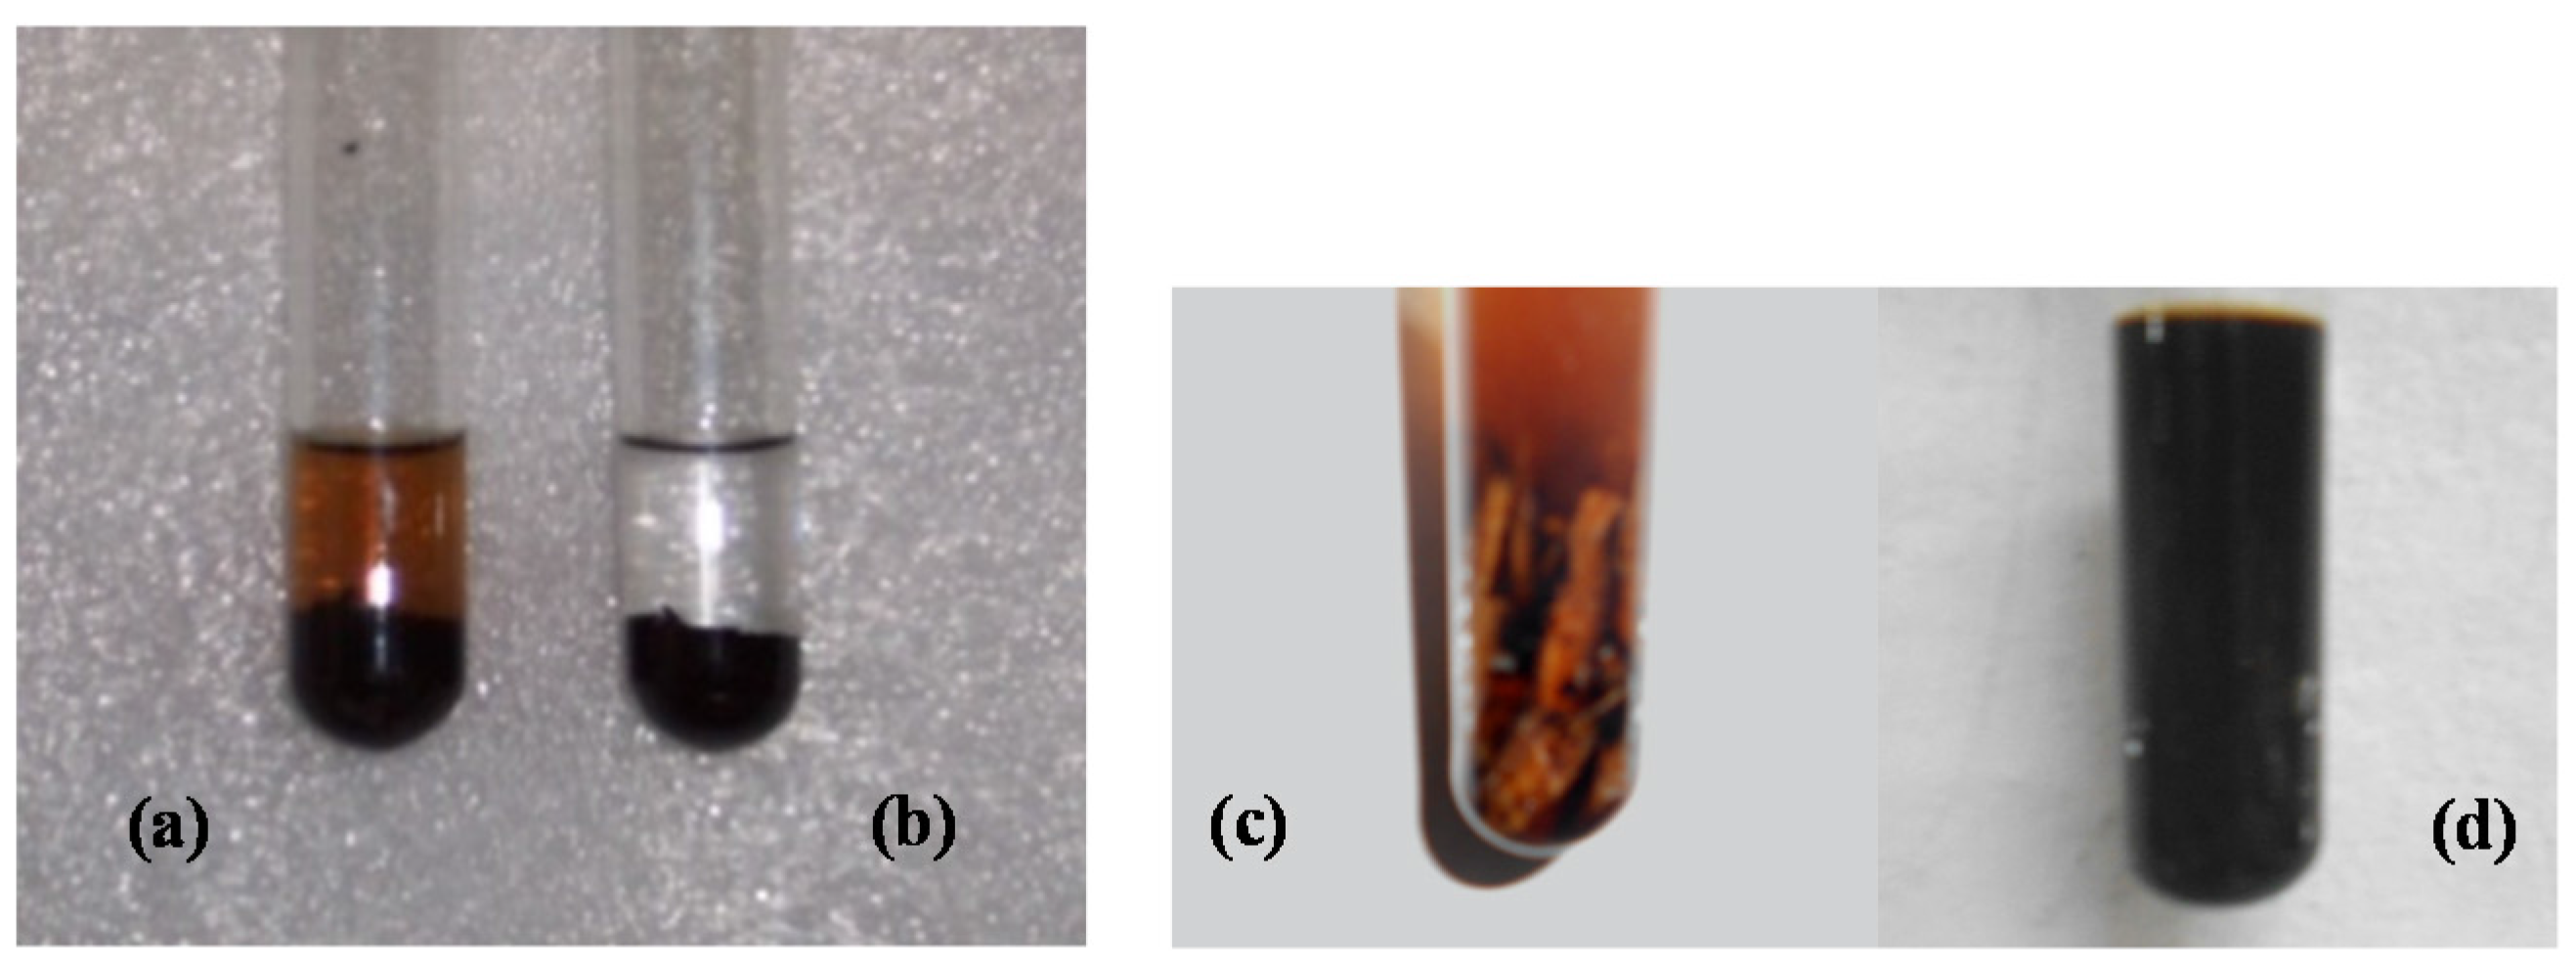
When the GAC has been used in rum production (specifically for refining aged Aguardiente), it was found that a reaction between the exhausted GAC and an ammonia solution (in a wide concentration range) resulted in an almost instantaneously amber color appearing (
Figure 2). The more exhausted the GAC is, the darker the produced amber color. If the GAC has not been used in aged Aguardiente treatment, the reaction does not occur.
Additionally, from our pre-studies, the same reaction feature occurred between chips of white oak wood and ammonia solution. The amber color appeared much darker than the amber color obtained with GAC (
Figure 2c).
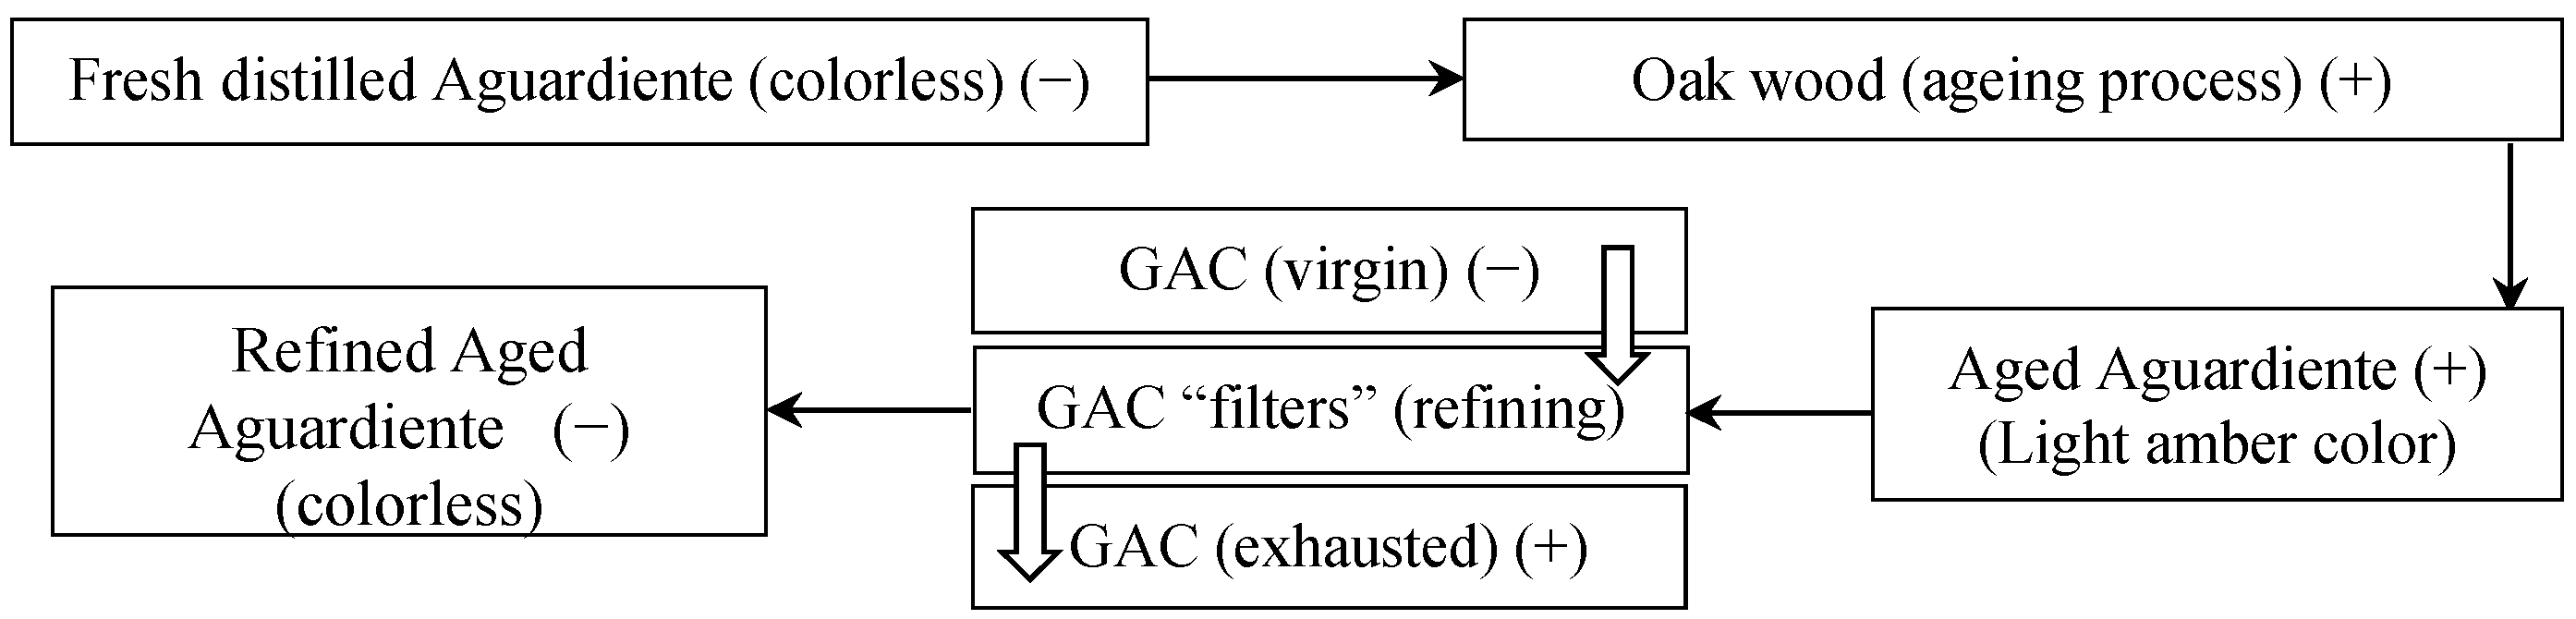
The compounds present in the white oak wood are responsible for the amber color in the rum. The compounds are adsorbed onto GAC during rum production. The exhausted GAC reacts with the ammonia solution, releasing the amber-colored compounds, as is shown in
Figure 2a. According to
Figure 3, the reaction with ammonia occurs when the white oak is introduced in the scenario of rum production. The compounds responsible for coloring the ammonia solution are coming from the wood fibers as extractable compounds. The concentration of these substances in the wood is high enough to obtain a very intense dark amber color by reacting with ammonia (
Figure 2d).
When the Aguardiente is aged, the colored extractable compounds are present in the liquid [
1,
2,
5,
8,
13,
14,
15,
18,
19,
20,
21,
22,
23,
24] (Step 2 in
Figure 1), but its concentration is so low in comparison with the oak wood that the reaction produces just a pale amber color. However, in the Aguardiente refining process, GAC adsorbs these color compounds among other substances [
1,
28,
29].
Our study was conducted to develop an in-depth specific, reliable, robust and fast colorimetric method to analyze the exhausted level of different GAC samples used in the rum production process. A quick qualitative pre-evaluation of the exhausted degree can be performed based on an on-sight color intensity evaluation by a simple extraction test of used GAC with ammonia.
3. Results and Discussion
3.1. Samples Characterization
Table 2 displays the iodine number and contact pH of the samples. Five experiments were performed, and statistical parameters were determined for each sample. According to their exhausting level, the samples can be ordered as follows: GAC-1 > GAC-2 > GAC-3 > GAC-4 > GAC-5. GAC-1 is the virgin sample. Based on the iodine number, GAC-5 is the most exhausted. The pH trend was consistent with the obtained order by the iodine number and the N
2 adsorption/desorption results presented in
Table 3. This indicates that the lower the iodine number, the more acidic the GAC. Iodine number and the measured pH correlated with the adsorption capacity of the GAC: the more exhausted the GAC, the lower the pH value. According to other researchers [
1,
26], the acidity increases during the ageing process in rum production. After filtering the Aguardiente through the GAC, adsorption of a variety of acids occurs. The longer the GAC is used in the rum production process, the higher the adsorbed concentration of these acid compounds onto the GAC is (beside the adsorption of other compounds) and, thus, the more acidic these GAC become.
A linear correlation (
R2 = 0.99) is obtained by plotting the iodine number vs. the pH (
Table 2). The reduction of the adsorption capacity involves an increment of adsorbed compounds onto GAC particles (including extractable and formed acids during the ageing process (Steps 2–4,
Figure 1) [
1,
2,
5,
8,
13,
14,
15,
18,
19,
20,
21,
22,
23,
24]. It can be concluded that the iodine number and the contact pH can be equally used to determine the exhaustion level of GACs, once the value of the initial GAC is known.
The iodine number and contact pH value are in line with the porous characteristics and the surface area of these GAC using the N
2 adsorption/desorption technique as found in
Table 3.
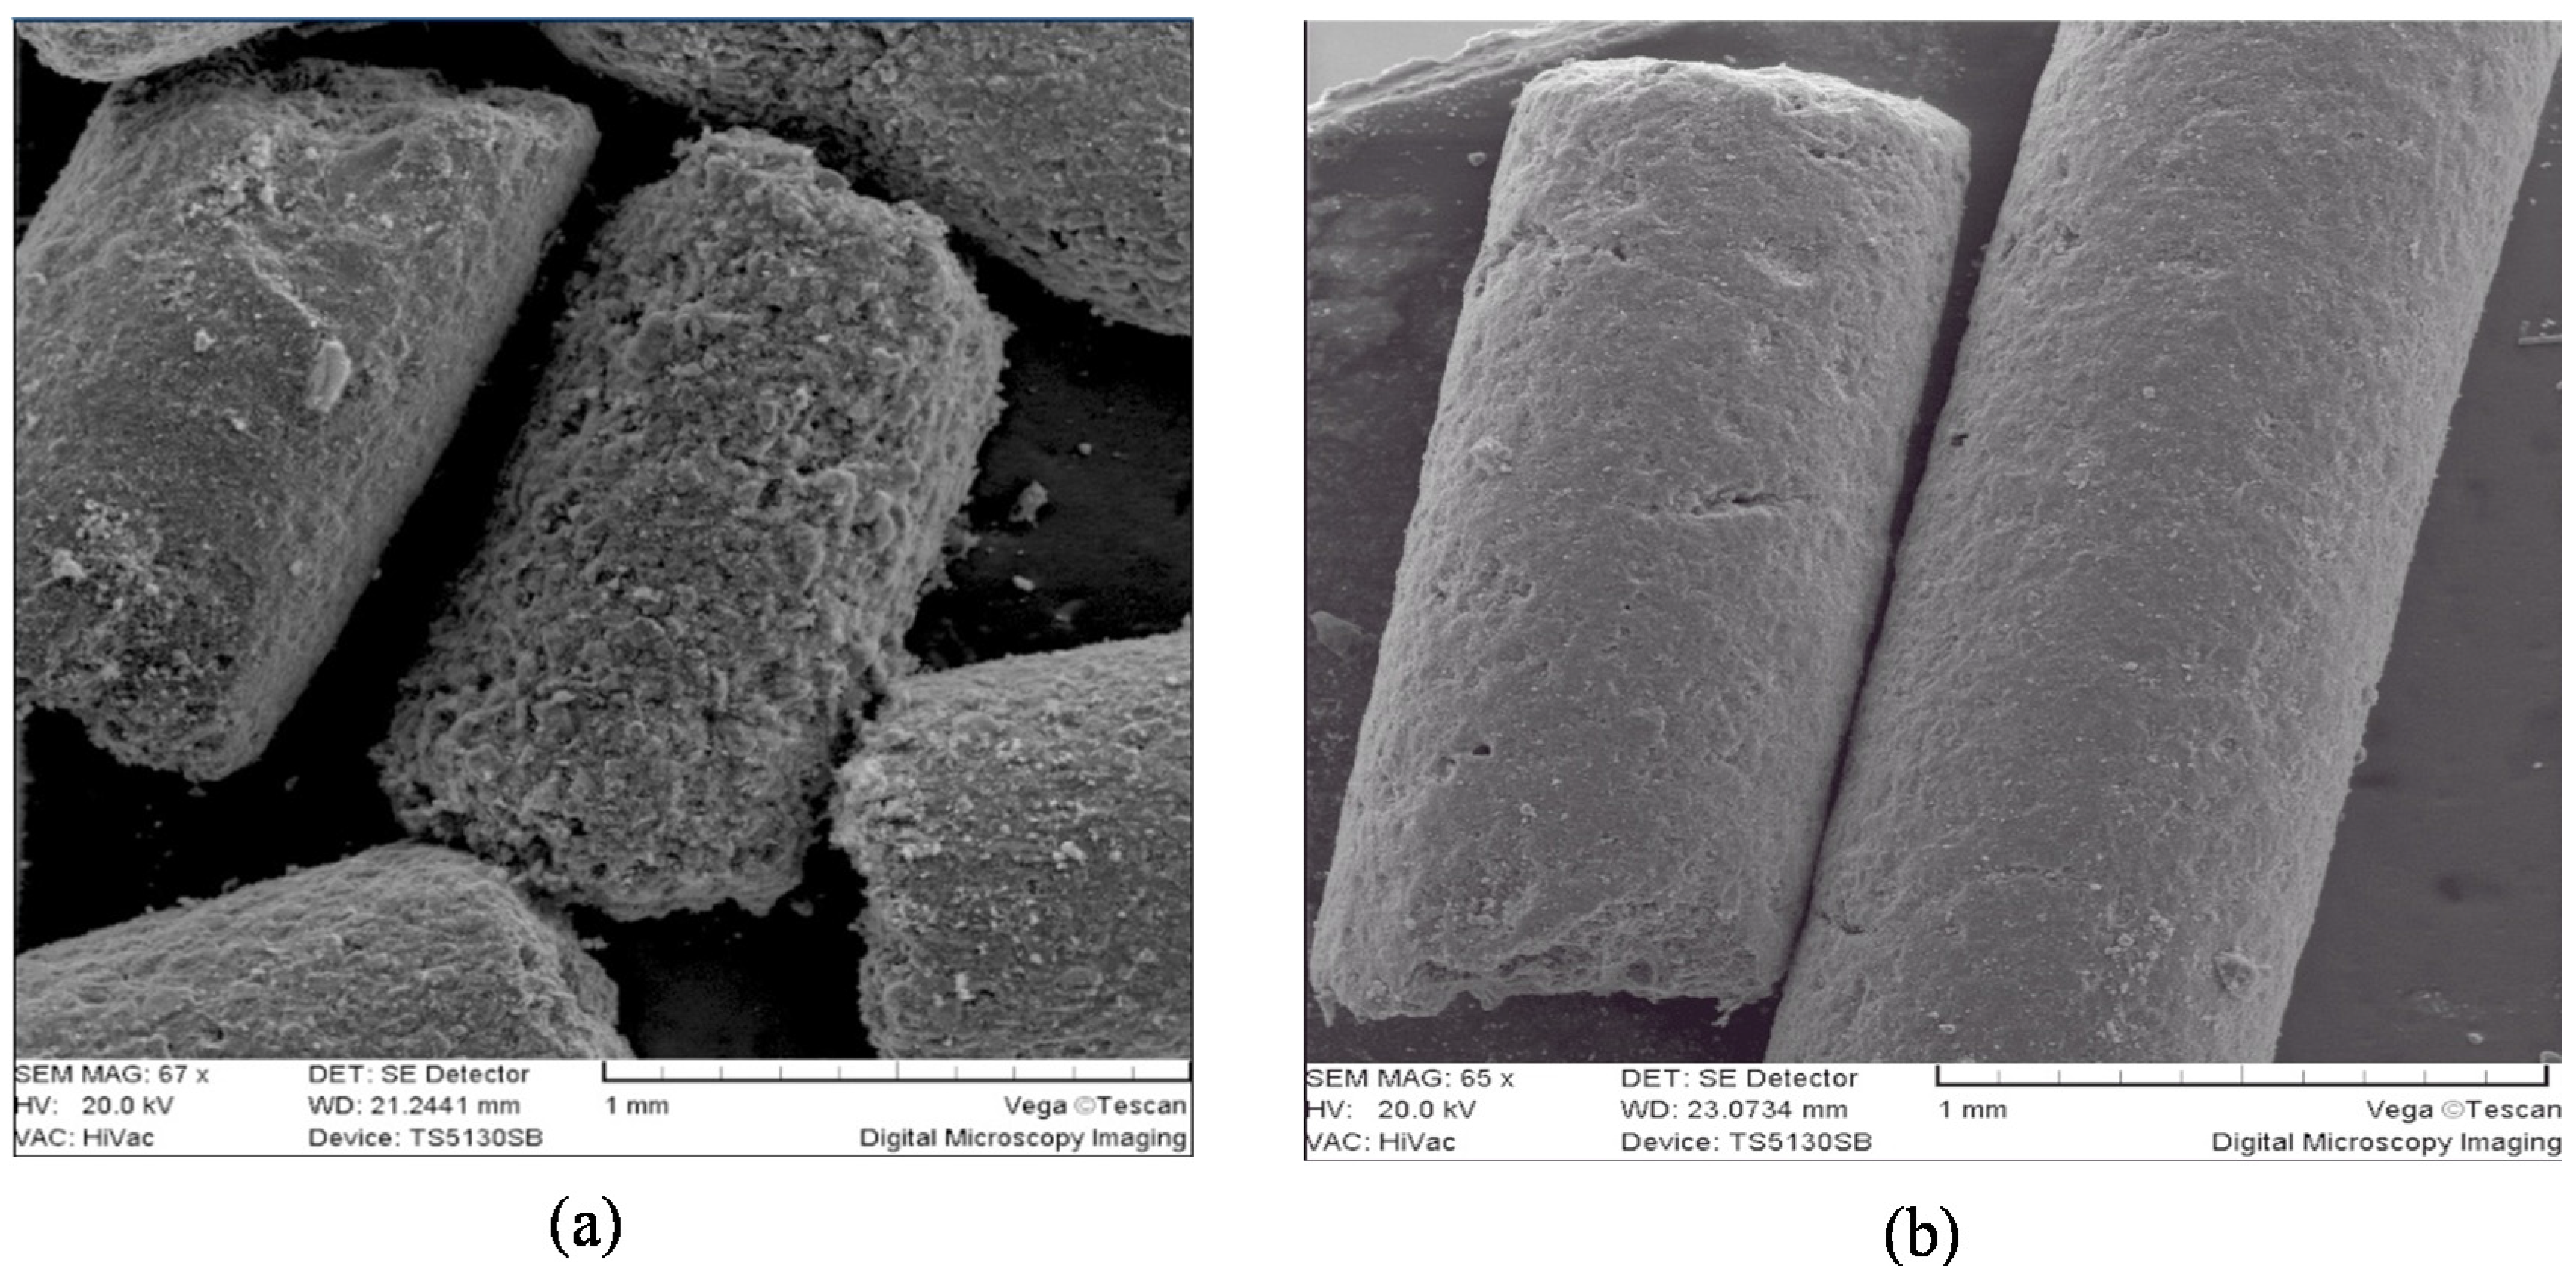
Figure 5 displays SEM images of GAC samples: “virgin” (a) and “most exhausted” (b) before and after use in a rum production process. Differences can be seen in the external surface of the GAC particle. “Virgin” GAC (GAC-1 (a)) shows more roughness in its surface in comparison to “exhausted” GAC (GAC-5 (b)).
The diminished external roughness of the used GAC in the rum production process can be associated with increased amounts of adsorbed organic compounds.
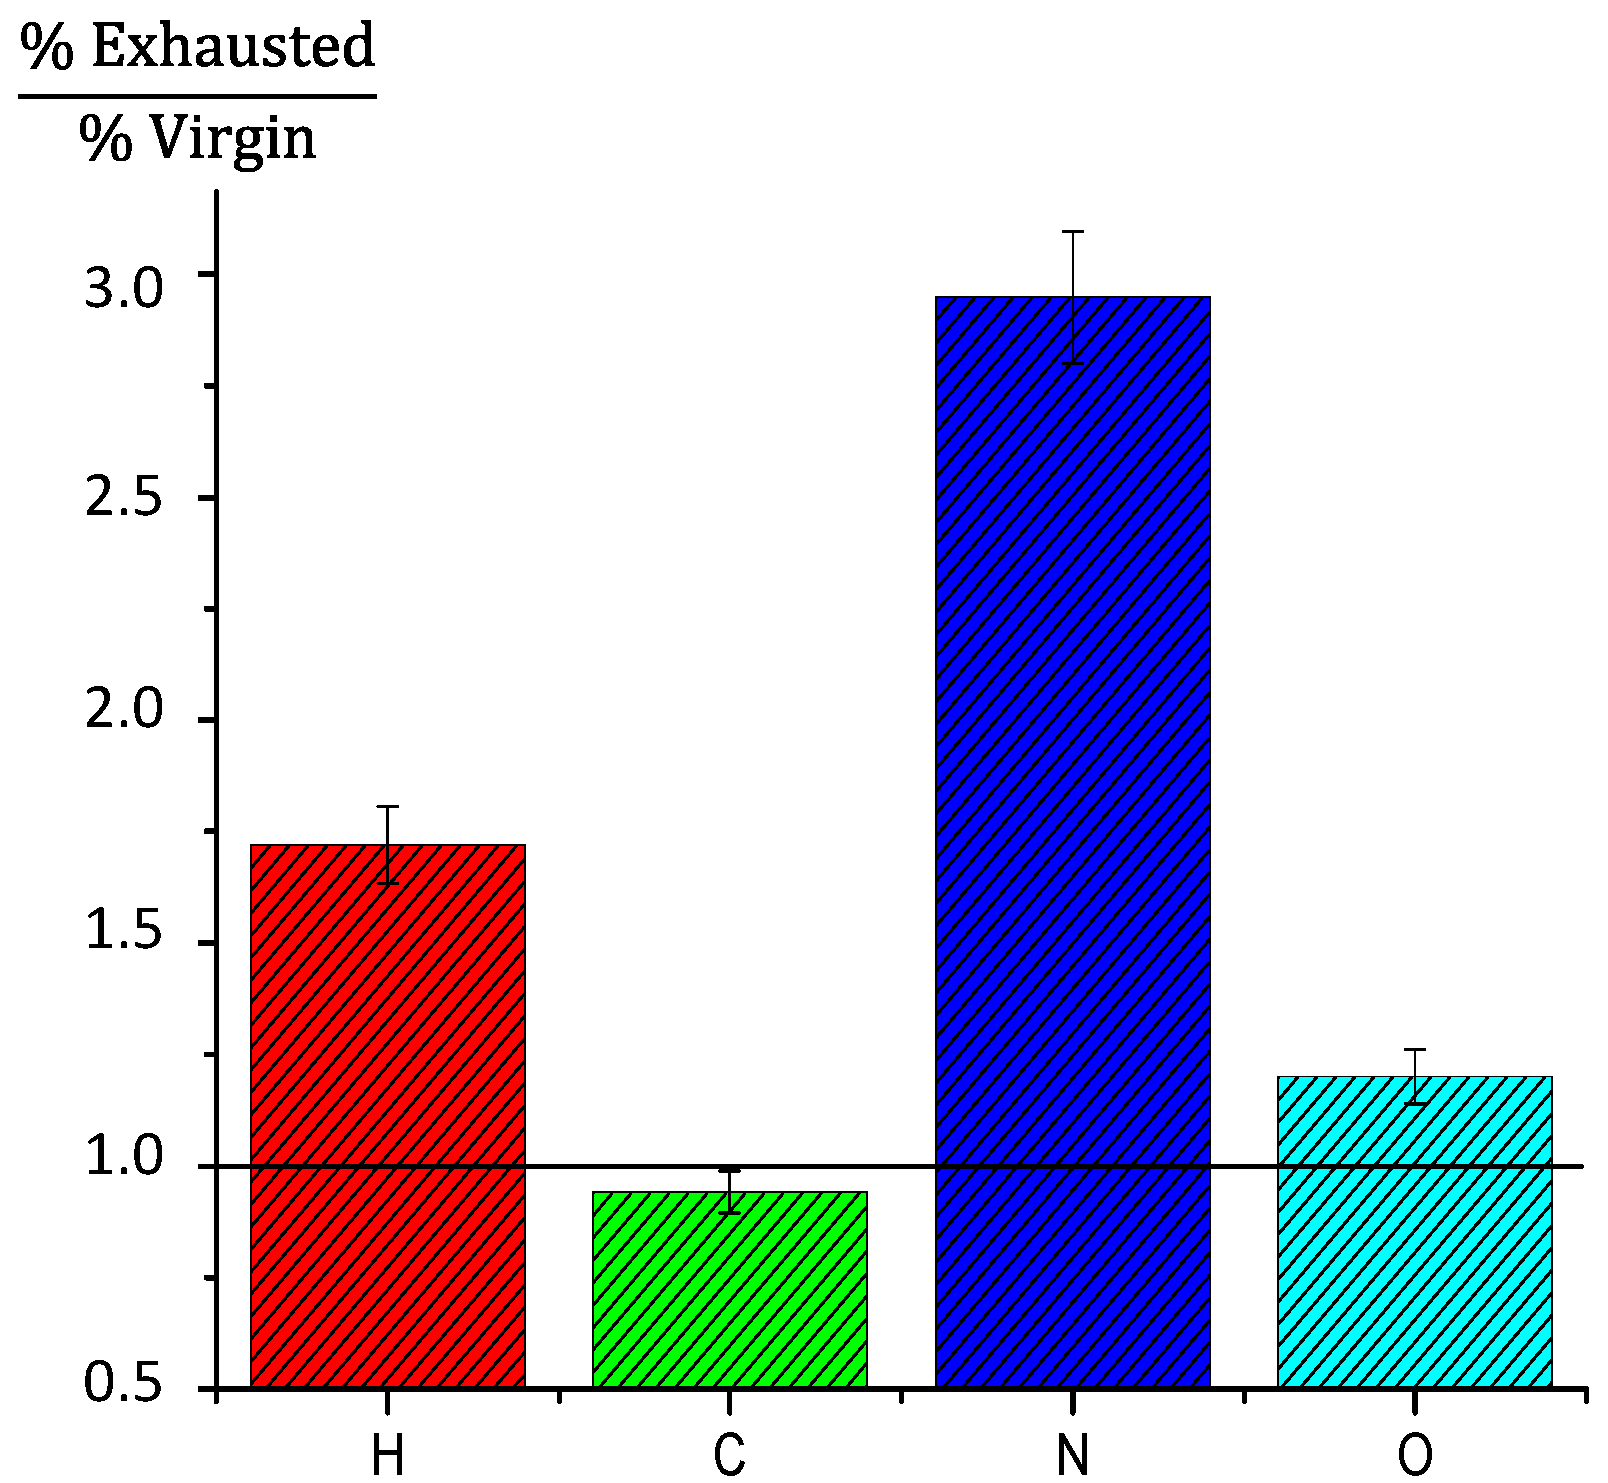
Figure 6 displays the elemental analysis data expressed as the element ratio between the most exhausted GAC-5 and virgin GAC-1. The line located at “1.0” represents a ratio = 1. Above this line, the ratio value represents how much higher the element percent in the GAC-5 sample is compared to the virgin carbon. The carbon percentage in the exhausted sample is almost the same in comparison to the virgin GAC. The oxygen percent ratio is around 25% higher than the virgin GAC. Hydrogen and nitrogen present a significant increment, approximately 1.75- and three-times higher than the virgin GAC, respectively. The exhausted carbon adsorbs an important amount of nitrogenized compounds, which might be associated with wood amino acids and proteins from the oak wood in the form of extractable compounds. These amino acids and proteins are contributors to the color in the aged rums and other alcoholic beverages [
1,
2,
5,
8,
13,
14,
15,
18,
19,
20,
21,
22,
23,
24].
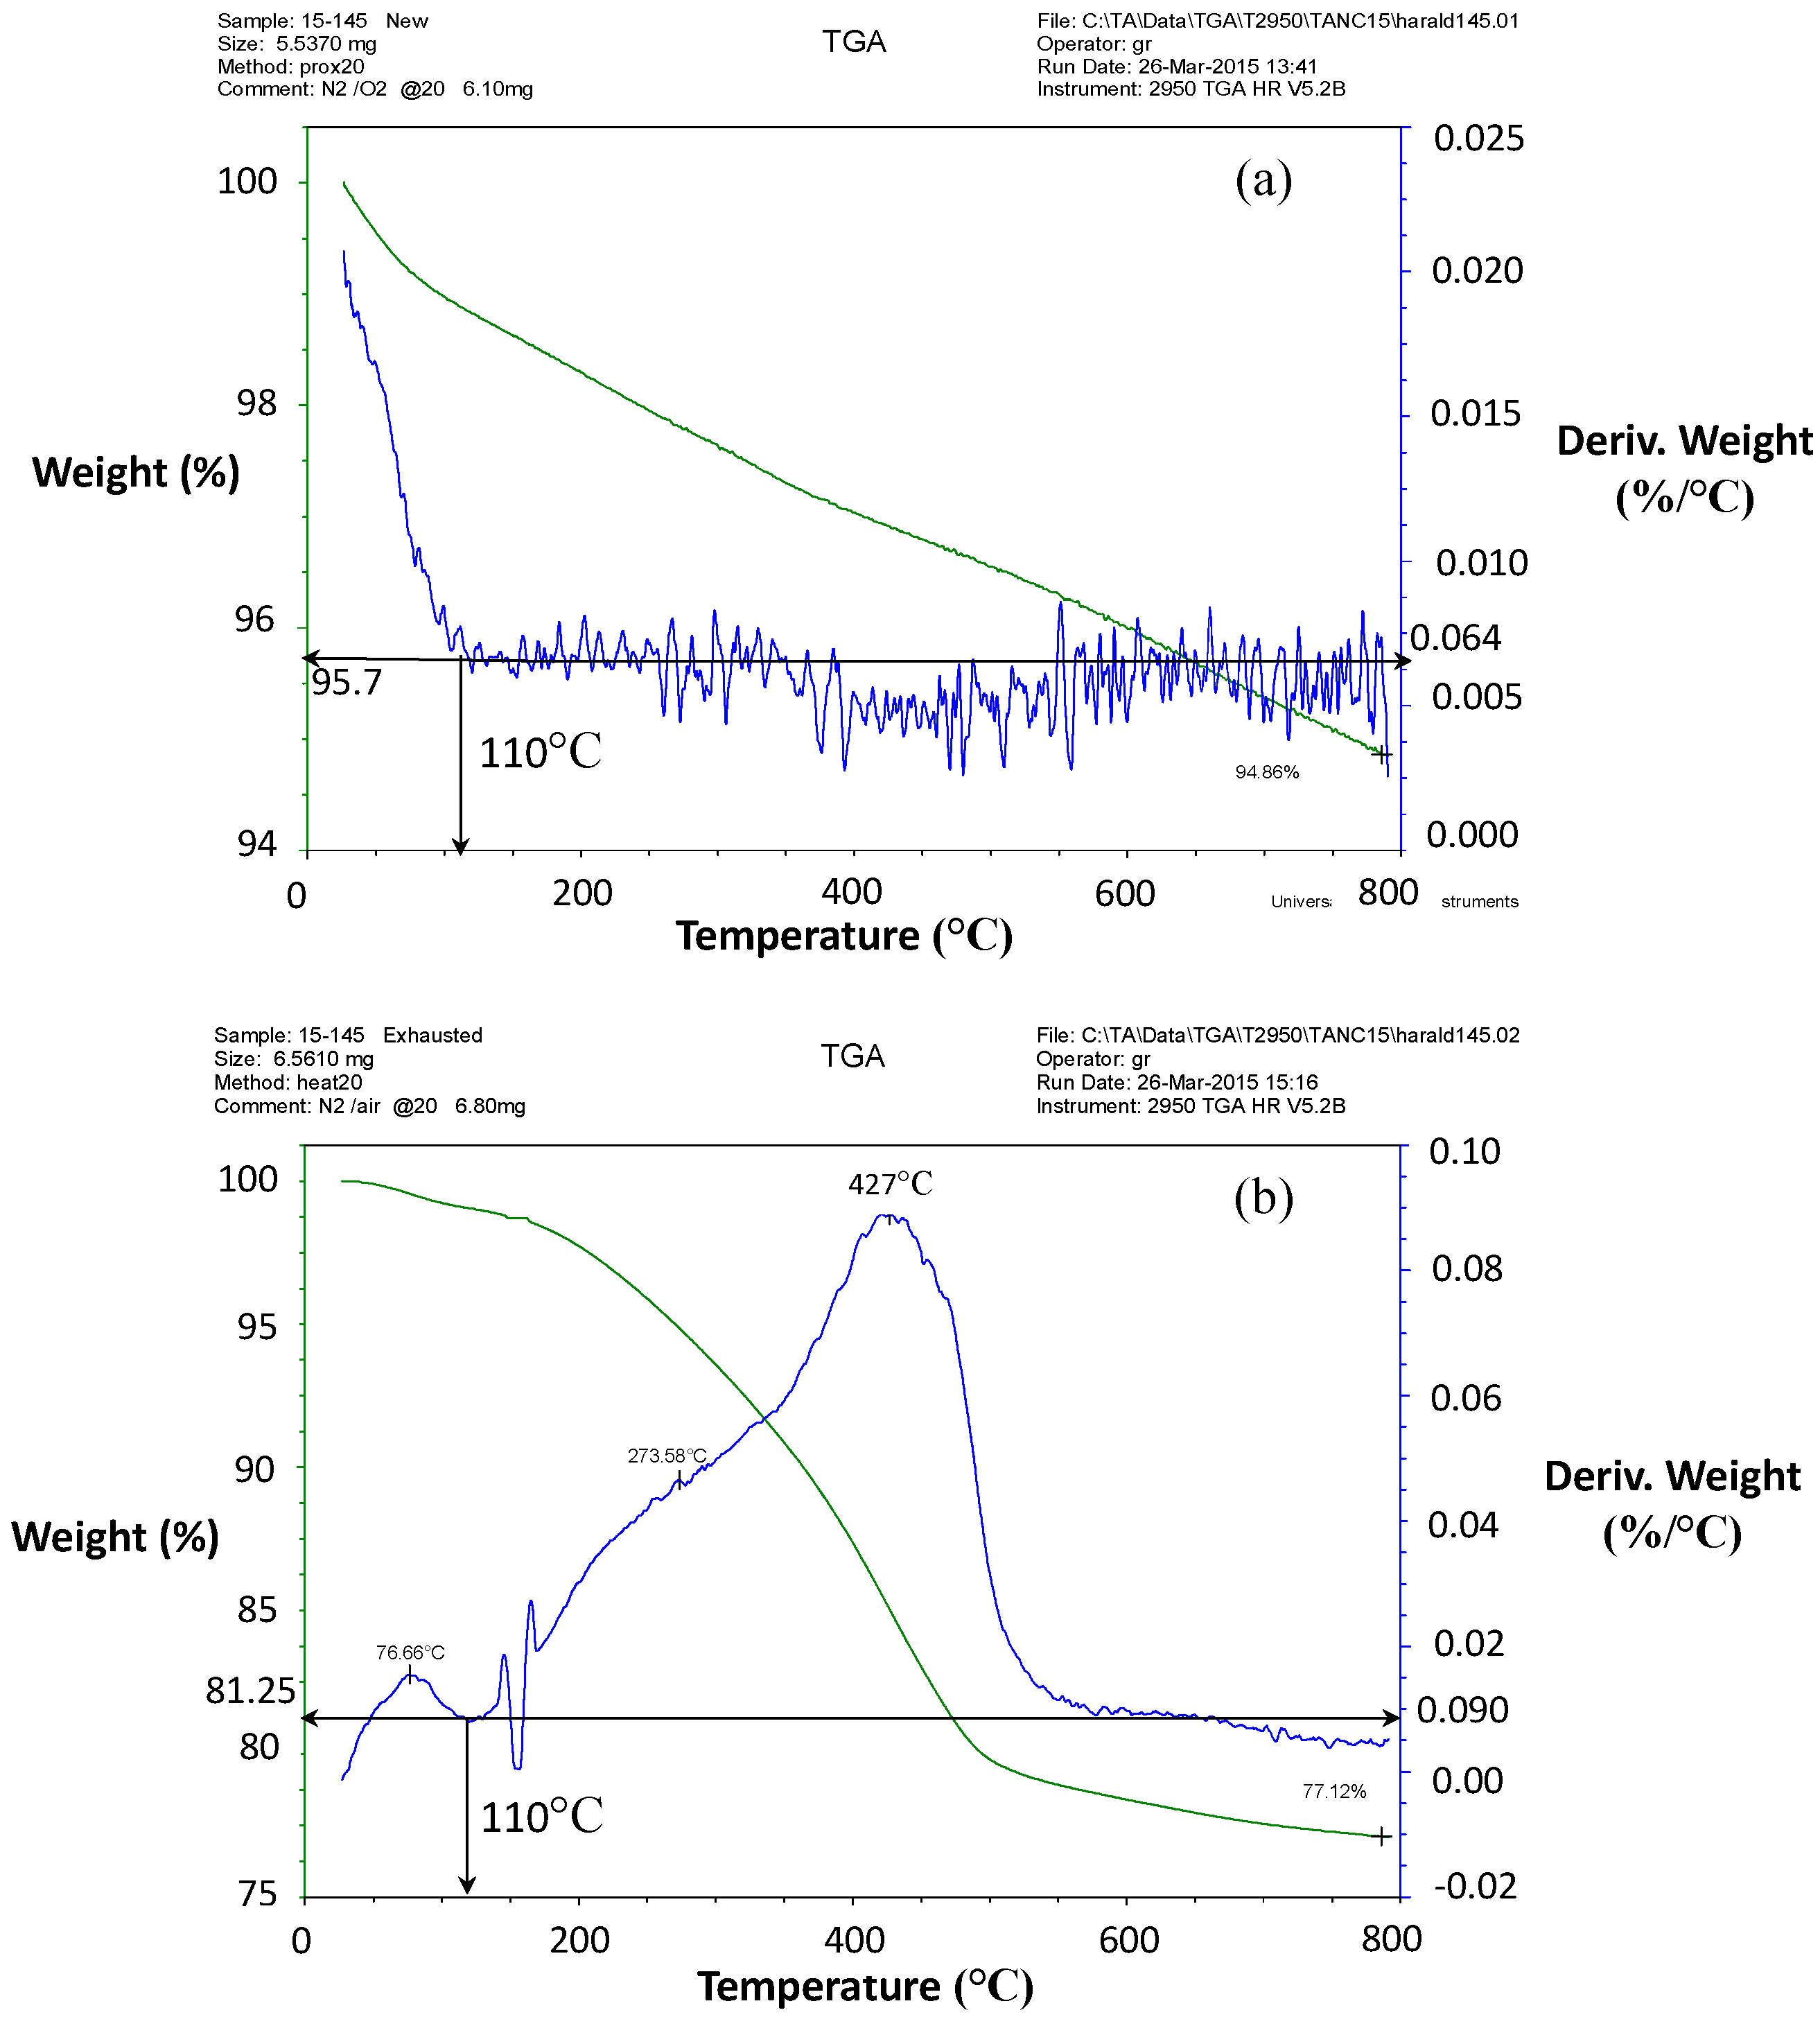
Figure 7 displays the thermogravimetric analysis (TGA) results for the virgin and exhausted samples: GAC-1 (a) and GAC-5 (b) correspondently. According to the graph, the loss of weight for GAC-1 was about 6%. Above 110 °C, minor weight loss occurred in a continuous way due to in situ-formed volatiles for GAC-1 upon further heating. Comparing TGA results,
Figure 7a,b, great differences between the exhausted samples and virgin GAC are noticeable. At 110 °C, the loss of water and low MW volatile compounds ends. Additionally, based on this TGA, a thermal treatment just above 500 °C for GAC-5 could result in a removal of most of the adsorbed organic compounds. Thermal desorption in the absence of oxygen could point to a possible recycling strategy.
Based on contact pH, iodine number, nitrogen adsorption/desorption results, TGA and elemental analysis, GAC-5 was used as the target GAC in developing the colorimetric method. Afterwards, GAC 2–4 were measured with the optimal colorimetric method conditions.
3.2. Sample Preparation
3.2.1. Drying
According to
Figure 7b, the drying process for the samples of exhausted GAC must be handled carefully in order to release only moisture. Therefore, preparing GAC for the colorimetric method, a drying curve was recorded in order to determine the proper drying time at 110 °C.
The moisture content for GAC-5 was determined [
35] and plotted versus time. After 3 h, the moisture content did not significantly change. According to the drying curve (not shown) and TGA results, the drying process must be carried out at 110 °C for 3 h.
3.2.2. Solid-Liquid Relation “Xi” (g/mL) and Wavelength
The solid-liquid relation “Xi” (grams of GAC per volume of ammonia solution) represents an important variable to be fixed. Xi affects the intensity of the obtained color of the ES. The higher the Xi value is, the darker the color. An optimal Xi to perform the colorimetric method was determined in combination with an optimal wavelength to measure the color intensity according to the Xi value. Initially, the experiments were performed using 20.0 mL of 25% ammonia solution, with masses of GAC equal to: 0.2; 0.4; 0.6; 1.0; 1.6; 3.2 and 6.0 g.
3.2.2.1. Wavelength
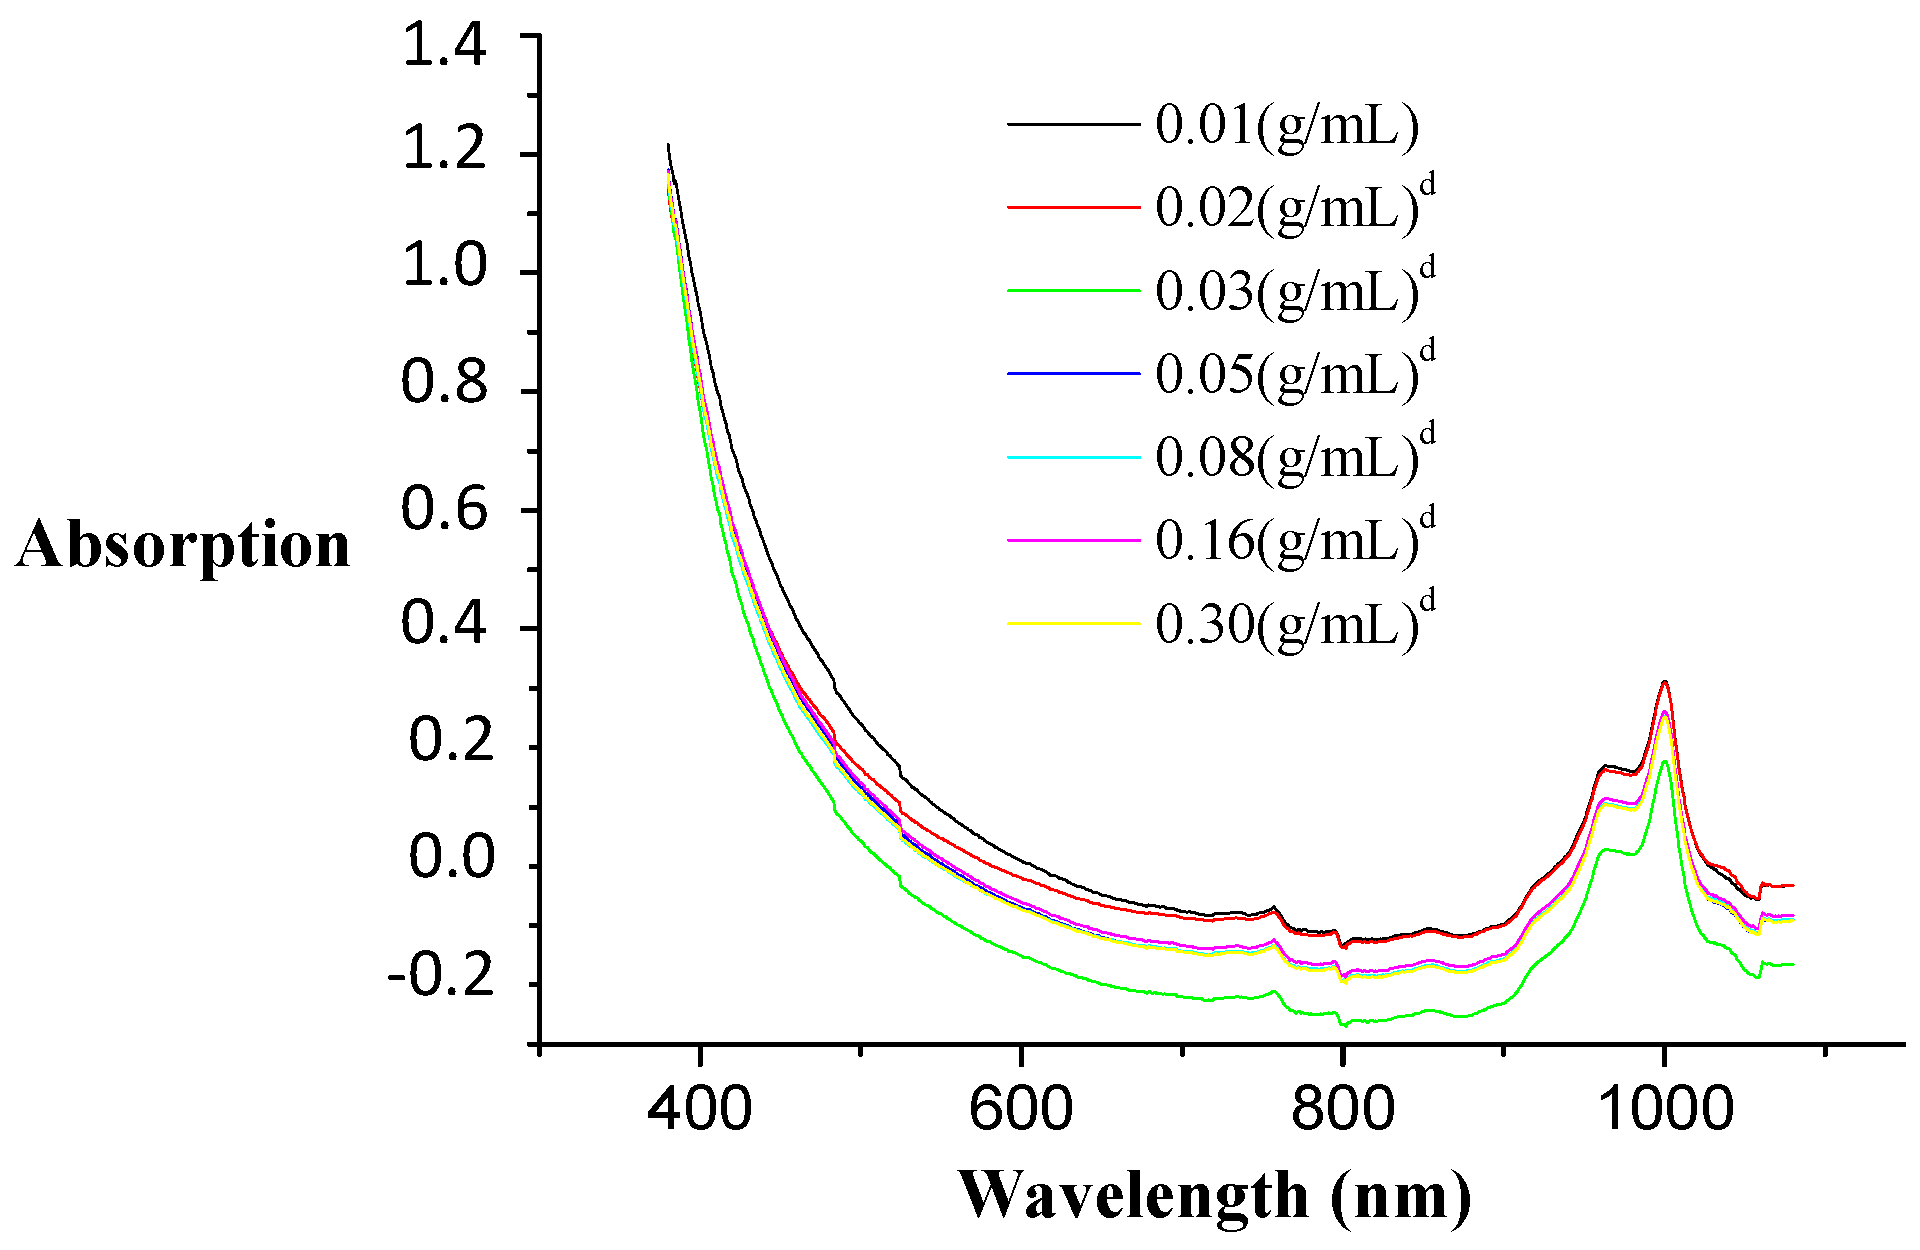
Figure 8 displays the absorption spectra of ES at different Xi combinations. Absorption spectra are almost identical for all Xi combinations. From these spectra, it is clear that no optimal wavelength can be selected. Therefore, a strategy was explored to measure at the most proper wavelength. First, a proper dilution of all ES solutions was made to account for all Xi values of the VIS spectrum (380–1100 nm), making spectra comparison possible.
Table 4 displays the values of the wavelength determined by processing statistically the optical data close to 1.25 AU (absorption units). Five independent experiments for each value of Xi were performed. The more intense the color is, the higher the obtained wavelength.
3.2.2.2. Measurement Scale
According to the instrumentation and measurement criteria, any measurement should be done at 50%–75% of the equipment maximal scale value in order to minimize the measurement errors. The spectrophotometric measurement range of absorption was 0–2 absorption units (AU). Thus, an accurate measurement in the range of 1–1.5 AU was possible. For each absorption spectrum of ES at different Xi values, the selected wavelength must give an absorption value in this range. The value of 1.25 AU was selected. Hereafter, each sample of ES at different Xi values was spectrophotometrically analyzed without dilution.
The minimal σ(x) was observed at 634 nm at Xi = 0.16 g/mL. A representative amount of GAC particles per volume of ammonia solution has to be used in order to obtain an optimal extraction condition. However, when the Xi value is higher than 0.16 g/mL, the color (dark-amber) is so intense that the optimal wavelength is loaded again with a larger error. Concluding: a representative Xi value with a proper amount of GAC, but also proper color intensity and the lowest error is for 0.16 g/mL of GAC (3.2 g/20 mL) to be measured at 634 nm.
3.3. Kinetics
3.3.1. Effect of Ammonia Concentration
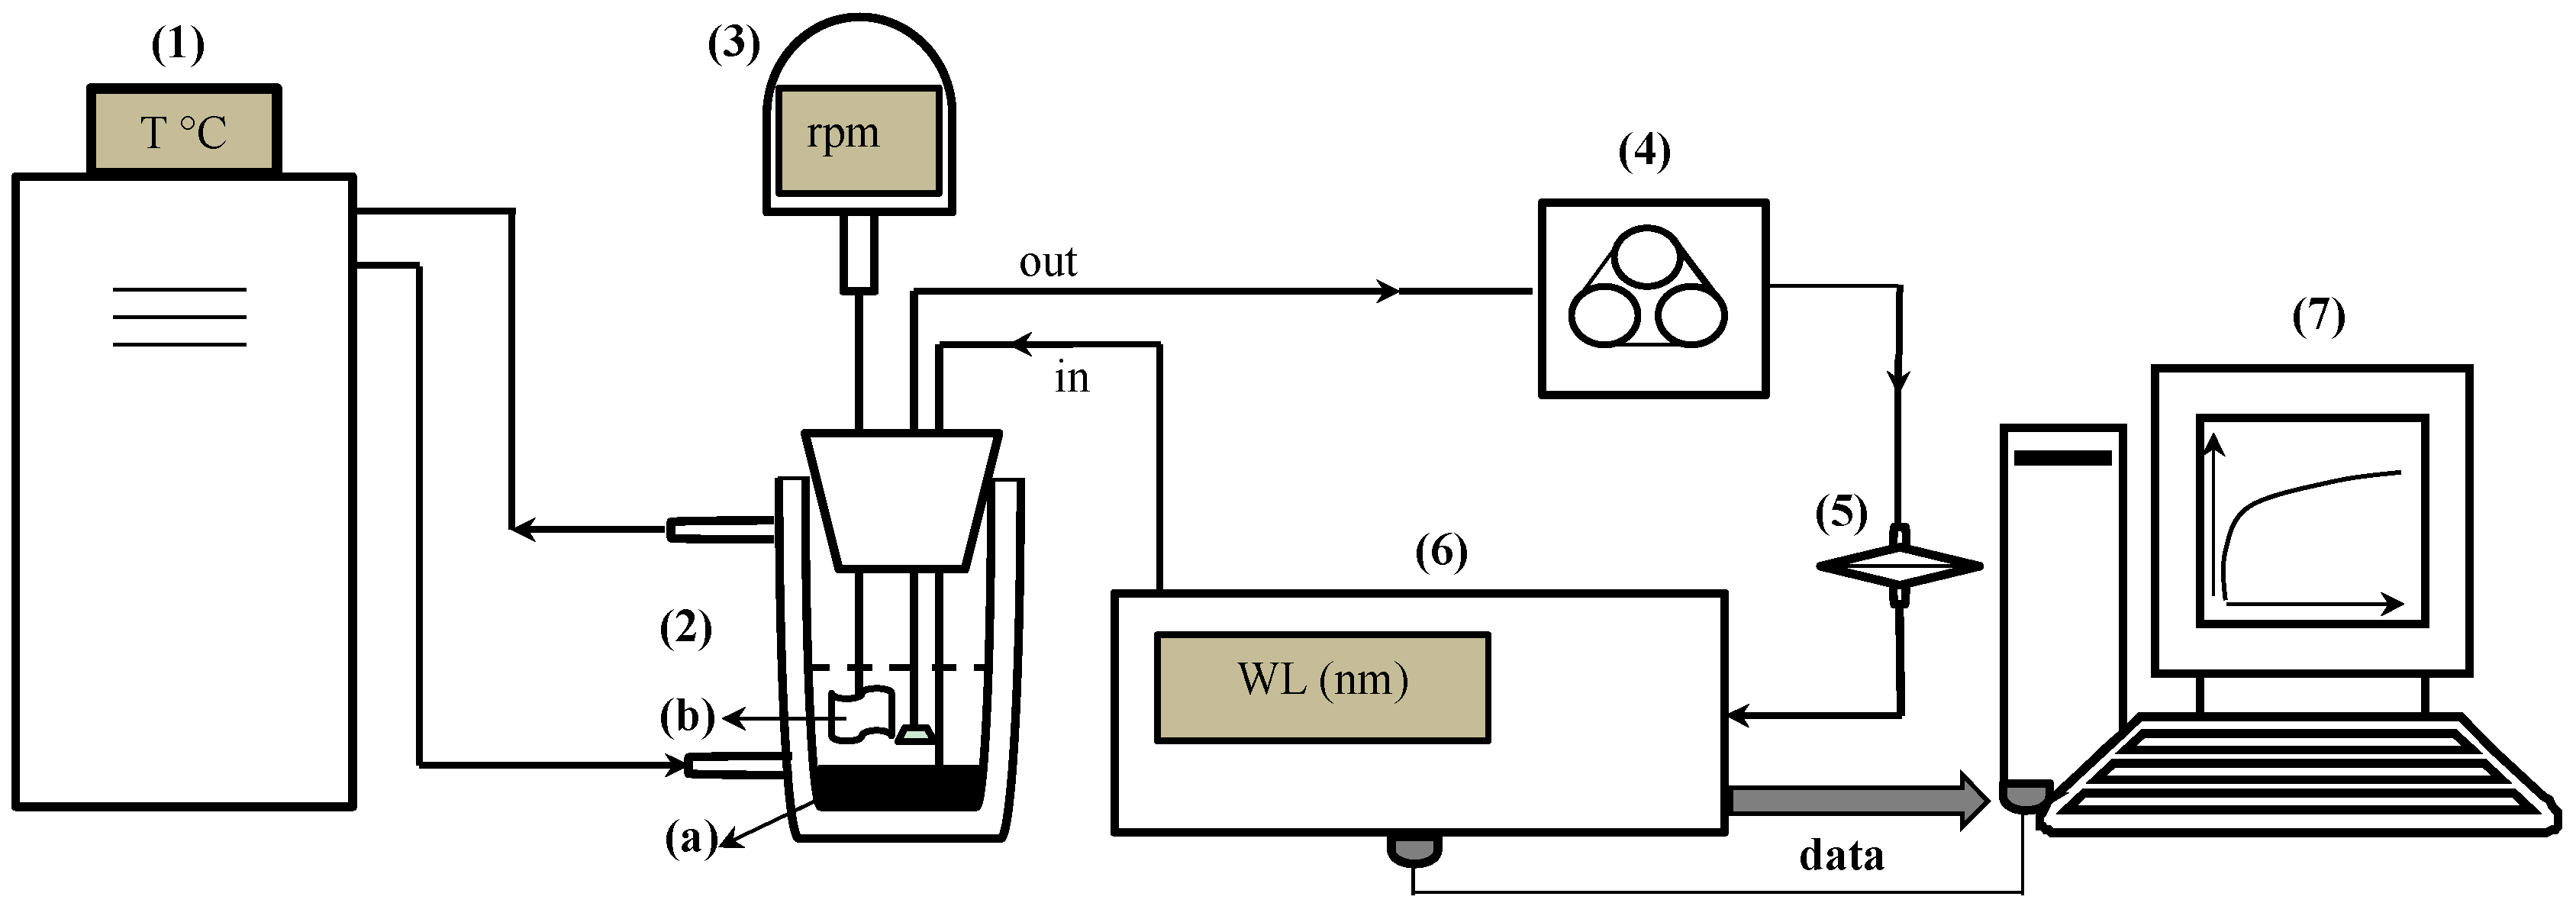
A 25% ammonia solution was used to determine the optimal Xi and wavelength to develop the spectrophotometric measurement. To evaluate the effect of the ammonia concentration, seven different ammonia concentrations were explored: 25%; 12.5%; 6.25%; 3.125%; 1.25%; 0.25% and 0.125%. Three-point-two grams of GAC-5 and 20 mL of ammonia solution were loaded in the kinetic set-up (
Figure 4). For each ammonia concentration, five independent experiments were performed at 25 °C, and absorption was measured at 634 nm after every 30 s.
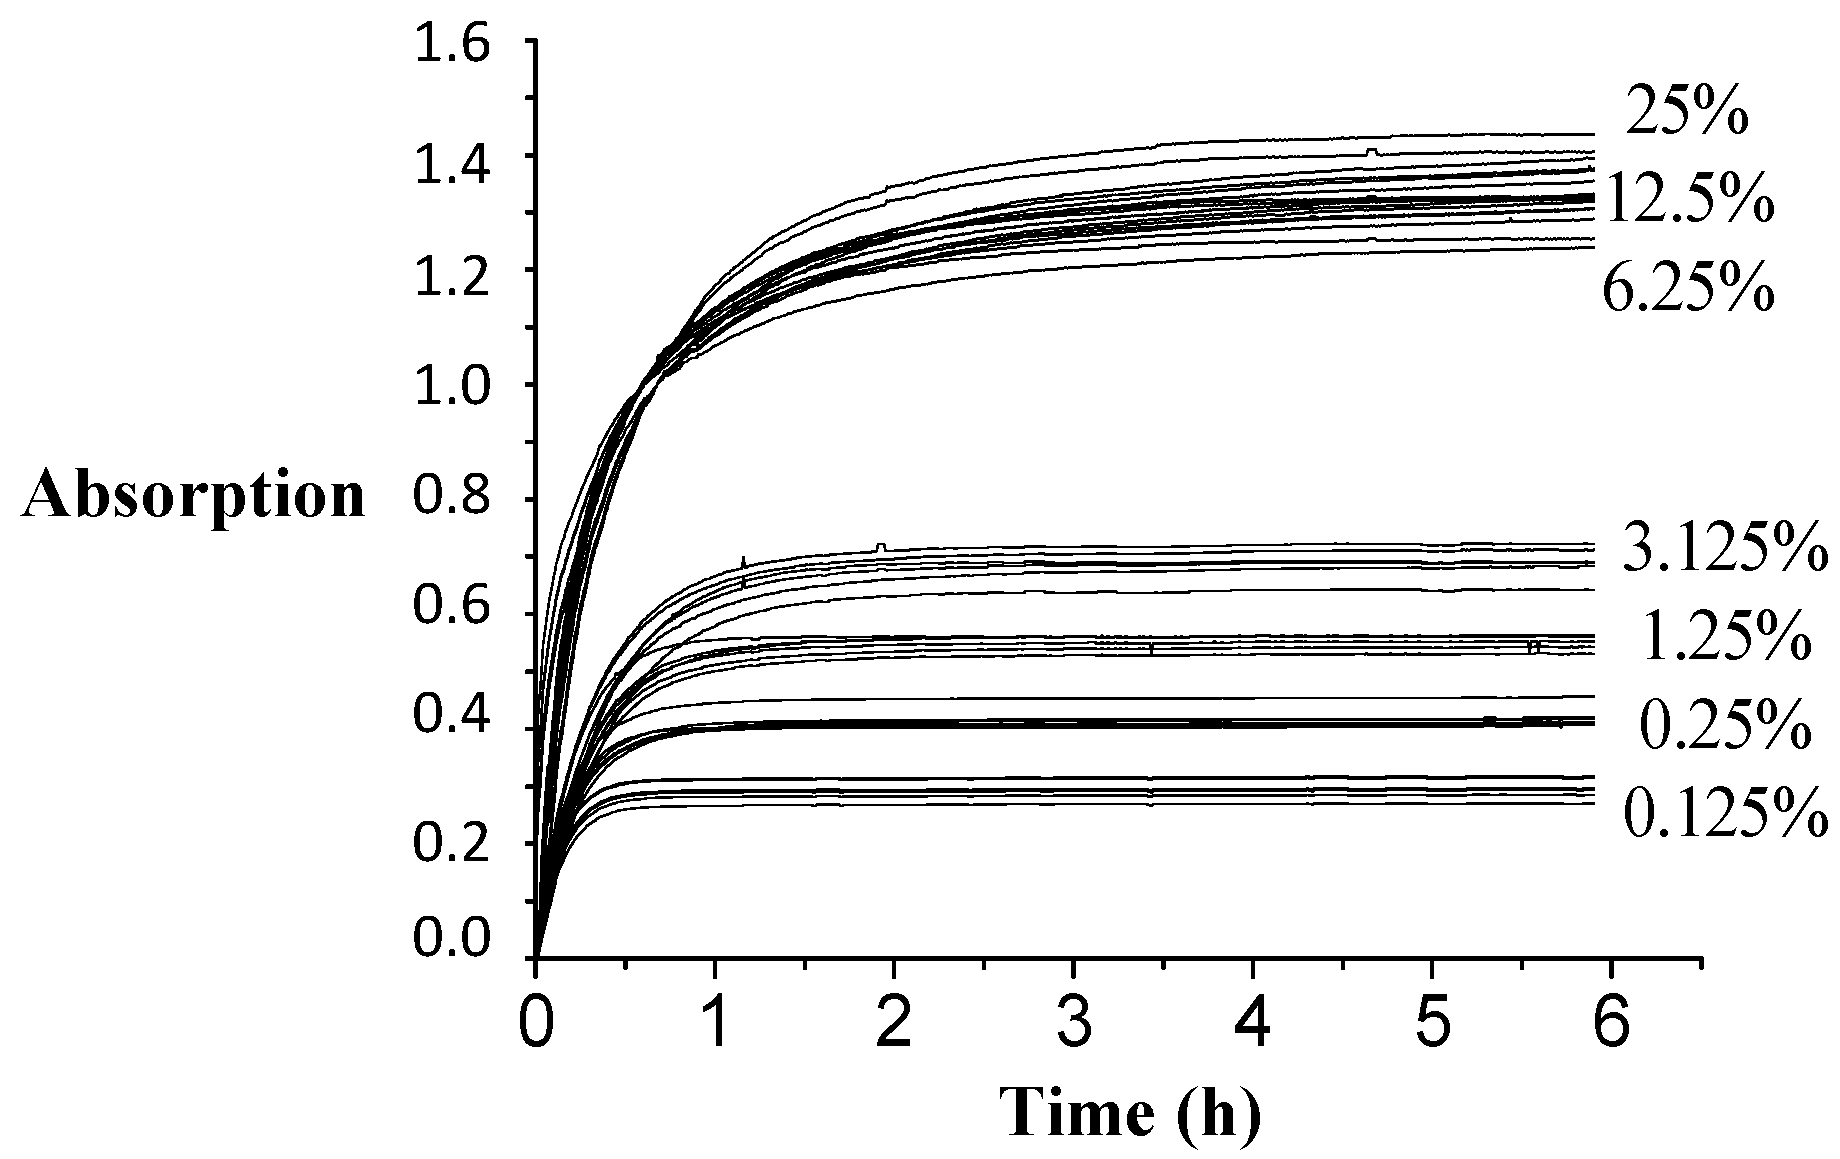
Figure 9 displays the kinetic data plotted at different ammonia concentrations. Kinetic plots for ammonia concentration at 25%, 12.5% and 6.25% are grouped together showing a similar extraction rate. By contrast, kinetic plots for ammonia concentrations 3.125%–0.125% were different: different extraction rates and different extracted amounts. The lower the concentration of ammonia used, the faster the extraction occurred, but a lower maximum absorption value is reached or fewer amount of compounds are desorbed. An ammonia concentration of 6.25% needed 6 h of contact for maximum absorption.
Table 5 presents the results of the statistical comparison between the final absorption values reached at 25 °C for each ammonia concentration. The multiple comparison method was applied to determine statistical differences between the mean of the samples using Fisher’s lower significant difference (LSD) method. In this case, there was no statistical difference in the equilibrium absorption value reached between 25%, 12.5% and 6.25% of ammonia. In addition, all spectra recorded for ES at different ammonia concentrations were identical to those displayed in
Figure 8.
According to Lambert-Beer’s law, the absorption value is directly proportional to the concentration of a component “A” (C
A). As rum is a complex mixture of organic substances [
5,
6,
7,
8,
9,
10,
11,
22], it is difficult to determine the specific extractable compounds responsible for ES color (an analytical procedure to determine the extractable compounds responsible for the obtained color is under study). Therefore, an alternative way to assume the linear correlation between the absorption value and the concentration of the color can be proposed. An industrial amber color from sugar cane (known as caramel color) was therefore used. This colorant is produced at the industrial scale, and its quality parameters are strictly guaranteed and regulated. The amber color from the caramel color is very similar to the color of the ES and OES.
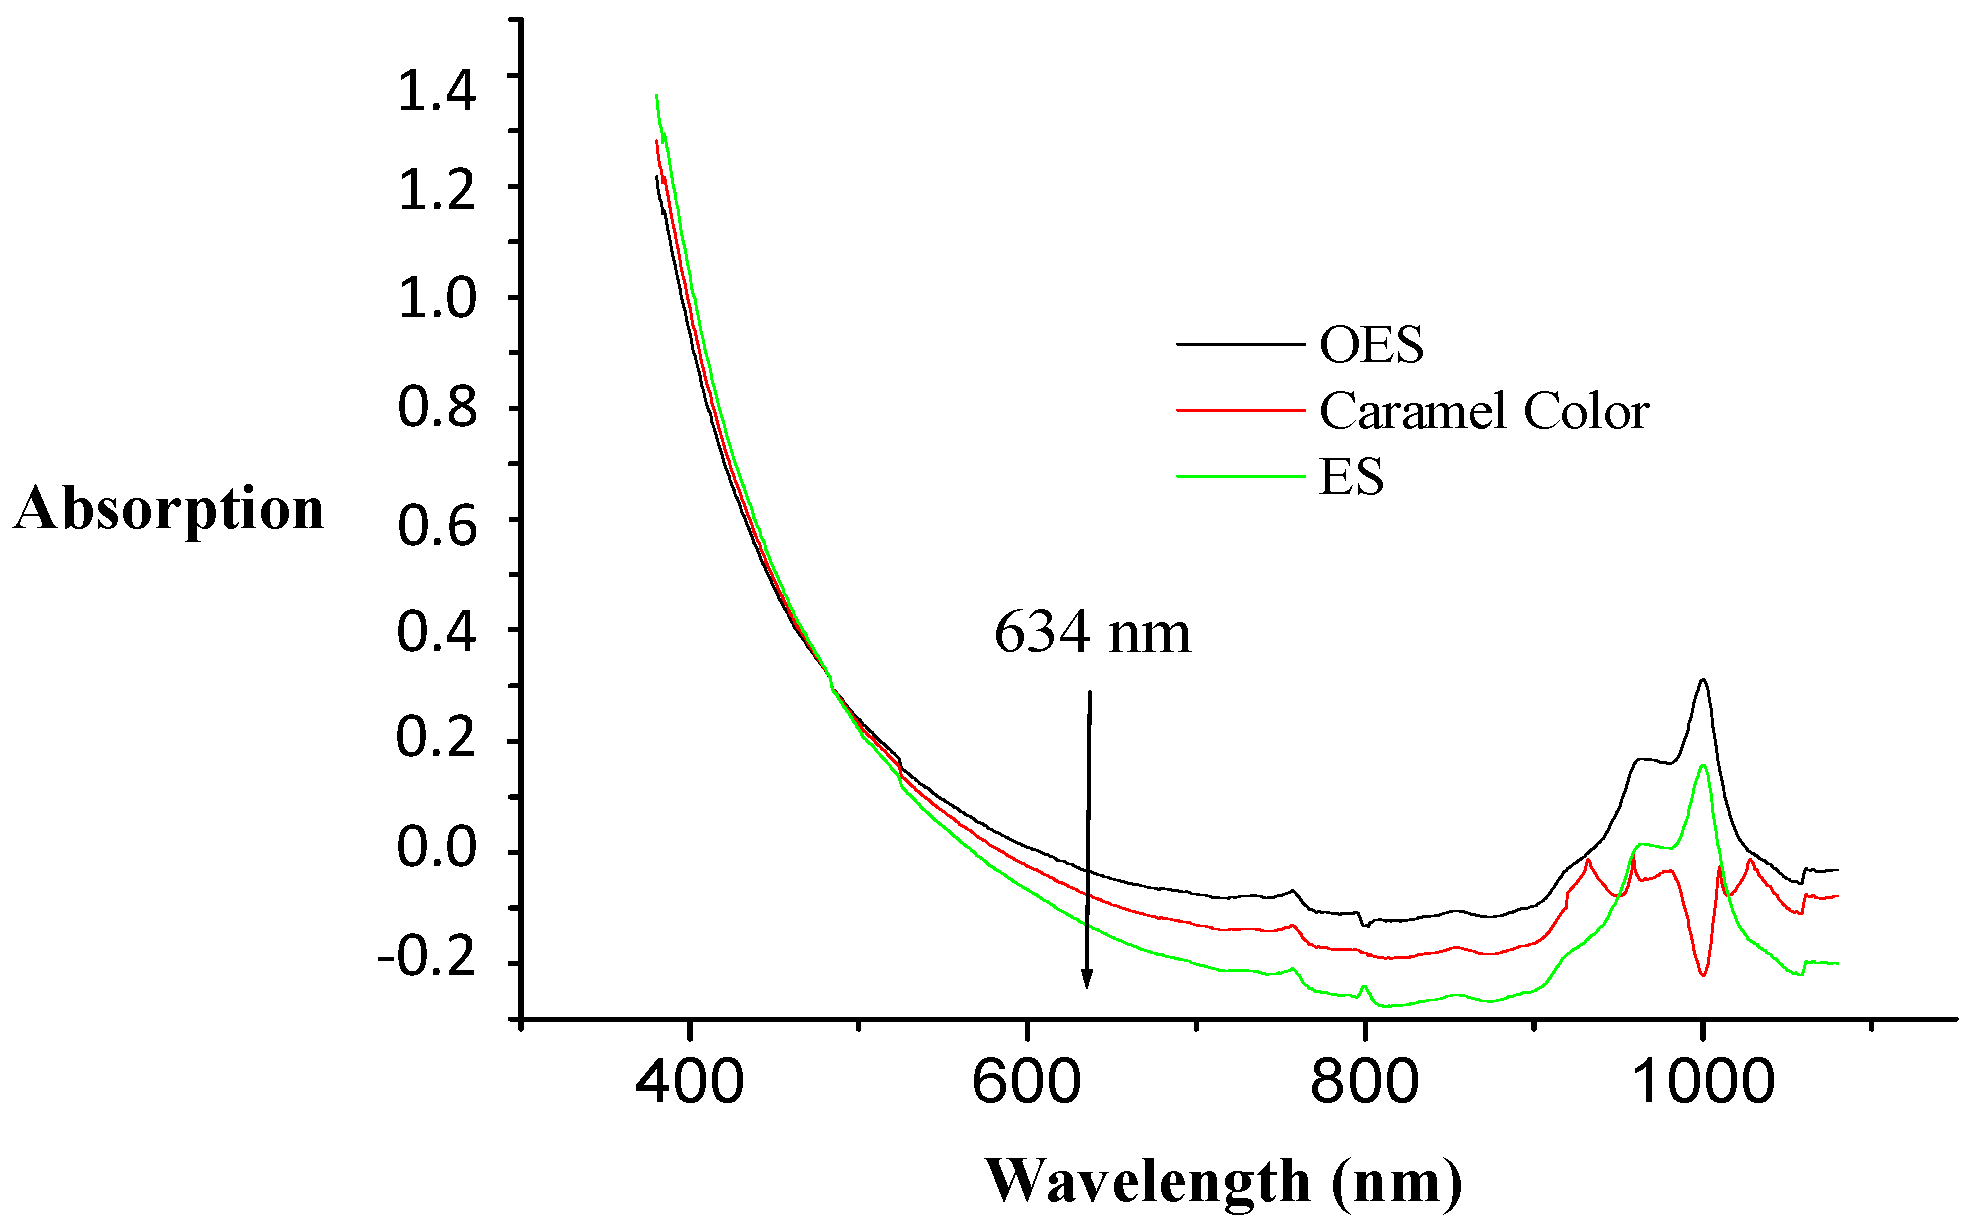
Figure 10 presents the optical spectra of ES, OES and the caramel color. The spectra are similar in the 380–900 nm range. As the measurements take place at 634 nm, the caramel color can be used as a representative or equivalent substance to evaluate the linear correlation between the absorption value and the color concentration. After 900 nm, the optical pattern of the caramel color is somewhat different from the ES and OES patterns.
A linear calibration curve between measured absorbance and the concentration of the caramel color at 634 nm was obtained. Accordingly, for ES, an equivalent linear correlation at 634 nm can be stated and is used to calculate “color” concentration or
Ceq for ES and OES. The model that describes the relationship between absorption (
Abs) and the color concentration
Ceq (in g/L) is proposed as:
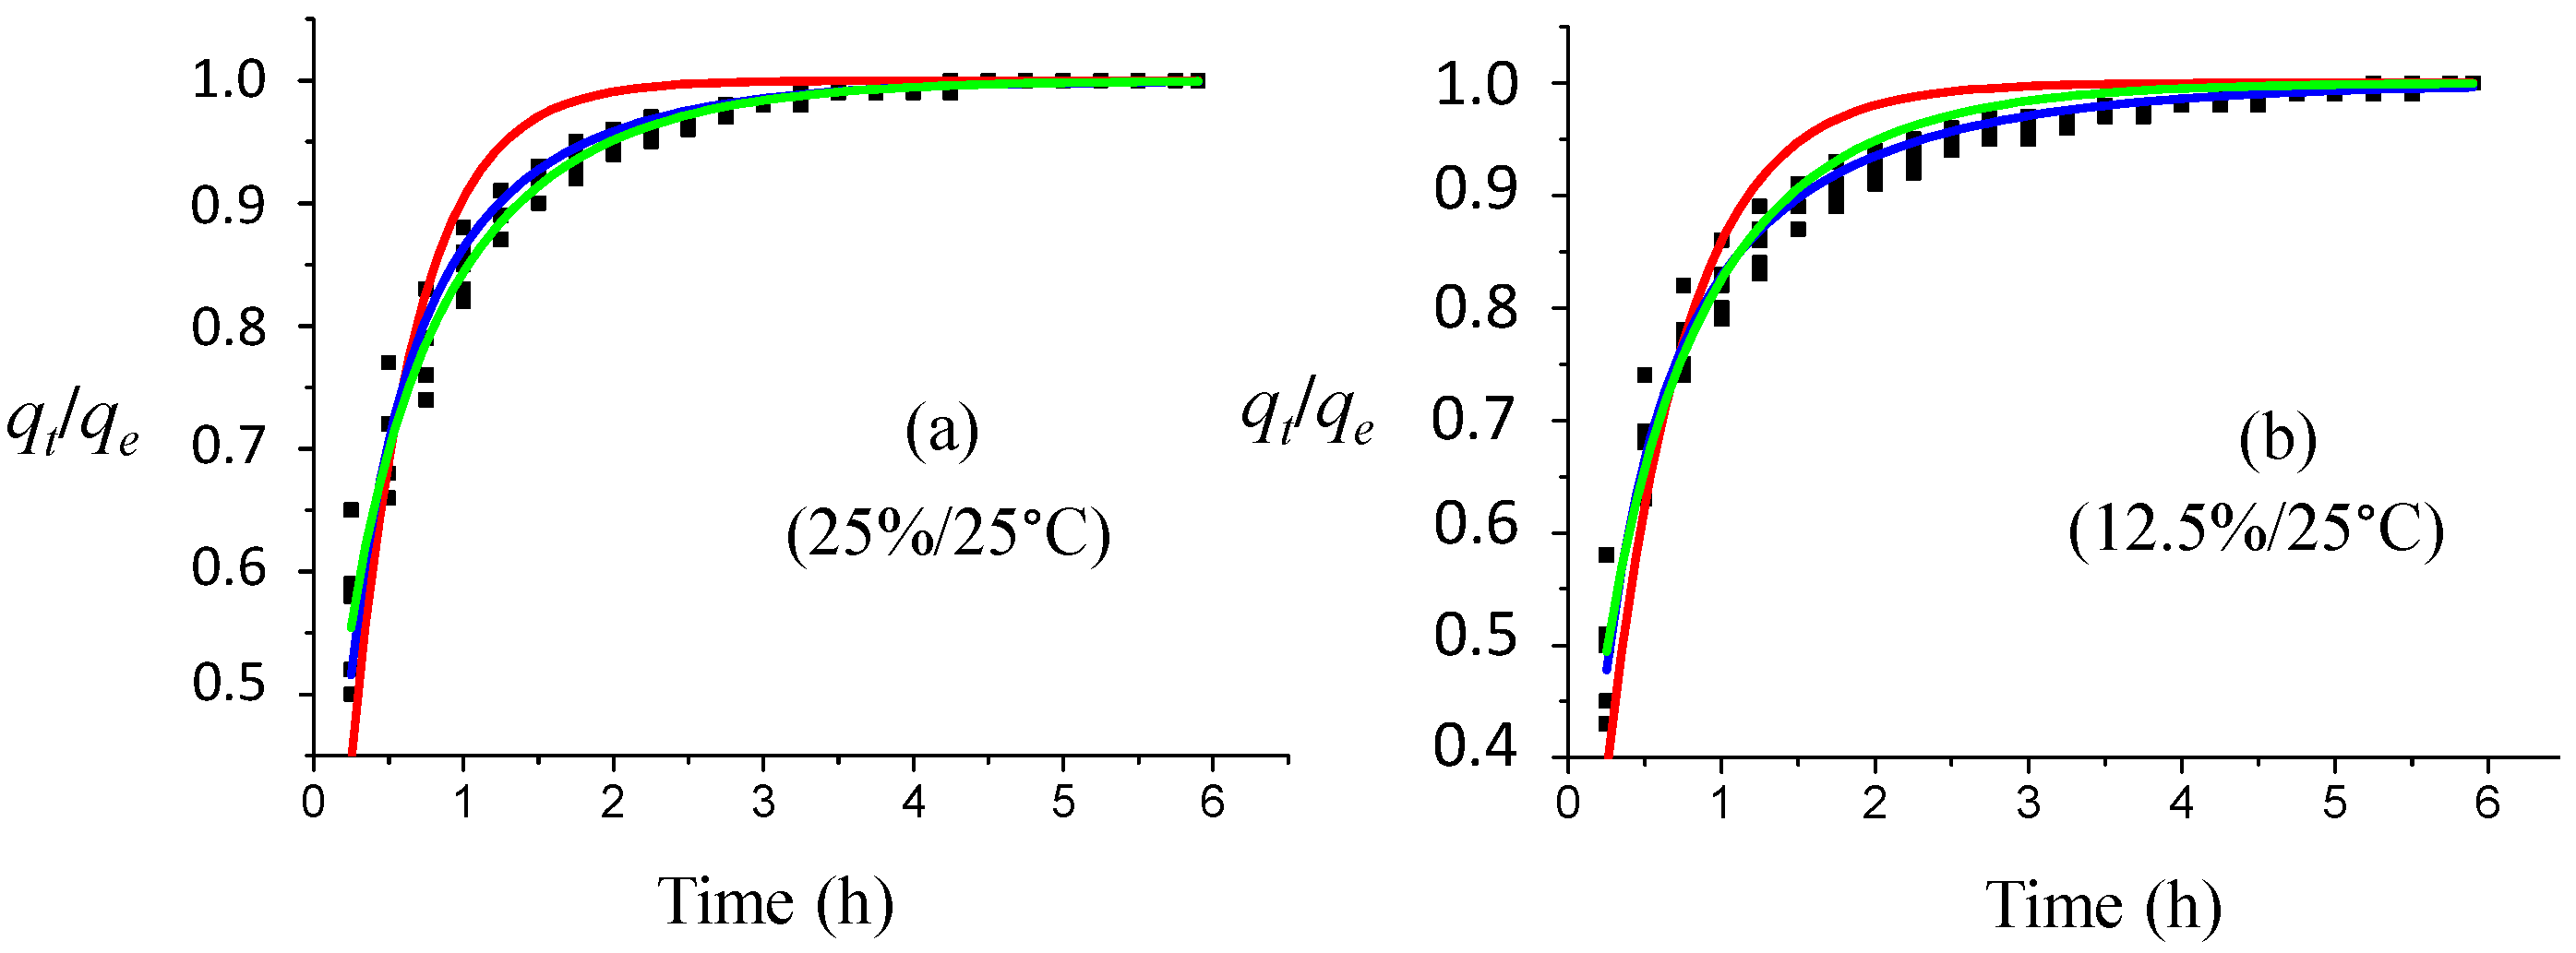
Figure 11 presents the experimental and fitted kinetic data for only two different ammonia concentrations at 25 °C. All of the data were used in the fitting process using the
qt/
qe ratio versus
t according to the PFO, PSO, MPnO and MOE models.
qt and
qe data were obtained by transforming the absorbance values into equivalent color concentration
Ceq.
At all ammonia concentrations, the PSO model had a correlation coefficient lower than 0.80, and they were therefore not restrained. For 25%, 12.5% and 6.25% of ammonia concentration, a lower regression coefficient was found for the PFO model fitting compared to MPnO and MOE (
Table 6). However, the PFO model fits the data for all lower ammonia concentrations quite well; MPnO and MOE models fit the data for all ammonia concentrations at 25 °C very well. In all examined models, the rate coefficient increased with a decreasing ammonia concentration, which was in accordance with the kinetic results (
Figure 9). The lower the concentration of ammonia, the faster the equilibrium absorption value is reached. The desorption velocity increases as the ammonia concentration decreases.
According to
Table 5 and
Table 6, the ammonia concentration in the range of 25% down to 6.25% affects the reaction parameters, but does not affect the equilibrium absorption value reached.
3.3.2. Effect of Temperature
For determining the effect of temperature, three different temperatures were explored: 10, 25 and 40 °C. Three-point-two grams of GAC-5 and 20 mL of a 6.25% ammonia solution were loaded in the kinetic set-up (
Figure 5). For each temperature, five independent experiments were performed: the absorption value was recorded at 634 nm every 30 s.
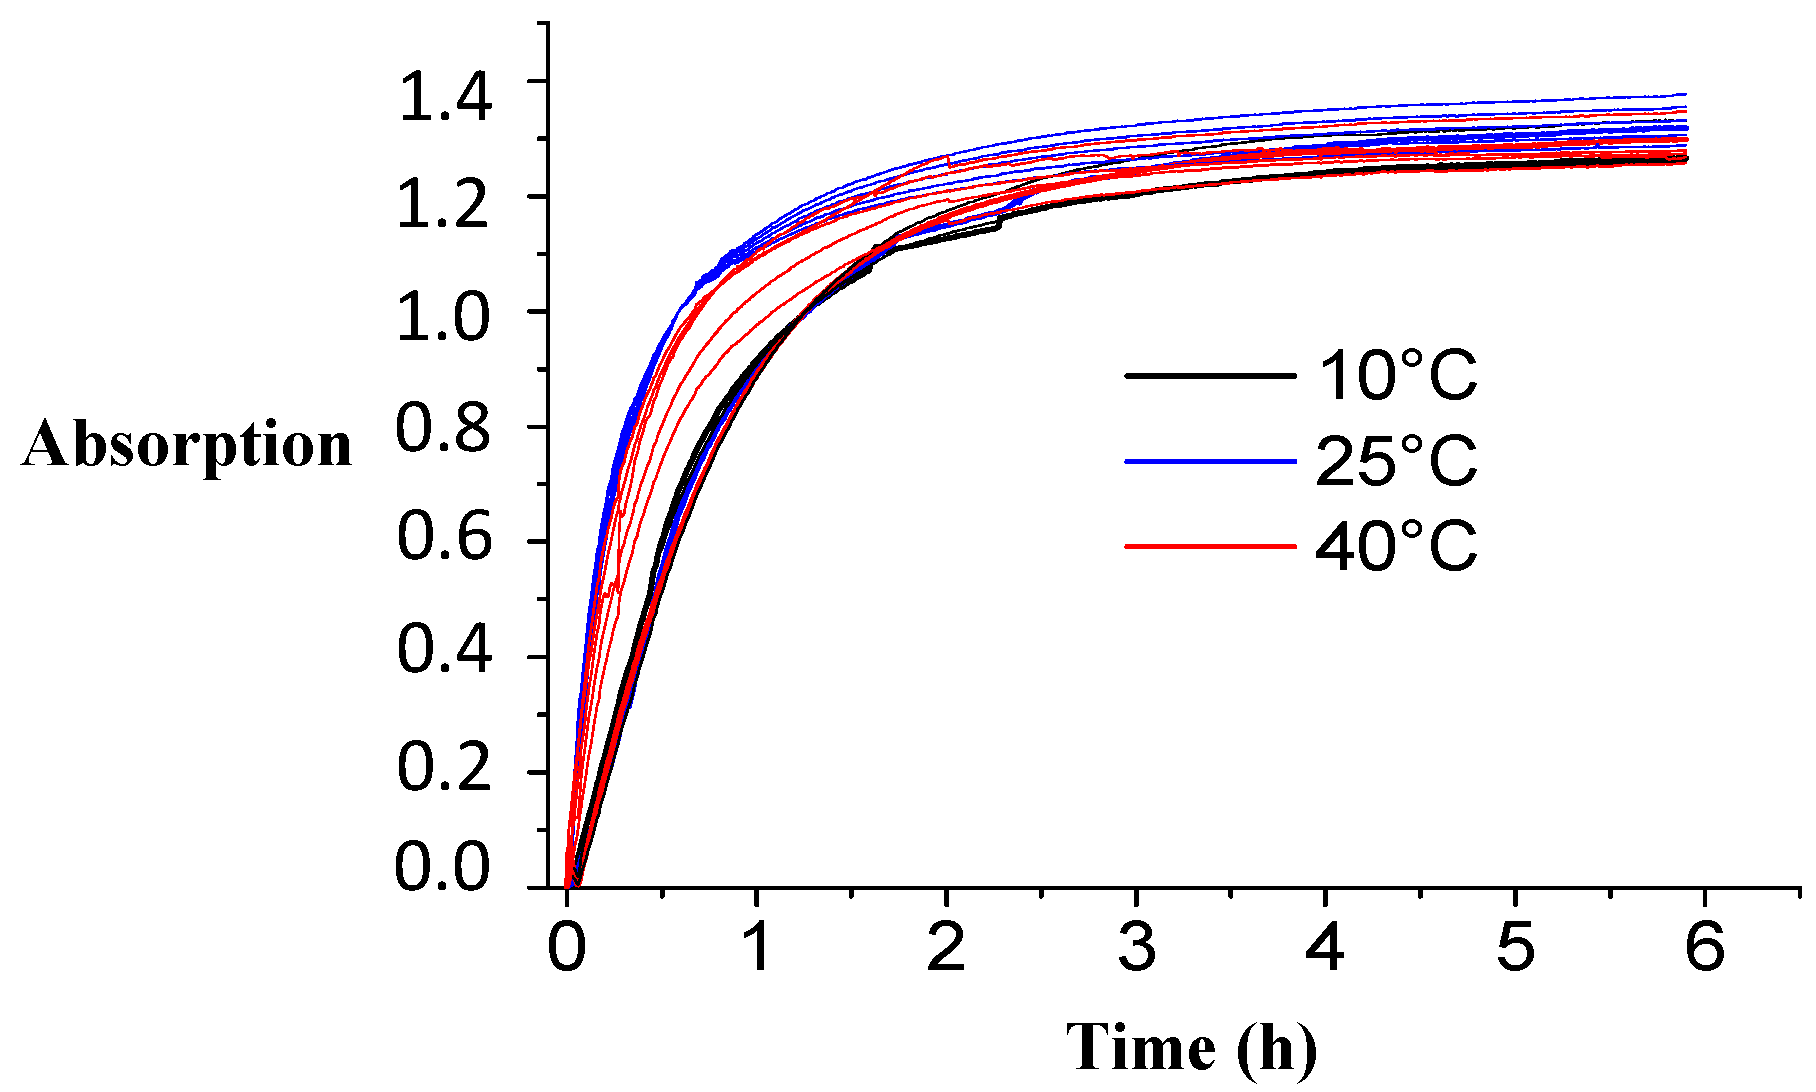
Figure 12 displays the obtained plots for the experimental kinetic data at different temperatures. Only some minor differences in the plots can be noticed. The equilibrium absorption values reached are very similar.
Table 7 presents the results of the statistical comparison between the final absorption values reached at equilibrium for each temperature. There are no statistical differences between 10, 25 and 40 °C. It can thus be concluded that temperature does not affect the final absorption value at equilibrium in the range of 10–40 °C.
However, in terms of reaction rate, 25 °C seems to be the most optimal temperature. Further on, the recorded spectra (not shown) at the different temperatures are again comparable with each other, as found in
Figure 9 and
Figure 11.
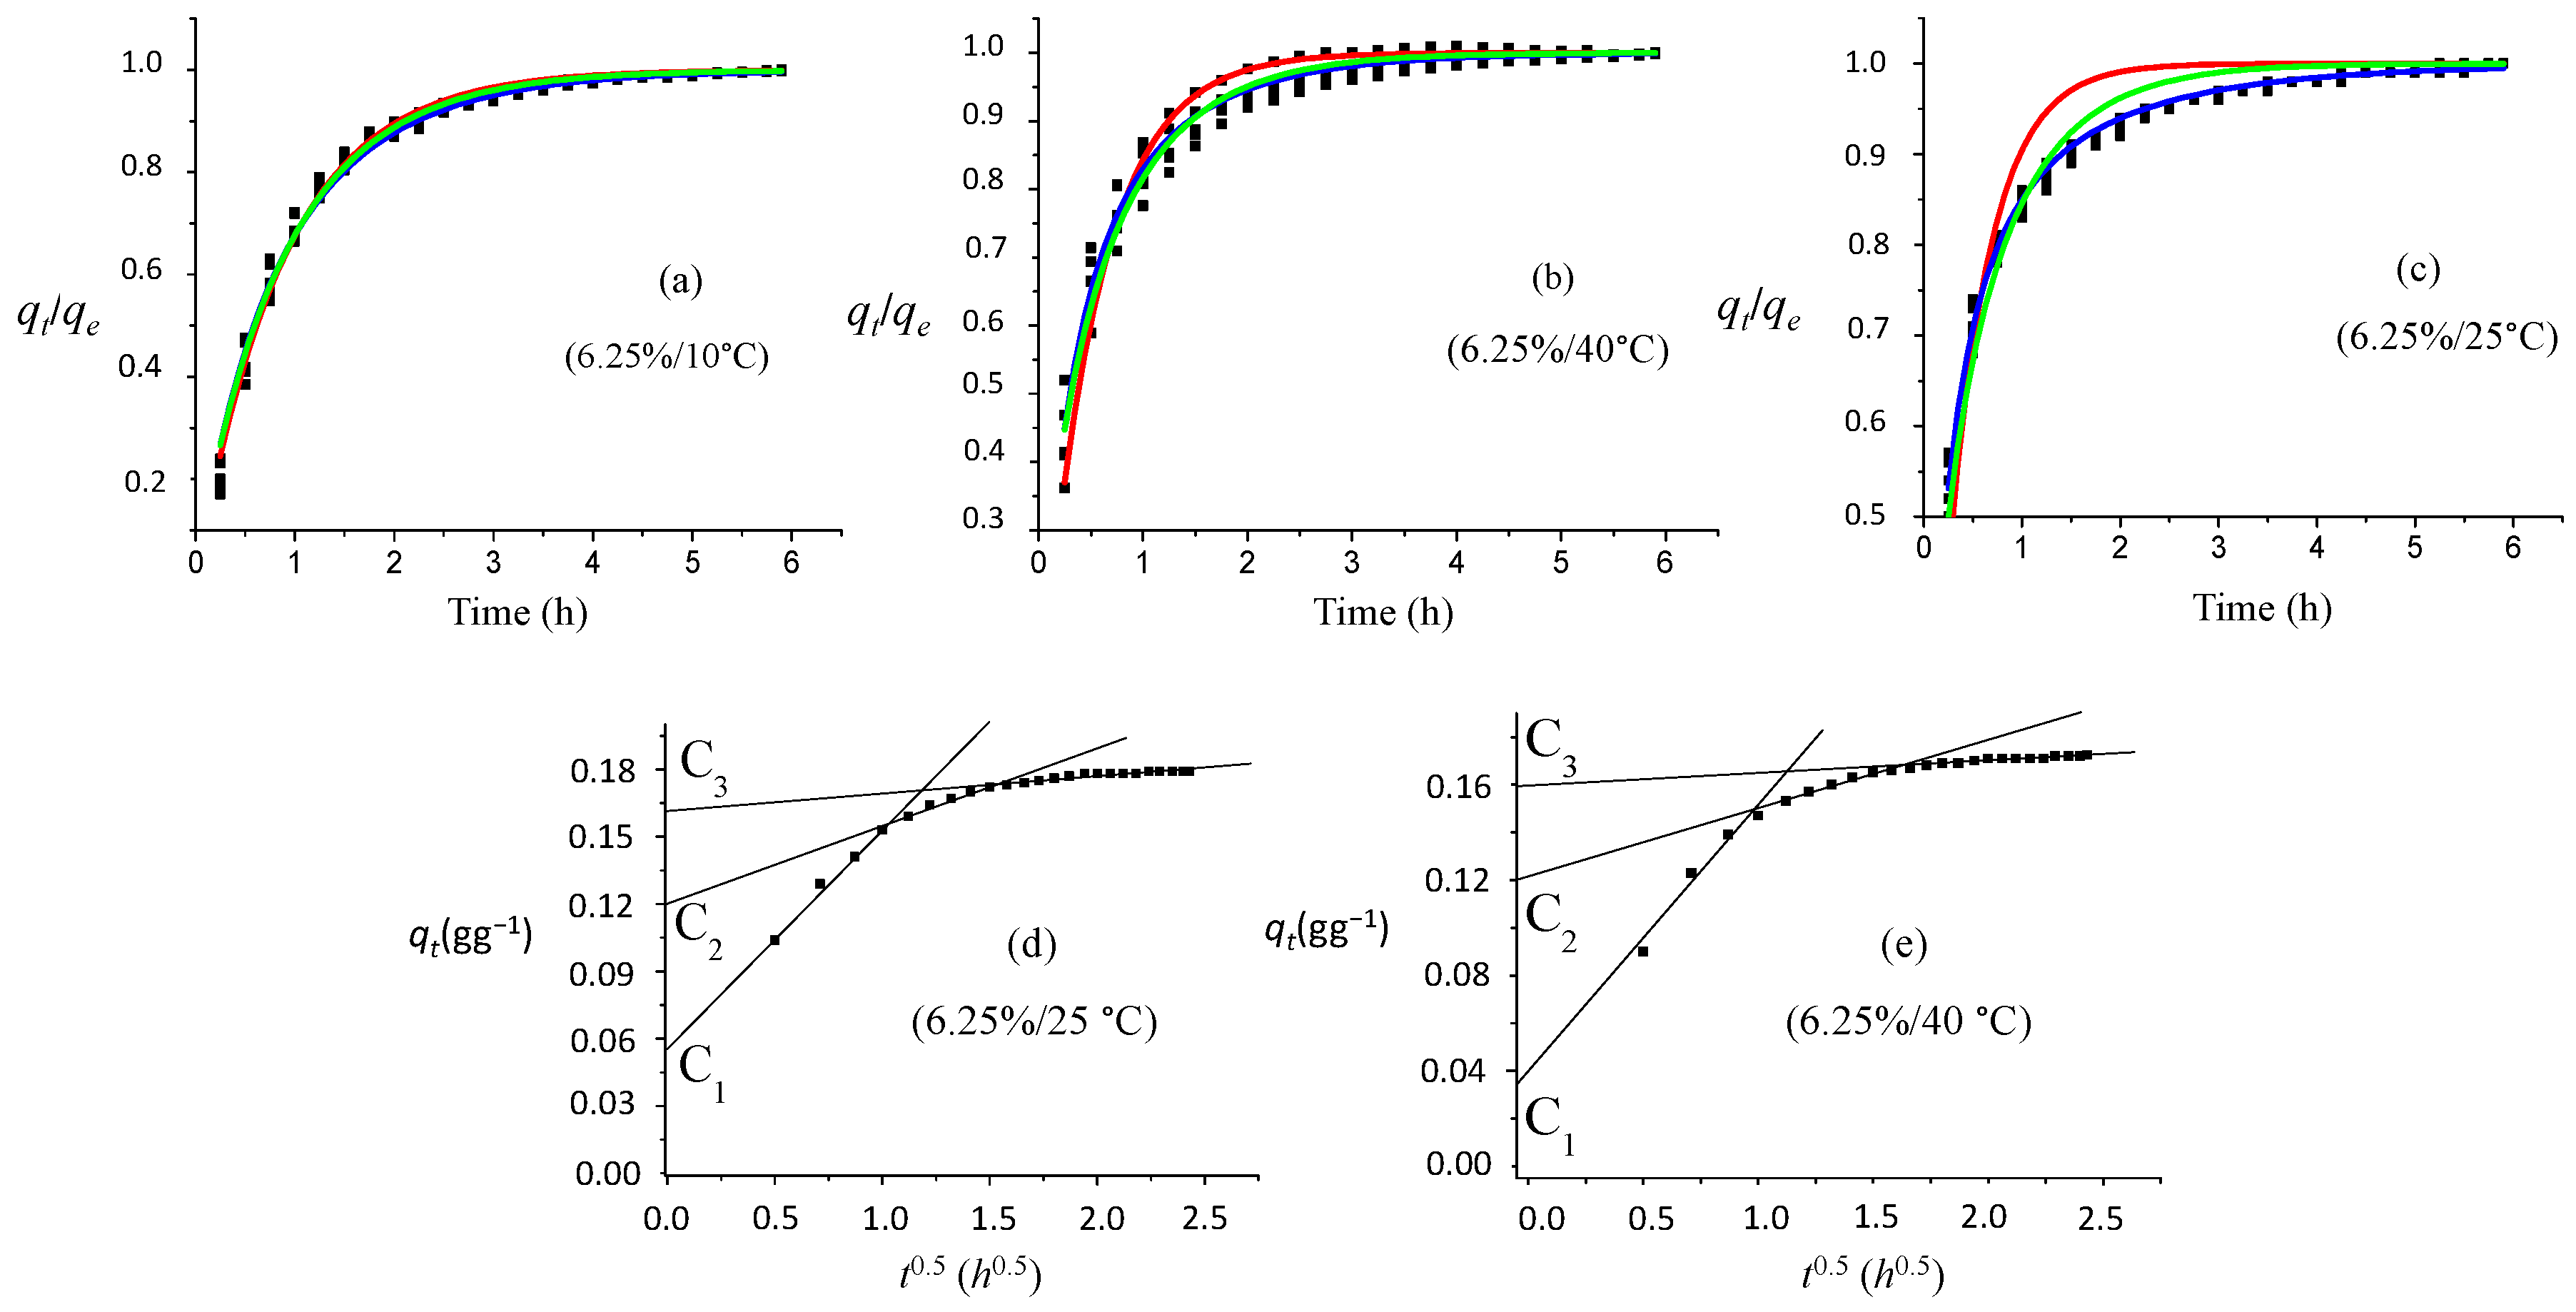
Figure 13a–c displays the experimental and fitted kinetic data at different temperatures for a 6.25% ammonia solution. At 25 °C, the lowest correlation coefficient was for the PFO model (
Table 6,
Figure 13c). MPnO and MOE models present satisfactory goodness of fit for all temperature ranges. For the 10 °C kinetic study, all of the other models fit the data equally well. At 25 °C, the MOE model fits the data better than the MPnO model. At 40 °C, again, all models were comparable, but MOE is superior towards MPnO. PFO has the least coefficient. The temperature affects the reaction rate constant, but does not affect the equilibrium absorbance value. At 25 °C, the rate constant is different from the other temperatures for all of the explored kinetics models.
The effect of temperature on the behavior of the rate constant value is a typical feature of heterogeneous reactions controlled by the desorption velocity of the reactant from the solid surface [
39,
40,
41]. It can be noticed from
Table 8 that at 25 °C for all kinetic models compared to the 10 °C and 40 °C experiments, the rate constants clearly drastically change. For the PFO model, although having the lowest correlation coefficient, k
1 increased. For the MPnO model, an increase in the n-value and a corresponding decrease in k′ can be observed. For the MOE model, k
1 decreased, and there was a corresponding huge increase in k
2. Nevertheless, the above formulated features cannot explain these changes as a function of temperature, indicating a more complex desorption mechanism. The study of the kinetics in the colorimetric method, as well as the compounds involved in the reaction can be very interesting for addressing a strategy of the GAC regeneration process in rum production. A pretreatment using ammonia solution as the extraction solvent prior to thermal regeneration could be an attractive procedure to reduce the energy consumption in the GAC reactivation. The ammonia as a solvent can be easily recovered and reused due to its high volatility and solubility in water. Beyond the practical use of the colorimetric method for determining the exhaustion level of GAC, this method can be potentially applied for the recycling of GAC in rum production.
For all considered temperatures and certainly for the 10 °C experimental conditions, no acceptable data fitting according to the intra-particle diffusion model can be proposed. For the 25 °C and 40 °C data, a fitting can be proposed for the desorption points at the start of the process and at the end of the desorption process (
Table 9,
Figure 13d,e). The results indicated that, as formulated previously, a complex desorption mechanism of the colored compound(s) even in competition with other adsorbed molecules must be proposed, which is clearly temperature dependent.
3.4. Effect of Temperature and Vessel Size on the Ammonia Concentration in the Liquid Phase
Ammonia is a volatile compound and thus in equilibrium with its partial pressure in the gas phase. To that effect, a hermetic capping of the experimental vessel is needed in order to avoid the volatilization of ammonia during the experiment and consequently a reduction of its concentration in the liquid phase, which could affect the final results. However, it was found that the increment of the temperature resulted in a statistical minor effect. Additionally, the free space in the experimental set-up is very small, closed and constant. Therefore, the amount of loss in ammonia can be neglected.
Furthermore, results in
Table 5 indicate the very small effect on the absorption value recorded, when changing drastically the ammonia concentration in the range of 25%–6.25%.
3.5. Experimental Conditions for the Final Proposal of the Colorimetric Method
The same procedure as described in
Section 3.2 can be applied to other GAC, i.e., 3.2 g of GAC is added to 20 mL of 6.25% ammonia solution, gently stirred at 50 rpm in batch conditions at 25 °C for 6 h in a 100-mL capped glass vessel.
Table 10 displays the equilibrium absorption values (
) of the samples. Five experiments were performed, and the statistical parameters were determined. According to the equilibrium absorbance, the samples can be ordered as follows: GAC-1 < GAC-2 < GAC-3 < GAC-4 < GAC-5. This order is consistent with the iodine number, the contact pH, N
2 adsorption/desorption results and the color intensity. The darker the obtained extracted solution was, the more exhausted the GAC.
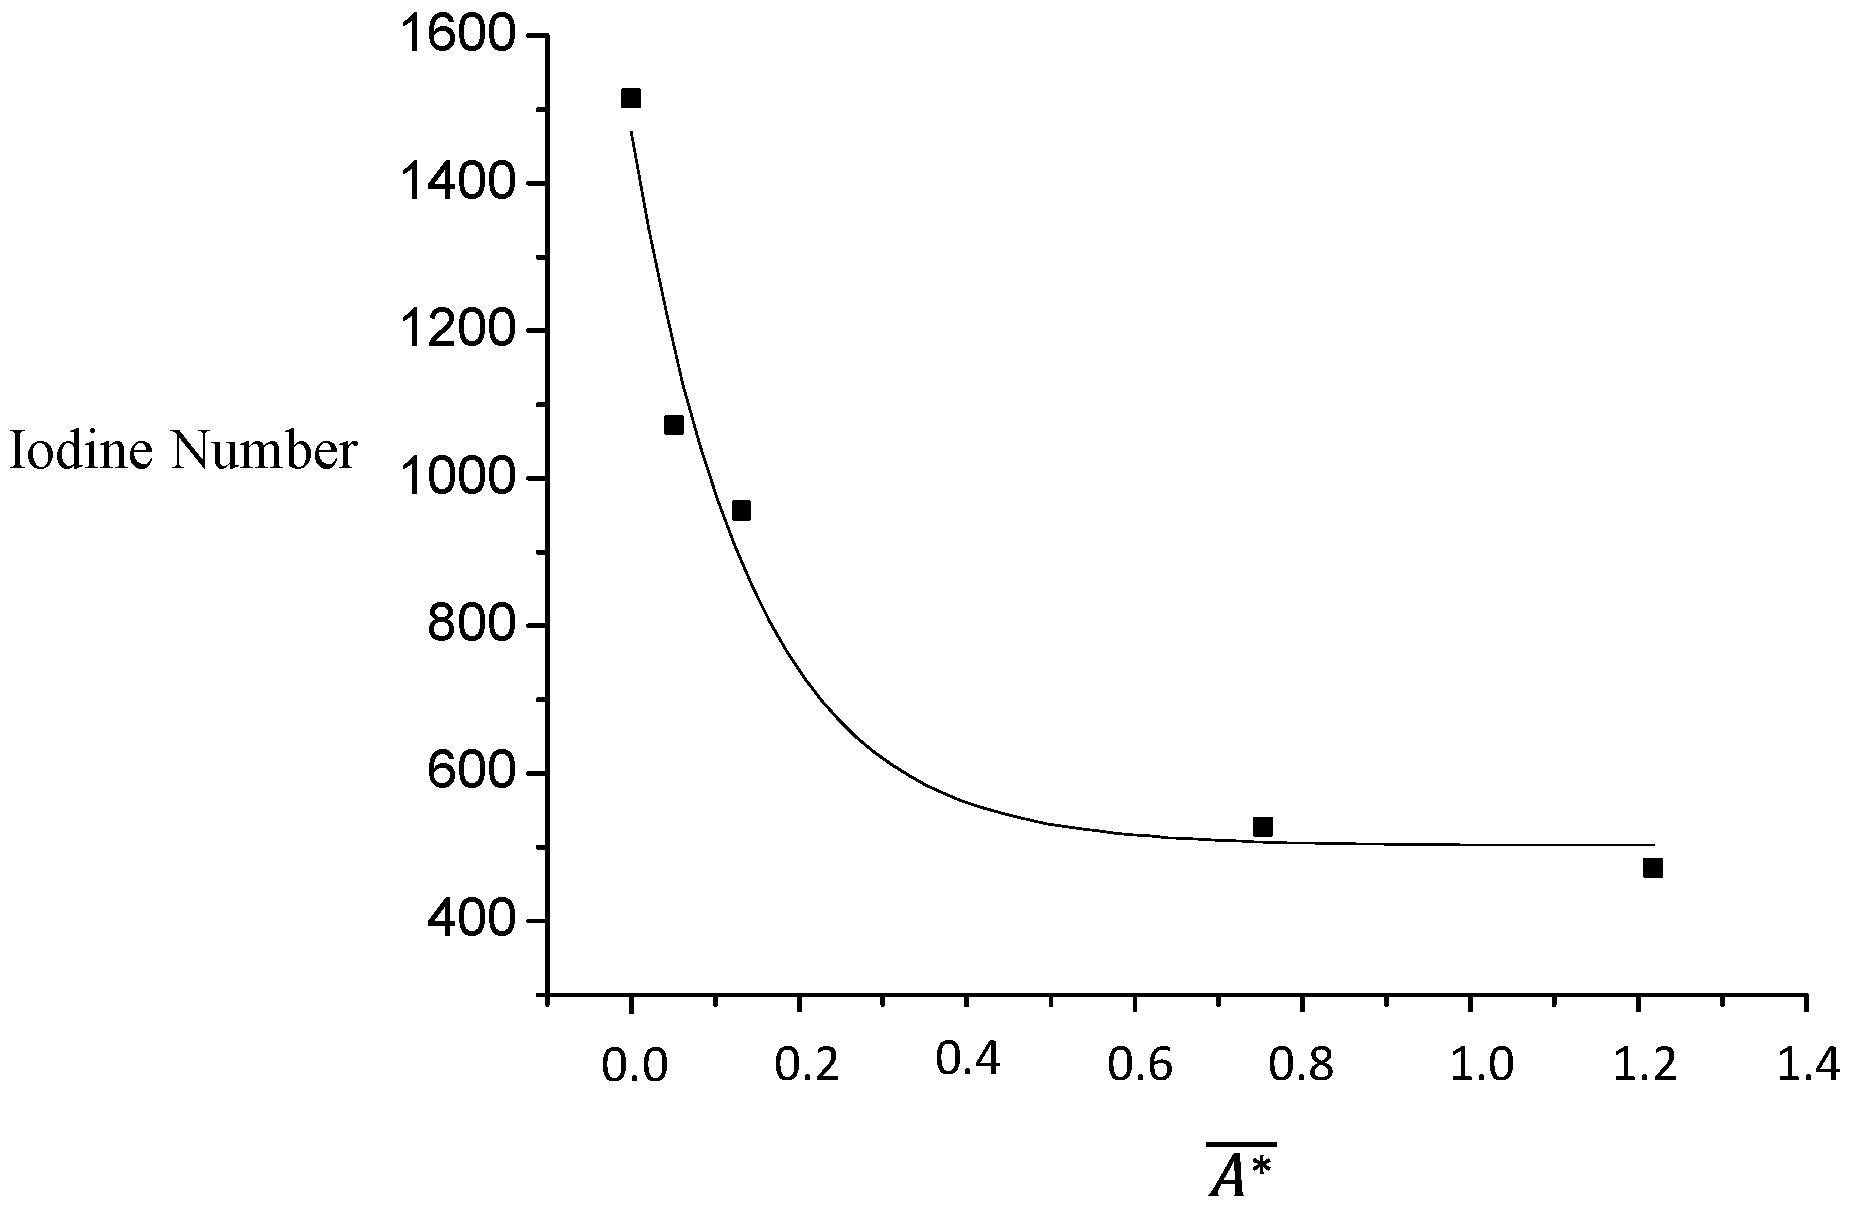
Figure 14 shows the relationship between the equilibrium absorption value and the iodine number. The shape of the curve suggests a non-linear fitting; the parameters could be fitted using models as power or exponential.
However, according to other reports [
39,
40,
41], it is demonstrated that the fraction coverage
of the GAC can be given by:
,
are specific constants, C
i is the concentration of colored compound i.
This has basically the form of the Freundlich isotherm, which often provides a good fit to adsorption/desorption data, especially in liquids [
41].
Considering that the absorption value is linear correlated with C
A,
can be expressed as:
β is a proportional factor.
Applying the logarithm in both terms:
Considering the iodine number (IN) as a quantification of the free pores or available active sites on the GAC surface [
33] and taking GAC-1 (virgin) as the “model GAC” with the maximum of available free space of sites, then for the other used samples (GAC-2–5) the fractional coverage can be expressed as:
with
: IN of the used GAC “
i”; and
: IN of the virgin GAC.
According to the obtained mean of the IN for the samples (
Table 2), the fractional coverage can be calculated as:
Table 11 presents the values of
,
and
for each example. Applying double logarithm arrangement, a quite good linear correlation (
R2 = 0.99) was found for
.
The equation that correlates the fractional coverage and the equilibrium absorption value in the colorimetric method can be expressed as:
The absorption value at equilibrium can thus be used to determine and can be used to determine and quantify the exhaustion level of GAC used in the rum production. This means that for GAC-2, 70.7% of the free space or sites are still unoccupied and that in the case of the GAC-5, this is reduced to only 31.2%.
In other words, using the colorimetric approach, the exhaustion can be quantified. Taking into account that also other compounds are adsorbed and a completely exhausted GAC can be determined using colorimetric measurement, the results can be used to define the end-of-life state of a GAC in the rum production process.
4. Conclusions
The colorimetric method generated an amber color from activated carbon with ammonia solution, which is a useful tool in quantifying the exhaustion level of the GAC. Data obtained with the method correlated with the iodine number, the contact pH and the N2 adsorption/desorption data.
According to the kinetic results, the extraction reaction of the ammonia solution from the GAC demonstrated that the final absorption value at equilibrium was not affected by the applied temperature range of 10–40 °C, nor by the ammonia concentration in the range of 25% down to 6.25%. The optimal measurement conditions were: an ammonia concentration of 6.25%, working temperature of 25 °C and 3.2 g of GAC for 20 mL of ammonia.
The facilities and advantages of all proposed methods for analyzing the exhausted level of GAC form a very interesting complementary analytical technique to characterize GAC used in rum production. The colorimetric method has some advantages in comparison with the iodine number and contact pH methods. To determine the iodine number, GAC must be powdered, and a higher amount of reagents is needed’ more experimental steps are involved, and this is thus more time consuming. Additionally, the experimental error for the iodine number method was higher than the others (around 10%) [
33]. On the other hand, the contact pH method is very simple and had a good confidence limit of around 2.4% [
34]. However, the amount of GAC sample to be tested must be 10 g (dry weight); the results are highly dependent on the working temperature, correct calibration procedure and the quality of the used water.
In contrast, the colorimetric method is fast, specific and requires minimal reactants. It is not affected by changes of temperature or ammonia concentration. The error for the colorimetric method was around 5.3%. Additionally, even only on sight, a quick qualitative inspection of the color intensity can be performed by a simple ammonia extraction test, giving a very fast indication about the exhausted level of the used GAC.


 ,
, 


