
Effects of Pulsatile Flow Rate and Shunt Ratio in Bifurcated Distal Arteries on Hemodynamic Characteristics Involved in Two Patient-Specific Internal Carotid Artery Sidewall Aneurysms: A Numerical Study


Abstract
:1. Introduction
2. Numerical Methodology
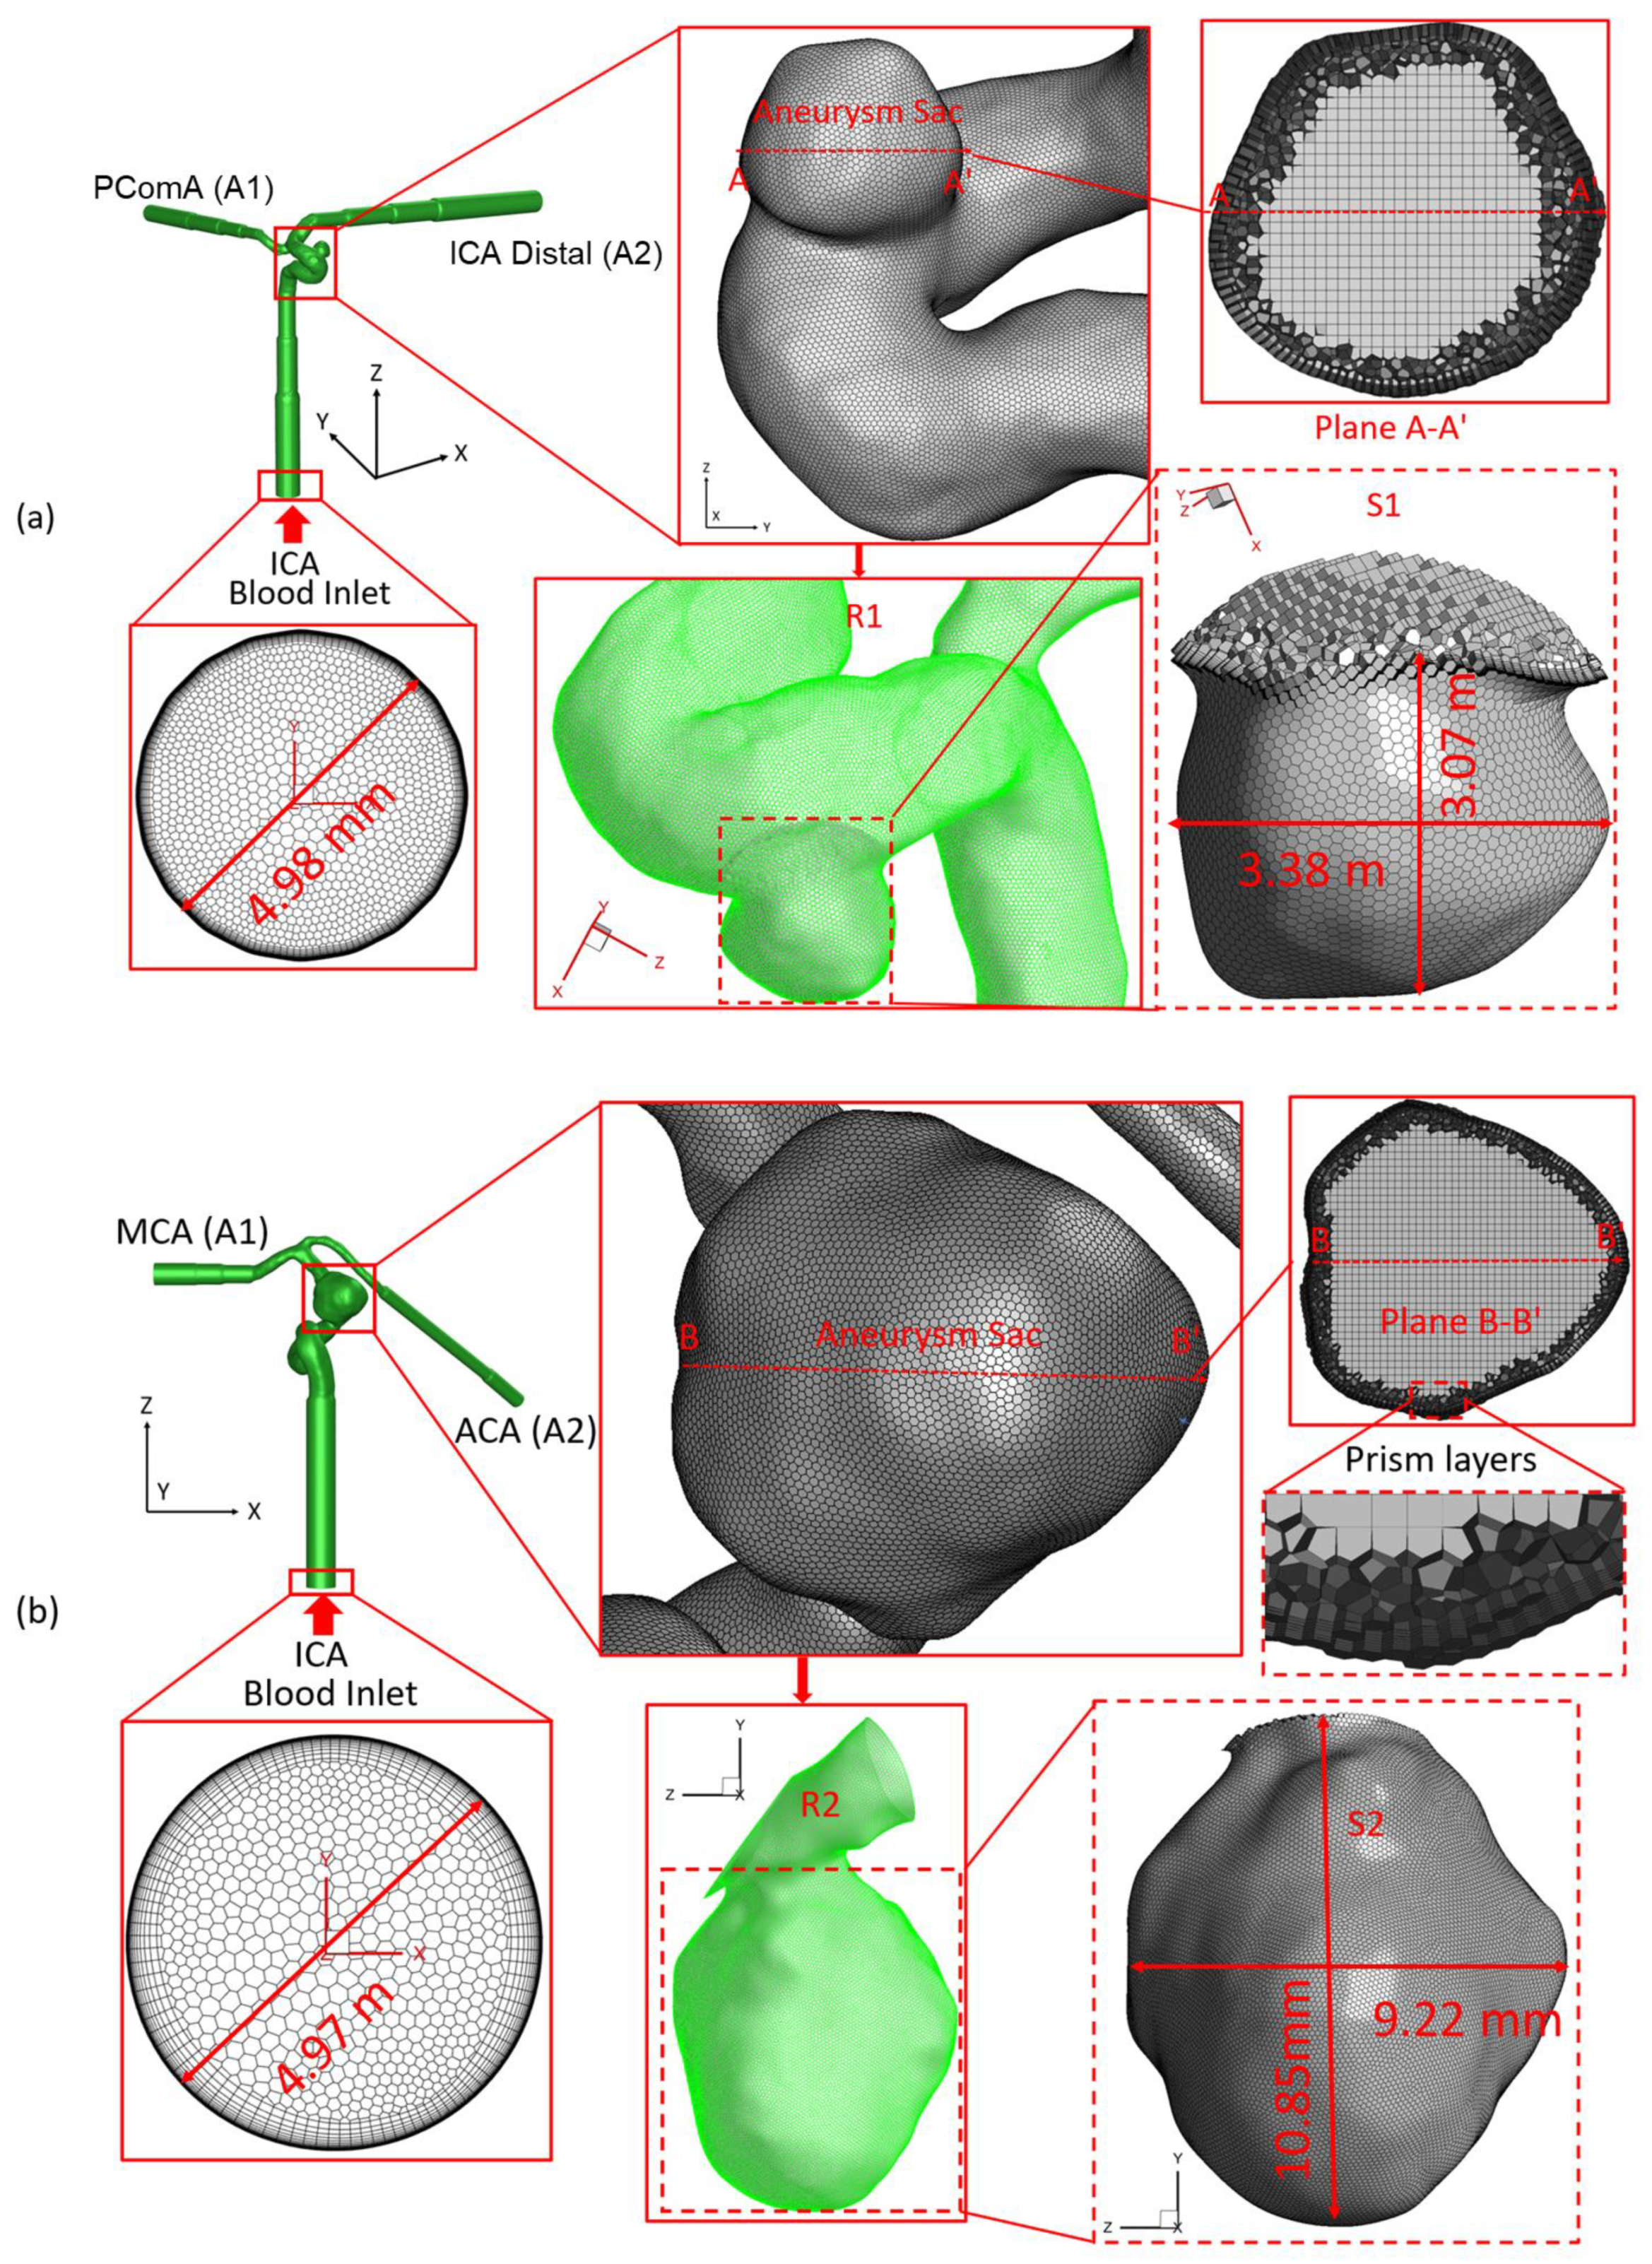
2.1. Geometry and Mesh
2.2. Governing Equations
2.3. Wall Shear Stress ()
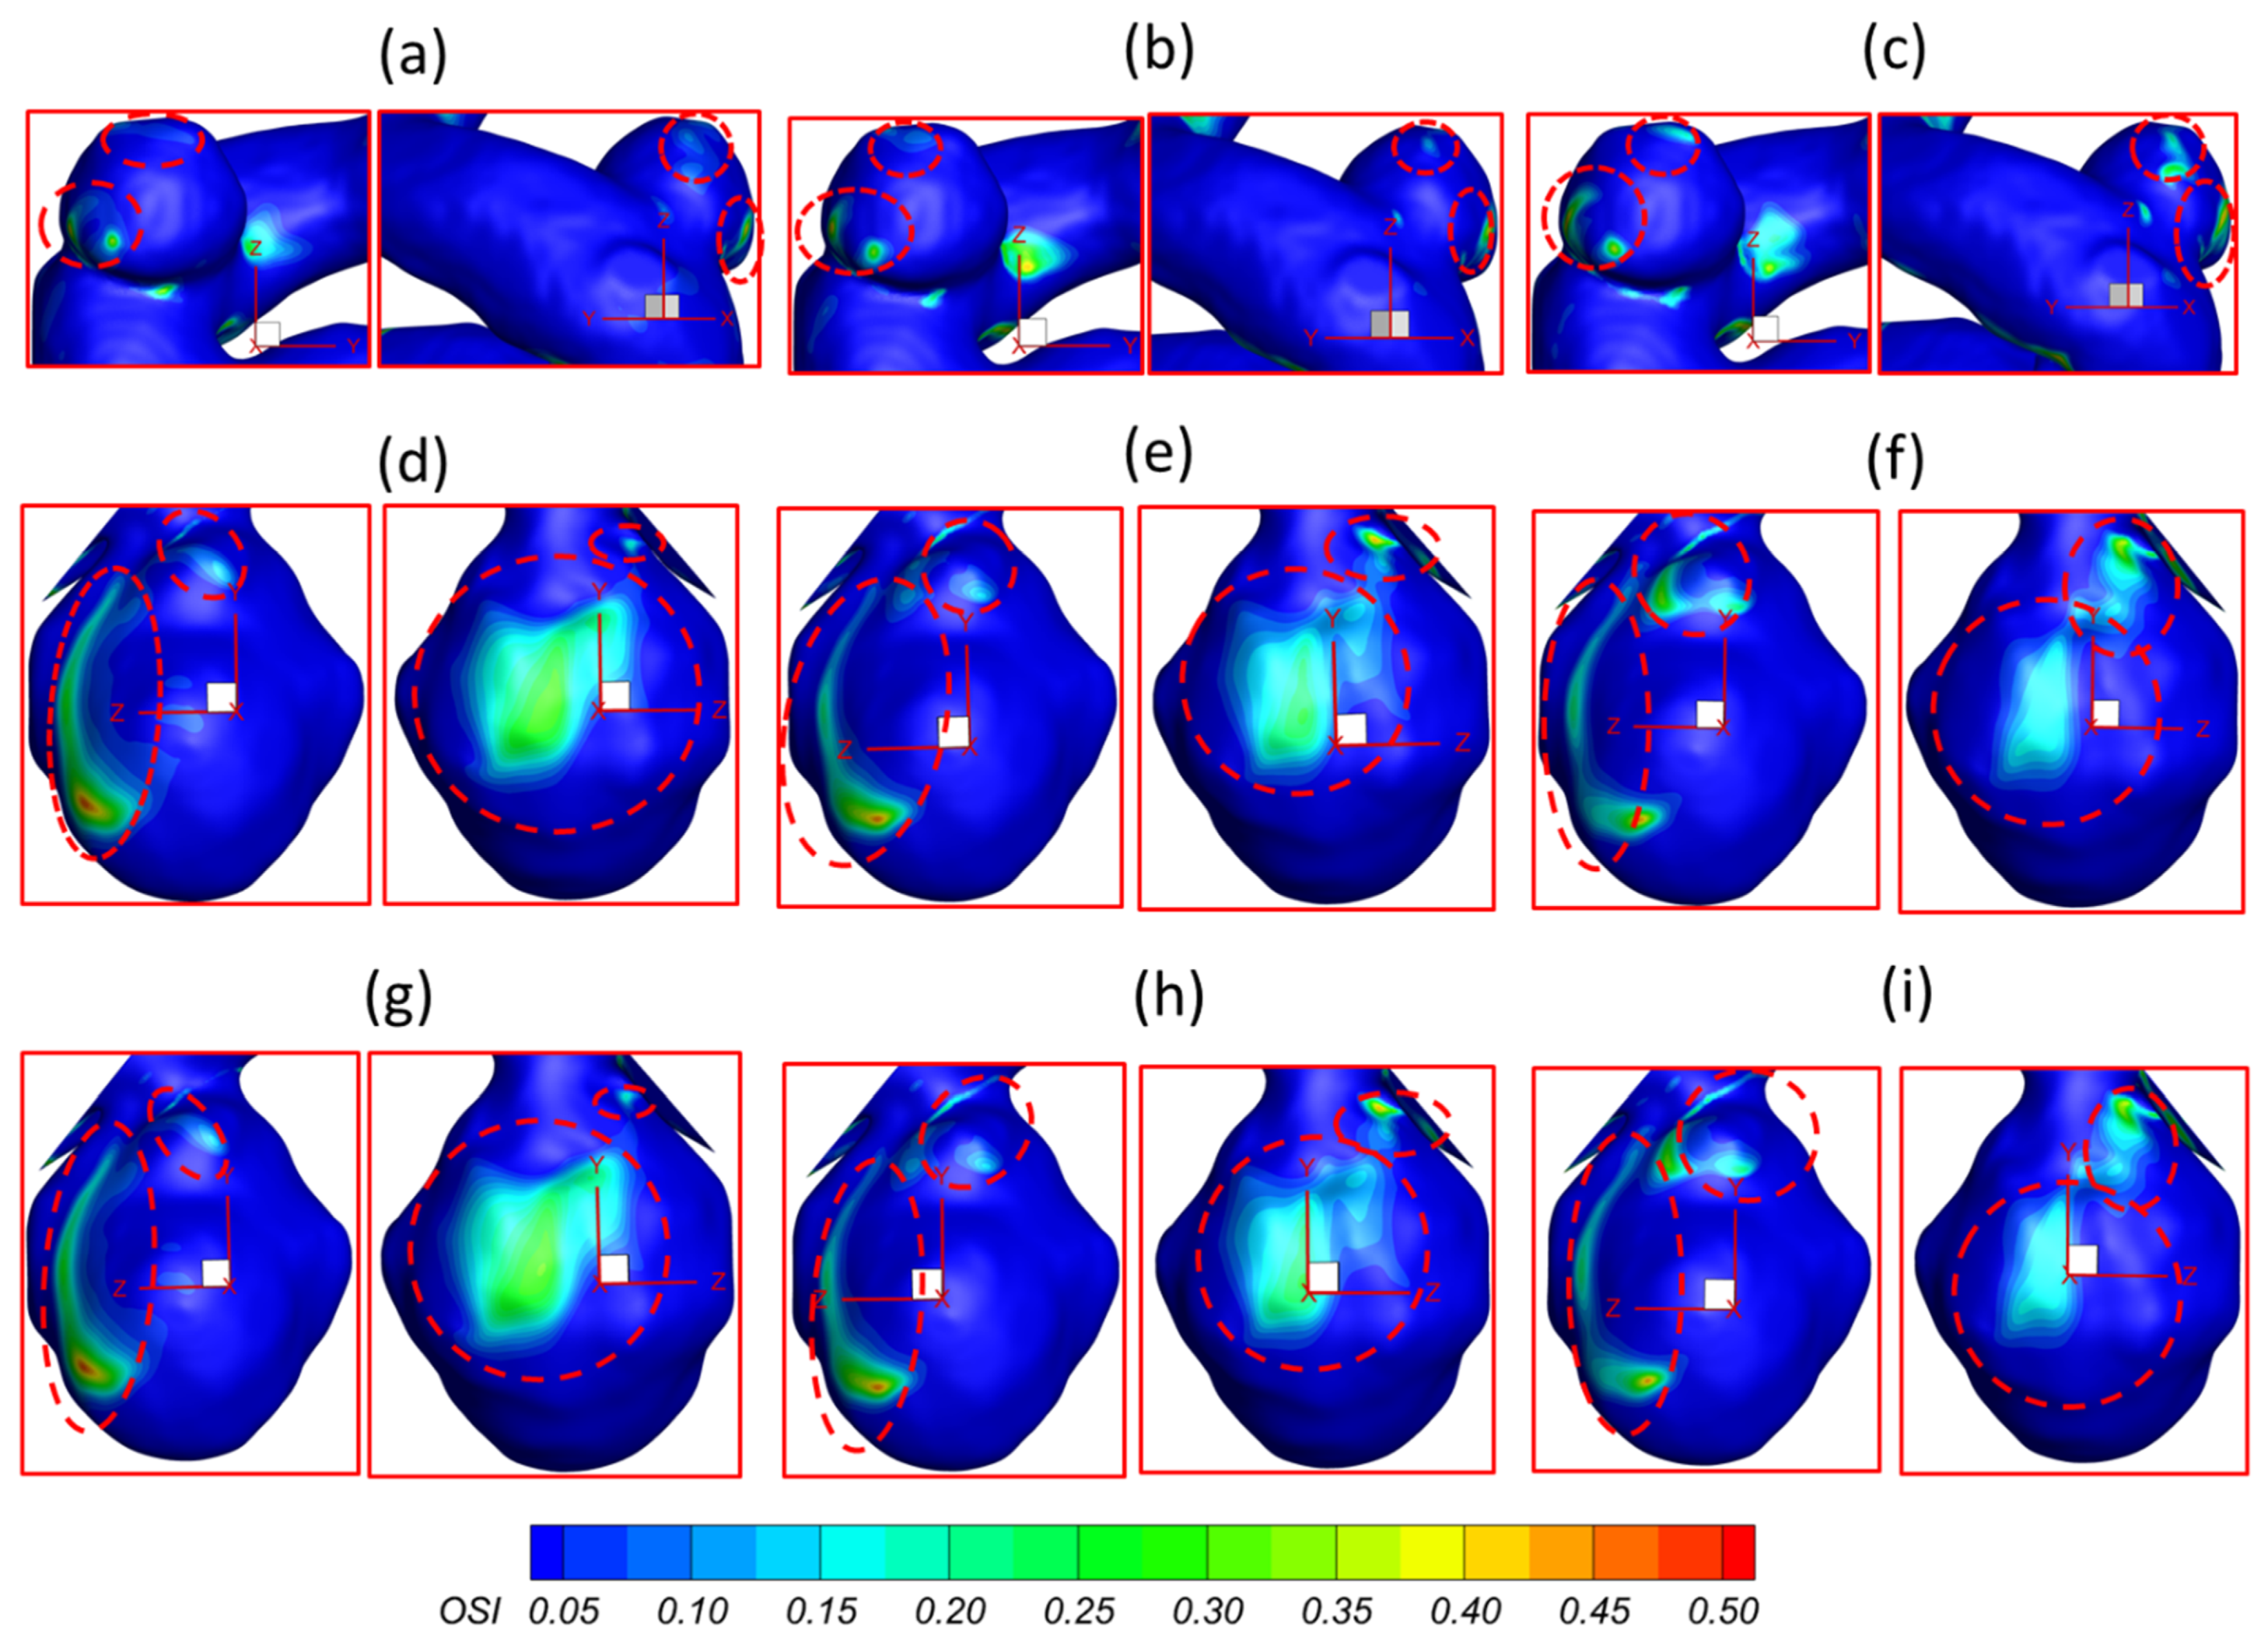
2.4. Oscillatory Shear Index ()
2.5. Time-Averaged Pressure ()
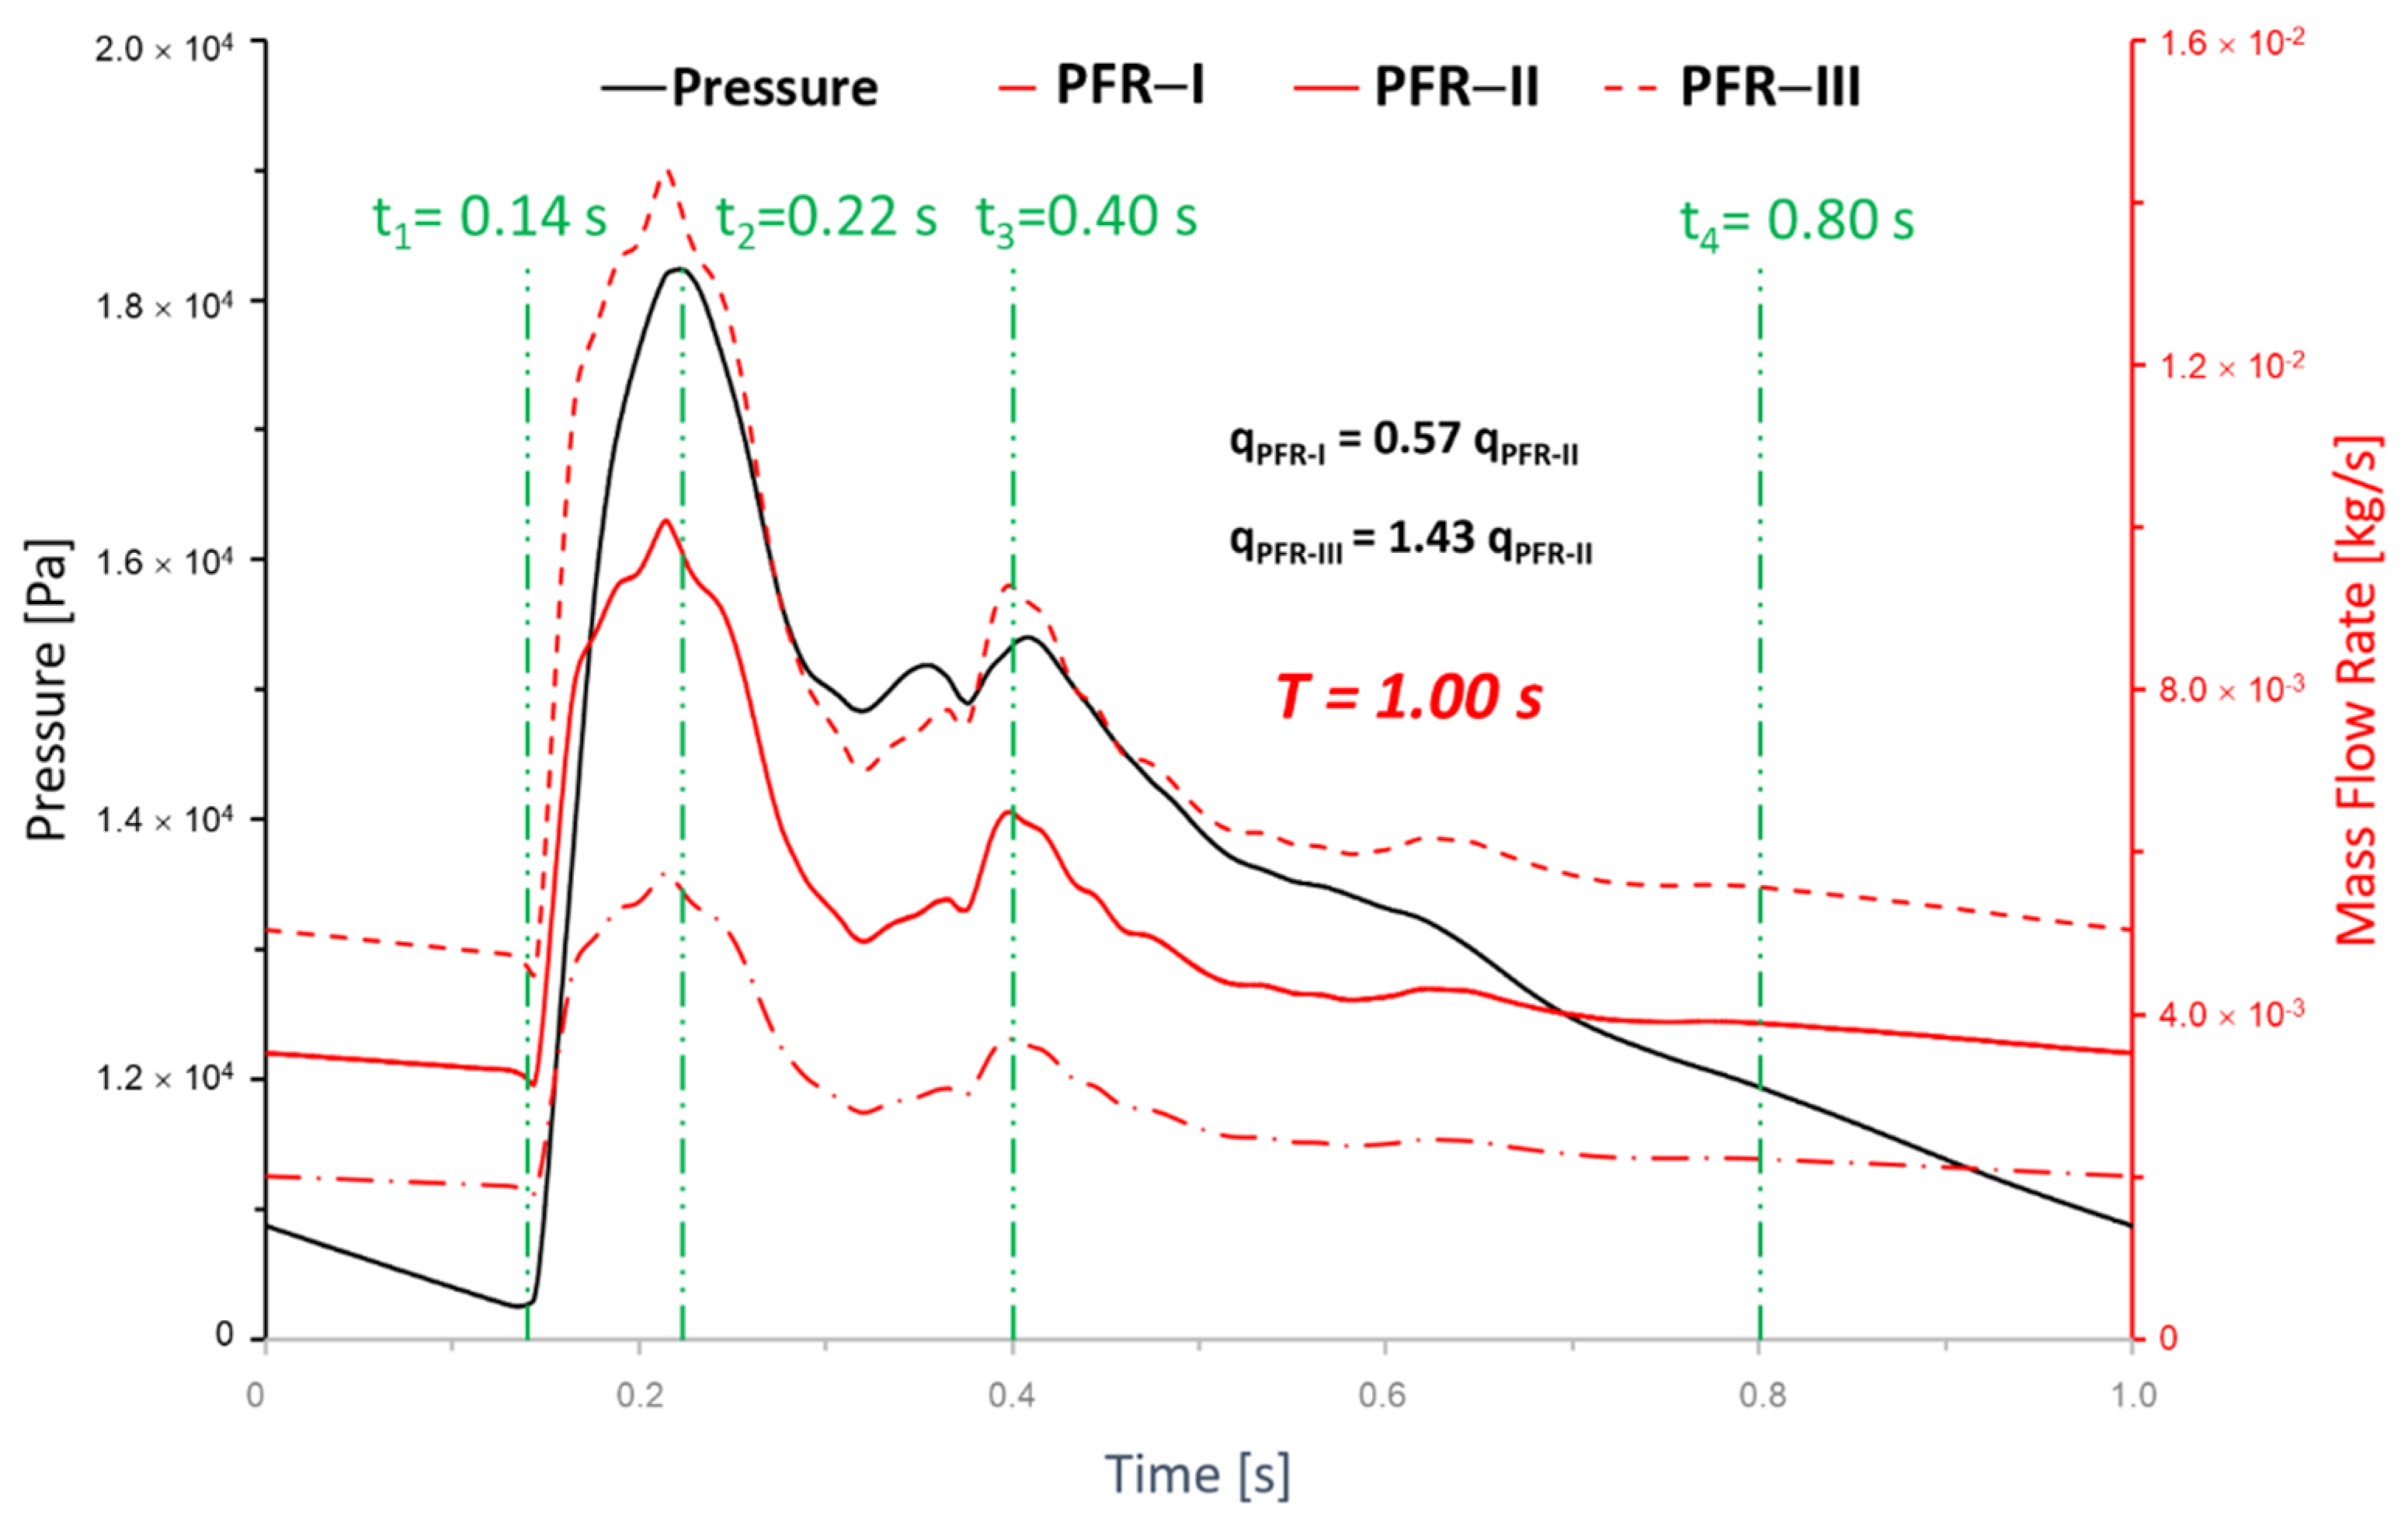
2.6. Boundary and Initial Conditions
2.7. Numerical Settings
3. Results and Discussion
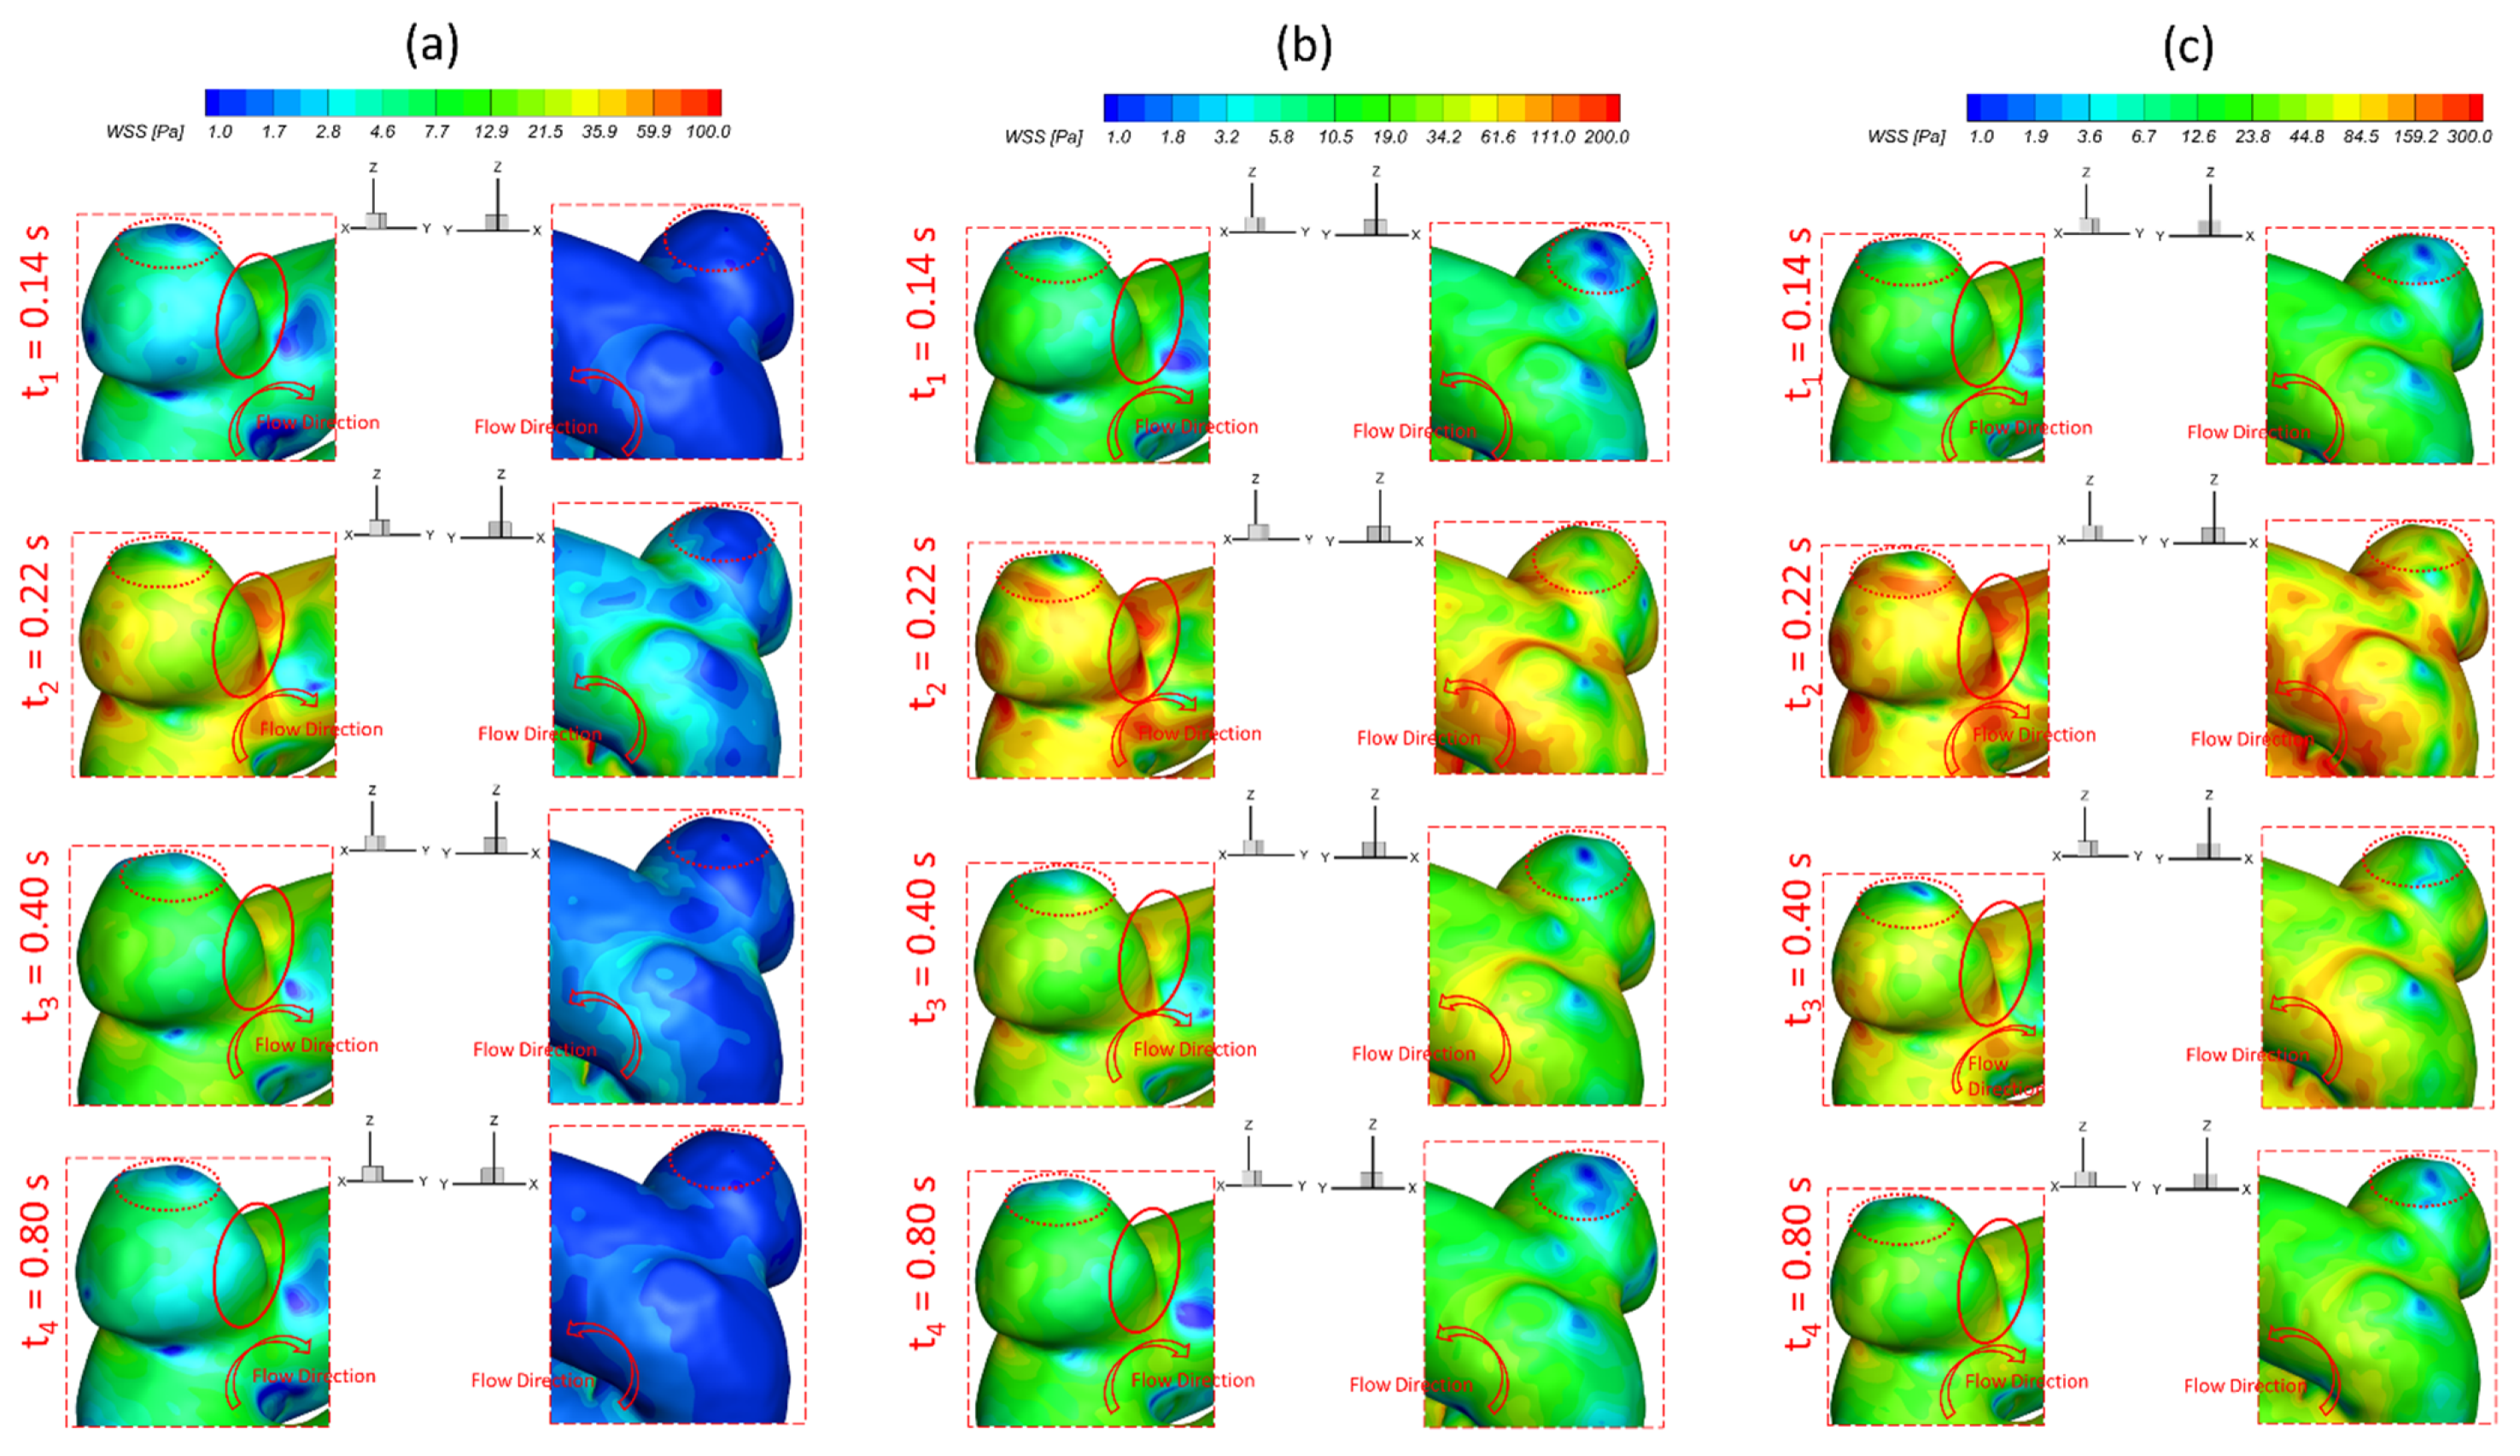
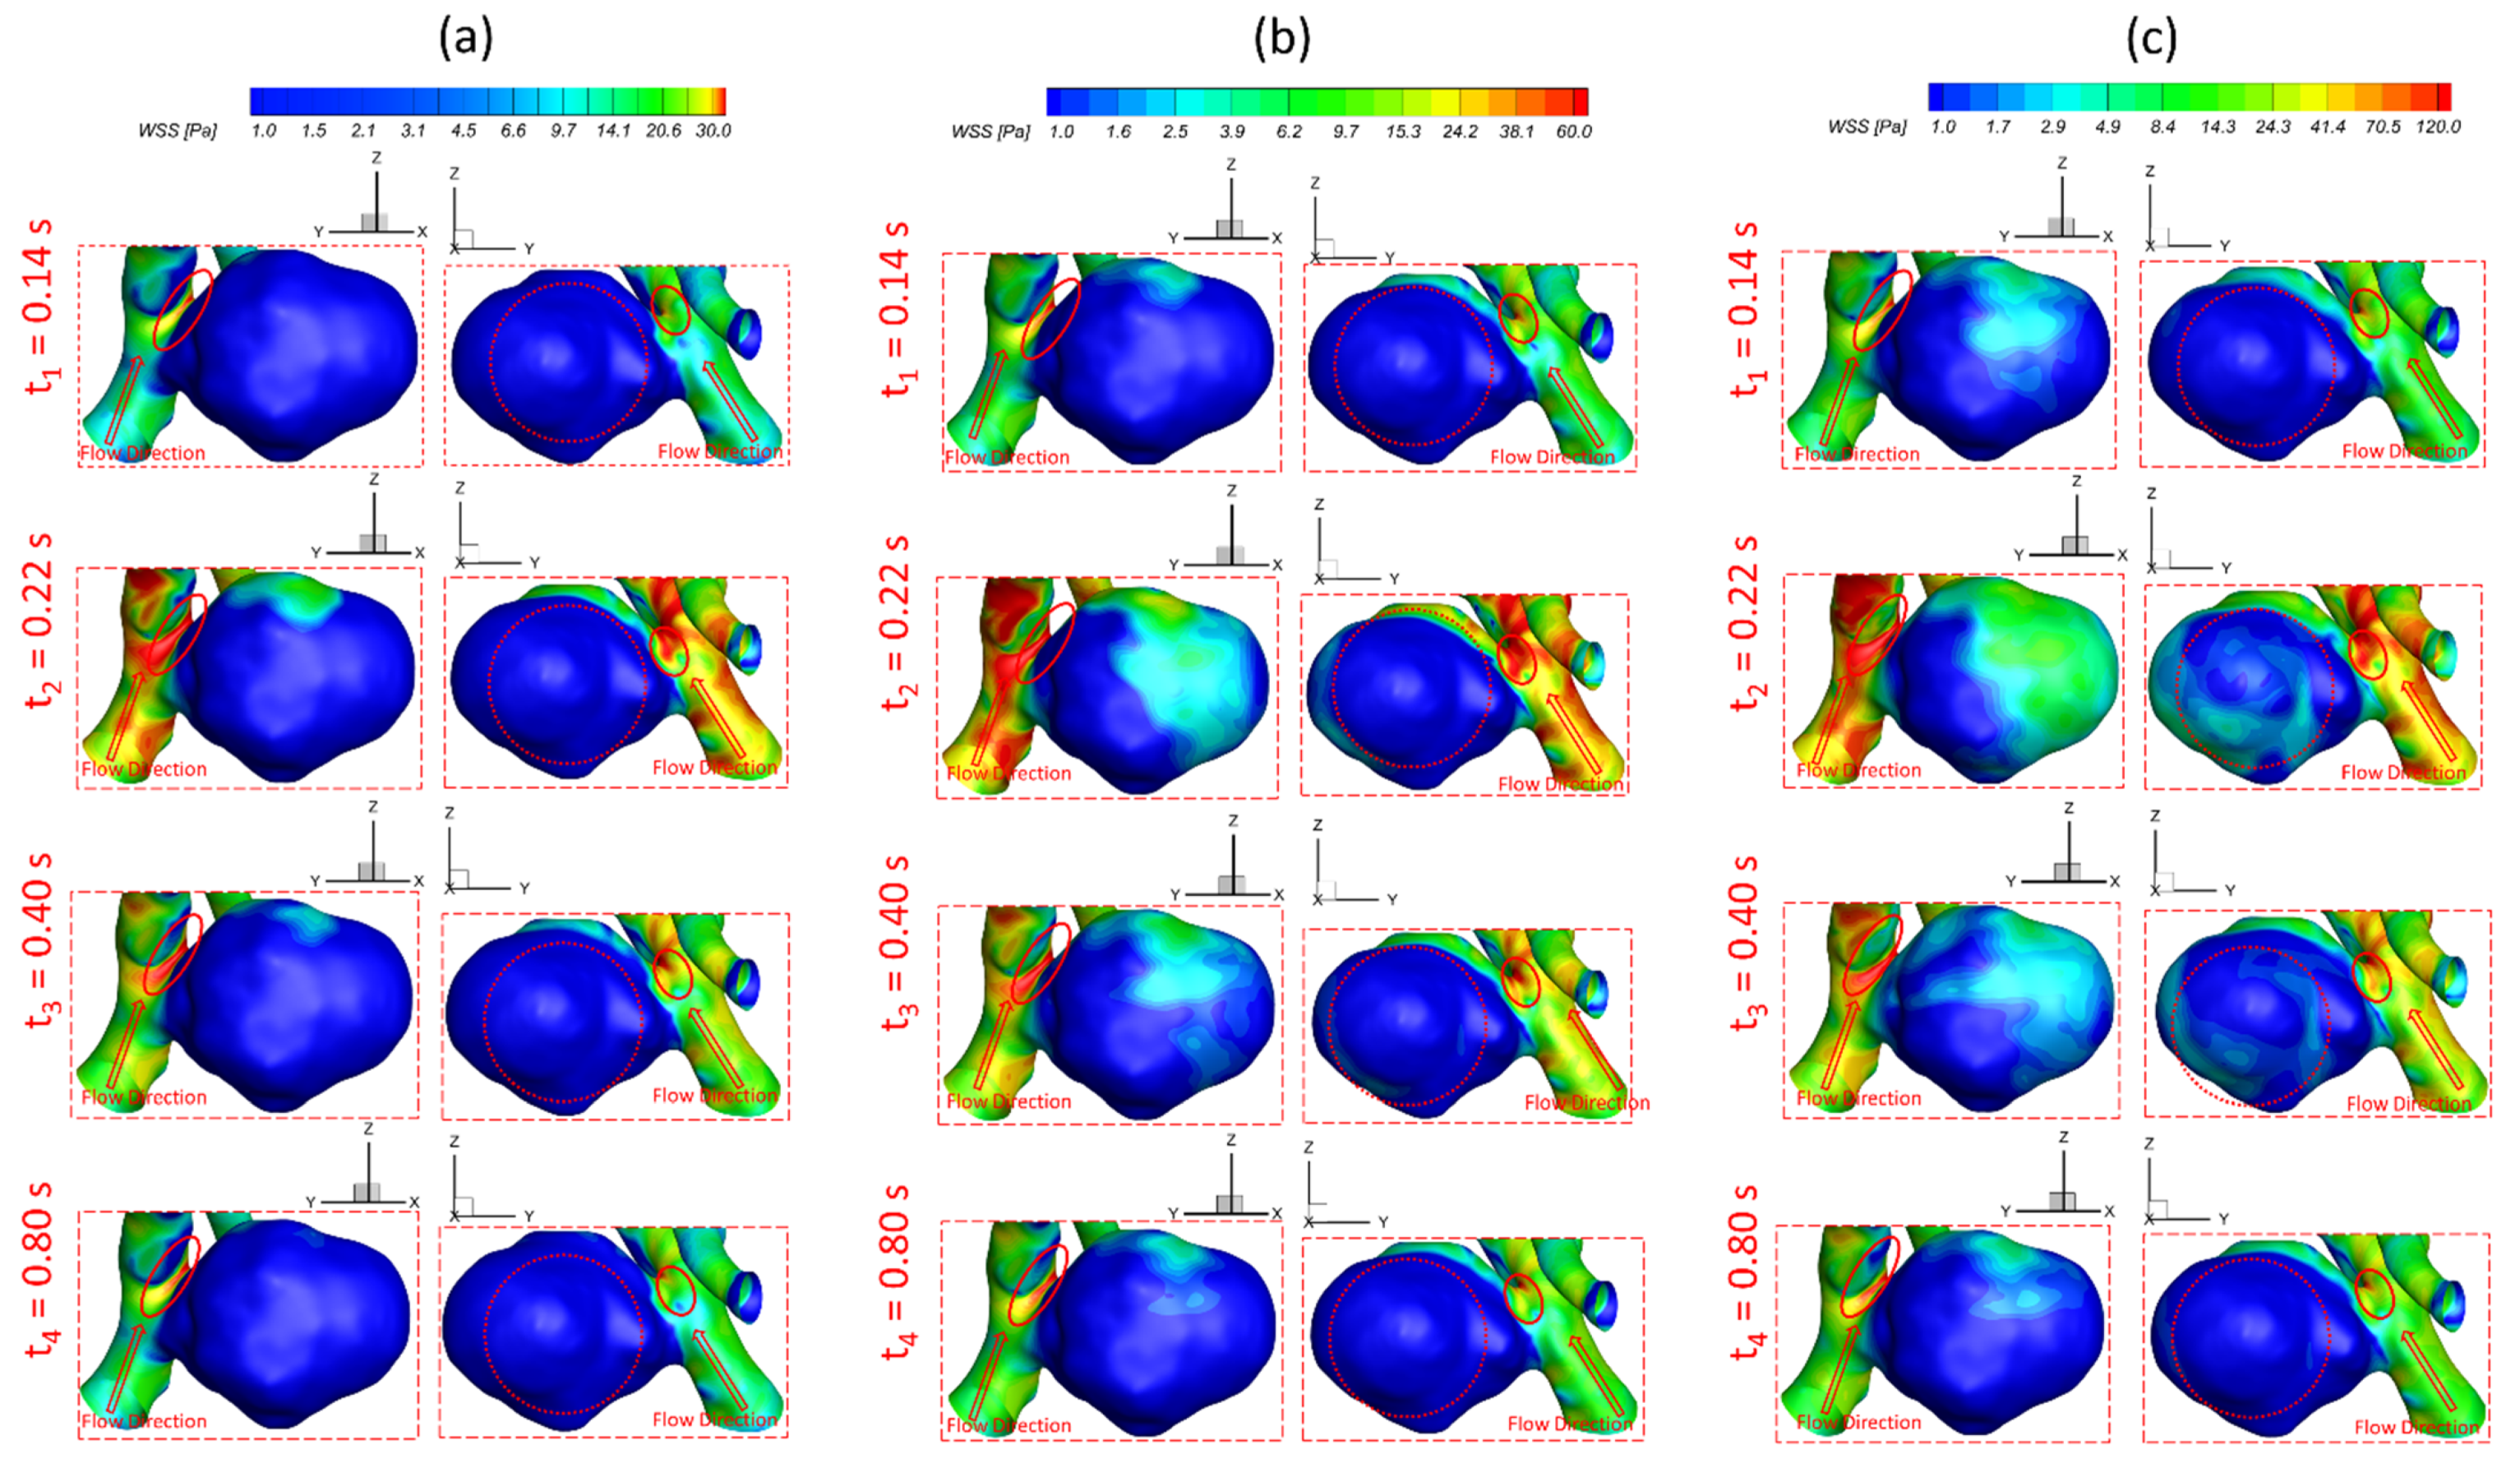
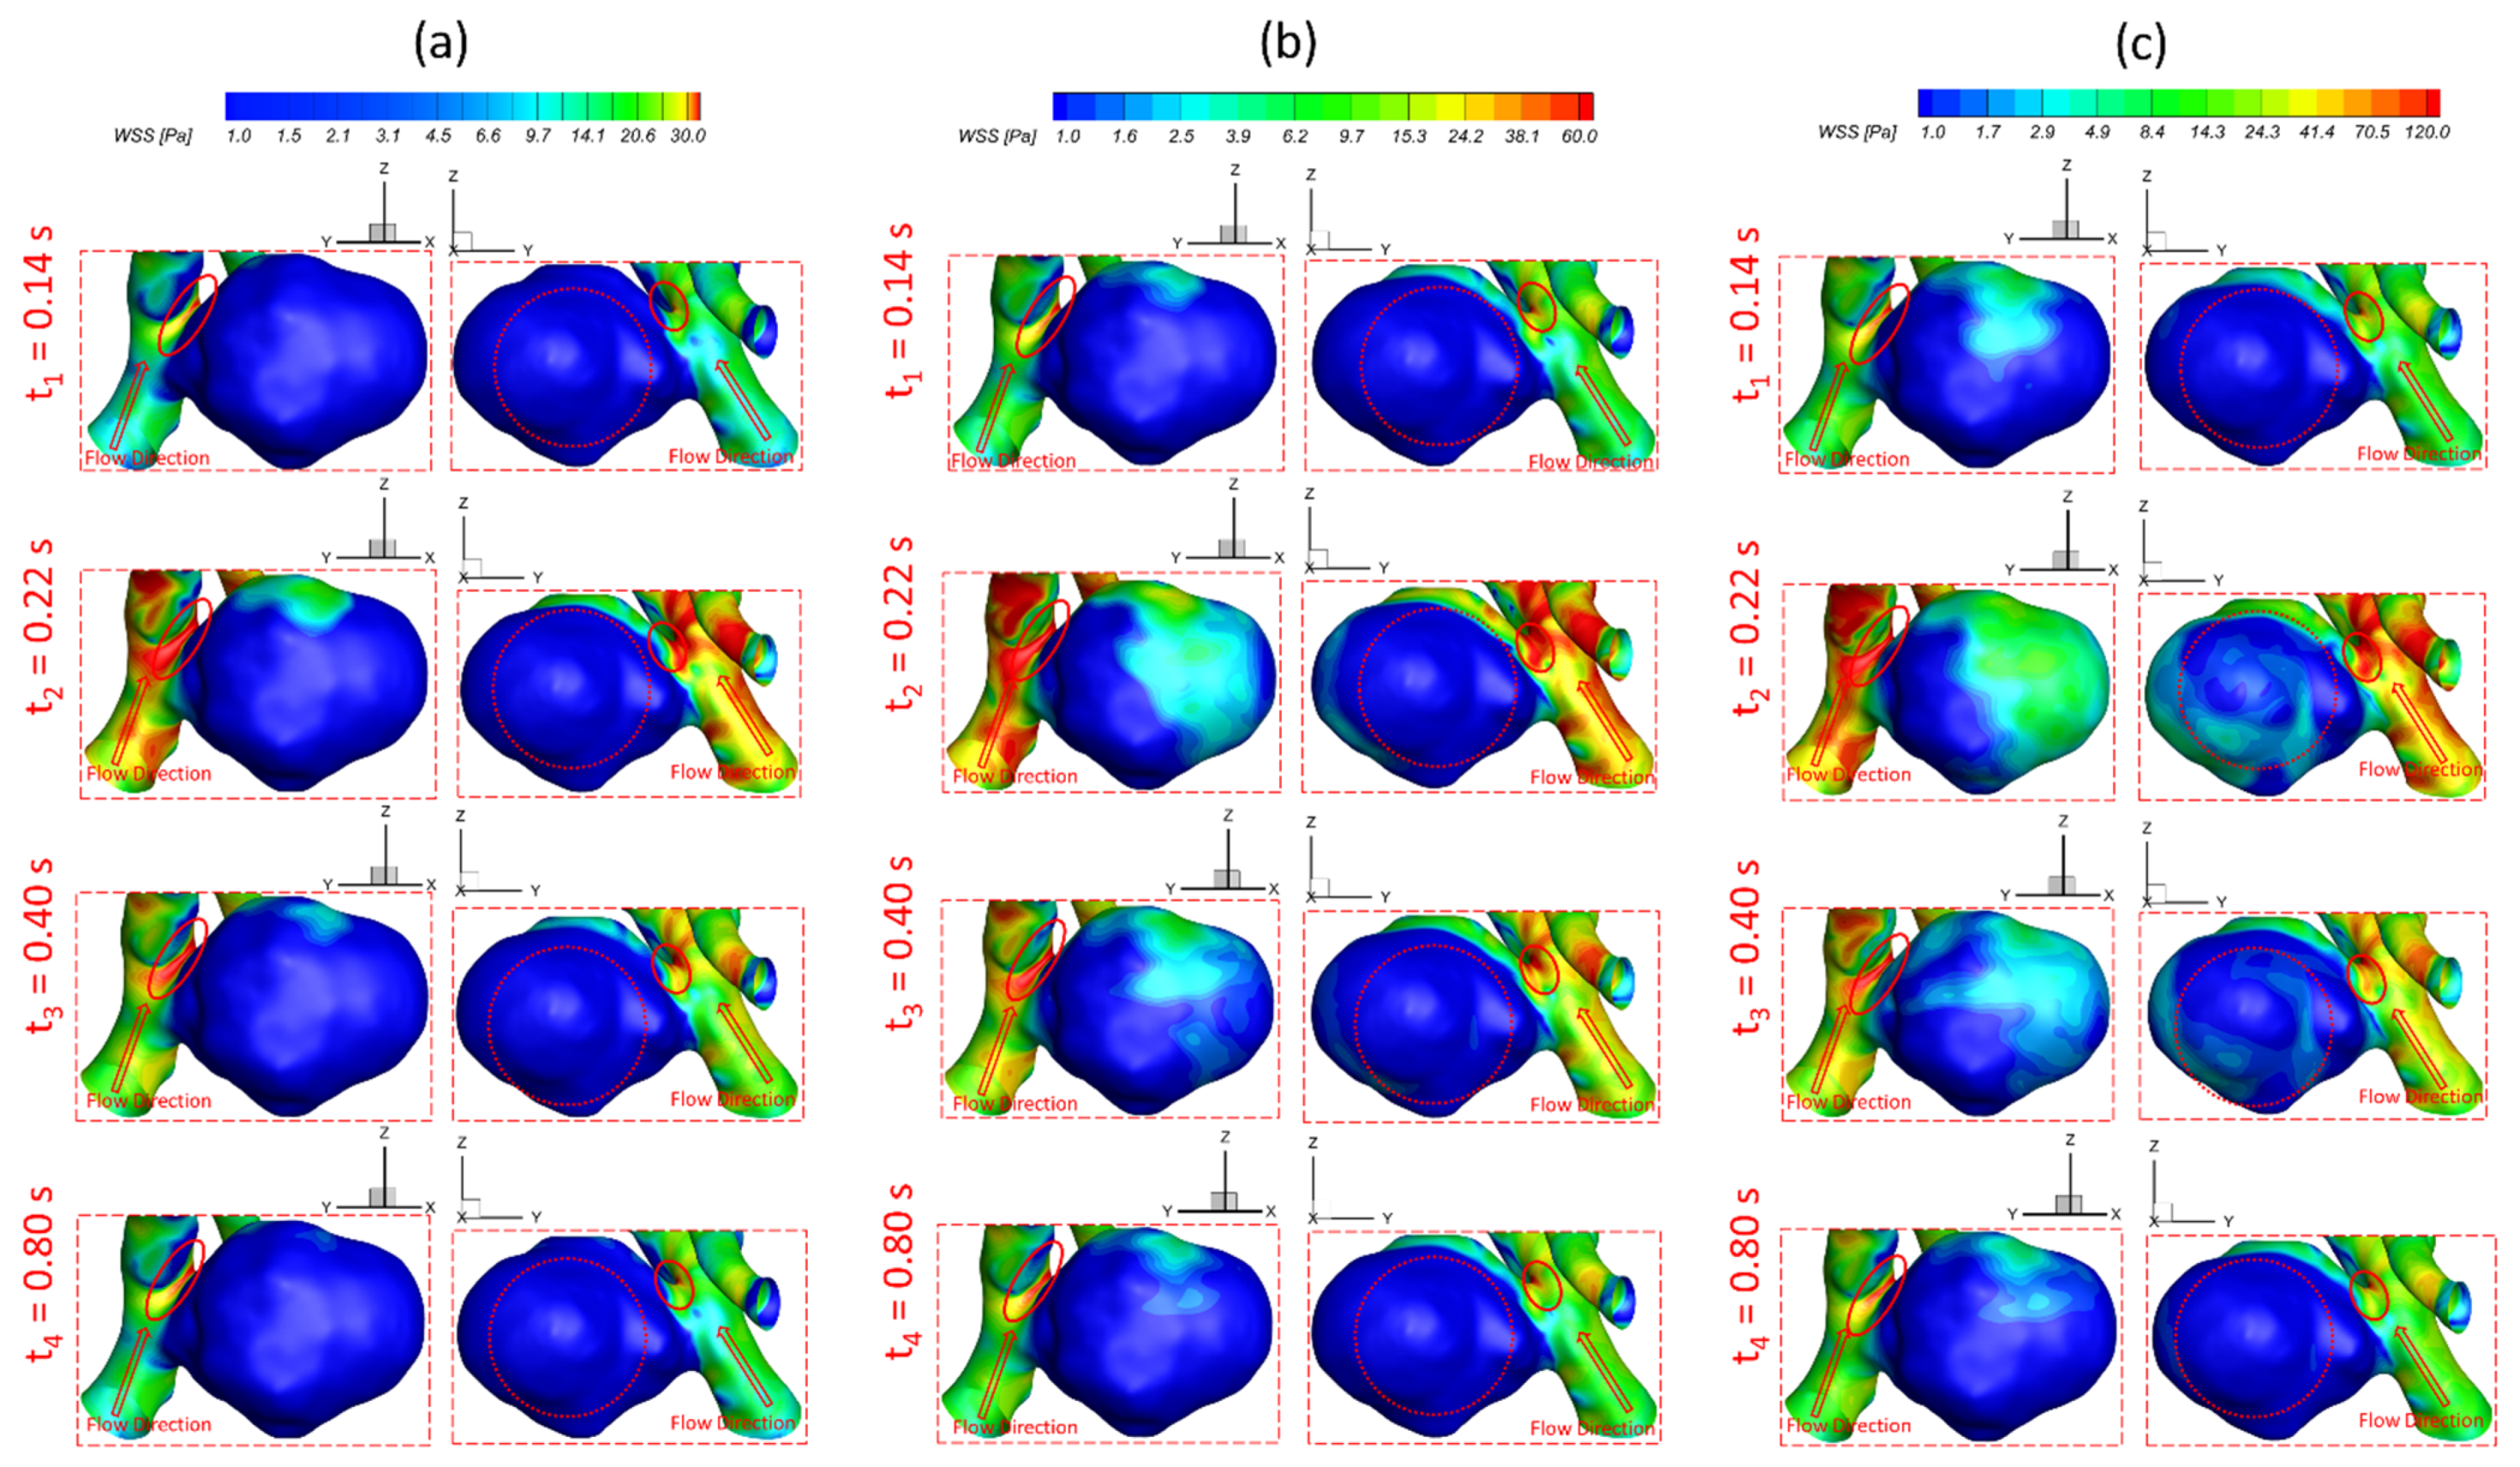
3.1. Effects of Pulsatile Flow Rate
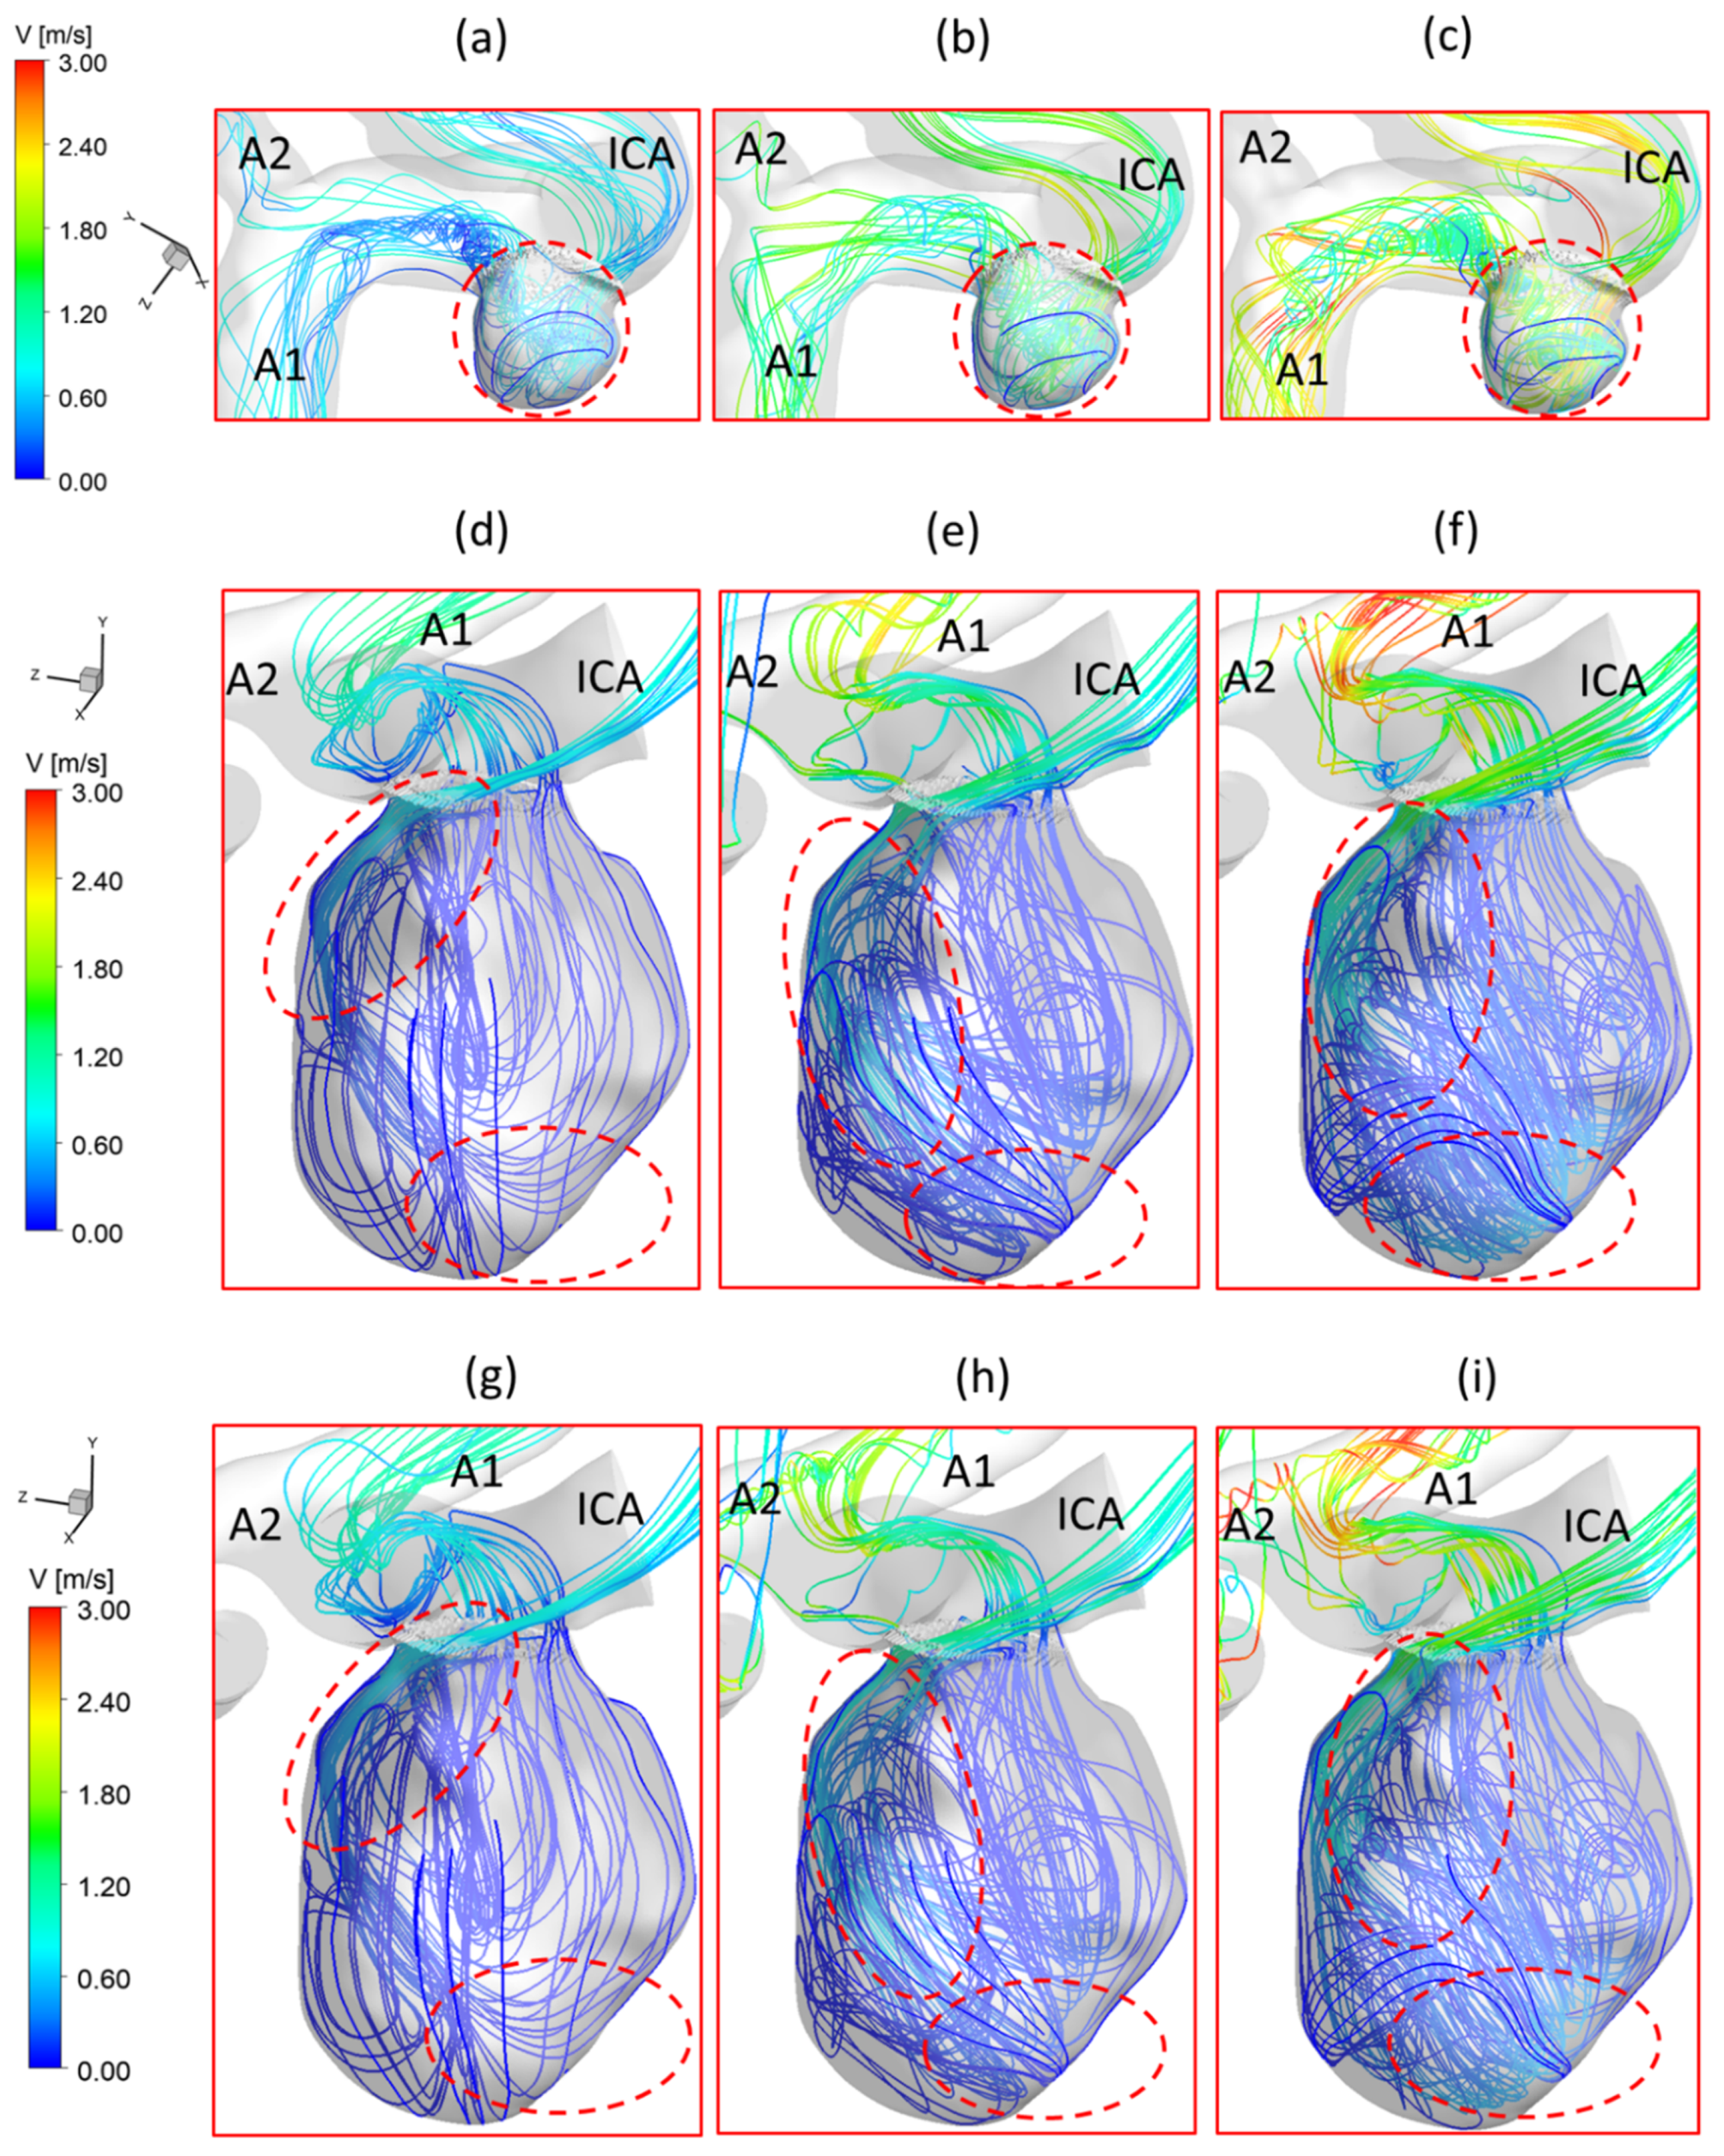
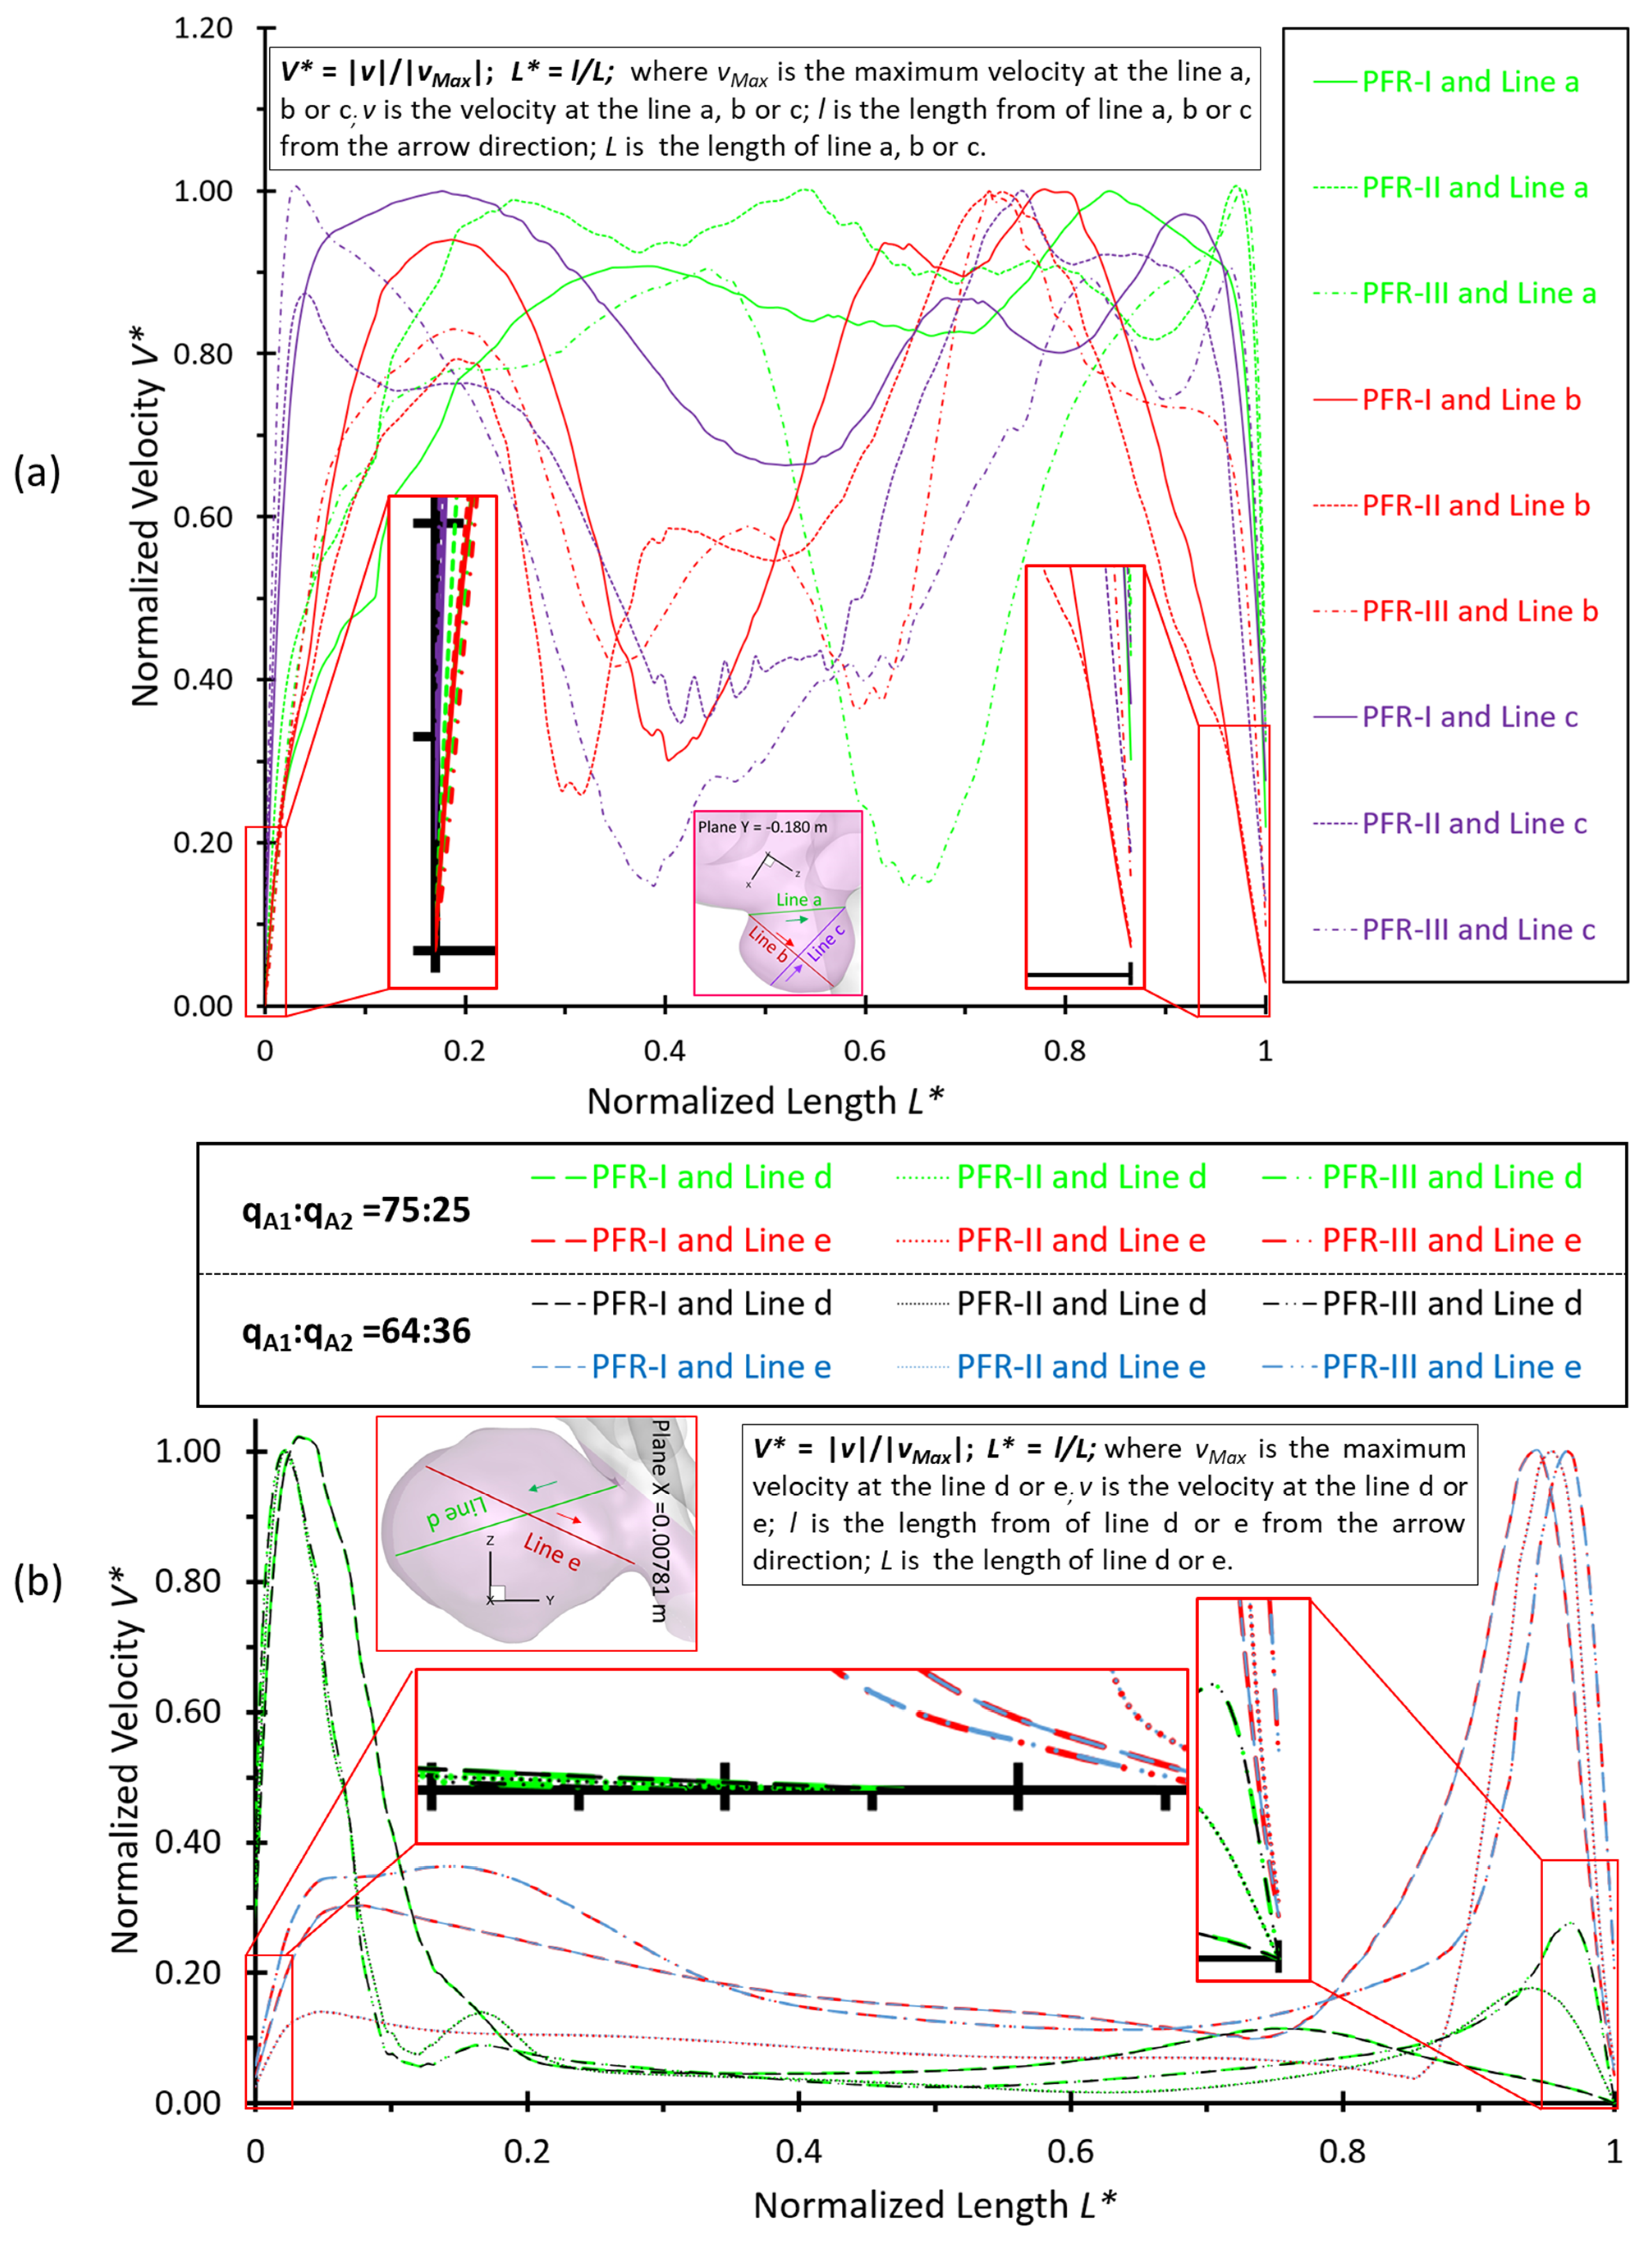
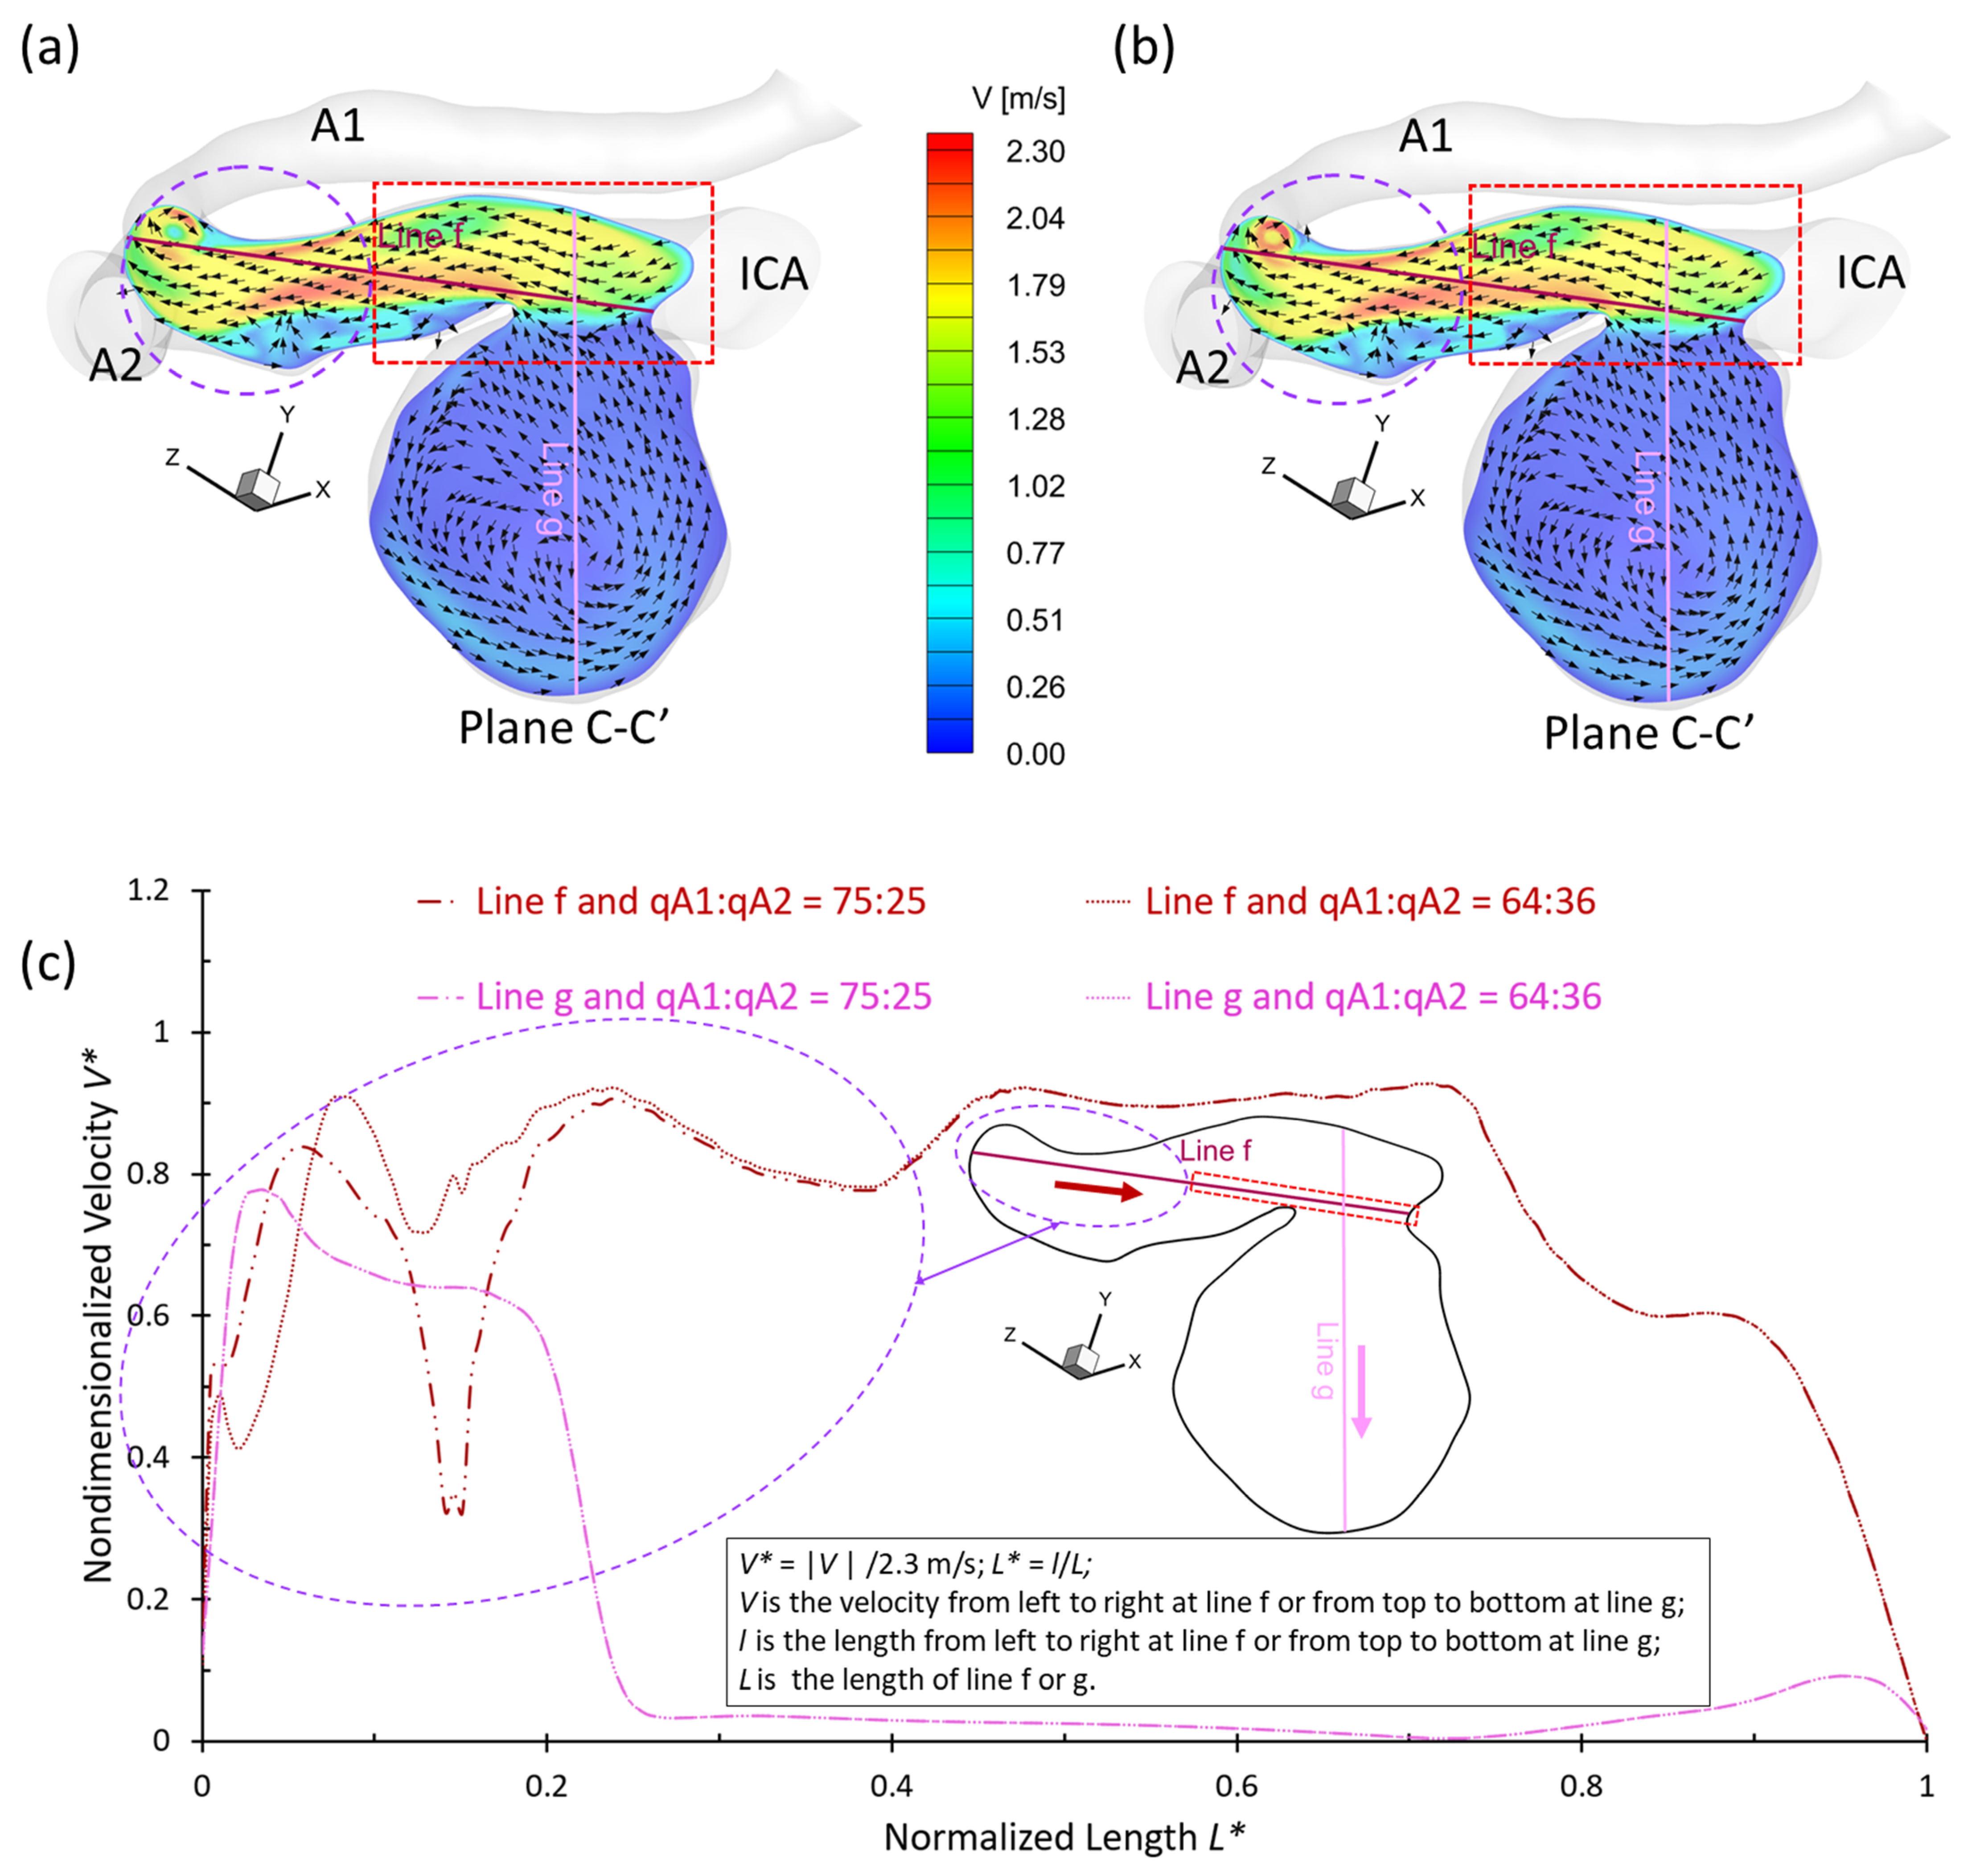
3.2. Effects of Shunt Ratios in Bifurcated Distal Arteries
3.3. Effects of Transitional Pulsatile Blood Flow
4. Conclusions
- The pulsatile flow rate has a significant impact on hemodynamic characteristics in cerebral aneurysms. Larger pulsatile flow rates lead to higher in the aneurysmal region, which may increase the risk of forming small/secondary aneurysms. Although aneurysmal artery walls may suffer lower under a lower pulsatile flow rate, the high distributed in local regions may affect the growth and rupture of cerebral aneurysms.
- The variances of shunt ratios in bifurcated distal arteries have no significant impact on the hemodynamic behaviors in the aneurysmal sac because the distal bifurcated location is not close enough to the aneurysm sac in the ICASA−2 model. We concede that more specific qualitative and quantitative investigations of the effects of bifurcated shunt ratios on flow characteristics in the aneurysmal sac using patient-specific cerebral aneurysms are still needed.
- A higher PFR can contribute more to the pressure increase in the ICASA−1 dome due to the stronger impingement by the splitting bloodstream, while the variances of PFR and shunt ratio in the bifurcated distal arteries have rare impacts on the dome of the ICASA−2 model since only a small part of the bloodstream will be redirected into the sac.
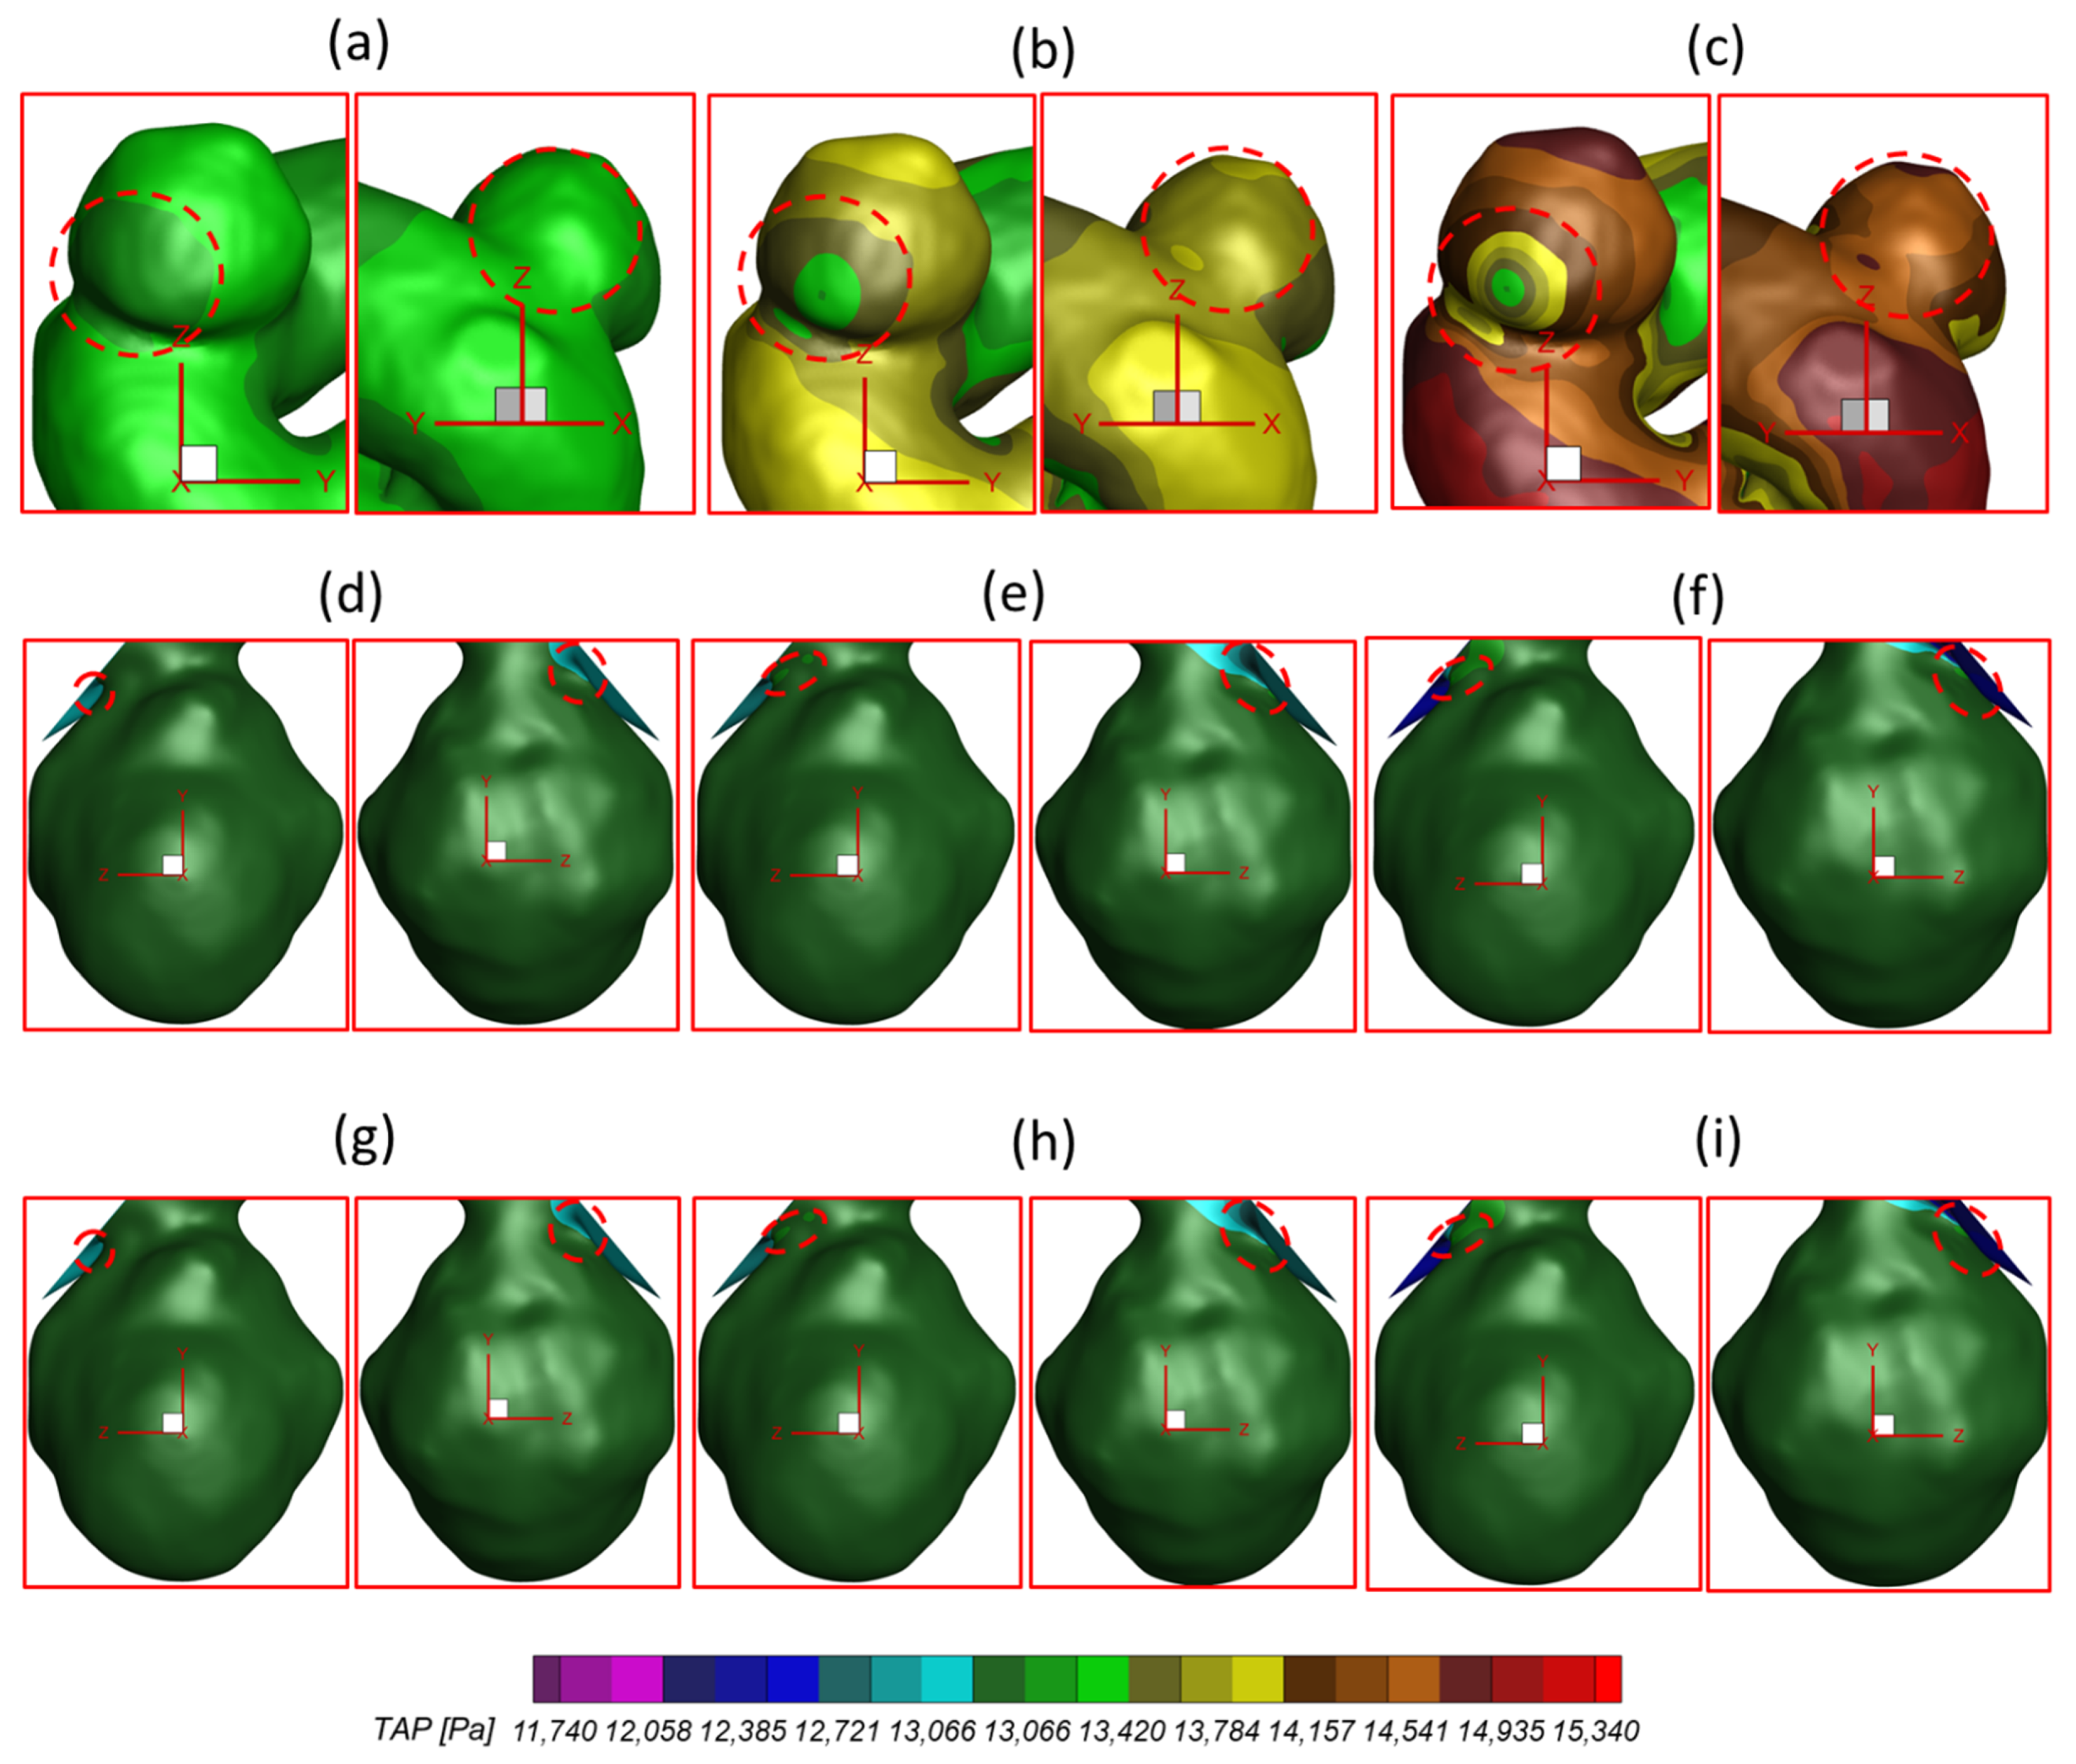
- The regions in the neck of the aneurysmal sac with higher may lead to a high incidence of small/secondary aneurysm generation under all studied pulsatile flow rates and bifurcated shunt ratios. Moreover, some local luminal surfaces on the aneurysmal dome could have a higher probability of enlarging/rupturing, given the evidence of relatively high and low features.
- During one pulse period, the blood flow at the systolic peak can influence the hemodynamic patterns (i.e., and vortex) considerably more than other time instants. The slope of the increase of WSS is beyond the slope of the increase of the blood flow rate, and this phenomenon is more apparent under a smaller PFR.
5. Limitations and Future Work
Author Contributions
Funding
Institutional Review Board Statement
Informed Consent Statement
Data Availability Statement
Acknowledgments
Conflicts of Interest
References
- Cebral, J.R.; Castro, M.A.; Burgess, J.E.; Pergolizzi, R.S.; Sheridan, M.J.; Putman, C.M. Characterization of Cerebral Aneurysms for Assessing Risk of Rupture By Using Patient-Specific Computational Hemodynamics Models. Am. J. Neuroradiol. 2005, 26, 2550–2559. [Google Scholar]
- Weir, B. Unruptured intracranial aneurysms: A review. J. Neurosurg. 2002, 96, 3–42. [Google Scholar] [CrossRef]
- Foutrakis, G.N.; Yonas, H.; Sclabassi, R.J. Saccular Aneurysm Formation in Curved and Bifurcating Arteries. Am. J. Neuroradiol. 1999, 20, 1309–1317. [Google Scholar] [PubMed]
- Moossy, J. Pathology of the Cerebral Blood Vessels. Arch. Neurol. 1973, 28, 284. [Google Scholar] [CrossRef]
- Jabbarli, R.; Reinhard, M.; Roelz, R.; Shah, M.; Niesen, W.D.; Kaier, K.; Taschner, C.; Weyerbrock, A.; Van Velthoven, V. Intracerebral Hematoma Due to Aneurysm Rupture: Are There Risk Factors Beyond Aneurysm Location? Neurosurgery 2016, 78, 813–820. [Google Scholar] [CrossRef] [PubMed]
- Kaminogo, M.; Yonekura, M.; Shibata, S. Incidence and Outcome of Multiple Intracranial Aneurysms in a Defined Population. Stroke 2003, 34, 16–21. [Google Scholar] [CrossRef] [PubMed] [Green Version]
- Linn, F.H.H.; Rinkel, G.J.E.; Algra, A.; Gijn, J.v. Incidence of Subarachnoid Hemorrhage. Stroke 1996, 27, 625–629. [Google Scholar] [CrossRef]
- Winn, H.R.; Jane, J.A.; Taylor, J.; Kaiser, D.; Britz, G.W. Prevalence of asymptomatic incidental aneurysms: Review of 4568 arteriograms. J. Neurosurg. 2002, 96, 43–49. [Google Scholar] [CrossRef]
- Byoun, H.S.; Huh, W.; Oh, C.W.; Bang, J.S.; Hwang, G.; Kwon, O.K. Natural History of Unruptured Intracranial Aneurysms: A Retrospective Single Center Analysis. J. Korean Neurosurg. Soc. 2016, 59, 11–16. [Google Scholar] [CrossRef]
- AANS. Cerebral Aneurysm; American Association of Neurological Surgeons: Rolling Meadows, IL, USA, 2021. [Google Scholar]
- ISOUIAI. Unruptured Intracranial Aneurysms—Risk of Rupture and Risks of Surgical Intervention. N. Engl. J. Med. 1998, 339, 1725–1733. [Google Scholar] [CrossRef] [PubMed]
- Marosfoi, M.; Orrù, E.; Rabinovich, M.; Newman, S.; Patel, N.V.; Wakhloo, A.K. 68-Endovascular Treatment of Intracranial Aneurysms. In Stroke, 7th ed.; Grotta, J.C., Albers, G.W., Broderick, J.P., Day, A.L., Kasner, S.E., Lo, E.H., Sacco, R.L., Wong, L.K.S., Eds.; Elsevier: Philadelphia, PA, USA, 2022; pp. 985–1000.e4. [Google Scholar]
- Cebral, J.R.; Vazquez, M.; Sforza, D.M.; Houzeaux, G.; Tateshima, S.; Scrivano, E.; Bleise, C.; Lylyk, P.; Putman, C.M. Analysis of hemodynamics and wall mechanics at sites of cerebral aneurysm rupture. J. NeuroInterv. Surg. 2015, 7, 530–536. [Google Scholar] [CrossRef] [PubMed]
- Shojima, M.; Oshima, M.; Takagi, K.; Torii, R.; Hayakawa, M.; Katada, K.; Morita, A.; Kirino, T. Magnitude and Role of Wall Shear Stress on Cerebral Aneurysm. Stroke 2004, 35, 2500–2505. [Google Scholar] [CrossRef] [PubMed]
- Papaioannou, T.G.; Stefanadis, C. Vascular wall shear stress: Basic principles and methods. Hell. J. Cardiol. 2005, 46, 9–15. [Google Scholar]
- Meng, H.; Tutino, V.M.; Xiang, J.; Siddiqui, A. High WSS or Low WSS? Complex Interactions of Hemodynamics with Intracranial Aneurysm Initiation, Growth, and Rupture: Toward a Unifying Hypothesis. Am. J. Neuroradiol. 2014, 35, 1254–1262. [Google Scholar] [CrossRef] [Green Version]
- Sadasivan, C.; Fiorella, D.J.; Woo, H.H.; Lieber, B.B. Physical Factors Effecting Cerebral Aneurysm Pathophysiology. Ann. Biomed. Eng. 2013, 41, 1347–1365. [Google Scholar] [CrossRef]
- Jeong, W.; Rhee, K. Hemodynamics of Cerebral Aneurysms: Computational Analyses of Aneurysm Progress and Treatment. Comput. Math. Methods Med. 2012, 2012, 782801. [Google Scholar] [CrossRef] [PubMed]
- Sheikh, M.A.A.; Shuib, A.S.; Mohyi, M.H.H. A review of hemodynamic parameters in cerebral aneurysm. Interdiscip. Neurosurg. 2020, 22, 100716. [Google Scholar] [CrossRef]
- Sforza, D.M.; Putman, C.M.; Cebral, J.R. Hemodynamics of Cerebral Aneurysms. Annu. Rev. Fluid Mech. 2009, 41, 91–107. [Google Scholar] [CrossRef] [Green Version]
- Yu, W.; Huang, Y.; Zhang, X.; Luo, H.; Chen, W.; Jiang, Y.; Cheng, Y. Effectiveness comparisons of drug therapies for postoperative aneurysmal subarachnoid hemorrhage patients: Network meta-analysis and systematic review. BMC Neurol. 2021, 21, 294. [Google Scholar] [CrossRef]
- Nieuwkamp, D.J.; Setz, L.E.; Algra, A.; Linn, F.H.H.; de Rooij, N.K.; Rinkel, G.J.E. Changes in case fatality of aneurysmal subarachnoid haemorrhage over time, according to age, sex, and region: A meta-analysis. Lancet Neurol. 2009, 8, 635–642. [Google Scholar] [CrossRef]
- Nixon, A.M.; Gunel, M.; Sumpio, B.E. The critical role of hemodynamics in the development of cerebral vascular disease: A review. J. Neurosurg. JNS 2010, 112, 1240–1253. [Google Scholar] [CrossRef]
- Aoki, T.; Nishimura, M. The Development and the Use of Experimental Animal Models to Study the Underlying Mechanisms of CA Formation. J. Biomed. Biotechnol. 2011, 2011, 535921. [Google Scholar] [CrossRef] [PubMed] [Green Version]
- Fennell, V.S.; Kalani, M.Y.S.; Atwal, G.; Martirosyan, N.L.; Spetzler, R.F. Biology of Saccular Cerebral Aneurysms: A Review of Current Understanding and Future Directions. Front. Surg. 2016, 3, 00043. [Google Scholar] [CrossRef] [PubMed] [Green Version]
- Zarrinkoob, L.; Ambarki, K.; Wåhlin, A.; Birgander, R.; Eklund, A.; Malm, J. Blood Flow Distribution in Cerebral Arteries. J. Cereb. Blood Flow Metab. 2015, 35, 648–654. [Google Scholar] [CrossRef] [PubMed] [Green Version]
- Enzmann, D.R.; Ross, M.R.; Marks, M.P.; Pelc, N.J. Blood flow in major cerebral arteries measured by phase-contrast cine MR. Am. J. Neuroradiol. 1994, 15, 123–129. [Google Scholar] [PubMed]
- Sekhane, D.; Mansour, K. Quantification of the Effects of the Inlet Waveform on Hemodynamics Inside Internal Carotid Arteries Using Computational Fluid Dynamics. Sci. Technol. B 2017, 46, 27–36. [Google Scholar]
- Sarrami-Foroushani, A.; Nasr Esfahany, M.; Saligheh Rad, H.; Firouznia, K.; Shakiba, M.; Ghanaati, H. Effects of Variations of Flow and Heart Rate on Intra-Aneurysmal Hemodynamics in a Ruptured Internal Carotid Artery Aneurysm During Exercise. Iran. J. Radiol. 2016, 13, e18217. [Google Scholar] [CrossRef] [Green Version]
- Sunderland, K.; Jiang, J. Multivariate analysis of hemodynamic parameters on intracranial aneurysm initiation of the internal carotid artery. Med. Eng. Phys. 2019, 74, 129–136. [Google Scholar] [CrossRef]
- Valen-Sendstad, K.; Piccinelli, M.; KrishnankuttyRema, R.; Steinman, D.A. Estimation of Inlet Flow Rates for Image-Based Aneurysm CFD Models: Where and How to Begin? Ann. Biomed. Eng. 2015, 43, 1422–1431. [Google Scholar] [CrossRef]
- Najafi, M.; Cancelliere, N.M.; Brina, O.; Bouillot, P.; Vargas, M.I.; Delattre, B.M.; Pereira, V.M.; Steinman, D.A. How patient-specific do internal carotid artery inflow rates need to be for computational fluid dynamics of cerebral aneurysms? J. NeuroInterv. Surg. 2021, 13, 459–464. [Google Scholar] [CrossRef]
- Xiang, J.; Siddiqui, A.H.; Meng, H. The effect of inlet waveforms on computational hemodynamics of patient-specific intracranial aneurysms. J. Biomech. 2014, 47, 3882–3890. [Google Scholar] [CrossRef] [PubMed] [Green Version]
- Meijs, M.; Pegge, S.A.H.; Vos, M.H.E.; Patel, A.; van de Leemput, S.C.; Koschmieder, K.; Prokop, M.; Meijer, F.J.A.; Manniesing, R. Cerebral Artery and Vein Segmentation in Four-dimensional CT Angiography Using Convolutional Neural Networks. Radiol. Artif. Intell. 2020, 2, e190178. [Google Scholar] [CrossRef] [PubMed]
- Randles, A.; Frakes, D.H.; Leopold, J.A. Computational Fluid Dynamics and Additive Manufacturing to Diagnose and Treat Cardiovascular Disease. Trends Biotechnol. 2017, 35, 1049–1061. [Google Scholar] [CrossRef] [PubMed]
- Polanczyk, A.; Strzelecki, M.; Wozniak, T.; Szubert, W.; Stefanczyk, L. 3D Blood Vessels Reconstruction Based on Segmented CT Data for Further Simulations of Hemodynamic in Human Artery Branches. Found. Comput. Decis. Sci. 2017, 42, 359–371. [Google Scholar] [CrossRef] [Green Version]
- Polanczyk, A.; Wozniak, T.; Strzelecki, M.; Szubert, W.; Stefanczyk, L. Evaluating an algorithm for 3D reconstruction of blood vessels for further simulations of hemodynamic in human artery branches. In Proceedings of the 2016 Signal Processing: Algorithms, Architectures, Arrangements, and Applications (SPA), Poznan, Poland, 21–23 September 2016; pp. 103–107. [Google Scholar]
- Rayz, V.L.; Cohen-Gadol, A.A. Hemodynamics of Cerebral Aneurysms: Connecting Medical Imaging and Biomechanical Analysis. Annu. Rev. Biomed. Eng. 2020, 22, 231–256. [Google Scholar] [CrossRef] [Green Version]
- Botti, L.; Paliwal, N.; Conti, P.; Antiga, L.; Meng, H. Modeling hemodynamics in intracranial aneurysms: Comparing accuracy of CFD solvers based on finite element and finite volume schemes. Int. J. Numer. Methods Biomed. Eng. 2018, 34, e3111. [Google Scholar] [CrossRef]
- Alastruey, J.; Parker, K.H.; Peiró, J.; Byrd, S.M.; Sherwin, S.J. Modelling the circle of Willis to assess the effects of anatomical variations and occlusions on cerebral flows. J. Biomech. 2007, 40, 1794–1805. [Google Scholar] [CrossRef]
- Steinman, D.A.; Milner, J.S.; Norley, C.J.; Lownie, S.P.; Holdsworth, D.W. Image-Based Computational Simulation of Flow Dynamics in a Giant Intracranial Aneurysm. Am. J. Neuroradiol. 2003, 24, 559–566. [Google Scholar]
- Kerber, C.W.; Imbesi, S.G.; Knox, K. Flow Dynamics in a Lethal Anterior Communicating Artery Aneurysm. Am. J. Neuroradiol. 1999, 20, 2000–2003. [Google Scholar]
- Jou, L.-D.; Quick, C.M.; Young, W.L.; Lawton, M.T.; Higashida, R.; Martin, A.; Saloner, D. Computational Approach to Quantifying Hemodynamic Forces in Giant Cerebral Aneurysms. Am. J. Neuroradiol. 2003, 24, 1804–1810. [Google Scholar]
- Hongo, K.; Morota, N.; Watabe, T.; Isobe, M.; Nakagawa, H. Giant basilar bifurcation aneurysm presenting as a third ventricular mass with unilateral obstructive hydrocephalus: Case report. J. Clin. Neurosci. 2001, 8, 51–54. [Google Scholar] [CrossRef] [PubMed]
- Burleson, A.C.; Strother, C.M.; Turitto, V.T. Computer modeling of intracranial saccular and lateral aneurysms for the study of their hemodynamics. Neurosurgery 1995, 37, 774–782. [Google Scholar] [CrossRef] [PubMed]
- Soldozy, S.; Norat, P.; Elsarrag, M.; Chatrath, A.; Costello, J.S.; Sokolowski, J.D.; Tvrdik, P.; Kalani, M.Y.S.; Park, M.S. The biophysical role of hemodynamics in the pathogenesis of cerebral aneurysm formation and rupture. Neurosurg. Focus FOC 2019, 47, E11. [Google Scholar] [CrossRef] [PubMed] [Green Version]
- Yu, H.; Huang, G.P.; Yang, Z.; Ludwig, B.R. Numerical studies of hemodynamic alterations in pre- and post-stenting cerebral aneurysms using a multiscale modeling. Int. J. Numer. Methods Biomed. Eng. 2019, 35, e3256. [Google Scholar] [CrossRef]
- Yang, Z.; Yu, H.; Huang, P.; Schwieterman, R. Computational fluid dynamics simulation of intracranial aneurysms–comparing size and shape. J. Coast. Life Med. 2015, 3, 245–252. [Google Scholar]
- Ford, M.D.; Nikolov, H.N.; Milner, J.S.; Lownie, S.P.; DeMont, E.M.; Kalata, W.; Loth, F.; Holdsworth, D.W.; Steinman, D.A. PIV-Measured Versus CFD-Predicted Flow Dynamics in Anatomically Realistic Cerebral Aneurysm Models. J. Biomech. Eng. 2008, 130, 021015. [Google Scholar] [CrossRef] [Green Version]
- Raschi, M.; Mut, F.; Byrne, G.; Putman, C.M.; Tateshima, S.; Viñuela, F.; Tanoue, T.; Tanishita, K.; Cebral, J.R. CFD and PIV analysis of hemodynamics in a growing intracranial aneurysm. Int. J. Numer. Methods Biomed. Eng. 2012, 28, 214–228. [Google Scholar] [CrossRef] [Green Version]
- Sun, Q.; Groth, A.; Aach, T. Comprehensive validation of computational fluid dynamics simulations of in-vivo blood flow in patient-specific cerebral aneurysms. Med. Phys. 2012, 39, 742–754. [Google Scholar] [CrossRef] [Green Version]
- Brindise, M.C.; Rothenberger, S.; Dickerhoff, B.; Schnell, S.; Markl, M.; Saloner, D.; Rayz, V.L.; Vlachos, P.P. Multi-modality cerebral aneurysm haemodynamic analysis: In vivo 4D flow MRI, in vitro volumetric particle velocimetry and in silico computational fluid dynamics. J. R. Soc. Interface 2019, 16, 20190465. [Google Scholar] [CrossRef] [Green Version]
- Roloff, C.; Stucht, D.; Beuing, O.; Berg, P. Comparison of intracranial aneurysm flow quantification techniques: Standard PIV vs stereoscopic PIV vs tomographic PIV vs phase-contrast MRI vs CFD. J. NeuroInterv. Surg. 2019, 11, 275–282. [Google Scholar] [CrossRef]
- Li, Y.; Verrelli, D.I.; Yang, W.; Qian, Y.; Chong, W. A pilot validation of CFD model results against PIV observations of haemodynamics in intracranial aneurysms treated with flow-diverting stents. J. Biomech. 2020, 100, 109590. [Google Scholar] [CrossRef] [PubMed]
- Wüstenhagen, C.; John, K.; Langner, S.; Brede, M.; Grundmann, S.; Bruschewski, M. CFD validation using in-vitro MRI velocity data–Methods for data matching and CFD error quantification. Comput. Biol. Med. 2021, 131, 104230. [Google Scholar] [CrossRef] [PubMed]
- Himburg, H.A.; Grzybowski, D.M.; Hazel, A.L.; LaMack, J.A.; Li, X.M.; Friedman, M.H. Spatial comparison between wall shear stress measures and porcine arterial endothelial permeability. Am. J. Physiol. Heart Circ. Physiol. 2004, 286, H1916–H1922. [Google Scholar] [CrossRef] [Green Version]
- Sandvei, M.S.; Romundstad, P.R.; Müller, T.B.; Vatten, L.; Vik, A. Risk Factors for Aneurysmal Subarachnoid Hemorrhage in a Prospective Population Study. Stroke 2009, 40, 1958–1962. [Google Scholar] [CrossRef] [PubMed] [Green Version]
- Tada, Y.; Wada, K.; Shimada, K.; Makino, H.; Liang, E.I.; Murakami, S.; Kudo, M.; Kitazato, K.T.; Nagahiro, S.; Hashimoto, T. Roles of Hypertension in the Rupture of Intracranial Aneurysms. Stroke 2014, 45, 579–586. [Google Scholar] [CrossRef] [Green Version]
- Chalouhi, N.; Hoh, B.L.; Hasan, D. Review of Cerebral Aneurysm Formation, Growth, and Rupture. Stroke 2013, 44, 3613–3622. [Google Scholar] [CrossRef]
- Yu, H.; Huang, G.P.; Yang, Z.; Ludwig, B.R. A multiscale computational modeling for cerebral blood flow with aneurysms and/or stenoses. Int. J. Numer. Methods Biomed. Eng. 2018, 34, e3127. [Google Scholar] [CrossRef]
- Klötzsch, C.; Popescu, O.; Berlit, P. Assessment of the Posterior Communicating Artery by Transcranial Color-Coded Duplex Sonography. Stroke 1996, 27, 486–489. [Google Scholar] [CrossRef]
- Tanaka, H.; Fujita, N.; Enoki, T.; Matsumoto, K.; Watanabe, Y.; Murase, K.; Nakamura, H. Relationship between variations in the circle of Willis and flow rates in internal carotid and basilar arteries determined by means of magnetic resonance imaging with semiautomated lumen segmentation: Reference data from 125 healthy volunteers. AJNR Am. J. Neuroradiol. 2006, 27, 1770–1775. [Google Scholar]
- Metaxa, E.; Tremmel, M.; Natarajan, S.K.; Xiang, J.; Paluch, R.A.; Mandelbaum, M.; Siddiqui, A.H.; Kolega, J.; Mocco, J.; Meng, H. Characterization of Critical Hemodynamics Contributing to Aneurysmal Remodeling at the Basilar Terminus in a Rabbit Model. Stroke 2010, 41, 1774–1782. [Google Scholar] [CrossRef] [Green Version]
- Isaksen, J.G.; Bazilevs, Y.; Kvamsdal, T.; Zhang, Y.; Kaspersen, J.H.; Waterloo, K.; Romner, B.; Ingebrigtsen, T. Determination of Wall Tension in Cerebral Artery Aneurysms by Numerical Simulation. Stroke 2008, 39, 3172–3178. [Google Scholar] [CrossRef] [PubMed] [Green Version]
- Lu, D.; Kassab, G.S. Role of shear stress and stretch in vascular mechanobiology. J. R. Soc. Interface 2011, 8, 1379–1385. [Google Scholar] [CrossRef] [PubMed] [Green Version]
- Wegener, P.P. What Makes Airplanes Fly? 1st ed.; Springer: New York City, NY, USA, 1991. [Google Scholar]
- Zhang, Y.; Jing, L.; Zhang, Y.; Liu, J.; Yang, X. Low wall shear stress is associated with the rupture of intracranial aneurysm with known rupture point: Case report and literature review. BMC Neurol. 2016, 16, 231. [Google Scholar] [CrossRef] [PubMed] [Green Version]
- Malek, A.M.; Alper, S.L.; Izumo, S. Hemodynamic shear stress and its role in atherosclerosis. Jama 1999, 282, 2035–2042. [Google Scholar] [CrossRef]
- Yen, W.; Cai, B.; Yang, J.; Zhang, L.; Zeng, M.; Tarbell, J.M.; Fu, B.M. Endothelial Surface Glycocalyx Can Regulate Flow-Induced Nitric Oxide Production in Microvessels In Vivo. PLoS ONE 2015, 10, e0117133. [Google Scholar] [CrossRef]
- Joyner, M.J.; Casey, D.P. Regulation of increased blood flow (hyperemia) to muscles during exercise: A hierarchy of competing physiological needs. Physiol. Rev. 2015, 95, 549–601. [Google Scholar] [CrossRef] [Green Version]
- Bauer, A.; Bopp, M.; Jakirlic, S.; Tropea, C.; Krafft, A.J.; Shokina, N.; Hennig, J. Analysis of the wall shear stress in a generic aneurysm under pulsating and transitional flow conditions. Exp. Fluids 2020, 61, 59. [Google Scholar] [CrossRef] [Green Version]


| Mesh | Minimum Size (mm) | Face Elements | Face-Maximum Skewness | Volume Elements | Volume-Maximum Skewness | Prism Layers | First Prism Layer Height (m) | Peel Layers | Size Growth Rate |
|---|---|---|---|---|---|---|---|---|---|
| Mesh 01 | 3.5 × 10⁻⁴ | 31,930 | 0.45 | 1,569,600 | 0.88 | 15 | 2.2 × 10⁻⁶ | 3 | 1.05 |
| Mesh 02 (Final) | 3.0 × 10⁻⁴ | 99,170 | 0.47 | 2,741,603 | 0.89 | 25 | 1.8 × 10⁻⁶ | ||
| Mesh 03 | 2.5 × 10⁻⁴ | 271,511 | 0.44 | 4,191,447 | 0.88 | 30 | 1.5 × 10⁻⁶ | ||
| Mesh 04 | 4.0 × 10⁻⁴ | 30,589 | 0.29 | 1,883,708 | 0.89 | 15 | 2.0 × 10⁻⁶ | ||
| Mesh 05 (Final) | 3.5 × 10⁻⁴ | 126,896 | 0.42 | 3,012,970 | 0.87 | 20 | 1.5 × 10⁻⁶ | ||
| Mesh 06 | 3.0 × 10⁻⁴ | 166,901 | 0.38 | 4,799,221 | 0.86 | 25 | 1.0 × 10⁻⁶ |
| Aneurysmal Sac | PFR | Time Instant (s) | ||||
|---|---|---|---|---|---|---|
| t1 = 0.14 | t2 = 0.22 | t3 = 0.40 | t4 = 0.80 | |||
| ICASA−1 (S1) | PFR−I | 15.2711 | 173.537 | 40.8334 | 19.869 | |
| −9.98615 | −81.9959 | −34.0993 | −13.9671 | |||
| 13.3374 | 73.5389 | 36.5139 | 17.596 | |||
| 12.1799 | 91.7417 | 32.5699 | 16.5839 | |||
| PFR−II | 43.3625 | 267.123 | 122.726 | 59.102 | ||
| −29.8159 | −220.707 | −96.8994 | −41.3871 | |||
| 32.3394 | 191.372 | 90.6823 | 42.4013 | |||
| 36.2225 | 231.593 | 108.234 | 50.3479 | |||
| PFR−III | 80.9053 | 431.082 | 231.061 | 108.233 | ||
| −58.853 | −361.069 | −194.217 | −82.4116 | |||
| 56.5928 | 249.25 | 154.078 | 74.6838 | |||
| 71.5142 | 391.926 | 206.949 | 98.4345 | |||
| ICASA−2 (S2) | PFR−I | 34.0782 | 169.003 | 92.7069 | 45.3113 | |
| −22.7832 | −87.9672 | −54.4009 | −28.8848 | |||
| 25.3666 | 116.035 | 68.6824 | 32.9661 | |||
| 24.1866 | 135.185 | 69.7968 | 32.8628 | |||
| PFR−II | 86.1642 | 343.389 | 213.202 | 107.149 | ||
| −52.2246 | −146.942 | −107.226 | −60.6988 | |||
| 60.534 | 234.625 | 153.317 | 75.4735 | |||
| 63.318 | 269.778 | 174.383 | 84.017 | |||
| PFR−III | 138.585 | 587.266 | 321.377 | 175.407 | ||
| −77.2774 | −276.796 | −130.745 | −82.6379 | |||
| 98.1775 | 392.104 | 214.711 | 117.631 | |||
| 109.770 | 438.358 | 251.712 | 140.801 | |||
| Selected Region | qA1:qA2 | Pulsatile Flow Rate | Time Instant (s) | |||
|---|---|---|---|---|---|---|
| t1 = 0.14 | t2 = 0.22 | t3 = 0.40 | t4 = 0.80 | |||
| ICASA−1 (R1) | 75:25 | PFR−I | 3.783 | 19.230 | 9.586 | 4.933 |
| PFR−II | 8.752 | 46.121 | 22.782 | 11.310 | ||
| PFR−III | 15.105 | 82.072 | 39.916 | 19.736 | ||
| ICASA−2 (R2) | 75:25 | PFR−I | 2.359 | 11.390 | 6.264 | 3.061 |
| PFR−II | 5.292 | 26.509 | 13.909 | 6.900 | ||
| PFR−III | 8.989 | 44.884 | 23.743 | 11.518 | ||
| 64:36 | PFR−I | 2.543 | 11.863 | 6.402 | 3.282 | |
| PFR−II | 5.594 | 27.110 | 14.258 | 7.180 | ||
| PFR−III | 9.306 | 46.224 | 23.961 | 11.729 | ||
| Selected Region | qA1:qA2 | Pulsatile Flow Rate | TAP (Pa) | |
|---|---|---|---|---|
| Minimum | Maximum | |||
| ICASA−1 (R1) | 75:25 | PFR−I | 13,114.6 | 13,613.0 |
| PFR−II | 12,973.9 | 14,301.0 | ||
| PFR−III | 12,732.1 | 15,324.9 | ||
| ICASA−2(R2) | 75:25 | PFR−I | 12,884.3 | 13,262.5 |
| PFR−II | 12,399.9 | 13,429.7 | ||
| PFR−III | 11,742.8 | 13,613.9 | ||
| 64:36 | PFR−I | 12,884.4 | 13,263.0 | |
| PFR−II | 12,400.0 | 13,430.0 | ||
| PFR−III | 11,743.3 | 13,614.2 | ||
Publisher’s Note: MDPI stays neutral with regard to jurisdictional claims in published maps and institutional affiliations. |
© 2022 by the authors. Licensee MDPI, Basel, Switzerland. This article is an open access article distributed under the terms and conditions of the Creative Commons Attribution (CC BY) license (https://creativecommons.org/licenses/by/4.0/).
Share and Cite
Yi, H.; Johnson, M.; Bramlage, L.C.; Ludwig, B.; Yang, Z. Effects of Pulsatile Flow Rate and Shunt Ratio in Bifurcated Distal Arteries on Hemodynamic Characteristics Involved in Two Patient-Specific Internal Carotid Artery Sidewall Aneurysms: A Numerical Study. Bioengineering 2022, 9, 326. https://doi.org/10.3390/bioengineering9070326
Yi H, Johnson M, Bramlage LC, Ludwig B, Yang Z. Effects of Pulsatile Flow Rate and Shunt Ratio in Bifurcated Distal Arteries on Hemodynamic Characteristics Involved in Two Patient-Specific Internal Carotid Artery Sidewall Aneurysms: A Numerical Study. Bioengineering. 2022; 9(7):326. https://doi.org/10.3390/bioengineering9070326
Chicago/Turabian StyleYi, Hang, Mark Johnson, Luke C. Bramlage, Bryan Ludwig, and Zifeng Yang. 2022. "Effects of Pulsatile Flow Rate and Shunt Ratio in Bifurcated Distal Arteries on Hemodynamic Characteristics Involved in Two Patient-Specific Internal Carotid Artery Sidewall Aneurysms: A Numerical Study" Bioengineering 9, no. 7: 326. https://doi.org/10.3390/bioengineering9070326