
Gait Impairment Analysis Using Silhouette Sinogram Signals and Assisted Knowledge Learning

 ,
,  , , and
Abstract
:1. Introduction
- Novel silhouette sinogram signals are generated for each silhouette image by computing the angle and distance between the centroid and all boundary points, facilitating the extraction of prominent representations of relative variations in pathological gait patterns.
- We develop a 1D CNN model that can integrate multiple silhouette sinogram signals and train them together to enhance the network’s understanding of gait abnormalities through assisted knowledge learning.
- We analyze the influence of varying -assisted silhouette sinogram signals, used as prior knowledge and fed into the network ( 1, 10, 20, and 30). This work also conducts comprehensive experiments encompassing three distinct sizes of gait abnormalities, categorized into classes.
- This work employs two evaluation methodologies: one based on individual silhouette frames and another operating at the subject level using a majority voting approach.
2. Related Works
3. Materials and Methods
3.1. Dataset
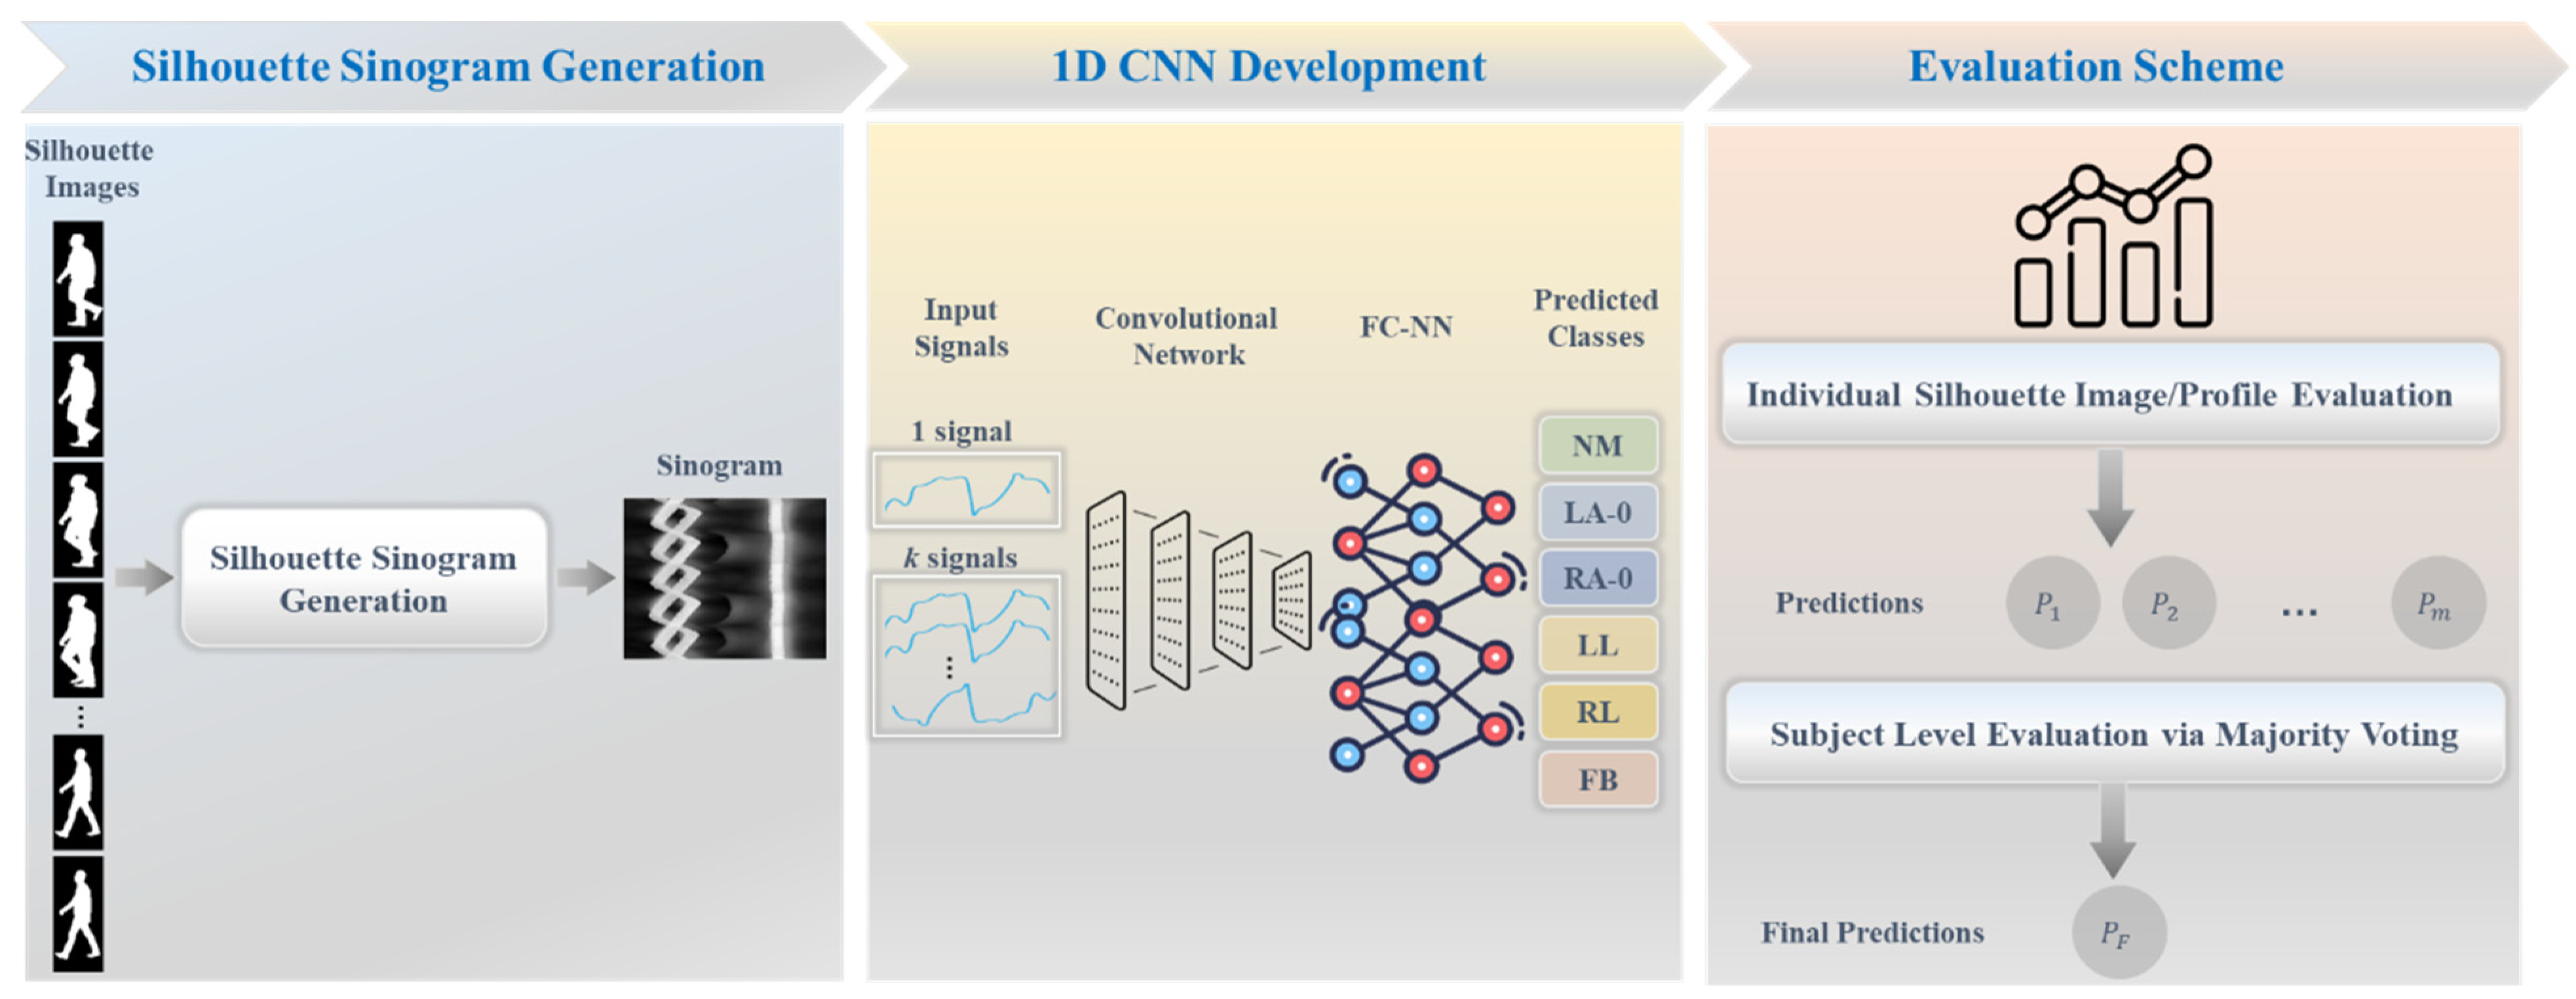
3.2. Proposed Framework
3.2.1. Generation of Silhouette Sinogram Signals
- (1)
- Image Cropping
- (2)
- Centroid and Boundary Calculations
- (3)
- Silhouette Sinogram Calculations
3.2.2. Deep Learning Network Architecture
3.2.3. Assisted Knowledge Learning
3.2.4. Technical Specifications
3.2.5. Evaluation Measures
4. Results and Experiments
4.1. Gait Analysis Results
4.2. Comparative Experiments
5. Discussion
6. Conclusions
Author Contributions
Funding
Institutional Review Board Statement
Informed Consent Statement
Data Availability Statement
Acknowledgments
Conflicts of Interest
Appendix A
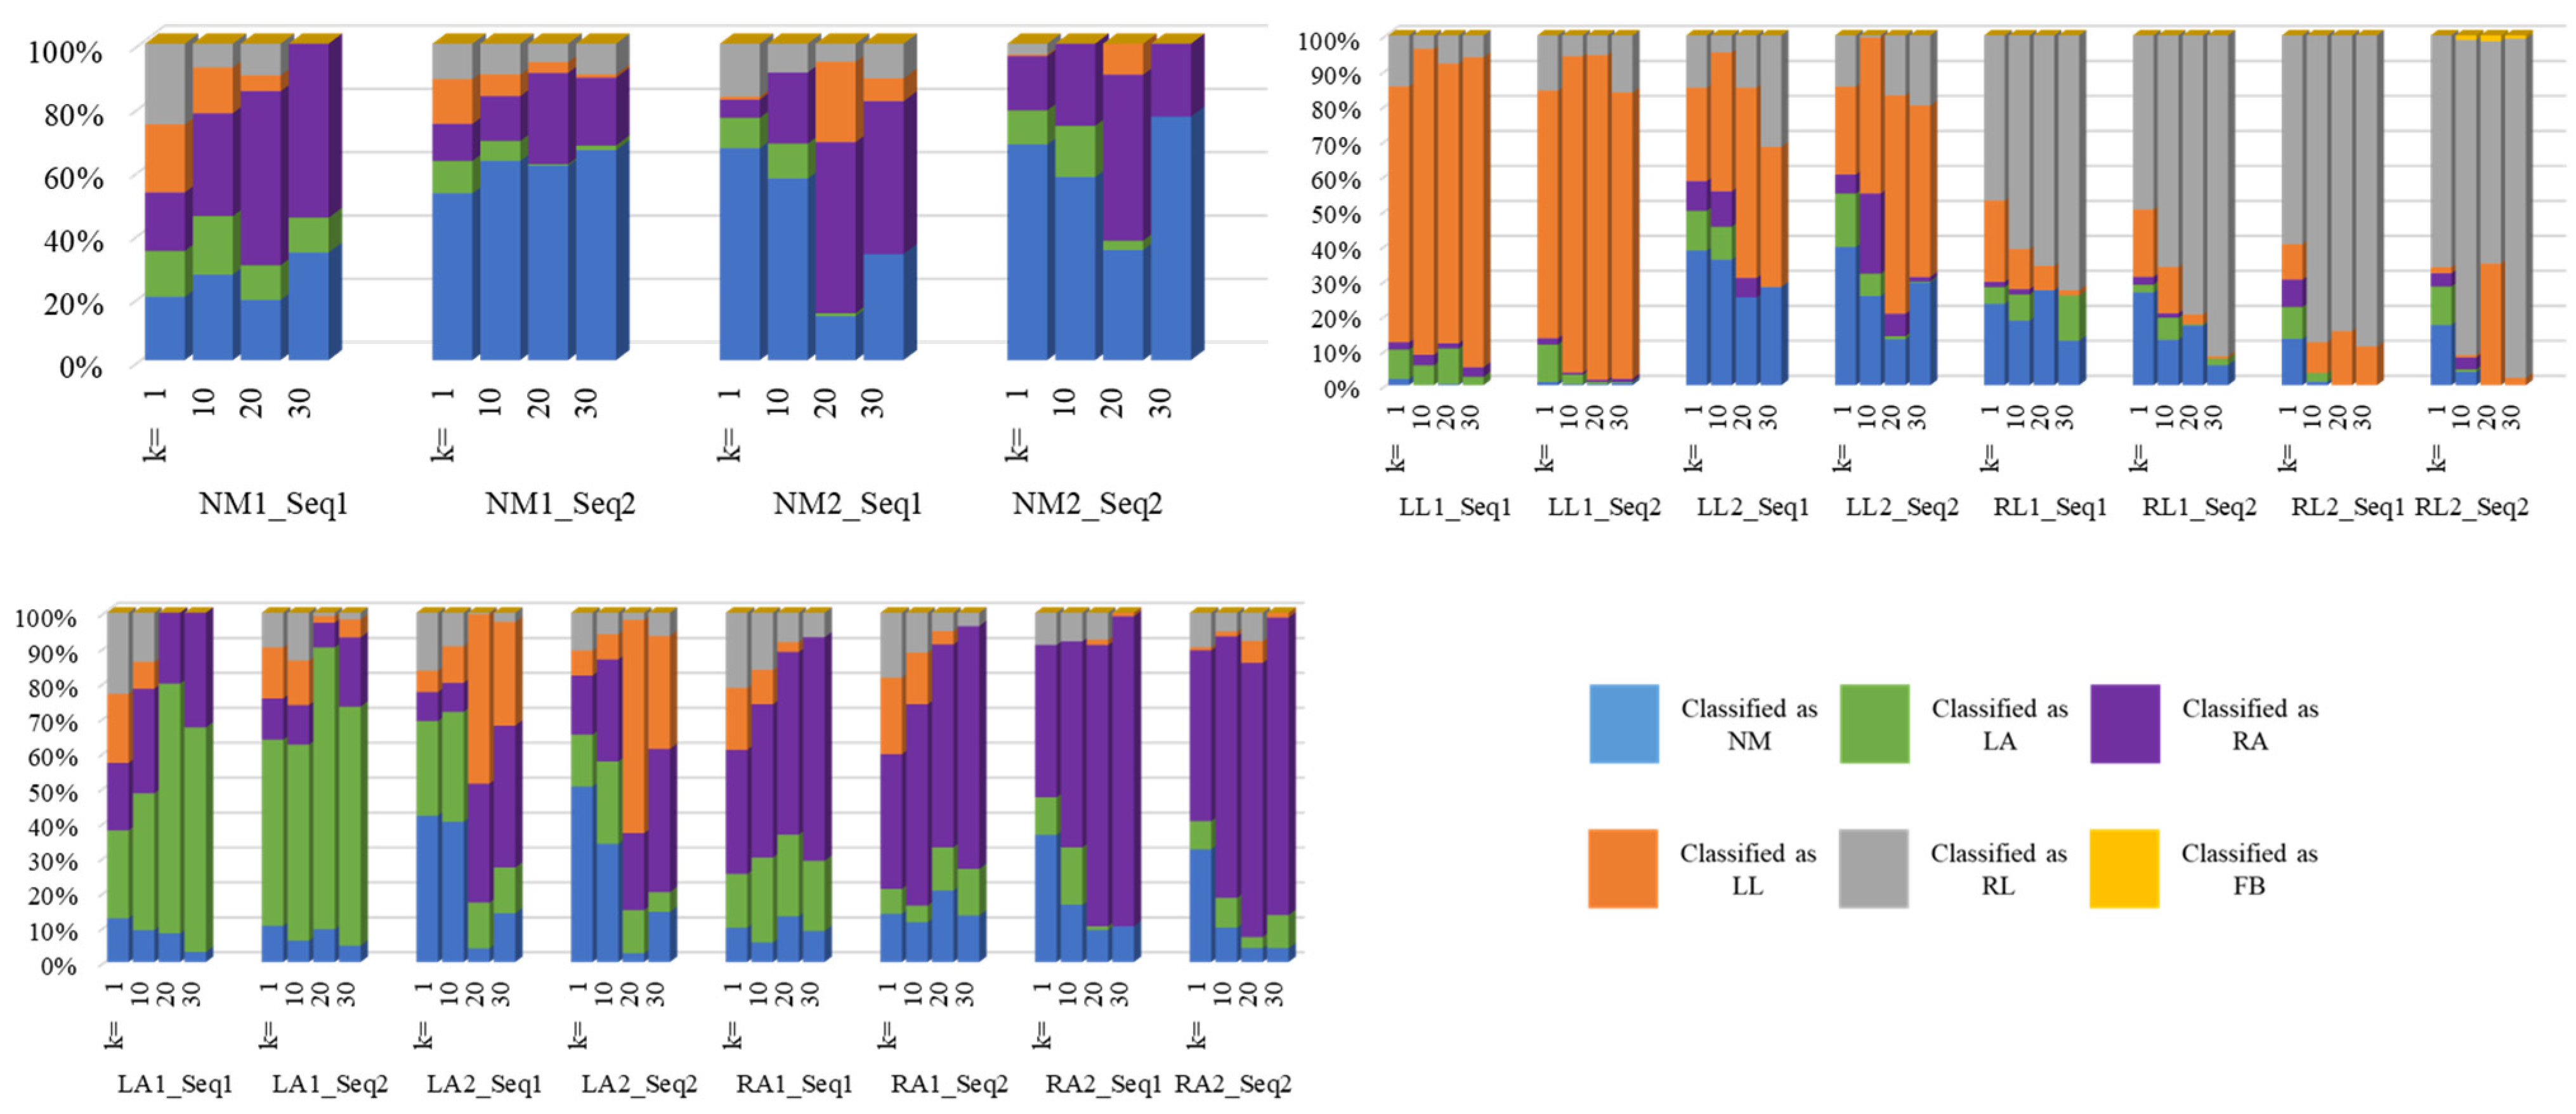
| NM | ||||||||
| Evaluation based on a signal/image | ||||||||
| Classes | n = 4 | n = 6 | ||||||
| Frames/signals | k = 1 | k = 10 | k = 20 | k = 30 | k = 1 | k = 10 | k = 20 | k = 30 |
| Sensitivity | 62.71 | 76.28 | 75.18 | 89.98 | 52.2 | 51.47 | 32.27 | 52.69 |
| Specificity | 89.7 | 94.81 | 96.92 | 95.03 | 86.29 | 91.43 | 93.97 | 94.28 |
| Accuracy | 86.01 | 92.28 | 93.95 | 94.33 | 82.66 | 87.16 | 87.39 | 89.84 |
| F1-score | 55.07 | 72.98 | 77.26 | 81.28 | 39.1 | 46.11 | 35.32 | 52.53 |
| Evaluation based on majority voting of a sequence of a subject | ||||||||
| Classes | n = 4 | n = 6 | ||||||
| Frames/signals | k = 1 | k = 10 | k = 20 | k = 30 | k = 1 | k = 10 | k = 20 | k = 30 |
| Sensitivity | 75 | 100 | 100 | 100 | 50 | 25 | 75 | 50 |
| Specificity | 83.33 | 100 | 100 | 91.67 | 90 | 100 | 100 | 100 |
| Accuracy | 81.25 | 100 | 100 | 93.75 | 83.33 | 87.5 | 96 | 91.67 |
| F1-score | 66.67 | 100 | 100 | 88.89 | 50 | 40 | 85.71 | 66.67 |
| LL | ||||||||
| Evaluation based on a signal/image | ||||||||
| Classes | n = 4 | n = 6 | ||||||
| Frames/signals | k = 1 | k = 10 | k = 20 | k = 30 | k = 1 | k = 10 | k = 20 | k = 30 |
| Sensitivity | 58.51 | 77.79 | 79.64 | 67.72 | 49.85 | 66.49 | 72.99 | 65.71 |
| Specificity | 92.9 | 96.87 | 97.8 | 98.32 | 93.16 | 95.47 | 91.58 | 96.68 |
| Accuracy | 85.48 | 92.75 | 93.88 | 91.71 | 85.87 | 90.58 | 88.45 | 91.46 |
| F1-score | 63.5 | 82.24 | 84.9 | 77.92 | 54.3 | 70.41 | 68.04 | 72.16 |
| Evaluation based on majority voting of a sequence of a subject | ||||||||
| Classes | n = 4 | n = 6 | ||||||
| Frames/signals | k = 1 | k = 10 | k = 20 | k = 30 | k = 1 | k = 10 | k = 20 | k = 30 |
| Sensitivity | 50 | 100 | 100 | 75 | 50 | 100 | 50 | 100 |
| Specificity | 100 | 100 | 100 | 100 | 95 | 100 | 100 | 100 |
| Accuracy | 87.5 | 100 | 100 | 93.75 | 87.5 | 100 | 92 | 100 |
| F1-score | 66.67 | 100 | 100 | 85.71 | 57.14 | 100 | 66.67 | 100 |
| FB | ||||||||
| Evaluation based on a signal/image | ||||||||
| Classes | n = 4 | n = 6 | ||||||
| Frames/signals | k = 1 | k = 10 | k = 20 | k = 30 | k = 1 | k = 10 | k = 20 | k = 30 |
| Sensitivity | 100 | 100 | 100 | 100 | 100 | 100 | 100 | 100 |
| Specificity | 100 | 99.7 | 99.97 | 99.82 | 100 | 100 | 99.9 | 99.94 |
| Accuracy | 100 | 99.83 | 99.98 | 99.9 | 100 | 100 | 99.93 | 99.96 |
| F1-score | 100 | 99.81 | 99.98 | 99.89 | 100 | 100 | 99.9 | 99.94 |
| Evaluation based on majority voting of a sequence of a subject | ||||||||
| Classes | n = 4 | n = 6 | ||||||
| Frames/signals | k = 1 | k = 10 | k = 20 | k = 30 | k = 1 | k = 10 | k = 20 | k = 30 |
| Sensitivity | 100 | 100 | 100 | 100 | 100 | 100 | 100 | 100 |
| Specificity | 100 | 100 | 100 | 100 | 100 | 100 | 100 | 100 |
| Accuracy | 100 | 100 | 100 | 100 | 100 | 100 | 100 | 100 |
| F1-score | 100 | 100 | 100 | 100 | 100 | 100 | 100 | 100 |
| RL | ||||||||
| Evaluation based on a signal/image | ||||||||
| Classes | n = 4 | n = 6 | ||||||
| Frames/signals | k = 1 | k = 10 | k = 20 | k = 30 | k = 1 | k = 10 | k = 20 | k = 30 |
| Sensitivity | 63.91 | 84.02 | 92.61 | 95.15 | 55.48 | 76.08 | 73.61 | 87.28 |
| Specificity | 90.9 | 94.56 | 93.74 | 95.39 | 91.22 | 95.59 | 95.96 | 94.91 |
| Accuracy | 85.23 | 92.35 | 93.5 | 95.34 | 85.36 | 92.39 | 92.29 | 93.66 |
| F1-score | 64.53 | 82.19 | 85.69 | 89.56 | 55.42 | 76.6 | 75.81 | 81.88 |
| Evaluation based on majority voting of a sequence of a subject | ||||||||
| Classes | n = 4 | n = 6 | ||||||
| Frames/signals | k = 1 | k = 10 | k = 20 | k = 30 | k = 1 | k = 10 | k = 20 | k = 30 |
| Sensitivity | 100 | 100 | 100 | 100 | 100 | 100 | 100 | 100 |
| Specificity | 91.67 | 100 | 100 | 100 | 75 | 70 | 76.19 | 100 |
| Accuracy | 93.75 | 100 | 100 | 100 | 79.17 | 75 | 80 | 100 |
| F1-score | 88.89 | 100 | 100 | 100 | 61.54 | 57.14 | 61.54 | 100 |
| LA | ||||||||
| Evaluation based on a signal/image | ||||||||
| Classes | n = 6 | |||||||
| Frames/signals | k = 1 | k = 10 | k = 20 | k = 30 | ||||
| Sensitivity | 30.37 | 37.72 | 44.25 | 37.84 | ||||
| Specificity | 93.99 | 94.85 | 97.71 | 97.42 | ||||
| Accuracy | 87 | 88.57 | 91.84 | 90.87 | ||||
| F1-score | 33.93 | 42.06 | 54.37 | 47.68 | ||||
| Evaluation based on majority voting of a sequence of a subject | ||||||||
| Classes | n = 6 | |||||||
| Frames/signals | k = 1 | k = 10 | k = 20 | k = 30 | ||||
| Sensitivity | 50 | 25 | 40 | 50 | ||||
| Specificity | 100 | 100 | 100 | 100 | ||||
| Accuracy | 91.67 | 87.5 | 88 | 91.67 | ||||
| F1-score | 66.67 | 40 | 57.14 | 66.67 | ||||
| RA | ||||||||
| Evaluation based on a signal/image | ||||||||
| Classes | n = 6 | |||||||
| Frames/signals | k = 1 | k = 10 | k = 20 | k = 30 | ||||
| Sensitivity | 41.69 | 59.03 | 67.22 | 76.72 | ||||
| Specificity | 95.18 | 92.82 | 91.05 | 91.2 | ||||
| Accuracy | 89.31 | 89.11 | 88.43 | 89.61 | ||||
| F1-score | 46.12 | 54.35 | 56.07 | 61.85 | ||||
| Evaluation based on majority voting of a sequence of a subject | ||||||||
| Classes | n = 6 | |||||||
| Frames/signals | k = 1 | k = 10 | k = 20 | k = 30 | ||||
| Sensitivity | 50 | 50 | 100 | 100 | ||||
| Specificity | 100 | 90 | 95.24 | 80 | ||||
| Accuracy | 91.67 | 83.33 | 96 | 83.33 | ||||
| F1-score | 66.67 | 50 | 88.89 | 66.67 | ||||
References
- Saboor, A.; Kask, T.; Kuusik, A.; Alam, M.M.; Le Moullec, Y.; Niazi, I.K.; Zoha, A.; Ahmad, R. Latest research trends in gait analysis using wearable sensors and machine learning: A systematic review. IEEE Access 2020, 8, 167830–167864. [Google Scholar] [CrossRef]
- Hulleck, A.A.; Menoth Mohan, D.; Abdallah, N.; El Rich, M.; Khalaf, K. Present and future of gait assessment in clinical practice: Towards the application of novel trends and technologies. Front. Med. Technol. 2022, 4, 901331. [Google Scholar] [CrossRef] [PubMed]
- Hase, K. A computer simulation study on the causal relationship between walking and physical malfunctions in older adults. Anthropol. Sci. 2008, 116, 95–104. [Google Scholar] [CrossRef]
- Zhou, C.J.; Mitsugami, I.; Yagi, Y. Detection of Gait Impairment in the Elderly Using Patch-GEI. IEEJ Trans. Electr. Electr. 2015, 10, S69–S76. [Google Scholar] [CrossRef]
- Ortells, J.; Herrero-Ezquerro, M.T.; Mollineda, R.A. Vision-based gait impairment analysis for aided diagnosis. Med. Biol. Eng. Comput. 2018, 56, 1553–1564. [Google Scholar] [CrossRef] [PubMed]
- Mohan, D.M.; Khandoker, A.H.; Wasti, S.A.; Alali, S.I.I.I.; Jelinek, H.F.; Khalaf, K. Assessment Methods of Post-stroke Gait: A Scoping Review of Technology-Driven Approaches to Gait Characterization and Analysis. Front. Neurol. 2021, 12, 650024. [Google Scholar] [CrossRef] [PubMed]
- Carriero, A.; Zavatsky, A.; Stebbins, J.; Theologis, T.; Shefelbine, S.J. Determination of gait patterns in children with spastic diplegic cerebral palsy using principal components. Gait Posture 2009, 29, 71–75. [Google Scholar] [CrossRef] [PubMed]
- Chang, F.M.; Rhodes, J.T.; Flynn, K.M.; Carollo, J.J. The Role of Gait Analysis in Treating Gait Abnormalities in Cerebral Palsy. Orthop. Clin. N. Am. 2010, 41, 489–506. [Google Scholar] [CrossRef] [PubMed]
- Zhang, X.; Rong, X.; Luo, H. Optimizing lower limb rehabilitation: The intersection of machine learning and rehabilitative robotics. Front. Rehabil. Sci. 2024, 5, 1246773. [Google Scholar] [CrossRef]
- States, R.A.; Krzak, J.J.; Salem, Y.; Godwin, E.M.; Bodkin, A.W.; McMulkin, M.L. Instrumented gait analysis for management of gait disorders in children with cerebral palsy: A scoping review. Gait Posture 2021, 90, 1–8. [Google Scholar] [CrossRef]
- Rozumalski, A.; Schwartz, M.H. Crouch gait patterns defined using k-means cluster analysis are related to underlying clinical pathology. Gait Posture 2009, 30, 155–160. [Google Scholar] [CrossRef]
- Begg, R.; Kamruzzaman, J. A machine learning approach for automated recognition of movement patterns using basic, kinetic and kinematic gait data. J. Biomech. 2005, 38, 401–408. [Google Scholar] [CrossRef]
- Cho, C.W.; Chao, W.H.; Lin, S.H.; Chen, Y.Y. A vision-based analysis system for gait recognition in patients with Parkinson’s disease. Expert Syst. Appl. 2009, 36, 7033–7039. [Google Scholar] [CrossRef]
- Chen, Y.Y.; Cho, C.W.; Lin, S.H.; Lai, H.Y.; Lo, Y.C.; Chen, S.Y.; Chang, Y.J.; Huang, W.T.; Chen, C.H.; Jaw, F.S.; et al. A vision-based regression model to evaluate Parkinsonian gait from monocular image sequences. Expert Syst. Appl. 2012, 39, 520–526. [Google Scholar] [CrossRef]
- Yang, M.J.; Zheng, H.R.; Wang, H.Y.; McClean, S.; Hall, J.; Harris, N. A machine learning approach to assessing gait patterns for Complex Regional Pain Syndrome. Med. Eng. Phys. 2012, 34, 740–746. [Google Scholar] [CrossRef]
- Khan, T.; Grenholm, P.; Nyholm, D. Computer vision methods for parkinsonian gait analysis: A review on patents. Recent Pat. Biomed. Eng. 2013, 6, 97–108. [Google Scholar] [CrossRef]
- Alaqtash, M.; Yu, H.Y.; Brower, R.; Abdelgawad, A.; Sarkodie-Gyan, T. Application of wearable sensors for human gait analysis using fuzzy computational algorithm. Eng. Appl. Artif. Intel. 2011, 24, 1018–1025. [Google Scholar] [CrossRef]
- Nadeau, S.; Duclos, C.; Bouyer, L.; Richards, C.L. Guiding task-oriented gait training after stroke or spinal cord injury by means of a biomechanical gait analysis. Prog. Brain Res. 2011, 192, 161–180. [Google Scholar] [CrossRef] [PubMed]
- Papageorgiou, E.; Nieuwenhuys, A.; Vandekerckhove, I.; Van Campenhout, A.; Ortibus, E.; Desloovere, K. Systematic review on gait classifications in children with cerebral palsy: An update. Gait Posture 2019, 69, 209–223. [Google Scholar] [CrossRef]
- Darbandi, H.; Baniasad, M.; Baghdadi, S.; Khandan, A.; Vafaee, A.; Farahmand, F. Automatic classification of gait patterns in children with cerebral palsy using fuzzy clustering method. Clin. Biomech. 2020, 73, 189–194. [Google Scholar] [CrossRef]
- Figueiredo, J.; Santos, C.P.; Moreno, J.C. Automatic recognition of gait patterns in human motor disorders using machine learning: A review. Med. Eng. Phys. 2018, 53, 1–12. [Google Scholar] [CrossRef] [PubMed]
- Han, J.; Bhanu, B. Individual recognition using Gait Energy Image. IEEE Trans. Pattern Anal. 2006, 28, 316–322. [Google Scholar] [CrossRef]
- Bailly, R.; Lempereur, M.; Thepaut, M.; Pons, C.; Houx, L.; Brochard, S. Relationship between 3D lower limb bone morphology and 3D gait variables in children with uni and bilateral Cerebral Palsy. Gait Posture 2022, 92, 51–59. [Google Scholar] [CrossRef] [PubMed]
- Hebda-Boon, A.; Tan, X.L.; Tillmann, R.; Shortland, A.P.; Firth, G.B.; Morrissey, D. The impact of instrumented gait analysis on decision-making in the interprofessional management of cerebral palsy: A scoping review. Eur. J. Paediatr. Neurol. 2023, 42, 60–70. [Google Scholar] [CrossRef] [PubMed]
- Bonnet-Lebrun, A.; Linglart, A.; De Tienda, M.; Khac, V.N.; Ouchrif, Y.; Berkenou, J.; Pillet, H.; Assi, A.; Wicart, P.; Skalli, W. Combined gait analysis and radiologic examination in children with X-linked hypophosphatemia. Clin. Biomech. 2023, 105, 105974. [Google Scholar] [CrossRef]
- Otayek, J.; Bizdikian, A.J.; Yared, F.; Saad, E.; Bakouny, Z.; Massaad, A.; Ghanimeh, J.; Labaki, C.; Skalli, W.; Ghanem, I.; et al. Influence of spino-pelvic and postural alignment parameters on gait kinematics. Gait Posture 2020, 76, 318–326. [Google Scholar] [CrossRef] [PubMed]
- Mostayed, A.; Mazumder, M.M.G.; Kim, S.; Park, S.J. Abnormal gait detection using discrete Fourier transform. In Proceedings of the 2008 International Conference on Multimedia and Ubiquitous Engineering (MUE 2008), Busan, Republic of Korea, 24–26 April 2008; pp. 36–40. [Google Scholar]
- Wang, F.; Stone, E.; Dai, W.Q.; Skubic, M.; Keller, J. Gait Analysis and Validation Using Voxel Data. In Proceedings of the 2009 Annual International Conference of the IEEE Engineering in Medicine and Biology Society, Minneapolis, MN, USA, 3–6 September 2009; pp. 6127–6130. [Google Scholar]
- Chiu, S.L.; Chou, L.S. Variability in inter-joint coordination during walking of elderly adults and its association with clinical balance measures. Clin. Biomech. 2013, 28, 454–458. [Google Scholar] [CrossRef] [PubMed]
- Shin, S.S.; An, D.H.; Yoo, W.G. The effect of navigating obstacles when walking with deficient (inappropriate, deprived, limited) foot sensory input on spatiotemporal gait parameters of elderly individuals with different visual acuities. Eur. Geriatr. Med. 2015, 6, 1–6. [Google Scholar] [CrossRef]
- Salarian, A.; Russmann, H.; Vingerhoets, F.J.G.; Dehollain, C.; Blanc, Y.; Burkhard, P.R.; Aminian, K. Gait assessment in Parkinson’s disease: Toward an ambulatory system for long-term monitoring. IEEE Trans. Biomed. Eng. 2004, 51, 1434–1443. [Google Scholar] [CrossRef]
- Chang, H.-C.; Hsu, Y.-L.; Yang, S.-C.; Lin, J.-C.; Wu, Z.-H. A wearable inertial measurement system with complementary filter for gait analysis of patients with stroke or Parkinson’s disease. IEEE Access 2016, 4, 8442–8453. [Google Scholar] [CrossRef]
- Amin, J.; Ruthiraphong, P. Cloud-based Gait Analysis Using a Single IMU for Parkinson Disease. In Proceedings of the 2021 18th International Conference on Electrical Engineering/Electronics, Computer, Telecommunications and Information Technology (ECTI-CON), Chiang Mai, Thailand, 19–22 May 2021; pp. 1129–1132. [Google Scholar]
- Khan, A.Z.; Aamir, F.; Kafeel, A.; Khan, M.U.; Aziz, S. Freezing of gait detection in parkinson’s disease from accelerometer readings. In Proceedings of the 2021 Mohammad Ali Jinnah University International Conference on Computing (MAJICC), Karachi, Pakistan, 15–17 July 2021; pp. 1–5. [Google Scholar]
- Kovalenko, E.; Shcherbak, A.; Somov, A.; Bril, E.; Zimniakova, O.; Semenov, M.; Samoylov, A. Detecting the Parkinson’s Disease Through the Simultaneous Analysis of Data From Wearable Sensors and Video. IEEE Sens. J. 2022, 22, 16430–16439. [Google Scholar] [CrossRef]
- Hallemans, A.; Ortibus, E.; Meire, F.; Aerts, P. Low vision affects dynamic stability of gait. Gait Posture 2010, 32, 547–551. [Google Scholar] [CrossRef] [PubMed]
- Khan, T.; Westin, J.; Dougherty, M. Motion cue analysis for parkinsonian gait recognition. Open Biomed. Eng. J. 2013, 7, 1–8. [Google Scholar] [CrossRef] [PubMed]
- Costin, H.; Luca, R.; Onu, I.; Rotaru, F.; Bejinariu, S.-I. Medical Rehabilitation Evaluation using Image Processing of Patients’ Gait. In Proceedings of the 2023 13th International Symposium on Advanced Topics in Electrical Engineering (ATEE), Bucharest, Romania, 23–25 March 2023; pp. 1–5. [Google Scholar]
- Yang, X.C.; Zhou, Y.; Zhang, T.H.; Shu, G.; Yang, J. Gait recognition based on dynamic region analysis. Signal Process. 2008, 88, 2350–2356. [Google Scholar] [CrossRef]
- Hu, M.D.; Wang, Y.H. A New Approach for Gender Classification Based on Gait Analysis. In Proceedings of the 2009 Fifth International Conference on Image and Graphics (ICIG 2009), Xi’an, China, 20–23 September 2009; pp. 869–874. [Google Scholar]
- Bakchy, S.C.; Islam, M.R.; Mahmud, M.R.; Imran, F. Human gait analysis using gait energy image. arXiv 2022, arXiv:2203.09549. [Google Scholar]
- Luo, J.; Zhang, J.; Zi, C.; Niu, Y.; Tian, H.; Xiu, C. Gait recognition using GEI and AFDEI. Int. J. Opt. 2015, 2015, 763908. [Google Scholar] [CrossRef]
- Verlekar, T.T.; Soares, L.D.; Correia, P.L. Automatic Classification of Gait Impairments Using a Markerless 2D Video-Based System. Sensors 2018, 18, 2743. [Google Scholar] [CrossRef]
- Albuquerque, P.; Machado, J.P.; Verlekar, T.T.; Correia, P.L.; Soares, L.D. Remote Gait Type Classification System Using Markerless 2D Video. Diagnostics 2021, 11, 1824. [Google Scholar] [CrossRef] [PubMed]
- Loureiro, J.; Correia, P.L. Using a Skeleton Gait Energy Image for Pathological Gait Classification. In Proceedings of the 2020 15th IEEE International Conference on Automatic Face and Gesture Recognition (FG 2020), Buenos Aires, Argentina, 16–20 November 2020; pp. 503–507. [Google Scholar]
- Albuquerque, P.; Verlekar, T.T.; Correia, P.L.; Soares, L.D. A Spatiotemporal Deep Learning Approach for Automatic Pathological Gait Classification. Sensors 2021, 21, 6202. [Google Scholar] [CrossRef]
- Wang, T.; Du, Y.; Gong, Y.; Choo, K.-K.R.; Guo, Y. Applications of federated learning in mobile health: Scoping review. J. Med. Internet Res. 2023, 25, e43006. [Google Scholar] [CrossRef]
- Zhang, J.; Tian, J.; Yan, P.; Wu, S.; Luo, H.; Yin, S. Multi-hop graph pooling adversarial network for cross-domain remaining useful life prediction: A distributed federated learning perspective. Reliab. Eng. Syst. Saf. 2024, 244, 109950. [Google Scholar] [CrossRef]
- Zhang, J.; Tian, J.; Alcaide, A.M.; Leon, J.I.; Vazquez, S.; Franquelo, L.G.; Luo, H.; Yin, S. Lifetime extension approach based on levenberg-marquardt neural network and power routing of dc-dc converters. IEEE Trans. Power Electron. 2023, 38, 10280–10291. [Google Scholar] [CrossRef]
- INIT Gait Database. Available online: https://www.vision.uji.es/gaitDB/ (accessed on 10 January 2023).
- Gonzalez, R.C.; Woods, R.E.; Eddins, S.L. Digital Image Processing Using MATLAB; Pearson Prentice-Hall: London, UK, 2004. [Google Scholar]
- Springenberg, J.T.; Dosovitskiy, A.; Brox, T.; Riedmiller, M. Striving for simplicity: The all convolutional net. arXiv 2014, arXiv:1412.6806. [Google Scholar]
- Kelleher, J.D.; Mac Namee, B.; D’Arcy, A. Fundamentals of Machine Learning for Predictive Data Analytics: Algorithms, Worked Examples, and Case Studies; MIT Press: Cambridge, MA, USA, 2015; p. 262029448. [Google Scholar]
- Chavez, J.M.; Tang, W. A vision-based system for stage classification of parkinsonian gait using machine learning and synthetic data. Sensors 2022, 22, 4463. [Google Scholar] [CrossRef]


| Gait Style | Description |
|---|---|
| Normal (NM) | It depicts the normal gait pattern of a healthy person, which is also referred to as neutral or regular appearance in the database. |
| Abnormal right leg (RL) | A pattern of walking in which the right leg takes steps that are approximately one half as short as the ones taken by the left leg. |
| Abnormal left leg (LL) | A pattern of walking in which the left leg takes steps that are approximately one half as short as the steps taken by the right leg. |
| Abnormal full body (FB) | A damaged gait pattern in which the complete body shows a multitude of abnormal gait symptoms, including the following: participants walk slowly, bending their knees, and taking extremely tiny steps, barely lifting their feet off the ground (shuffling gait). |
| Abnormal half right arm (RA-0.5) | A walking pattern in which the right arm swings about one half as far as the left arm does. |
| Abnormal half left arm (LA-0.5) | A walking pattern in which the left arm swings about one half as far as the right arm does. |
| Abnormal right arm (RA) | A walking pattern in which the right arm does not swing at all while walking. |
| Abnormal left arm (LA) | A walking pattern in which the left arm does not swing at all while walking. |
| Evaluation Based on a Signal/Image | ||||||||
|---|---|---|---|---|---|---|---|---|
| Classes | n = 4 | n = 6 | ||||||
| Frames/signals | k = 1 | k = 10 | k = 20 | k = 30 | k = 1 | k = 10 | k = 20 | k = 30 |
| Sensitivity | 78.36 | 88.60 | 90.66 | 90.64 | 65.09 | 73.91 | 74.17 | 77.70 |
| Specificity | 95.15 | 97.34 | 97.78 | 97.91 | 94.76 | 96.24 | 96.01 | 96.73 |
| Accuracy | 78.36 | 88.60 | 90.66 | 90.64 | 65.09 | 73.87 | 74.17 | 77.70 |
| F1-score | 78.52 | 88.65 | 90.62 | 90.43 | 65.32 | 74.05 | 73.88 | 77.32 |
| Evaluation Based on Majority Voting of a Sequence of a Subject | ||||||||
| Classes | n = 4 | n = 6 | ||||||
| Frames/signals | k = 1 | k = 10 | k = 20 | k = 30 | k = 1 | k = 10 | k = 20 | k = 30 |
| Sensitivity | 81.25 | 100 | 100 | 93.75 | 66.67 | 66.67 | 77.5 | 83.33 |
| Specificity | 93.75 | 100 | 100 | 97.92 | 93.33 | 93.33 | 95.24 | 96.67 |
| Accuracy | 81.25 | 100 | 100 | 93.75 | 66.67 | 66.67 | 79.17 | 83.33 |
| F1-score | 80.56 | 100 | 100 | 93.65 | 67 | 64.52 | 76.66 | 83.33 |
| Evaluation Based on a Signal/Image | ||||||||||
|---|---|---|---|---|---|---|---|---|---|---|
| NM | LL | RL | FB | LA | RA | |||||
| Classes | n = 4 | n = 6 | n = 4 | n = 6 | n = 4 | n = 6 | n = 4 | n = 6 | n = 6 | n = 6 |
| Frames/signals | k = 20 | k = 30 | k = 20 | k = 30 | k = 20 | k = 30 | k = 20 | k = 30 | k = 30 | k = 30 |
| Sensitivity | 75.18 | 52.69 | 79.64 | 65.71 | 92.61 | 87.28 | 100 | 100 | 37.84 | 76.72 |
| Specificity | 96.92 | 94.28 | 97.8 | 96.68 | 93.74 | 94.91 | 99.97 | 99.94 | 97.42 | 91.2 |
| Accuracy | 93.95 | 89.84 | 93.88 | 91.46 | 93.5 | 93.66 | 99.98 | 99.96 | 90.87 | 89.61 |
| F1-score | 77.26 | 52.53 | 84.9 | 72.16 | 85.69 | 81.88 | 99.98 | 99.94 | 47.68 | 61.85 |
| Evaluation Based on Majority Voting of a Sequence of a Subject | ||||||||||
| Frames/signals | k = 20 | k = 30 | k = 20 | k = 30 | k = 20 | k = 30 | k = 20 | k = 30 | k = 30 | k = 30 |
| Sensitivity | 100 | 50 | 100 | 100 | 100 | 100 | 100 | 100 | 50 | 100 |
| Specificity | 100 | 100 | 100 | 100 | 100 | 100 | 100 | 100 | 100 | 80 |
| Accuracy | 100 | 91.67 | 100 | 100 | 100 | 100 | 100 | 100 | 91.67 | 83.33 |
| F1-score | 100 | 66.67 | 100 | 100 | 100 | 100 | 100 | 100 | 66.67 | 66.67 |
| Correctly classified FB using n = 2, 4, and 6 for any k value. Blue corresponds to predicting FB. |  |
| A part of an NM sequence; white, red, and green corresponds to NM, LL, and RL predictions, respectively. n = 4, k = 1. | 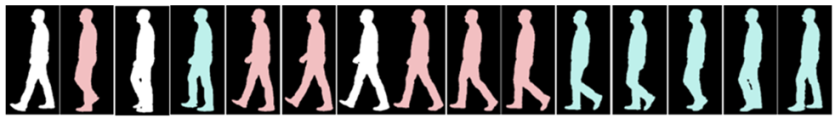 |
| Same part as the row above; white and green corresponds to NM and RL predictions, respectively. n = 4, k = 10, 20. |  |
| Same part as the row above; white and green corresponds to NM and RL predictions, respectively. n = 4, k = 30, and for n = 2. | 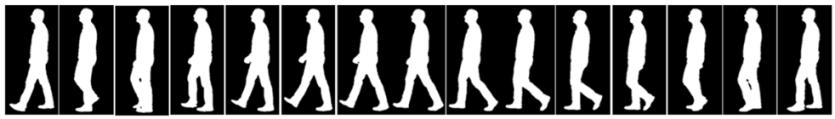 |
| A part of an LL sequence; white, red, and green corresponds to NM, LL, and RL predictions, respectively. n = 4, k = 1. |  |
| Same part as the row above; red corresponds to LL predictions. n = 4, k = 10, 20, and 30. | 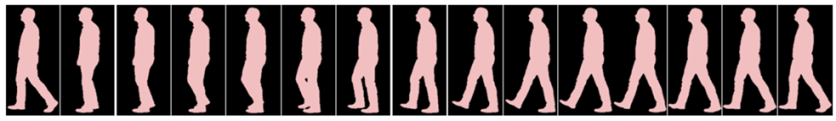 |
| Study | Data | Approach | Accuracy |
|---|---|---|---|
| Chavez et al. [54] | Private dataset (Parkinsonian gait) | Classical machine learning methods (RFC and XGBoost) | 50% (Normal vs. abnormal gait) |
| Cho et al. [13] | Private dataset (Parkinsonian gait) | Classical machine learning methods (hybrid PCA and LDA) | 77% (Normal vs. abnormal gait) |
| Proposed study | Public dataset (INIT database [50]) | Deep learning approach (1D CNN) | 90% (4 classes of gait) 77% (6 classes of gait) |
| Methods | Number of Classes (n = 4) | Number of Classes (n = 6) | ||||||
|---|---|---|---|---|---|---|---|---|
| Sensitivity | Specificity | Accuracy | F1-Score | Sensitivity | Specificity | Accuracy | F1-Score | |
| 2D CNN | 82.50 | 94.83 | 82.50 | 82.35 | 70.94 | 89.90 | 70.94 | 70.25 |
| 2D ResNet50 | 86.25 | 91.38 | 86.25 | 86.24 | 67.08 | 85.86 | 67.52 | 67.08 |
| Proposed 1D-CNN (k = 20) | 90.66 | 97.78 | 90.66 | 90.62 | 74.17 | 96.01 | 74.17 | 73.88 |
| Proposed 1D-CNN (k = 30) | 90.64 | 97.91 | 90.64 | 90.43 | 77.70 | 96.73 | 77.70 | 77.32 |
Disclaimer/Publisher’s Note: The statements, opinions and data contained in all publications are solely those of the individual author(s) and contributor(s) and not of MDPI and/or the editor(s). MDPI and/or the editor(s) disclaim responsibility for any injury to people or property resulting from any ideas, methods, instructions or products referred to in the content. |
© 2024 by the authors. Licensee MDPI, Basel, Switzerland. This article is an open access article distributed under the terms and conditions of the Creative Commons Attribution (CC BY) license (https://creativecommons.org/licenses/by/4.0/).
Share and Cite
Al-masni, M.A.; Marzban, E.N.; Al-Shamiri, A.K.; Al-antari, M.A.; Alabdulhafith, M.I.; Mahmoud, N.F.; Abdel Samee, N.; Kadah, Y.M. Gait Impairment Analysis Using Silhouette Sinogram Signals and Assisted Knowledge Learning. Bioengineering 2024, 11, 477. https://doi.org/10.3390/bioengineering11050477
Al-masni MA, Marzban EN, Al-Shamiri AK, Al-antari MA, Alabdulhafith MI, Mahmoud NF, Abdel Samee N, Kadah YM. Gait Impairment Analysis Using Silhouette Sinogram Signals and Assisted Knowledge Learning. Bioengineering. 2024; 11(5):477. https://doi.org/10.3390/bioengineering11050477
Chicago/Turabian StyleAl-masni, Mohammed A., Eman N. Marzban, Abobakr Khalil Al-Shamiri, Mugahed A. Al-antari, Maali Ibrahim Alabdulhafith, Noha F. Mahmoud, Nagwan Abdel Samee, and Yasser M. Kadah. 2024. "Gait Impairment Analysis Using Silhouette Sinogram Signals and Assisted Knowledge Learning" Bioengineering 11, no. 5: 477. https://doi.org/10.3390/bioengineering11050477