


Impact of Particle Size on the Setting Behavior of Tricalcium Silicate: A Comparative Study Using ISO 6876 Indentation Testing and Isothermal Induction Calorimetry
 , , , and
Abstract
:
1. Introduction
2. Materials and Methods
3. Results and Discussion
3.1. Features of Anhydrous Powders
3.2. Setting Behavior of Hydrated Samples
4. Conclusions
Author Contributions
Funding
Institutional Review Board Statement
Informed Consent Statement
Data Availability Statement
Acknowledgments
Conflicts of Interest
References
- Torabinejad, M.; Watson, T.F.; Pitt Ford, T.R. Sealing ability of a mineral trioxide aggregate when used as a root end filling material. J. Endod. 1993, 19, 591–595. [Google Scholar] [CrossRef]
- Donnermeyer, D.; Bürklein, S.; Dammaschke, T.; Schäfer, E. Endodontic sealers based on calcium silicates: A systematic review. Odontology 2018, 107, 421–436. [Google Scholar] [CrossRef]
- Loushine, B.A.; Bryan, T.E.; Looney, S.W.; Gillen, B.M.; Loushine, R.J.; Weller, R.N.; Pashley, D.H.; Tay, F.R. Setting Properties and Cytotoxicity Evaluation of a Premixed Bioceramic Root Canal Sealer. J. Endod. 2011, 37, 673–677. [Google Scholar] [CrossRef]
- Komabayashi, T.; Spångberg, L.S. Particle Size and Shape Analysis of MTA Finer Fractions Using Portland Cement. J. Endod. 2008, 34, 709–711. [Google Scholar] [CrossRef] [PubMed]
- Parirokh, M.; Torabinejad, M. Mineral Trioxide Aggregate: A Comprehensive Literature Review—Part I: Chemical, Physical, and Antibacterial Properties. J. Endod. 2010, 36, 16–27. [Google Scholar] [CrossRef] [PubMed]
- Parirokh, M.; Torabinejad, M. Mineral Trioxide Aggregate: A Comprehensive Literature Review—Part III: Clinical Applications, Drawbacks, and Mechanism of Action. J. Endod. 2010, 36, 400–413. [Google Scholar] [CrossRef]
- ISO 6876:2012; Dentistry—Root Canal Sealing Materials. Technical Committee: ISO/TC 106/SC 1 Filling and Restorative Materials; ISO: Geneva, Switzerland, 2012; p. 9. Available online: https://www.iso.org/standard/45117.html (accessed on 17 August 2023).
- Torres, F.F.E.; Guerreiro-Tanomaru, J.M.; Pinto, J.C.; Bonetti-Filho, I.; Tanomaru-Filho, M. Evaluation of flow and filling of root canal sealers using different methodologies. Rev. Odontol. UNESP 2019, 48, e20190112. [Google Scholar] [CrossRef]
- Jung, Y.; Yoon, J.-Y.; Patel, K.D.; Lee, H.-H.; Ma, L.; Kim, J.; Lee, J.-H.; Shin, J. Biological Effects of Tricalcium Silicate Nanoparticle-Containing Cement on Stem Cells from Human Exfoliated Deciduous Teeth. Nanomaterials 2020, 10, 1373. [Google Scholar] [CrossRef] [PubMed]
- Angelus. Technical Scientific Profile- Bio-C ® Sealer. 2018. Available online: https://angelus.ind.br/assets/uploads/2019/12/BIO-C%C2%AE-SEALER-Technical-Scientific-Profile-ENGLISH.pdf (accessed on 17 August 2023).
- Camilleri, J.; Atmeh, A.; Li, X.; Meschi, N. Present status and future directions: Hydraulic materials for endodontic use. Int. Endod. J. 2022, 55, 710–777. [Google Scholar] [CrossRef]
- Bortoluzzi, E.A.; Broon, N.J.; Bramante, C.M.; Felippe, W.T.; Tanomaru Filho, M.; Esberard, R.M. The Influence of Calcium Chloride on the Setting Time, Solubility, Disintegration, and pH of Mineral Trioxide Aggregate and White Portland Cement with a Radio-pacifier. J. Endod. 2009, 35, 550–554. [Google Scholar] [CrossRef]
- Bernardi, A.; Bortoluzzi, E.A.; Felippe, W.T.; Felippe, M.C.S.; Wan, W.S.; Teixeira, C.S. Effects of the addition of nanoparticulate calcium carbonate on setting time, dimensional change, compressive strength, solubility and pH of MTA. Int. Endod. J. 2016, 50, 97–105. [Google Scholar] [CrossRef] [PubMed]
- Da Silva, W.J.; Souza, P.H.C.; Rosa, E.A.R.; Cury, A.A.D.B.; Rached, R.N. Mineral Trioxide Aggregate as root canal filing material: Comparative study of physical properties. Rev. Odonto. Cienc. 2010, 25, 386–390. [Google Scholar] [CrossRef]
- Akbari, M.; Zebarjad, S.M.; Nategh, B.; Rouhani, A. Effect of Nano Silica on Setting Time and Physical Properties of Mineral Tri-oxide Aggregate. J. Endod. 2013, 39, 1448–14451. [Google Scholar] [CrossRef] [PubMed]
- Ha, W.N.; Nicholson, T.; Kahler, B.; Walsh, L.J. Methodologies for measuring the setting times of mineral trioxide aggregate and Portland cement products used in dentistry. Acta Biomater. Odontol. Scand. 2016, 2, 25–30. [Google Scholar] [CrossRef]
- Tsubota, K.; Mori, K.; Yasuda, G.; Kawamoto, R.; Yoshida, T.; Yamaguchi, K.; Kurokawa, H.; Miyazaki, M. Setting behaviour of luting cements monitored by an ultrasonic method. J. Oral Sci. 2008, 50, 117–121. [Google Scholar] [CrossRef]
- Mehta, P.K.K.; Monteiro, P.J.M. Concrete: Microstructure, Properties and Materials; McGraw-Hill: New York, NY, USA, 1993; 704p. [Google Scholar]
- Weiss, J. Experimental determination of the “Time Zero”, t0 (“Maturity-Zero”, M0). In Early Age Cracking in Cementitious Systems—Report of RILEM Technical Committee 181-EAS—Early Age Shrinkage Induced Stresses and Cracking in Cementitious Systems; Bentur, A., Ed.; RILEM Publications SARL: Champs-sur-Marne, France, 2003; pp. 195–206. Available online: https://www.rilem.net/boutique/fiche.php?cat=book&reference=rep025-019 (accessed on 17 August 2023).
- Sandberg, J.; Liberman, S. Monitoring and Evaluation of Cement Hydration by Semi-Adiabatic Field Calorimetry. ACI Symp. Publ. 2007, 241, 13–24. [Google Scholar] [CrossRef]
- Hu, J.; Ge, Z.; Wang, K. Influence of cement fineness and water-to-cement ratio on mortar early-age heat of hydration and set times. J. Constr. Build. Mater. 2014, 50, 657–663. [Google Scholar] [CrossRef]
- Taylor, H.F.W. Cement Chemistry; Thomas Telford: London, UK, 1997; Volume 20, p. 335. [Google Scholar]
- Neville, A.M. Properties of Concrete, 5th ed.; Pearson: London, UK, 2011. [Google Scholar]
- Ramachandran, V.S. Concrete Admixtures Handbook: Properties, Science and Technology, 2nd ed.; Elsevier: Amsterdam, The Netherlands, 1995. [Google Scholar]
- Jawed, I.; Skalny, J.; Young, J. Hydration of Portland Cement. In Structure and Performance of Cements; Barbes, P., Ed.; Applied Science Publishers: London, UK, 1983. [Google Scholar]
- Viecili, M.J.C.; Hastenpflug, D.; Girardi, R. Comparativo entre o teste de Vicat e a calorimetria semi-adiabática para determinação do tempo de início e fim de pega em cimentos Portland. Matéria 2018, 23. [Google Scholar] [CrossRef]
- Allen, A.; McLaughlin, J.; Neumann, D.; Livingston, R. In situ quasi-elastic scattering characterization of particle size effects on the hydration of tricalcium silicate. J. Mater. Res. 2004, 19, 3242–3254. [Google Scholar] [CrossRef]
- Garrault, S.; Behr, T.; Nonat, A. Formation of the C−S−H Layer during Early Hydration of Tricalcium Silicate Grains with Different Sizes. J. Phys. Chem. B 2005, 110, 270–275. [Google Scholar] [CrossRef]
- Lee, B.-S.; Lin, H.-P.; Chan, J.C.C.; Wang, W.-C.; Hung, P.-H.; Tsai, Y.-H.; Lee, Y.-L. A novel sol-gel-derived calcium silicate cement with short setting time for application in endodontic repair of perforations. Int. J. Nanomed. 2018, 13, 261–271. [Google Scholar] [CrossRef] [PubMed]
- Abdalla, M.M.; Lung, C.Y.K.; Neelakantan, P.; Matinlinna, J.P. A novel, doped calcium silicate bioceramic synthesized by sol–gel method: Investigation of setting time and biological properties. J. Biomed. Mater. Res. Part B Appl. Biomater. 2019, 108, 56–66. [Google Scholar] [CrossRef]
- Modolon, H.B.; Inocente, J.; Bernardin, A.M.; Montedo, O.R.K.; Arcaro, S. Nanostructured biological hydroxyapatite from Tilapia bone: A pathway to control crystallite size and crystallinity. Ceram. Int. 2021, 47, 27685–27693. [Google Scholar] [CrossRef]
- Hesse, C.; Goetz-Neunhoeffer, F.; Neubauer, J. A new approach in quantitative in-situ XRD of cement pastes: Correlation of heat flow curves with early hydration reactions. Cem. Concr. Res. 2011, 41, 123–128. [Google Scholar] [CrossRef]
- Jansen, D.; Bergold, S.T.; Goetz-Neunhoeffer, F.; Neubauer, J. The hydration of alite: A time-resolved quantitative X-ray diffraction approach using the G-factor method compared with heat release. J. Appl. Crystallogr. 2011, 44, 895–901. [Google Scholar] [CrossRef]
- Bergold, S.; Goetz-Neunhoeffer, F.; Neubauer, J. Quantitative analysis of C–S–H in hydrating alite pastes by in-situ XRD. Cem. Concr. Res. 2013, 53, 119–126. [Google Scholar] [CrossRef]
- Jansen, D.; Goetz-Neunhoeffer, F.; Lothenbach, B.; Neubauer, J. The early hydration of Ordinary Portland Cement (OPC): An approach comparing measured heat flow with calculated heat flow from QXRD. Cem. Concr. Res. 2012, 42, 134–138. [Google Scholar] [CrossRef]
- Jennings, H.M.; Thomas, J.J. Materials of Cement Science Primer: The Science of Concrete; Northwestern University Libraries: Evanston, IL, USA, 2009; p. 98. [Google Scholar]
- Rothstein, D.; Thomas, J.J.; Christensen, B.J.; Jennings, H.M. Solubility behavior of Ca-, S-, Al-, and Si-bearing solid phases in Portland cement pore solutions as a function of hydration time. Cem. Concr. Res. 2002, 32, 1663–1671. [Google Scholar] [CrossRef]


| Sample Preparation | Average Particle Size (D50) | Surface Area (m2/g) |
|---|---|---|
| As received | 5.40 µm | 4.84 m2/g |
| 1 h-milled | 2.79 µm | 12.22 m2/g |
| 2 h-milled | 0.82 µm | 15.84 m2/g |
| Sample | Indentation Final Setting Time (h) | Midpoint of the Acceleration Period (h) | Uppermost Point of the Acceleration Period (h) |
|---|---|---|---|
| As received (5.40 µm) | 5.5 | 4.87 | 8.11 |
| 1 h-milled (2.79 µm) | 4.5 (18.2%) | 4.31 (11.5%) | 7.64 (5.8%) |
| 2 h-milled (0.82 µm) | 4.2 (6.7%) | 4.13 (4.2%) | 7.28 (4.7%) |
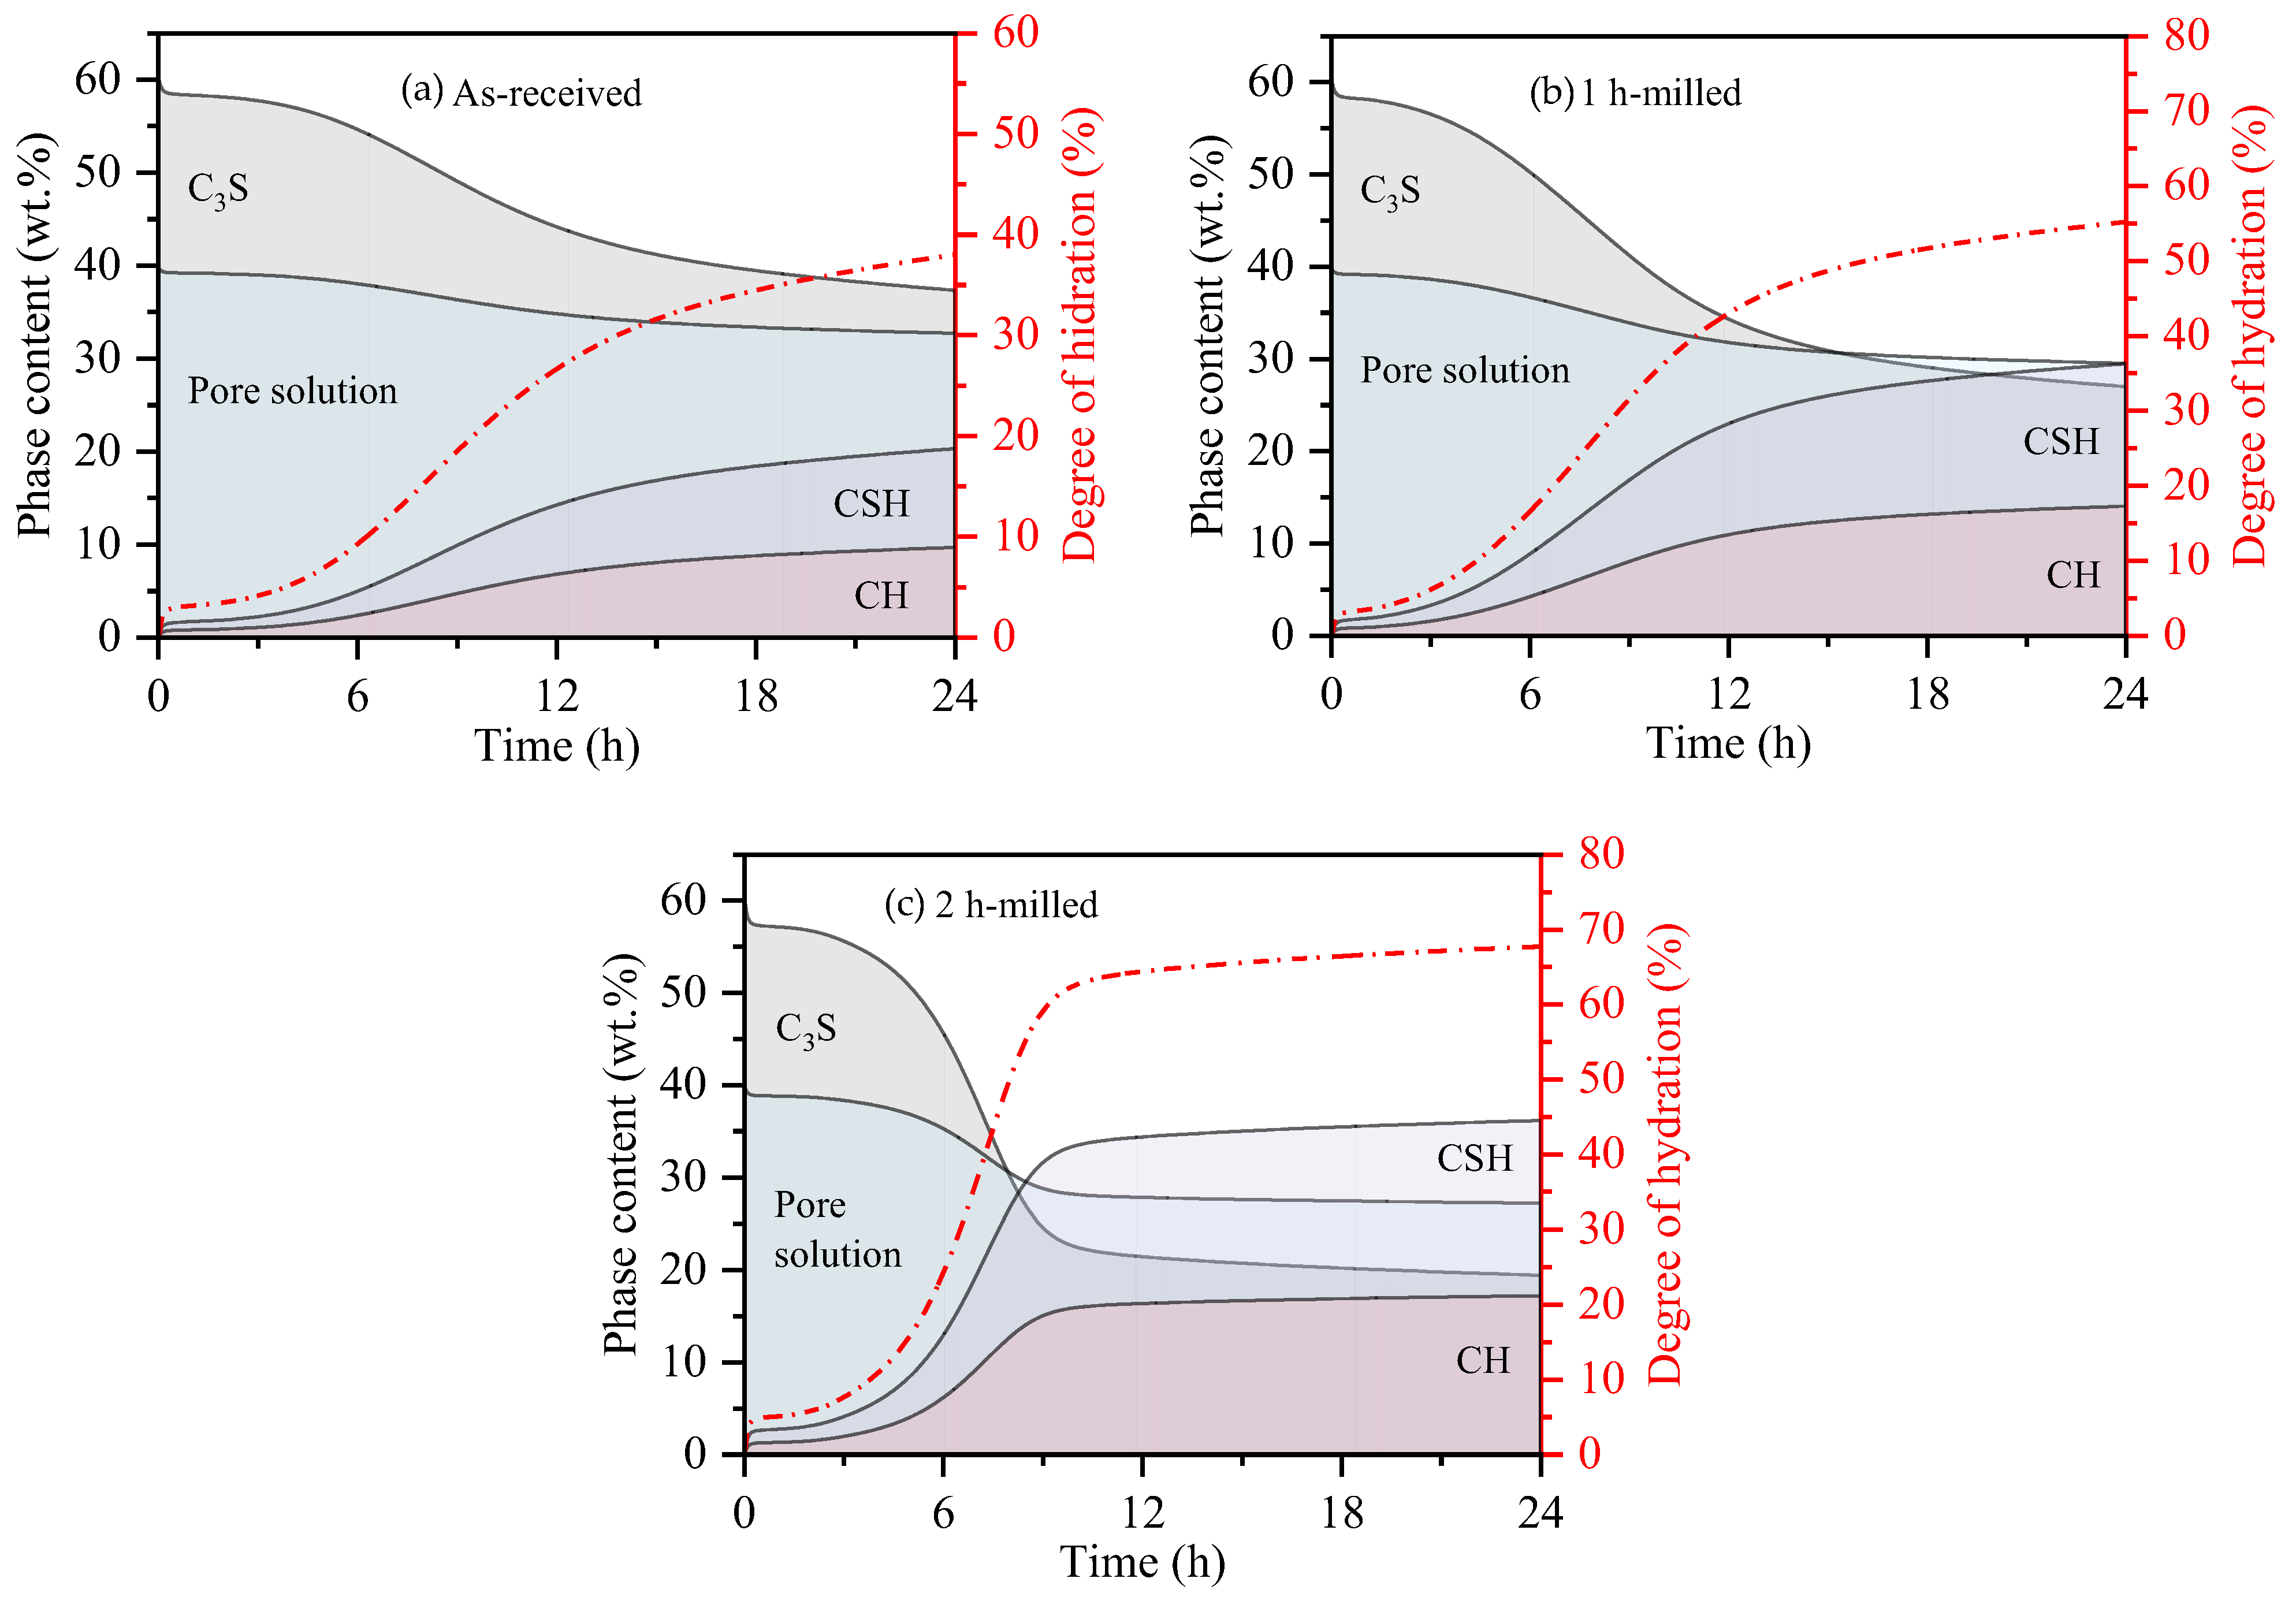
| Sample | * Final Indentation Time/ ** Time of Hydration (h) | Degree of Hydration (%) | Solid Phase’s Proportion (wt.%) | ||
|---|---|---|---|---|---|
| CSH | CH | Unhydrate C3S | |||
| As-received | 5.5 * | 8 | 7 | 3 | 90 |
| 1 h-milled | 4.5 * | 10 | 9 | 4 | 87 |
| 2 h-milled | 4.2 * | 11 | 10 | 5 | 85 |
| As-received | 11 ** | 24 | 20 | 10 | 70 |
| 1 h-milled | 40 | 31 | 15 | 54 | |
| 2 h-milled | 63 | 47 | 22 | 31 | |
| As-received | 24 ** | 38 | 30 | 14 | 56 |
| 1 h-milled | 55 | 42 | 20 | 38 | |
| 2 h-milled | 68 | 50 | 23 | 27 | |
Disclaimer/Publisher’s Note: The statements, opinions and data contained in all publications are solely those of the individual author(s) and contributor(s) and not of MDPI and/or the editor(s). MDPI and/or the editor(s) disclaim responsibility for any injury to people or property resulting from any ideas, methods, instructions or products referred to in the content. |
© 2023 by the authors. Licensee MDPI, Basel, Switzerland. This article is an open access article distributed under the terms and conditions of the Creative Commons Attribution (CC BY) license (https://creativecommons.org/licenses/by/4.0/).
Share and Cite
Bernardi, A.V.; Souza, M.T.; Montedo, O.R.K.; Domingues, F.H.F.; Arcaro, S.; Kopper, P.M.P. Impact of Particle Size on the Setting Behavior of Tricalcium Silicate: A Comparative Study Using ISO 6876 Indentation Testing and Isothermal Induction Calorimetry. Bioengineering 2024, 11, 36. https://doi.org/10.3390/bioengineering11010036
Bernardi AV, Souza MT, Montedo ORK, Domingues FHF, Arcaro S, Kopper PMP. Impact of Particle Size on the Setting Behavior of Tricalcium Silicate: A Comparative Study Using ISO 6876 Indentation Testing and Isothermal Induction Calorimetry. Bioengineering. 2024; 11(1):36. https://doi.org/10.3390/bioengineering11010036
Chicago/Turabian StyleBernardi, Anarela Vassen, Marcelo Tramontin Souza, Oscar Rubem Klegues Montedo, Felipe Henrique Fassina Domingues, Sabrina Arcaro, and Patrícia Maria Poli Kopper. 2024. "Impact of Particle Size on the Setting Behavior of Tricalcium Silicate: A Comparative Study Using ISO 6876 Indentation Testing and Isothermal Induction Calorimetry" Bioengineering 11, no. 1: 36. https://doi.org/10.3390/bioengineering11010036