
Introducing an Open-Source Regional Water Quality Data Viewer Tool to Support Research Data Access

 ,
,  and
and
Abstract
:1. Introduction
1.1. Background and Need
1.2. Application Objectives
2. Methods: Application Design and Capabilities
2.1. Application Design
2.2. WQDV Data Schema
2.3. Data Access
2.3.1. Minimum Limit Values
2.3.2. Maximum Values
2.4. Visualization
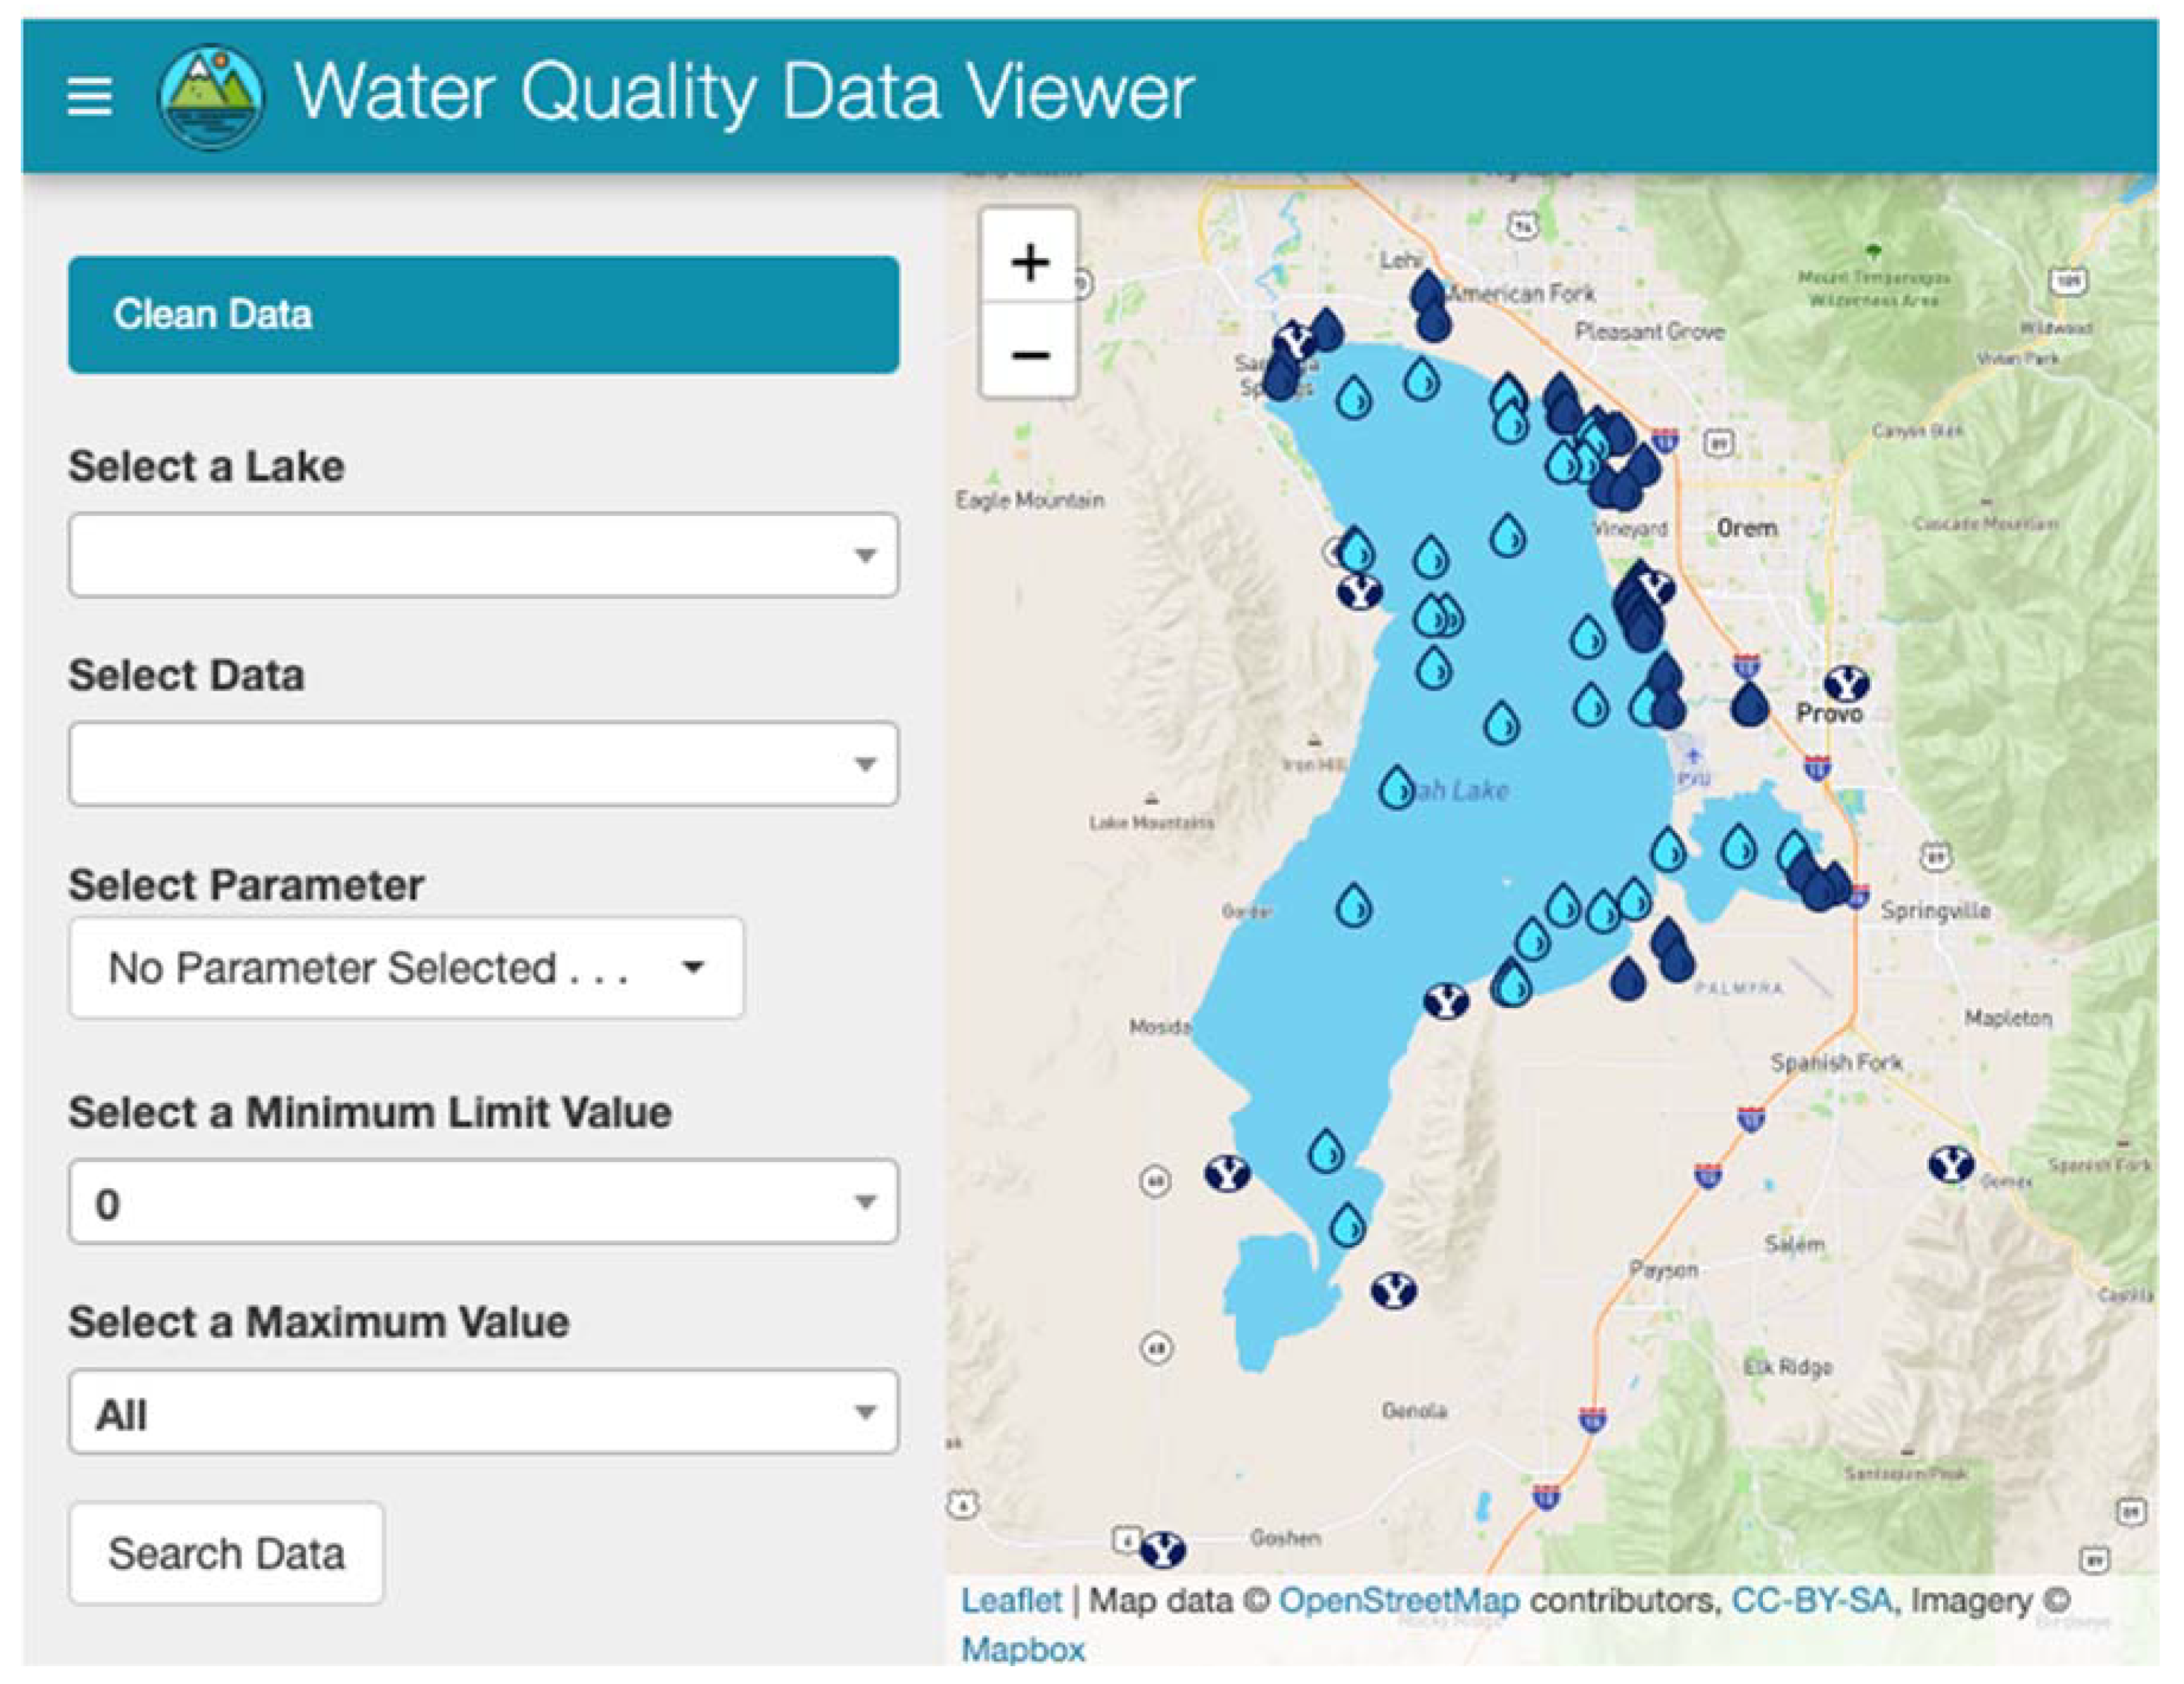
2.4.1. Spatial Map
2.4.2. Time Series
2.5. Downloading Data
2.5.1. Download Data by Station
2.5.2. Download Plot Data
3. Case Study
3.1. Utah Water Quality
3.2. Utah Water Quality Data
3.2.1. Brigham Young University Data
3.2.2. State of Utah Data
4. Case Study Discussion
4.1. Background
4.2. Case Study Data
4.3. Data Limits
4.3.1. Minimum Limit Value
4.3.2. Maximum Value
4.4. Data Visualization
4.4.1. Maps
4.4.2. Graphs
5. Conclusions
- The difficulty in archiving and providing access to research data, or data gathered by other groups, to other users or interested parties.
- The difficulty of determining what data are available in a large, comprehensive database, such as the AWQMS database.
6. WQDV Acquisition
Author Contributions
Funding
Data Availability Statement
Acknowledgments
Conflicts of Interest
References
- Read, E.K.; Carr, L.; De Cicco, L.; Dugan, H.A.; Hanson, P.C.; Hart, J.A.; Kreft, J.; Read, J.S.; Winslow, L.A. Water quality data for national—scale aquatic research: The Water Quality Portal. Water Resour. Res. 2017, 53, 1735–1745. [Google Scholar] [CrossRef]
- Tomasic, A.; Simon, E. Improving access to environmental data using context information. SIGMOD Rec. 1997, 26, 11–15. [Google Scholar] [CrossRef] [Green Version]
- Pokorný, J. Database architectures: Current trends and their relationships to environmental data management. Environ. Model. Softw. 2006, 21, 1579–1586. [Google Scholar] [CrossRef]
- Horsburgh, J.S.; Tarboton, D.G.; Maidment, D.R.; Zaslavsky, I. A relational model for environmental and water resources data. Water Resour. Res. 2008, 44. [Google Scholar] [CrossRef] [Green Version]
- Beran, B.; Piasecki, M. Availability and coverage of hydrologic data in the US geological survey National Water Information System (NWIS) and US Environmental Protection Agency Storage and Retrieval System (STORET). Earth Sci. Inform. 2008, 1, 119–129. [Google Scholar] [CrossRef] [Green Version]
- Slawecki, T.; Young, D.; Dean, B.; Bergenroth, B.; Sparks, K. Pilot implementation of the US EPA interoperable watershed network. Open Geospat. Data Softw. Stand. 2017, 2, 1–11. [Google Scholar] [CrossRef] [Green Version]
- Park, Y.S.; Engel, B.A.; Kim, J.; Theller, L.; Chaubey, I.; Merwade, V.; Lim, K.J. A web tool for STORET/WQX water quality data retrieval and Best Management Practice scenario suggestion. J. Environ. Manag. 2015, 150, 21–27. [Google Scholar] [CrossRef] [PubMed]
- Soranno, P.A.; Bissell, E.G.; Cheruvelil, K.S.; Christel, S.T.; Collins, S.M.; Fergus, C.E.; Filstrup, C.T.; Lapierre, J.-F.; Lottig, N.R.; Oliver, S.K. Building a multi-scaled geospatial temporal ecology database from disparate data sources: Fostering open science and data reuse. GigaScience 2015, 4. [Google Scholar] [CrossRef] [PubMed] [Green Version]
- Larsen, S.; Hamilton, S.; Lucido, J.; Garner, B.; Young, D. Supporting diverse data providers in the open water data initiative: Communicating water data quality and fitness of use. JAWRA J. Am. Water Resour. Assoc. 2016, 52, 859–872. [Google Scholar] [CrossRef]
- Tarboton, D.G.; Horsburgh, J.S.; Maidment, D.R. CUAHSI Community Observations Data Model (ODM) Version 1.1 Design Specifications. Des Doc. 2008. Available online: https://www.cuahsi.org/ (accessed on 7 June 2021).
- Tarboton, D.G.; Idaszak, R.; Ames, D.; Goodall, J.; Horsburgh, J.S.; Band, L.; Merwade, V.; Song, C.; Couch, A.; Valentine, D. HydroShare: An Online, Collaborative Environment for the Sharing of Hydrologic Data and Models. 2012. Available online: https://digitalcommons.usu.edu/ (accessed on 7 June 2021).
- Bandaragoda, C.; Tarboton, D.; Maidment, D. Hydrology’s efforts toward the cyberfrontier. EOS 2006, 87. [Google Scholar] [CrossRef]
- Beran, B.; Piasecki, M. Engineering new paths to water data. Comput. Geosci. 2009, 35, 753–760. [Google Scholar] [CrossRef]
- Valentine, D.; Zaslavsky, I.; Whitenack, T.; Maidment, D. Design and implementation of CUAHSI WATERML and WaterOneFlow Web services. In Proceedings of the AGU Fall Meeting Abstracts, San Francisco, CA, USA, 10–14 December 2007; p. IN53C-08. [Google Scholar]
- Swain, N.R. Tethys Platform: A Development and Hosting Platform for Water Resources Web Apps. Ph.D. Thesis, Brigham Young University, Provo, UT, USA, 2015. [Google Scholar]
- Crawley, S.; Ames, D.P.; Li, Z.; Tarboton, D.G. HydroShare GIS: Visualizing Spatial Data in the Cloud. Open Water J. 2017, 4, 3. [Google Scholar]
- Heard, J.; Tarboton, D.G.; Idaszak, R.; Horsburgh, J.S.; Ames, D.; Bedig, A.; Castronova, A.M.; Couch, A. An architectural overview of HydroShare, a next-generation hydrologic information system. In Proceedings of the 11th International Conference on Hydroinformatics, New York, NY, USA, 17–21 August 2014. [Google Scholar]
- Morsy, M.M.; Goodall, J.L.; Castronova, A.M.; Dash, P.; Merwade, V.; Sadler, J.M.; Rajib, M.A.; Horsburgh, J.S.; Tarboton, D.G. Design of a metadata framework for environmental models with an example hydrologic application in HydroShare. Environ. Model. Softw. 2017, 93, 13–28. [Google Scholar] [CrossRef] [Green Version]
- Sadler, J.M.; Ames, D.P.; Livingston, S.J. Extending HydroShare to enable hydrologic time series data as social media. J. Hydroinformatics 2016, 18, 198–209. [Google Scholar] [CrossRef] [Green Version]
- Horsburgh, J.S.; Aufdenkampe, A.K.; Mayorga, E.; Lehnert, K.A.; Hsu, L.; Song, L.; Jones, A.S.; Damiano, S.G.; Tarboton, D.G.; Valentine, D. Observations Data Model 2: A community information model for spatially discrete Earth observations. Environ. Model. Softw. 2016, 79, 55–74. [Google Scholar] [CrossRef] [Green Version]
- Conner, L.G.; Ames, D.P.; Gill, R.A. HydroServer Lite as an open source solution for archiving and sharing environmental data for independent university labs. Ecol. Inform. 2013, 18, 171–177. [Google Scholar] [CrossRef]
- Ames, D.P.; Horsburgh, J.S.; Cao, Y.; Kadlec, J.; Whiteaker, T.; Valentine, D. HydroDesktop: Web services-based software for hydrologic data discovery, download, visualization, and analysis. Environ. Model. Softw. 2012, 37, 146–156. [Google Scholar] [CrossRef]
- Horsburgh, J.S.; Tarboton, D.G.; Hooper, R.P.; Zaslavsky, I. Managing a community shared vocabulary for hydrologic observations. Environ. Model. Softw. 2014, 52, 62–73. [Google Scholar] [CrossRef]
- Boldrini, E.; Mazzetti, P.; Nativi, S.; Santoro, M.; Papeschi, F.; Roncella, R.; Olivieri, M.; Bordini, F.; Pecora, S. WMO Hydrological Observing System (WHOS) broker: Implementation progress and outcomes. In Proceedings of the EGU General Assembly Conference, 4–8 May 2020; p. 14755. Available online: https://ui.adsabs.harvard.edu/abs/2020EGUGA..2214755B/abstract (accessed on 7 June 2021).
- Hallegraeff, G.M. A review of harmful algal blooms and their apparent global increase. Phycologia 1993, 32, 79–99. [Google Scholar] [CrossRef] [Green Version]
- Probe Slated in Pollution of Utah Lake. Deseret News, 21 July 1948; 8.
- Merritt, L. Utah Lake, a Few Considerations. Unpubl. Lett. 2004, 3. [Google Scholar]


| Name | Type | Description |
|---|---|---|
| Activity Start Date | Date | Date when the sample was taken |
| Monitoring Location ID | Variant | Number assigned to the station |
| Monitoring Location Name | String | Name assigned to the station |
| Monitoring Location Latitude | ||
| Monitoring Location Longitude | ||
| Monitoring Location Type | ||
| Characteristic Name | String | Parameter name |
| Sample Fraction | String | Total or dissolved parameter measurement differentiated |
| Result Value | Single | Left blank if below the detection limit or lower than the reporting value |
| Result Unit | String | |
| Detection Condition | String | Some methods provide concentrations below the detection limit. Many water quality databases, including AWQMS, allow a measurement to have a lower reporting value that is above the detection limit. This field indicates if the reported value is below the detection limit or below the reporting limit |
| Detection Limit Value | Single | For data below the detection limit or reporting limit, most water quality databases, including AQWMS, leave the results “Results Value” field empty, users can either ignore the measurement, use the detection, reporting, or some other value as appropriate when this occurs |
| Detection Limit Unit | String | Units of the Detection Limit Value |
| Measurement Type | Number of Measurements |
|---|---|
| Nitrogen | 397 |
| Orthophosphate | 102 |
| Phosphate-phosphorus | 418 |
| TOTAL Measurements | 917 |
| Measurement Type | Number of Measurements | |
|---|---|---|
| In-Lake Stations | Out-of-Lake Stations | |
| Ammonia-nitrogen | 481 | 1439 |
| Chlorophyll a | 47 | 32 |
| Chlorophyll a, corrected for pheophytin | 426 | 43 |
| Chlorophyll a, free of pheophytin | 218 | 66 |
| Chlorophyll a, uncorrected for pheophytin | 790 | 89 |
| Depth, Secchi disk depth | 3082 | 1 |
| Dissolved oxygen (DO) | 5618 | 2033 |
| Inorganic nitrogen (nitrate and nitrite) | 896 | 2061 |
| Magnesium | 757 | 1209 |
| Nitrate | 71 | 60 |
| Nitrite | 1 | 2 |
| Nitrogen | 1011 | 1221 |
| Orthophosphate | 7 | 41 |
| pH | 5991 | 2682 |
| Phosphate-phosphorus | 2184 | 2518 |
| Specific conductance | 6019 | 2835 |
| Temperature, water | 5708 | 2048 |
| Total dissolved solids | 717 | 1551 |
| Total suspended solids | 939 | 1509 |
| Turbidity | 417 | 805 |
| Total Measurements | 13,652 | 22,245 |
Publisher’s Note: MDPI stays neutral with regard to jurisdictional claims in published maps and institutional affiliations. |
© 2021 by the authors. Licensee MDPI, Basel, Switzerland. This article is an open access article distributed under the terms and conditions of the Creative Commons Attribution (CC BY) license (https://creativecommons.org/licenses/by/4.0/).
Share and Cite
Dolder, D.; Williams, G.P.; Miller, A.W.; Nelson, E.J.; Jones, N.L.; Ames, D.P. Introducing an Open-Source Regional Water Quality Data Viewer Tool to Support Research Data Access. Hydrology 2021, 8, 91. https://doi.org/10.3390/hydrology8020091
Dolder D, Williams GP, Miller AW, Nelson EJ, Jones NL, Ames DP. Introducing an Open-Source Regional Water Quality Data Viewer Tool to Support Research Data Access. Hydrology. 2021; 8(2):91. https://doi.org/10.3390/hydrology8020091
Chicago/Turabian StyleDolder, Danisa, Gustavious P. Williams, A. Woodruff Miller, Everett James Nelson, Norman L. Jones, and Daniel P. Ames. 2021. "Introducing an Open-Source Regional Water Quality Data Viewer Tool to Support Research Data Access" Hydrology 8, no. 2: 91. https://doi.org/10.3390/hydrology8020091