Article

Assessment of Alternative Agricultural Land Use Options for Extending the Availability of the Ogallala Aquifer in the Northern High Plains of Texas

1
Department of Ecosystem Science and Management, Texas A&M University, 2138 TAMU, College Station, TX 77845, USA
2
USDA-ARS Conservation and Production Research Laboratory, 2300 Experiment Station Rd., P.O. Drawer 10, Bushland, TX 79012, USA
3
Texas A&M AgriLife Research, Texas A&M AgriLife Research and Extension Center, 6500 Amarillo Blvd W, Amarillo, TX 79106, USA
4
Forage and Livestock Production Unit, USDA-ARS Grazinglands Research Laboratory, 7207 West Cheyenne Street, El Reno, OK 73036, USA
*
Author to whom correspondence should be addressed.
Hydrology 2018, 5(4), 53; https://doi.org/10.3390/hydrology5040053
Submission received: 11 September 2018 / Revised: 23 September 2018 / Accepted: 25 September 2018 / Published: 26 September 2018

Abstract

:
The Ogallala Aquifer has experienced a continuous decline in water levels due to decades of irrigation pumping with minimal recharge. Corn is one of the major irrigated crops in the semi-arid Northern High Plains (NHP) of Texas. Selection of less water-intensive crops may provide opportunities for groundwater conservation. Modeling the long-term hydrologic impacts of alternative crops can be a time-saving and cost-effective alternative to field-based experiments. A newly developed management allowed depletion (MAD) irrigation scheduling algorithm for Soil and Water Assessment Tool (SWAT) was used in this study. The impacts of irrigated farming, dryland farming, and continuous fallow on water conservation were evaluated. Results indicated that simulated irrigation, evapotranspiration, and crop yield were representative of the measured data. Approximately 19%, 21%, and 32% reductions in annual groundwater uses were associated with irrigated soybean, sunflower, and sorghum, respectively, as compared to irrigated corn. On average, annual soil water depletion was more than 52 mm for dryland farming scenarios. In contrast, only 18 mm of soil water was lost to evaporation annually, for the long-term continuous fallow simulation. The fallow scenario also showed 31 mm of percolation for aquifer recharge.

1. Introduction

The Ogallala Aquifer serves as a crucial groundwater source for agricultural production in the semi-arid Texas High Plains (THP). This region is one of the most productive irrigated agricultural regions in the United States (U.S.). However, decades of irrigation pumping combined with limited recharge has led to reduced water levels in the aquifer, resulting in decreased well capacities. The saturated thickness of the aquifer generally decreases in a southward gradient across the THP (Figure 1). Differences in associated pumping capacities effectively divides the THP into two agricultural production regions, the Northern High Plains (NHP) and the Southern High Plains (SHP). The SHP consists of 16 counties extending from northwest of Lubbock to Midland, while the NHP region is comprised of the 25 northernmost counties of the Texas Panhandle. The saturated thickness of the aquifer and associated well capacities in each region directly influence land use and crop composition. Cotton (Gossypium hirsutum L.) is the major cultivated crop in the SHP, which produces nearly one-third of all U.S. cotton [1]. Currently, grain corn (Zea mays L.) is the dominant irrigated crop grown in the NHP, and several counties have reported some of the largest average corn yields in the nation [1]. However, production of relatively water-intensive corn in this semi-arid environment often requires large amounts of supplemental irrigation, as in-season precipitation is inadequate, variable, and unpredictable.
Groundwater regulations have been enacted in major portions of the THP for restricting annual irrigation withdrawals to mitigate depletion of the Ogallala Aquifer [2]. In response to these regulations, many producers have expressed increased interest in crops with reduced water requirements or even conversion to dryland farming [3]. Less water-intensive crops, such as cotton, soybean (Glycine max L.), sunflower (Helianthus annuus L.), grain sorghum (Sorghum bicolor L.), winter wheat (Triticum aestivum L.), and others are of interest. For example, drought-tolerant crops, such as cotton, grain sorghum, and winter wheat, are less sensitive to water stress and can produce profitable yields under both limited irrigation and dryland conditions [4,5]. Although less drought tolerant than wheat and sorghum, soybean is adapted to drought conditions because photosynthesis continues at lower leaf-water potentials [6], and yield is less sensitive to water deficit during the vegetative stage [7]. Sunflowers are characterized by deep and extensive root systems, which can extract water and nutrients from the soil profile as deep as 3.0 m [8,9,10]. This allows sunflowers to survive in even severe drought conditions. According to the National Agricultural Statistics Service (NASS), 47% of all cultivated agricultural land in the THP was classified as dryland in 2017 [1]. Dryland crop production in the THP is expected to increase as groundwater levels continue to decline and competition for other uses increases [11]. Accurate crop-specific water requirements and their respective impacts on groundwater depletion are useful for selecting viable and profitable alternative crops in the NHP.
Long-term field experiments for determining irrigation requirements of various crops are time consuming and costly. Computational modeling programs are especially useful for studying long-term effects of crop or land use selections on hydrology [12]. Modeling applications also mitigate the time and financial resources needed to evaluate alternative agricultural land use options compared to the field experiments. However, adequate model parameterization and representative agronomic algorithms are required for meaningful simulation and interpretation of results. Past modeling attempts have been unable to adequately simulate irrigation strategies that use management allowed depletion (MAD) scheduling, an approach used by producers in the THP and in the arid and semi-arid climates around the world [13,14,15,16,17,18].
The Soil and Water Assessment Tool (SWAT) is a physically-based, semi-distributed, watershed-scale hydrologic model [19]. Primary model inputs include elevation information, land use and cover, soil properties, climate conditions, and management practices such as tillage, planting date, fertilizer application, irrigation scheduling, and harvest date [20]. Recently, Chen et al. [21] developed and tested a new auto-irrigation algorithm for simulating MAD irrigation scheduling with the SWAT model using ten years of measured irrigation, evapotranspiration (ET), and crop growth data from lysimeter fields at the USDA-ARS Conservation and Production Research Laboratory (CPRL), Bushland, Texas. The MAD-based algorithm more accurately simulated irrigation practices typical of the THP and outperformed the default auto-irrigation functions in SWAT [21]. The improved algorithm allows for a user defined depletion of plant available water to occur before irrigations are triggered. In addition, the MAD algorithm suspends irrigation after crop harvest. However, when using the SWAT default soil water content auto-irrigation method, irrigation may still occur after crop harvest, resulting in the overestimation of seasonal irrigation [22,23]. These refinements allow for improved simulation of irrigation practices that result in more accurate representation of long-term land use scenarios under irrigated conditions.
Altering crop composition or changing a land use regime (e.g., irrigated farming, dryland farming, or fallow with bare soil conditions) in the THP may significantly influence the water budget by altering proportions of irrigation, ET, soil water content, and groundwater recharge. For example, using the SWAT model, Luan et al. [24] predicted an 8% increase in annual ET in the Hetao irrigation district of China due to a change in land use from wheat to corn. VanLoocke et al. [25] also reported that land use conversion from corn to perennial grasses would increase ET by up to 150 mm yr−1 and decrease streamflow by 250 mm yr−1 in the Corn Belt of U.S. Midwest. However, long-term assessments of the water use impacts of land use scenarios are lacking for arid/semi-arid regions, such as the THP, due to limited field-based data [26]. In addition, no study has provided a comprehensive assessment of water balance for long-term continuous fallow conditions.
The primary goal of this study was to assess the impacts of multiple land use scenarios of irrigated farming, dryland farming, and entire-year fallow on ET, soil water content, and crop yield in the NHP region. Specifically, the objectives of this study were to: (1) determine the appropriateness of various crops including corn, winter wheat, cotton, soybean, sunflower, sorghum under irrigated and dryland farming conditions in the NHP; and (2) quantify the effects of long-term continuous fallow on groundwater recharge and soil water depletion.

2. Materials and Methods
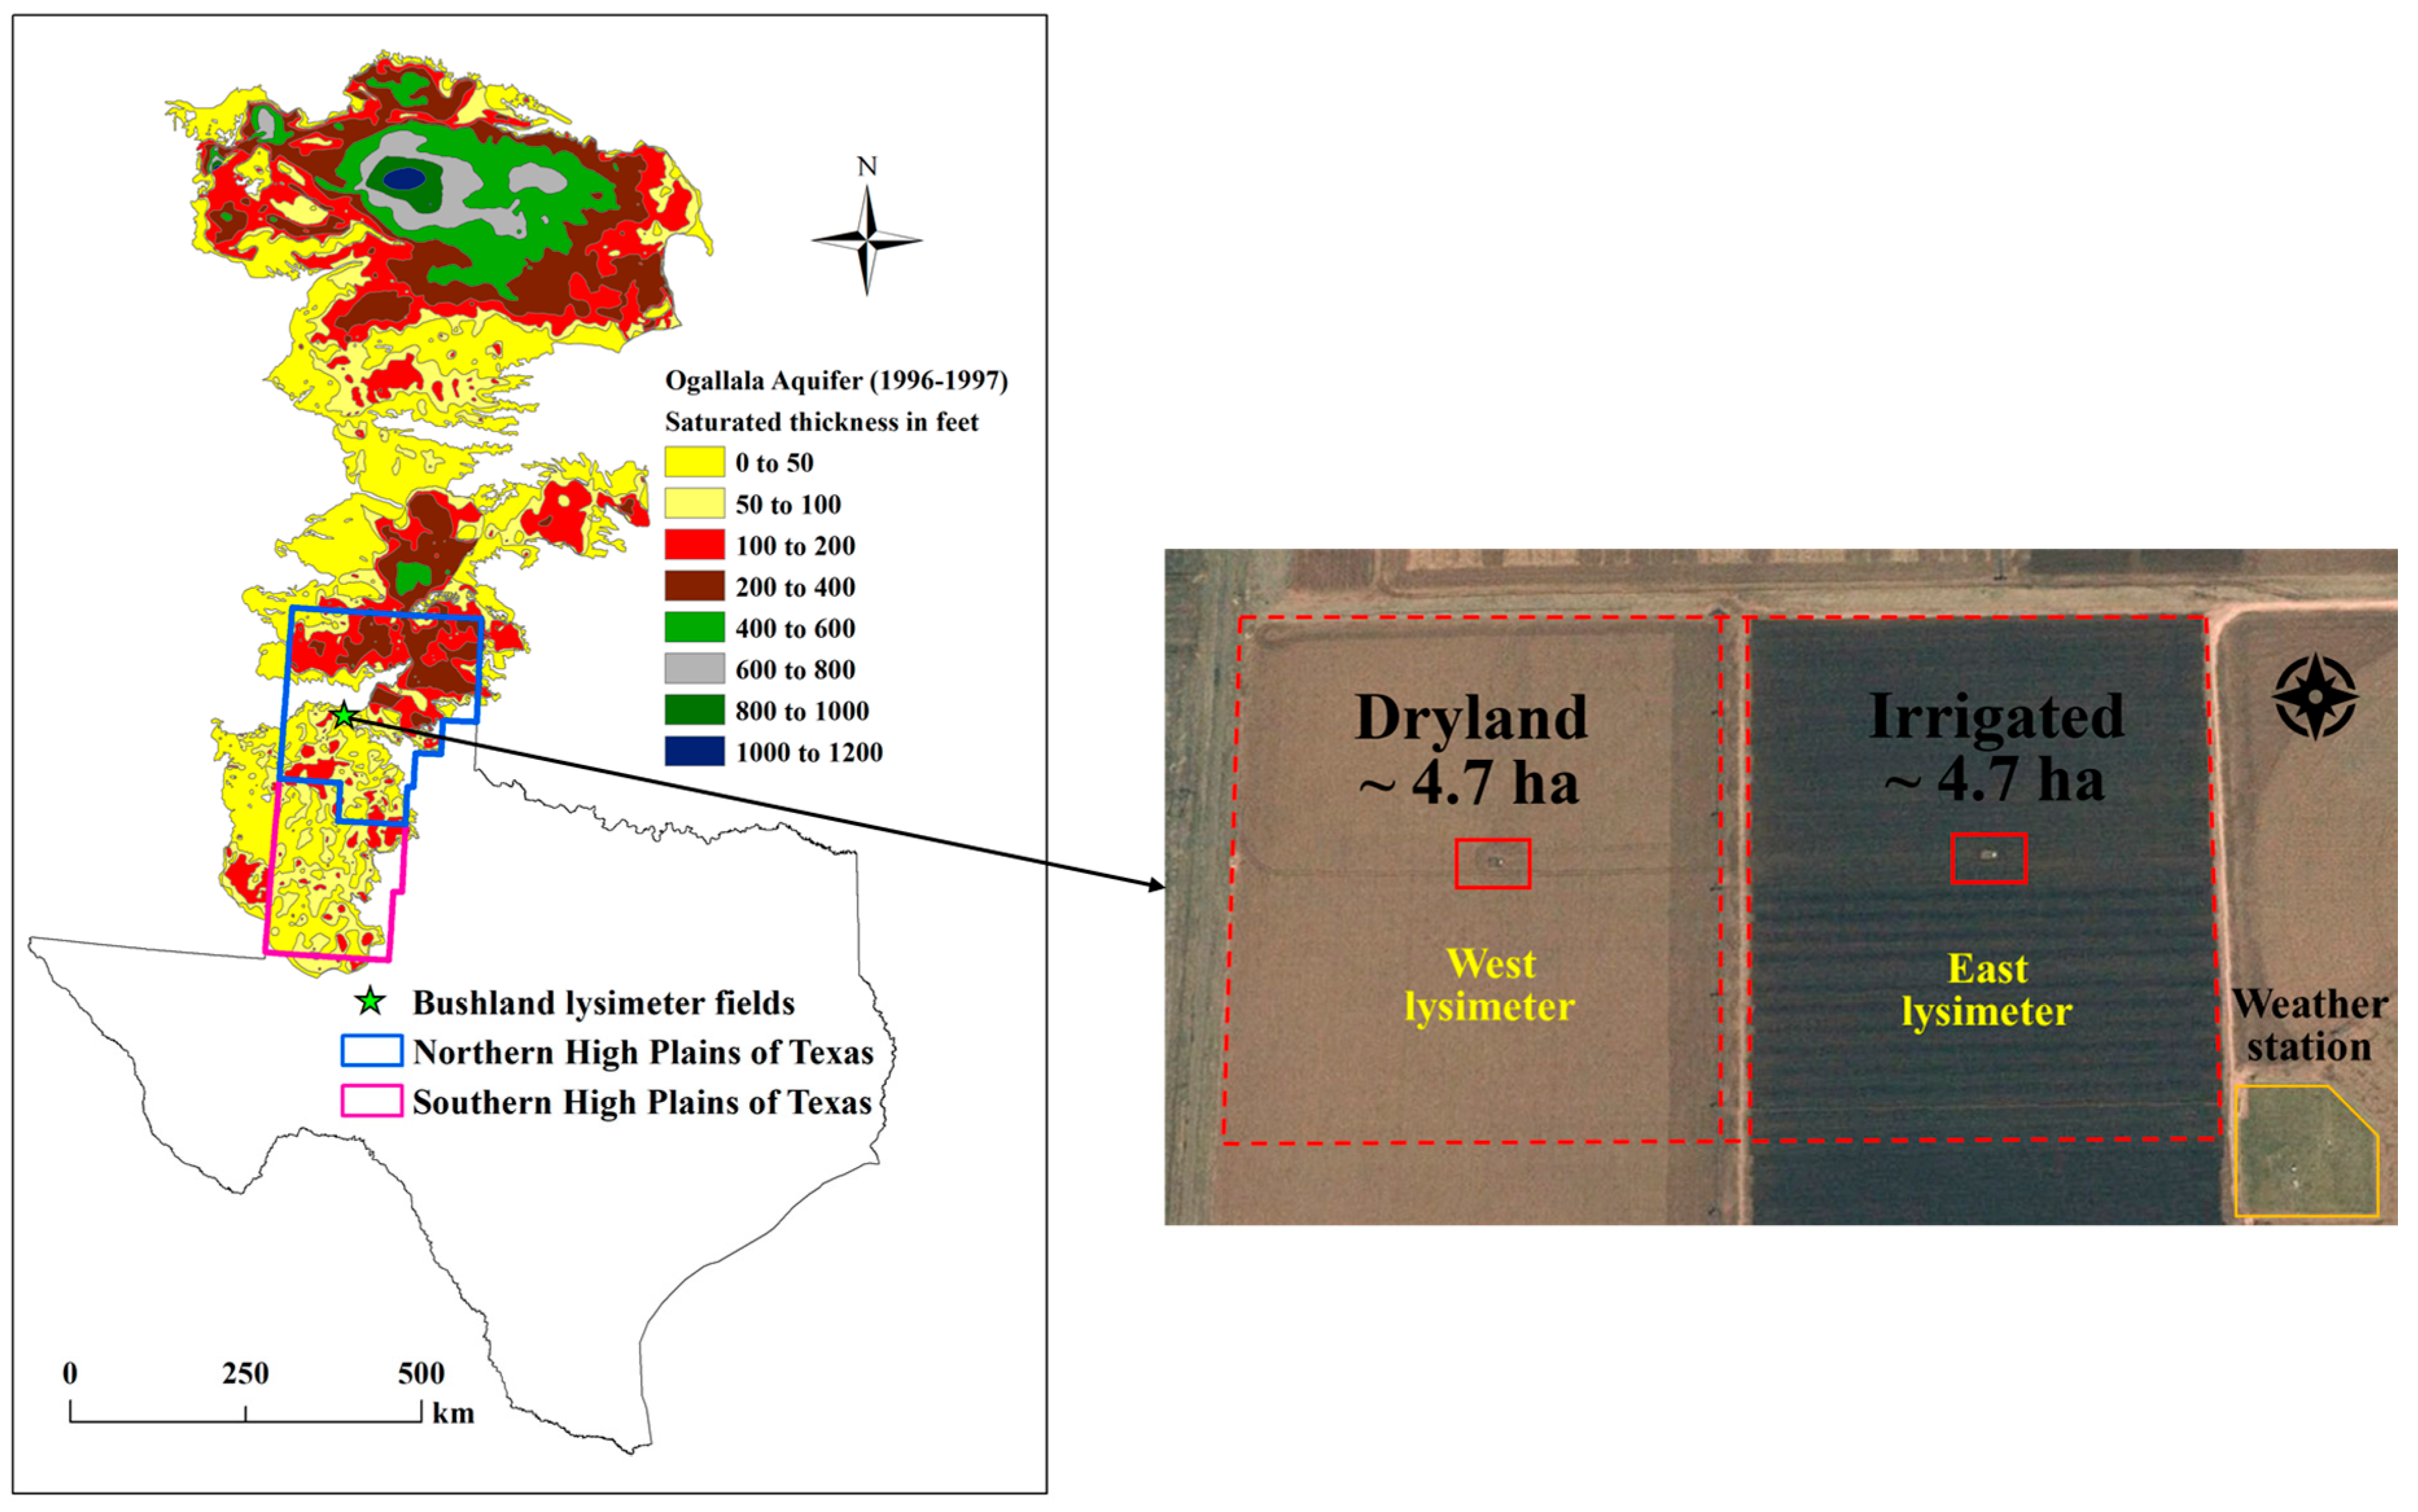
2.1. Study Site

The study site is located at the USDA-ARS CPRL at Bushland, Texas (35.2° N, 102.1° W, ~1170 m above mean sea level). The regional climate is classified as the semi-arid with average annual rainfall and temperature of 496 mm and 14.1 °C, respectively for years 2001–2010. The dominant soil is classified as Pullman clay loam (fine, mixed, superactive, thermic Torrertic Paleustoll) [27]. Selected soil properties are provided in Table 1. The study site is relatively flat with a minimal slope of less than one percent.
Two 4.7 ha fields (one irrigated and one dryland), each having a large weighing lysimeter situated in its center, was selected as the study site (Figure 1). Climate data were obtained from an adjacent research-grade weather station maintained to the American Society of Civil Engineers-Environmental and Water Resources Institute (ASCE-EWRI) specifications [28]. Irrigated field crops grown from 1996 to 2016 included alfalfa (Medicago sativa L.), cotton, soybean, grain, and forage sorghum, sunflower, and grain and forage corn. Dryland crops included grain sorghum, cotton, soybean, and sunflower (Table 2). A N–S oriented linear move sprinkler system was used to apply water to the east irrigated lysimeter field. The west lysimeter field was managed as dryland with fallow years of 1996, 2002, 2005, and 2009. Management of fallow field included weed control operations, including tillage and herbicide treatments as needed. Fertilizer applications for irrigated and dryland crops were applied according to recommendations from annual soil testing.

2.2. Model Inputs and Crop Growth Data

Elevation information and the soil data for the study site were obtained from the U.S. Geological Survey (USGS) and Web Soil Survey [29], respectively. All management information, including tillage, planting, fertilizer applications, harvest, etc., were recorded for each field for every year. Irrigation amounts and application dates were also recorded. Climatic data, including precipitation, maximum air temperature, minimum air temperature, relative humidity, solar radiation, and wind speed were aggregated into daily values for modeling input.
Crop LAI samples were collected periodically during the growing season by destructive sampling. Leaf samples were measured using a digital scanning bed leaf area meter (model LI-3100, LI-COR, Lincoln, Nebraska). LAI values were calculated as the ratio of upper side leaf area (m2) to the ground area (m2). Final yield was determined by both combine harvest and hand harvest sampling at the end of the growing season. Specifically, agronomic data collected from the east lysimeter field from 2000 to 2010 were used for SWAT inputs. Actual irrigation frequency and magnitude data were input into SWAT using the manual irrigation function and the schedule by specific date method. Daily ET, seasonal LAI, and final crop yield from 2001 to 2010 were used to calibrate and validate the SWAT model for the irrigated conditions [26]. Analyses of long-term alternative land use scenarios using the newly developed MAD auto-irrigation function [21] were performed in this study. Measured data from the west lysimeter field from 2001 to 2010 were used to calibrate and validate SWAT under dryland conditions [30].

2.3. Lysimetric ET Data Collection

Each lysimeter contains an undisturbed soil monolith collected on site, weighing ~45 Mg including the container mass. The lysimeter surface dimensions are 3 m × 3 m (9 m2) with a depth of 2.3 m [31]. The accuracy of ET measurements has ranged from 0.05 mm to 0.01 mm when expressed as an equivalent depth of water [32,33]. Experienced technicians and scientists work to ensure that the lysimeters are as representative of the surrounding fields as possible. Lysimeter design and management are described in detail by Marek et al. [31]. Daily ET (mm) is calculated using the following soil water balance equation:
ET = I + P − R − F − ΔSW
where I is irrigation (mm; assigned a value of zero for dryland lysimeter), P is precipitation (mm), R is surface runoff (assigned a value of zero due to lysimeter freeboard and furrow diking in the surrounding fields), F is water flux exiting the lysimeter storage volume (mm), and ΔSW is the change in soil water content (mm), calculated as the difference between the midnight-centered average lysimeter mass of the current and previous day. The lysimeters are equipped with vacuum drainage systems, which collect soil profile drainage into tanks suspended from the bottom of the lysimeters. As such, drainage does not influence overall lysimeter mass and subsequent ET measurements except when the tanks are periodically drained. Therefore, F is assigned to zero. Mass-changing events such as this are flagged and adjusted in the lysimeter mass datasets. Missing or spurious data resulting from the days of lysimeter calibration, maintenance, agronomic activities, and power outages were not used. Detailed lysimeter data processing and data quality assurance/quality control (QA/QC) procedures are provided by Marek et al. [34].

2.4. Default and Management Allowed Depletion Auto-Irrigation Functions in SWAT

The default SWAT auto-irrigation functions allow for irrigation based on (1) plant water demand or (2) soil water content. Using the soil water content method, irrigation is triggered whenever the soil water in the profile falls below field capacity by more than a user-defined soil water deficit threshold. The alternative MAD auto-irrigation function triggers an irrigation when a user-defined percentage of plant available water is depleted. Plant available water is determined by soil profile texture and crop-specific maximum rooting depth [21].
ArcSWAT was developed by Stone Environmental, Inc. in collaboration with Texas A&M Spatial Sciences Laboratory and Backland Research and Extension Center. ArcSWAT 2012 (version 2012.10_2.19; revision 664) modified with the MAD-based auto-irrigation function was used in this study. Two SWAT projects, one calibrated for ET, LAI, and crop yield for the east irrigated lysimeter field [21,26], and the other for west dryland lysimeter field [30], were used in this study for the analysis of alternative land use scenarios. Both SWAT projects were structured as 11-year (2000–2010) continuous simulations. In both projects, the first year (2000) was used for the model warmup.

2.5. Scenario Design and Assessment of Land Use Scenarios

The effects of three land use regimes including irrigated farming, dryland farming, and continuous fallow on water conservation were evaluated. Specifically, twelve agricultural land use scenarios for the 2000–2010 simulation period were evaluated. They consisted of irrigated farming scenarios of grain corn, winter wheat, cotton, soybean, sunflower, and grain sorghum. Dryland farming scenarios consisted of winter wheat, cotton, soybean, sunflower, and grain sorghum, as well as an entire-year fallow (Table 3).
Average values of actual crop management information from 1996 to 2016 were used as the model inputs for SWAT scenario analysis (Table 3). The MAD auto-irrigation function was used to schedule irrigation in the irrigated scenarios. The average values of the calibrated crop growth parameters from the two SWAT projects [21,26,30], in addition to other literature from Bushland studies, were used to parameterize the crop database for the land use scenarios (Supplementary Materials Table S1). The SWAT outputs for the long-term land use scenarios were also evaluated against observed irrigation, ET, and crop yield data for the same crops at the study site. Finally, the impacts of various land use selections on irrigation, ET, soil water depletion, and groundwater recharge were analyzed and discussed.

3. Results and Discussion

3.1. Comparison of Simulated Irrigation, ET, and Crop Yield with Observed Data

The range of simulated seasonal irrigation using the MAD auto-irrigation function for the ten-year period (2001–2010) was representative of the actual irrigation range for the same crops, except for soybean and sunflower, which had greater maximums than the actual irrigation amounts (Table 4). Chen et al. [39] also showed that the MAD auto-irrigation function represented well the measured irrigation data from five states in the Southern Great Plains including Texas, Colorado, Kansas, Nebraska, and New Mexico. Specifically, the SWAT default soil water content and plant water demand auto-irrigation methods tended to overestimate and underestimate seasonal irrigation, respectively, when compared to the actual MAD-based irrigation management. Simulated average seasonal irrigation was the largest for corn, followed by winter wheat, cotton, soybean, sunflower, and grain sorghum.
A comparison of the range of annual ET for the irrigated conditions showed that the simulated ET range bracketed the observed ET range. However, the continuous fallow simulation resulted in a lower minimum value for ET compared to actual ET. The continuous fallow simulation did not have cropping between subsequent years (Table 5). However, the actual fallow conditions in 2002, 2005, and 2009 were preceded by dryland cropping in the previous year, which resulted in low initial soil moisture for evaporation in those years. As expected, simulated average annual ET followed the same descending order as simulated irrigation with fallow scenario having the least amount of simulated ET (largely evaporation) of 457 mm (Table 5). Under dryland farming conditions, more than 99% of the input water from precipitation (~500 mm) was lost through ET in this semi-arid region. Chen et al. [37] also found that annual ET values of all SWAT simulated cotton and bioenergy crop scenarios accounted for about 99% of annual rainfall in the Double Mountain Fork Brazos watershed in the Texas High Plains. Therefore, average annual simulated ET (~500 mm) approximated average annual precipitation for all dryland farming scenarios.
Simulated average crop yields closely matched average measured yields under both irrigated and dryland management scenarios (Table 6). Overall, the range of simulated yields bracketed the range of observed yields with the exceptions of irrigated grain corn and sorghum. Average annual rainfall for the 2001–2010 simulation period was around 500 mm, which approximated the long-term annual average for precipitation [40]. However, corn grown in 2013 received relatively low annual precipitation with only 333 mm. Conversely, annual precipitation was exceedingly large (928 mm) for the grain sorghum grown in 2015. These conditions likely contributed to the differences between the simulated and measured yields for irrigated grain corn and sorghum. Overall, the long-term simulated average annual irrigation, ET, and crop yield were considered representative of the long-term actual average values in the study site.

3.2. Evaluation of Annual Net Groundwater Use, Soil Water Depletion, and Groundwater Recharge under Different Land Uses

In this study, net groundwater use was defined as the groundwater used for irrigation minus the amount of percolation. Water that percolates below the plant rooting zone can be defined as groundwater recharge. Under irrigated scenarios, grain sorghum had the lowest net groundwater use of 293 mm (Table 7). As expected, irrigated grain corn showed the highest net groundwater use at 432 mm. In six of the ten years of the simulation period, irrigation water for corn exceeded the 457 mm (18 inches) groundwater pumping restriction imposed by the High Plains Underground Water Conservation District [2].
As compared to irrigated grain corn, irrigated winter wheat and cotton reduced net groundwater use by 5.5% and 8.3%, respectively. However, the cotton grown on the lysimeter fields of the study site was managed as full irrigation (near 100% of cotton ET requirements). Similar management of winter wheat led to larger seasonal irrigation amounts for both crops than those typically observed in production agriculture from producers, resulting in 27% and 37% reductions of irrigation water compared to corn [42]. Winter wheat is generally not fully irrigated as marginal increases in yield do not offset input costs [43]. As for cotton, water stress, defined as irrigation less than 100% of ET, can support partitioning of photosynthate to cotton bolls (seed and lint), thereby promoting fiber maturity and quality. However, reduction of irrigation generally results in negative impacts on corn production. Therefore, production data from producers revealed a ~30% reduction in irrigation water for typical limited irrigation cotton and winter wheat relative to the grain corn production in the NHP [42].
Reductions in net groundwater use of 18.9% and 21.3% were estimated for irrigated soybean and sunflower, respectively, compared to the irrigated corn. A 32.2% decrease in net groundwater use was estimated for irrigated grain sorghum as compared to grain corn. A land use change from corn to soybean and sunflower may yield a 15–20% reduction in net groundwater use in the region. Producers facing reduced well capacities may be forced to target grain sorghum production which is estimated to reduce net groundwater use by more than 30% as compared to grain corn. It is worth noting that simulated irrigation water for grain sorghum never exceeded the 457 mm restriction during the 10-year simulation period (Table 4).
There was no net groundwater use under the dryland conditions as no irrigation water was applied and negligible or no percolation under the dryland conditions in this region. However, it is worth noting that the continuous fallow simulation resulted in an annual average of 31 mm of percolated precipitation available for eventual groundwater recharge (Table 8). Dryland farming scenarios forfeited this potential benefit to groundwater conservation. In addition, annual soil water depletion ranged from 47 mm to 57 mm under the dryland cotton and sunflower scenarios. However, an average of only 18 mm of soil water was lost in the fallow scenario on a yearly basis. Finally, the system available water loss (groundwater and soil profile water) was 60 mm more for the dryland farming scenarios compared to the fallow scenario. Obviously, fallow management precludes the production of a crop and any associated profits. However, this study is aimed at advancing the understanding of impacts on water balance components associated with long-term dryland and irrigated production, as well as continuous fallow. Assessments of these agricultural land uses and management practices are limited, and the effect of long-term fallow management is largely absent from the literature [44].
A large amount of research has been conducted on groundwater recharge for the Ogallala Aquifer in Texas. A summary of the literature of the groundwater recharge studies for the Ogallala Aquifer in Texas from 1960 to 2016 was provided in Table 9. Using a groundwater model, Sophocleous [45] predicted 7 mm groundwater recharge annually for irrigated cropland in Muleshoe, located in the SHP. In addition, Crosbie et al. [46] simulated groundwater recharge in clay-loam soils were 11 and 8 mm yr−1 for irrigated and dryland farming, respectively, at Amarillo in the NHP. Chen et al. [37], using SWAT, reported average annual (1994–2009) groundwater recharge was ~10.5 mm in the Double Mountain Fork Brazos watershed of the Ogallala Aquifer region in Texas. The average annual groundwater recharge rate in the Texas Ogallala Aquifer from 1960 to 2016 is 10.7 mm (Table 9), which agrees closely with the simulated average annual percolation amount for crops (10.8 mm) in this study.

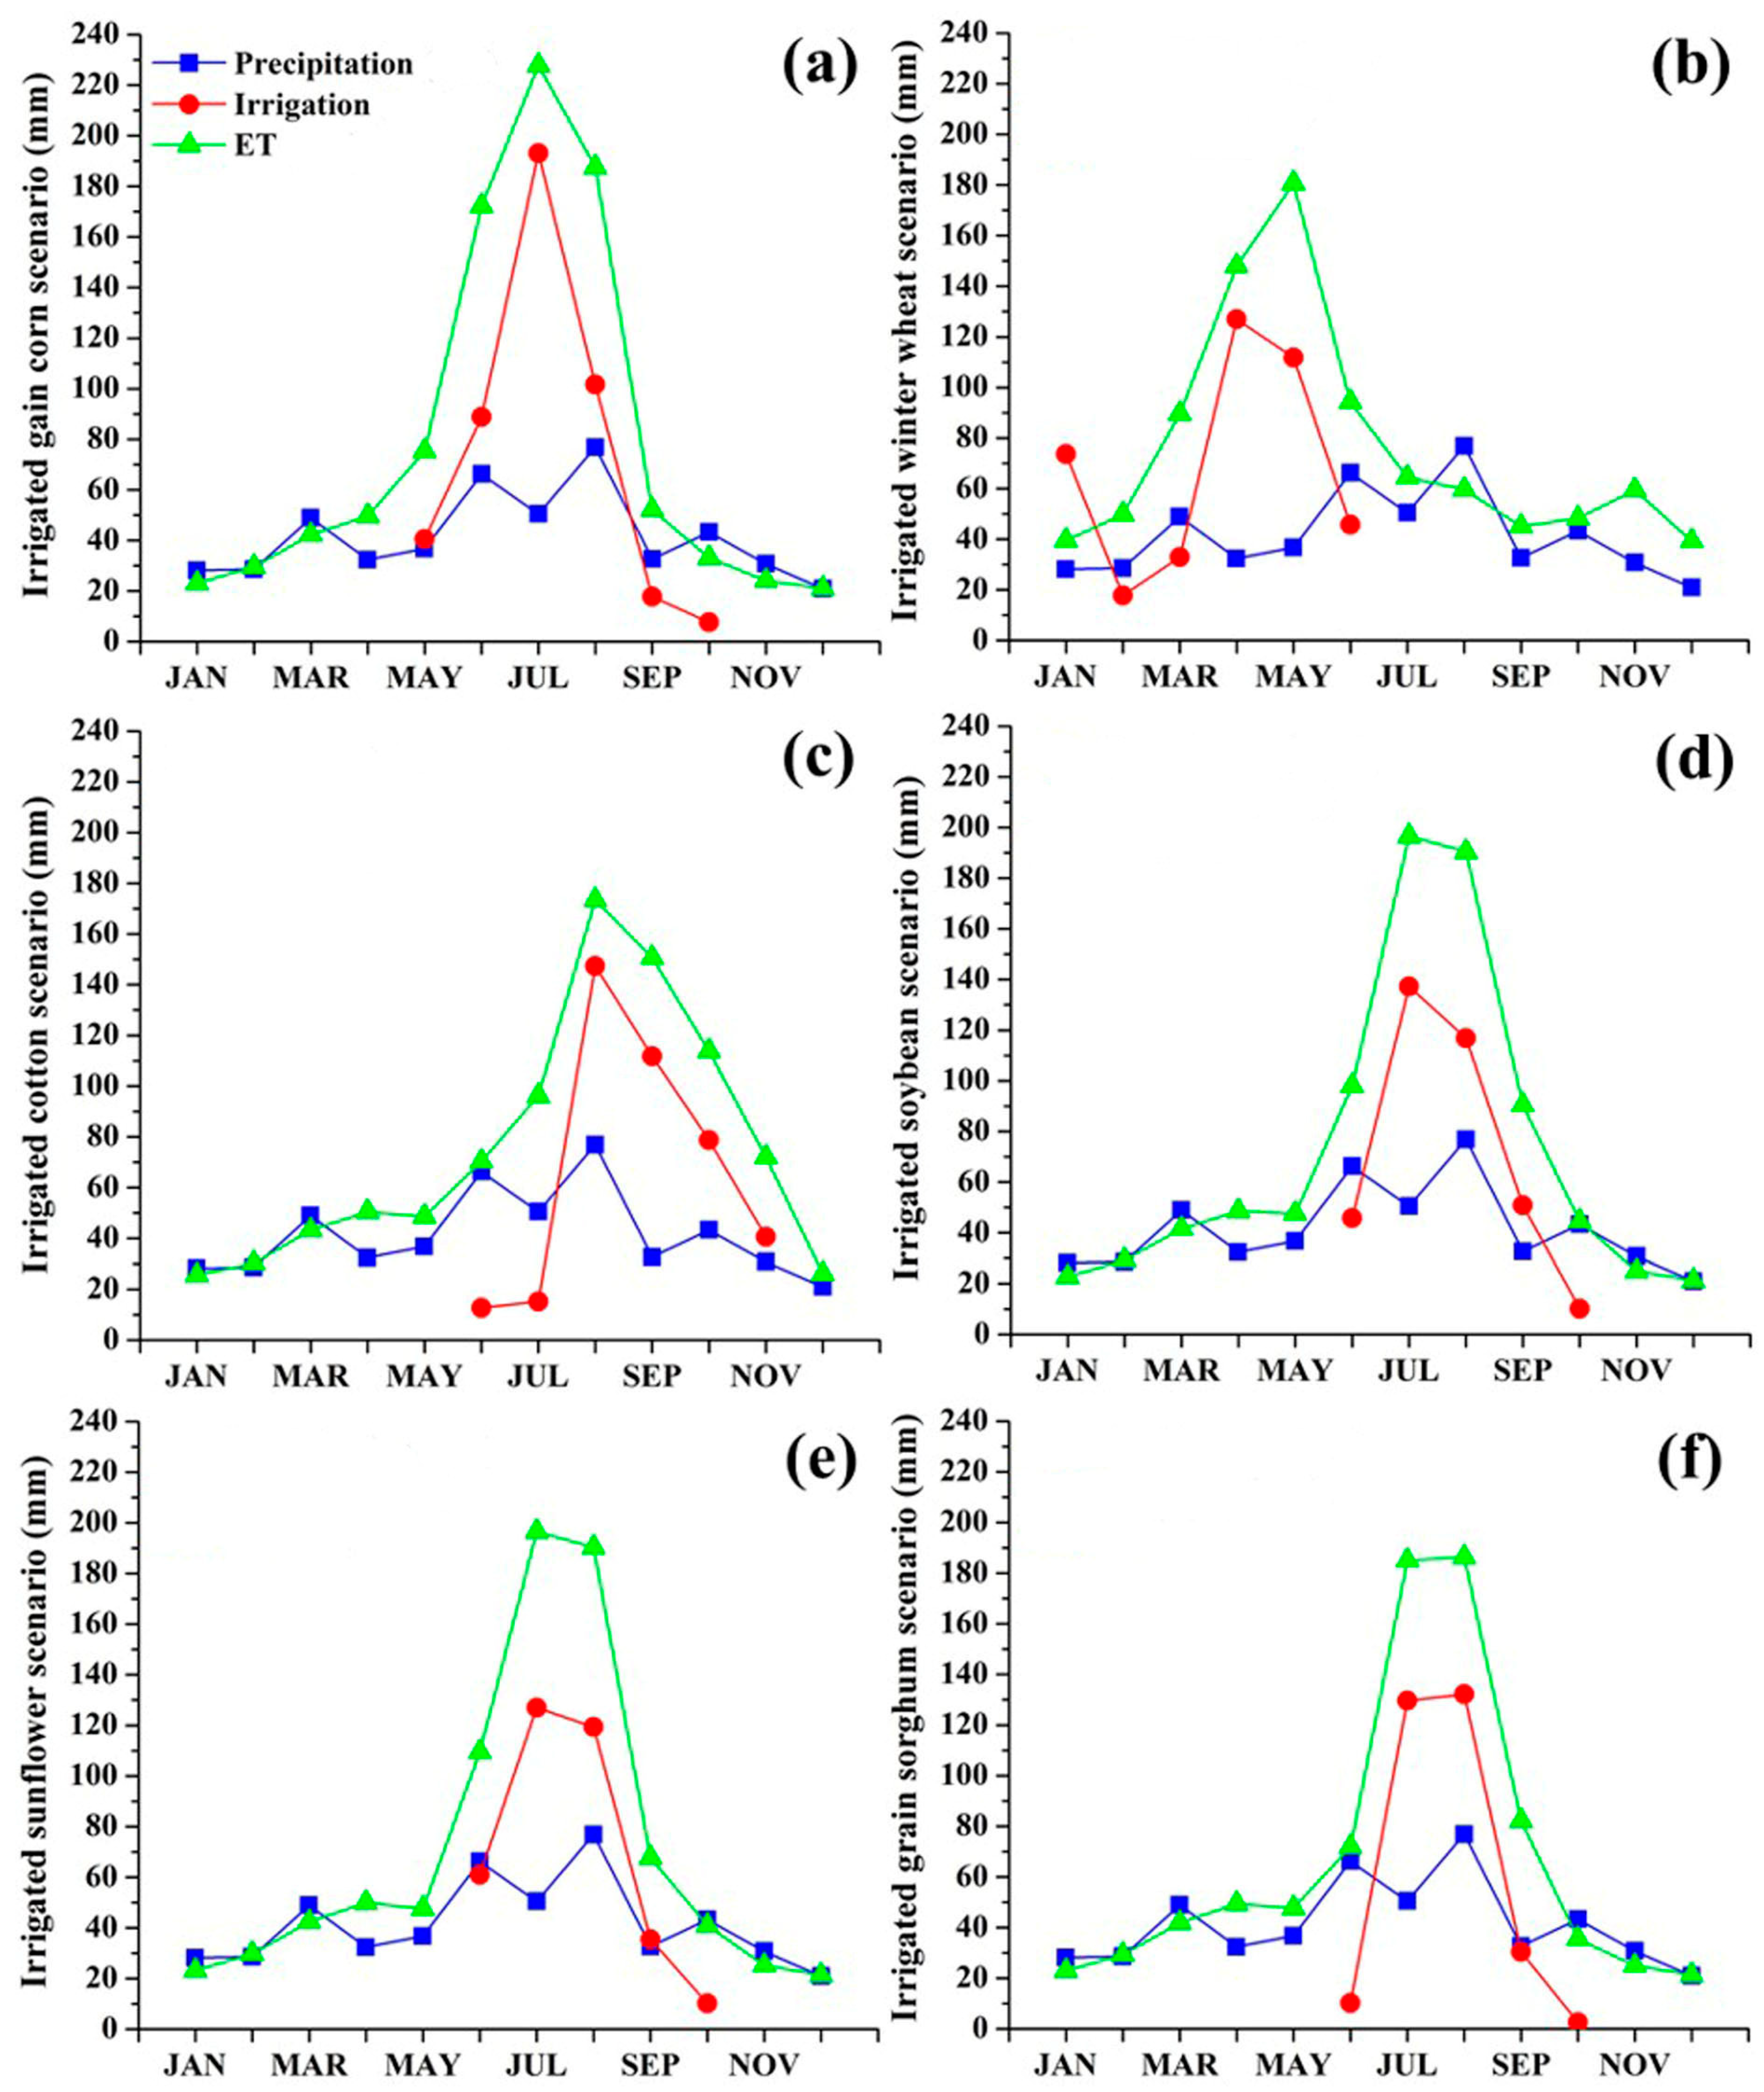
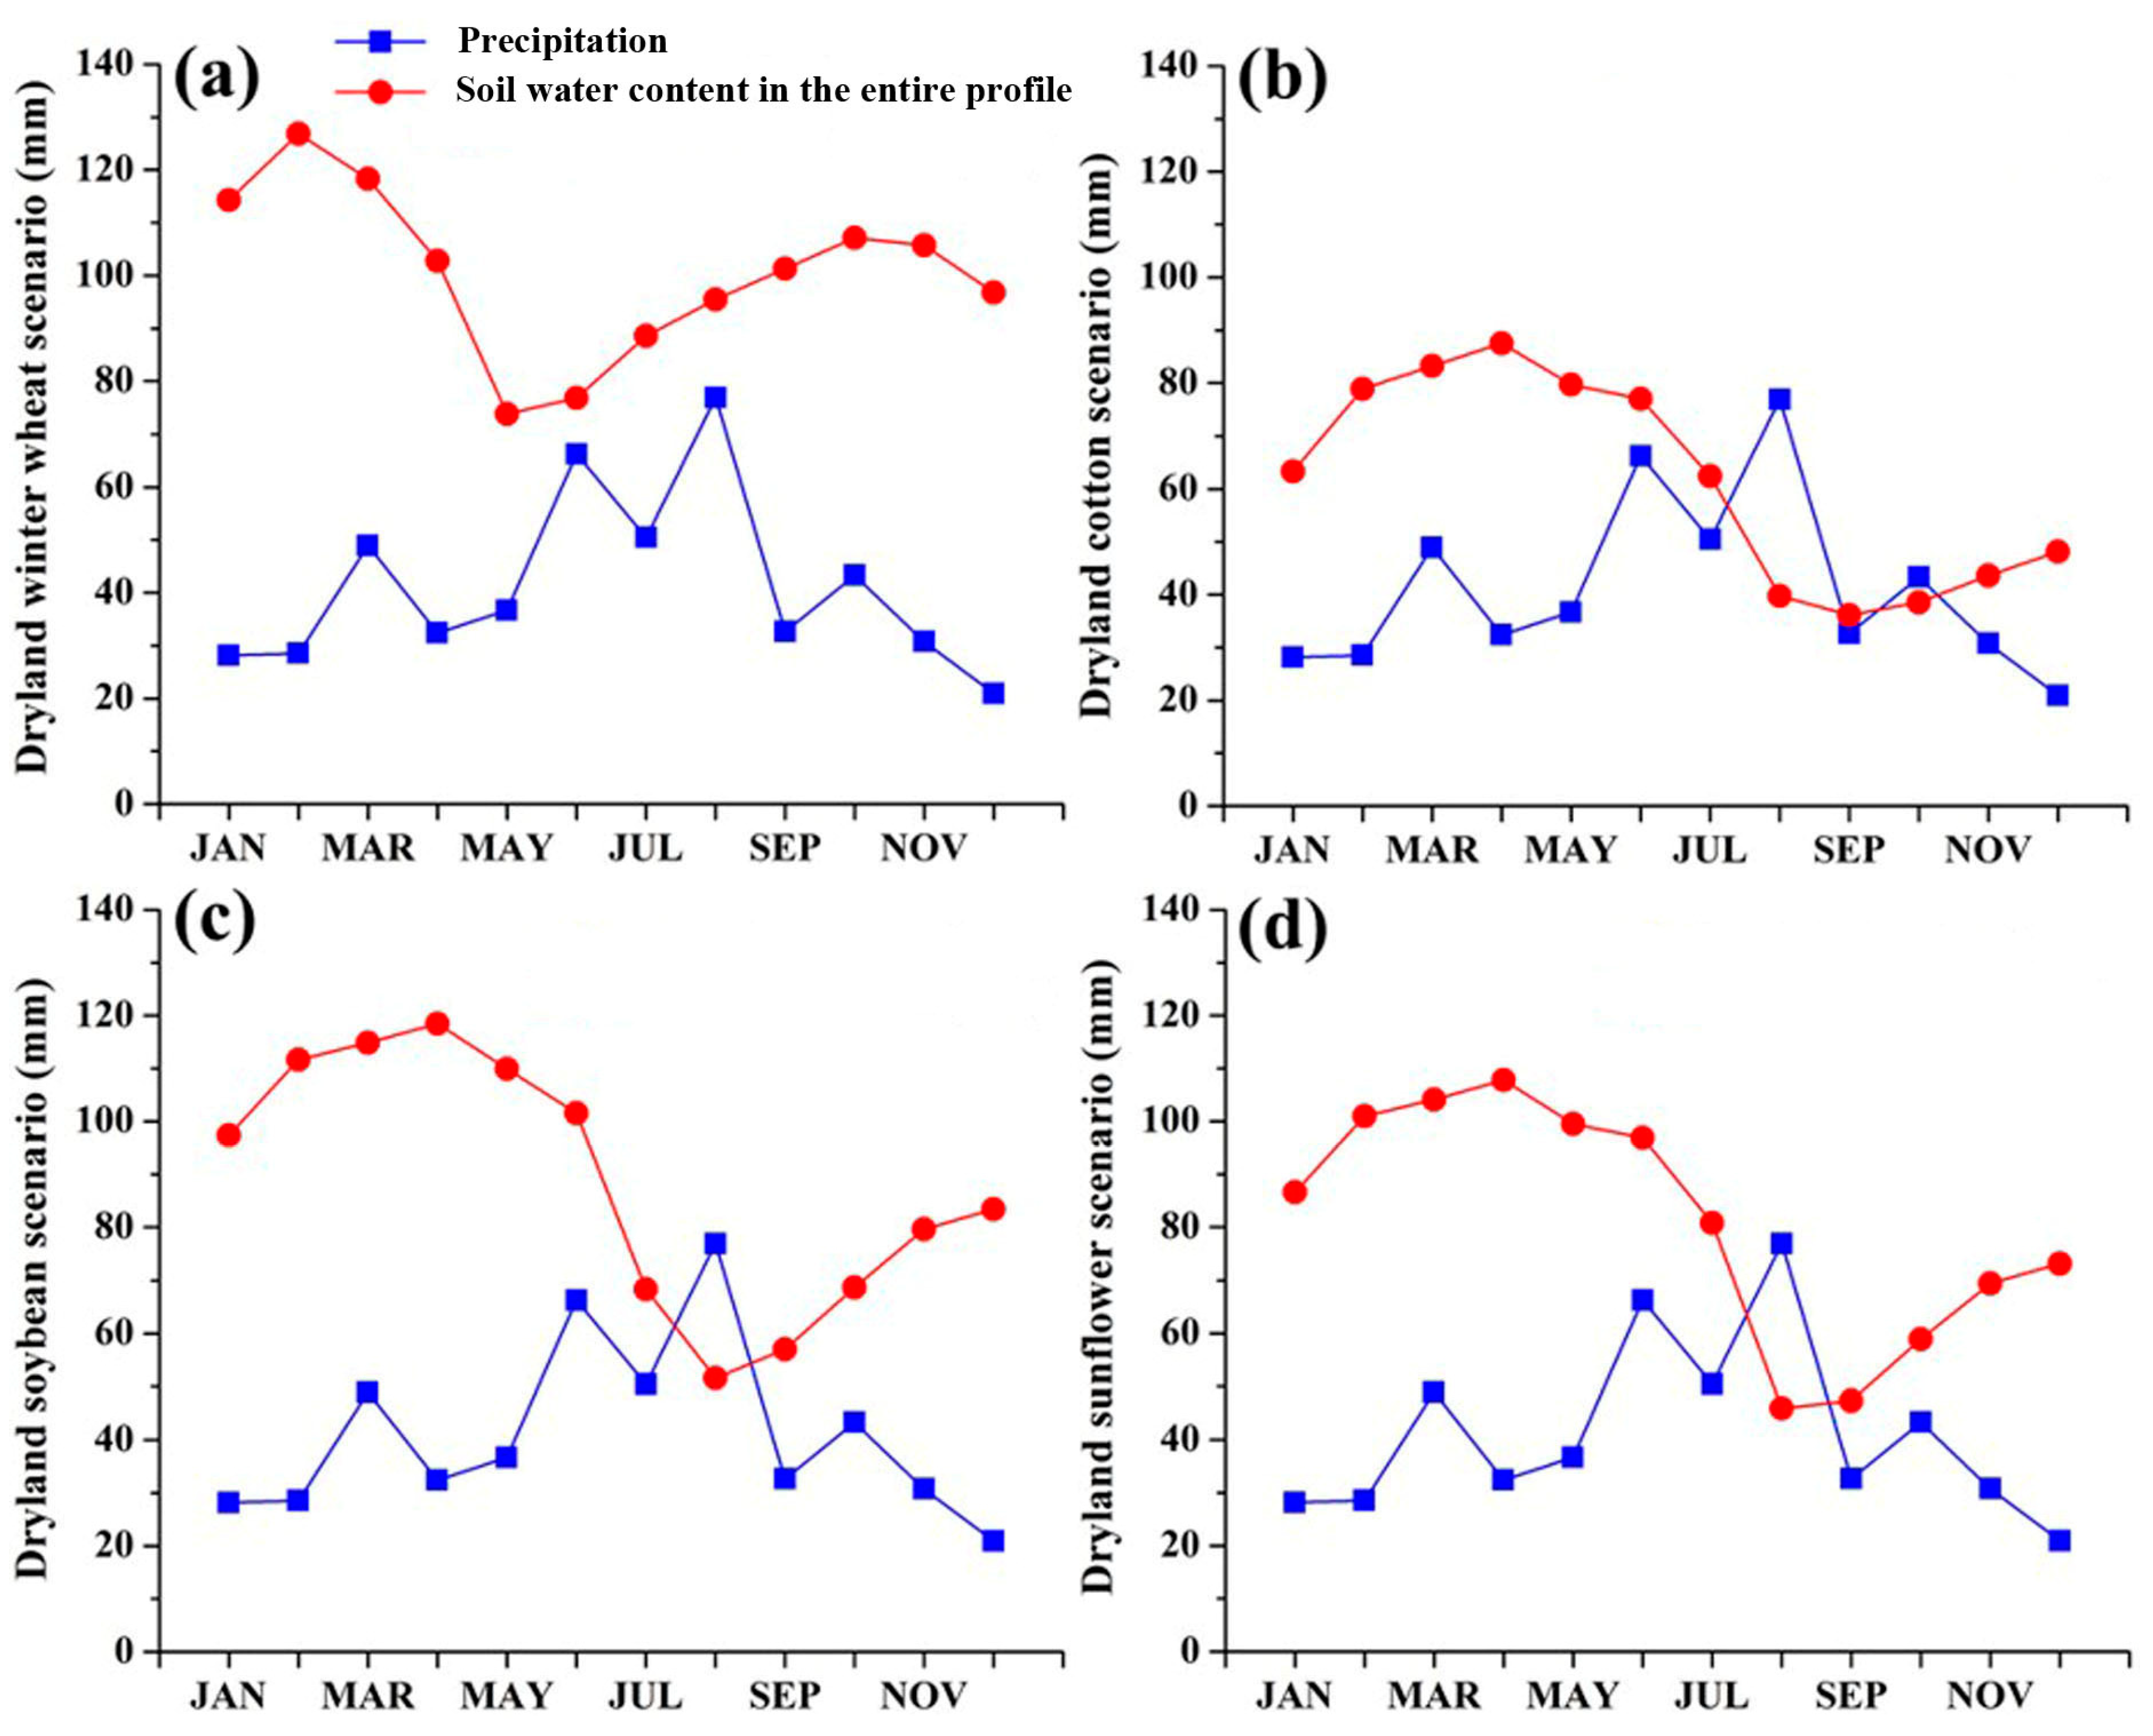
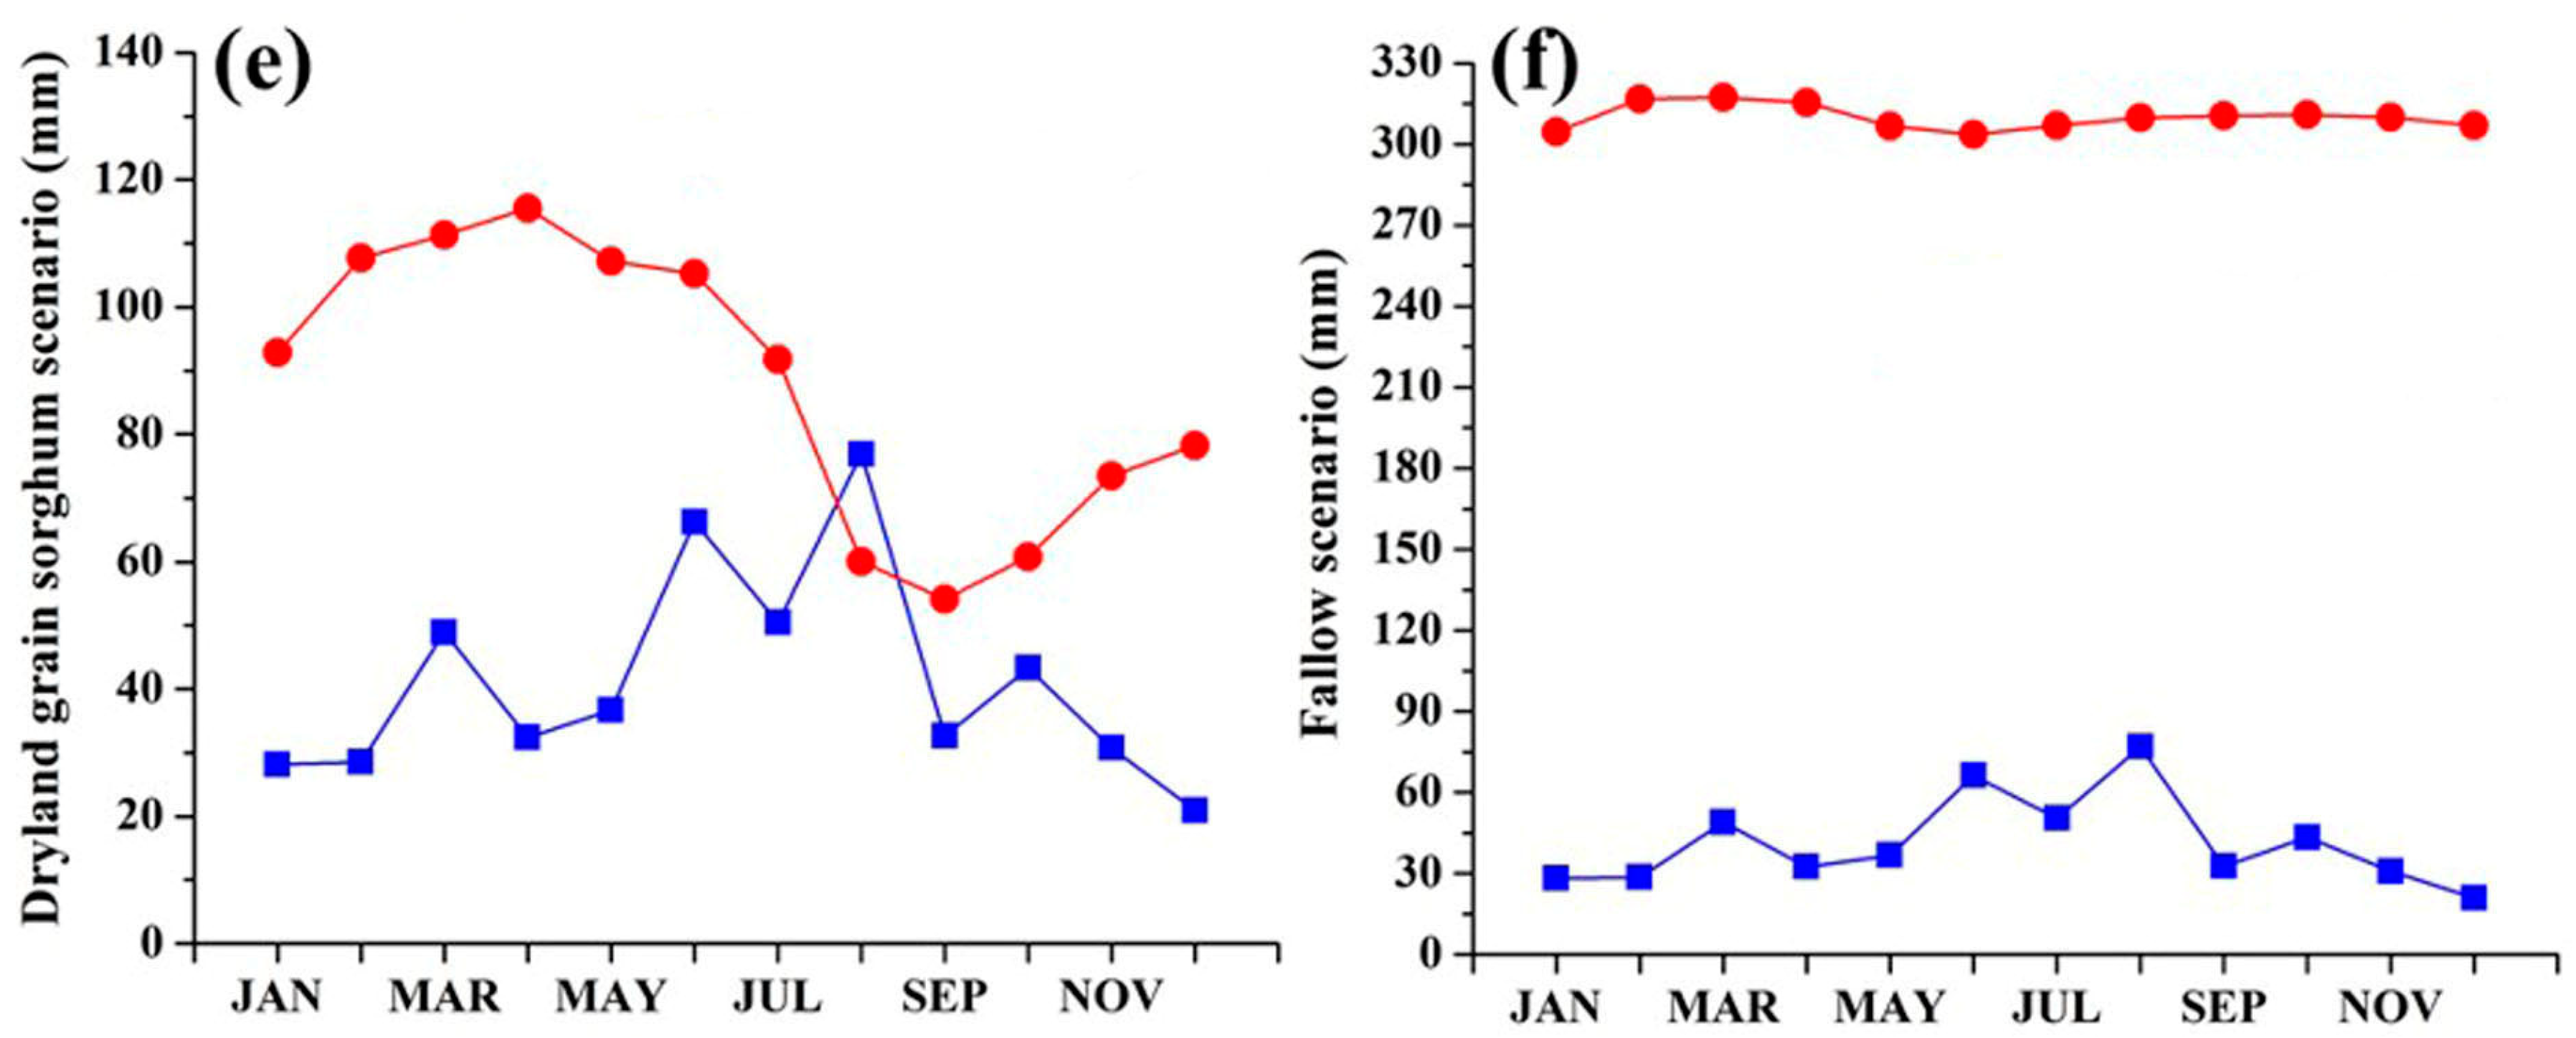
3.3. Simulated Monthly ET, Irrigation, and Soil Water Content under Twelve Land Use Scenarios

A monthly analysis showed that the simulated peak ET occurred in July or August in all irrigated crops, except for irrigated winter wheat which peaked in May (Figure 2). The peak monthly ET was approximately 230 mm and 180–200 mm for irrigated grain corn and other crop scenarios, respectively. As expected, simulated monthly ET trended with irrigation scheduling. Precipitation was concentrated from June to August in the NHP region. However, it was far lower than the alfalfa reference ET (ETrs) of ~1600 mm in the region (Figure 2). Therefore, a large amount of irrigation was supplied to minimize crop stress. For instance, precipitation may only satisfy half of corn water demand in some years, with the remainder coming from irrigation. As for irrigated winter wheat, it is planted in the early October, and producers typically do not irrigate until the following January, during the drought-sensitive wheat jointing period [35]. This was the reason for a large amount of irrigation simulated in January (Figure 2b). Other irrigation events for winter wheat occurred during anthesis and grain filling periods from April to June.
Precipitous declines in soil water content of the whole soil profile occurred from February to May for the dryland winter wheat scenario (Figure 3a). For all other summer crops, soil water content levels decreased continuously from May to September (Figure 3). However, soil water content generally rebounded to 100–120 mm before next year’s planting through rainfall under the dryland soybean, sunflower, and grain sorghum scenarios. The soil water content was lower than 100 mm before planting for dryland cotton (80–100 mm). It is worth noting that the continuous fallow simulation maintained a 300 mm soil water content throughout the year (Figure 3f). In general, simulated dryland winter wheat sustained good soil moisture conditions compared to summer crops, primarily due to the majority of annual precipitation occurring in July and August after the winter wheat harvest (transpiration ceased). Similar to the continuous fallow scenario, only evaporation accounted for the majority of water lost in this summer fallow period. Recently, Holman et al. [44] concluded that the fallow period was very important for the dryland winter wheat production according to a five-year (2007–2012) field experiment in Garden City, Kansas. They found that soil available water was reduced by 1 mm for every 125 kg ha−1 of biomass of summer crop that was produced during the summer fallow period. They also reported that for every millimeter of soil water saved in the summer fallow period, wheat yield was increased by 5.5 kg ha−1. Therefore, occasional fallow years may not only increase groundwater recharge, but also benefit dryland crop production in the following year. Continuous dryland cotton production resulted in the lowest initial soil water content at planting, suggesting that such a scenario may benefit from the occasional fallow rotation.

4. Conclusions

A newly developed auto-irrigation method for simulating MAD irrigation scheduling in SWAT was used in this study. The MAD auto-irrigation algorithm was developed and evaluated based on ten years of field measurements for irrigation, ET, LAI, and crop yield data at the USDA-ARS CPRL at Bushland, TX. In this study, a total of 20 years of observed field data were used to evaluate the representativeness of the simulated results under multiple land use scenarios. Overall, the long-term simulated average annual irrigation, ET, and crop yield were representative of the long-term actual average values in the study area.
In order to extend the availability of the Ogallala Aquifer for sustainable crop production, a shift from water-intensive corn to less water demanding crops such as cotton, winter wheat, soybean, sunflower, grain sorghum, or dryland farming may be necessary. Simulation results showed that irrigated grain sorghum resulted in the lowest net groundwater use of 293 mm as compared to the highest (432 mm) for irrigated grain corn. Conventional thought may argue that no net groundwater use exists under dryland conditions. However, simulations of continuous fallow showed an annual average of 31 mm of water for eventual groundwater recharge from rainfall as compared to dryland farming, which resulted in minimal or no groundwater recharge. Results also showed that soil water was quickly depleted during the growing season of dryland farming while fallow conditions maintained a relatively high soil water content throughout the year.
From the perspective of groundwater conservation, fallow management is essential and plays a critical role. However, food shortage and security are still dominant issues in the world. Simulated production of dryland cotton and grain sorghum showed that less water is lost from the soil and groundwater systems compared to others, which may be promising for the dryland farming in the region. However, comprehensive economic analyses of the revenue potential of alternative cropping and land use strategies need to be assessed before making land use conversion recommendations to producers.

Supplementary Materials

The following is available online at https://www.mdpi.com/2306-5338/5/4/53/s1, Table S1: Default and used values of crop parameters in Soil and Water Assessment Tool (SWAT) for long-term simulations.

Author Contributions

Conceptualization, Y.C., G.W.M. and T.H.M.; methodology, Y.C., G.W.M., T.H.M., J.E.M., K.R.H., D.K.B., P.H.G. and R.S.; software, Y.C., G.W.M., T.H.M. and R.S.; validation, Y.C., G.W.M., T.H.M., J.E.M., K.R.H., D.K.B., P.H.G. and R.S.; formal analysis, Y.C. and G.W.M.; investigation, Y.C., G.W.M. and J.E.M.; resources, G.W.M., P.H.G., J.E.M. and D.K.B.; data curation, Y.C., G.W.M., P.H.G., J.E.M. and D.K.B.; writing—original draft preparation, Y.C. and G.W.M.; writing—review and editing, T.H.M., J.E.M., K.R.H., D.K.B., P.H.G. and R.S.; visualization, Y.C. and G.W.M.; supervision, G.W.M., R.S. and D.K.B.; project administration, G.W.M. and D.K.B.; funding acquisition, G.W.M. and D.K.B.

Funding

This research received no external funding.

Acknowledgments

This research was supported in part by the Ogallala Aquifer Program, a consortium between USDA-Agricultural Research Service, Kansas State University, Texas A&M AgriLife Research, Texas A&M AgriLife Extension Service, Texas Tech University, and West Texas A&M University.

Conflicts of Interest

The authors declare no conflict of interest.

References

  1. National Agricultural Statistics Service (NASS). Available online: https://www.nass.usda.gov/ (accessed on 29 May 2018).
  2. High Plains Underground Water Conservation District (HPUWCD). Available online: http://static1.squarespace.com/static/53286fe5e4b0bbf6a4535d75/t/54db8326e4b09b0ec42ee61d/1423672102940/%28RuleExplanationRevised.pdf (accessed on 24 May 2018).
  3. Rajan, N.; Maas, S.; Cui, S. Extreme drought effects on evapotranspiration and energy balance of a pasture in the Southern Great High Plains. Ecohydrology 2015, 8, 1194–1204. [Google Scholar] [CrossRef]
  4. Schneider, A.D.; Musick, J.T.; Dusek, D.A. Efficient wheat irrigation with limited water. Trans. Am. Soc. Agric. Eng. 1969, 12, 23–26. [Google Scholar] [CrossRef]
  5. Stewart, B.A.; Musick, J.T.; Dusek, D.A. Yield and water use efficiency of grain sorghum in a limited irrigation-dryland farming system. Agron. J. 1983, 75, 629–634. [Google Scholar] [CrossRef]
  6. Boyer, J.S. Differing sensitivity of photosynthesis to low leaf water potentials in corn and soybean. Plant Physiol. 1970, 46, 236–239. [Google Scholar] [CrossRef]
  7. Eck, H.V.; Mathers, A.C.; Musick, J.T. Plant water stress at various growth stages and growth and yield of soybeans. Field Crops Res. 1987, 17, 1–16. [Google Scholar] [CrossRef]
  8. Salih, A.A.; Ali, I.A.; Lux, A.; Luxova, M.; Cohen, Y.; Sugimoto, Y.; Inanaga, S. Rooting, water uptake, and xylem structure adaptation to drought of two sorghum cultivars. Crop Sci. 1999, 39, 168–173. [Google Scholar] [CrossRef]
  9. Stone, L.R.; Goodrum, D.E.; Jafaar, M.N.; Khan, A.H. Rooting front and water depletion depths in grain sorghum and sunflower. Agron. J. 2001, 93, 1105–1110. [Google Scholar] [CrossRef]
  10. Moroke, T.S. Root Distribution, Water Extraction Patterns, and Crop Water Use Efficiency of Selected Dryland Crops under Differing Tillage Systems. Ph.D. Thesis, Texas A&M Univercity, College Station, TX, USA, 2002. [Google Scholar]
  11. Baumhardt, R.L.; Salinas-Garcia, J. Dryland agriculture in Mexico and the US southern Great Plains. Dryland Agric. 2006, 23, 341–364. [Google Scholar]
  12. Li, Q.; Qi, J.; Xing, Z.; Li, S.; Jiang, Y.; Danielescu, S.; Zhu, H.; Wei, X.; Meng, F. An approach for assessing impact of land use and biophysical conditions across landscape on recharge rate and nitrogen loading of groundwater. Agric. Ecosyst. Environ. 2014, 196, 114–124. [Google Scholar] [CrossRef]
  13. Callison, D. Management Allowed Depletion Irrigation Scheduling. Available online: http://awqa.org/wp-content/toolkits/IrrigationScheduling/ManagementAllowedDepletion-IrrigationScheduling.pdf (accessed on 3 May 2018).
  14. Evett, S.R.; Schwartz, R.C.; Mazahrih, N.T.; Jitan, M.A.; Shaqir, I.M. Soil water sensors for irrigation scheduling: Can they deliver a management allowed depletion? Acta Hortic. 2011, 888, 231–237. [Google Scholar] [CrossRef]
  15. Gheysari, M.; Mirlatifi, S.M.; Homaee, M.; Asadi, M.E.; Hoogenboom, G. Nitrate leaching in a silage maize field under different irrigation and nitrogen fertilizer rates. Agric. Water Manag. 2009, 96, 946–954. [Google Scholar] [CrossRef]
  16. Lamm, F.R.; Rogers, D.H.; Clark, G.A. Irrigation scheduling for corn: Macromanagement. In Proceedings of the ASABE Evapotranspiration and Irrigation Scheduling Conference, San Antonio, TX, USA, 3–6 November 1996; pp. 741–748. [Google Scholar]
  17. Merriam, J.L. A management control concept for determining the economical depth and frequency of irrigation. Trans. ASAE 1966, 9, 492–498. [Google Scholar] [CrossRef]
  18. Suarez-Rey, E.; Choi, C.Y.; Waller, P.M.; Kopec, D.M. Comparison of subsurface drip irrigation and sprinkler irrigation for Bermuda grass turf in Arizona. Trans. ASAE 2000, 43, 631–640. [Google Scholar] [CrossRef]
  19. Arnold, J.G.; Srinivasan, R.; Muttiah, R.S.; Williams, J.R. Large-area hydrologic modeling and assessment: Part I. Model development. J. Am. Water Resour. Assoc. 1998, 34, 73–89. [Google Scholar] [CrossRef]
  20. Srinivasan, R.; Zhang, X.; Arnold, J.G. SWAT ungauged: Hydrological budget and crop yield predictions in the upper Mississippi river basin. Trans. ASABE 2010, 53, 1533–1546. [Google Scholar] [CrossRef]
  21. Chen, Y.; Marek, G.W.; Marek, T.H.; Brauer, D.K.; Srinivasan, R. Improving SWAT auto-irrigation functions for simulating agricultural irrigation management using long-term lysimeter field data. Environ. Model. Softw. 2018, 99, 25–38. [Google Scholar] [CrossRef]
  22. McInerney, D.; Thyer, M.; Kavetski, D.; Githui, F.; Thayalakumaran, T.; Liu, M.; Kuczera, G. The importance of spatio-temporal variability in irrigation inputs for hydrological modelling of irrigated catchments. Water Resour. Res. 2018. [Google Scholar] [CrossRef]
  23. Uniyal, B.; Dietrich, J.; Vu, N.Q.; Jha, M.K.; Arumí, R.J.L. Simulation of regional irrigation requirement with SWAT in different agro-climatic zones driven by observed climate and two re-analysis datasets. Sci. Total Environ. 2019, 649, 846–865. [Google Scholar] [CrossRef] [PubMed]
  24. Luan, X.B.; Wu, P.T.; Sun, S.K.; Li, X.L.; Wang, Y.B.; Gao, X.R. Impact of land use change on hydrologic processes in a large plain irrigation district. Water Resour. Manag. 2018, 32, 3203–3217. [Google Scholar] [CrossRef]
  25. VanLoocke, A.; Bernacchi, C.J.; Twine, T.E. The impacts of Miscanthus×giganteus production on the Midwest US hydrologic cycle. Glob. Chang. Biol. Bioenergy 2010, 2, 180–191. [Google Scholar] [CrossRef]
  26. Chen, Y.; Marek, G.W.; Marek, T.H.; Brauer, D.K.; Srinivasan, R. Assessing the efficacy of the SWAT auto-irrigation function to simulate irrigation, evapotranspiration, and crop response to management strategies of the Texas High Plains. Water 2017, 9, 509. [Google Scholar] [CrossRef]
  27. Unger, P.W.; Pringle, F.B. Pullman Soils: Distribution Importance, Variability, and Management; Bulletin B-1372; Texas Agricultural Experiment Station: College Station, TX, USA, 1981.
  28. American Society of Civil Engineers (ASCE). The ASCE Standardized Reference Evapotranspiration Equation; ASCE Environmental and Water Resources Institute: Reston, VA, USA, 2005.
  29. Web Soil Survey. Soil Survey Staff, Natural Resources Conservation Service, United States Department of Agriculture, 2011. Available online: https://websoilsurvey.sc.egov.usda.gov/App/HomePage.htm (accessed on 25 September 2018).
  30. Marek, G.W.; Gowda, P.H.; Evett, S.R.; Baumhardt, R.L.; Brauer, D.K.; Howell, T.A.; Marek, T.H.; Srinivasan, R. Estimating evapotranspiration for dryland cropping systems in the semiarid Texas High Plains using SWAT. J. Am. Water Resour. Assoc. 2016, 52, 298–314. [Google Scholar] [CrossRef]
  31. Marek, T.H.; Schneider, A.D.; Howell, T.A.; Ebeling, L.L. Design and construction of large weighing monolithic lysimeters. Trans. ASAE 1988, 31, 477–484. [Google Scholar] [CrossRef]
  32. Howell, T.A.; Schneider, A.D.; Dusek, D.A.; Marek, T.H.; Steiner, J.L. Calibration and scale performance of Bushland weighing lysimeters. Trans. ASAE 1995, 38, 1019–1024. [Google Scholar] [CrossRef]
  33. Evett, S.R.; Schwartz, R.C.; Howell, T.A.; Baumhardt, R.L.; Copeland, K.S. Can weighing lysimeter ET represent surrounding field ET well enough to test flux station measurements of daily and sub-daily ET? Adv. Water Resour. 2012, 50, 79–90. [Google Scholar] [CrossRef]
  34. Marek, G.W.; Evett, S.R.; Gowda, P.H.; Howell, T.A.; Copeland, K.S.; Baumhardt, R.L. Post-processing techniques for reducing errors in weighing lysimeter evapotranspiration (ET) datasets. Trans. ASAE 2014, 57, 499–515. [Google Scholar] [CrossRef]
  35. Xue, Q.; Zhu, Z.; Musick, J.T.; Stewart, B.A.; Dusek, A.D. Physiological mechanisms contributing to the increased water-use efficiency in winter wheat under deficit irrigation. J. Plant Phys. 2006, 163, 154–164. [Google Scholar] [CrossRef] [PubMed]
  36. Attia, A.; Rajan, N.; Xue, Q.; Nair, S.; Ibrahim, A.; Hays, D. Application of DSSAT-CERES-Wheat model to simulate winter wheat response to irrigation management in the Texas High Plains. Agric. Water Manag. 2016, 165, 50–60. [Google Scholar] [CrossRef]
  37. Chen, Y.; Ale, S.; Rajan, N.; Morgan, C.L.S.; Park, J.Y. Hydrological responses of land use change from cotton (Gossypium hirsutum L.) to cellulosic bioenergy crops in the Southern High Plains of Texas, USA. Glob. Chang. Biol. Bioenergy 2016, 8, 981–999. [Google Scholar] [CrossRef]
  38. Moroke, T.S.; Schwartz, R.C.; Brown, K.W.; Juo, A.S.R. Water use efficiency of dryland cowpea, sorghum and sunflower under reduced tillage. Soil Tillage Res. 2011, 112, 76–84. [Google Scholar] [CrossRef]
  39. Chen, Y.; Ale, S.; Rajan, N. Implications of biofuel-induced changes in land use and crop management on sustainability of agriculture in the Texas High Plains. Biomass Bioenergy 2018, 111, 13–21. [Google Scholar] [CrossRef]
  40. National Oceanic and Atmospheric Administration-National Climatic Data Center (NOAA-NCDC). Weather Data. Available online: http://gis.ncdc.noaa.gov/map/viewer/#app=cdo&cfg=cdo&theme=daily&layers=111&node=gis (accessed on 30 May 2018).
  41. Musick, J.T.; New, L.L.; Dusek, D.A. Soil water depletion—Yield relationships of irrigated sorghum, wheat, and soybeans. Trans. ASABE 1976, 19, 489–493. [Google Scholar] [CrossRef]
  42. 2011 Regional Water Plans | Texas Water Development Board. Region A 2011 RWP Appendices. Available online: http://www.twdb.texas.gov/waterplanning/rwp/plans/2011/A/Region_A_2011_RWP_Appendices.pdf?d=258905.39999999964 (accessed on 6 July 2018).
  43. Marek, G.W.; Baumhardt, R.L.; Brauer, D.K.; Gowda, P.H.; Mauget, S.A.; Moorhead, J.E. Evaluation of the Oceanic Niño Index as a decision support tool for winter wheat cropping systems in the Texas High Plains using SWAT. Comput. Electron. Agr. 2018, 151, 331–337. [Google Scholar] [CrossRef]
  44. Holman, J.D.; Arnet, K.; Dille, J.; Maxwell, S.; Obour, A.; Roberts, T.; Roozeboom, K.; Schlegel, A. Can cover or forage crops replace fallow in the semiarid Central Great Plains? Crop Sci. 2018, 58, 932–944. [Google Scholar] [CrossRef]
  45. Sophocleous, M. Groundwater recharge and sustainability in the High Plains aquifer in Kansas, USA. Hydrogeol. J. 2005, 13, 351–365. [Google Scholar] [CrossRef]
  46. Crosbie, R.S.; Scanlon, B.R.; Mpelasoka, F.S.; Reedy, R.C.; Gates, J.B.; Zhang, L. Potential climate change effects on groundwater recharge in the High Plains Aquifer, USA. Water Resour. Res. 2013, 49, 3936–3951. [Google Scholar] [CrossRef] [Green Version]
  47. Cronin, J.G. A Summary of the Occurrence and Development of Ground Water in the Southern High Plains of Texas; Texas Board of Water Engineers: Washington, DC, USA, 1961; 104p. [Google Scholar]
  48. Havens, J.S. Recharge Studies on the High Plains in Northern Lea County, New Mexico; U.S. Geological Survey: Washington, DC, USA, 1966; 52p.
  49. Brown, R.F.; Signor, D.S. Artificial Recharge Experiments and Operations on the Southern High Plains of Texas and New Mexico; U.S. Geological Survey: Washington, DC, USA, 1973; 54p.
  50. Bell, A.E.; Morrison, S. Analytical Study of the Ogallala Aquifer in Carson County, Texas, Projections of Saturated Thickness, Volume of Water in Storage, Pumpage Rates, Pumping Lifts, and Well Yields; Texas Department of Water Resources: Austin, TX, USA, 1979; 64p. [Google Scholar]
  51. Klemt, W.B. Evaluating the Ground-Water Resources of the High Plains of Texas, Neutronprobe Measurements of Deep Soil Moisture as an Indicator of Aquifer Recharge Rates; Texas Department of Water Resources: Austin, TX, USA, 1981; 31p. [Google Scholar]
  52. Texas Department of Water Resources. U.S. Bureau of Reclamation. Llano Estacado Playa Lake Water Resources Study; U.S. Department of the Interior: Amarillo, TX, USA, 1982.
  53. Wood, W.W.; Osterkamp, W.R. Recharge to the Ogallala aquifer from playa lake basins on the Llano Estacado (an outrageous proposal?). In Proceedings of the Ogallala Aquifer Symposium II; Whetstone, G.A., Ed.; Texas Tech University, Water Resources Center: Lubbock, TX, USA, 1984; pp. 337–349. [Google Scholar]
  54. Wood, W.W.; Petraitis, M.J. Origin and distribution of carbon dioxide in the unsaturated zone of the Southern High Plains of Texas. Water Resour. Res. 1984, 20, 1193–1208. [Google Scholar] [CrossRef]
  55. Knowles, T.R.; Nordstrom, P.; Klemt, W.B. Evaluating the Ground-Water Resources of the High Plains of Texas; Records of Wells and Maps Showing Locations, Base of Aquifer, Water Levels, and Saturated Thickness; Texas Department of Water Resources: Austin, TX, USA, 1984; 475p. [Google Scholar]
  56. Gutentag, E.D.; Heimes, F.J.; Krothe, N.C.; Luchkey, R.R.; Weeks, J.B. Geohydrology of the High Plains Aquifer in Parts of Colorado, Kansas, Nebraska, New Mexico, Oklahoma, South Dakota, Texas, and Wyoming; U.S. Geological Survey: Alexandria, VA, USA, 1984; 63p.
  57. Nativ, R. Recharge into Southern High Plains aquifer-possible mechanisms, unresolved questions. Environ. Geol. Water Sci. 1992, 19, 21–32. [Google Scholar] [CrossRef]
  58. Mullican III, W.F.; Fryar, A.E.; Johns, N.D. Vertical Transport of Contaminants through Perched Aquifers to the Ogallala Aquifer, Pantex Plant Area, Southern High Plains, Texas, in Dutton; American Institute of Hydrology: Austin, TX, USA, 1994; pp. 547–562. [Google Scholar]
  59. Dugan, J.T.; McGrath, T.; Zelt, R.B. Water Level Changes in the High Plains Aquifer-Predevelopment to 1992; U.S. Geological Survey: Denver, CO, USA, 1994; 56p.
  60. Wood, W.W.; Sanford, W.E. Chemical and isotopic methods for quantifying ground-water recharge in a regional, semiarid environment. Ground Water 1995, 33, 458–468. [Google Scholar] [CrossRef]
  61. Rosenberg, N.J.; Epstein, D.J.; Wang, D.; Vail, L.; Srinivasan, R.; Arnold, J.G. Possible impacts of global warming on the hydrology of the Ogallala Aquifer region. Clim. Chang. 1999, 42, 677–692. [Google Scholar] [CrossRef]
Figure 1. Location, size, orientation, and water management of the two large weighing lysimeter fields at the USDA-ARS Conservation and Production Research Laboratory (CPRL), Bushland, TX.
Hydrology 05 00053 g001
Figure 2. Simulated monthly precipitation, irrigation, and ET amounts under irrigated (a) corn, (b) winter wheat, (c) cotton, (d) soybean, (e) sunflower, and (f) grain sorghum scenarios.
Hydrology 05 00053 g002
Figure 3. Simulated monthly soil water content of the whole soil profile under dryland (a) winter wheat, (b) cotton, (c) soybean, (d) sunflower, (e) grain sorghum, and (f) fallow land use scenarios.
Hydrology 05 00053 g003aHydrology 05 00053 g003b
Table 1. Soil properties of the study site.
Soil PropertiesLayer 1Layer 2Layer 3Layer 4
Layer depth (mm)0–180180–860860–18001800–2300
Bulk density (g cm−3)1.431.381.381.45
Clay content (% soil mass)33.942.139.439.1
Silt content (% soil mass)53.848.047.647.1
Sand content (% soil mass)12.39.913.013.8
Available water capacity (mm H2O per mm soil)0.200.180.190.14
Saturated hydraulic conductivity (mm h−1)9.722.162.169.72
Table 2. Crops grown in the large weighing lysimeter fields at Bushland, Texas under full irrigation and dryland conditions from 1996 to 2016.
YearFull Irrigation Using Sprinkler SystemDryland Conditions
1996AlfalfaEntire-year fallow with bare soil
1997AlfalfaGrain sorghum
1998AlfalfaGrain sorghum
1999AlfalfaGrain sorghum
2000CottonCotton
2001CottonCotton
2002CottonEntire-year fallow with bare soil
2003SoybeanGrain sorghum
2004SoybeanCotton
2005Grain sorghumEntire-year fallow with bare soil
2006Forage cornGrain sorghum
2007Forage sorghumGrain sorghum
2008CottonCotton
2009SunflowerEntire-year fallow with bare soil
2010CottonSoybean
2011SunflowerSunflower
2012No cropDrip installation
2013Grain cornDrip-irrigated grain corn
2014Grain sorghumDrip-irrigated grain sorghum
2015Grain sorghumDrip-irrigated grain sorghum
2016Grain cornDrip-irrigated grain corn
Table 3. Long-term crop management information under the land use scenarios.
ScenariosCropPlanting DateFertilizer (kg ha−1) *Harvest DateInformation Source
1Irrigared grain corn14 May644.519 Oct.2013 and 2016 data
2Irrigated winter wheat5 Oct.41228 June[35,36]
3Irrigared cotton21 May326.522 Nov.2000, 2001, 2002, 2008, and 2010 data
4Irrigared soybean16 May017 Oct.2003 and 2004 data
5Irrigared sunflower4 June51019 Oct.2009 and 2011 data
6Irrigared grain sorghum30 May61215 Oct.2005, 2014, and 2015 data
7Dryland winter wheat15 Oct.1501 July[35,37]
8Dryland cotton21 May207.78 Dec.2000, 2001, 2004, and 2008 data
9Dryland soybean16 May017 Oct.2010 data
10Dryland sunflower4 June9120 Sept.[38]
11Dryland grain sorghum13 June17017 Oct.2003, 2006, and 2007 data
12Fallow with bare soil- -- -- -2002, 2005, and 2009 data
* Ammonium nitrate fertilizer.
Table 4. Comparison of long-term simulated and actual irrigation (annual amount in mm).
CropSimulated Irrigation RangeSimulated Irrigation AverageActual Irrigation RangeActual Irrigation AverageObserved Data Source
Grain corn254–635450470–6185442013 and 2016 irrigated data
Winter wheat0–762409400.0400[35]
Cotton279–559406282–4863892001, 2002, 2008, and 2010 irrigated data
Soybean229–483361313–4954042003 and 2004 irrigated data
Sunflower178–483353375–4854302009 and 2011 irrigated data
Grain sorghum178–457305198–2382242005, 2014, and 2015 irrigated data
Table 5. Comparison of long-term simulated evapotranspiration (ET) under irrigated and fallow conditions with the observed ET (annual amount in mm).
Land UseSimulated ET RangeSimulated ET AverageObserved ET RangeObserved ET AverageObserved Data Source
Grain corn796–1055938847–9579022013 and 2016 irrigated data
Winter wheat599–1158918833.0833[35]
Cotton739–1030901798–10189052001, 2002, 2008, and 2010 irrigated data
Soybean740–969856884–9499172003 and 2004 irrigated data
Sunflower716–942845766–9328492009 and 2011 irrigated data
Grain sorghum623–893798790–8238072005, 2014, and 2015 irrigated data
Fallow with bare soil375–578457319–4574002002, 2005, and 2009 dryland data
Table 6. Comparison of long-term simulated crop yields with the measured yields (annual yield in Mg ha−1).
CropSimulated Yield RangeSimulated Yield AverageObserved Yield RangeObserved Yield AverageObserved Data Source
Irrigated grain corn10.9–13.712.4110.4–14.112.252013 and 2016 irrigated data
Irrigated winter wheat6.10–8.136.827.117.11[35]
Irrigated cotton0.28–1.220.670.33–1.100.672001, 2002, 2008, and 2010 irrigated data
Irrigated soybean2.25–3.432.902.66–3.162.912003 and 2004 irrigated data
Irrigated sunflower2.29–4.713.673.31–3.333.322009 and 2011 irrigated data
Irrigated grain sorghum6.62–8.938.096.54–9.408.012005, 2014, and 2015 irrigated data
Dryland winter wheat0.52–4.402.202.432.43[36]
Dryland cotton0.16–0.640.320.25–0.460.332001, 2004, and 2008 dryland data
Dryland soybean0.03–1.980.640.560.56[41]
Dryland sunflower0.20–1.590.860.51–1.010.76[38]
Dryland grain sorghum0.85–5.582.952.31–3.493.061997, 1998, and 1999 dryland data
Table 7. Comparison of different crop selection scenarios under irrigated conditions.
Irrigated Crops (mm)IrrigationPercolationNet Groundwater UseDifference in Net Groundwater Use Compared to Grain Corn
Grain corn450184320.0
Winter wheat4091408−24 (−5.5%)
Cotton40611396−36 (−8.3%)
Soybean36110350−82 (−18.9%)
Sunflower35313340−92 (−21.3%)
Grain sorghum30512293−139 (−32.2%)
Net groundwater use = irrigation − percolation; The number in the brackets is the change percentage.
Table 8. Comparison of different land use scenarios under dryland conditions.
Dryland Crops (mm)PercolationSoil Moisture DepletionSoil Moisture Depletion Compared to FallowWater Lost from System Compared to Fallow
Winter wheat0553768
Cotton0472960
Soybean0543667
Sunflower0573970
Grain sorghum0513464
Fallow with bare soil31180.0−13
Table 9. A summary of the literature for groundwater recharge studies in the Texas Ogallala Aquifer region from 1960 to 2016.
LiteratureGroundwater Recharge/Percolation (mm year−1)
Cronin [47]13.0
Havens [48]20.6
Brown and Signor [49]1.3
Bell and Morrison [50]13.0
Klemt [51]4.8
U.S. Bureau of Reclamation [52]24.0
Wood and Osterkamp [53]2.5
Wood and Petraitis [54]2.5
Knowles et al. [55]3.9
Gutentag et al. [56]2.1
Nativ [57]30.0
Mullican et al. [58]6.0
Dugan et al. [59]25.5
Wood and Sanford [60]11.0
Rosenberg et al. [61]6.0
Sophocleous [45]7.0
Crosbie et al. [46]9.5
Chen et al. [37]10.5
Total average10.7

