Review

Applications of Open-Access Remotely Sensed Data for Flood Modelling and Mapping in Developing Regions

by
Iguniwari Thomas Ekeu-wei
* and
George Alan Blackburn
Lancaster Environment Centre, Lancaster University, Lancaster LA1 4YQ, UK
*
Author to whom correspondence should be addressed.
Hydrology 2018, 5(3), 39; https://doi.org/10.3390/hydrology5030039
Submission received: 28 March 2018 / Revised: 21 July 2018 / Accepted: 22 July 2018 / Published: 31 July 2018
(This article belongs to the Special Issue Advances in Large Scale Flood Monitoring and Detection)

Abstract

:
Flood modelling and mapping typically entail flood frequency estimation, hydrodynamic modelling and inundation mapping, which require specific datasets that are often unavailable in developing regions due to financial, logistical, technical and organizational challenges. This review discusses fluvial (river) flood modelling and mapping processes and outlines the data requirements of these techniques. This paper explores how open-access remotely sensed and other geospatial datasets can supplement ground-based data and high-resolution commercial satellite imagery in data sparse regions of developing countries. The merits, demerits and uncertainties associated with the application of these datasets, including radar altimetry, digital elevation models, optical and radar images, are discussed. Nigeria, located within the Niger river basin of West Africa is a typical data-sparse country, and it is used as a case study in this review to evaluate the significance of open-access datasets for local and transboundary flood analysis. Hence, this review highlights the vital contribution that open access remotely sensed data can make to flood modelling and mapping and to support flood management strategies in developing regions.

1. Introduction to Flood Modelling and Mapping

Managing floods effectively requires a good understanding of historical flood trends, future expectations, and identification of locations likely to be impacted by flooding. Flood mapping provides the baseline for acquiring such information, to ensure preparedness, response and recovery efficiently undertaken to mitigate the impact of flooding [1]. Flood mapping is a process that describes the expected extent of water inundation into dryland as a result of intense precipitation or river water level rise driven by natural or anthropogenic factors [2]. Flood mapping processes differ considerably from project to project, and/or country to country, depending on specific project requirements and country-specific guidelines. In addition, the scale of flood mapping is influenced by available data, resources, technical know-how and delivery timeline, and this can determine the approach deployed [3,4,5,6]. Nevertheless, the sequence of activities that lead to the final flood hazard map outcome is fundamentally the same, and involves (i) flood frequency estimation: the probability of occurrence of a flood of specific magnitude over a certain period; (ii) hydrodynamic modelling: routing of expected or known river discharge or catchment runoff over a landscape to determine water depth, velocity and inundation extent; (iii) risk mapping: determining through overlay analysis, the landscape properties (land use/cover, infrastructures, population density, socioeconomic activities, etc.) to be impacted within flooded regions [7,8,9,10,11].
Typical flood mapping processes are presented in Table 1, including the basic data requirements, expected outcomes and some reference case studies. These processes, if executed with reasonable accuracy, can provide the necessary information to underpin effective flood management decisions such as floodplain planning, design of flood defence structures, and implementation of disaster response and recovery measures to mitigate flood impact.
Going forward, this review highlights that the data required for flood modelling and mapping is scarce in many developing regions (Table 1), and details how open-access remotely sensed data can compensate for ground monitoring deficiencies in local and transboundary river basins. The applications of remotely sensed data sets such as altimetry, digital elevation models, radar and optical images in each flood mapping process are discussed. To further demonstrate the usefulness of open-access remotely sensed data in developing regions, Nigeria is used as the case study for this review, which is a typical data-sparse country that has experienced severe flooding in recent years, the prospects for the use of remotely sensed data are discussed.

2. Data Limitations, Prediction of Ungauged Basins and Remote Sensing Advancements

In recent decades, floods have been perceived to be increasingly frequent, widespread and more devastating. As such, existing spatial networks of hydrological gauging stations have become inadequate for optimal data collection [22]. In some case, obsolete equipment, financial and technical challenges hamper sufficient data collection for flood modelling and mapping [23,24,25]. Due to increasing global data deficiency and the uncertainty associated with sparse data for hydrological and hydrodynamic modelling, the International Association of Hydrological Sciences (IAHS) launched the Prediction of Ungauged Basins (PUB) initiative to explore alternative data and techniques for improved ungauged basin modelling [26]. One of the core objectives of the PUB is to “Advance the technological capability around the world to make predictions in ungauged basins firmly based on local knowledge of the climatic and landscape that controls hydrological processes, along with access to the latest data sources, and through these means constrain the uncertainty in hydrological predictions” [27]. This objective aligns seamlessly with remote sensing (RS), considering that it provides an alternative data source to improve our understanding of local hydrology and associated uncertainties in flood mapping for data-sparse regions [28].
RS has advanced enormously in recent decades, and this has led to the availability of free datasets in many parts of the world, thereby enabling developing countries to explore its potential at little to no data acquisition cost [29]. This review focuses on the integration of open-access (freely available) satellite data into fluvial (river) flood mapping processes to compensate for data sparsity faced in developing regions, then uses a Nigerian case study to assess the possibility of leveraging on global geospatial technology for local and transboundary flood management. Inferences are drawn from previous reviews on low-cost Geographic Information System (GIS) and RS applications in hydrology, hydrodynamic modelling and flood mapping [30,31,32]. However, a wider range of freely available datasets and sources needed for every flood-mapping step listed in Table 1 are explored in this review.

3. Open-Access Remotely Sensed Data Sources for Flood Modelling and Management

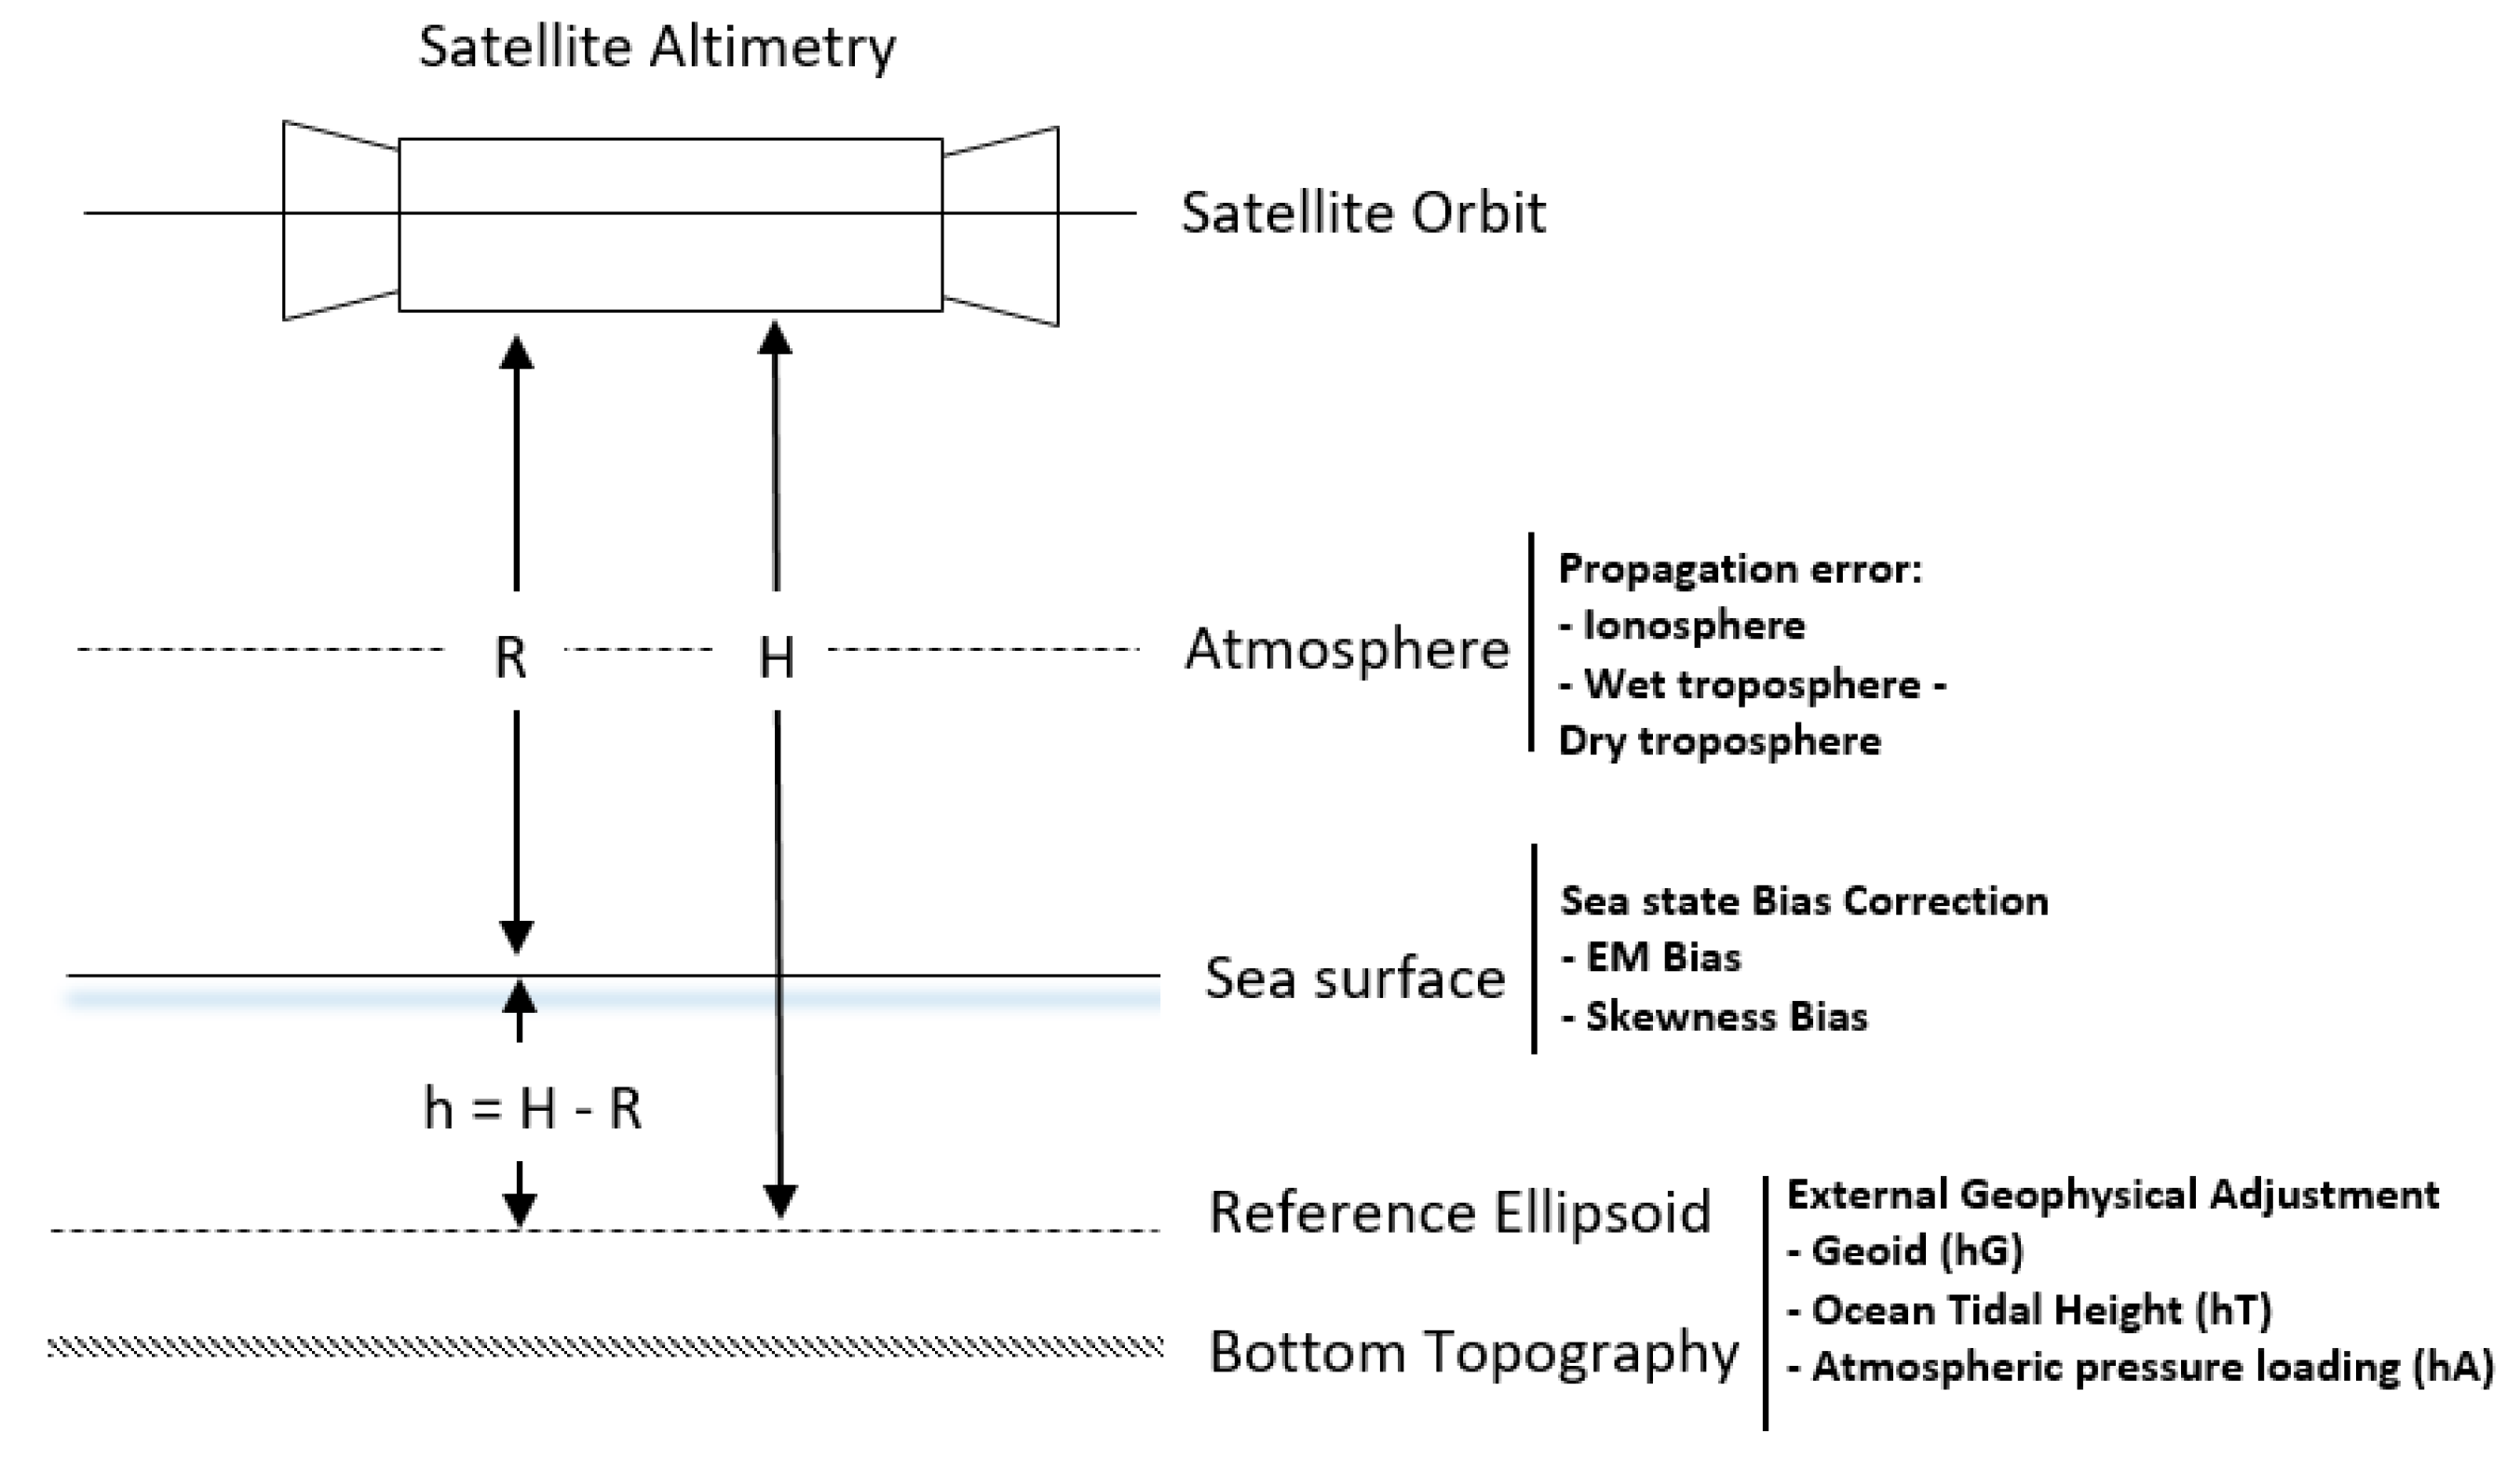
3.1. Radar Altimetry for Water Level and Elevation Measurements

River water levels are an essential data input (initial and boundary conditions) for hydrology and hydrodynamic modelling [33], and advances in RS have improved the way changes in water surface elevation and slope can be measured since the early 90’s [34]. Radar altimetry missions originally developed for ocean water level measurements now routinely measure freshwater surface elevation of large rivers [35,36]. Radar altimetry data is acquired via a process that measures the distance between the orbiting satellite and water surface in relation to a reference datum, by estimating the time it takes a sensor emitted echo pulse to be reflected by a water surface and return to satellite [37,38], using Equations (1) and (2), and the schematic of this methodology is presented in Figure 1. Altimetry water levels are usually measured at virtual stations located intermittently where altimetry satellite tracks cross path with rivers [39,40], see Figure 2. When altimetry tracks pass over dry land, the elevation of the surface intersected is measured; this is elaborated later in Section 3.1.2. A sample of altimetry time series extracted from the surface monitoring by satellite altimetry database [41] for the Niger River in Nigeria is presented in Figure 3.
The water level at a river of interest with reference to a predefined datum (such as Earth Gravitational Model (EGM 2008)), is expressed as:
h = H R C o r
R C o r = R ( c Δ t 2 ) C o r
where, h = water surface elevation in relation to the reference ellipsoid, H = altitude of the satellite (from satellite orbit to reference ellipsoid), R = range (distance between satellite and open surface water body), RCor = corrected range, c = speed of light, Δ t 2 = the dual direction travel time of radar signal, and C o r = the sum of ionospheric, tidal, wet and dry tropospheric corrections.
The vertical accuracy of altimetry water levels contributes to hydrologic and hydraulic modelling outcome uncertainties [43]. In comparison to ground (in-situ) measurements, altimetry water level vertical accuracy ranges from approximately 0.01 to 0.05 metres, and Root Mean Squared Error (RMSE) from 0.003 to 0.004 metres for watershed areas up to 100 km2 [36,44,45,46]. In some cases, the difference between altimetry and in situ water levels can be as high as 2 metres [47]. Accuracies of altimetry water level are presented in Table 2 and these variations in accuracies are attributed to the different sensor types, the distance between in situ and virtual station, and location of altimetry track intersection with the river [29]. Other factors that affect altimetry accuracy include ionosphere, troposphere, instrument noise, geoid, tidal and water surface variations [38,48,49], as well as local topography and heterogeneity of reflecting land surfaces [50]. The river width at the location of the virtual station overpass if lower than the altimetry satellite track footprint and the presence of a tributary or distributary between in situ and virtual station have also been identified as the external factors that can contribute to altimetry water level discordancy from ground level measurements [37,51]. Despite these limitations, altimetry has been widely applied in hydrology and the four key areas of deployment, particularly in the context of hydrodynamic modelling in data-sparse regions, are discussed in the following sub-sections.

3.1.1. Altimetry for Discharge Estimation

River discharge and water level often used as initial/boundary conditions for hydrodynamic and hydrological models are rarely available at most remote locations of many developing regions due to factors previously highlighted in Section 2 [23,39]. Radar altimetry has been explored in several studies to curb data limitation challenges and reduce the uncertainty associated with modelling ungauged rivers.
Papa et al. [58] utilised TOPEX/Poseidon, ERS-2, ENVISAT and Jason 2 altimetry water levels in combination with in situ rating curves to estimate discharge along the Ganga and Brahmaputra rivers from 1993–2011. Accuracy levels of 0.17 (mean error) and 0.28 (standard error) metres in comparison to in situ discharge at gauging stations were achieved. River discharge along the Godavari river from 2001 to 2014 was derived by combining ENVISAT (2002–2010), Jason-2 (2008–2014) and SARAL/Altika (2013–2014) radar altimeter water levels with in-situ rating curves at nearby gauging stations. When validated against a hydrodynamic model a correlation coefficient (R2) of 0.9 and a standard error varying from 0.15 to 0.40 metres were achieved [59]. In an Amazon River basin study, Getirana and Peters-Lidard [60] explored the potential of estimating discharge using altimetry data from ENVISAT (2002–2005). Using the relationship between in situ water level and discharge, Getirana and Peters-Lidard, [60] successfully estimated discharge at 90 virtual stations with mean relative errors varying from 15 to 84% for small and large and river basins respectively. Discharge was estimated at transboundary rivers including the Danube (Austria, Romania, Bulgaria, Slovakia, Hungary, Ukraine, Croatia, Germany, Serbia, and Moldova), Mekong (Thailand, Cambodia, Laos, China, Myanmar (Burma and Vietnam), Amazon (Ecuador, Colombia, Peru, and Brazil), Brahmaputra (India), Amur (China and Russia), Ob (Russia), Vistula (Poland) and Niger (Nigeria, Mali, Niger, Benin, and Guinea), using a quantile function algorithm that exploits ENVISAT altimetry data [61]. This approach resulted in discharge outcomes similar to those derived from a conventional Forecast Rating Curve (FRC) approach.
The studies presented above indicate that river discharge estimation from altimetry water levels typically depends on the rating curve or river geometry data availability [62]. However, several studies have been able to demonstrate direct river discharge estimation from altimetry water levels in the absence of in situ measurements, using supplemental remotely sensed data or models. ENVISAT altimetry data from six virtual stations along the Brahmaputra river from 2008 to 2010 were assimilated into a Muskingum routing model driven by outputs of a calibrated Budyko type rainfall-runoff model derived from Tropical Rainfall Measuring Mission (TRMM) Multi-satellite Precipitation Analysis (TMPA) 3B42RT real-time products. This integrated approach improved the model’s discharge predictive accuracy (Nash-Sutcliffe (NS) efficiency) from 0.78 to 0.84. Additionally, Tarpanelli et al. [63] combined Moderate-resolution Imaging Spectroradiometer (MODIS) Terra and Aqua satellite images with ENVISAT altimetry using a pixel to water level detection approach to estimate discharge with a correlation coefficient of 0.96 and NS efficiency of 0.91 when compared to in situ discharge along the Niger and Benue rivers. Similarly, Sichangi et al. [64] integrated MODIS satellite-derived river width and altimetry water levels into Manning’s equation to estimate discharge at a continental scale. The derived discharge NS efficiency varied from 0.60 to 0.97.
Although the discharge estimates derived from radar altimetry as presented above are perceived to be within acceptable levels of uncertainty, factors such as the distance between virtual and ground stations, contributing tributaries and the width of the river affect the accuracy of such estimates [51]. The studies discussed above also reveal that the availability of supplementary remotely sensed data and hydrodynamic models can enable improved discharge estimation in ungauged river basins.

3.1.2. Altimetry for Digital Elevation Model Accuracy Assessment

Once the discharge and/or flood magnitude is estimated, it is propagated longitudinally along river channels and laterally across floodplains using hydrodynamic models governed by continuity and momentum equations [65]. The accuracy of the DEM that defines the river channel and floodplain terrain upon which flow is propagated influences model outcome accuracy [66]. Therefore, in several flood modelling studies the accuracy of the primary DEM is assessed prior to usage against a higher accuracy DEM such a Light Detection and Ranging (LiDAR) or Differential Global Positioning System (GPS) elevation points [67,68,69,70]. Acquiring such detailed topography datasets for [2complexity and weather conditions that hinder logistics and field operations [71,72].
Data acquired by the National Aeronautics and Space Administration (NASA) between 12 January 2003 and 11 October 2009 using the Geoscience Laser Altimeter System (GLAS) onboard the Ice Cloud and Land Elevation Satellite (ICE Sat) provides a worthy alternative to ground elevation data due to its high accuracy in comparison to Kinematic GPS measurements [73]. The absolute accuracy of ICE Sat has been shown to range from 0.002 to 0.005 m in Bolivia [74] and French Lake [75], respectively, and depends on the slope of the terrain under scrutiny [76]. Over the years ICE Sat/GLAS has been applied in assessing various DEM accuracies including SRTM [77,78,79], ASTER GDEM [76,80], GPS elevation [81], Carto DEM [82], Canadian DEM [83], InSAR DEM [84], TanDEM [85] and modified/corrected DEMs [52,86,87]. The 70-m ground footprint of ICE Sat [73] coupled with its ability to penetrate gaps in vegetation canopy to capture underlying bare earth elevation [88] makes it a useful alternative to ground survey for DEM accuracy assessment.

3.1.3. Altimetry for Bathymetry Delineation

Accurate digital elevation models combined with detailed river bathymetry delineation provides the most accurate terrain data for flood routing [65,89]. Nevertheless, acquiring such data for remote locations is usually difficult as discussed earlier (Section 3.1.2). Hence, flood modellers have resorted to exploring alternative options to compensate for such deficiencies. In the Amazon and Napo Rivers in Peru, Chávarri et al. [90], examined the applicability of altimetry (ENVISAT) in constraining river cross-sections of a one-dimensional hydraulic model. The results showed reduced model uncertainty, mostly for rivers with widths less than or equal to 2.5 km. The relationship between river width and depths established using ENVISAT altimetry was combined with SRTM, Landsat, MODIS and satellite rainfall data to derive an updated river network and adjusted bed profile used in the development of Ganges, Brahmaputra, and Meghna (GBM) model suitable for large ungauged watersheds [33]. The GBM model data integration approach resulted in a reduced RMSE from 3.0 to 1.0 metres.
The proposed Surface Water and Ocean Topography (SWOT) scheduled for launch in 2020 is expected to provide some of the best altimetry data for water resource monitoring and management at a global scale [57,91]. A few studies have explored the potential of SWOT derived bathymetry for improving the accuracy of hydrodynamic modelling. For example, Durand et al. [92] experimented simulated data of the SWOT mission, applying data assimilation technique to estimate bathymetric depth and slope at five points along a 240 km reach along the Amazon river to within 0.50 m and 0.30 cm km−1 accuracies, respectively. These outcomes were then integrated into the LISFLOOD-FP hydrodynamic model [93] to improve estimates of inundation extent and downstream water surface elevation (WSE). SWOT WSE was also assimilated into the LISFLOOD-FP hydrodynamic model using a local ensemble batch smoother (LEnBS) method by Yoon et al. [94], to generate bathymetry, depth and discharge estimates. Bathymetry extracted from SWOT had a RMSE of 0.56 metres, improving with the inclusion of more SWOT observations in the modelling process. The proposed SWOT and recently launched Sentinel-3 provides a huge prospective dataset for future of hydrodynamic studies, and their integration into hydrodynamic models can improve flood extent, discharge and water levels predictions, particularly when multiple altimetry data are available along a modelled reach, as Yoon et al. [94] suggested.

3.1.4. Altimetry for Hydrodynamic Model Calibration and Validation

Hydrodynamic model calibration is usually undertaken by adjusting various model parameters such as floodplain roughness, channel roughness, river channel depth and river width in order to tune model outputs (water level, discharge and/or inundation extent) to observations, derived from in situ or remotely sensed measurements [38,42,95,96]. Validation, on the other hand, helps reveal how well a model represents what is found in reality [97], and is directly linked to the confidence in the flood management measures implemented as a result of the model outcome. Commercial high-resolution optical and radar satellites images, aerial images and hydrological data have been largely established as the optimal data sources for hydrodynamic model calibration and validation [98,99,100,101]. However, the high cost of acquiring such data hinders their application in developing countries [102]. Hence, radar altimetry over the past decade has been explored globally as an alternate source of data for model calibration and validation [103].
Typically, in many developing regions river measurements are manually collected using staff gauges and later converted to discharge using an established rating curve. At the peak of floods, measurement equipment may be damaged, or access roads inundated, thus impeding the observation process [32]. Therefore, radar altimetry provides an alternative river measurement option that supports hydrodynamic model calibration and validation in the absence of observed records [103].
Water level data from three ENVISAT altimetry virtual stations along a 150 km reach of the Danube river were applied in the calibration of a 2-D LISFLOOD-FP model to reconstruct the 2006 transboundary flood occurrence [104]. Yan et al. [104] achieved a Mean Average Error (MAE) of 1.53 m and 1.37 m for altimetry and in situ model calibration approaches, respectively, suggesting that both datasets can be used interchangeably to improve flood modelling in sparsely gauged river basins. Domeneghetti et al. [105] performed hydrodynamic model calibration for a 140 km reach along the Po river using ERS-2 and ENVISAT altimetry data, resulting in RMSE of 0.85 m and 0.73 m respectively, and an improved NS efficiency when altimetry is combined with in situ data for model calibration. An implementation of the Soil and Water Assessment Tool (SWAT) rainfall run-off model for the sparsely gauged Okavango transboundary river of Angola, Namibia and Botswana were calibrated using total water storage derived from Gravity Recovery and Climate Experiment (GRACE) altimetry satellite and in situ data [106]. In addition, Sun et al. [42] assessed the uncertainty associated with Hydrological Model (HYMOD) along the Mississippi River, calibrated against in situ and altimetry data. NS efficiencies of 79.05 and 64.50 were reported for in situ stream flow and radar altimetry (TOPEX/Poseidon), respectively, showing reduced uncertainty for streamflow calibration in comparison to altimetry calibration.
Notwithstanding the value of radar altimetry for hydrodynamic model calibration and validation, residual altimetry uncertainties are expected to affect flood model accuracy as Tommaso et al. [107] demonstrated. This was further emphasised by Domeneghetti et al. [105], where ENVISAT proved to provide higher accuracy than ERS-2 (See Table 2 for altimetry accuracy differences). Belaud et al. [38] applied TOPEX/Poseidon (T/P) and ENVISAT altimetry data to calibrate a propagation model and disclosed that inherent altimetry uncertainties have an effect on the model outcome. Despite these deficiencies, the importance of altimetry data in model calibration and validation in ungauged basins cannot be dismissed. However, it is advised that altimetry is applied in combination with in-situ data when available [105], and when there is a choice in situ data should take priority over altimetry [108].

3.2. Open-Access Digital Elevation Model Data and Applications in Flood Modelling

Topographical data is an essential requirement in hydrological and hydrodynamic modelling, especially for ungauged river basins [29,109], and accounts for a substantial portion of the uncertainty that propagates through to model outcomes [66,110]. The effect of terrain accuracy on hydrodynamic models and the need for accuracy assessment have been discussed briefly in Section 3.1.2 and Section 3.1.3, revealing how improved river channel characterization using altimetry can improve flood model outcomes [90,92,94]. High-resolution topographical data such as LiDAR, TanDEM, bathymetry and differential Geographic Positioning System (dGPS) survey provides the best terrain depiction with reduced uncertainty and error [19,89,111,112]. However, the cost of acquiring such data is enormous [69] and in other cases, remote locations are inaccessible and security challenges add to the complexity of field surveys [52]. Freely available DEMs have been widely used as an alternative to commercial data in many developing regions where data is sparse, and resources limited [67,113].
The Shuttle Radar Topography Mission (SRTM) DEM is arguably one of the most widely used topographical data in developing regions, applied in improving flood modelling in data-sparse regions [52,69,103,114]. The 30 and 90 m resolution SRTM was collected during an 11-day mission in February 2000, through a collaborative effort involving NASA, the National Geospatial-Intelligence Agency (NGA) and the German Aerospace Centre (DLR), and provides near-global scale (80%) elevation data [115,116]. The 15-m Advanced Spaceborne Thermal Emission and Reflection Radiometer (ASTER) Global Digital Elevation Model (GDEM) acquired by a joint mission of the NASA and Japan’s Ministry of Economy, Trade, and Industry is also widely used in flood modelling and mapping [70,117,118]. However, the ASTER GDEM is argued to be less accurate than SRTM due to extensive elevation pixel voids [68,91].
Other open-access topographic data sets such as Altimeter Corrected Elevations 2 (ACE2) GDEM, Global 30 Arc-Second Elevation (GTOPO30) and Global Multi-resolution Terrain Elevation Data 2010 (GMTED2010) are generally coarse in resolution and are therefore employed in large-scale models only [114,119]. The recently released Advanced Land Observing Satellite (ALOS) DEM [120] has been evaluated and established to provide more accurate elevation in comparison to SRTM and ASTER [121]. A recent flood extent modelling study by Courty et al [122] revealed that the ALOS DEM outperformed its SRTM counterpart. The properties of various open-access DEMs and some case studies are presented in Table 3. The discrepancies between open-access DEM and ground surveyed elevation presented in Table 3 can be attributed to inherent systemic and external factors [115]. For the SRTM, system noise, as well as beam reflection off forest canopies, water bodies and rooftops in urban areas contribute to DEM bias and elevation overestimation [66,78,123,124].
Various methods have been adopted to curb the deficiencies and reduce the uncertainty associated with open-access DEMs. For example, Baugh et al. [124] reduced STRM uncertainty by combing vegetation canopy heights [132,133] and MODIS imagery to reduce vegetation height effects. Betbeder et al. [134] reduced SRTM bias by 64 percent by adopting a systematic approach that combines vegetation height [132], Landsat land cover map and radar altimetry to produce a hydrologically corrected DEM. SRTM derived river cross-sections were adjusted using limited bathymetric surveys and applied in the one-dimensional MIKE11 model [67] and LISFLOOD-FP two-dimensional model Sanyal et al. [69] to reduce model uncertainty. Neal et al. [114] adopted an approach that reduced SRTM uncertainty by making hydrodynamic model parameters such as channel width and depth calibratable in a sub-grid LISFLOOD-FP model, thereby improving simulated water levels, wave propagation and flood extent. Biancamaria et al. [135] experimented by varying river channel depth in the SRTM DEM by 5, 10 and 15 m when modelling Obi river, and identified 10 m as the optimal average river channel depth for the best outcome. In a recent study in Australia, Jarihani et al. [52] adopted the Hydrological Correction (HC) and Vegetation Smoothening (VS) [136] approaches to reduce SRTM and ASTER DEM error and deduced that the HC DEM outperformed the VS DEM for flood modelling.
Although the DEM modification techniques described above resulted in reduced DEM and flood model uncertainty, they require specific skill sets, computational power and supplementary data that are not always readily available. Hence, there is a need to identify globally available off-the-shelf modified DEMs that can be readily applied in developing regions where such resources are seldom available. At a global scale, errors emanating from satellite system noise, and sensor beam reflection off vegetation canopy, water surfaces and urban rooftops have been treated with different techniques, resulting in the development of freely available new data sets. O’Loughlin et al. [137] reduced average vertical bias from 14.1 m to 5.9 m by systematically combining ICESat GLAS ground elevation [73], vegetation height [132], MODIS-derived forest canopy density and climate regionalization maps [138,139]. Sampson et al. [86] reduced SRTM sensor noise irregularities, urban landscape and vegetation canopy elevation overestimations using a moving window filtering technique [136]. Their approach reduced RMSE from 10.96 m to 6.05 m when compared to LiDAR, and overall flood model bias from 15.08 m to −0.1 m. The EarthEnv-DEM90 was developed by Integrating ASTER GDEM2, CGIAR-CSI SRTM V4.1 and Global Land Survey Digital Elevation Model (GLSDEM) using a combined delta surface filling [140] and adaptive DEM noise smoothing [136] methodology, resulting in minimised error compared to raw SRTM and ASTER GDEM2 [141]. A recent DEM developed by Yamazaki et al [140] was developed using a multi-error removal approach that removed error factors that include absolute bias, stripe noise, speckle noise, and tree height bias using multiple satellite datasets and filtering techniques, resulting in Multi-Error-Removed Improved-Terrain DEM (MERIT DEM). The properties of various modified SRTM DEMs and some case studies are presented in Table 4.
Since no study currently presents a comparison of all globally available modified SRTM DEMs for a specific region, a comparative analysis of all the modified DEMs and raw SRTM is presented in Table 5, evaluated against ICE Sat/GLAS altimetry data for the Niger-South river basin of Nigeria. The result reveals that Bare-Earth SRTM corrected for vegetation provides the best elevation estimates in comparison to the ICE Sat/GLAS altimetry dataset. This is expected to support the selection of globally modified SRTM DEMs for flood modelling and mapping studies going forward.

3.3. Open-Access Optical and Radar Satellite Images and Applications in Flood Modelling and Mapping

Optical and radar images also play a crucial role in flood modelling and mapping, being used for a range of applications including (i) manning’s roughness derivation [143], (ii) river width estimation [143], (iii) geomorphological properties extraction [143], (iv) inundation extent mapping [112], (v) river discharge estimation [144,145], (vi) land use/cover derivation [146], (vii) bathymetry estimation [147] and (viii) hydrodynamic model calibration and validation [148]. In this context, open-access images from Landsat, MODIS and ASTER have been widely used in developing regions [32]. Until the launch of the free high-resolution C-Band Sentinel-1 SAR mission by the European Space Agency (ESA) in 2014, the use of radar imagery in developing regions has been limited due to the cost of acquisition [149,150]. Nevertheless, other low-cost radar satellite images such as ERS-1, ERS-2, JERS1 and ALOS PALSAR have widely been applied for flood modelling [29].
Optical and radar RS each provide unique merits and demerits and are characterised based on the source of energy employed during data collection. Optical (passive) RS relies on solar energy, while radar (active) RS uses an inbuilt energy source onboard the satellite [32]. Therefore, optical remotely sensed data can only be captured in the day-time and depends on cloud-free skies [32]. However, its multispectral characteristics make it a suitable for land use/cover classification, inundation delineation, drainage mapping and flood impact assessment [40,151,152]. Flood extent is derived from the discrimination between the spectral signatures of water surface and the surrounding landscape in single or multi-temporal images, using classification or spectral indices approaches [151,153].
Radar RS has the ability to penetrate clouds and its ability to discrimination water makes it the optimal data type for flood mapping when available [149,154]. Flood maps are usually extracted by pixel discrimination, given that flooded pixels tend to have lower values of back-scatter, due to the weak return signal associated with a smooth water surface [155]. The discrimination method applied can strongly influence the accuracy of the derived flood extent [156]. Analytical techniques for flood mapping using radar data include statistical active contouring, radiometric thresholding, histogram thresholding, pixel-based segmentation, fractal dimensioning of multi-temporal images, neural networks in a grid system, image segmentation and decision tree analysis [157,158]. Despite the advantages of radar RS, sensor noise and backscatter from vegetation and buildings have been identified as factors that hamper flood discrimination potential using radar data [157,159,160]. Furthermore, the temporal resolution, spatial accuracy and flood detection precision also affect the usability of radar images, especial for near-real-time flood forecasting in data-sparse regions [161,162].
The properties of some open-access optical and radar data sources are presented in Table 6, along with some case studies in flood modelling and mapping.

4. Case Study: Open-Access Remotely Sensed Data Applications in Flood Monitoring and Management in Nigeria

Nigeria, used as the case study for this review is located downstream of the Niger Basin (Figure 4) which collects run-off from a 2,156,000 km2 area and passes this through the Niger and Benue rivers [165]. Thus, Nigeria is prone to fluvial flooding, which exposes floodplain dwellers to diverse negative consequences [166,167,168,169]. Nigeria recently experienced unprecedented levels of flooding attributed to poor dam water release management and risk communication, linked to data unavailability for informed and prompt decision making [165].
This section focuses on identifying the causes of data deficiencies in Nigeria and presents the outcome of reviewed literature on the applications of open-access remotely sensed data in Nigeria, to identify gaps and opportunities for research based on global trends discussed in the preceding sections. This section builds upon previous reviews on GIS and RS in flood risk management in Nigeria [170,171,172,173,174], then expands further on data challenges, solutions and prospects for regional and national flood management using open-access remotely sensed data.

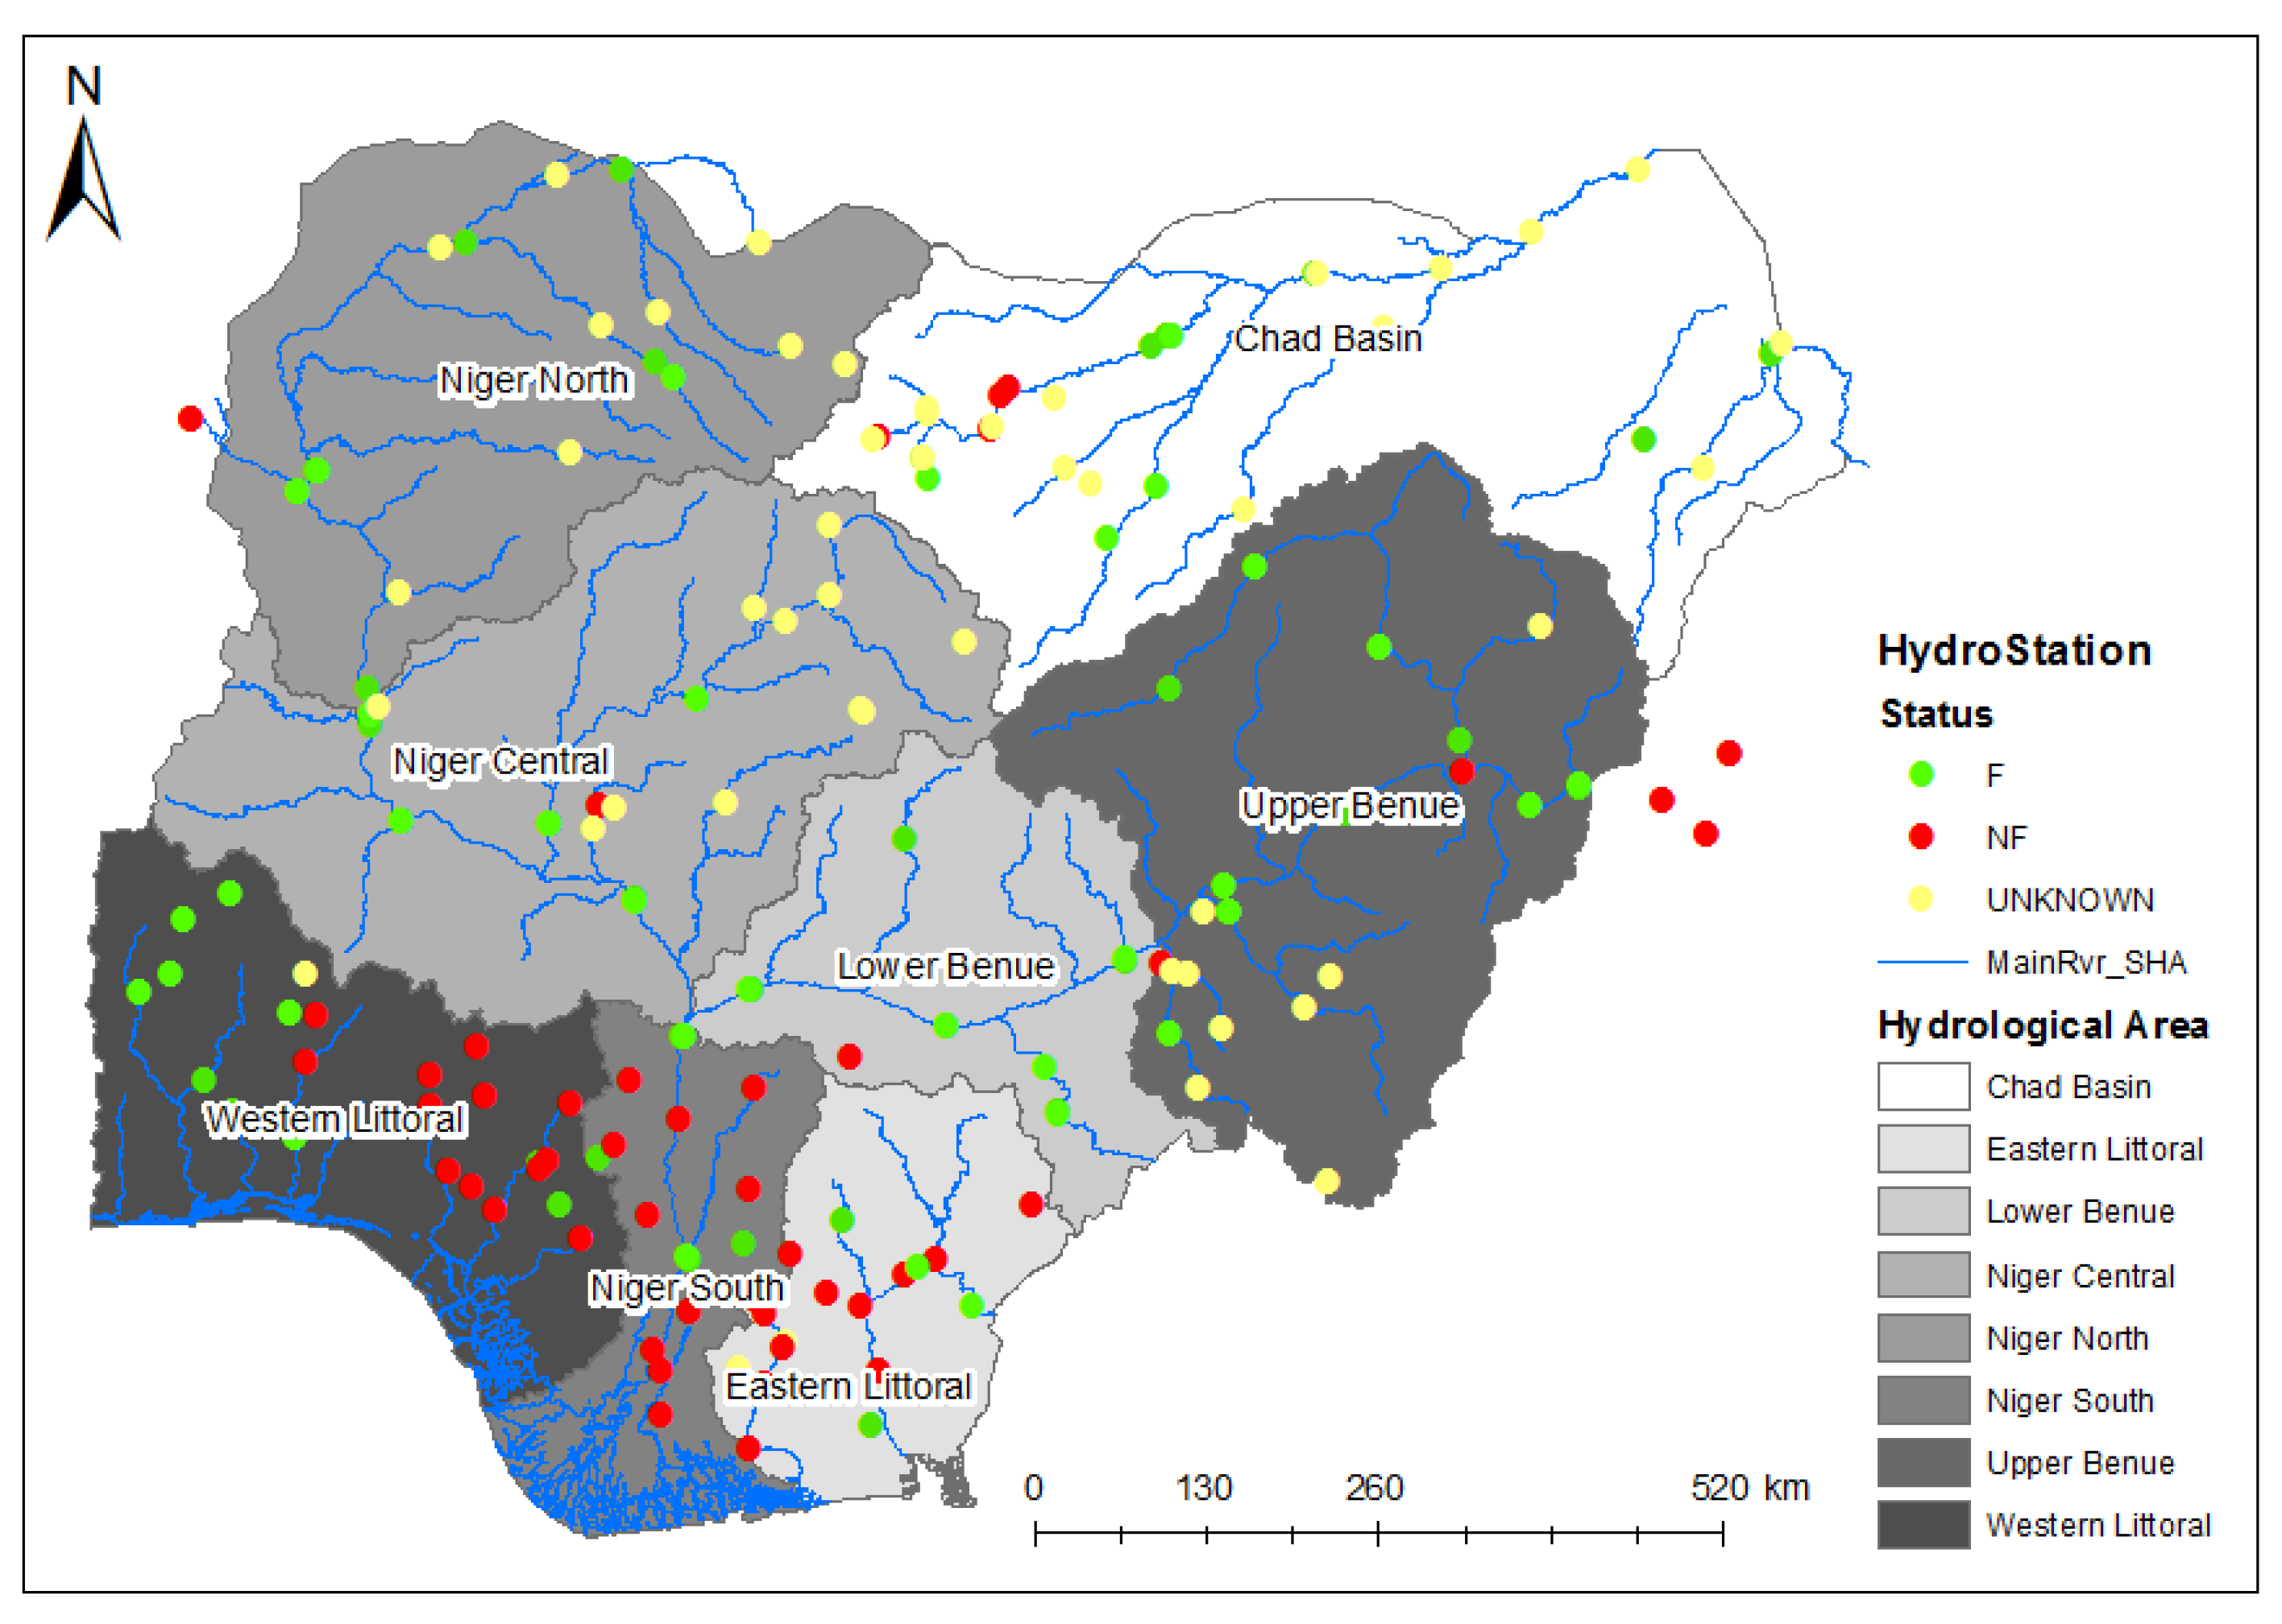
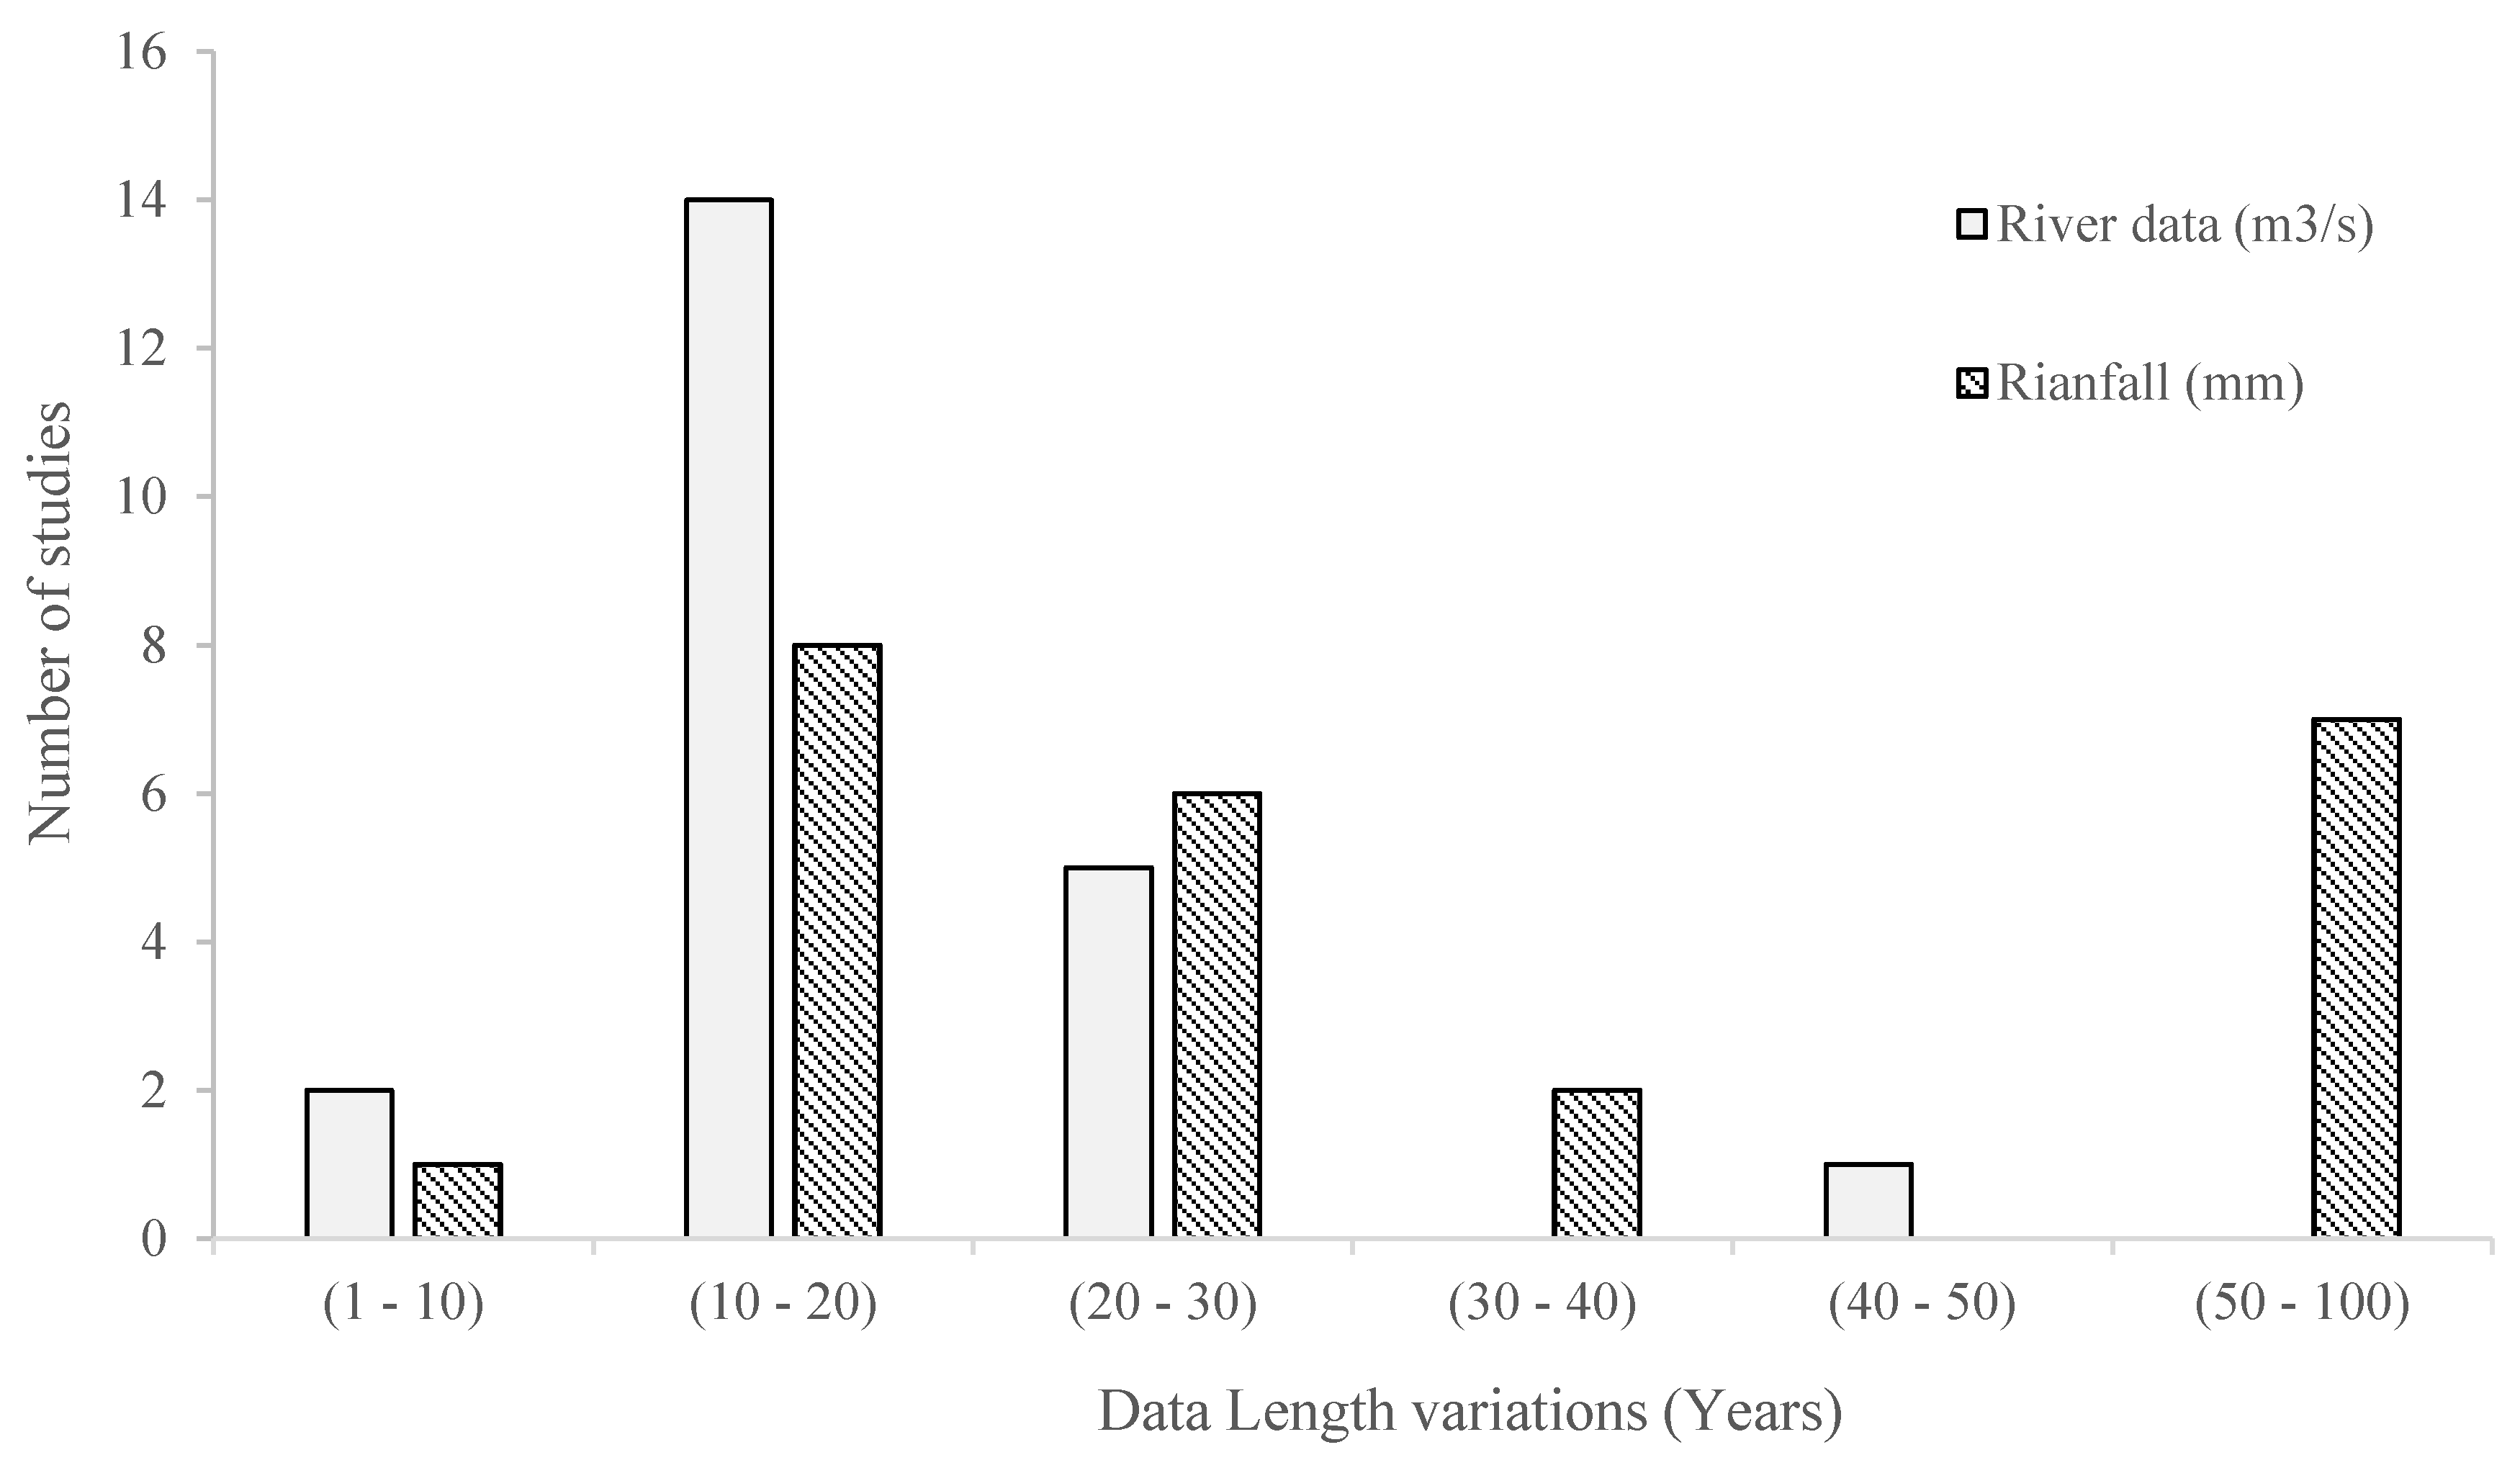
4.1. Hydro-Meteorological Data Limitations in Nigeria

Similarly to many developing countries, the lack of hydro-meteorological data in Nigeria has been widely documented, and the consequences for flood management decisions have been identified [175]. Currently, existing hydrological and meteorological gauge distributions do not meet the recommendations of the World Meteorological Organization [176] and Ngene [177], i.e., 237 hydrological stations exist out of 384 recommended and 291 meteorological stations (rain gauges) exist of 970 recommended. In addition, several of the established stations have been reported to be inactive, decommissioned or discontinued (Figure 5), contributing to the data sparsity in the country [175,176].
Lack of financial support, technical deficiency, poor institutional capacity and obsolete infrastructure have been identified as factors responsible for data shortages in Nigeria [178,179,180]. Poor hydrological data management systems and lack of standards have led to unreliable and inconsistent data (Maxwell, [24]; Ononiwu, [181]. Furthermore, Maxwell [24] and Olayinka [182] argued that even when data is available, custodians store data in paper formats, thus reducing transferability, applicability and long-term/sustainable data provision.
Hydro-meteorological data are essentially applied in estimating expected flood magnitudes based on past trends, and a restricted length of available historical data contributes to the uncertainty in the derived flood estimates [183,184] . Extended historical data result in more accurate estimates and vice versa [13]. For the purposes of the present study, in 2016 a search was conducted within the peer-reviewed literature on the Google scholar (https://scholar.google.com) database spanning the years 2000 to 2016. A combination of the search terms and keywords including “hydrology”, “flood modelling”, “hydrodynamic modelling”, “flood frequency analysis”, “vulnerability assessment”, “rainfall frequency analysis”, “flood mapping”, and “GIS and Remote sensing of flooding”, were used, with the results further refined with keywords such as “Nigeria”, to represent the country of interest. A meta-analysis of these river and rainfall estimation studies (Figure 6) shows that rainfall data sets are generally longer in duration than those of streamflow data. The majority of hydrological modelling studies are based on historical data of lengths ranging from 10 to 20 years, hence there is a need for the adoption of an approach that leverages data from multiple gauging stations to reduce flood estimate uncertainty and improve flood management decision making [185].

4.2. Remote Sensing for Flood Management in Nigeria

RS has been applied in seven sub-categories of flood management in Nigeria: (i) vulnerability assessment: integrating socio-economic and biophysical factors to ascertain a regions’ coping capacity in relation to flood exposure [186,187,188]; (ii) flood frequency analysis: estimating expected flood magnitudes by fitting historic flood time series to a suitable probability distribution or combining hydrological data from regions of physiographic similarity [179,189,190]; (iii) rainfall intensity-duration-Frequency: applying rainfall data to gives an idea on return period of rainfall intensity which can be expected for a defined period [191,192]; (iv) hydrodynamic modelling: once flood estimates are determined, the outcomes are routed in 1/2 dimensional models in combination with terrain data to derive flood hazard information such as inundation extent, depths and /or velocity [193]; (v) flood risk mapping: other than hydraulically modelling flood hazard, flood depths and inundation extent for a particular point in time can be directly determined using satellite images and digital elevations models [21,167]; (vi) floodplain encroachment analysis: the increasing development of industries and settlements within the floodplain increases exposure and vulnerability [188,194]; (vii) rainfall varibility assemment: understanding the degree to which the amount of rainfall across an area varies through time and space [195,196]; and RS and GIS approaches are used to monitor floodplain encroachment, to ensure adherence to, and enforcement of flood management policies [197,198]; and (viii) water resource management: adoption of GIS and RS for sustainable water resource management [199]. Figure 7 shows the flood studies application areas in Nigeria, revealing vulnerability mapping, flood frequency assessment and risk assessment are the main areas of interest.

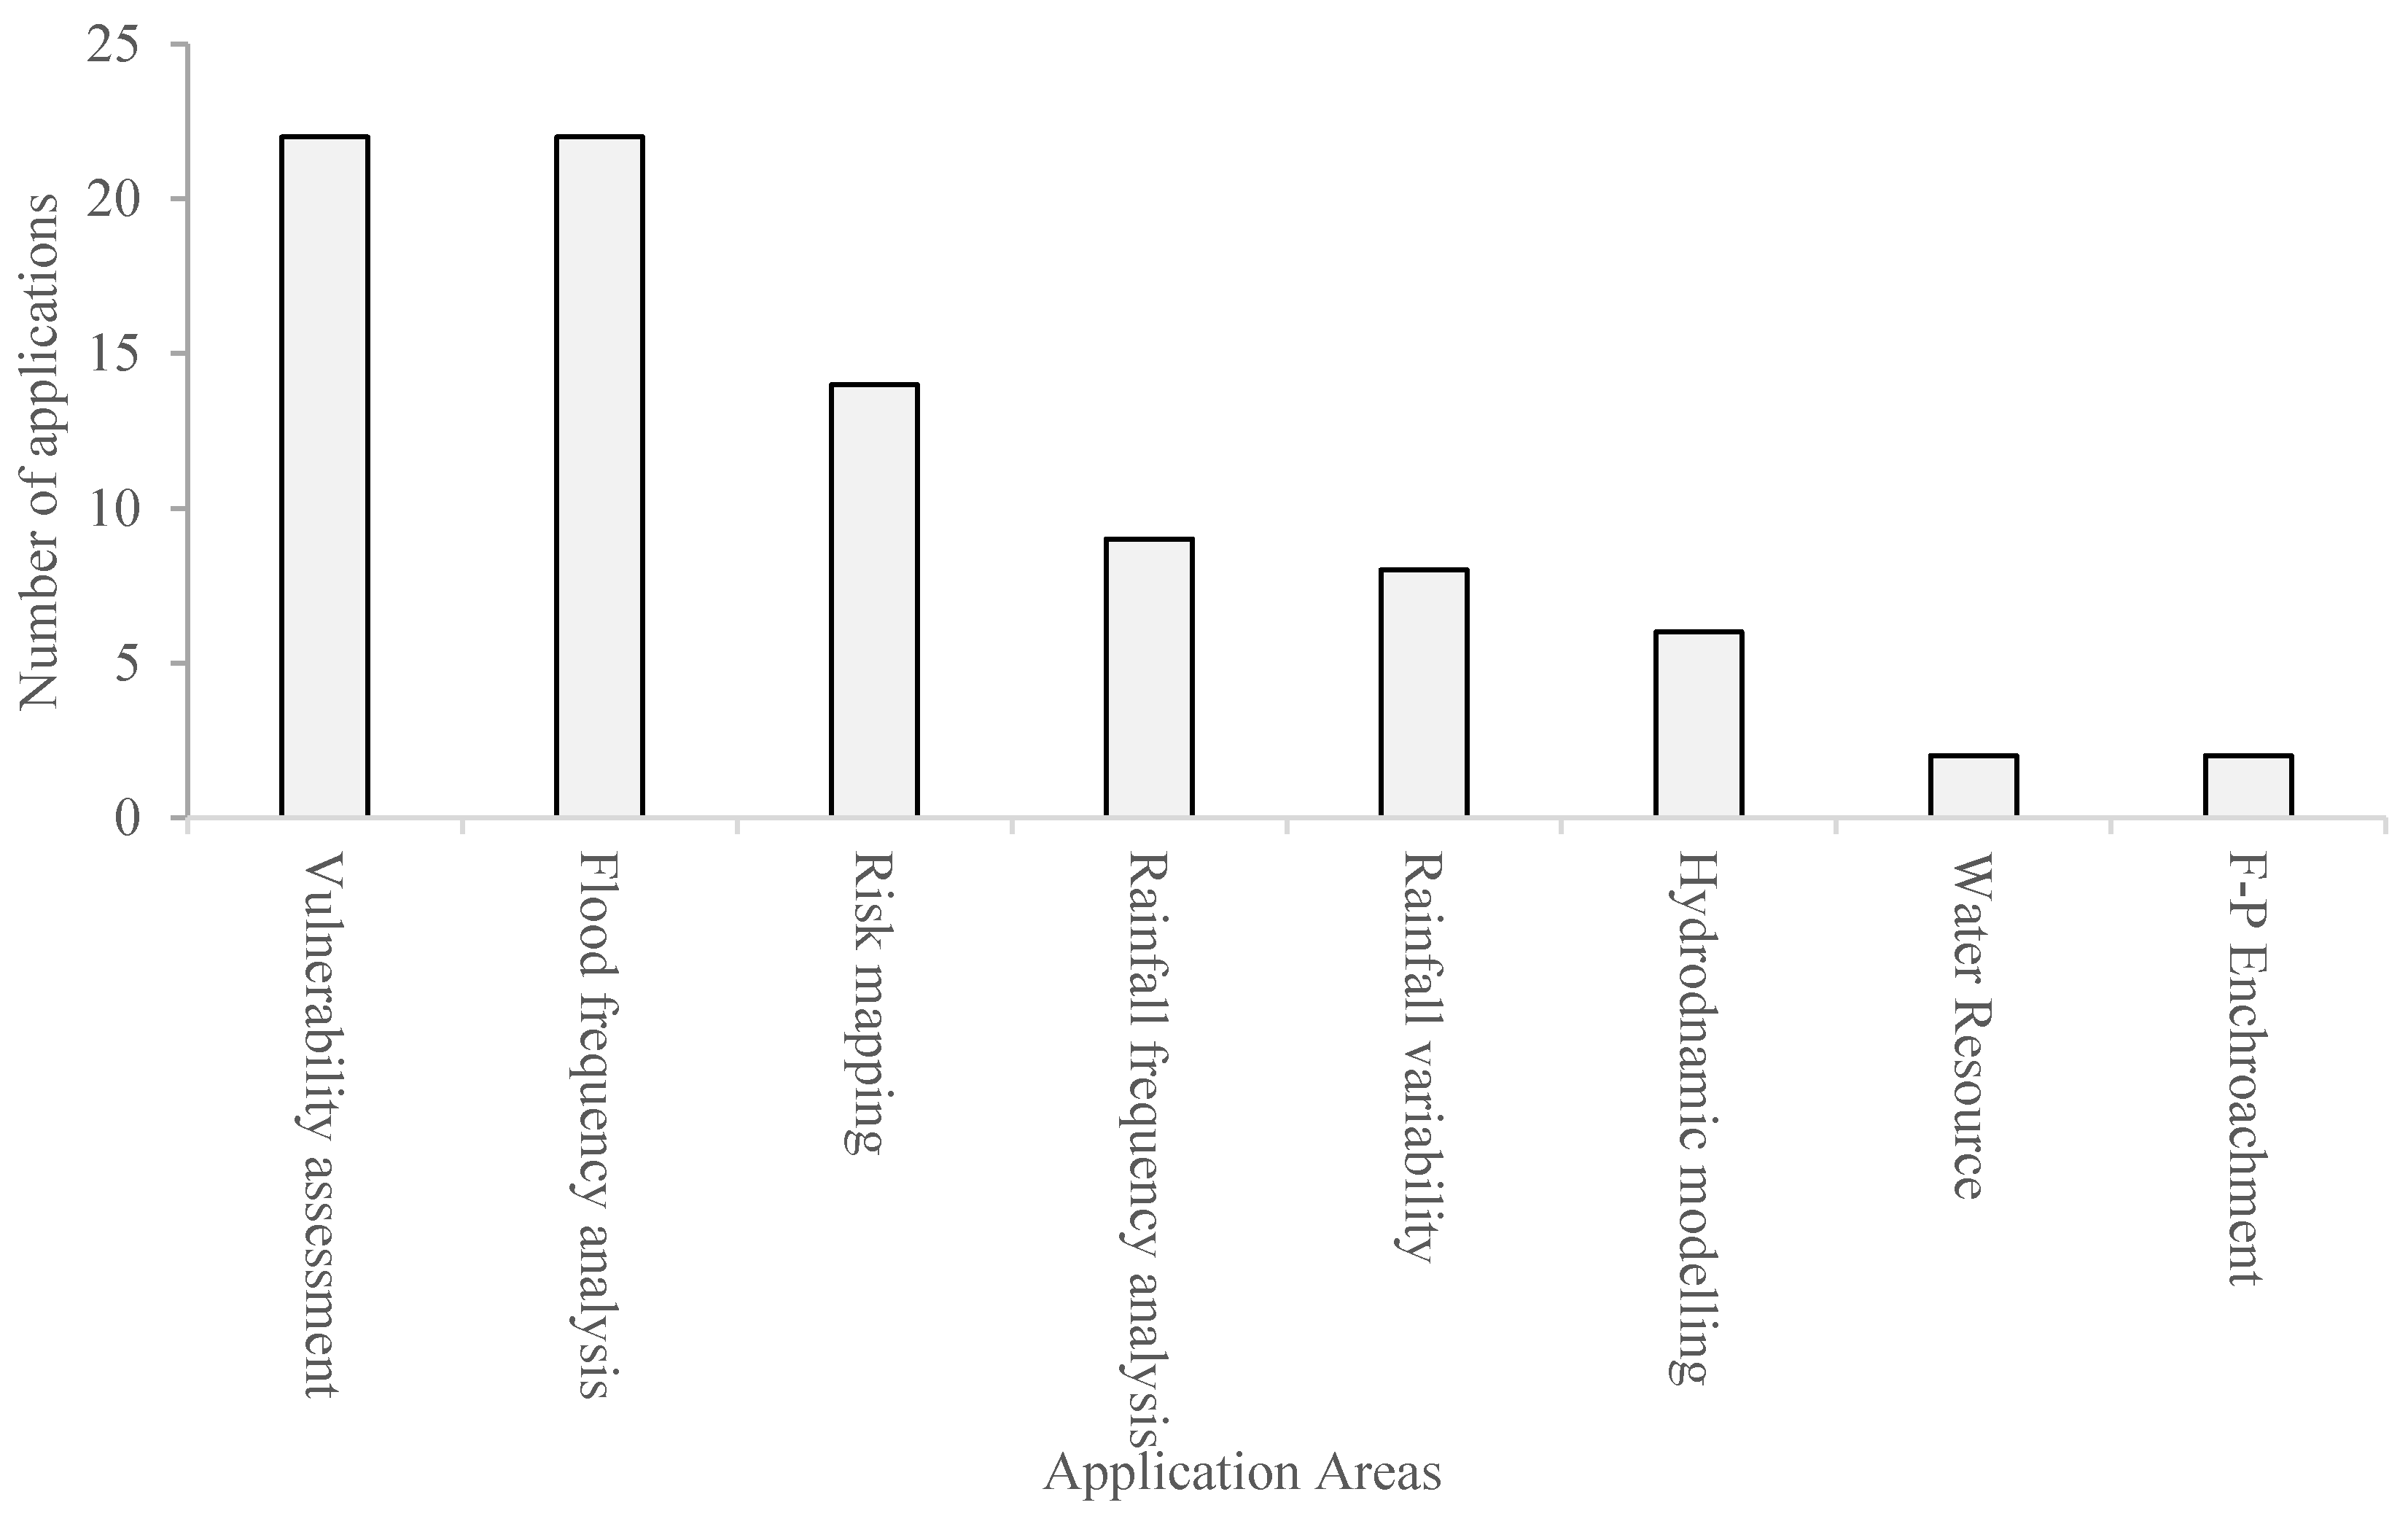
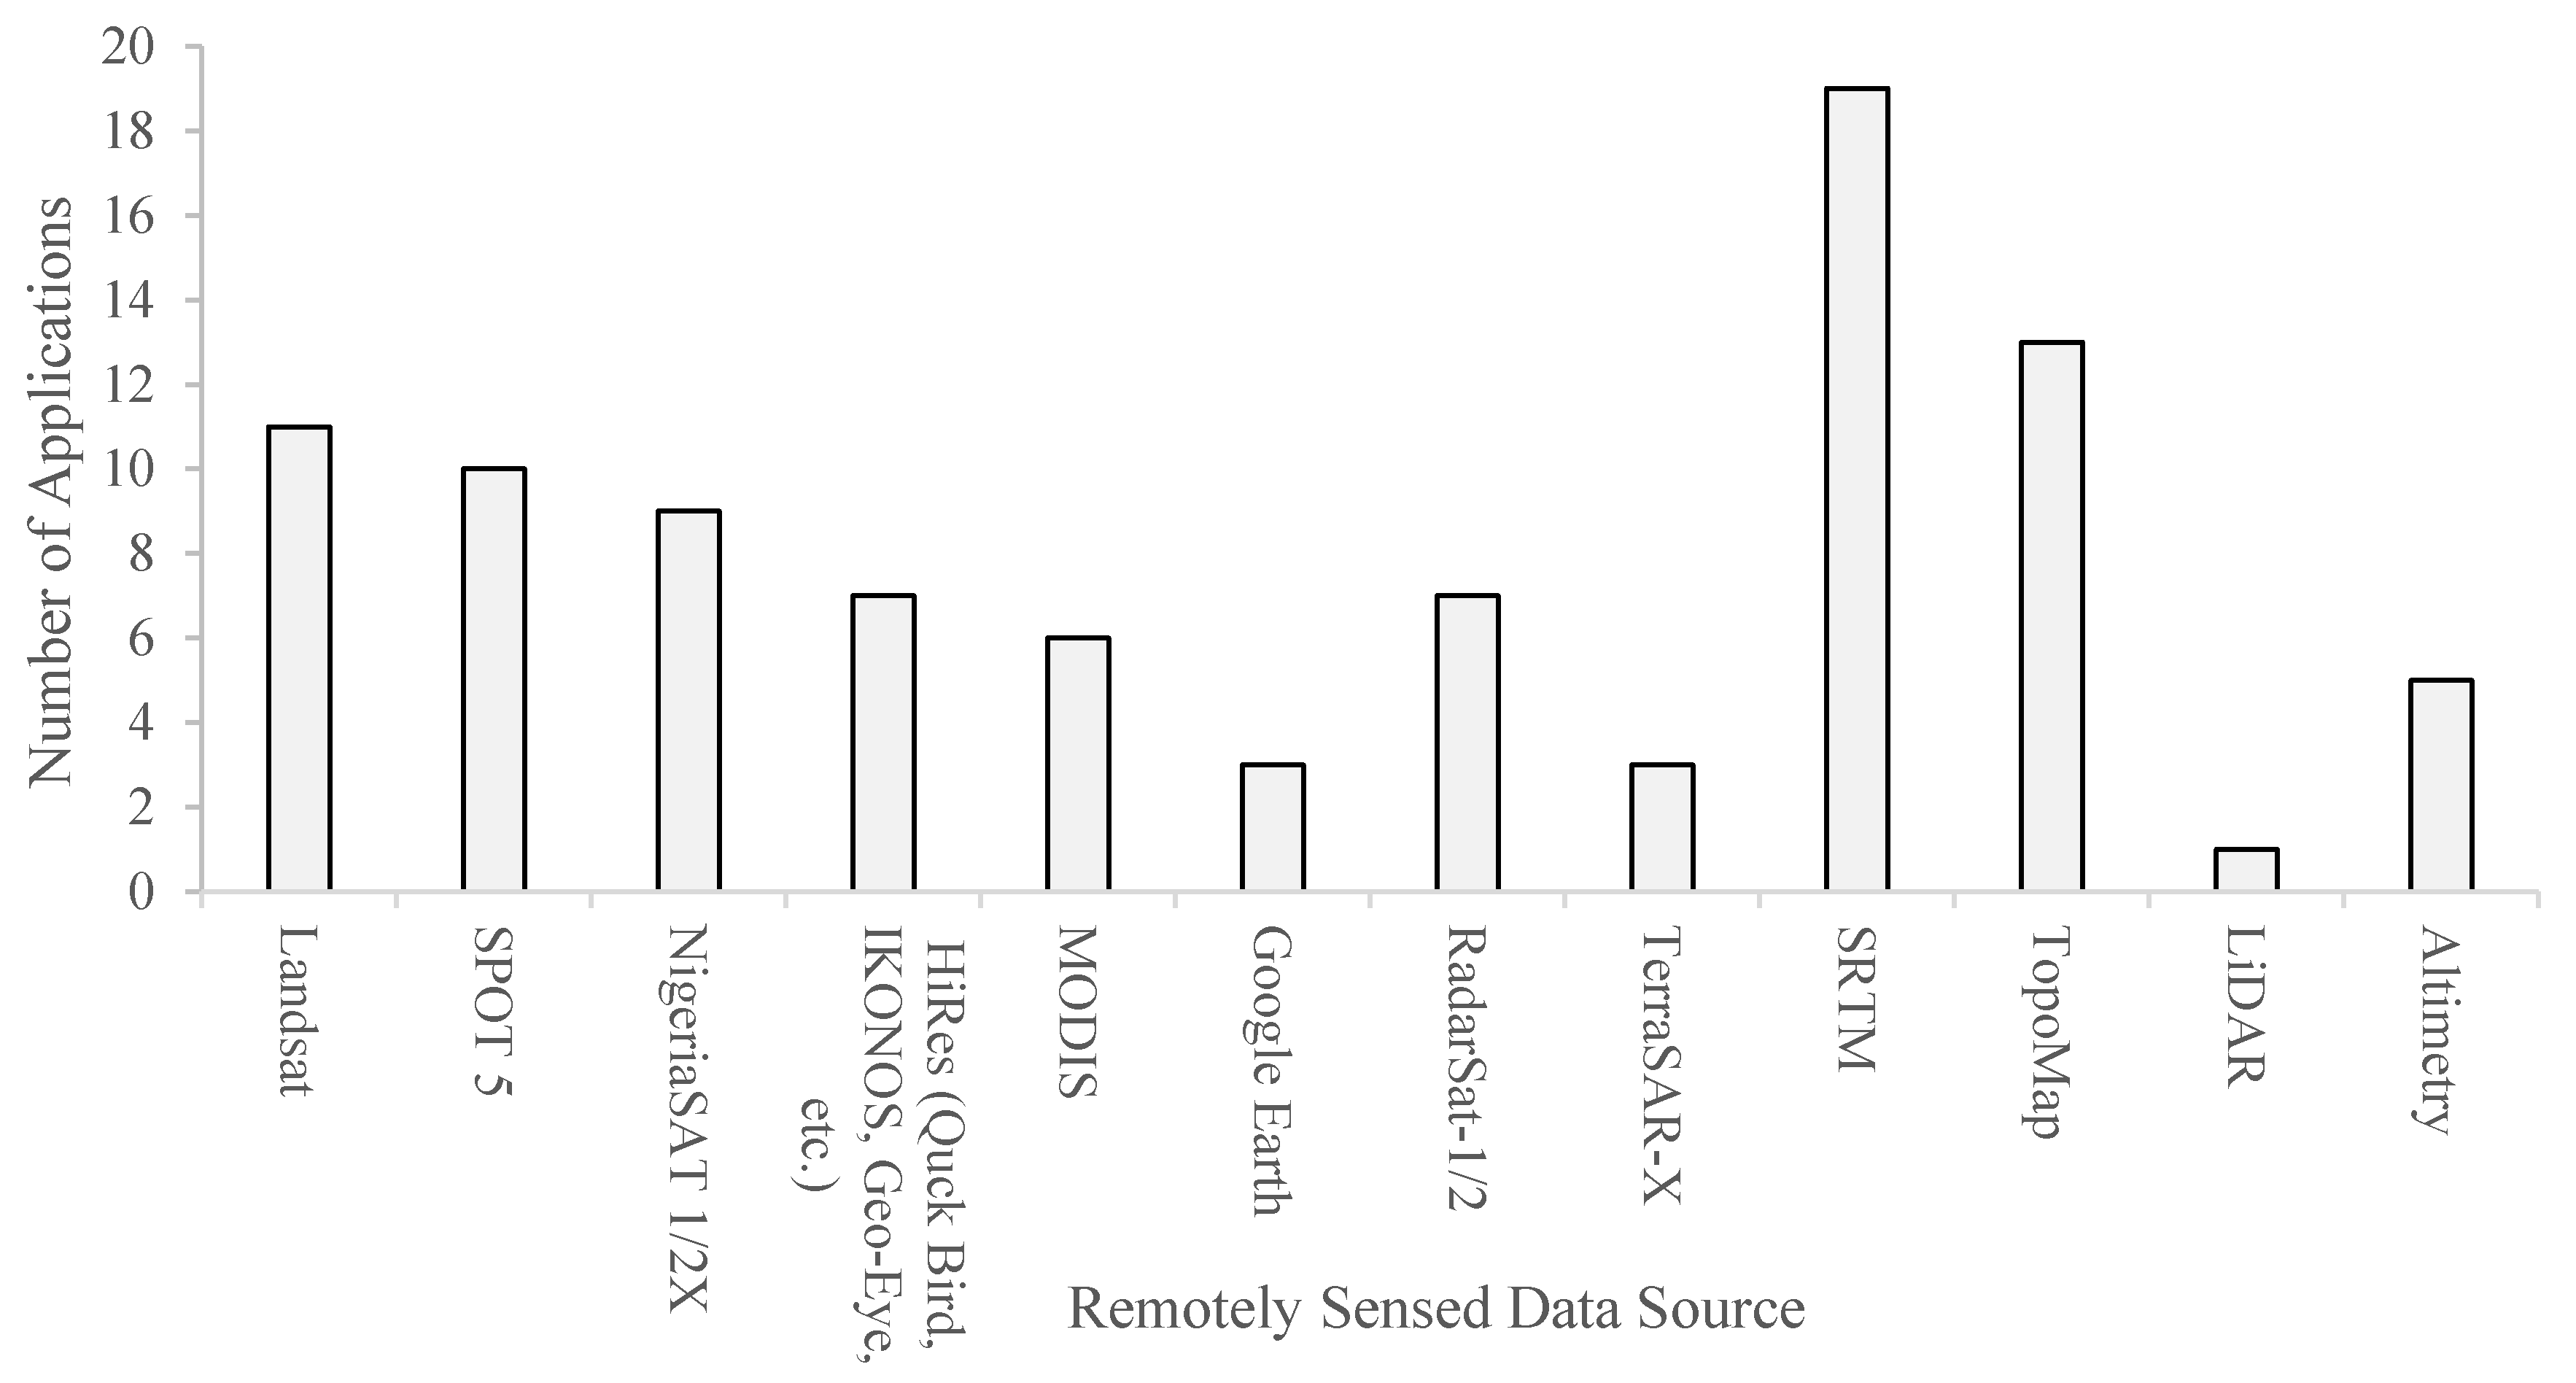
4.3. Applications of Open-Access Remotely Sensed Data for Flood Management in Nigeria

Meta-analysis of 100 flood research journal articles focused on Nigeria acquired from google scholar using the methodology described in Section 4.1. shows the range of data applied in flood management studies (Figure 8) and reveals high reliance on Landsat and SRTM. Various data sets provide contrasting levels of accuracy and uncertainty [110], therefore high spatial resolution data such as LiDAR and SAR are mostly recommended for flood modelling processes due to the advantages of LiDAR’s ability to delineate complex terrains with high levels of details and the effective water surface discrimination capacity of SAR imagery [150,200].
Figure 9 further demonstrates the difference between flood extent extracted from radar and optical images, revealing the optical satellite image’s deficiency in delineating flood extent, especially in cloudy regions of tropical environments. The TerraSAR-X (radar) flood map was derived using a histogram thresholding approach by the Disaster Charter consortium, while the MODIS (optical) flood extent was automatically generated from the Modis Water Product (MWP) through a collaborative effort between NASA and Dartmouth Flood Observatory, University of Colorado, USA, using an algorithm that uses a ratio of MODIS 250-m Bands 1 and 2, and a threshold on Band 7 to provisionally identify pixels as water [201].

5. Open-Access Remotely Sensed Data in Transboundary Flood Management

Managing flood occurrences in a sovereign nation is challenging enough; the complexity is increased when floods transcend borders. Floods sometimes originate from one country, and if hydraulically connected to another country within a single catchment area, this travels downstream [202] creating transboundary flooding. Poor management of excess water releases from dams triggered by variable rainfall and other anthropogenic factors have been identified as some of the leading causes of transboundary flooding [203,204,205,206]. In such situations, efforts need to be coordinated between flood origin and destination countries to ensure effective flood management. Approximately 2286 transboundary river basins exist globally (Figure 10), encircling 42% of the world’s population within a 62 million Km2 area, and they are responsible for approximately 50% of global river discharge [207,208].
Coordinating the activities of individual countries within a transboundary water resource management organisation is particularly challenging due to the diverse interests, policies and activities of riparian countries [209,210,211], thereby prompting the need for a shift to RS approaches that enables independent data collection by riparian countries without violating administrative protocols [212]. Several RS studies have been undertaken in this regard, using radar altimetry, optical/radar imagery and hydrodynamic models to curb the data limitation challenges associated with poorly coordinated transboundary flood management efforts.
Mallinis et al. [213] delineated the transboundary Evros river (Bulgaria/Turkey) flood extent and damage caused by upstream dam water release using ENVISAT ASAR and post-flood multi-temporal LANDSAT TM images. The effect of varying flood magnitudes released from upstream Ivaylovgrad dam (Bulgaria) on the connecting Ardas River (Greece) was modelled using HEC-HMS, using in situ gauge measurements and digital terrain data [214], thereby enabling effective downstream flood planning and management. Mati et al. [215] investigated changing land use/cover impact on the Mara transboundary river (Kenya/Tanzania) hydrological regime, using remotely sensed data (Landsat MSS, TM/ETM, and SRTM), ground-collected land use/cover data, meteorological and streamflow data integrated within the Geospatial Streamflow Model (GeoSFM). Biancamaria et al. [135] established an empirical relation between downstream altimetry (TOPEX/Poseidon) water levels (India) and upstream in situ measurements (Bangladesh) for forecasting purpose along the Ganges and Brahmaputra transboundary river. Hossain et al. [216] in the same study area applied a forecasting rating curve approach combined with HEC-RAS hydraulic model to forecast downstream water levels using upstream JASON-2 altimetry, in situ water levels and rating curve. Seyler et al. [217] further demonstrated the value of altimetry and SAR satellite missions in transboundary water resource management, as remote locations along the Beni-Madeira river in the Amazon were monitored using ENVISAT altimetry and JERS-1 radar images.
The case studies discussed above illustrate the wide range of applications of open-access remotely sensed data in transboundary flood management, with radar altimetry, DEM, SAR, optical images, as well as hydrodynamic models and empirical formulas identified as alternatives for improved transboundary monitoring. These approached minimise or avoid the bureaucratic challenges of ground-based monitoring across country boundaries. In this way, RS makes it possible to forecast expected floods, estimate flood exceedance probabilities and monitor how changes in riparian land use/cover can affect downstream hydrology, across different countries.

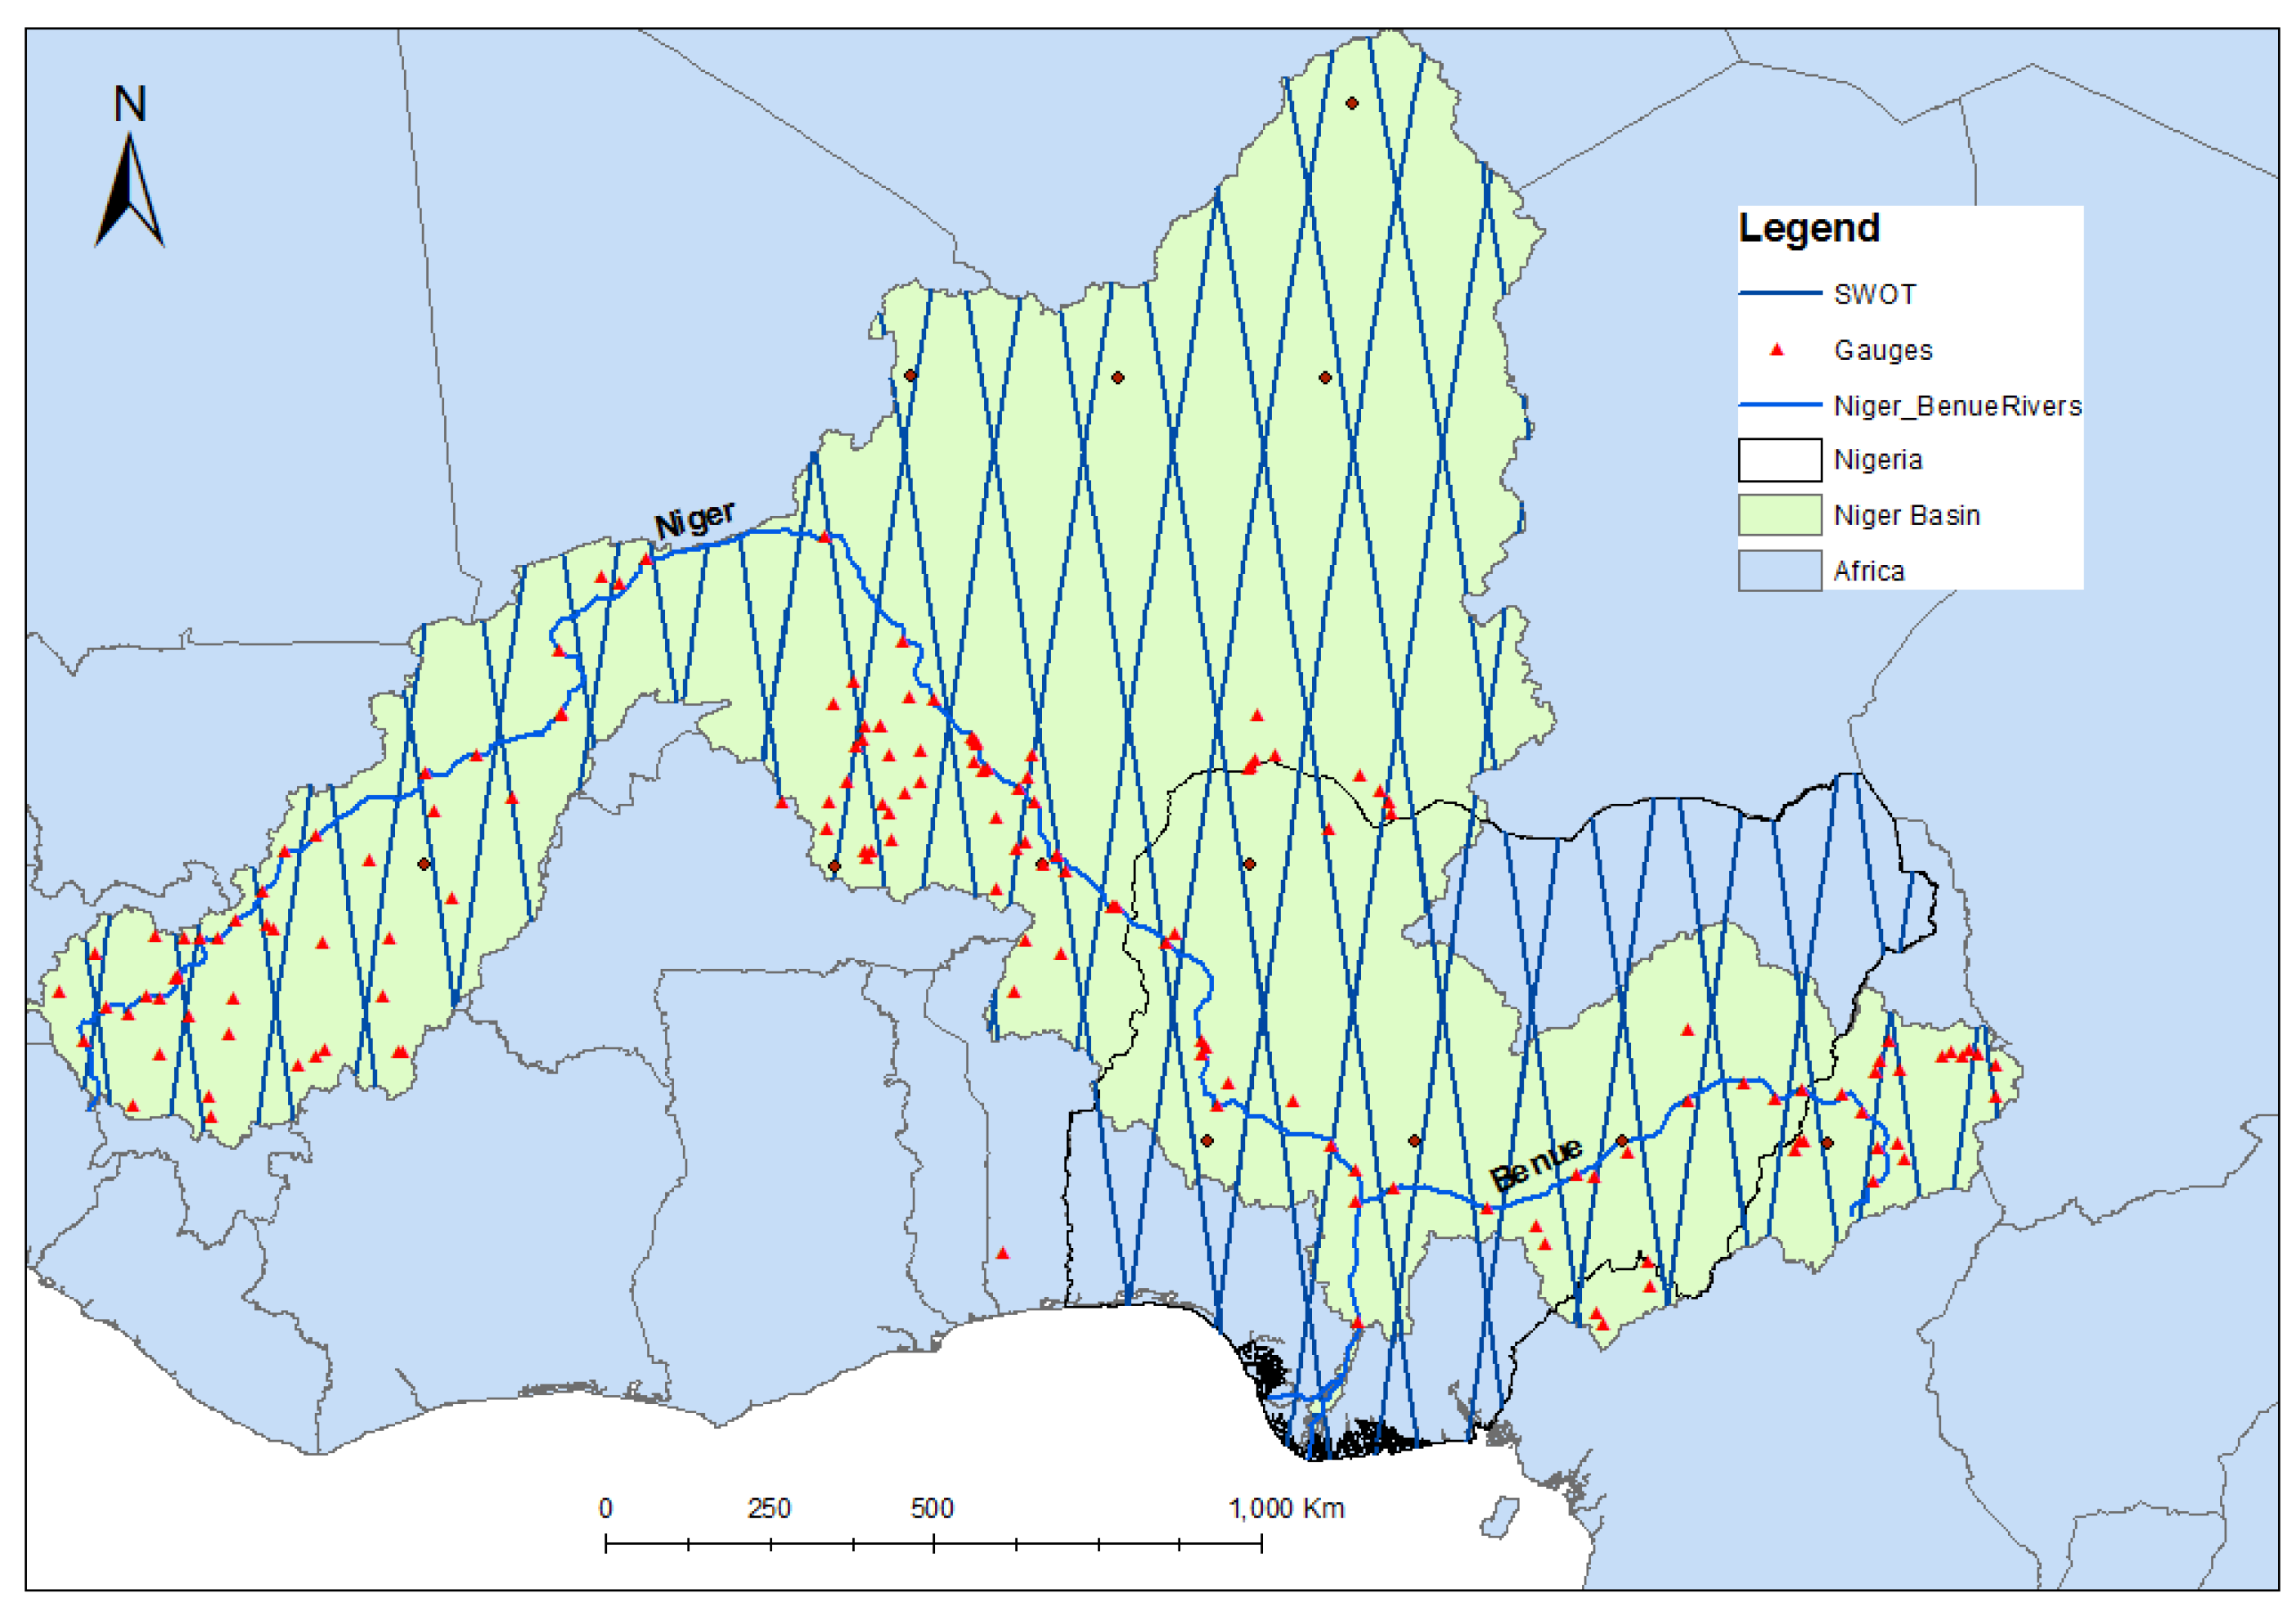
5.1. Transboundary Flood Management Nigeria (Niger River Basin)

The unprecedented flood event of 2012 in Nigeria was attributed to (i) excess water release from dams within and outside Nigeria due to intense precipitation; (ii) inadequate risk communication; and (iii) poor stakeholder collaboration [218,219]. One instance of a lack of transboundary stakeholder collaboration is evident in Nigeria’s inability to uphold part of the 1980 agreement with Cameroon, to establish Dasin Hausa dam to buffer the effect of Lagdo dam built by Cameroon along the Benue River [220,221].
The Niger transboundary river basin (Figure 11) encompasses 12 countries including Senegal, Guinea, Côte D’Ivoire Mauritania, Mali, Burkina Faso, Algeria, Niger, Benin, Nigeria, Cameroon and Chad. The basin hosts a human population of 93,617,850 within a 2,156,000 km2 area [165,208].
Figure 11 also highlights the transboundary nature Niger River Basin, the constituent countries and characteristics. The Niger basin is largely regulated by dams, housing approximately 69 dams [222] conceived mostly as national and local projects, but these have transboundary impacts downstream [223]. To effectively manage transboundary water resource and impact on riparian countries, the Niger River Commission (NRC) was established in 1963, now the Niger Basin Authority (NBA) as reconstituted in 1980, to promote co-operation between member states and ensure sustainable Integrated Water Resource Management [224]. The Niger basin is presently controlled by several post-colonial agreements presented in Table 7.
Despite these multiple cooperative frameworks, several factors have hindered effective transboundary water resource management in the Niger Basin: (i) poor and fragmented data collection, (ii) lack of coordination between riparian countries and organizations, (iii) poor communication and knowledge of legal and institutional frameworks, (iv) Funding deficiency, (v) lack of clear objectives, (vi) lingual differences, and (vii) technical limitations [226,227,228]. Grossmann, [229] also lamented the deplorable state of the 65 gauging stations set-up by the NBA, through the “Hydro Niger Project” initiative. Nevertheless, the emergence of the ongoing Niger-HYCOS (Hydrological Cycle Observing System) program is expected to improve river monitoring networks in the Niger river basin [178,230]. Nigeria, however, further faces specific challenges such as poor engagement, varied risk perception, lack of interest, poor communication and commitment within the Nigeria Basin Authority, which hinder effective coordination and integrated water resource implementation [178].

5.2. Application of Open-Access Remotely Sensed Data in Transboundary Flood Management, Nigeria

As transboundary floods become more prevalent and intense due to increased storms triggered by climate change and anthropogenic factors [231], sufficient hydrological data is required for planning interventions for flood impact mitigation. In addition, considering that transboundary flood management institutions are facing recurring challenges that limit their functionality and sufficient data acquisition, open-access remotely sensed data provide a low-cost and viable alternative to enable transboundary flood monitoring and management without disrupting any sovereign nation’s autonomy. Open-access satellite imagery such as Landsat and MODIS have been widely applied to delineate flood extent across transboundary river basins, aiding flood impact quantification needed for prompt response, as well as risk assessment and evaluation [213,232]. Radar altimetry, on the other hand, can be applied independently or with satellite images to support planning, forecasting and flood management in riparian countries [216,217].
In Nigeria, Tarpanelli et al. [63] explored the potential of integrating MODIS imagery and ENVISAT radar altimetry to predict and forecast discharge along the Niger-Benue river. The discharge was derived from daily (MOD09GQ) and 8-day (MOD09Q1) 250 m resolution MODIS TERRA and AQUA Image pixels (BAND 2-NIR), by establishing an empirical relationship between water-free land pixels during peak flood, permanent water pixels within the river and known discharge values derived from in situ measurements. Pandey and Amarnath [51] applied a combined forecasting rating curve approach developed by Hossain et al. [216] and hydraulic (HEC-RAS) model techniques to estimate discharge from ENVISAT, Jason-2 and AltiKa altimetry virtual station water levels along the Niger and Benue rivers, resulting in NS and R2 values of 0.7 and 0.97 respectively.
In other closely related studies in the region, Salami and Nnadi, [233] monitored Kainji Lake along the Niger river, using TOPEX/Poseidon and ENVISAT altimetry, revealing stronger correlation between altimetry and in situ measurements in the wet season (R2 = 0.93) than the dry season (R2 = 0.77), and RMSE varying from 0.50 m to 0.83 m for TOPEX/Poseidon and ENVISAT, respectively. Sparavigna [234] studied the water level variability of Nasser, Tana, Chad and Kainji lakes using TOPEX/POSEIDON and Jason-1 altimetry. Cretaux et al. [235] combined TOPEX/Poseidon (T/P) and ENVISAT altimetry with 8-day MODIS near-infrared band images to monitor water level variations and inundation along the Niger inner delta, Lake Tchad and Ganaga river delta.
The high correlation between altimetry and in situ water levels during the wet season along the Niger river [233] suggests that altimetry can potentially be used in flood monitoring and management in Nigeria and the Niger Basin. The varying accuracies of different altimetry missions imply that altimetry data must be applied cautiously as earlier emphasized in Section 3.1.4, due to residual uncertainty. With current radar altimetry tracks, such as Jason-2 (Figure 12), Sentinel 3A/B (Figure 13) and future SWOT (Figure 14) passing across the Niger basin, the potential for long-term acquisition of spaceborne altimetry data for flood management is considerable.

6. Providers of Data for Flood Emergency Management

Other than open-access remotely sensed data, in some instances, commercial, regional and national satellite organisations collaboratively deliver high-resolution images and services to support flood response and mitigation efforts. This section discusses some of the available satellite data providers/consortia and disaster support services, as well as case study applications in Nigeria and hydraulically connected rivers in the Niger River Basin in West Africa.

6.1. International Charter “Space and Major Disasters”

The international charter “space and major disasters” (ICSMD) was established by ESA and the Centre National d’Etudes Spatiales (CNES) following the UNISPACE III conference held in Vienna in 1999 and was co-signed by the Canadian Space Agency (CSA) in 2001 [236]. The objective of the Charter is to provide data to enable critical decision making during environmental or technological disasters such as flooding, oil spills, fires, earthquake, volcanoes, hurricanes, landslides and ice hazards, thereby minimizing the impact of disasters on people and infrastructures [237]. Between 2001 and 2012, several satellite agencies joined the consortium: Japan Aerospace Exploration Agency (JAXA), Indian Space Research Organisation (ISRO), United States Geological Survey (USGS), National Oceanic and Atmospheric Administration (NOAA), Argentinean National Commission on Space Activities (CONAE), Exploration of Meteorological Satellite (EUMETSAT), German Space Agency (DLR), National Institute for Space Research (INPE) of Brazil, China National Space Administration, Disaster Monitoring Constellation International Imaging (DMCii) and Korean Aerospace Research Institute (KARI). This expansion of the consortium enhanced the Charter’s ability to deliver prompt high resolution optical and SAR images when disasters strike [238]. Between 2000 and 2016 the ICSMD charter has been activated 500 times by more than 110 countries for various disasters [239]. An overview of disaster Charter activations for flood monitoring and management is presented in Figure 15, with South America, Africa and Asia showing the highest number of activations.
The Nigerian satellite NigeriaSat-1 joined the ICSMD in 2003, followed by NigeriaSat-2 and NigeriaSat-X in August 2011 [237] (all optical Sensors), to further enhance the Charter’s capacity to deliver on its mission. Through this involvement, Nigeria provides its optical sensor images for disaster-related activities at no cost, as well as data for research purposes, and sells imagery to commercial ventures at a variable cost depending on the area of coverage. Some instances of the Nigerian Satellite activation for disaster response include Peloponnese forest fires, Greece 2007 (call 175); Beichuan Landslide and Debris flow, China 2008 (call 204); Java earthquake, Indonesia (call 269); Balkh, Kunduz, Takhar and Baghlan areas flooding, Afghanistan (call 255).
In Nigeria, the charter is usually activated by the National Emergency Management Agency’s (NEMA) designated project manager. The activation follows five steps: (i) requisition by authorised person, (ii) requestor identification and request verification by a 24/7 operator, (iii) request analysis and satellite tasking for data capture, (iv) data acquisition and delivery, and (v) support in data processing throughout the emergency [240]. In Nigeria, activation of the disaster charter is relatively new, and only 6 activations have been made between 2010 and 2012 to monitor flooding events at Sokoto in 2010 (calls: 324 and 326), Ibadan in 2011 (call: 370), and in 2012 at Adamawa, Kogi and Bayelsa, (calls: 407, 415 and 416) [240]. Some of the images collected over the course of the activations in Nigeria include RADARSAT-2, SPOT-5, TerraSAR-X/TanDEM-X, Landsat ETM, KOMPSAT, ENVISAT, UK-DMC, and NIGERIASAT [219,239]. One of the lingering challenges of the Disaster Charter images is the strict license and copyright policies that prohibit re-use and distribution of the raw data [240], thus limiting the prospect of further data analysis and application in research. Nevertheless, finished products are available via the Charter Activations webpage (https://www.disasterscharter.org/web/guest/activations/charter-activations) as high-resolution maps for download, and can be digitized for use in flood mapping processes.

6.2. International Water Management Institute Emergency Response Products for Water Disasters

This is a space-based information and rapid mapping platform for emergency response aimed at providing support for disaster management in Africa and Asia. The platform was developed from a collaboration amongst the International Water Management Institute (IWMI), Asia-Pacific Regional Space Agency Forum (APRSAF), ESA, the United Nations Office for Outer Space Affairs (UNOOSA) and the United Nations Platform for Space-based Information for Disaster Management and Emergency Response (UN-SPIDER). This platform channels an impacted country’s data request to the Disaster Charter, and also directly processes and analysis open-access images (i.e., Landsat, Sentinel 1, MODIS and Global Precipitation Measurement) to deliver products needed for decision making during a disaster [241]. So far, the platform has supported five countries including Sri Lanka, Myanmar, India, Bangladesh, and Nigeria [242]. In addition, a total of 37 activations to support flood information have deployed open-access satellites, as well as commercial TerraSAR-X, Radarsat-2, RISAT-1, ALOS-2 PALSAR-2, and JAXA-2 ALOS-2 satellite images [242].
Between 27th September–4th October 2015 this platform delivered 10 Sentinel-1 flood maps to support flood management efforts along the Niger and Benue rivers in Nigeria. This emanated from a collaborative effort amongst IWMI, ESA, Federal Ministry of Agriculture and Rural Development (FMARD) and Consortium of International Agricultural Research (CGIAR).

6.3. Copernicus Emergency Management Service

The European Union Copernicus Emergency Management Service (EMS) provide rapid (i.e., hours or days) free satellite-based maps to inform decision-making before, during and after natural and man-made disasters [243]. Although European nations are considered a priority for support provision, other countries can activate the Copernicus EMS. Thus far, between 1 April 2012 and 19 August 2016, the Copernicus EMS has been activated 175 times (Table 8), with flooding identified as the highest cause of activation (40%), resulting in 68% of the delineation maps generated.
The Copernicus EMS has not been activated for Nigeria yet, but has been activated three times (EMSR018, EMSR019 and EMSR235) in Niger (Niamey) in 2012, Cameroon (Lake Maga, Garoua-Benue River) in 2012 and Niger (Dosso, Maradi, Niamey, and Tillaberi) in 2017. These are riparian countries within the transboundary Niger River Basin, and this could prove useful for transboundary flood monitoring in Nigeria. Authorised users France|Centre Operationnel de Gestion Interministeriel de Crises (C.O.G.I.C) and EC Services|DG JRC activated the Copernicus EMS for the countries mentioned above, providing Radarsat-2, Rapid Eye, COSMO-SkyMed, and SPOT-5 satellite images flood extent maps.

6.4. Digital Globe Open Data Program

More recently, Digital Globe, a commercial satellite company launched the Open Data Program (ODP) initiative to provide high-resolution satellite imagery to support recovery from large-scale natural disasters such as flooding [244]. ODP provides pre and post-disaster images, including support via the Tomnod (http://www.tomnod.com) and Humanitarian OpenStreetMap Team (HOT, https://hotosm.org) crowdsourcing platforms for damage assessment [245]. So far, the ODP has been activated six times by Haiti, Nepal, Mexico, Ecuador, Caribbean/United States, and Madagascar, to manage disasters including earthquakes, hurricanes, and cyclones. The prospects for this initiative is substantial, as high-resolution imagery can considerably improve the detail of risk and damage assessment in remote locations. Though the ODP is yet to be deployed in Nigeria, it was deployed for post-disaster assessment of the 2017 Sierra Leone mudslide. This was the first application case on the African continent, followed with the mapping of Ebola response the Democratic Republic of Congo in 2018.

7. Synthesis

Flood disasters are becoming more frequent, intense and destructive, owing to climate change and anthropogenic factors. Managing floods requires effective decision making based on up-to-date and reliable hydrological information [8]. Typically, data needed for flood management include river discharge, water levels, terrain and land use/cover characteristics, and these are traditionally collected through the establishment of ground monitoring stations and field observations/surveys [246]. In situations where floods transcend administrative boundaries due to natural catchment delineations or river network connectivity, transboundary corporations are often set up to enable collaborative data collection, co-operation, risk communication, information sharing and planning to effectively manage flood impact in riparian countries [202,211]. However, in many developing regions both independent and transboundary data collection systems for flood management are flawed by organisational, technical, institutional, infrastructural and financial challenges that limit their effectiveness [178,202,205,247,248].
The potential of RS in supporting flood monitoring, planning and management are considerable, as it enables data collection in remote, inaccessible and data sparse locations [40]. Open-access remotely sensed data is particularly important for improving flood management in developing countries where the ground monitoring network is limited and the cost of obtaining commercial satellite data is prohibitive [29,135]. Datasets such as radar altimetry, DEMs, optical and radar imagery can be applied independently, in combination with in situ measurements or integrated into hydrodynamic models in order to reduce the uncertainty in flood estimation for ungauged river basins [39,69,89,98]. Furthermore, in the case of transboundary floods, RS allows data collection in an upstream country where the flood originates by a downstream impacted country without the need for bureaucratic authorization [59,203].
It is worth noting that the different freely available remotely sensed datasets provide varying levels of accuracy, depending on multiple factors. Altimetry mission accuracies depend on the satellite ground footprint, virtual station location, river width, tributaries discharging into the main river and satellite sensor properties [29]. The inability of C and X-band radar to penetrate vegetation canopies, and backscattering from rooftops and water surfaces, can result in over-estimation of elevation [40,66,249]. Optical imagery applications can be hampered by atmospheric conditions and spatial resolution [250], while one of the core deficiencies of radar images is the inconsistency in delineating floods in urban and forested areas [251].
Despite these deficiencies, the role of remotely sensed data in flood management is significant, especially in developing regions, as it allows for the quantification of hydrological parameters at previously undetected locations once a retrieval technique has been proven at a location where in-situ data is available [63]. With RS technology continuously advancing and more data becoming freely available, the reliance on ground observation data is expected to decline. Additionally, with commercial satellite companies such as Digital Globe and other satellite consortia making high-resolution images available for disaster management [237,244] will improve high-resolution flood modelling and mapping in data-sparse regions. Despite the advantages of RS, the role of ground-based data collection cannot be disregarded and must take priority or be applied in combination with remotely sensed data for enhanced flood mapping [42,105].
Planning for flood management usually requires flood magnitude estimates at varying return periods based on historical flood data. In many developing regions, such data are typically short time series if gauging stations are newly established or discontinued and contain gaps (missing data points) caused by equipment malfunction or poor data collation practices [24,182]. Altimetry can aid historical river data reconstruction where newly established and old discontinued gauging stations exist in proximity to virtual stations [252]. Nevertheless, the low revisit time of altimetry satellites [43] can result in a failure to capture peak floods needed for flood magnitude estimation [104,105] and in other instances, altimetry data is unavailable at certain locations [58]. Therefore, it is essential that the use of altimetry data is evaluated against other approaches, such as statistical techniques for infilling missing hydrological data, to ascertain the influence of both approaches on flood frequency estimates, and to understand when these individual approaches can be used.
Although this review focused on fluvial flood modelling and mapping, it is important to note that precipitation data (in situ and satellite) could also be vital in this process and has been widely applied, especially in data-sparse regions for flood modelling and hazard mapping [253,254,255,256]. However, this topic is beyond the scope of this review.

8. Conclusions

The potential of remotely sensed data such as altimetry, DEMs, optical and radar images has been highlighted in this review, with the unique merits, demerits and achievable applications being highlighted. In very remote locations of developing regions, data sparsity is so widespread that uniform data is seldom available for a whole catchment area, owing to inadequate and declining hydrological monitoring network [257]. Therefore, an integrated approach that enables the combination of all available open-access remotely sensed data is recommended in such locations, leveraging the merits of individual datasets to improve all phases of flood mapping processes, i.e., hydrological modelling, hydrodynamic modelling and inundation mapping.
Data from consortia of providers have proven to be useful in flood risk assessment when a flood occurs, where pre and post-flood images are provided for comparative analysis [219]. However, strict license and copyright policies prohibit re-use and distribution of the data [240], and this can hamper the important shift in focus from flood recovery to planning which is now imperative. Nevertheless, 3 end products (i.e., high-resolution inundation maps) are available via the Charter Activations web page and can be applied to support flood-modelling processes to inform flood planning decisions.
The deficiencies of open-source remotely sensed data for flood modelling and mapping can be quite pronounced in various landscapes, irrespective of the sensor type [157,258]. The private sector has played a vital role in advancing geo-informatics in developing regions [259], investing heavily in high-resolution satellite and airborne data needed for operational and disaster management purposes [21,260]. A significant opportunity now exists for integrating commercially sourced remotely sensed data with open-access and crowd-sourced data [261,262,263] to improve flood modelling and mapping in data sparse regions.

Author Contributions

I.T.E.-w. and G.A.B. conceived and designed this review study, while I.T.E.-w. undertook the review and drafted the Manuscript, and G.A.B. reviewed the Manuscript and provided suggestions as well as contributions to improve the Manuscript.

Funding

This research was funded by the Niger Delta Development Commission (NDDC), Nigeria, grant number NDDC/DEHSS/2013PGFS/BY/5.

Acknowledgments

This review is a product of part of Ekeu-wei Iguniwari Thomas’s PhD research at Lancaster University, United Kingdom, funded by NDDC, Nigeria. The authors acknowledge the input of the three anonymous reviewers who provide valuable feedback that improved this review article enormously.

Conflicts of Interest

The Authors declare no conflict of interest

References

  1. Plate, E. Flood risk and flood management. J. Hydrol. 2002, 267, 2–11. [Google Scholar] [CrossRef]
  2. Merwade, V.; Olivera, F.; Arabi, M.; Edleman, S. Uncertainty in flood inundation mapping: Current issues and future directions. J. Hydrol. Eng. 2008, 13, 608–620. [Google Scholar] [CrossRef]
  3. Moel, H.; Jongman, B.; Kreibich, H.; Merz, B.; Penning-Rowsell, E.; Ward, P. Flood risk assessments at different spatial scales. Mitig. Adapt. Strateg. Glob. Chang. 2015, 20, 865–890. [Google Scholar] [CrossRef] [Green Version]
  4. Klijn, F.; Samuels, P.; Van Os, A. Towards flood risk management in the EU: State of affairs with examples from various European countries. Int. J. River Basin Manag. 2008, 6, 307–321. [Google Scholar] [CrossRef]
  5. Büchele, B.; Kreibich, H.; Kron, A.; Thieken, A.; Ihringer, J.; Oberle, P.; Merz, B.; Nestmann, F. Flood- risk mapping: Contributions towards an enhanced assessment of extreme events and associated risks. Nat. Hazards Earth Syst. Sci. 2006, 6, 485–503. [Google Scholar] [CrossRef]
  6. Ologunorisa, T.E. An assessment of flood vulnerability zones in the Niger Delta, Nigeria. Int. J. Environ. Stud. 2004, 61, 31–38. [Google Scholar] [CrossRef]
  7. Valdes, H.M. Living with Risk: A Global Review of Disaster Reduction Initiatives; United Nations Publications: New York, NY, USA, 2004; Volume 1. [Google Scholar]
  8. Els, Z. Data Availability and Requirements for Flood Hazard Mapping. Master’s Thesis, Natural Sciences at Stellenbosch University, Stellenbosch, South Africa, 2013. [Google Scholar]
  9. Federal Ministry of Environment. Technical Guidelines on Soil Erosion, Flood and Coastal Zone Management; Federal Ministry of Environment: Abuja, Nigeria, 2005.
  10. Aerts, J.C.J.H.; Alphen, J.V.; Moel, H.D. Flood maps in Europe-methods, availability and use. Nat. Hazards Earth Syst. Sci. 2009, 9, 289–301. [Google Scholar]
  11. Martini, F.; Loat, R. Handbook on Good Practices for Flood Mapping in Europe; EXCIMAP: Brussels, Belgium, 2007. [Google Scholar] [CrossRef]
  12. Awokola, O.; Martins, O. Regional Flood Frequency Analysis of Osun Drainage Basin, South-Western Nigeria. Niger. J. Sci. 2001, 35, 37–44. [Google Scholar]
  13. Kjeldsen, T.R.; Smithers, J.C.; Schulze, R.E. Regional flood frequency analysis in the KwaZulu- Natal province, South Africa, using the index- flood method. J. Hydrol. 2002, 255, 194–211. [Google Scholar] [CrossRef]
  14. Leclerc, M.; Ouarda, T.B.M.J. Non- stationary regional flood frequency analysis at ungauged sites. J. Hydrol. 2007, 343, 254–265. [Google Scholar] [CrossRef]
  15. Ahn, J.; Cho, W.; Kim, T.; Shin, H.; Heo, J.-H. Flood frequency analysis for the annual peak flows simulated by an event-based rainfall-runoff model in an urban drainage basin. Water 2014, 6, 3841–3863. [Google Scholar] [CrossRef]
  16. Sarhadi, A.; Soltani, S.; Modarres, R. Probabilistic flood inundation mapping of ungauged rivers: Linking GIS techniques and frequency analysis. J. Hydrol. 2012, 458–459, 68–86. [Google Scholar] [CrossRef]
  17. Di Baldassarre, G.; Schumann, G.; Bates, P.; Freer, J.; Beven, K. Flood- plain mapping: A critical discussion of deterministic and probabilistic approaches. Hydrol. Sci. J. 2010, 55, 364–376. [Google Scholar] [CrossRef]
  18. Muncaster, S.; Warwick, B.; McCowab, A. Design flood estimation in small catchments using two dimensional hydraulic modelling—A case study. In Hydrology and Water Resource Symposium; TAS: Launceston, Australia, 2006; pp. 104–109. [Google Scholar]
  19. Neal, J.; Schumann, G.; Fewtrell, T.; Budimir, M.; Bates, P.; Mason, D. Evaluating a new LISFLOOD-FP formulation with data from the summer 2007 floods in Tewkesbury, UK. J. Flood Risk Manag. 2011, 4, 88–95. [Google Scholar] [CrossRef]
  20. Taubenböck, H.; Wurm, M.; Netzband, M.; Zwenzner, H.; Roth, A.; Rahman, A.; Dech, S. Flood risks in urbanized areas—Multi- sensoral approaches using remotely sensed data for risk assessment. Nat. Hazards Earth Syst. Sci. 2011, 11, 431–444. [Google Scholar] [CrossRef] [Green Version]
  21. Eyers, R.; Obowu, C.; Lasisi, B. Niger Delta Flooding: Monitoring, Forecasting & Emergency Response Support from SPDC. In Proceedings of the FIG Working Week, Environment and Sustainability, Abuja, Nigeria, 6–10 May 2013. [Google Scholar]
  22. Nigeria Hydrological Services Agency; Ankle Foot Orthosis. Nigerian Hydrological Service Agency, 2014 Annual Flood Outlook (AFO); NIHSA: Sioux City, IA, USA, 2014. [Google Scholar]
  23. Olayinka, D.N.; Nwilo, P.C.; Emmanuel, A. From Catchment to Reach: Predictive Modelling of Floods in Nigeria. In Proceedings of the FIG Working Week, Environment for Sustainability, Abuja, Nigeria, 6–10 May 2013. [Google Scholar]
  24. Maxwell, O. Hydrological Data Banking for Sustainable Development in Nigeria: An Overview. Aceh Int. J. Sci. Technol. 2013, 2, 59–62. [Google Scholar] [CrossRef] [Green Version]
  25. Ekeu-wei, I.T. Evaluation of Hydrological Data Collection Challenges and Flood Estimation Uncertainties in Nigeria. Environ. Nat. Resour. Res. 2018, 8, 44–54. [Google Scholar] [CrossRef]
  26. Sivapalan, M. Prediction in ungauged basins: A grand challenge for theoretical hydrology. Hydrol. Process. 2003, 17, 3163–3170. [Google Scholar] [CrossRef]
  27. Sivapalan, M.; Takeuchi, K.; Franks, S.W.; Gupta, V.K.; Karambiri, H.; Lakshmi, V.; Liang, X.; McDonnell, J.J.; Mendiondo, E.M.; Connell, P.E.; et al. IAHS Decade on Predictions in Ungauged Basins (PUB), 2003–2012: Shaping an exciting future for the hydrological sciences. Hydrol. Sci. J. 2003, 48, 857–880. [Google Scholar] [CrossRef] [Green Version]
  28. Hrachowitz, M.; Savenije, H.; Blöschl, G.; McDonnell, J.; Sivapalan, M.; Pomeroy, J.; Arheimer, B.; Blume, T.; Clark, M.; Ehret, U. A decade of Predictions in Ungauged Basins (PUB)—A review. Hydrol. Sci. J. 2013, 58, 1198–1255. [Google Scholar] [CrossRef]
  29. Yan, K.; Di Baldassarre, G.; Solomatine, D.P.; Schumann, G.J.P. A review of low-cost space-borne data for flood modelling: Topography, flood extent and water level. Hydrol. Process. 2015, 29, 3368–3387. [Google Scholar] [CrossRef]
  30. Schumann, G.; Bates, P.D.; Horritt, M.S.; Matgen, P.; Pappenberger, F. Progress in integration of remote sensing- derived flood extent and stage data and hydraulic models. Rev. Geophys. 2009, 47. [Google Scholar] [CrossRef]
  31. Mason, D.C.; Schumann, G.; Bates, P. Data utilization in flood inundation modelling. Flood Risk Sci. Manag. 2011. [Google Scholar] [CrossRef]
  32. Dano Umar, L.; Abdul-Nasir, M.; Ahmad Mustafa, H.; Imtiaz Ahmed, C.; Soheil, S.; Abdul-Lateef, B.; Haruna Ahmed, A. Geographic Information System and Remote Sensing Applications in Flood Hazards Management: A Review. Res. J. Appl. Sci. Eng. Technol. 2011, 3, 933–947. [Google Scholar]
  33. Maswood, M.; Hossain, F. Advancing river modelling in ungauged basins using satellite remote sensing: The case of the Ganges- Brahmaputra- Meghna basin. Int. J. River Basin Manag. 2016, 14, 103–117. [Google Scholar] [CrossRef]
  34. Alsdorf, D.E.; Rodríguez, E.; Lettenmaier, D.P. Measuring surface water from space. Rev. Geophys. 2007, 45, RG2002. [Google Scholar] [CrossRef]
  35. Koblinsky, C.; Clarke, R.; Brenner, A.; Frey, H. Measurement of river level variations with satellite altimetry. Water Resour. Res. 1993, 29, 1839–1848. [Google Scholar] [CrossRef]
  36. Da Silva, J.S.; Calmant, S.; Seyler, F.; Rotunno Filho, O.C.; Cochonneau, G.; Mansur, W.J. Water levels in the Amazon basin derived from the ERS 2 and ENVISAT radar altimetry missions. Remote Sens. Environ. 2010, 114, 2160–2181. [Google Scholar] [CrossRef]
  37. Sulistioadi, Y.B.; Tseng, K.H.; Shum, C.K.; Hidayat, H.; Sumaryono, M.; Suhardiman, A.; Setiawan, F.; Sunarso, S. Satellite radar altimetry for monitoring small rivers and lakes in Indonesia. Hydrol. Earth Syst. Sci. 2015, 19, 341–359. [Google Scholar] [CrossRef]
  38. Belaud, G.; Cassan, L.; Bader, J.; Bercher, N.; Feret, T. Calibration of a propagation model in large river using satellite altimetry. In Proceedings of the 6th International Symposium on Environmental Hydraulics, Athens, Greece, 23–25 June 2010; pp. 23–25. [Google Scholar]
  39. Birkinshaw, S.J.; Moore, P.; Kilsby, C.G.; Donnell, G.M.; Hardy, A.J.; Berry, P.A.M. Daily discharge estimation at ungauged river sites using remote sensing. Hydrol. Process. 2014, 28, 1043–1054. [Google Scholar] [CrossRef]
  40. Musa, Z.; Popescu, I.; Mynett, A. A review of applications of satellite SAR, optical, altimetry and DEM data for surface water modelling, mapping and parameter estimation. Hydrol. Earth Syst. Sci. Discuss. 2015, 12, 4857–4878. [Google Scholar] [CrossRef]
  41. Crétaux, J.-F.; Jelinski, W.; Calmant, S.; Kouraev, A.; Vuglinski, V.; Bergé-Nguyen, M.; Gennero, M.-C.; Nino, F.; Del Rio, R.A.; Cazenave, A. SOLS: A lake database to monitor in the Near Real Time water level and storage variations from remote sensing data. Adv. Space Res. 2011, 47, 1497–1507. [Google Scholar] [CrossRef]
  42. Sun, W.; Ishidaira, H.; Bastola, S. Calibration of hydrological models in ungauged basins based on satellite radar altimetry observations of river water level. Hydrol. Process. 2012, 26, 3524–3537. [Google Scholar] [CrossRef]
  43. O’Loughlin, F.E.; Neal, J.; Yamazaki, D.; Bates, P.D. ICESat-derived inland water surface spot heights. Water Resour. Res. 2016, 52, 3276–3284. [Google Scholar] [CrossRef] [Green Version]
  44. Birkett, C.M. The contribution of TOPEX/POSEIDON to the global monitoring of climatically sensitive lakes. J. Geophys. Res. Oceans 1995, 100, 25179–25204. [Google Scholar] [CrossRef]
  45. Birkett, C.M.; Mertes, L.A.K.; Dunne, T.; Costa, M.H.; Jasinski, M.J. Surface water dynamics in the Amazon Basin: Application of satellite radar altimetry. J. Geophys. Res. Atmos. 2002, 107, LBA 26-1–LBA 26-21. [Google Scholar] [CrossRef]
  46. Frappart, F.; Calmant, S.; Cauhopé, M.; Seyler, F.; Cazenave, A. Preliminary results of ENVISAT RA- 2- derived water levels validation over the Amazon basin. Remote Sens. Environ. 2006, 100, 252–264. [Google Scholar] [CrossRef] [Green Version]
  47. Birkinshaw, S.J.; Donnell, G.M.; Moore, P.; Kilsby, C.G.; Fowler, H.J.; Berry, P.A.M. Using satellite altimetry data to augment flow estimation techniques on the Mekong River. Hydrol. Process. 2010, 24, 3811–3825. [Google Scholar] [CrossRef]
  48. Ponte, R.M.; Wunsch, C.; Stammer, D. Spatial mapping of time-variable errors in Jason-1 and TOPEX/Poseidon sea surface height measurements. J. Atmos. Ocean. Technol. 2007, 24, 1078–1085. [Google Scholar] [CrossRef]
  49. Chelton, D.B.; Ries, J.C.; Haines, B.J.; Fu, L.-L.; Callahan, P.S. Satellite altimetry. Int. Geophys. 2001, 69, 1–2. [Google Scholar]
  50. Tourian, M.J.; Tarpanelli, A.; Elmi, O.; Qin, T.; Brocca, L.; Moramarco, T.; Sneeuw, N. Spatiotemporal densification of river water level time series by multimission satellite altimetry. Water Resour. Res. 2016, 52, 1140–1159. [Google Scholar] [CrossRef]
  51. Pandey, R.; Amarnath, G. The potential of satellite radar altimetry in flood forecasting: Concept and implementation for the Niger-Benue river basin. Proc. IAHS 2015, 370, 223–227. [Google Scholar] [CrossRef]
  52. Jarihani, A.A.; Callow, J.N.; McVicar, T.R.; Van Niel, T.G.; Larsen, J.R. Satellite- derived Digital Elevation Model (DEM) selection, preparation and correction for hydrodynamic modelling in large, low- gradient and data- sparse catchments. J. Hydrol. 2015, 524, 489–506. [Google Scholar] [CrossRef]
  53. Urban, T.J.; Schutz, B.E.; Neuenschwander, A.L. A survey of ICESat coastal altimetry applications: Continental Coast, Open Ocean Island, and Inland River. Terr. Atmos. Ocean. Sci. 2008, 19, 1–19. [Google Scholar] [CrossRef]
  54. Schneider, R.; Godiksen, P.N.; Villadsen, H.; Madsen, H.; Bauer-Gottwein, P. Application of CryoSat- 2 altimetry data for river analysis and modelling. Hydrol. Earth Syst. Sci. Discuss. 2016, 19, 1–19. [Google Scholar] [CrossRef]
  55. Schwatke, C.; Dettmering, D.; Börgens, E.; Bosch, W. Potential of SARAL/AltiKa for Inland Water Applications. Mar. Geodesy 2015, 38, 626–643. [Google Scholar] [CrossRef]
  56. European Space Agency. Altimetry Instrument Payload. Available online: https://sentinel.esa.int/web/sentinel/missions/sentinel-3/instrument-payload/altimetry (accessed on 26 April 2016).
  57. Fu, L.-L.; Alsdorf, D.; Rodriguez, E.; Morrow, R.; Mognard, N.; Lambin, J.; Vaze, P.; Lafon, T. The SWOT (Surface Water and Ocean Topography) mission: Spaceborne radar interferometry for oceanographic and hydrological applications. Proc. Ocean. Obs. 2009, 9, 21–25. [Google Scholar]
  58. Papa, F.; Durand, F.; Rossow, W.B.; Rahman, A.; Bala, S.K. Satellite altimeter- derived monthly discharge of the Ganga- Brahmaputra River and its seasonal to interannual variations from 1993 to 2008. J. Geophys. Res. Oceans 2010, 115. [Google Scholar] [CrossRef]
  59. Sridevi, T.; Sharma, R.; Mehra, P.; Prasad, K.V.S.R. Estimating discharge from the Godavari River using ENVISAT, Jason- 2, and SARAL/AltiKa radar altimeters. Remote Sens. Lett. 2016, 7, 348–357. [Google Scholar] [CrossRef]
  60. Getirana, A.C.V.; Peters-Lidard, C. Estimating water discharge from large radar altimetry datasets. Hydrol. Earth Syst. Sci. 2013, 17, 923–933. [Google Scholar] [CrossRef] [Green Version]
  61. Tourian, M.; Sneeuw, N.; Bárdossy, A. A quantile function approach to discharge estimation from satellite altimetry (ENVISAT). Water Resour. Res. 2013, 49, 4174–4186. [Google Scholar] [CrossRef] [Green Version]
  62. Michailovsky, C.I.; McEnnis, S.; Bauer-Gottwein, P.A.M.; Berry, R.; Smith, P. River monitoring from satellite radar altimetry in the Zambezi River basin. Hydrol. Earth Syst. Sci. 2012, 16, 2181–2192. [Google Scholar] [CrossRef] [Green Version]
  63. Tarpanelli, A.; Amarnath, G.; Brocca, L.; Moramarco, T. Discharge forecasting using MODIS and radar altimetry: Potential application for transboundary flood risk management in Niger-Benue River basin. In Proceedings of the EGU General Assembly Conference Abstracts, Vienna, Austria, 17–22 April 2016. [Google Scholar]
  64. Sichangi, A.W.; Wang, L.; Yang, K.; Chen, D.; Wang, Z.; Li, X.; Zhou, J.; Liu, W.; Kuria, D. Estimating continental river basin discharges using multiple remote sensing data sets. Remote Sens. Environ. 2016, 179, 36–53. [Google Scholar] [CrossRef]
  65. Casas, A.; Benito, G.; Thorndycraft, V.R.; Rico, M. The topographic data source of digital terrain models as a key element in the accuracy of hydraulic flood modelling. Earth Surf. Process. Landf. 2006, 31, 444–456. [Google Scholar] [CrossRef]
  66. Cook, A.; Merwade, V. Effect of topographic data, geometric configuration and modeling approach on flood inundation mapping. J. Hydrol. 2009, 377, 131–142. [Google Scholar] [CrossRef]
  67. Patro, S.; Chatterjee, C.; Singh, R.; Raghuwanshi, N. Hydrodynamic modelling of a large flood-prone river system in India with limited data. Hydrol. Process. 2009, 23, 2774–2791. [Google Scholar] [CrossRef]
  68. Wang, W.; Yang, X.; Yao, T. Evaluation of ASTER GDEM and SRTM and their suitability in hydraulic modelling of a glacial lake outburst flood in southeast Tibet. Hydrol. Process. 2012, 26, 213–225. [Google Scholar] [CrossRef]
  69. Sanyal, J.; Carbonneau, P.; Densmore, A. Hydraulic routing of extreme floods in a large ungauged river and the estimation of associated uncertainties: A case study of the Damodar River, India. Nat. Hazards 2013, 66, 1153–1177. [Google Scholar] [CrossRef] [Green Version]
  70. Ullah, S.; Farooq, M.; Sarwar, T.; Tareen, M.; Wahid, M. Flood modeling and simulations using hydrodynamic model and ASTER DEM—A case study of Kalpani River. Arab. J. Geosci. 2016, 9, 1–11. [Google Scholar] [CrossRef]
  71. Amans, O.C.; Beiping, W.; Ziggah, Y.Y. Assessing Vertical Accuracy of SRTM Ver. 4.1 and ASTER GDEM Ver. 2 using Differential GPS Measurements–case study in Ondo State, Nigeria. Int. J. Sci. Eng. Res. 2013, 4, 523–531. [Google Scholar]
  72. Isioye, O.A.; Yang, I.C. Comparison and validation of ASTER-GDEM and SRTM elevation models over parts of Kaduna State, Nigeria. SASGI Proc. 2013, 1, 1–11. [Google Scholar]
  73. Zwally, H.J.; Schutz, B.; Abdalati, W.; Abshire, J.; Bentley, C.; Brenner, A.; Bufton, J.; Dezio, J.; Hancock, D.; Harding, D.; et al. ICESat’s laser measurements of polar ice, atmosphere, ocean, and land. J. Geodyn. 2002, 34, 405–445. [Google Scholar] [CrossRef]
  74. Fricker, H.A.; Borsa, A.; Minster, B.; Carabajal, C.; Quinn, K.; Bills, B. Assessment of ICESat performance at the salar de Uyuni, Bolivia. Geophys. Res. Lett. 2005, 32. [Google Scholar] [CrossRef] [Green Version]
  75. Jean Stéphane, B.; Hani, A.; Nicolas, L.; Nicolas, B. The Relevance of GLAS/ICESat Elevation Data for the Monitoring of River Networks. Remote Sens. 2011, 3, 708–720. [Google Scholar] [Green Version]
  76. Satgé, F.; Bonnet, M.P.; Timouk, F.; Calmant, S.; Pillco, R.; Molina, J.; Lavado-Casimiro, W.; Arsen, A.; Crétaux, J.F.; Garnier, J. Accuracy assessment of SRTM v4 and ASTER GDEM v2 over the Altiplano watershed using ICESat/GLAS data. Int. J. Remote Sens. 2015, 36, 465–488. [Google Scholar] [CrossRef]
  77. Carabajal, C.C.; Harding, D.J. ICESat validation of SRTM C-band digital elevation models. Geophys. Res. Lett. 2005, 32, 117–137. [Google Scholar] [CrossRef]
  78. Kon Joon Bhang, F.W.; Schwartz, A.; Braun, A. Verification of the Vertical Error in C- Band SRTM DEM Using ICESat and Landsat- 7, Otter Tail County, MN. IEEE Trans. Geosci. Remote Sens. 2007, 45, 36–44. [Google Scholar] [CrossRef]
  79. Du, X.; Guo, H.; Fan, X.; Zhu, J.; Yan, Z.; Zhan, Q. Vertical accuracy assessment of freely available digital elevation models over low-lying coastal plains. Int. J. Dig. Earth 2016, 9, 252–271. [Google Scholar] [CrossRef]
  80. Zhao, G.; Xue, H.; Ling, F. Assessment of ASTER GDEM performance by comparing with SRTM and ICESat/GLAS data in Central China. In Proceedings of the 18th International Conference on Geoinformatics, Beijing, China, 18–20 June 2010; pp. 1–5. [Google Scholar]
  81. Braun, A.; Fotopoulos, G. Assessment of SRTM, ICESat, and survey control monument elevations in Canada. Photogramm. Eng. Remote Sens. 2007, 73, 1333–1342. [Google Scholar] [CrossRef]
  82. Rastogi, G.; Agrawal, R.; Ajai, R. Bias corrections of CartoDEM using ICESat- GLAS data in hilly regions. GISci. Remote Sens. 2015, 52, 571–585. [Google Scholar]
  83. Beaulieu, A.; Clavet, D. Accuracy assessment of Canadian digital elevation data using ICESat. Photogramm. Eng. Remote Sens. 2009, 75, 81–86. [Google Scholar] [CrossRef]
  84. Yamanokuchi, T.; Doi, K.; Shibuya, K. Comparison of Antarctic Ice Sheet Elevation between ICESat GLAS and InSAR DEM. In Proceedings of the 2006 IEEE International Symposium on Geoscience and Remote Sensing, Denver, CO, USA, 31 July–4 August 2006; pp. 2712–2715. [Google Scholar]
  85. Mirzaee, S.; Motagh, M.; Arefi, H. Assessment of Reference Height Models on Quality of Tandem-X dem. Int. Arch. Photogramm. Remote Sens. Spat. Inf. Sci. 2015, 40, 463–466. [Google Scholar] [CrossRef]
  86. Sampson, C.C.; Smith, A.M.; Bates, P.D.; Neal, J.C.; Alfieri, L.; Freer, J.E. A high- resolution global flood hazard model. Water Resour. Res. 2015, 51, 7358–7381. [Google Scholar] [CrossRef] [PubMed]
  87. O’Loughlin, F.; Paiva, R.; Durand, M.; Alsdorf, D.; Bates, P. Development of a ‘bare-earth’ SRTM DEM product. In Proceedings of the EGU General Assembly Conference Abstracts, Vienna, Austria, 12–17 April 2015. [Google Scholar]
  88. Heyder, U. Vertical Forest Structure from ICESat/GLAS Lidar Data. Master’s Thesis, Department of Geography, University College London, London, UK, 2005; pp. 12–50. [Google Scholar]
  89. Trigg, M.A.; Bates, P.D.; Wilson, M.D.; Horritt, M.S.; Alsdorf, D.E.; Forsberg, B.R.; Vega, M.C. Amazon flood wave hydraulics. J. Hydrol. 2009, 374, 92–105. [Google Scholar] [CrossRef]
  90. Chávarri, E.; Crave, A.; Bonnet, M.-P.; Mejía, A.; Santos Da Silva, J.; Guyot, J.L. Hydrodynamic modelling of the Amazon River: Factors of uncertainty. J. S. Am. Earth Sci. 2013, 44, 94–103. [Google Scholar] [CrossRef]
  91. Bates, P.; Neal, J.; Alsdorf, D.; Schumann, G. Observing Global Surface Water Flood Dynamics. Surv. Geophys. 2014, 35, 839–852. [Google Scholar] [CrossRef]
  92. Durand, M.; Andreadis, K.M.; Alsdorf, D.E.; Lettenmaier, D.P.; Moller, D.; Wilson, M. Estimation of bathymetric depth and slope from data assimilation of swath altimetry into a hydrodynamic model. Geophys. Res. Lett. 2008, 35. [Google Scholar] [CrossRef] [Green Version]
  93. Bates, P.D.; De Roo, A.P.J. A simple raster-based model for flood inundation simulation. J. Hydrol. 2000, 236, 54–77. [Google Scholar] [CrossRef]
  94. Yoon, Y.; Durand, M.; Merry, C.J.; Clark, E.A.; Andreadis, K.M.; Alsdorf, D.E. Estimating river bathymetry from data assimilation of synthetic SWOT measurements. J. Hydrol. 2012, 464–465, 363–375. [Google Scholar] [CrossRef]
  95. Van Wesemael, A.; Gobeyn, S.; Neal, J.; Lievens, H.; Van Eerdenbrugh, K.; De Vleeschouwer, N.; Schumann, G.; Vernieuwe, H.; Di Baldassarre, G.; De Baets, B. Calibration of a flood inundation model using a SAR image: Influence of acquisition time. In Proceedings of the EGU General Assembly Conference Abstracts, Vienna, Austria, 17–22 April 2016. [Google Scholar]
  96. Neal, J.C.; Odoni, N.A.; Trigg, M.A.; Freer, J.E.; Garcia-Pintado, J.; Mason, D.C.; Wood, M.; Bates, P.D. Efficient incorporation of channel cross-section geometry uncertainty into regional and global scale flood inundation models. J. Hydrol. 2015, 529, 169–183. [Google Scholar] [CrossRef] [Green Version]
  97. Stephens, E.; Schumann, G.; Bates, P. Problems with binary pattern measures for flood model evaluation. Hydrol. Process. 2014, 28, 4928–4937. [Google Scholar] [CrossRef]
  98. Jung, H.C.; Jasinski, M.; Kim, J.W.; Shum, C.K.; Bates, P.; Neal, J.; Lee, H.; Alsdorf, D. Calibration of two- dimensional floodplain modeling in the central Atchafalaya Basin Floodway System using SAR interferometry. Water Resour. Res. 2012, 48. [Google Scholar] [CrossRef]
  99. Dung, N.V.; Merz, B.; Bárdossy, A.; Thang, T.D.; Apel, H. Multi- objective automatic calibration of hydrodynamic models utilizing inundation maps and gauge data. Hydrol. Earth Syst. Sci. 2011, 15, 1339–1354. [Google Scholar] [CrossRef] [Green Version]
  100. Pasquale, N.; Perona, P.; Wombacher, A.; Burlando, P. Hydrodynamic model calibration from pattern recognition of non- orthorectified terrestrial photographs. Comput. Geosci. 2014, 62, 160–167. [Google Scholar] [CrossRef]
  101. Wood, M.; Neal, J.; Hostache, R.; Corato, G.; Bates, P.; Giustarini, L.; Chini, M.; Matgen, P. Using time series of satellite SAR images to calibrate channel depth and friction parameters in the LISFLOOD-FP hydraulic model. In Proceedings of the EGU General Assembly Conference Abstracts, Vienna, Austria, 27 April–2 May 2014. [Google Scholar]
  102. Andréfouët, S.; Ouillon, S.; Brinkman, R.; Falter, J.; Douillet, P.; Wolk, F.; Smith, R.; Garen, P.; Martinez, E.; Laurent, V.; et al. Review of solutions for 3D hydrodynamic modeling applied to aquaculture in South Pacific atoll lagoons. Mar. Pollut. Bull. 2006, 52, 1138–1155. [Google Scholar] [CrossRef] [PubMed]
  103. Domeneghetti, A. On the use of SRTM and altimetry data for flood modeling in data- sparse regions. Water Resour. Res. 2016, 52, 2901–2918. [Google Scholar] [CrossRef]
  104. Yan, K.; Tarpanelli, A.; Balint, G.; Moramarco, T.; Baldassarre, G.D. Exploring the Potential of SRTM Topography and Radar Altimetry to Support Flood Propagation Modeling: Danube Case Study. J. Hydrol. Eng. 2015, 20, 04014048. [Google Scholar] [CrossRef]
  105. Domeneghetti, A.; Tarpanelli, A.; Brocca, L.; Barbetta, S.; Moramarco, T.; Castellarin, A.; Brath, A. The use of remote sensing- derived water surface data for hydraulic model calibration. Remote Sens. Environ. 2014, 149, 130–141. [Google Scholar] [CrossRef]
  106. Milzow, C.; Bauer-Gottwein, P.E.; Krogh, P. Combining satellite radar altimetry, SAR surface soil moisture and GRACE total storage changes for hydrological model calibration in a large poorly gauged catchment. Hydrol. Earth Syst. Sci. 2011, 15, 1729–1743. [Google Scholar] [CrossRef] [Green Version]
  107. Tommaso, M.; Angelica, T.; Luca, B.; Silvia, B. River Discharge Estimation by Using Altimetry Data and Simplified Flood Routing Modeling. Remote Sens. 2013, 5, 4145–4162. [Google Scholar] [Green Version]
  108. Sun, W.; Song, H.; Cheng, T.; Yu, J. Calibration of hydrological models using TOPEX/Poseidon radar altimetry observations. Proc. Int. Assoc. Hydrol. Sci. 2015, 368, 3–8. [Google Scholar] [CrossRef] [Green Version]
  109. Grimaldi, S.; Petroselli, A.; Serinaldi, F. A continuous simulation model for design-hydrograph estimation in small and ungauged watersheds. Hydrol. Sci. J. 2012, 57, 1035–1051. [Google Scholar] [CrossRef]
  110. Jung, Y.; Merwade, V. Estimation of uncertainty propagation in flood inundation mapping using a 1- D hydraulic model. Hydrol. Process. 2015, 29, 624–640. [Google Scholar] [CrossRef]
  111. Mason, D.C.; Trigg, M.; Garcia-Pintado, J.; Cloke, H.L.; Neal, J.C.; Bates, P.D. Improving the TanDEM- X Digital Elevation Model for flood modelling using flood extents from Synthetic Aperture Radar images. Remote Sens. Environ. 2016, 173, 15–28. [Google Scholar] [CrossRef]
  112. Bates, P.D.; Wilson, M.D.; Horritt, M.S.; Mason, D.C.; Holden, N.; Currie, A. Reach scale floodplain inundation dynamics observed using airborne synthetic aperture radar imagery: Data analysis and modelling. J. Hydrol. 2006, 328, 306–318. [Google Scholar] [CrossRef]
  113. Lewis, M.; Bates, P.; Horsburgh, K.; Neal, J.; Schumann, G. A storm surge inundation model of the northern Bay of Bengal using publicly available data. Q. J. R. Meteorol. Soc. 2013, 139, 358–369. [Google Scholar] [CrossRef] [Green Version]
  114. Neal, J.; Schumann, G.; Bates, P. A subgrid channel model for simulating river hydraulics and floodplain inundation over large and data sparse areas. Water Resour. Res. 2012, 48. [Google Scholar] [CrossRef] [Green Version]
  115. Farr, T.G.; Rosen, P.A.; Caro, E.; Crippen, R.; Duren, R.; Hensley, S.; Kobrick, M.; Paller, M.; Rodriguez, E.; Roth, L.; et al. The Shuttle Radar Topography Mission. Rev. Geophys. 2007, 45, RG2004. [Google Scholar] [CrossRef]
  116. Farr, T.G.; Kobrick, M. Shuttle radar topography mission produces a wealth of data. EOS 2000, 81, 583–585. [Google Scholar] [CrossRef]
  117. Gichamo, T.Z.; Popescu, I.; Jonoski, A.; Solomatine, D. River cross- section extraction from the ASTER global DEM for flood modeling. Environ. Model. Softw. 2012, 31, 37–46. [Google Scholar] [CrossRef]
  118. Demirkesen, A. Flood hazard vulnerability for settlements of Turkey’s province of Edirne, using ASTER DEM data and Landsat-7 ETM+ image data. Arab. J. Geosci. 2016, 9, 1–15. [Google Scholar] [CrossRef]
  119. Schumann, G.P.; Neal, J.C.; Voisin, N.; Andreadis, K.M.; Pappenberger, F.; Phanthuwongpakdee, N.; Hall, A.C.; Bates, P.D. A first large-scale flood inundation forecasting model. Water Resour. Res. 2013, 49, 6248–6257. [Google Scholar] [CrossRef] [Green Version]
  120. Tadono, T.; Ishida, H.; Oda, F.; Naito, S.; Minakawa, K.; Iwamoto, H. Precise Global DEM Generation by ALOS PRISM. ISPRS Ann. Photogramm. Remote Sens. Spat. Inf. Sci. 2014, II-4, 71–76. [Google Scholar] [CrossRef]
  121. Santillana, J.; Makinano-Santillana, M.; Ampayon, B.C.; del Norte, A. Vertical Accuracy Assessment of 30-M Resolution Alos, Aster, and Srtm Global Dems Over Northeastern Mindanao, Philippines. ISPRS-Int. Arch. Photogramm. Remote Sens. Spat. Inf. Sci. 2016, XLI-B4, 149–156. [Google Scholar] [CrossRef]
  122. Courty, L.G.; Soriano-Monzalvoa, J.C.; Pedrozo-Acuñaa, A. Evaluation of open-access global digital elevation models (AW3D30, SRTM and ASTER) for flood modelling purposes. Zenodo 2017. [Google Scholar] [CrossRef]
  123. Yamazaki, D.; Baugh, C.; Bates, P.D.; Kanae, S.; Alsdorf, D.; Oki, T. Adjustment of a spaceborne DEM for use in floodplain hydrodynamic modeling. J. Hydrol. 2012, 436, 81–91. [Google Scholar] [CrossRef]
  124. Baugh, C.A.; Bates, P.D.; Schumann, G.; Trigg, M.A. SRTM vegetation removal and hydrodynamic modeling accuracy. Water Resour. Res. 2013, 49, 5276–5289. [Google Scholar] [CrossRef] [Green Version]
  125. Rodriguez, E.; Morris, C.S.; Belz, J.E. A global assessment of the SRTM performance. Photogramm. Eng. Remote Sens. 2006, 72, 249–260. [Google Scholar] [CrossRef]
  126. Tarekegn, T.H.; Haile, A.T.; Rientjes, T.; Reggiani, P.; Alkema, D. Assessment of an ASTER- generated DEM for 2D hydrodynamic flood modeling. Int. J. Appl. Earth Obs. Geoinf. 2010, 12, 457–465. [Google Scholar] [CrossRef]
  127. Tachikawa, T.; Kaku, M.; Iwasaki, A.; Gesch, D.B.; Oimoen, M.J.; Zhang, Z.; Danielson, J.J.; Krieger, T.; Curtis, B.; Haase, J. ASTER Global Digital Elevation Model Version 2-Summary of Validation Results; NASA: Washington, DC, USA, 2011. [Google Scholar]
  128. Varga, M.; Bašić, T. Accuracy validation and comparison of global digital elevation models over Croatia. Int. J. Remote Sens. 2015, 36, 170–189. [Google Scholar] [CrossRef]
  129. Jilani, R.; Munir, S.; Siddiqui, P. Application of ALOS data in flood monitoring in Pakistan. In Proceedings of the 1st PI Symposium of ALOS Data Nodes, Kyoto, Japan, 10 July 2017. [Google Scholar]
  130. Danielson, J.J.; Gesch, D.B. Global Multi-Resolution Terrain Elevation Data 2010 (GMTED2010); United States Geological Survey: Reston, VA, USA, 2011.
  131. Pakoksung, K.; Takagi, M. Digital elevation models on accuracy validation and bias correction in vertical. Model. Earth Syst. Environ. 2016, 2, 1–13. [Google Scholar] [CrossRef]
  132. Simard, M.; Pinto, N.; Fisher, J.B.; Baccini, A. Mapping forest canopy height globally with spaceborne lidar. J. Geophys. Res. Biogeosci. 2011, 116. [Google Scholar] [CrossRef]
  133. Lefsky, M.A. A global forest canopy height map from the Moderate Resolution Imaging Spectroradiometer and the Geoscience Laser Altimeter System. Geophys. Res. Lett. 2010, 37. [Google Scholar] [CrossRef] [Green Version]
  134. Betbeder, J.; Rapinel, S.; Corgne, S.; Pottier, E.; Hubert-Moy, L. TerraSAR- X dual-pol time-series for mapping of wetland vegetation. ISPRS J. Photogramm. Remote Sens. 2015, 107, 90–98. [Google Scholar] [CrossRef] [Green Version]
  135. Biancamaria, S.; Bates, P.D.; Boone, A.; Mognard, N.M. Large-scale coupled hydrologic and hydraulic modelling of the Ob river in Siberia. J. Hydrol. 2009, 379, 136–150. [Google Scholar] [CrossRef] [Green Version]
  136. Gallant, J. Adaptive smoothing for noisy DEMs. Geomorphometry 2011, 2011, 7–9. [Google Scholar]
  137. O’Loughlin, F.E.; Paiva, R.C.D.; Durand, M.; Alsdorf, D.E.; Bates, P.D. A multi- sensor approach towards a global vegetation corrected SRTM DEM product. Remote Sens. Environ. 2016, 182, 49–59. [Google Scholar] [CrossRef]
  138. Peel, M.C.; Finlayson, B.L.; Mcmahon, T.A. Updated world map of the Köppen- Geiger climate classification. Hydrol. Earth Syst. Sci. 2007, 11, 1633–1644. [Google Scholar] [CrossRef]
  139. Broxton, P.D.; Zeng, X.; Sulla-Menashe, D.; Troch, P.A. A global land cover climatology using MODIS data. J. Appl. Meteorol. Climatol. 2014, 53, 1593–1605. [Google Scholar] [CrossRef]
  140. Yamazaki, D.; Ikeshima, D.; Tawatari, R.; Yamaguchi, T.; O’Loughlin, F.; Neal, J.C.; Sampson, C.C.; Kanae, S.; Bates, P.D. A high-accuracy map of global terrain elevations. Geophys. Res. Lett. 2017, 44, 5844–5853. [Google Scholar] [CrossRef] [Green Version]
  141. Robinson, N.; Regetz, J.; Guralnick, R.P. EarthEnv-DEM90: A nearly-global, void-free, multi-scale smoothed, 90 m digital elevation model from fused ASTER and SRTM data. ISPRS J. Photogramm. Remote Sens. 2014, 87, 57–67. [Google Scholar] [CrossRef]
  142. Tan, M.L.; Ficklin, D.L.; Dixon, B.; Yusop, Z.; Chaplot, V. Impacts of DEM resolution, source, and resampling technique on SWAT-simulated streamflow. Appl. Geogr. 2015, 63, 357–368. [Google Scholar] [CrossRef] [Green Version]
  143. Medeiros, S.C.; Hagen, S.C.; Weishampel, J.F. Comparison of floodplain surface roughness parameters derived from land cover data and field measurements. J. Hydrol. 2012, 452–453, 139–149. [Google Scholar] [CrossRef]
  144. Tarpanelli, A.; Brocca, L.; Lacava, T.; Melone, F.; Moramarco, T.; Faruolo, M.; Pergola, N.; Tramutoli, V. Toward the estimation of river discharge variations using MODIS data in ungauged basins. Remote Sens. Environ. 2013, 136, 47–55. [Google Scholar] [CrossRef]
  145. Gleason, C.J.; Smith, L.C. Toward global mapping of river discharge using satellite images and at-many-stations hydraulic geometry. Proc. Natl. Acad. Sci. USA 2014, 111, 4788–4791. [Google Scholar] [CrossRef] [PubMed] [Green Version]
  146. Sanyal, J.; Densmore, A.L.; Carbonneau, P. Analysing the effect of land-use/cover changes at sub-catchment levels on downstream flood peaks: A semi-distributed modelling approach with sparse data. Catena 2014, 118, 28–40. [Google Scholar] [CrossRef] [Green Version]
  147. Karimi, N.; Bagheri, M.H.; Hooshyaripor, F.; Farokhnia, A.; Sheshangosht, S. Deriving and Evaluating Bathymetry Maps and Stage Curves for Shallow Lakes Using Remote Sensing Data. Water Resour. Manag. 2016, 30, 5003–5020. [Google Scholar] [CrossRef]
  148. Wood, M.; Hostache, R.; Neal, J.; Wagener, T.; Giustarini, L.; Chini, M.; Corato, G.; Matgen, P.; Bates, P. Calibration of channel depth and friction parameters in the LISFLOOD- FP hydraulic model using medium resolution SAR data. Hydrol. Earth Syst. Sci. Discuss. 2016, 20, 4983–4997. [Google Scholar] [CrossRef]
  149. Townsend, P.A.; Walsh, S.J. Modeling floodplain inundation using an integrated GIS with radar and optical remote sensing. Geomorphology 1998, 21, 295–312. [Google Scholar] [CrossRef]
  150. Qasim, A.-A.M.S.M. Assessment of High Resolution SAR Imagery for Mapping Floodplain Water Bodies: A Comparison between Radarsat-2 and TerraSAR-X; Durham University: Durham, UK, 2011. [Google Scholar]
  151. Stephen, M.C.; Ryan, S.A.; Paul, H.E.; Melinda, J.L.; David, M.M. Multi-Temporal Independent Component Analysis and Landsat 8 for Delineating Maximum Extent of the 2013 Colorado Front Range Flood. Remote Sens. 2015, 7, 9822–9843. [Google Scholar] [Green Version]
  152. Alexakis, D.D.; Gryllakis, M.G.; Koutroulis, A.G.; Agapiou, A.; Themistocleous, K.; Tsanis, I.K.; Michaelides, S.; Pashiardis, S.; Demetriou, C.; Aristeidou, K.; et al. GIS and remote sensing techniques for the assessment of land use changes impact on flood hydrology: The case study of Yialias Basin in Cyprus. Nat. Hazards Earth Syst. Sci. Discuss. 2013, 1, 4833–4869. [Google Scholar] [CrossRef]
  153. Zhang, F.; Zhu, X.; Liu, D. Blending MODIS and Landsat images for urban flood mapping. Int. J. Remote Sens. 2014, 35, 3237–3253. [Google Scholar] [CrossRef]
  154. Schnebele, E.; Cervone, G. Improving remote sensing flood assessment using volunteered geographical data. Nat. Hazards Earth Syst. Sci. 2013, 13, 669–677. [Google Scholar] [CrossRef] [Green Version]
  155. Henderson, F.M.; Lewis, A.J. Principles and Applications of Imaging Radar. Manual of Remote Sensing; John Wiley and Sons: Hoboken, NJ, USA, 1998; Volume 2. [Google Scholar]
  156. Veljanovski, T.; Lamovec, P.; Ostir, K.; Pehani, P. Comparison of three techniques for detection of flooded areas on Envisat and Radarsat-2 satellite images. In Proceedings of the GEOSS Era: Towards Operational Environmental Monitoring, Sydney, Australia, 10–15 April 2011. [Google Scholar]
  157. Long, S.; Fatoyinbo, T.E.; Policelli, F. Flood extent mapping for namibia using change detection and thresholding with SAR. Environ. Res. Lett. 2014, 9, 035002. [Google Scholar] [CrossRef]
  158. Im, J.; Jensen, J.R.; Tullis, J.A. Object- based change detection using correlation image analysis and image segmentation. Int. J. Remote Sens. 2008, 29, 399–423. [Google Scholar] [CrossRef]
  159. Lamovec, P.; Veljanovski, T.; Mikoš, M.; Oštir, K. Detecting flooded areas with machine learning techniques: Case study of the Selška Sora river flash flood in September 2007. J. Appl. Remote Sens. 2013, 7, 073564. [Google Scholar] [CrossRef]
  160. Giustarini, L.; Hostache, R.; Matgen, P.; Schumann, G.J.P.; Bates, P.D.; Mason, D.C. A Change Detection Approach to Flood Mapping in Urban Areas Using TerraSAR- X. IEEE Trans. Geosci. Remote Sens. 2013, 51, 2417–2430. [Google Scholar] [CrossRef]
  161. Grimaldi, S.; Li, Y.; Pauwels, V.; Walker, J.P. Remote Sensing-Derived Water Extent and Level to Constrain Hydraulic Flood Forecasting Models: Opportunities and Challenges. Surv. Geophys. 2016, 37, 977–1034. [Google Scholar] [CrossRef]
  162. Di Baldassarre, G.; Schumann, G.; Brandimarte, L.; Bates, P. Timely low resolution SAR imagery to support floodplain modelling: A case study review. Surv. Geophys. 2011, 32, 255–269. [Google Scholar] [CrossRef]
  163. Seung Oh, L.; Yongchul, S.; Kyudong, Y.; Younghun, J.; Venkatesh, M. An Approach Using a 1D Hydraulic Model, Landsat Imaging and Generalized Likelihood Uncertainty Estimation for an Approximation of Flood Discharge. Water 2013, 5, 1598–1621. [Google Scholar] [Green Version]
  164. Sanyal, J. Flood Prediction and Mitigation in Data-Sparse Environments; Durham University: Durham, UK, 2013. [Google Scholar]
  165. Aich, V.; Koné, B.; Hattermann, F.F.; Müller, E.N. Floods in the Niger basin – analysis and attribution. Nat. Hazards Earth Syst. Sci. Discuss. 2014, 2, 5171–5212. [Google Scholar] [CrossRef]
  166. Nkeki, F.; Henah, P.; Ojeh, V. Geospatial Techniques for the Assessment and Analysis of Flood Risk along the Niger- Benue Basin in Nigeria. J. Geogr. Inf. Syst. 2013, 5, 123–135. [Google Scholar] [CrossRef]
  167. Akinbobola, A.; Okogbue, E.C.; Olajiire, O. A GIS based flood risk mapping along the Niger-Benue river basin in Nigeria using watershed approach. Ethiop. J. Environ. Stud. Manag. 2015, 8, 616–627. [Google Scholar] [CrossRef]
  168. Agada, S.; Nirupama, N. A serious flooding event in Nigeria in 2012 with specific focus on Benue State: A brief review. Nat. Hazards 2015, 77, 1405–1414. [Google Scholar] [CrossRef]
  169. Tami, A.G.; Moses, O. Flood Vulnerability Assessment of Niger Delta States Relative to 2012 Flood Disaster in Nigeria. Am. J. Environ. Protect. 2015, 3, 76–83. [Google Scholar]
  170. Komolafe, A.A.; Adegboyega, S.A.; Akinluyi, F.O. A Review of Flood Risk Analysis in Nigeria. Am. J. Environ. Sci. 2015, 11, 157–166. [Google Scholar] [CrossRef]
  171. Ugonna, C. A Review of Flooding and Flood Risk Reduction in Nigeria. Glob. J. Hum. Soc. Sci. Res. 2016, 16, 1–21. [Google Scholar]
  172. Opolot, E. Application of remote sensing and geographical information systems in flood management: A review. Res. J. Appl. Sci. Eng. Technol. 2013, 6, 1884–1894. [Google Scholar] [CrossRef]
  173. Adeaga, O.; Oyebande, L.; Balogun, I. PUB and Water Resources Management Practises in Nigeria. Water Energy Abstr. 2008, 18, 58. [Google Scholar]
  174. Ologunorisa, T.; Abawua, M. Flood risk assessment: A review. J. Appl. Sci. Environ. Manag. 2005, 9, 57–63. [Google Scholar]
  175. Ngene, B.U.; Agunwamba, J.C.; Nwachukwu, B.A.; Okoro, B.C. The Challenges to Nigerian Raingauge Network Improvement. RJEES 2015, 7, 68–74. [Google Scholar] [CrossRef]
  176. Federal Ministry of Water Resources. The Project for Review and Update of Nigeria National Water Resources Master Plan; Federal Ministry of Water Resources: Abuja, Nigeria, 2013. [Google Scholar]
  177. Ngene, B.U. Optimization of Rain Gauge Stations in Nigeria; Federal University of Technology: Owerri, Nigeria, 2009. [Google Scholar]
  178. Olomoda, I. Challenges of Continued River Niger Low Flow into Nigeria. Spec. Publ. Niger. Assoc. Hydrol. Sci. 2012, 2012, 145–155. [Google Scholar]
  179. Izinyon, O.; Ehiorobo, J. L-moments approach for flood frequency analysis of river Okhuwan in Benin-Owena River basin in Nigeria. Niger. J. Technol. 2014, 33, 10–18. [Google Scholar] [CrossRef]
  180. Ertuna, C. Water Resources Development and Management in Asia and the Pacific. Environ. Soil Water Manag. 1996, 10, 32–53. [Google Scholar]
  181. Ononiwu, N. Appraisal of the role of satellite systems in acquisition of data for monitoring and evaluating global climatic changes with respect to reservoir energy generation. Glob. Clim. Chang. Impact Energy Dev. 1994, 1994, 1. [Google Scholar]
  182. Olayinka, D.N. Modelling Flooding in the Niger Delta; Lancaster University: Lancaster, UK, 2012. [Google Scholar]
  183. Merz, R.; Blöschl, G. Flood frequency regionalisation—Spatial proximity vs. catchment attributes. J. Hydrol. 2005, 302, 283–306. [Google Scholar] [CrossRef]
  184. Reed, D. Procedures for Flood Freequency Estimation, Volume 3: Statistical Procedures for Flood Freequency Estimation; Institute of Hydrology: Parker, CO, USA, 1999. [Google Scholar]
  185. Federal Ministry of Environment. Action Plan for Erosion and Flood Control; Federal Ministry of Environment: Abuja, Nigeria, 2005.
  186. Musa, Z.N.; Popescu, I.; Mynett, A. The Niger Delta’s vulnerability to river floods due to sea level rise. Nat. Hazards Earth Syst. Sci. 2014, 14, 3317–3329. [Google Scholar] [CrossRef]
  187. Adelekan, I. Vulnerability assessment of an urban flood in Nigeria: Abeokuta flood 2007. Nat. Hazards 2011, 56, 215–231. [Google Scholar] [CrossRef]
  188. Tamuno, P.; Ince, M.; Howard, G. Understanding vulnerability in the Niger floodplain. In Proceedings of the 29th (Water, Engineering and Development Centre) Conference WEDC towards the Millennium Development Goals-Actions for Water and Environmental Sanitation, Abuja, Nigeria, 23–26 September 2003; pp. 358–361. [Google Scholar]
  189. Izinyon, O.; Ajumka, H. Regional Flood Frequency Analysis of Catchments in upper Benueriver Basin Using Index Flood Procedure. Niger. J. Technol. 2013, 32, 159–169. [Google Scholar]
  190. Fasinmirin, J.T.; Olufayo, A.A. Comparison of Flood Prediction Models for River Lokoja, Nigeria. Geophys. Res. Abstr. 2006, 8. [Google Scholar]
  191. Isikwue, M.O.; Onoja, S.B.; Laudan, K.J.; Bauchi, F. Establishment of an empirical model that correlates rainfall-intensity-duration-frequency for Makurdi Area, Nigeria. Int. J. Adv. Eng. Technol. 2012, 5, 40–46. [Google Scholar]
  192. Ologunorisa, T.E.; Tersoo, T. The changing rainfall pattern and its implication for flood frequency in Makurdi, Northern Nigeria. J. Appl. Sci. Environ. Manag. 2006, 10, 97–102. [Google Scholar] [CrossRef]
  193. Adewale, P.O.; Sangodoyin, A.Y.; Adewale, J.; Adamowski, J. Flood routing in the Ogunpa River in nigeria using HEC- RAS. J. Environ. Hydrol. 2010, 18, 1. [Google Scholar]
  194. Padi, P.T.; Baldassarre, G.D.; Castellarin, A. Floodplain management in Africa: Large scale analysis of flood data. Phys. Chem. Earth 2011, 36, 292–298. [Google Scholar] [CrossRef]
  195. Balogun, I.I.; Sojobi, A.O.; Oyedepo, B.O. Assessment of rainfall variability, rainwater harvesting potential and storage requirements in Odeda local government area of Ogun State in Southwestern Nigeria. Cogent Environ. Sci. 2016, 2, 1138597. [Google Scholar] [CrossRef]
  196. Ogungbenro, S.B.; Morakinyo, T.E. Rainfall distribution and change detection across climatic zones in Nigeria. Weather Clim. Extremes 2014, 5–6, 1–6. [Google Scholar] [CrossRef]
  197. Oyinloye, M.A.; Olamiju, O.I.; Oyetayo, B.S. Combating flood crisis using GIS: Empirical evidences from ala river floodplain, Isikan Area, Akure, Ondo State, Nigeria. Commun. Inf. Sci. Manag. Eng. 2013, 3, 439–447. [Google Scholar]
  198. Ndabula, C.; Jidauna, G.; Oyatayo, K.; Averik, P.; Iguisi, E. Analysis of urban floodplain encroachment: Strategic approach to flood and floodplain management in Kaduna metropolis, Nigeria. J. Geogr. Geol. 2012, 4, 170. [Google Scholar] [CrossRef]
  199. Okeke, I.C. Geographic Information Systems and Sustainable Water Resources Management in Nigeria. In Coastal and Marine Geospatial Technologies; Springer: Dordrecht, The Netherlands, 2010; pp. 219–226. [Google Scholar]
  200. Hunter, N.M.; Bates, P.D.; Neelz, S.; Pender, G.; Villanueva, I.; Wright, N.G.; Liang, D.; Falconer, R.A.; Lin, B.; Waller, S.; et al. Benchmarking 2D hydraulic models for urban flooding. Proc. ICE Water Manag. 2008, 161, 13–30. [Google Scholar] [CrossRef] [Green Version]
  201. Nigro, J.; Slayback, D.; Policelli, F.; Brakenridge, G. NASA/DFO MODIS Near Real-Time (NRT) Global Flood Mapping Product Evaluation of Flood and Permanent Water Detection. Available online: https://floodmap.modaps.eosdis.nasa.gov/documents/NASAGlobalNRTEvaluationSummary_v4.pdf (accessed on 30 July 2018).
  202. Bakker, M.H.N. Transboundary River Floods and Institutional Capacity. J. Am. Water Resour. Assoc. 2009, 45, 553–566. [Google Scholar] [CrossRef]
  203. Angelidis, P.; Kotsikas, M.; Kotsovinos, N. Management of Upstream Dams and Flood Protection of the Transboundary River Evros/Maritza. Water Resour. Manag. 2010, 24, 2467–2484. [Google Scholar] [CrossRef]
  204. Clement, A.R. Causes of seasonal flooding in flood plains: A case of Makurdi, Northern Nigeria. Int. J. Environ. Stud. 2012, 69, 904–912. [Google Scholar] [CrossRef]
  205. Zeitoun, M.; Goulden, M.; Tickner, D. Current and future challenges facing transboundary river basin management. WIREs Clim. Chang. 2013, 4, 331–349. [Google Scholar] [CrossRef]
  206. Cooley, H.; Gleick, P. Climate- proofing transboundary water agreements. Hydrol. Sci. J. 2011, 56, 711–718. [Google Scholar] [CrossRef]
  207. Wolf, A.T. Atlas of International Freshwater Agreements; UNEP: Nairobi, Kenya; Earthprint: Stevenage, UK, 2002; Volume 4. [Google Scholar]
  208. Transboundary Water Assessment Programme. The Global Transboundary River Basins. Available online: http://twap-rivers.org/#global-basins (accessed on 10 August 2016).
  209. ECOWAS-SWAC/OECD. Transboundary River Basins; ECOWAS-SWAC/OECD: Paris, France, 2008. [Google Scholar]
  210. Hooper, B.P.; Lloyd, G.J. Report on Iwrm in Transboundary Basins; UNEP-DHI Centre for Water Environment: Hørsholm, Denmark, 2011. [Google Scholar]
  211. Chikozho, C. Pathways for building capacity and ensuring effective transboundary water resources management in Africa: Revisiting the key issues, opportunities and challenges. Phys. Chem. Earth 2014, 76–78, 72–82. [Google Scholar] [CrossRef]
  212. Klemas, V. Remote Sensing of Floods and Flood-Prone Areas: An Overview. J. Coast. Res. 2015, 31, 1005–1013. [Google Scholar] [CrossRef]
  213. Mallinis, G.; Gitas, I.Z.; Giannakopoulos, V.; Maris, F.; Tsakiri-Strati, M. An object-based approach for flood area delineation in a transboundary area using ENVISAT ASAR and LANDSAT TM data. Int. J. Dig. Earth 2013, 6, 124–136. [Google Scholar] [CrossRef]
  214. Serbis, D.; Papathanasiou, C.; Mamassis, N. Flood mitigation at the downstream areas of a transboundary river. In Proceedings of the 8th International Conference of EWRA “Water Resources Management in an Interdisciplinary and Changing Context”, Porto, Portugal, 26–29 June 2013. [Google Scholar]
  215. Mati, B.M.; Mutie, S.; Gadain, H.; Home, P.; Mtalo, F. Impacts of land-use/cover changes on the hydrology of the transboundary Mara River, Kenya/Tanzania. Lakes Reserv. Res. Manag. 2008, 13, 169–177. [Google Scholar] [CrossRef]
  216. Hossain, F.; Siddique-E-Akbor, A.H.; Mazumder, L.C.; Shahnewaz, S.M.; Biancamaria, S.; Lee, H.; Shum, C.K. Proof of Concept of an Altimeter- Based River Forecasting System for Transboundary Flow Inside Bangladesh. IEEE J. Sel. Top. Appl. Earth Obs. Remote Sens. 2014, 7, 587–601. [Google Scholar] [CrossRef] [Green Version]
  217. Seyler, F.; Calmant, S.; da Silva, J.; Filizola, N.; Roux, E.; Cochonneau, G.; Vauchel, P.; Bonnet, M.-P. Monitoring water level in large trans-boundary ungauged basins with altimetry: The example of ENVISAT over the Amazon basin. In Proceedings of the Asia-Pacific Remote Sensing, Noumea, New Caledonia, 19 December 2008; p. 715017. [Google Scholar]
  218. Ojigi, M.; Abdulkadir, F.; Aderoju, M. Geospatial mapping and analysis of the 2012 flood disaster in central parts of Nigeria. In Proceedings of the 8th National GIS Symposium, Dammam, Saudi Arabia, 15–17 April 2013; pp. 1–14. [Google Scholar]
  219. Olojo, O.O.; Asma, T.I.; Isah, A.A.; Oyewumi, A.S.; Adepero, O. The Role of Earth Observation Satellite during the International Collaboration on the 2012 Nigeria Flood Disaster. In Proceedings of the 64th International Astronautical Congress, Beijing, China, 22–27 September 2013. [Google Scholar]
  220. Erekpokeme, L.N. Flood Disasters in Nigeria: Farmers and Governments’ Mitigation Efforts. J. Biol. Agric. Healthc. 2015, 5, 150–154. [Google Scholar]
  221. Daura, M.; Mayomi, I. Geo-Spatial Assessments of Flood Disaster Vulnerability of Benue and Taraba States. Acad. Res. Int. 2015, 1, 166–183. [Google Scholar]
  222. Lehner, B.; Liermann, C.R.; Revenga, C.; Vörösmarty, C.; Fekete, B.; Crouzet, P.; Döll, P.; Endejan, M.; Frenken, K.; Magome, J. Global Reservoir and Dam (GRanD) Database; Technical Documentation, Version 1; NASA: Washington, DC, USA, 2011.
  223. The Great Rivers Partnership. Niger River Basin. Available online: http://www.greatriverspartnership.org/en-us/africa/niger/pages/default.aspx (accessed on 11 August 2016).
  224. Global Water Partnership. West Africa—Iwrm in the Niger River Basin Case #46; Global Water Partnership: Stockholm, Sweden, 2016. [Google Scholar]
  225. Bossard, L. West African Studies Regional Atlas on West Africa; OECD Publishing: Paris, France, 2009. [Google Scholar]
  226. International Waters Governance. Niger Basin. Available online: http://www.internationalwatersgovernance.com/niger-basin.html (accessed on 11 August 2016).
  227. Morand, P.; Mikolasek, O. Review of the present state of knowledge of environment, fish stocks and fisheries of the River Niger (West Africa). In Proceedings of the Second International Symposium on the Management of Large Rivers for Fisheries: Sustaining Livelihoods and Biodiversity in the New Millenium, Phnom Penh, Cambodge, 11–14 February 2003. [Google Scholar]
  228. Olomoda, I. Integrated Water Resources Management: Niger Authority’s Experience. In Proceedings of the From Conflict to Co-Operation in International Water Resources Management: Challenges and Opportunities, Delft, The Netherlands, 20–22 November 2002. [Google Scholar]
  229. Grossmann, M. Cooperation on Africa’s international waterbodies: Information needs and the role of information-sharing. Editors 2006, 1, 173. [Google Scholar]
  230. Pilon, P.J.; Asefa, M.K. Comprehensive Review of the World Hydrological Cycle Observing System; World Meteorological Organization: Geneva, Switzerland, 2011. [Google Scholar]
  231. Earle, A.; Cascão, A.E.; Hansson, S.; Jägerskog, A.; Swain, A.; Öjendal, J. Transboundary Water Management and the Climate Change Debate; Routledge: Abingdon, UK, 2015. [Google Scholar]
  232. Skakun, S.; Kussul, N.; Shelestov, A.; Kussul, O. Flood Hazard and Flood Risk Assessment Using a Time Series of Satellite Images: A Case Study in Namibia. Risk Anal. 2014, 34, 1521–1537. [Google Scholar] [CrossRef] [PubMed]
  233. Salami, Y.D.; Nnadi, F.N. Seasonal and interannual validation of satellite-measured reservoir levels at the Kainji dam. Int. J. Water Resour. Environ. Eng. 2012, 4, 105–113. [Google Scholar]
  234. Sparavigna, A.C. Recurrence plots from altimetry data of some lakes in Africa. Int. J. Sci. 2014, 3, 19–27. [Google Scholar] [CrossRef]
  235. Cretaux, J.-F.; Berge-Nguyen, M.; Leblanc, M.; Abarca Del Rio, R.; Delclaux, F.; Mognard, N.; Lion, C.; Pandey, R.K.; Tweed, S.; Calmant, S. Flood mapping inferred from remote sensing data. Int. Water Technol. J. 2011, 1, 48–62. [Google Scholar]
  236. Bessis, J.L.; Béquignon, J.; Mahmood, A. The International Charter “Space and Major Disasters” initiative. Acta Astronaut. 2004, 54, 183–190. [Google Scholar] [CrossRef]
  237. ICSMD. The International Charter: Space and Major Disasters; ICSMD: Konya, Turkey, 2015. [Google Scholar]
  238. UNOOSA. International Charter ‘Space and Major Disasters’, Towards Universl Access; UNOOSA: Vienna, Austria, 2013. [Google Scholar]
  239. National Centre for Space Studies. International Charter Space and Major Disasters. In Charter Geographic Tool; CNES: Paris, France, 2016. [Google Scholar]
  240. James, G.; Shaba, H.; Zubair, O.; Teslim, A.G. Space-Based Disaster Management in Nigeria: The Role of the International Charter “Space and Major Disasters”. In Proceedings of the FIG Working Week, Environment for Sustainability, Abuja, Nigeria, 6–10 May 2013. [Google Scholar]
  241. Backhaus, R.; Czaran, L.; Epler, N.; Leitgab, M.; Lyu, Y.S.; Ravan, S.; Stevens, D.; Stumpf, P.; Szarzynski, J.; de Leon, J.-C.V. Support from space: The United Nations platform for space-based information for disaster management and emergency response (UN-SPIDER). In Geoinformation for Disaster and Risk Management: Examples and Best Practices. Copenhagen, Denmark: Joint Board of Geospatial Information Societies; UNITED NATIONS: New York, NY, USA, 2010. [Google Scholar]
  242. International Water Mangement Institute. Emergency Response Products for Water Disasters; International Water Mangement Institute: Colombo, Sri Lanka, 2016; Available online: http://www.iwmi.cgiar.org/resources/emergency-response-products-for-water-disasters/ (accessed on 17 August 2016).
  243. Copernicus. The Emergency Management Service—Mapping; Copernicus: Keilor Downs, Australia, 2016. [Google Scholar]
  244. Price, R. Digital Globe Open Data Program. Available online: http://blog.digitalglobe.com/news/launching-our-open-data-program-for-disaster-response/ (accessed on 20 January 2017).
  245. Baruch, A.; May, A.; Yu, D. The motivations, enablers and barriers for voluntary participation in an online crowdsourcing platform. Comput. Hum. Behav. 2016, 64, 923–931. [Google Scholar] [CrossRef]
  246. Kite, G.; Pietroniro, A. Remote sensing applications in hydrological modelling. Hydrol. Sci. J. 1996, 41, 563–591. [Google Scholar] [CrossRef] [Green Version]
  247. Chikozho, C. Towards best-practice in transboundary water governance in Africa: Exploring the policy and institutional dimensions of conflict and cooperation over water. In Rethinking Development Challenges for Public Policy; Palgrave Macmillan: London, UK, 2012; pp. 155–200. [Google Scholar]
  248. Tilleard, S.; Ford, J. Adaptation readiness and adaptive capacity of transboundary river basins. Clim. Chang. 2016, 137, 575–591. [Google Scholar] [CrossRef]
  249. Sandro, M.; Christoph, R. Backscatter Analysis Using Multi-Temporal and Multi-Frequency SAR Data in the Context of Flood Mapping at River Saale, Germany. Remote Sens. 2015, 7, 7732–7752. [Google Scholar] [Green Version]
  250. Asner, G.P. Cloud cover in Landsat observations of the Brazilian Amazon. Int. J. Remote Sens. 2001, 22, 3855–3862. [Google Scholar] [CrossRef]
  251. Veljanovski, T.; Kanjir, U.; Oštir, K. Object-based image analysis of remote sensing data. Geod. Vestnik 2011, 55, 678–688. [Google Scholar] [CrossRef]
  252. Escloupier, E.; Becker, M.; Marie-Joseph, I.; Linguet, L.; Timmermann, P.; Calmant, S.; Seyler, F. Reconstruction of Hydrological Archives in French Guiana by Radar Altimetry, Hydrodynamic Modeling and Nonlinear Analysis of Time Series. In Proceedings of the 20 Years of Progress in Radar Altimetry Symposium, Venice, Italy, 24–29 September 2012. [Google Scholar]
  253. Yoshimoto, S.; Amarnath, G. Applications of Satellite-Based Rainfall Estimates in Flood Inundation Modeling-A Case Study in Mundeni Aru River Basin, Sri Lanka. Remote Sens. 2017, 9, 998. [Google Scholar] [CrossRef]
  254. Komi, K.; Neal, J.; Trigg, M.A.; Diekkrüger, B. Modelling of flood hazard extent in data sparse areas: a case study of the Oti River basin, West Africa. J. Hydrol. 2017, 10, 122–132. [Google Scholar] [CrossRef]
  255. Yu, D.; Yin, J.; Liu, M. Validating city-scale surface water flood modelling using crowd-sourced data. Environ. Res. Lett. 2016, 11, 124011. [Google Scholar] [CrossRef] [Green Version]
  256. Revilla-Romero, B.; Beck, H.E.; Burek, P.; Salamon, P.; de Roo, A.; Thielen, J. Filling the gaps: Calibrating a rainfall-runoff model using satellite-derived surface water extent. Remote Sens. Environ. 2015, 171, 118–131. [Google Scholar] [CrossRef]
  257. Di Baldassarre, G.; Uhlenbrook, S. Is the current flood of data enough? A treatise on research needs for the improvement of flood modelling. Hydrol. Process. 2012, 26, 153–158. [Google Scholar] [CrossRef]
  258. Corcoran, J.; Knight, J.; Brisco, B.; Kaya, S.; Cull, A.; Murnaghan, K. The integration of optical, topographic, and radar data for wetland mapping in northern Minnesota. Can. J. Remote Sens. 2012, 37, 564–582. [Google Scholar] [CrossRef]
  259. African Association of Remote Sensing of the Environment; European Association of Remote Sensing Companies. A Survey into the Africanprivate Sector in Earthobservation Andgeospatial Fields; African Association of Remote Sensing of the Environment: Kampala, Uganda; European Association of Remote Sensing Companies: Brussels, Belgium, 2016. [Google Scholar]
  260. Nwilo, P.; Osanwuta, D. National Spatial Data Infrastructure for Nigeria-Issues to Be Considered. In Proceedings of the FIG Working Week, Athens, Greece, 22–27 May 2004. [Google Scholar]
  261. Degrossi, L.C.; de Albuquerque, J.P.; Fava, M.C.; Mendiondo, E.M. Flood Citizen Observatory: A crowdsourcing-based approach for flood risk management in Brazil. In Proceedings of the 26th International Conference on Software Engineering and Knowledge Engineering (SEKE 2014), Vancouver, BC, Canada, 1–3 July 2014; pp. 570–575. [Google Scholar]
  262. Ekeu-wei, I.T.; Blackburn, G.A. Evaluation of Crowd-Sourcing (Volunteered GIS) and NRT-MODIS Flood Map in Monitoring Flood in Nigeria. In Proceedings of the 7th International Conference of the Nigerian association of Hydrological Sciences (NAHS), Abuja, Nigeria, 18–21 October 2016. [Google Scholar]
  263. Ekeu-wei, I.T. Application of Open-Access and 3rd Party Geospatial Technology for Integrated Flood Risk Management in Data Sparse Regions of Developing Countries. In Lancaster Environmental Centre; Lancaster University: Lancaster, UK, 2018. [Google Scholar]
Figure 1. Graphic illustration of satellite altimetry height measurement principle (adapted from [40]).
Hydrology 05 00039 g001
Figure 2. Illustration of a virtual station, where altimetry satellite tracks intersect the river Niger.
Hydrology 05 00039 g002
Figure 3. Typical water level time-series extracted from an altimetry virtual station along the river Niger (error bars indicate standard deviation from water level height (m), and are low during peak flooding, as altimetry measurement accuracy is improved during this season [42].
Hydrology 05 00039 g003
Figure 4. Map showing Nigeria, Niger Basin, Africa and the main inflow rivers (Niger and Benue).
Hydrology 05 00039 g004
Figure 5. Status of some hydrological gauging stations in Nigeria (F = Functional, NF = Non-Functional, Unknown).
Hydrology 05 00039 g005
Figure 6. Rainfall and streamflow data length variation in years from previous studies in Nigeria.
Hydrology 05 00039 g006
Figure 7. Flood studies in Nigeria showing specific application areas.
Hydrology 05 00039 g007
Figure 8. Remotely sensed data application in flood studies in Nigeria.
Hydrology 05 00039 g008
Figure 9. Radar (TerraSAR-X) and optical (MODIS) flood extent comparison at Lokoja, Nigeria.
Hydrology 05 00039 g009
Figure 10. Global Transboundary River Basins (source: Transboundary Freshwater Dispute Database).
Hydrology 05 00039 g010
Figure 11. Map of the transboundary Niger River Basin, showing constituting countries and Dams.
Hydrology 05 00039 g011
Figure 12. Jason-1/2/3/TP Altimetry Tracks within the Niger River Basin of West Africa.
Hydrology 05 00039 g012
Figure 13. Sentinel 3A/B Altimetry Tracks within the Niger River Basin of West Africa.
Hydrology 05 00039 g013
Figure 14. SWOT Altimetry Tracks within the Niger River Basin of West Africa.
Hydrology 05 00039 g014
Figure 15. Map showing International Disaster Charter Flood Activations (2000–2016) (Source: Disaster Charter). Blue markers represent single activation areas, while numbers represent areas of multiple activations.
Hydrology 05 00039 g015
Table 1. Flood mapping process and fundamental data requirements, outcomes and case studies.
ProcessDataOutcomesReference Case Studies
Flood frequency estimationHistorical data: River discharge, water levels and rating curves/equations.Flood magnitude at specific return periods (Direct and regional).[12,13,14,15]
Hydrodynamic modellingFlood frequency outcome River discharge Digital elevation model Land use and cover map Historical flood extent, and marks.Inundation Extent Water depth Flood velocity and travel time[16,17,18,19]
Flood risk and vulnerability assessmentHydrodynamic model outcomes, demographic, socio-economic and infrastructure data.Exposure maps Vulnerability maps Evacuation plan[19,20,21]
Table 2. Altimetry characteristics adapted from [43].
S/NMissionGround Footprint (m)Revisit Time (days)Operation TimelineAccuracy (m)References
1TOPEX/Poseidon~6009.91993–20030.35[46]
2ERS-1~5000351991–2000N/A[36]
3ERS-2~400351995–20030.55[46]
4ENVISAT~400352002–20120.28[46]
5Jason-1~300102002–20091.07[52]
6ICE Sat/GLAS~70-2003–20090.10[53]
7Cyrosat-2~3003692010 *<SRTM (30)[54]
8Jason-2~300102008 *0.28[52]
9SARAL/Altika~173352013 *0.11[55]
10Sentinel 3 SRAL~300272016 *0.03[36]
11Jason-3~300102016 *0.03[56]
12SWOT~10–70212020 +0.10[57]
S/N = Sequential Number; Current = *, Future = +, SRTM = Shuttle Radar Topography Mission
Table 3. Open source digital elevation models properties and case studies.
DEMSpatial Resolution (m)Vertical Error (m)Case StudyReference
SRTM30, 90±16Damoda River, India.[69,125]
ASTER GDEM30±25Lake Tana, Ethiopia.[126,127]
ACE 2 GDEM1000>10Balkan Peninsula, Croatia[128]
GTOPO3010009–30Balkan Peninsula, Croatia[128]
ALOS30±5Sindh and Balochistan, Pakistan[120,129]
GMTED201025026–30Shikoku, Japan.[130,131]
Table 4. Globally available Modified SRTM DEM properties and case studies.
DEMSpatial Resolution (m)Vertical Error (m)Case StudyReference
Bare-Earth SRTM (Veg/Urban)906.05–12.64Belize, Honduras[86]
Bare-Earth SRTM (Veg)904.85–8.667Global[87]
EarthEnv-DEM90904.13–10.55Johor River Basin, Malaysia[141,142]
MERIT DEM90±2Nile Basin, Congo and Ob rivers[140]
Table 5. SRTM and Modifications comparison with ICE Sat/GLAS altimetry elevation.
ElevationMinMaxMeanStd. Dev.R2RMSE
Bare-Earth SRTM (Urban and Veg)−3.89151.0029.6537.660.993.21
Bare-Earth SRTM (Veg)0.35151.1829.7237.720.992.96
EarthEnv903.00152.0030.9537.450.993.76
MERIT DEM−1.27148.4428.9637.710.993.68
Raw-SRTM2.00153.0030.3337.480.993.27
ICE Sat/GLAS0.30148.3530.2837.64--
Std. Dev. = standard deviation, R2 = Correlation coefficient, Numbers of data Points = 522
Table 6. Optical and radar satellite imageries case studies.
Sat. ImageryRes. (m)Case StudyReferences
Landsat30Floodplain inundation delineation for 2 and 1–dimensional model calibration and validation, Inner Niger and Missouri River, Nebraska, USA[114,163]
MODIS200Hydrodynamic model calibration and validation.[113,164]
Terra ASTER15Urban sprawl and flood management Dhaka, Bangladesh[113,164]
Sentinel-110Sentinel-1 and Landsat-8 combination in mapping flooding at river Evros, Greece[113,164]
Sentinel-210Water bodies delineation[113,164]
Sat. = Satellite, Res = Spatial resolution
Table 7. Niger River Basin Agreement, Nigeria. Adapted from [207,225,226].
S/NTreatyFunctionLocationYear
1Act regarding navigation and economic co-operation between the states of the Niger Basin. Navigation and Joint managementNiamey, Niger1963
2Agreement concerning the River Niger Commission and the navigation and transport on the River Niger.Navigation, Joint management, information exchangeNiamey, Niger1964
3Agreement Revising the Agreement Concerning the Niger River Commission and the Navigation and Transport on the River Niger.Navigation, Joint management, information exchangeNiamey, Niger1973
4Convention Creating the Niger Basin Authority (NBA)Water resource mgt. coordinationFaranah, Guinea1980
5Protocol relating to the Development Fund of the Niger BasinPlanning funds for NBAFaranah, Guinea1982
6Agreement between Nigeria and MaliCo-operation on water resource use in the Niger-1988
7Agreement Nigeria and the Republic of Niger concerning the equitable sharing in the development, conservation and use of their common water resourcesEnvironmental conservation and water resource managementMaiduguri1990
8Nigeria-Cameroon Protocol AgreementCoordinate dam water release.-2000
9Niger Basin Water Charter.NBA review and update.Niamey, Niger2008
10African Risk CapacityWeather financial risk managementPretoria, South Africa2012
Table 8. Summary of the Copernicus Emergency Management Service (EMS)-Mapping Activations.
Type of DisasterNumber of ActivationsNumber of Reference MapsNumber of Delineation Maps
Earthquake98331
Flood71358692
Forest fire, wildfire214798
Industrial accident5123
Other55218143
Wind storm148045
Total1757981012

