1. Introduction
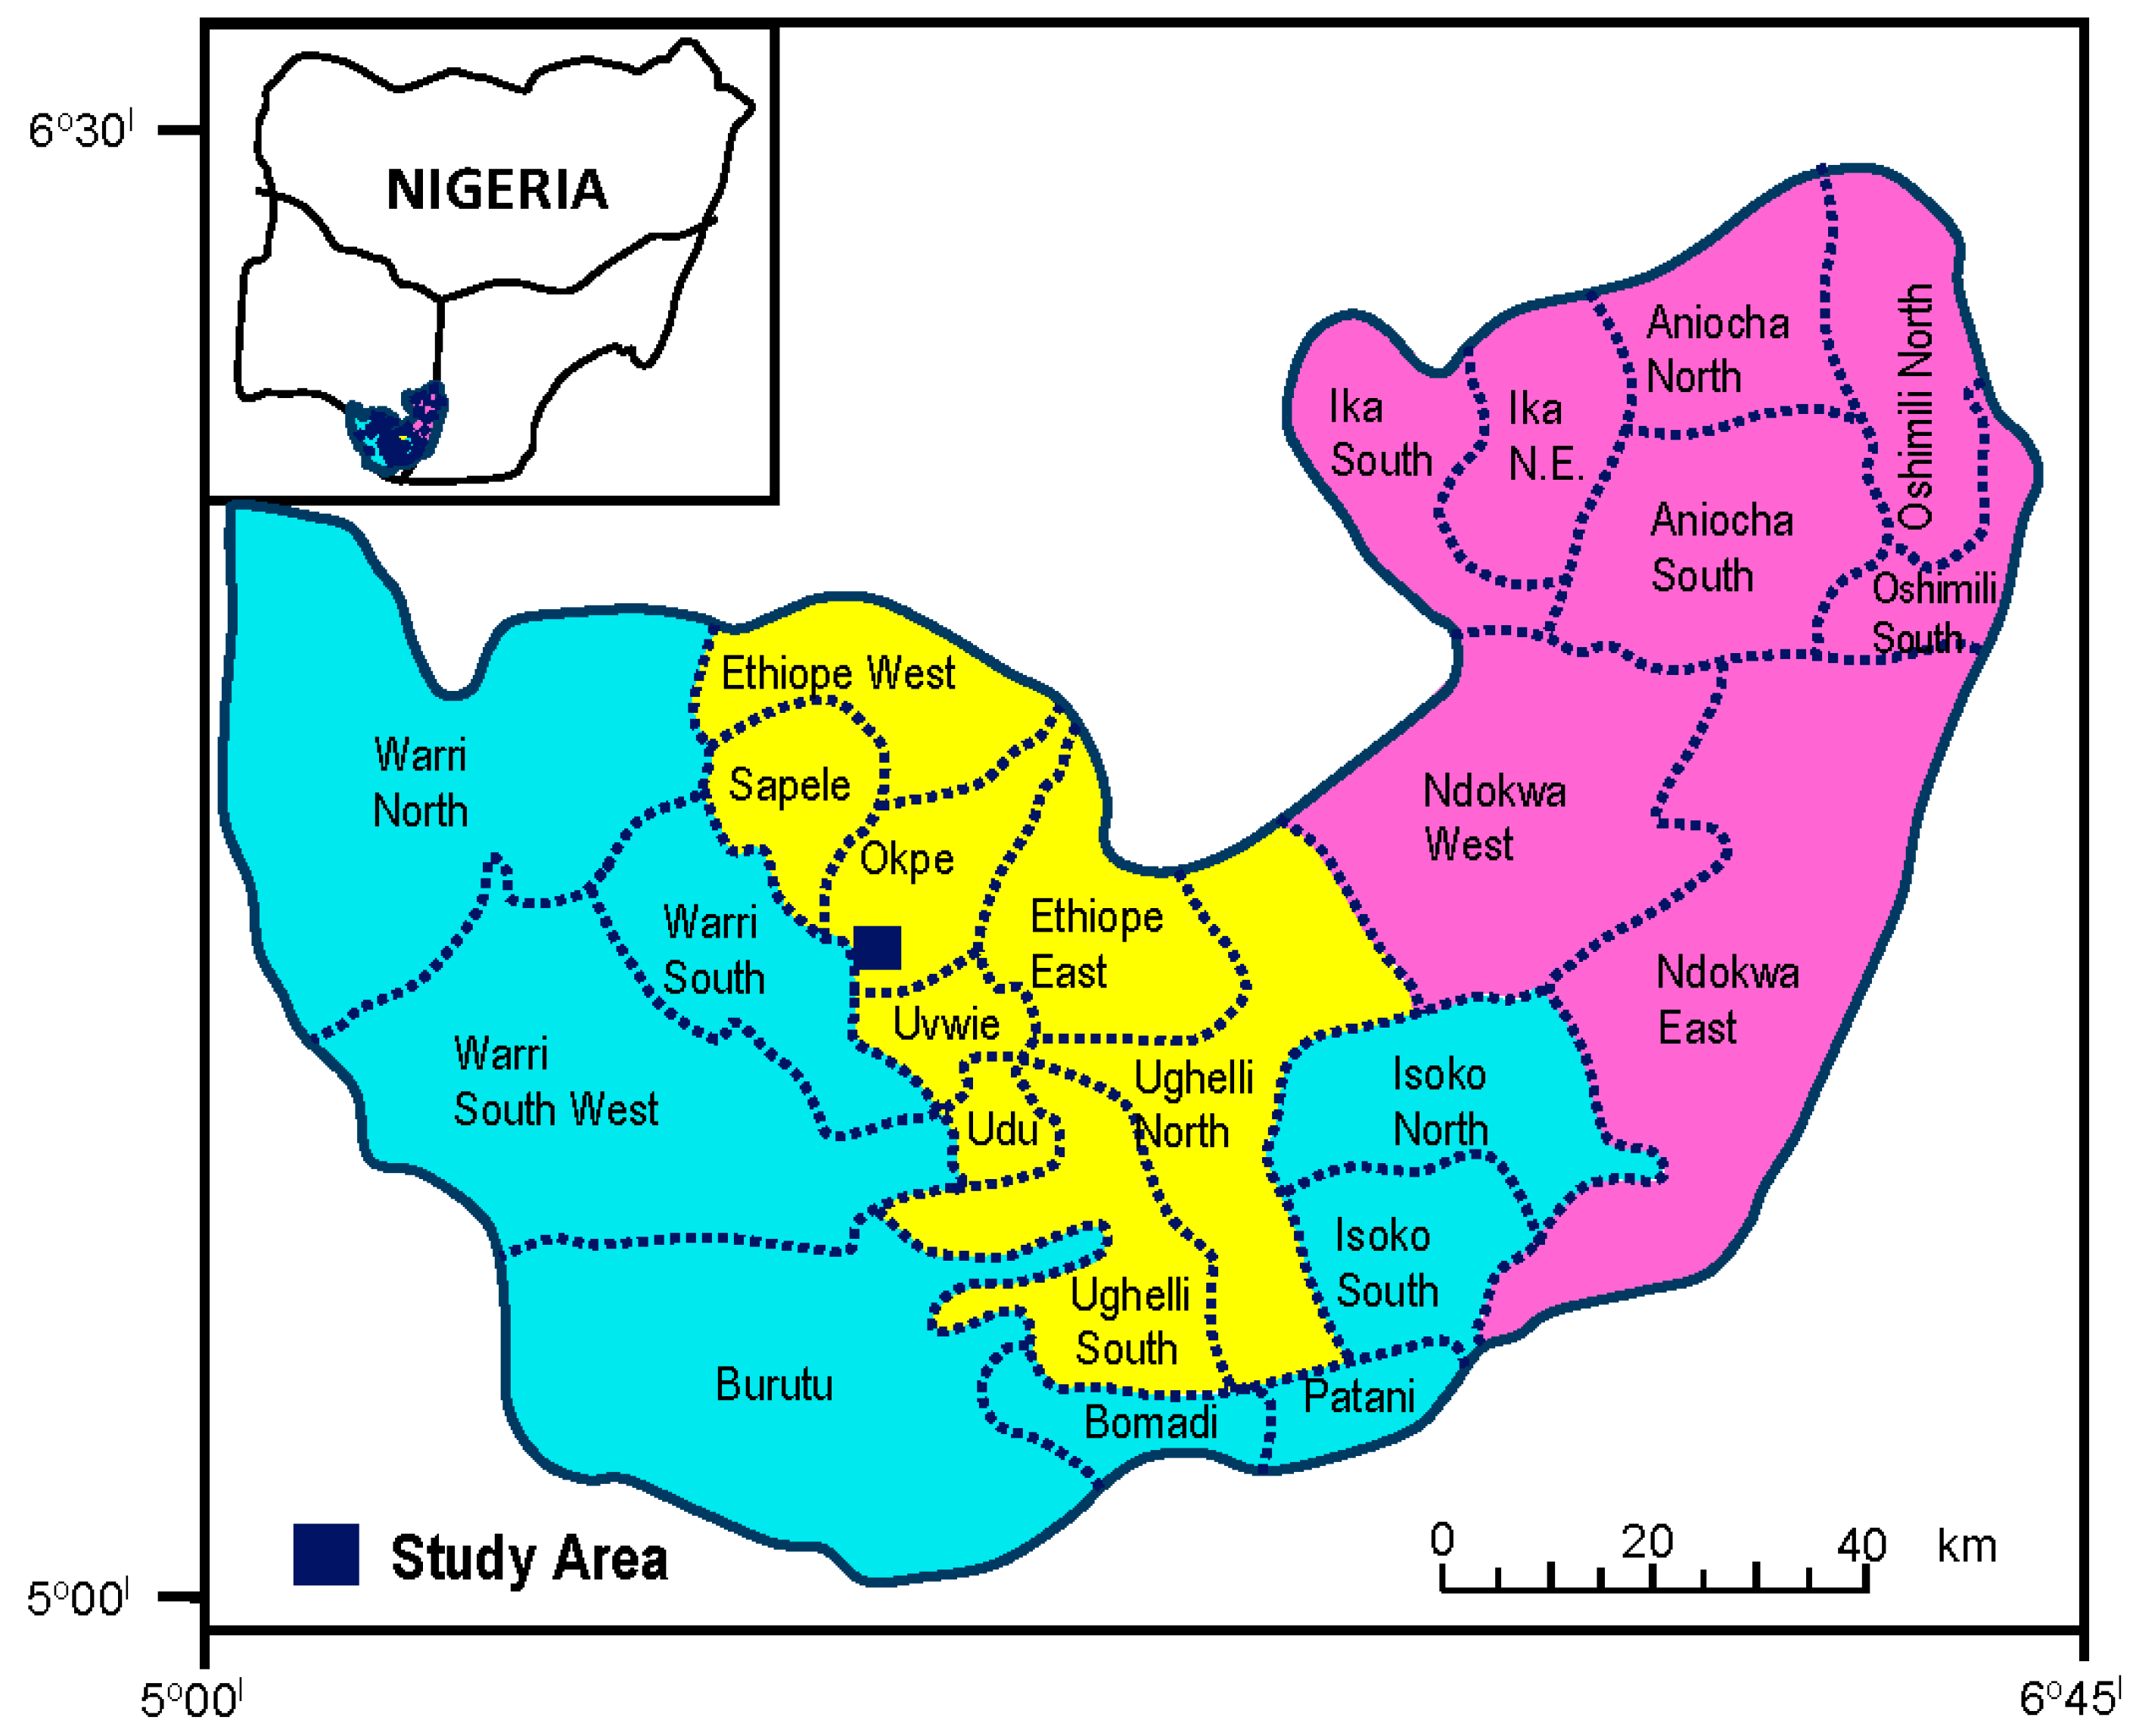
Jeddo, the study area, is in the western part of the Niger Delta region of Delta State, Nigeria. It has altitude of about 23 m, an elevation of about 3–12 m above sea level and it is about 437 km south-west of the country’s capital city, Abuja. It lies between latitude 5.583° N and 5.600° N and longitude 5.710° E and 5.716° E (
Figure 1). The area is characterized by tropical equatorial climate with a mean annual temperature of 32.8 °C and an annual rainfall of 2673.8 mm [
1]. It is an established fact that the annual temperature and amount of rainfall is highly variable from year to year [
2]. The region has witness an influx of people in recent times due to its proximity to the Warri Refinery and Petrochemical Company (WRPC), resulting in an ever-rising demand for water. Municipal water supply is not available in the community, thus several water wells have been drilled by individuals without preliminary geophysical, geological, and hydrogeological investigation, in search of potable drinking water.
The lithological identification of the subsurface and underground water characteristics of an area can be effectively determined by drilling of several boreholes and interpretation of the soil and water samples collected. This is both cost- and labor-intensive. Today however, great emphasis is placed on planned exploration and utilization of water resources which is a non-invasive, relatively cheap and quantitative technique. This exploration requires the use of various geophysical, hydrogeological and geochemical methods such as seismic, electromagnetic, magnetic, ground probing radar, and electrical resistivity methods among others.
The surface electrical resistivity method uses various techniques and instruments in its investigation and is useful in determining the thickness and resistivity distribution of the subsurface [
3]. The technique measures the properties of an earth material, which are related to hydraulic parameters. The success of the method is due to the variation of conductivity within the earth’s subsurface layers, which in turn affects the distribution of electric potential. The degree of this effect depends on the shape, size, location and bulk electrical resistivity of the subsurface layers. The bulk electrical resistivity depends on the mineralogy of the rocks and its contained fluids [
4].
The use of electrical methods applied to environmental studies is well documented by many geophysicists [
5,
6,
7,
8,
9,
10,
11,
12,
13,
14,
15,
16]. This paper provides a geoelectrical (resistivity) method for parameter estimation as complimentary/alternative approach to direct methods and is aimed at estimating the lithology, resistivity, longitudinal conductance and transverse resistance, hydraulic conductivity, transmissivity, direction of underground water flow, and protective capacity of the aquifer in Jeddo, located within the Niger Delta basin. It also includes results of water analysis carried out to ascertain the geochemical composition of the underground water.
2. Geology of Study Area
The subsurface geology of the Niger Delta Basin to which Jeddo belongs is well established [
17,
18,
19,
20]. The basin fill is made up of three formations, namely the Benin, Agbada and Akata Formations, from the youngest to oldest. The continental Miocene–Recent Benin Formation conformably overlies the Agbada Formation. Its lithologic composition is 90% sand and about 10% clay and lignite bed [
17]. The sands range in size from gravelly, coarse- to fine-grained. They are also poorly-sorted, sub-angular to well-rounded, and bear lignite streaks and wood fragments. Its porosity, which decreases with depth, ranges from 15 to 31% in the basin [
21]. It has numerous prolific aquifers. The Agbada Formation conformably overlies the Akata Formation in the subsurface. It is a parallic sequence of alternating shale and sandstone with a variable age ranging from Eocene to Pliocene/Pleistocene and Recent in the Delta surface. The Akata Formation, also known as marine shale ranges from Paleocene to Holocene in age and is composed of shale, silts, clay and turbidity sand at the base of the Delta sequence. The shale is believed to be over pressured and highly compacted [
18].
3. Methodology
Many investigative techniques are commonly employed in estimating the spatial distribution of aquifer parameters [
5,
6,
7,
8,
9,
10,
11,
12,
13,
14,
15,
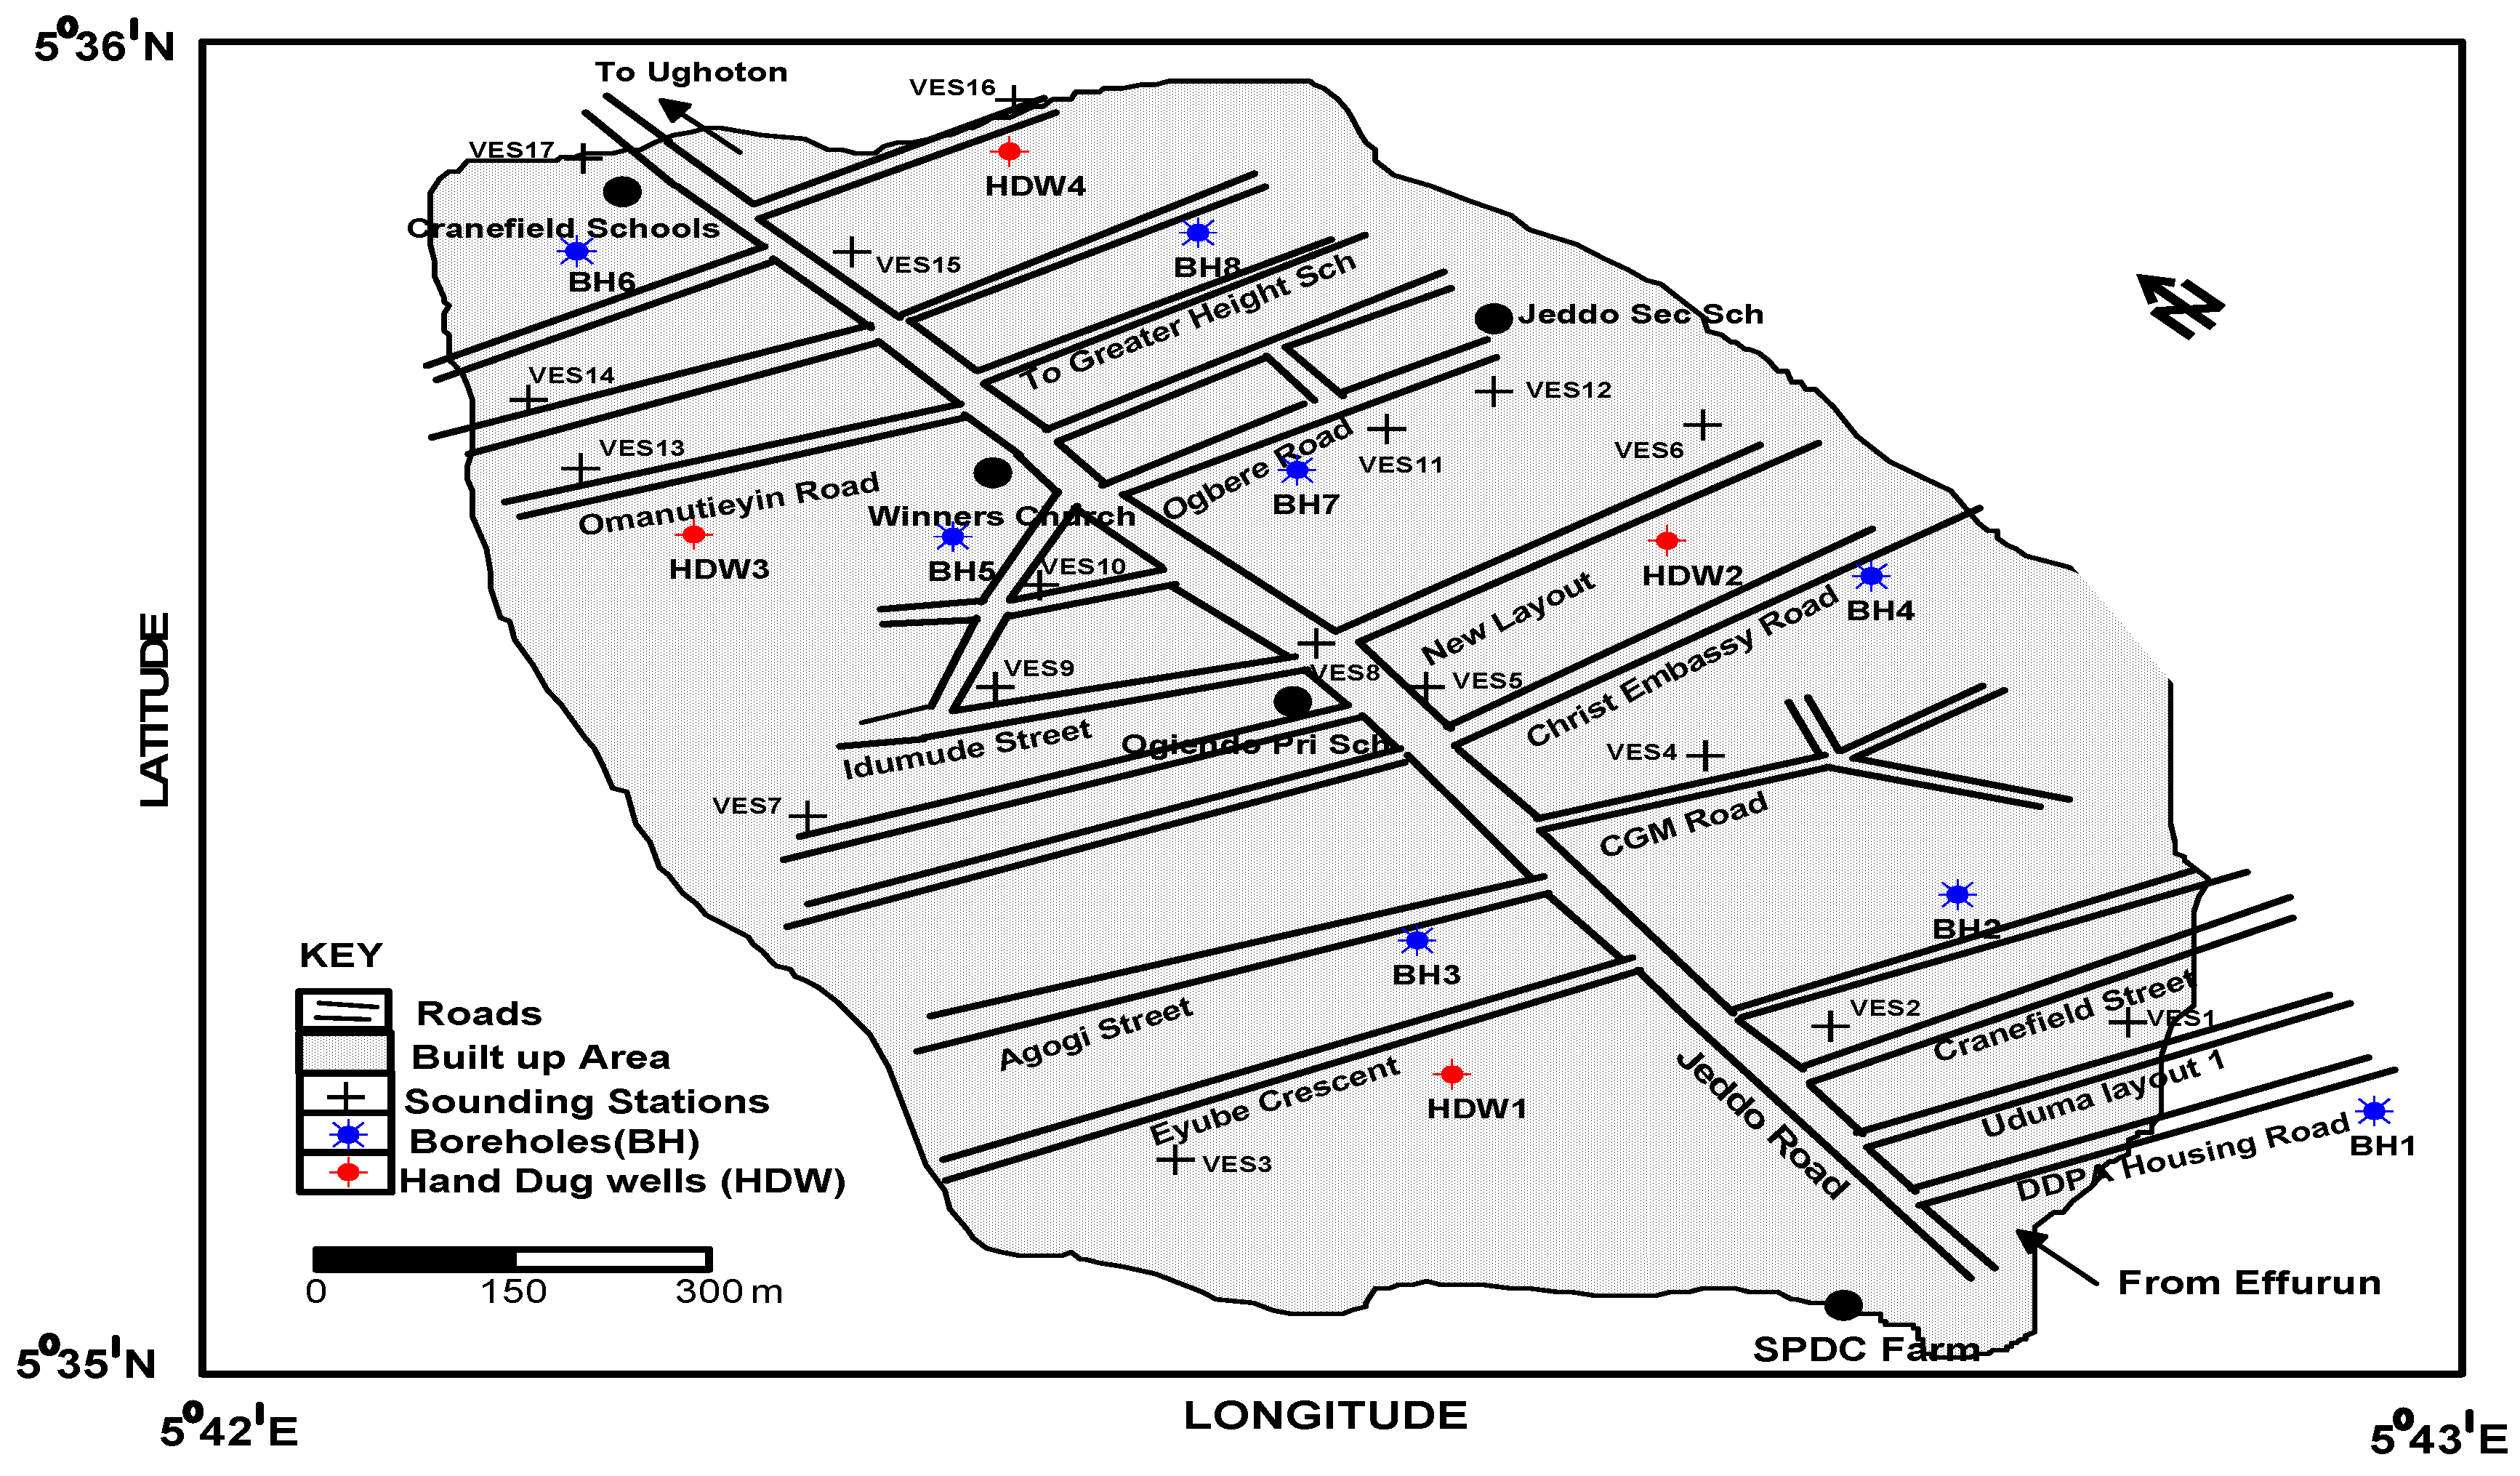
16]. In this research work, the Allied Ohmega Terrameter was used to obtain seventeen vertical electrical soundings (VES) in order to establish the characteristics of the aquifers in the study area. The VES locations are as shown in
Figure 2.Interpretation of VES results was done using the RESIST software, which is an iterative inversion-modeling program. Analysis of the resulting apparent resistivity versus the half-current electrode separations were used to obtain the earth models composed of individual layers of specified thickness (h) and apparent resistivity (
ρ) from which the longitudinal conductance (S
L = h/
ρ unit Ω
−1), transverse resistance (R = h
ρ unit Ωm
2) and transmissivity (T = Kh, unit m
2/s) were calculated.
Several groundwater surface maps contoured using Surfer 8 software were used for analysis. Hydrogeochemical analysis was also carried out on water samples collected from existing hand dug wells and boreholes in the study area to predict the quality of the underground water. The water samples are Grab samples collected from various hand dug wells and boreholes using new one-liter bottle and analyzed in the Analytical Laboratory of the Department of Chemistry, Delta State University, Abraka, Nigeria.
4. Results and Data Analysis
4.1. Geoelectric Model
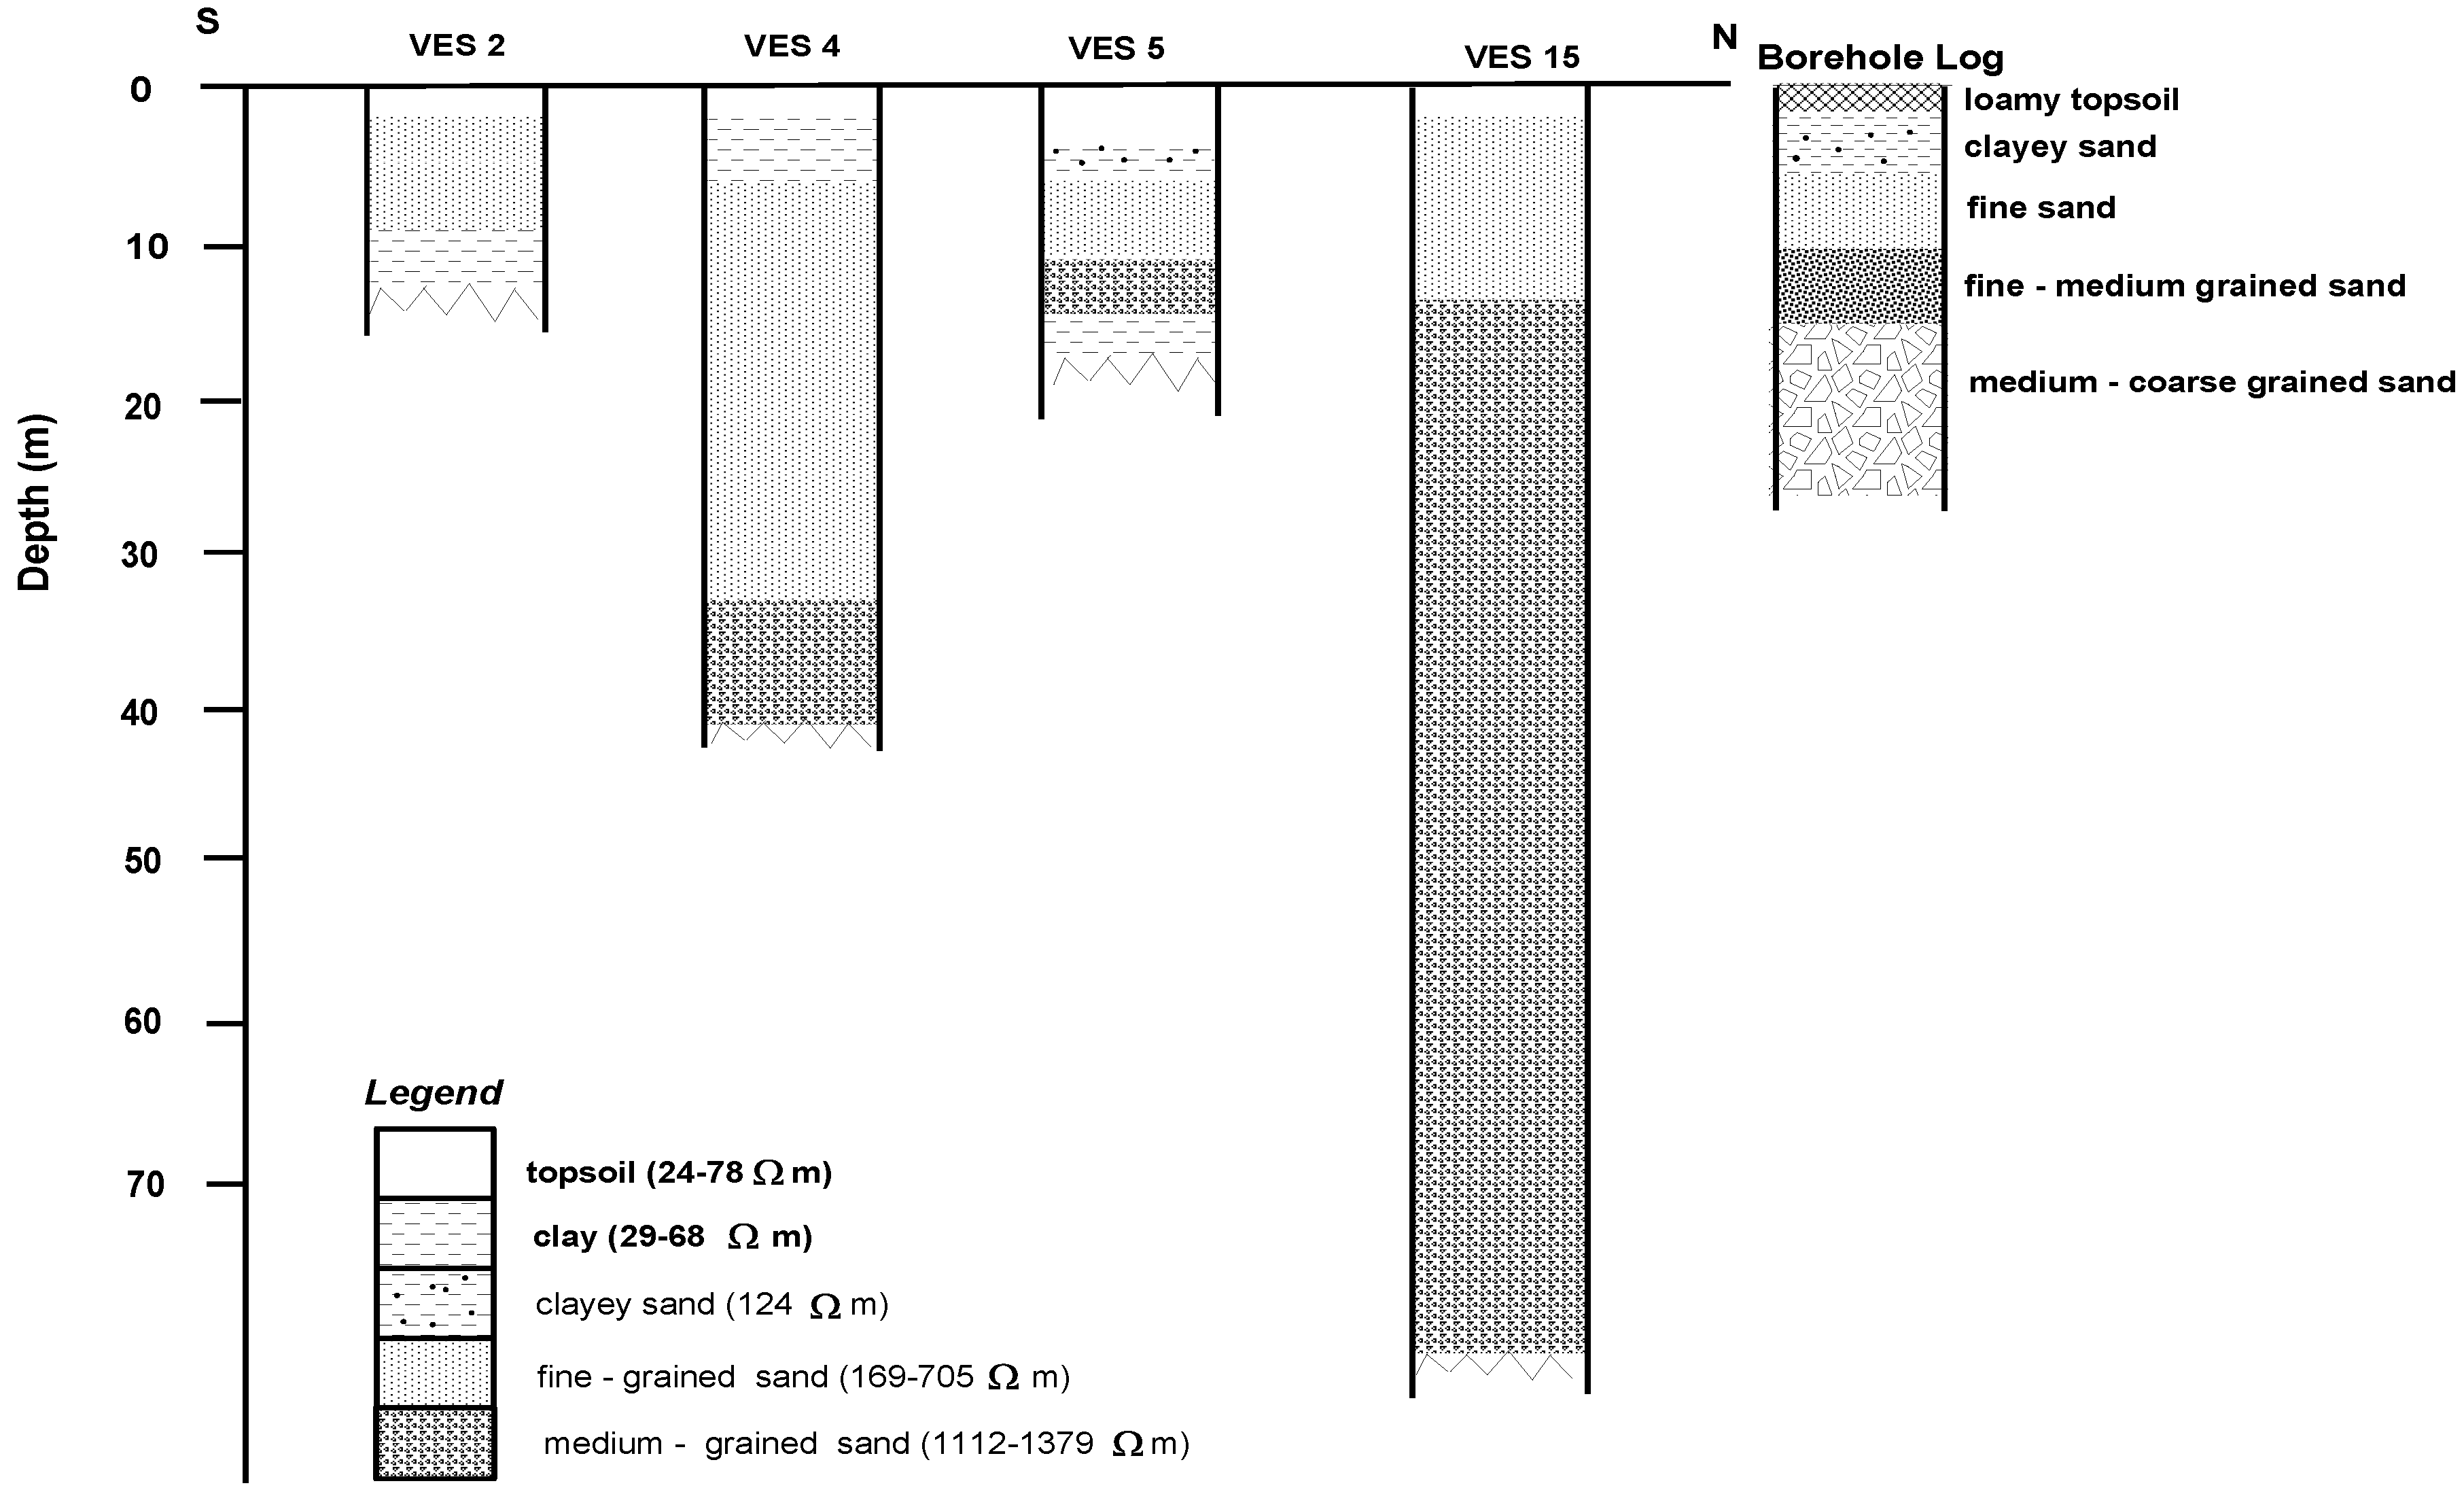
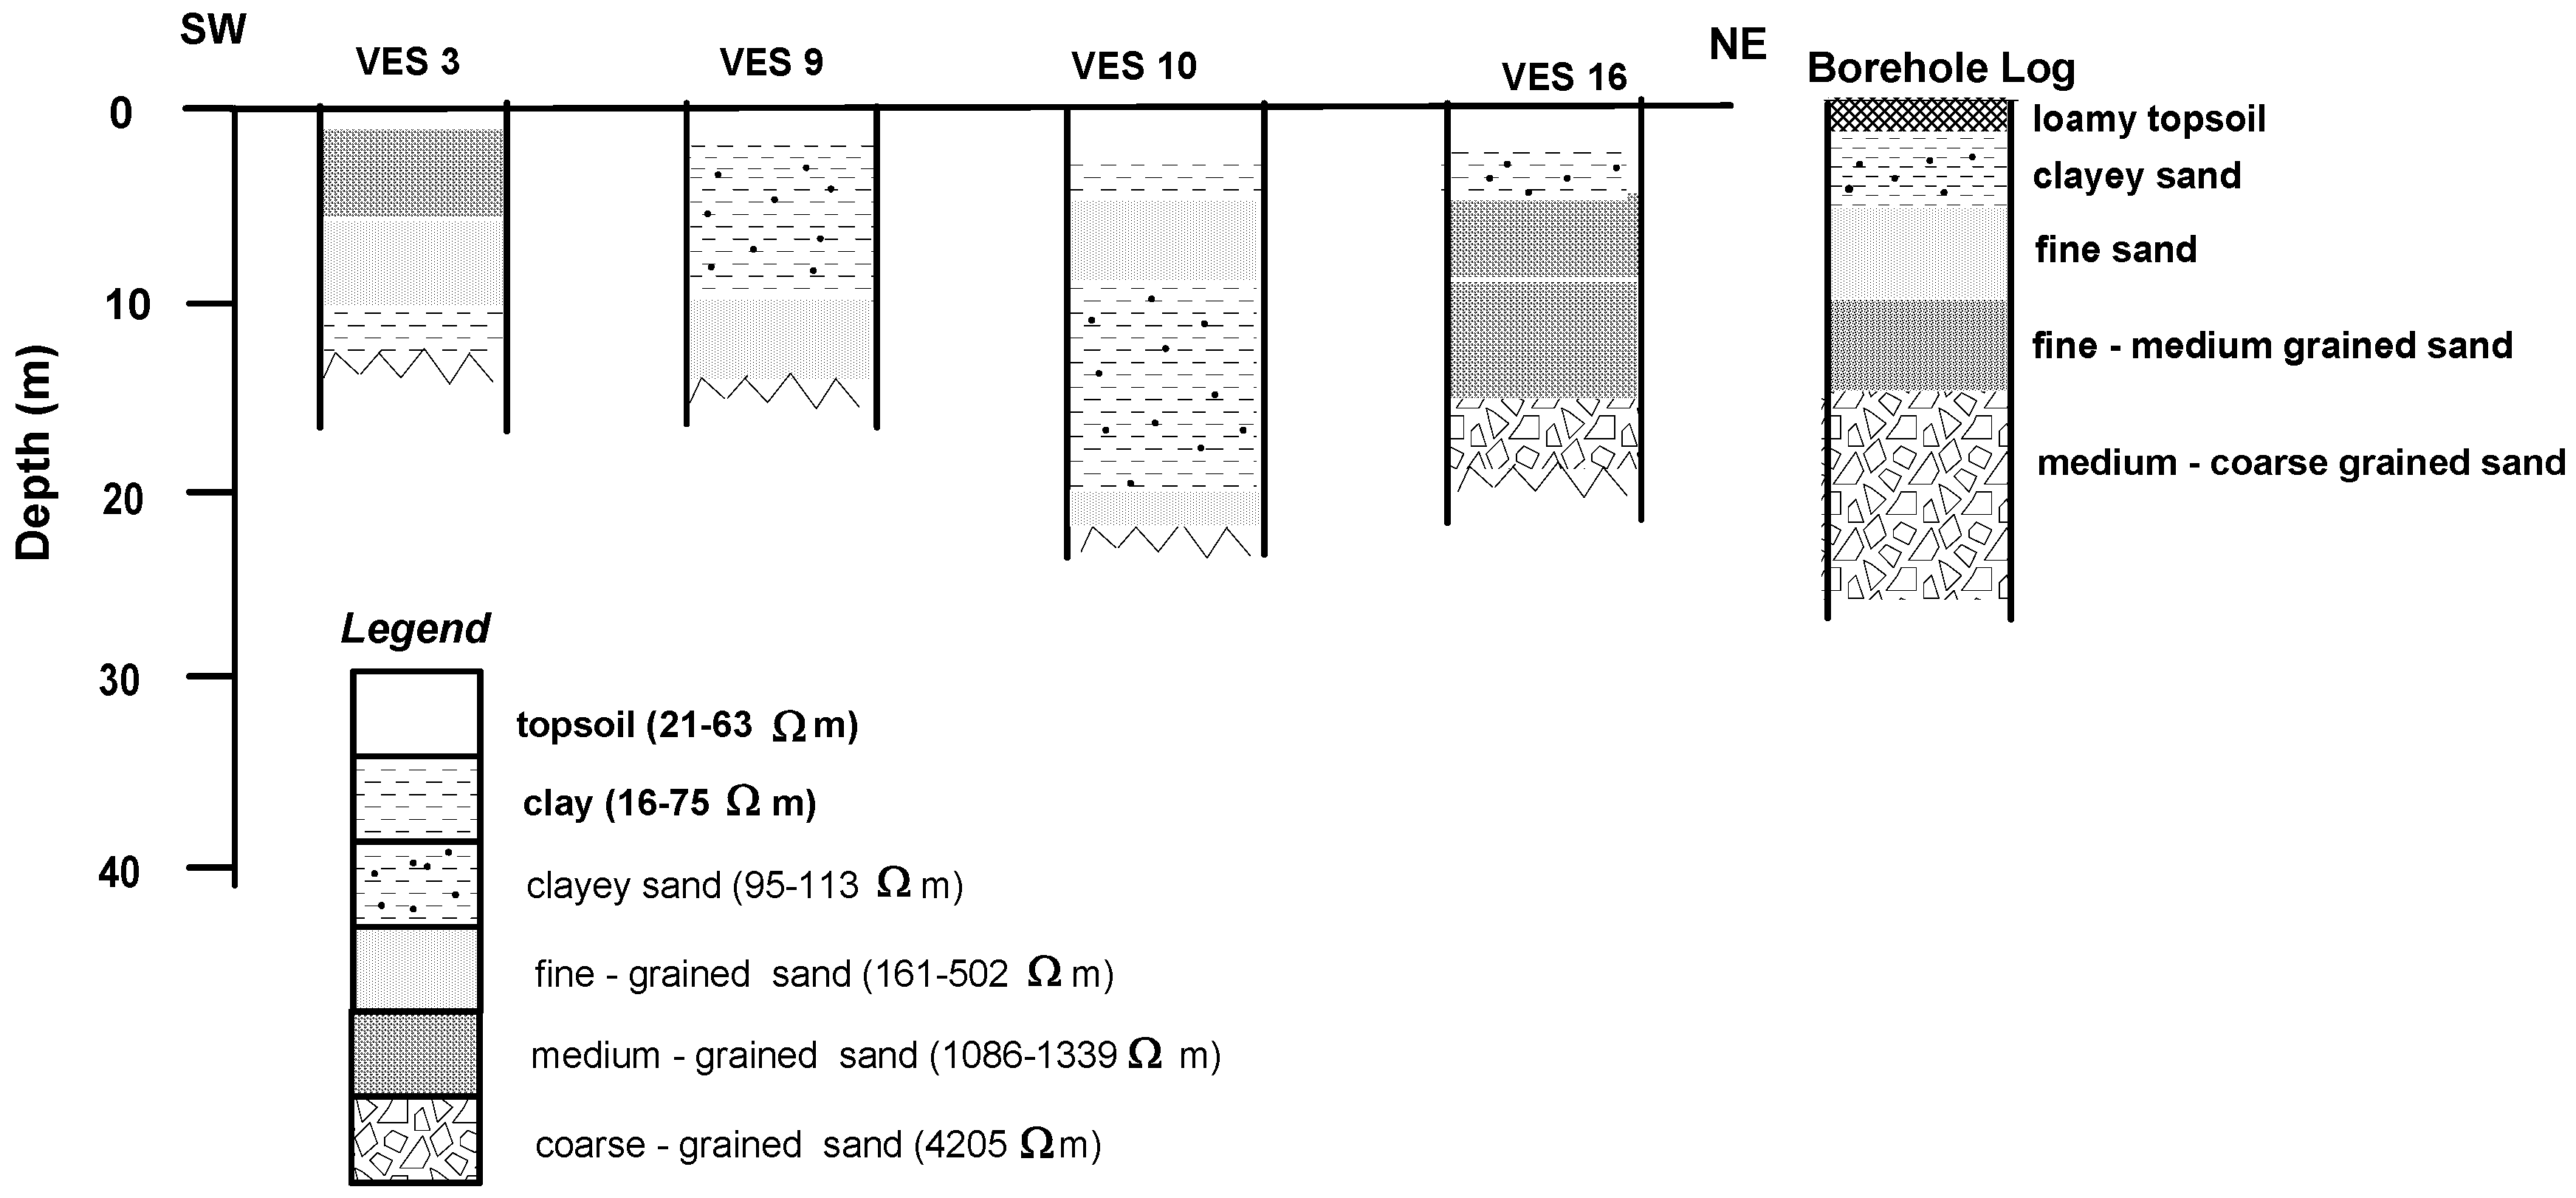
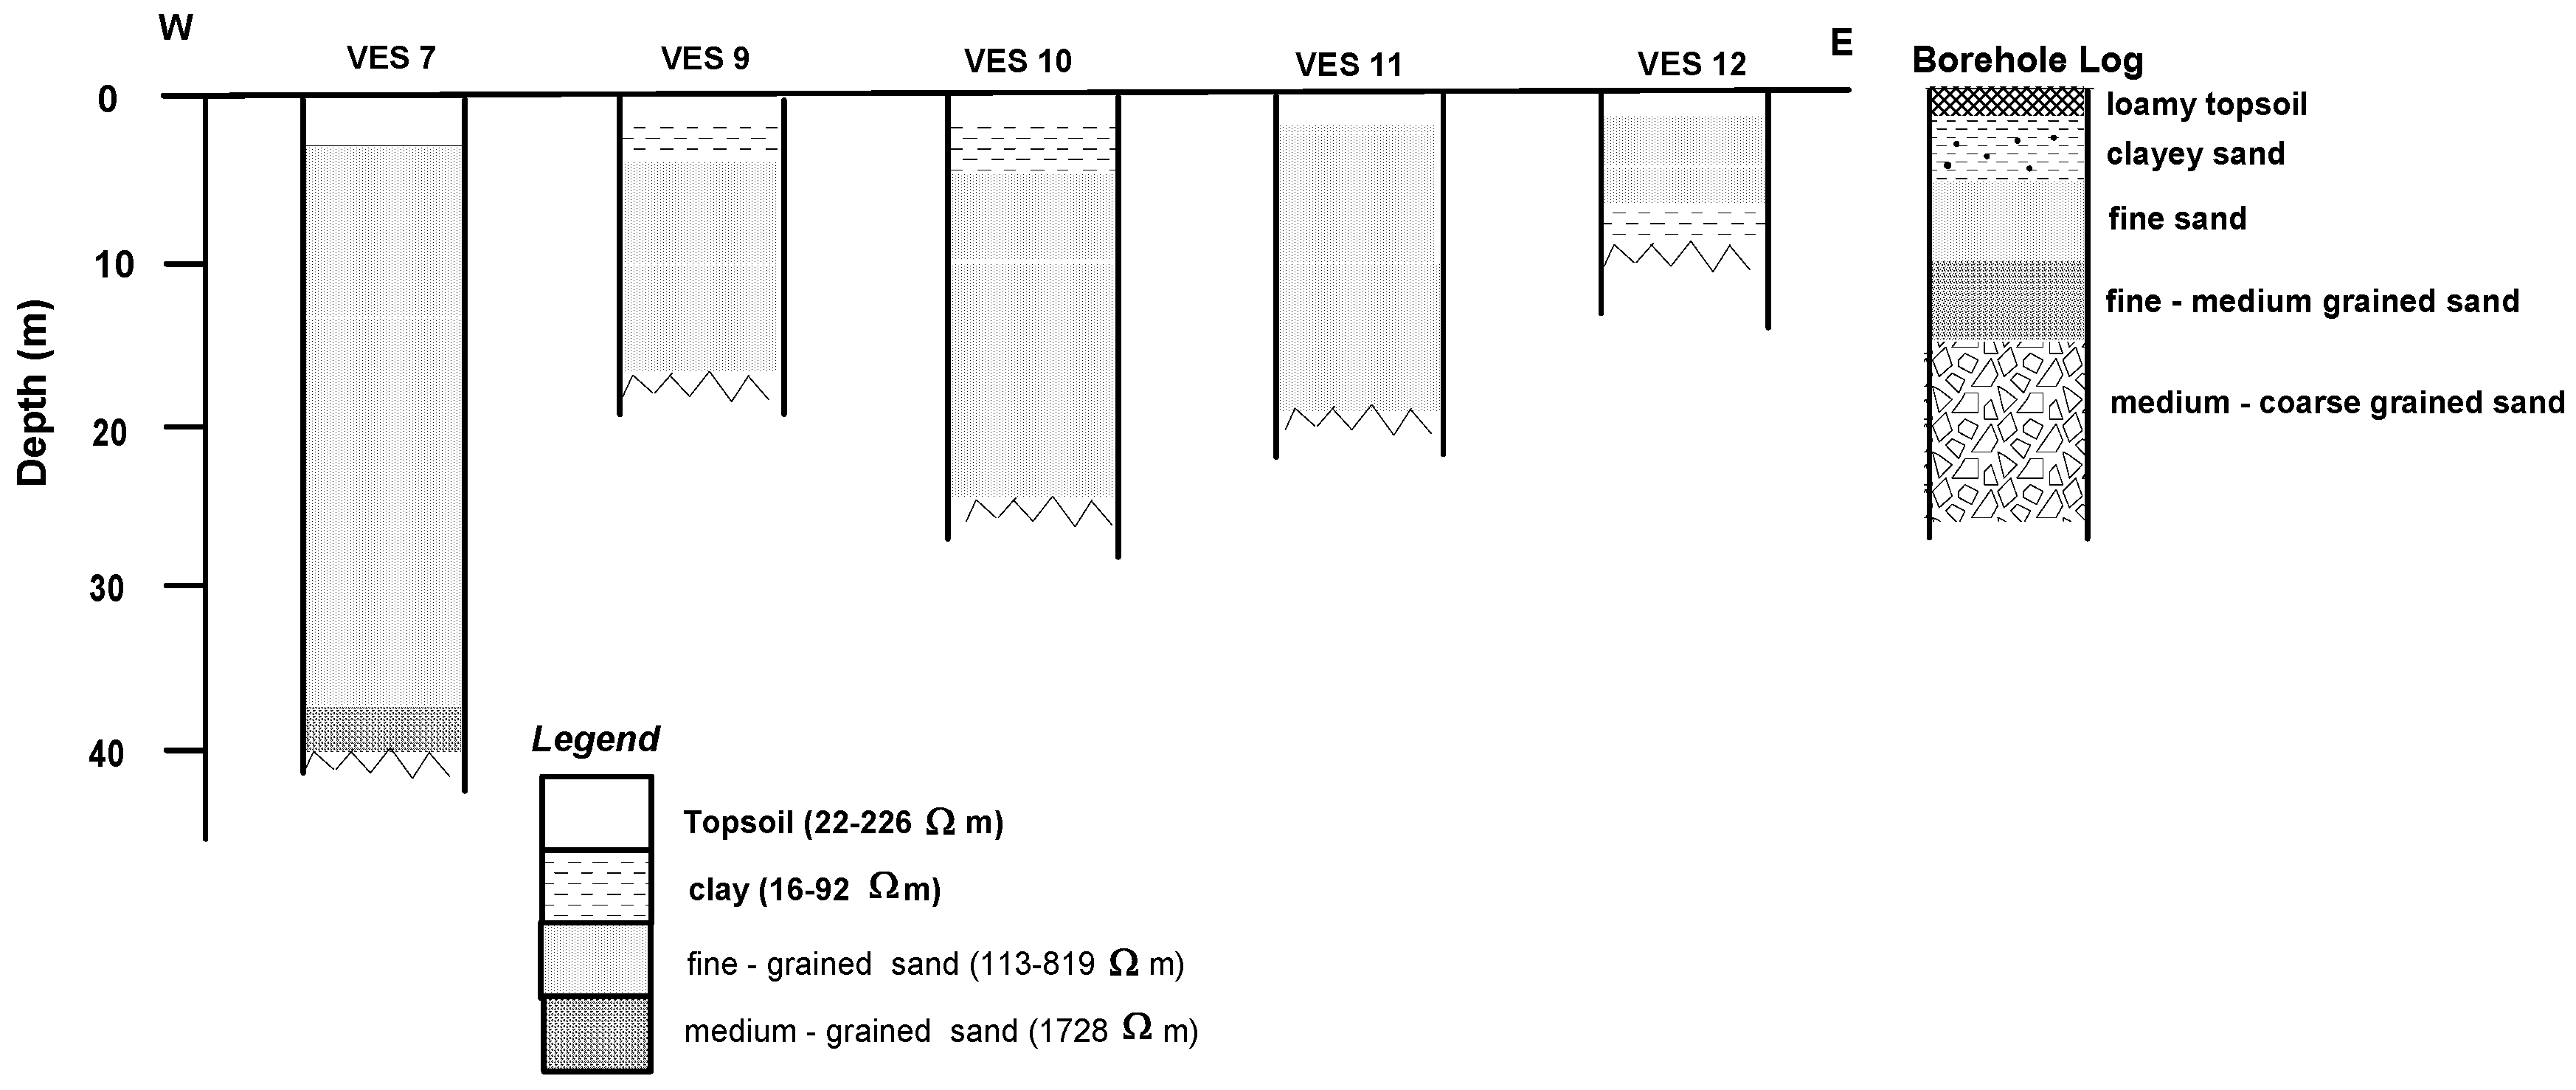
To reveal the geologic sections in various parts of the study area, geoelectric sections based on the interpretation of VES results (
Table 1) were generated as shown in
Figure 3,
Figure 4 and
Figure 5. The depth to water table was determined (ranging from 1.5 m to 35 m with an average aquifer depth of 12.7 m) and two sediments (unsaturated and saturated) identified. The unsaturated sediments consist of topsoil with resistivity values varying from 21 to 226 Ωm. The location studied shows a sequence of saturated sediment consisting of clay layers (16 ≤
ρ ≤ 92 Ωm) for VES 2, 3, 4, 5, 10 and 12, while clayey sand layers (95 ≤
ρ ≤ 113 Ωm) were identified for VES 5, 9, 10 and 16. Fine- to medium-grained sand (113 ≤
ρ ≤ 1728 Ωm), indicating the presence of productive aquifers in the area, was also identified in all VES. Coarse sand encountered in VES 6 has a resistivity of 4205 Ωm.
4.2. Aquifer Protective Capacity
The hydrogeological characteristics of a site useful in the simulation of groundwater flow and in evaluating overburden protective capacity and transmissivity of an area are the Dar-Zarrouk parameters (i.e., longitudinal conductance
SL, and transverse resistance
R) [
22].
The longitudinal conductance
SL, which is regarded as the medium’s ability to retard and filter percolating fluid is considered as the protective capacity of the overburden and expressed as,
It can also be expressed as
where
σi is the layer conductivity analogous to the layer transmissivity
T,
The total transverse resistance
R is given by,
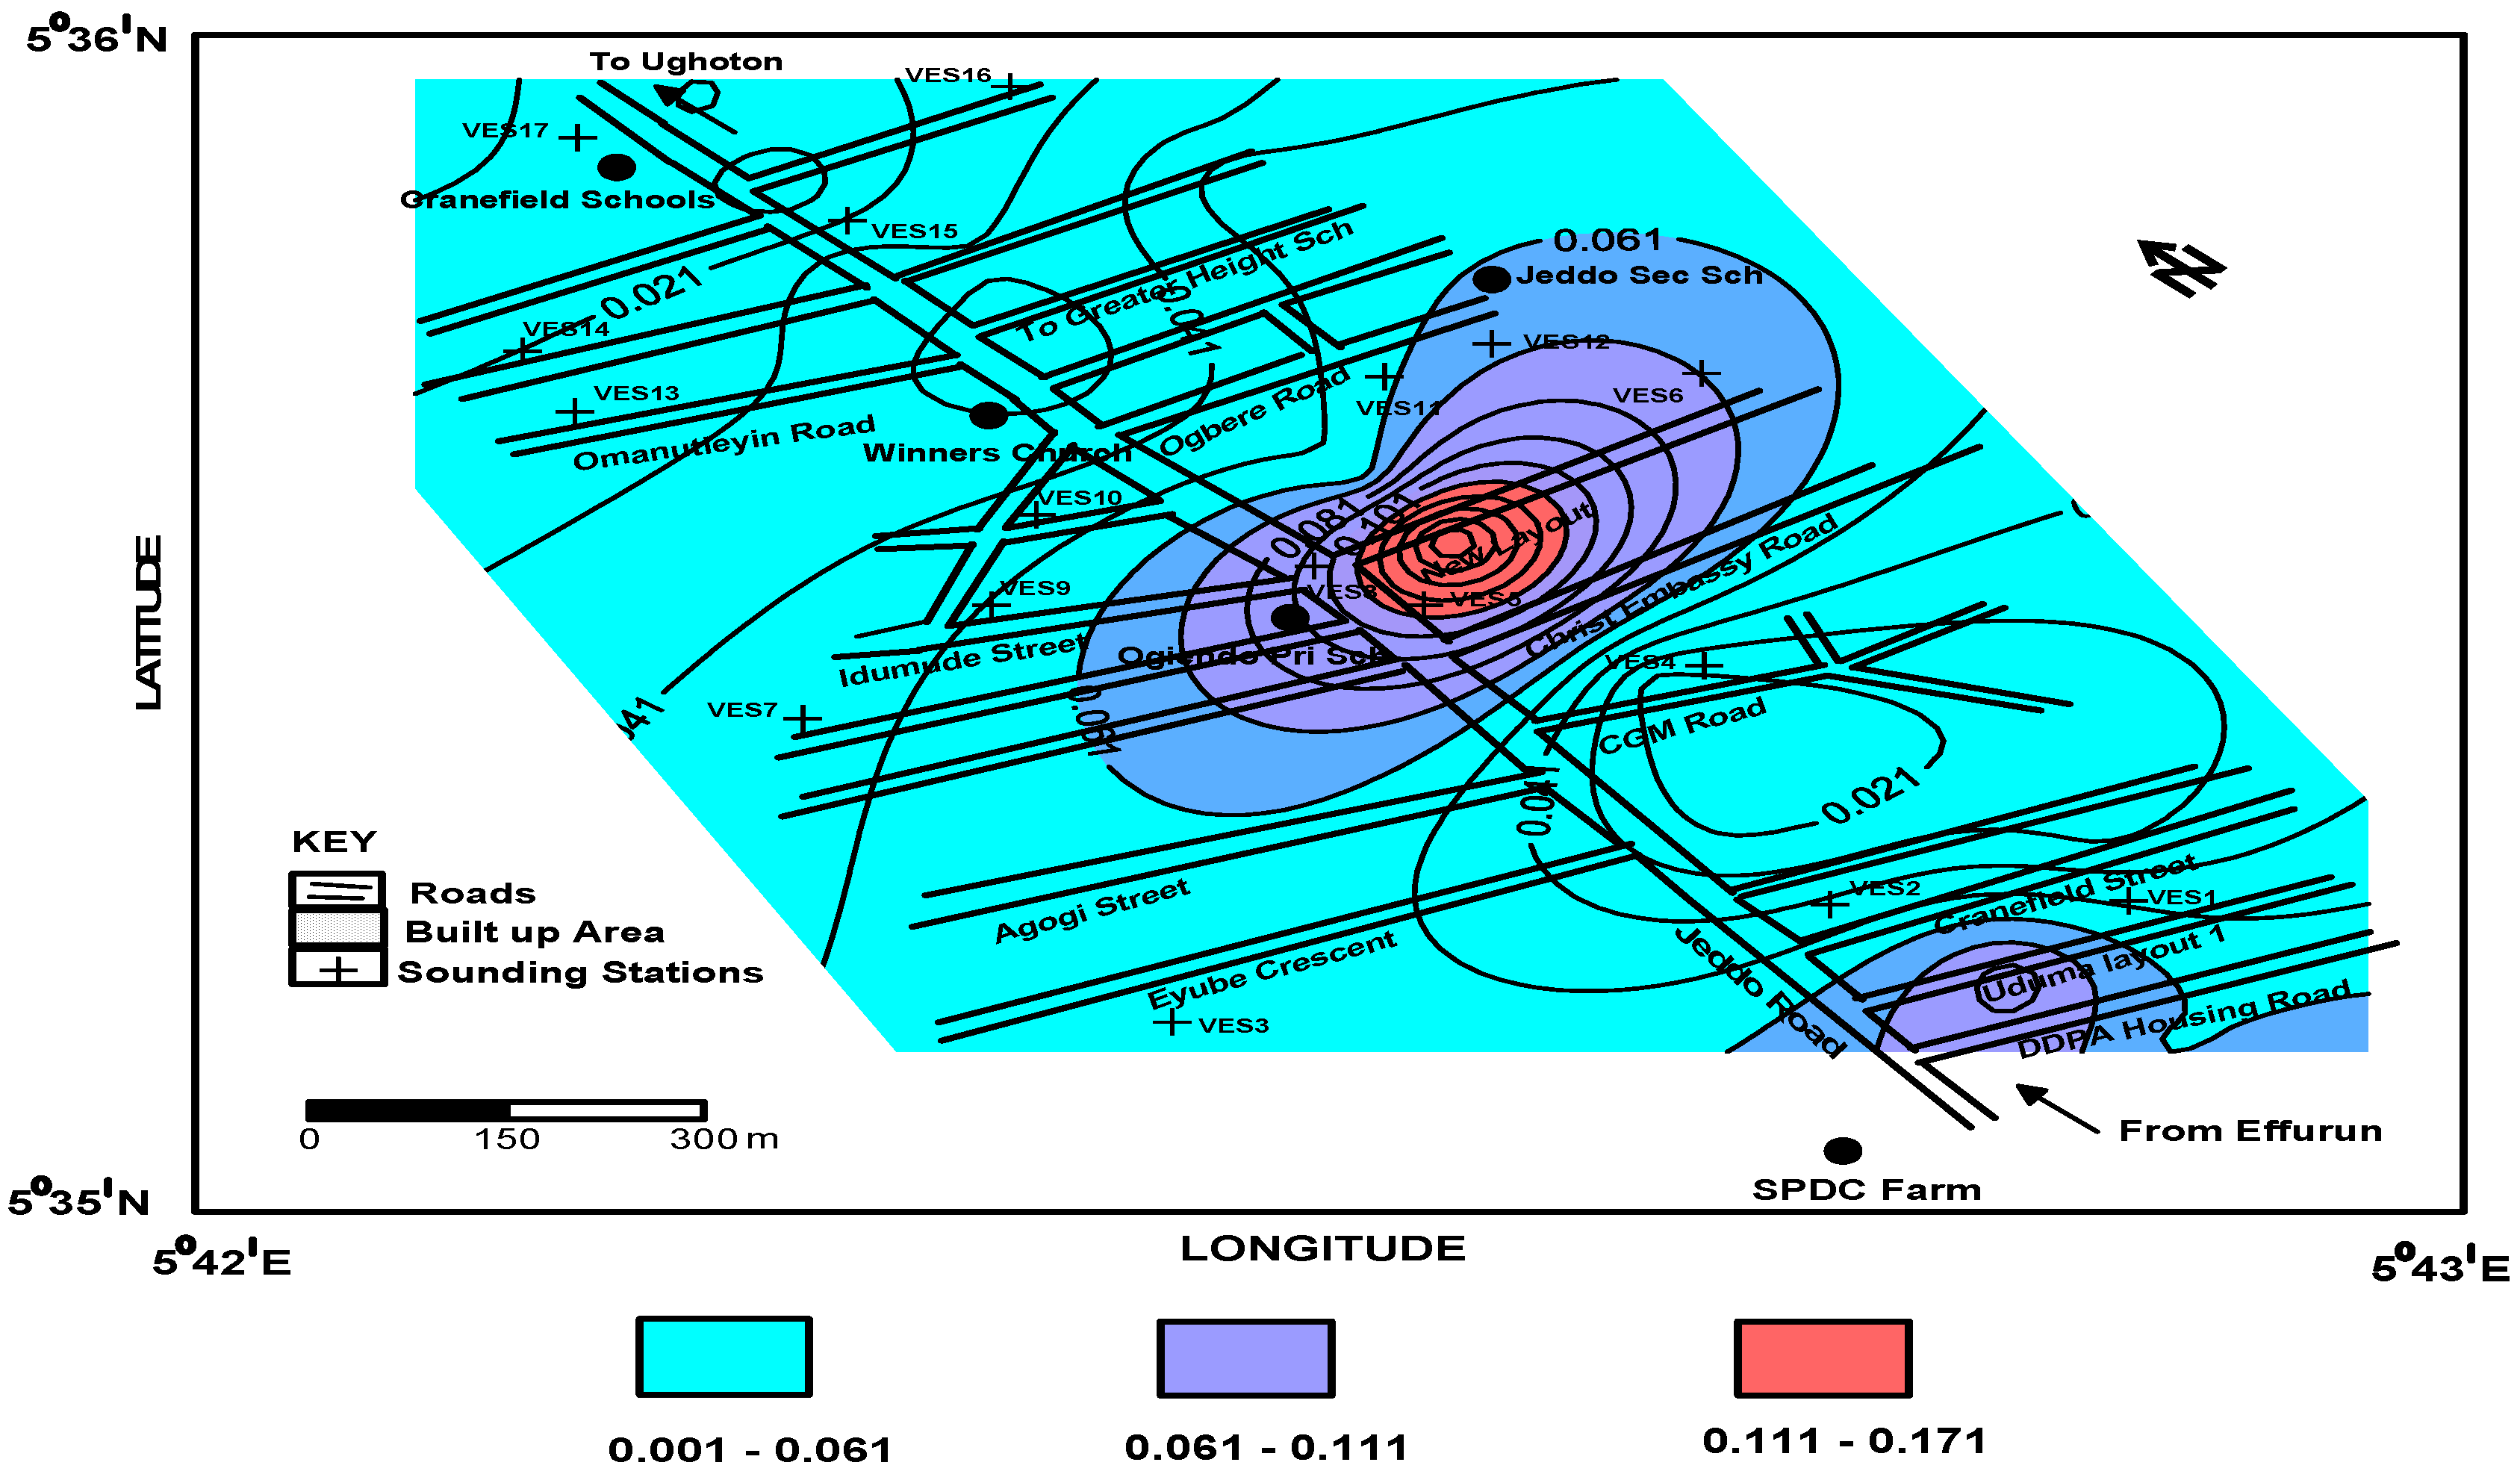
The derived longitudinal conductance values in
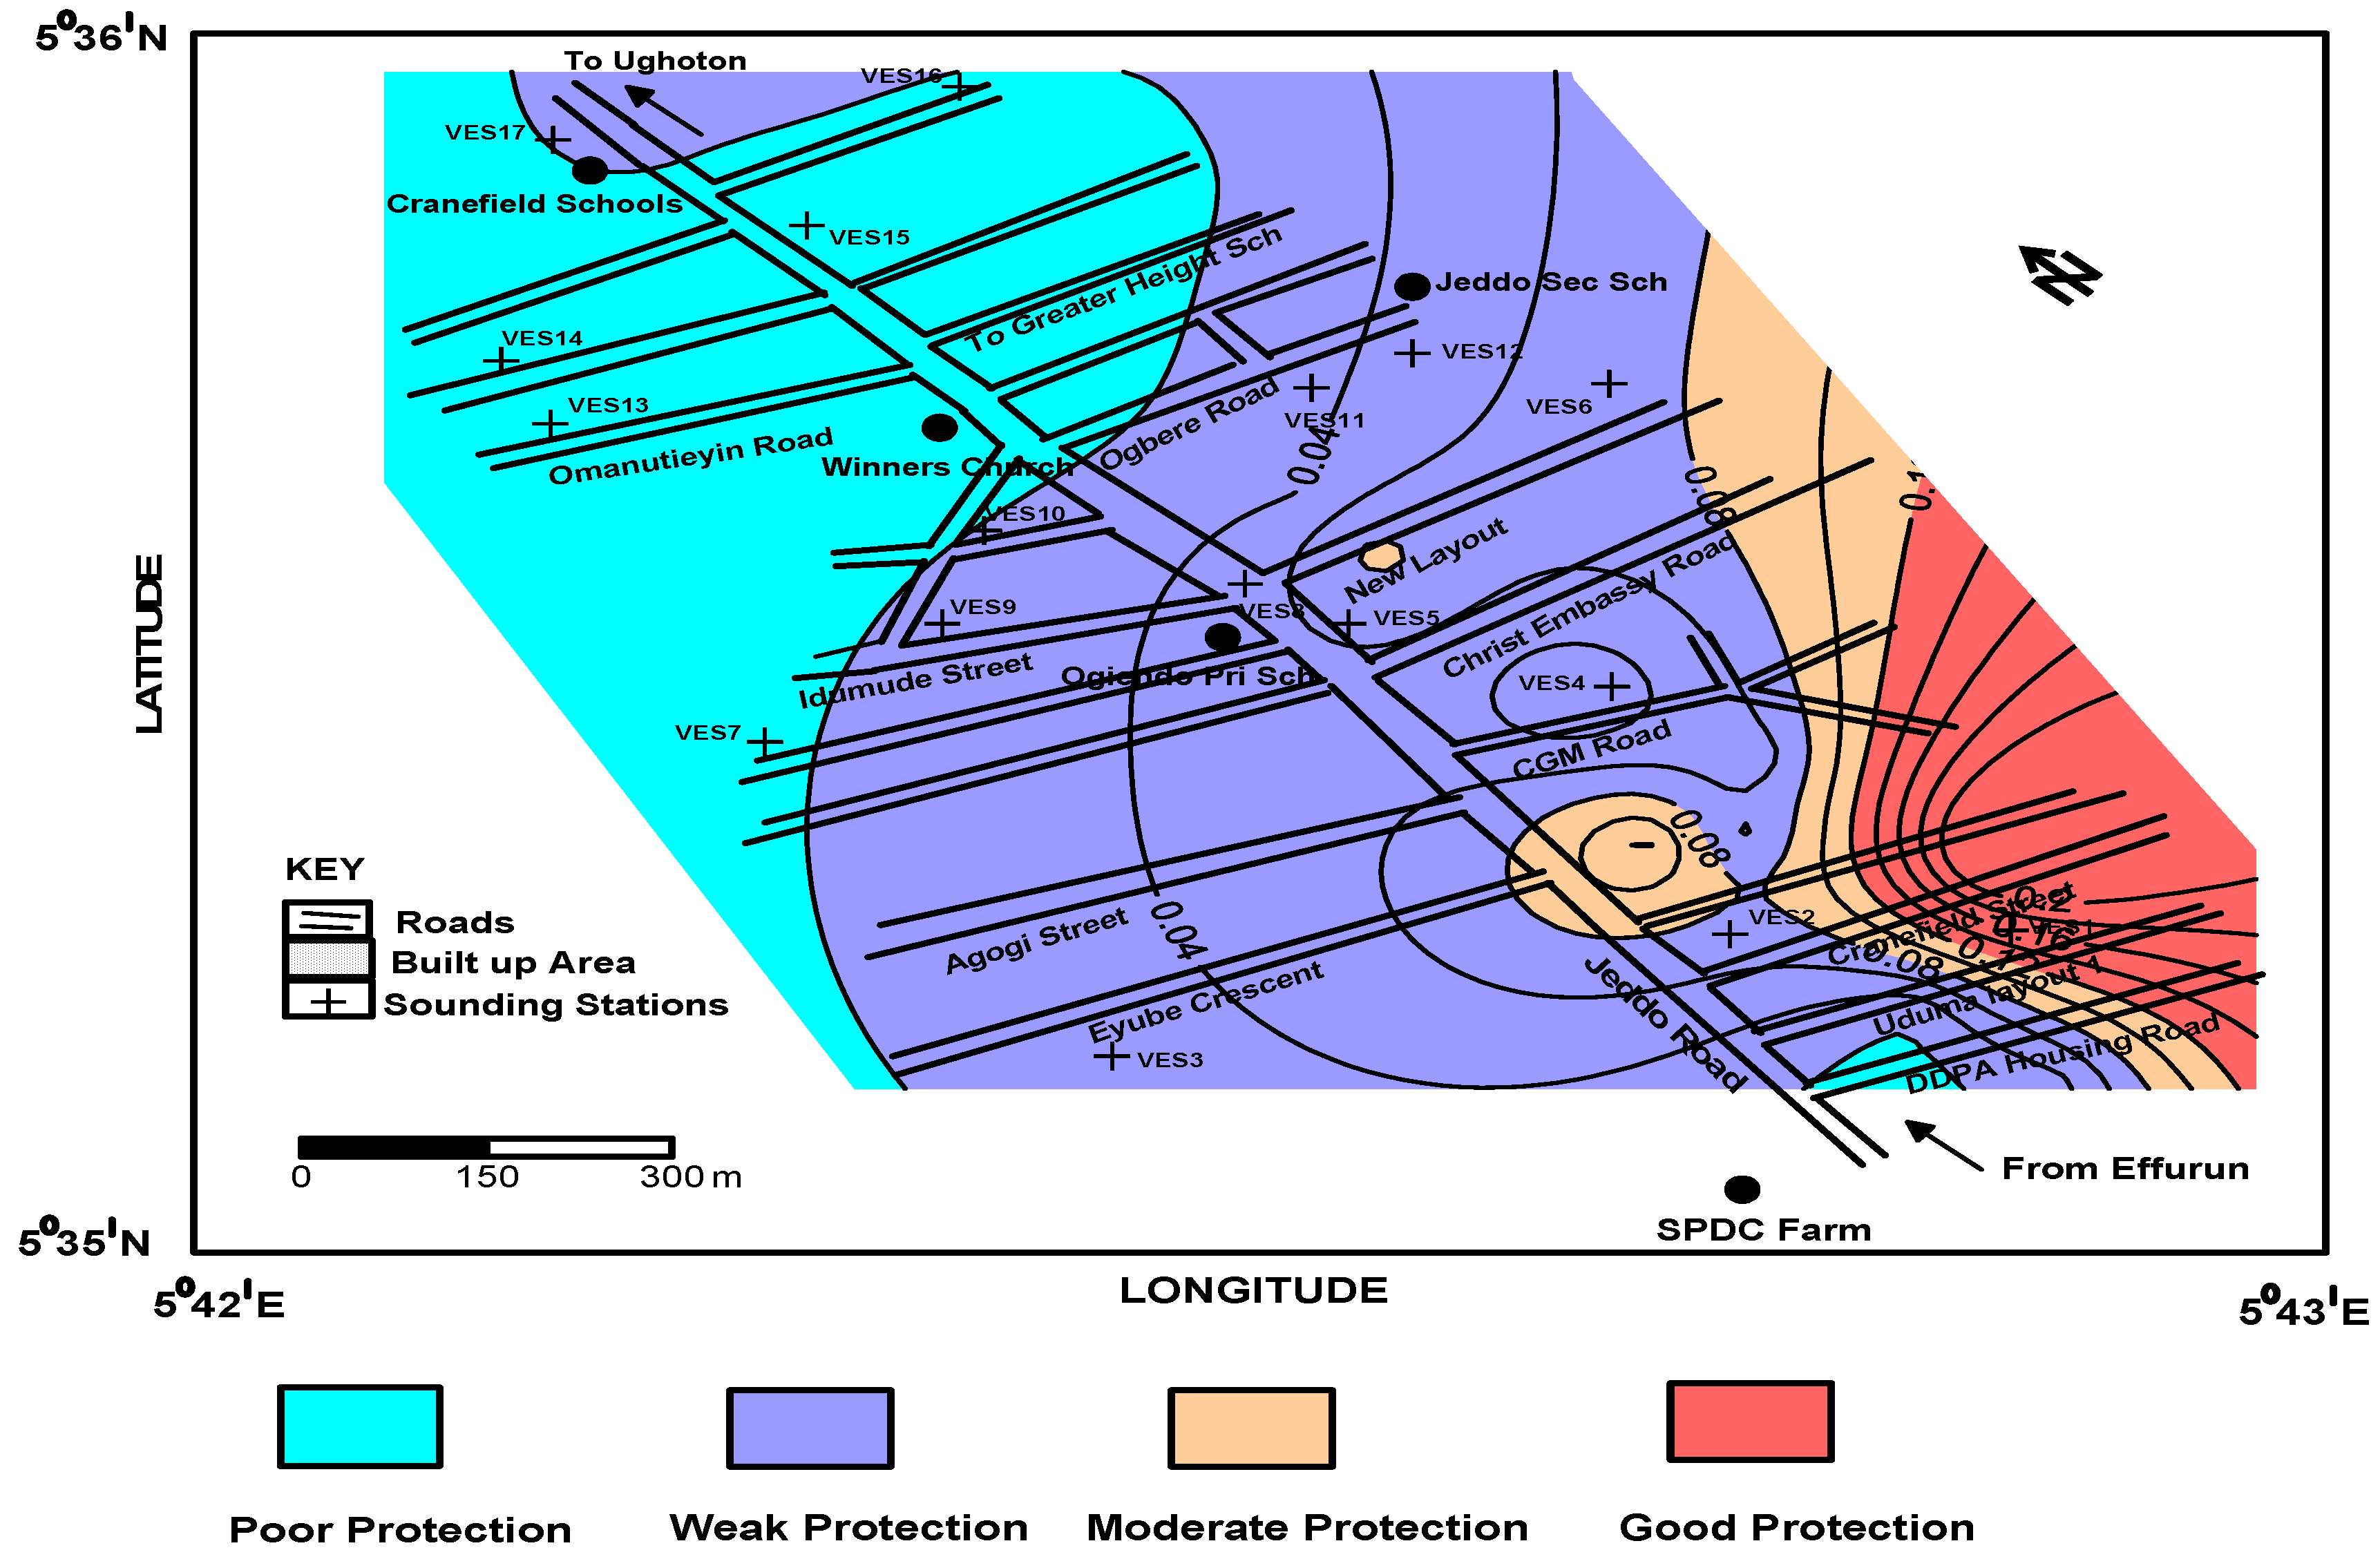
Table 2, calculated from obtained resistivity and thicknesses using Equation (1) for various layers at different VES stations were used to produce a protective capacity map (
Figure 6).The overburden protective capacity was evaluated based on the rating approach by [
23], and modified by [
24] and is given as >1 (excellent), 0.5–1 (very good), 0.1–0.49 (good), 0.06–0.09 (moderate), 0.01–0.05 (weak) and <0.01 (poor).
From the analysis of
Table 2, about 17.7% of the surveyed area in the eastern flank has good protective capacity and this coincides with zones of appreciable overburden thickness with clayey columns thick enough to protect the aquifer in the area from surface polluting fluid. In total, 17.7% in the eastern flank of Jeddo has moderate capacity, while 52.9% located in the central flank falls within areas of weak protective capacity and this is because of the presence of underlying layers of clayey sand. In the study area in the western region, 11.7% has poor protective capacity because of low porosity of the rock present in the layers which allows the aquifer to be prone to contamination resulting from short residence time in the sandy layers [
25].
Figure 6 clearly shows this distribution pattern of the aquifer protective capacity.
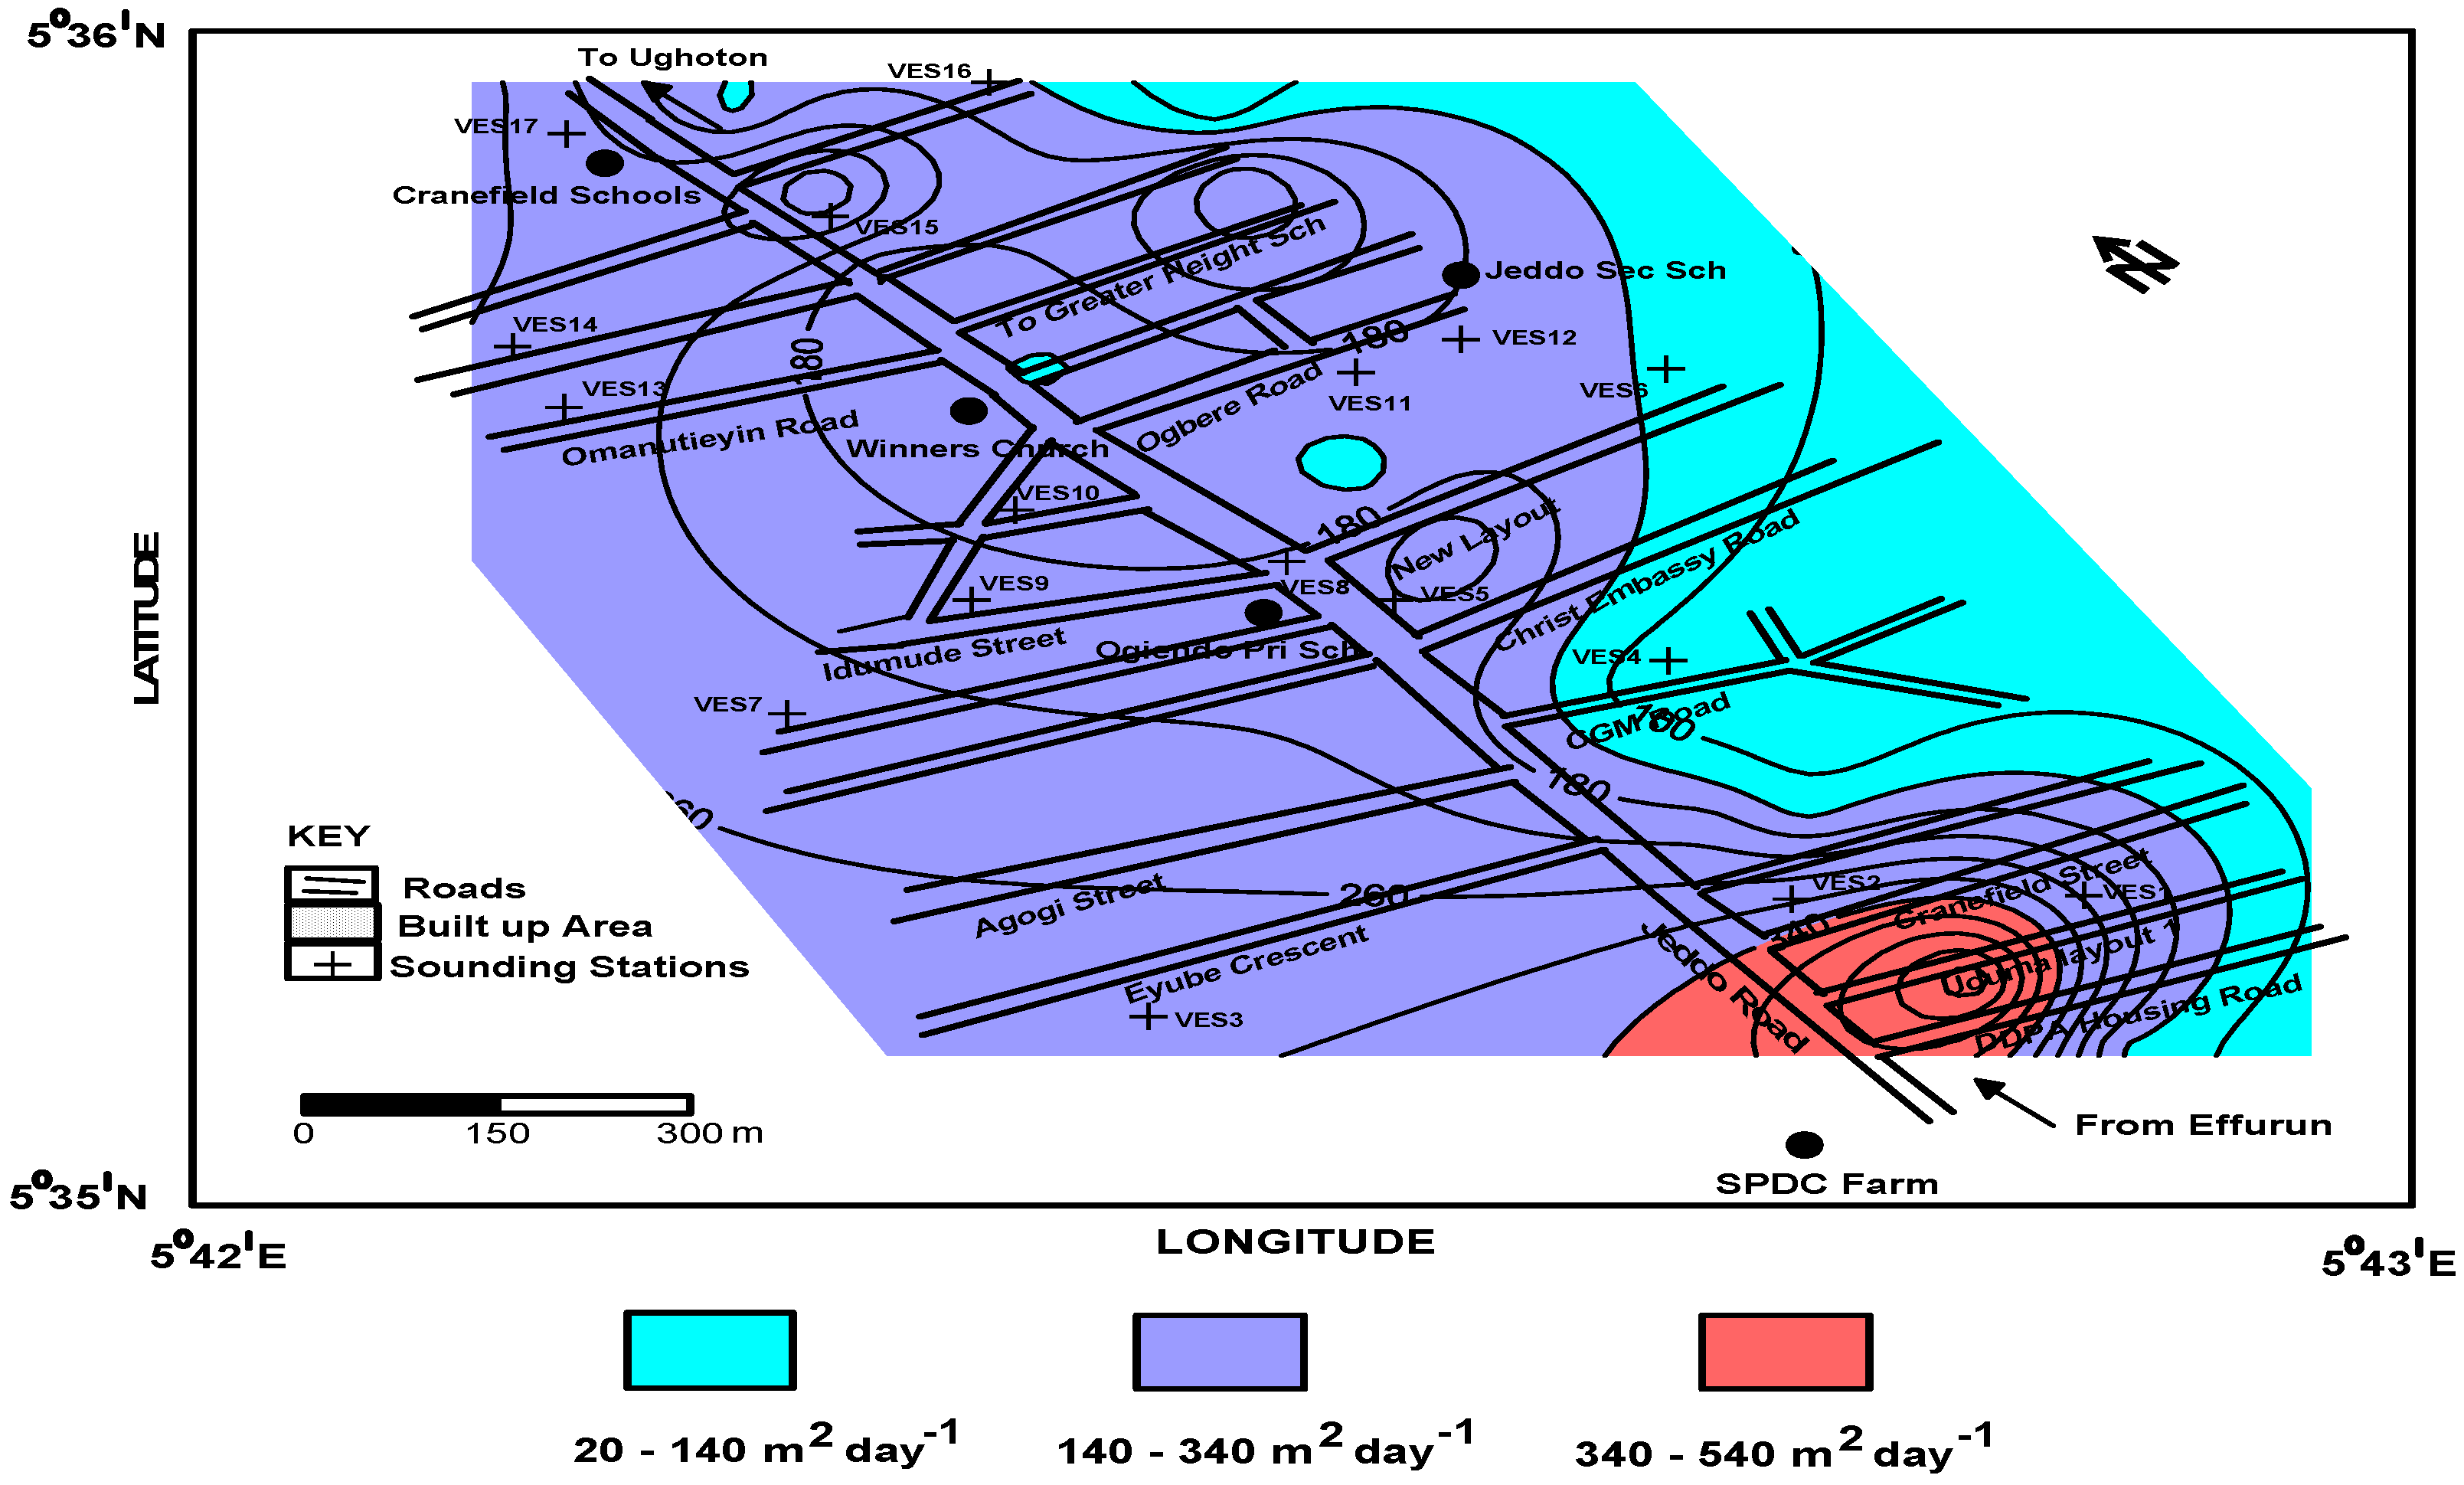
4.3. Aquifer Transmissivity
Aquifer transmissivity was determined using the analytical relationship between hydraulic conductivity (
K) and thickness of the aquifer
h, given in Equation (3). The hydraulic conductivity of sandy layers in Warri environs reported to range between 24.19 m/day and 30.24 m/day [
26] was assumed for calculating the transmissivity of the aquifer. The aquifer transmissivity rating according to the standards of Gheorghe (1978) as shown in
Table 3 was used in this study. The values of transmissivity obtained for the aquifers within the study area are
Tmean = 169 m
2 day
−1,
Tmin = 61.7 m
2 day
−1,
Tmax = 334 m
2 day
−1 (
Table 2). The highest value of
T obtained is for VES 3 with 334 m
2/day.
Figure 7 presents the map of aquifer transmissivity.
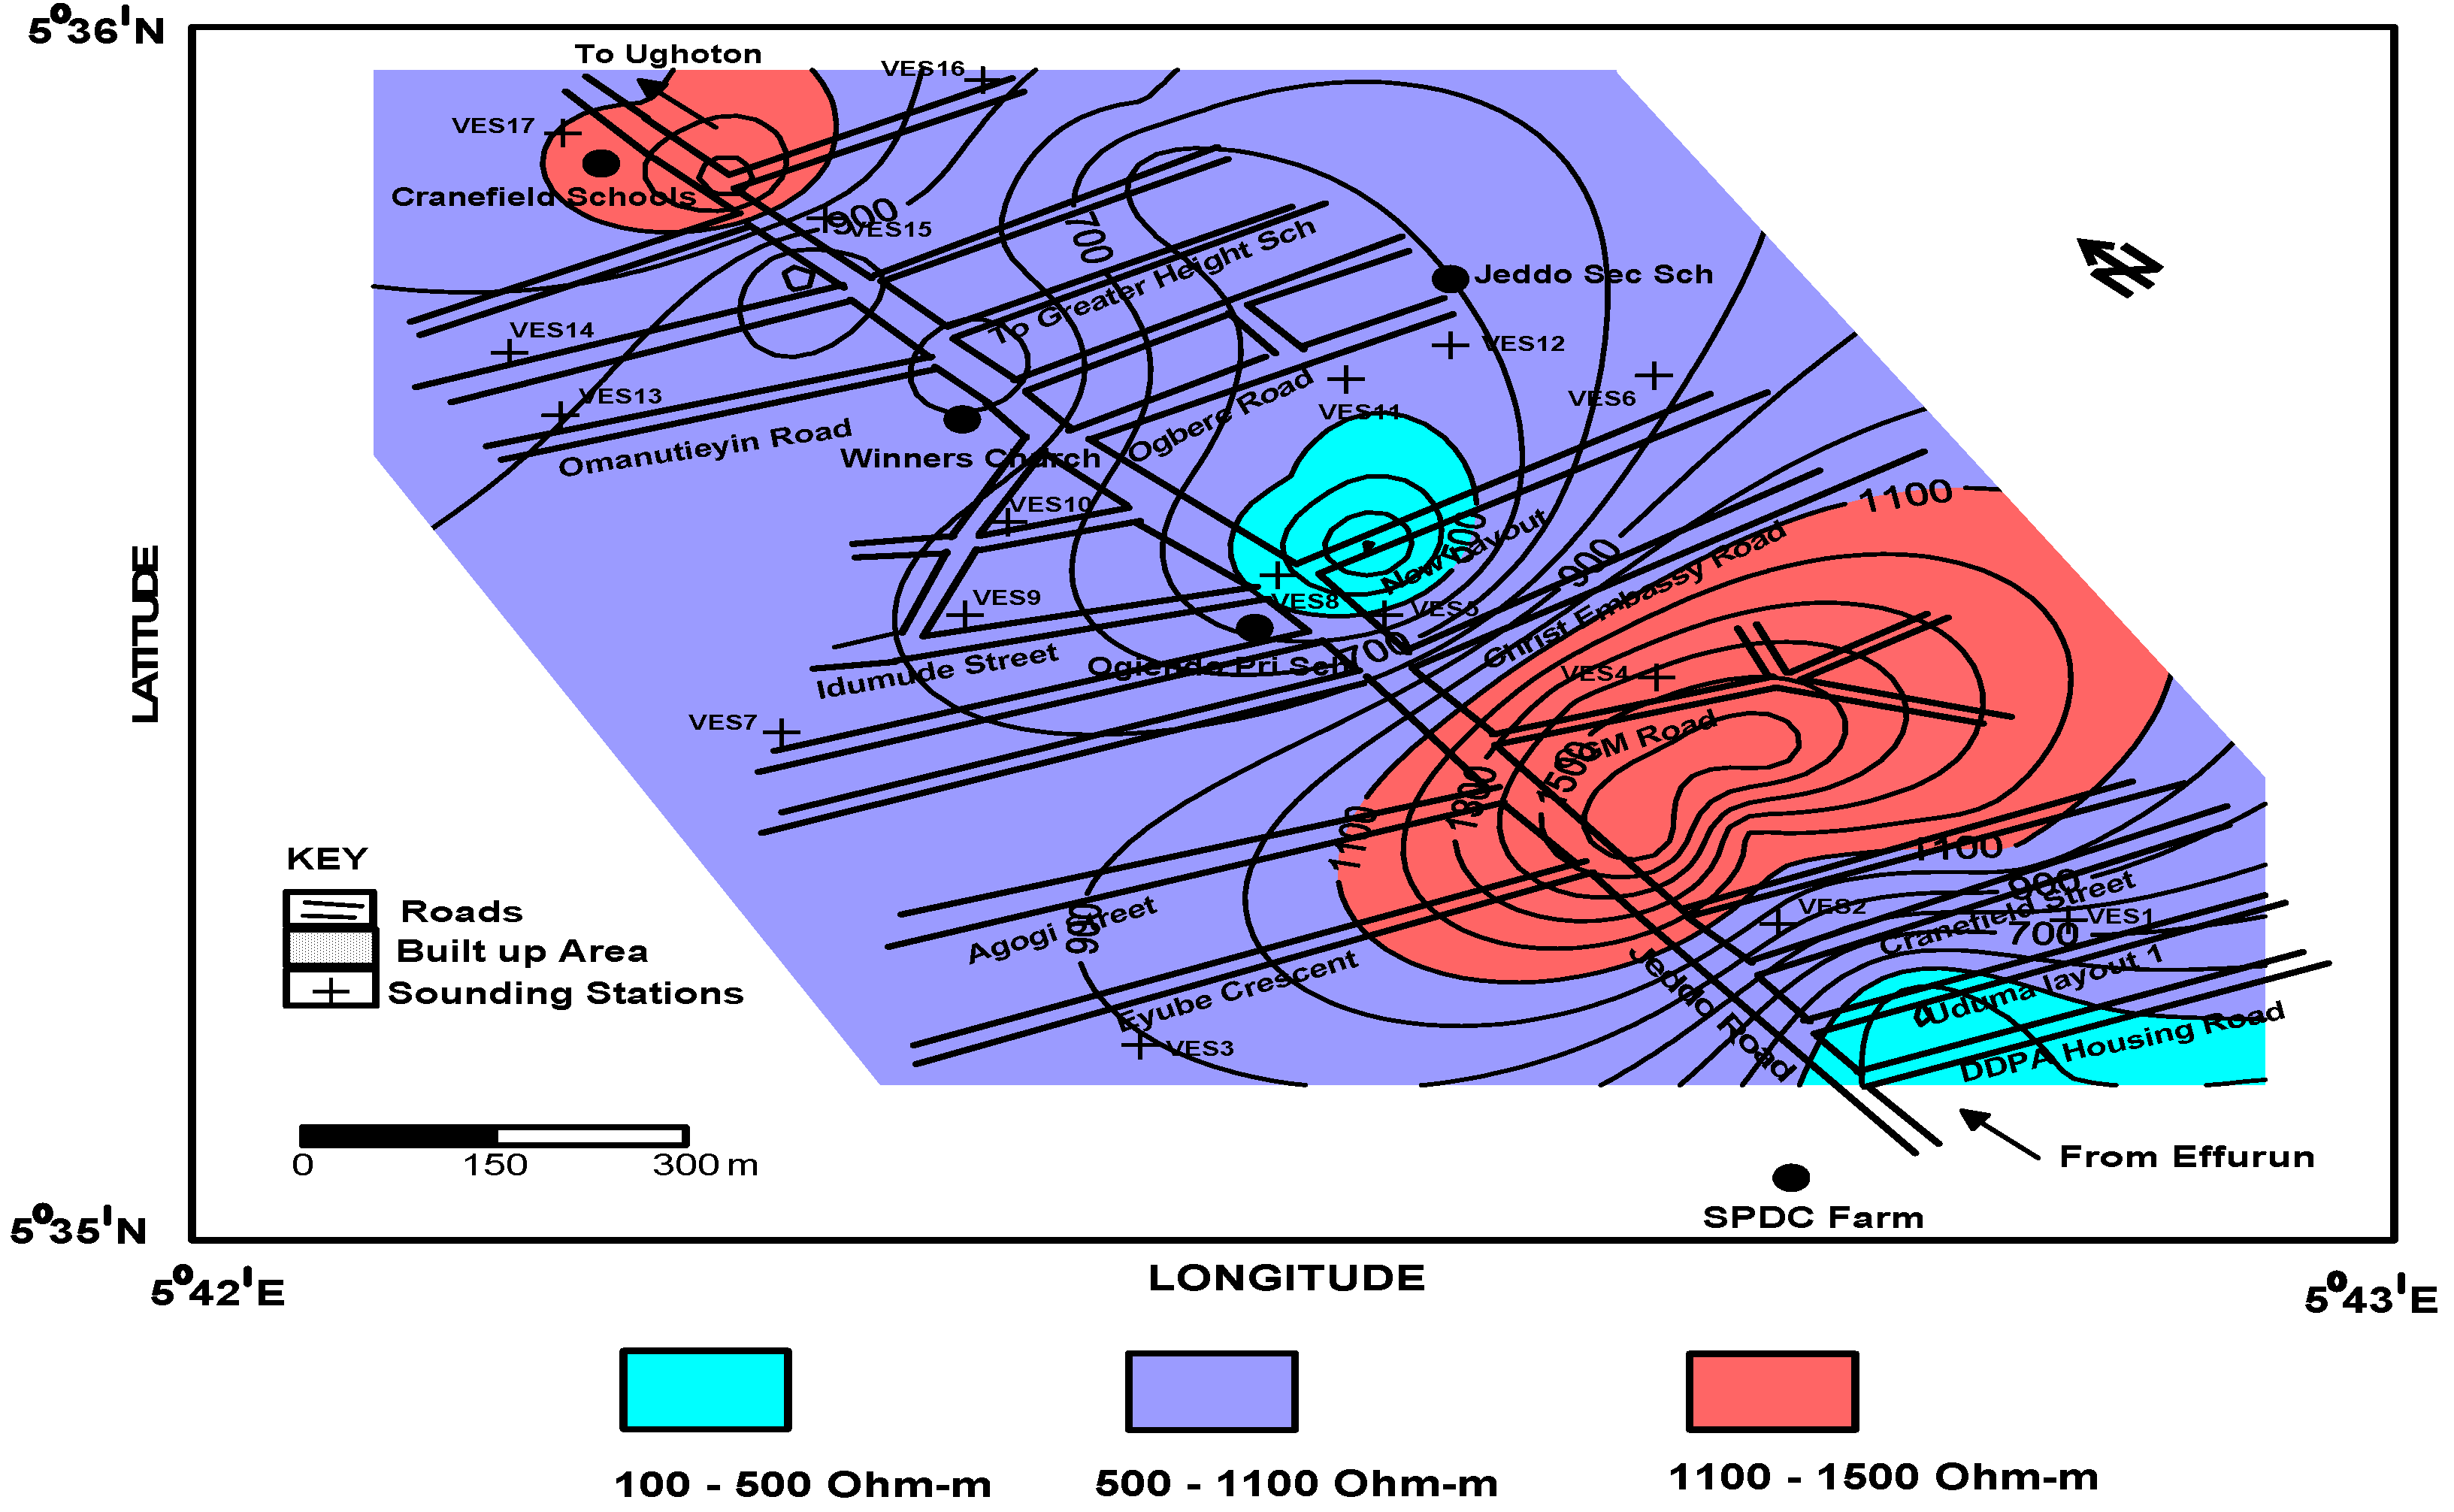
The map of aquifer resistivity is shown in
Figure 8. The low values of resistivity of the aquifers ranging between 161 and 1728 Ωm indicate the soil type of the aquifer and/or that the aquifer itself might be contaminated since relative high resistivity value imply a low concentration of conducting materials and thus of high ground water quality [
28].
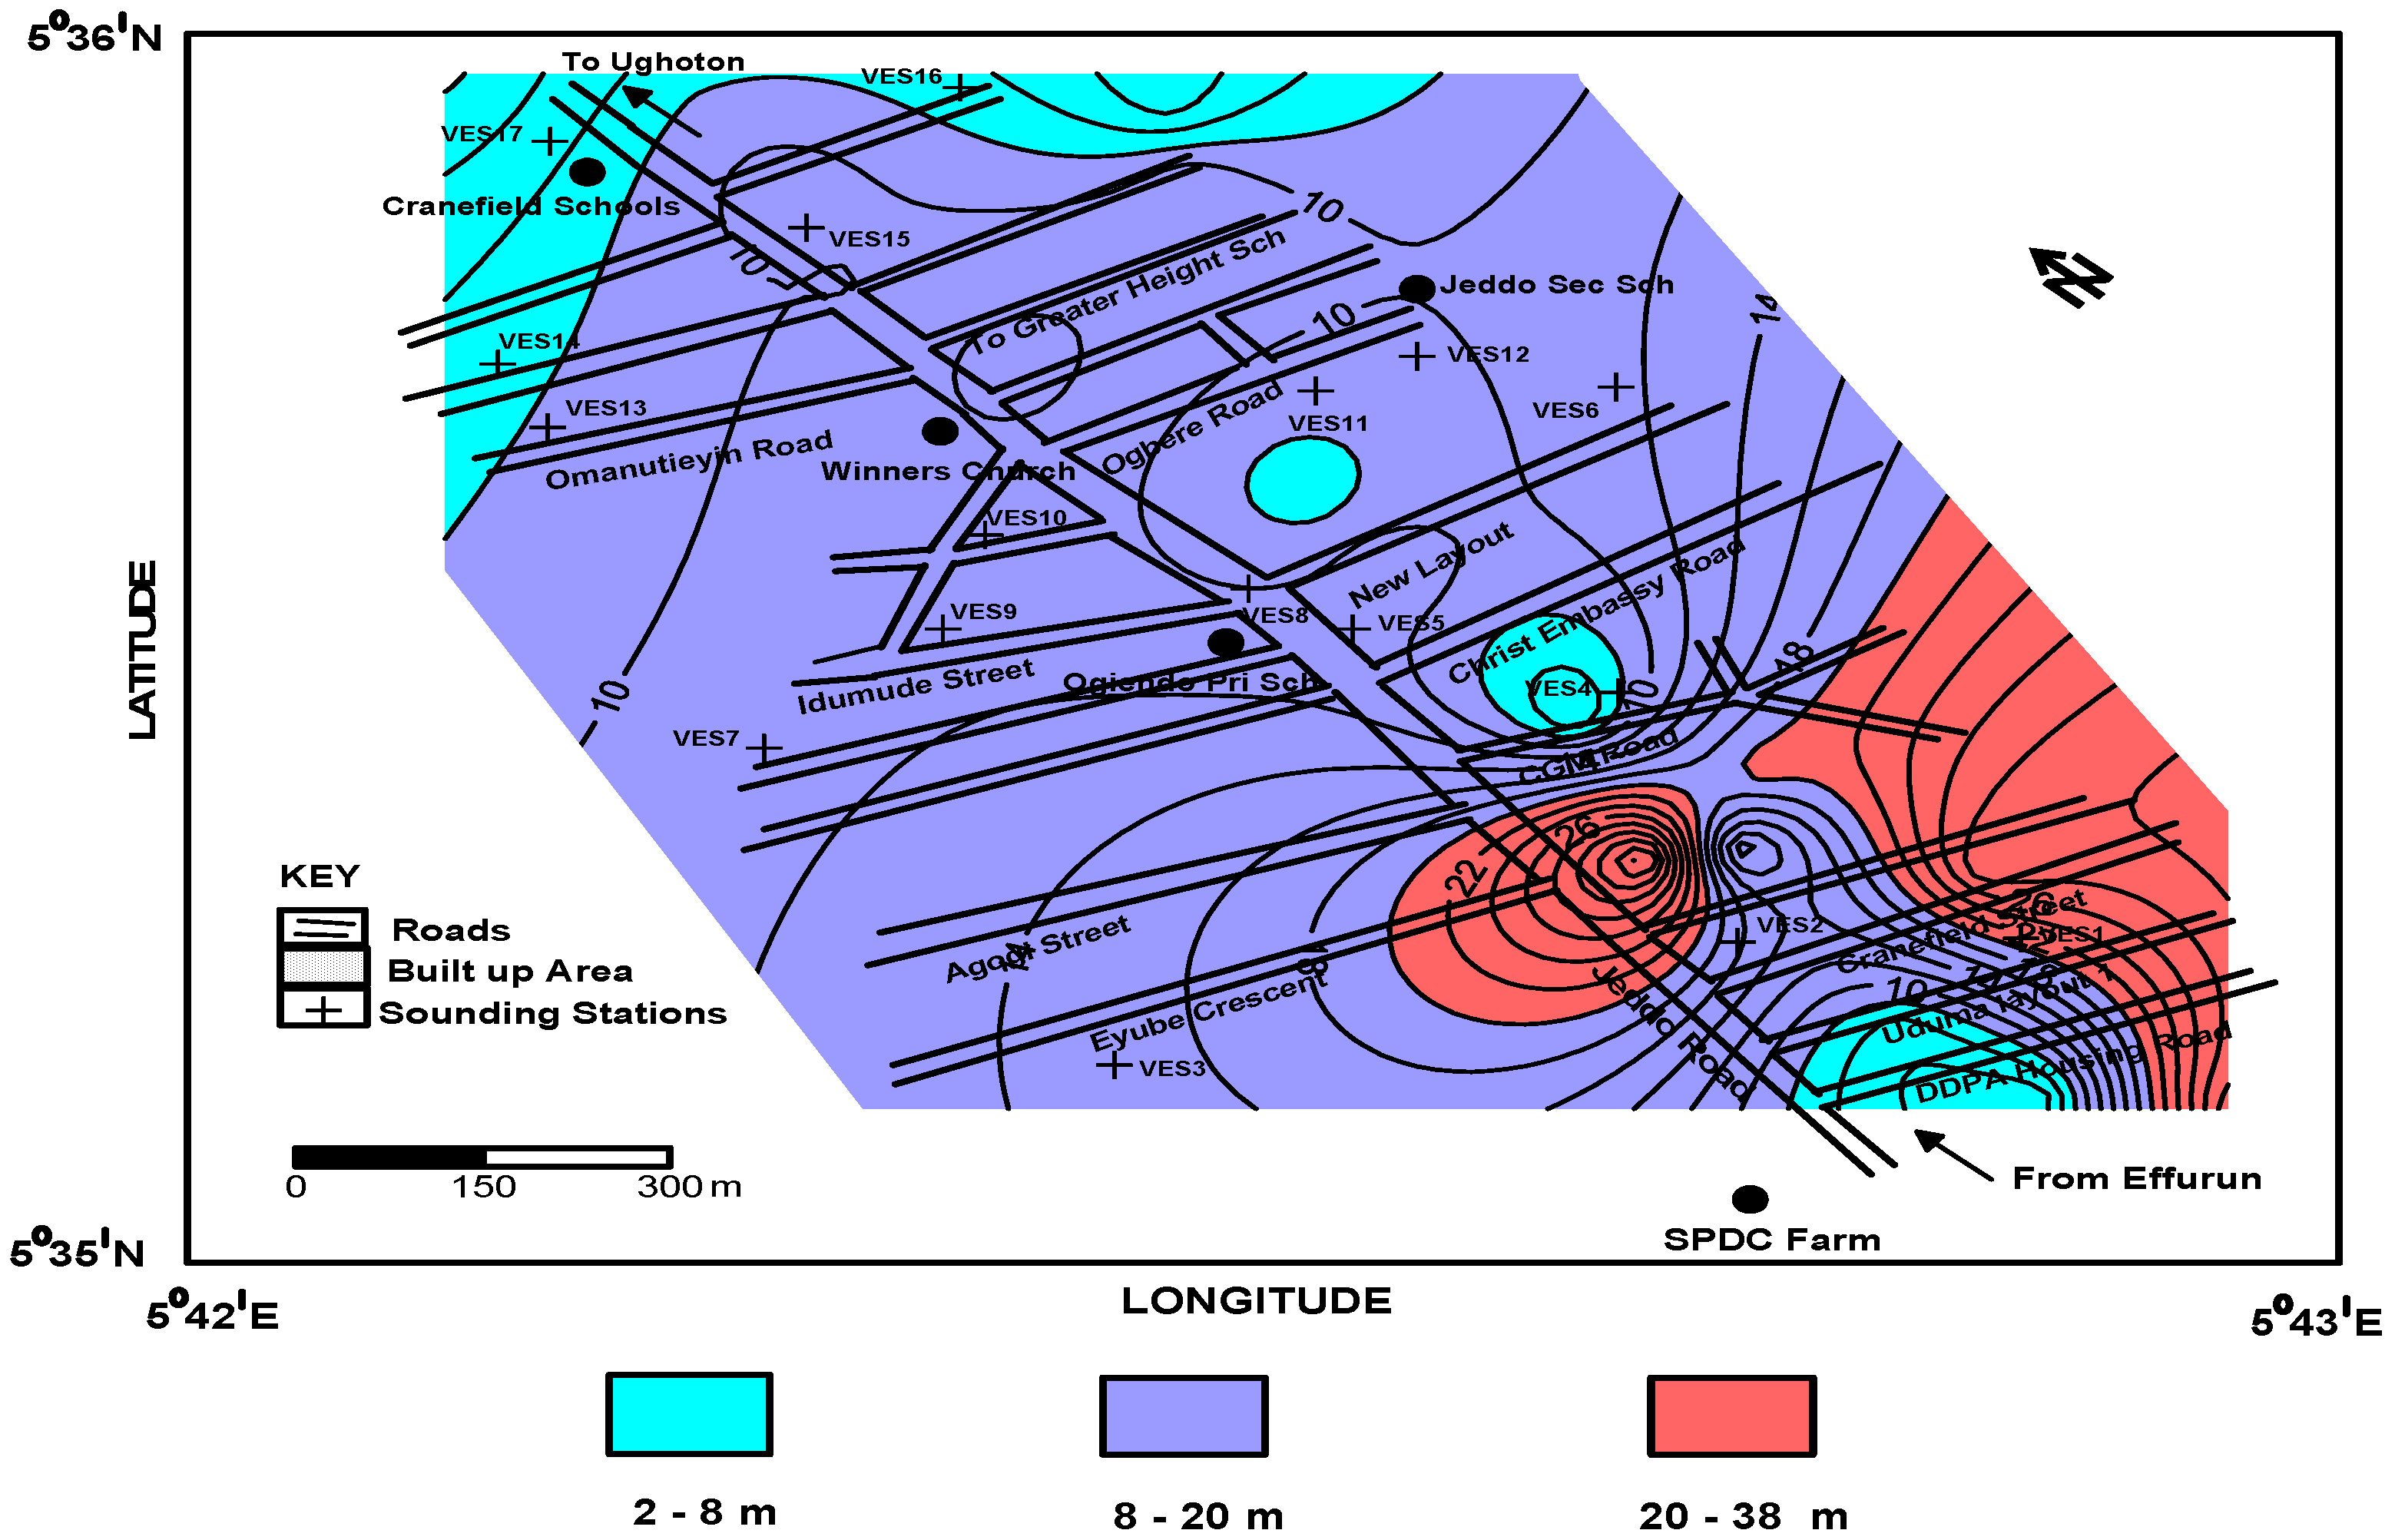
Figure 9 shows the map of depth to the aquifer. The depth to the water table tends to be highest around VES 7 with a value of 37.5 m and lowest at VES 17 with 1.5 m. The mean depth to aquifer in Jeddo is 12.7 m. The aquifer thickness also varies from 2.1 m to 75.9 m with a mean thickness of 15 m. The contour map of the diagnostic factor (
Figure 10), gives a detailed distribution pattern of the ratio of the transmissivity to transverse resistance,
Kσ, and show low values ranging from 0.0033 to 0.1645, indicating the Benin formation and that the water is not brackish or saline [
12,
29].
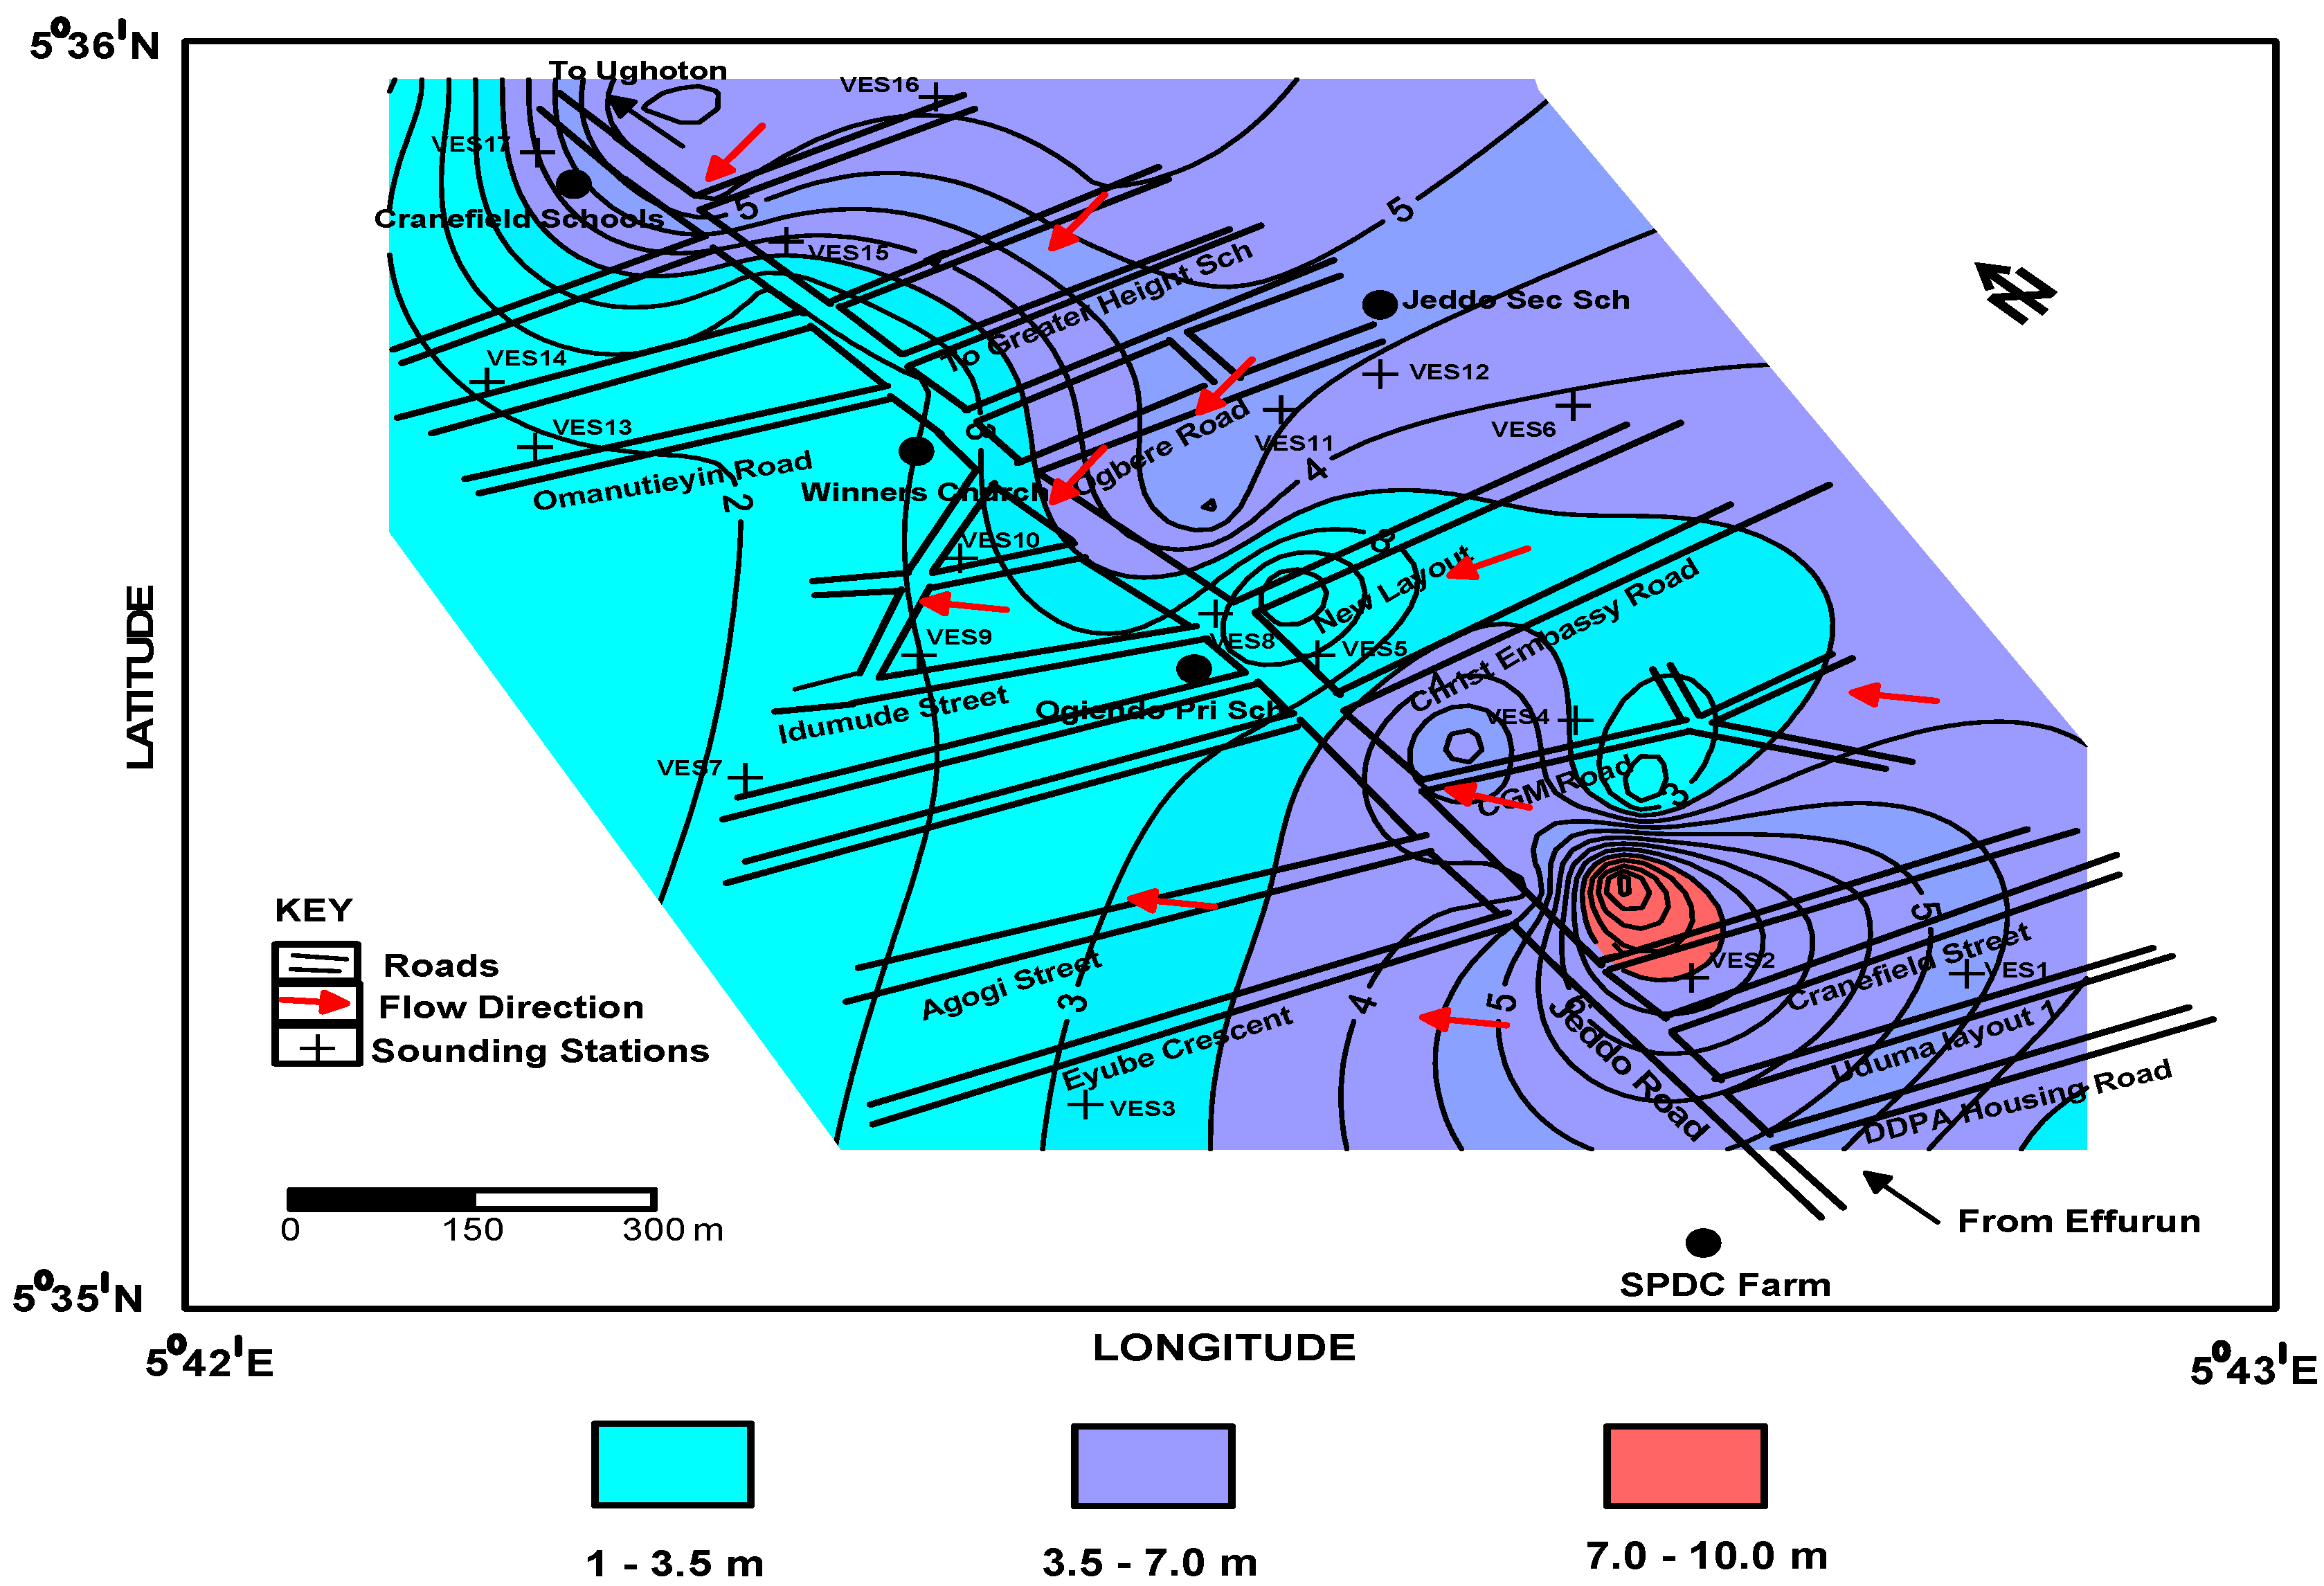
Groundwater level measurement, relative geographic position of the wells, and elevation were taken and used to obtain the static water level in the area to determine the direction of flow of the aquifer. The static water level (S
WL) of the area was calculated by subtracting the depth to the water level from earth surface, D
WL, from the elevation with respect to the mean sea level (E), in the hand-dug wells [
30]. This is given by the equation S
WL = E − D
WL. This coincides with the true water level in the case of unconfined aquifer. Generally, depths to water are deeper in areas with high elevations and vice-versa. Thus, depths to water typically is greater beneath hills than valleys but sometimes there are exceptions as observed in this study, resulting from influence on the water table due to some man-made activities such as overlying soil and rock removed leading to shallow depths to water [
31].
The contour map of static water level (
Figure 11) shows that the flow is towards river Ughoton in the northeast–southwest direction. Locally, variations as to this flow can be observed. These variations occur because of directional changes of groundwater flow, associated with the occurrence of a possible clay layer.
4.4. Hydrogeochemical Analysis
Hydrogeochemical analysis was carried out on water samples collected from four hand-dug wells and eight boreholes in the study area using Grab sampling method in other to obtain the water quality index (
WQI). Twenty-one parameters were chosen for the calculation of
WQI which was done by employing the weighted arithmetic index method and comparing the results with the recommended standard of drinking water by World Health Organization (WHO) and Nigerian Federal Environmental Protection Agency (FEPA). The calculation of the quality rating scale for each parameter was done by using the equation:
where
Qi is the quality rating scale,
Ci is the concentration of each parameter, and
Si is the recommended standard of each parameter. The inverse of the recommended standard gave the relative weight (
Wi) proportional to the recommended standard (
Si) of the corresponding parameter. The overall water quality index is given by Equation (6) and
Table 4 the water quality index rating.
The results of the hydrogeochemical analysis are shown in
Table 5 and
Table 6. Most of the values of the parameters obtained falls within the permissible limit of WHO and FEPA except for the high lead content in some of the hand-dug wells and a slightly acidic water of 6.0. For borehole water, there is a slightly high pH value of 5. For the hand-dug well, the calculated
WQI is 199.2 and the
WQI for borehole is 194.3. Comparing these values with the standard quality classification scheme, the water is poor for both the hand dug well and the borehole. The implication of this is that the water will require some level of purification before it is made available to the people as potable water.
5. Conclusions
The lithological identification and the characterization of the conditions of the underground water was made possible from the geophysical survey of the studied area. The geoelectric survey indicates that the area has topsoil, clay, clayey sand, and fine- to coarse-grained sand with various thicknesses and at various depths. These primary parameters were used to determine the Dar-Zarrouk parameters and the electrical conductivity. The longitudinal conductance map shows that the impermeability of the confining clay layer is about 17.6% of the surveyed area, indicating the area where the aquifer would be protected. The aquifer transmissivity map shows that the transmissivity of the area is of moderate potential with a mean value Tmean = 169 m2 day−1 while its maximum value is Tmax = 334 m2 day−1. The lower values of the diagnostic factor, ranging from 0.0033 to 0.1645, in the map show that the water is not brackish or not saline. Also, the aquifer thickness varies between 2.1 m at VES 12 and 75.9 m at VES 15 with an average value of 15 m. The hydrogeochemical analysis of water samples carried out showed values that fall within the permissible limit of WHO and FEPA except for lead, color and pH values which exceeded the permissible limit. The water from hand-dug wells is of poor quality compared to the water from boreholes. The estimation of elevation from geophysical survey has led to the determination of the pattern and direction of flow of the groundwater as shown in the generated static water table map. Generally, the underground water flow is towards the river Ughoton in the NE–SW direction.Locally, variations as to this flow can be observed. These variations occur because of directional changes of groundwater flow, associated with the occurrence of a possible clay layer.


