Article

Climate and Land Use/Land Cover Changes within the Sota Catchment (Benin, West Africa)

by
Kevin S. Sambieni
1,*,
Fabien C. C. Hountondji
2,
Luc O. Sintondji
3,
Nicola Fohrer
4,
Séverin Biaou
5 and
Coffi Leonce Geoffroy Sossa
6
1
Graduate Research Program on Climate Change and Water Resources, West African Science Service Center on Climate Change and Adapted Land Use, University of Abomey-Calavi, Abomey-Calavi BP 526, Benin
2
Faculté d’Agronomie, Université de Parakou, Parakou BP 123, Benin
3
Institut National de l’Eau, Université d’Abomey-Calavi, Abomey-Calavi BP 4521, Benin
4
Department of Hydrology and Water Resources Management, Institute for Natural Resource Conservation, Kiel University, 24098 Kiel, Germany
5
Laboratoire d’Écologie, de Botanique et de Biologie Végétale, Faculté d’Agronomie, Université de Parakou, Parakou BP 123, Benin
6
Graduate Research Program on Climate Change and Agriculture, West African Science Service Centre on Climate Change and Adapted Land Use (WASCAL), Université des Sciences, des Techniques et des Technologies de Bamako (USTTB), Bamako BP E 423, Mali
*
Author to whom correspondence should be addressed.
Hydrology 2024, 11(3), 30; https://doi.org/10.3390/hydrology11030030
Submission received: 27 December 2023 / Revised: 8 February 2024 / Accepted: 17 February 2024 / Published: 23 February 2024
(This article belongs to the Special Issue Trends and Variations in Hydroclimatic Variables)

Abstract

:
Climate and land cover changes are key factors in river basins’ management. This study investigates on the one hand 60-year (1960 to 2019) rainfall and temperature variability using station data combined with gridded data, and on the other hand land cover changes for the years 1990, 2005, and 2020 in the Sota catchment (13,410 km2, North Benin, West Africa). The climate period is different from the chosen land use change period due to the unavailability of satellite images. Standardized anomaly index, break points, trend analysis, and Thiessen’s polygon were applied. Satellite images were processed and ground truthing was carried out to assess land cover changes. The analyses revealed a wet period from 1960 to 1972, a dry period from 1973 to 1987, and another wet period from 1988 to 2019. The annual rainfall decreases from the south to the north of the catchment. In addition, rainfall showed a non-significant trend over the study period, and no significant changes were identified between the two normals (1960–1989 and 1990–2019) at catchment scale, although some individual stations exhibited significant trends. Temperatures, in contrast, showed a significant increasing trend over the study period at catchment scale, with significant break points in 1978, 1990, and 2004 for Tmax, and 1989 for Tmin. An increase of 0.4 °C and 1.2 °C is noted, respectively, for Tmax and Tmin between the two normals. The study also revealed increases in agricultural areas (212.1%), settlements (76.6%), waterbodies (2.9%), and baresoil (52%) against decreases in woodland (49.6%), dense forest (42.2%), gallery forest (21.2%), and savanna (31.9%) from 1990 to 2020. These changes in climate and land cover will have implications for the region. Appropriate adaptation measures, including Integrated Water Resources Management and afforestation, are required.

1. Introduction

One of the greatest challenges of this century is the issue of climate change because of its stressing impacts on the environment and humans, such as changes in weather patterns, rising sea levels, extreme weather events, and pressures on socioeconomic activities [1,2]. Due to climate change, the global economy could lose 10% of its total economic value by 2050, according to new research from the World Economic Forum [3]. Changes in temperature and precipitation are one of the most critical factors determining the overall climate change [4]. These changes also affect directly and indirectly land use and land cover (LULC) patterns. As humanity depends on land for food, energy, living space, and development [5], vast land areas have undergone land use and land cover changes [6]. On average, a land area of about 720,000 km2 has changed every year since 1960 and land use change affected almost a third (32%) of the global land area in just six decades (1960–2019) [5]. Our world is changing at an unprecedented rate in terms of climate and land use/land cover and both have become a crucial concern [7,8]. As a result, how climate and land have changed in particular areas has been therefore an important research question for many scholars. In West Africa for instance, some studies have revealed that, like the sub-Saharan region in general, West Africa has been experiencing strong spatial and temporal rainfall variability with recurrent drought and floods, with huge impacts on land and water resources [9,10,11,12,13]. During the twentieth century, mean annual temperatures increased by 2 °C while mean annual precipitation decreased by 50, or approximately 20% [14]. Between 1990 and 2010, deforestation resulted in the removal of about 32 million ha of forest, with significant land-use change in West Africa [15].
The Sota catchment, located in the northern part of Benin in West Africa, is an area of high agricultural and livestock production. Livestock production is the second largest economic activity in this catchment after crop production [16]. For several decades, the Alibori department part of the Sota catchment has supplied more than half of Benin’s national cotton production. The demand for agricultural “cotton-land” in northern Benin, for example, increased from 49,813 ha in 1990 to 205,675 ha in 2013, implying an annual land demand of 6494 ha [17]. It is therefore noted that agriculture and livestock production play an important role in the livelihoods of communities from this catchment. Both activities largely rely on water, pasture, and land, and are therefore prone to being heavily affected by climate and land use changes. A few studies on changes in climate and land use/land cover in the Sota catchment have been carried out, such as [18,19,20], and in the whole Niger basin (of which it is a part) by [16,21]. Only [20] from 1978 to 2010 and [19] in 1995 and 2013 addressed land dynamics. Some of the findings are that temperatures increased significantly by 0.02–0.05 °C per year between 1970 and 2010 [21], and a drought period was identified in the 1970s and 1980s. Woodland and dense forest areas have undergone, respectively, decreases of 0.70% and 11.3% per year from 1978 to 2010 in the Sota catchment [20]. An increase of 42.5% is noted in agricultural land from 1978 to 2010 [20].
The Sota region faces increasing pressure on water resources and woodlands due to agricultural (plant production and livestock raising) intensification and extensification [22]. Previous climate studies in the catchment were limited to 2010 [16,18,20,21], and trend analysis using autocorrelation was not performed, compromising the accuracy of the analyses [23,24,25]. In addition, gridded values were not used to fill the several missing rainfall data. Moreover, the seasonal rainfall trend was not assessed. Aside from this, the statistics on LULC rate of changes need to be updated.
The present study sought to fill these gaps by investigating, on the one hand, rainfall and temperature changes in the Sota catchment at annual and seasonal scales using 60 years of rainfall data (1960–2019) from stations combined with gridded values and 60 years of temperature data as well. On the other hand, land cover dynamics in the Sota catchment over the past thirty (30) years for the years 1990, 2005, and 2020 are investigated.

2. Materials and Methods
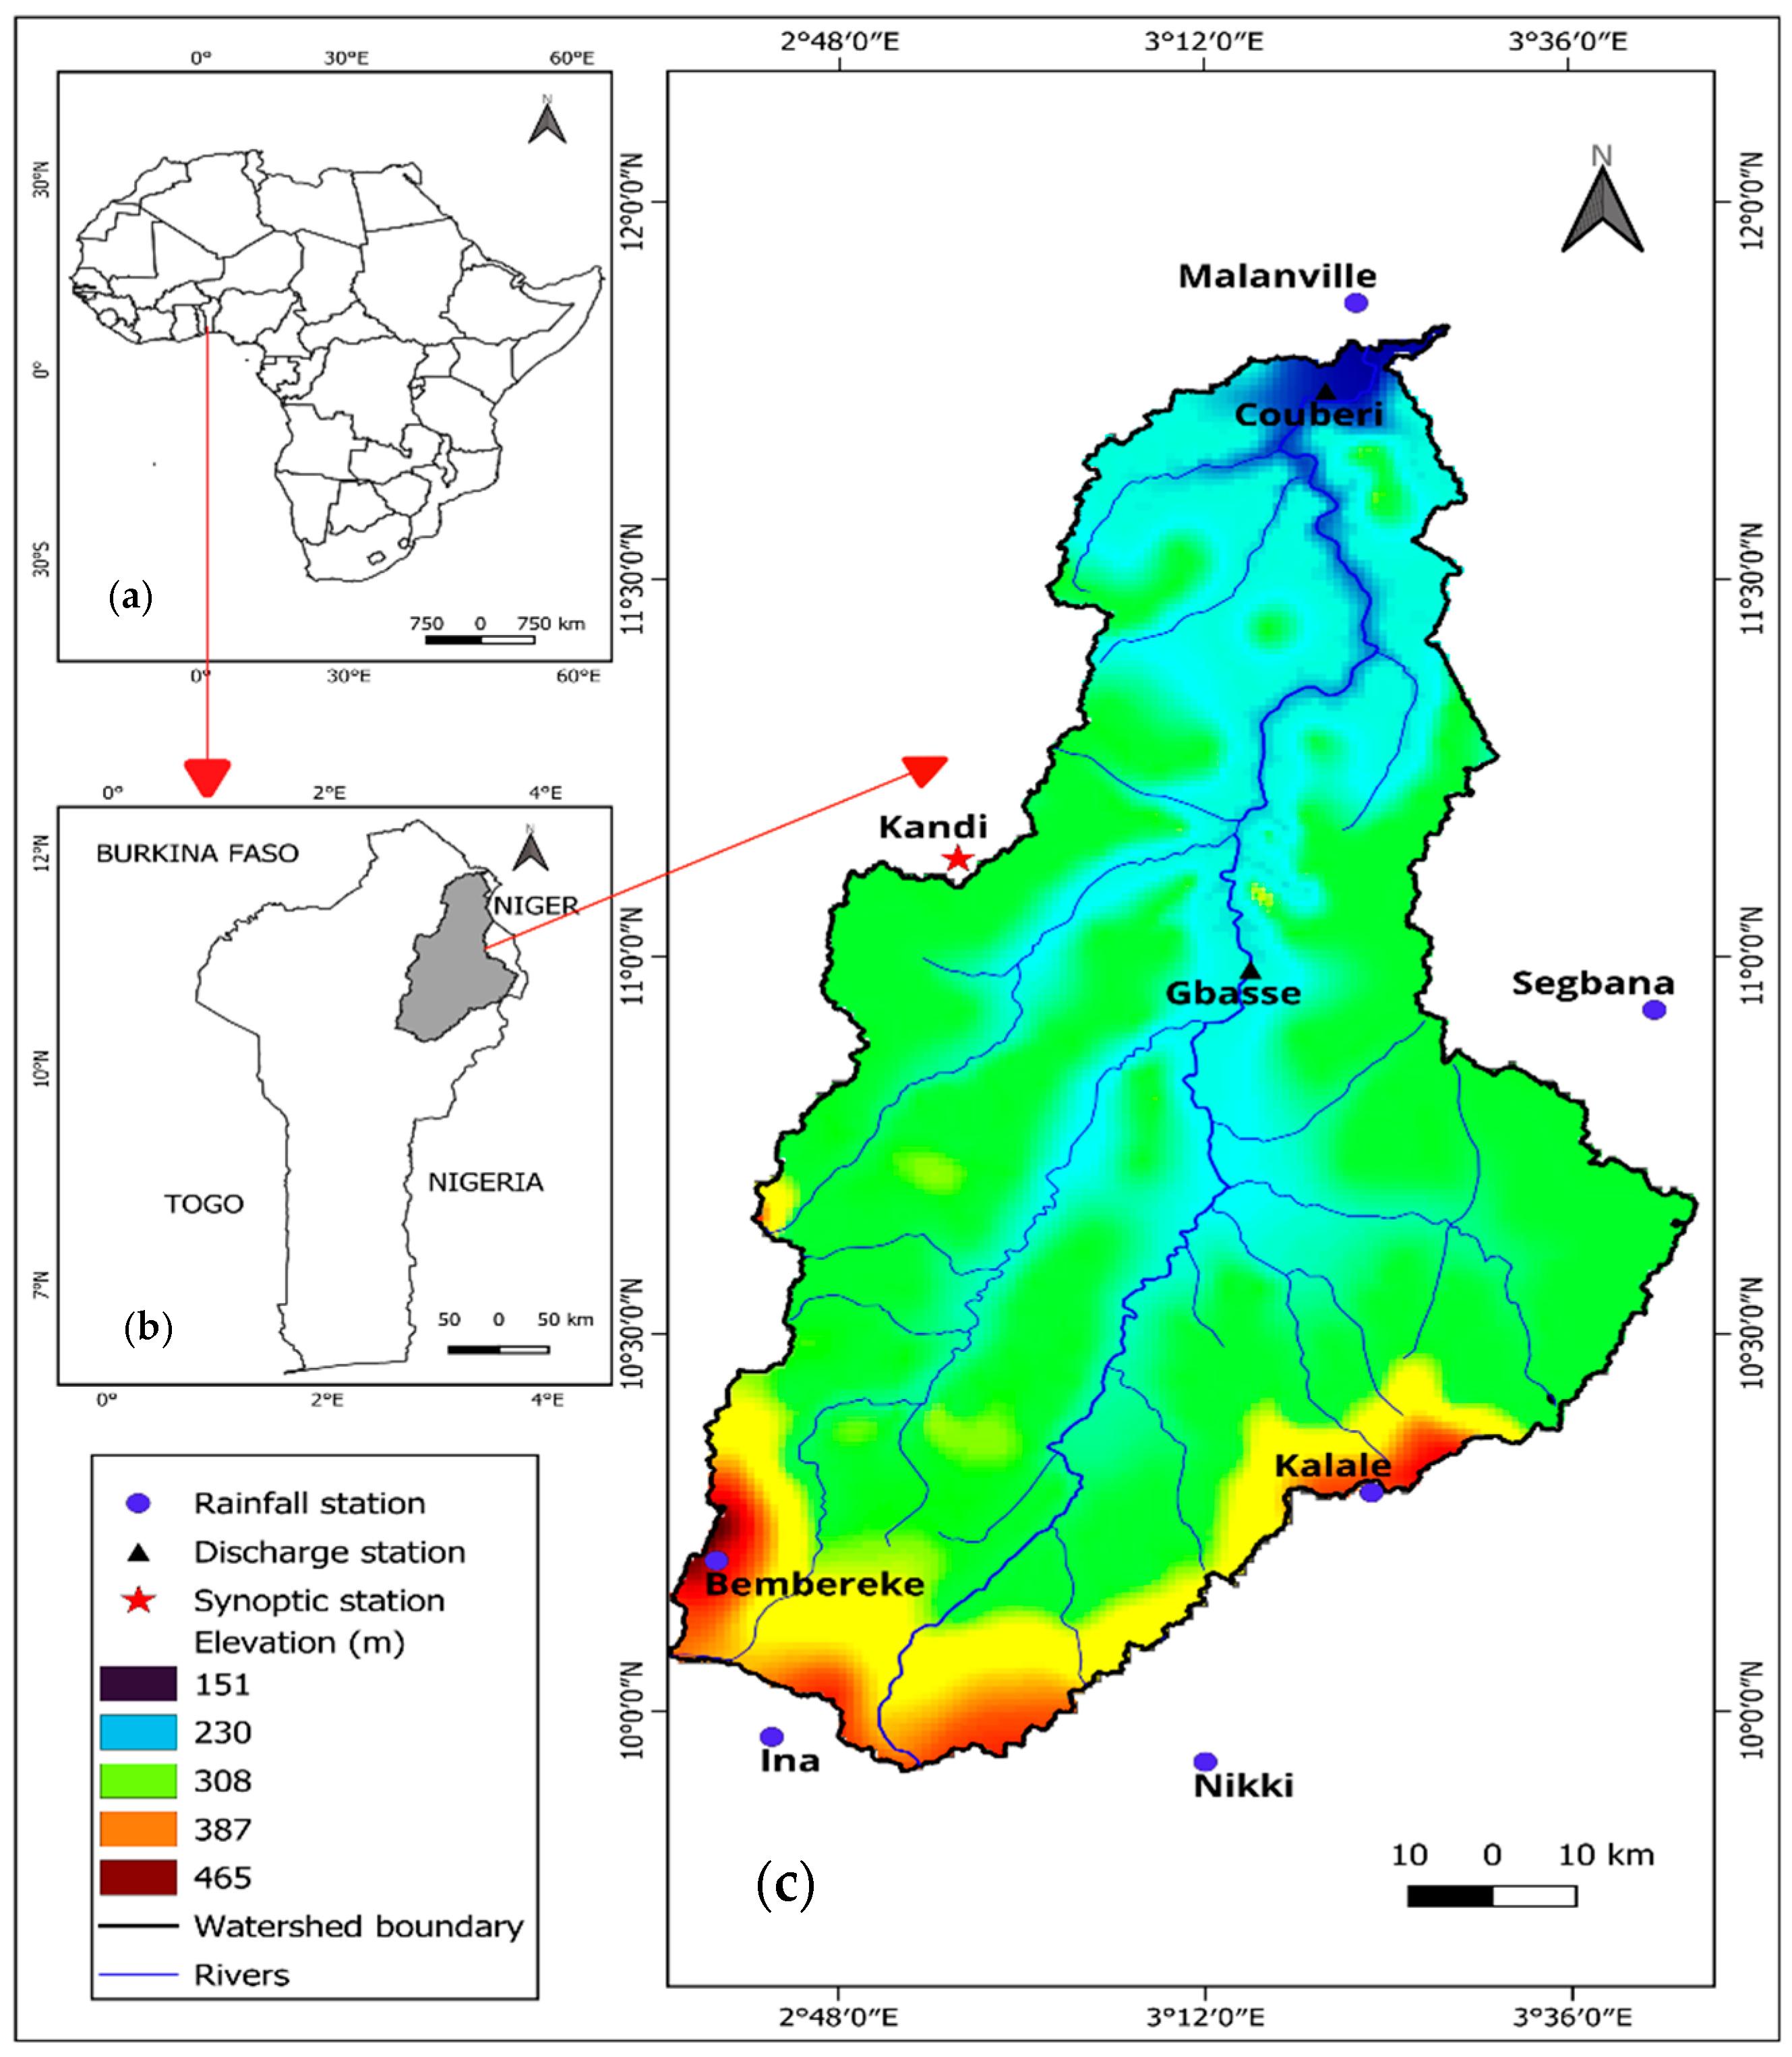
2.1. Study Area

This study was conducted in the Sota catchment, which is a sub-basin of the Benin portion of the Niger River Basin (BPNRB) located in the northern part of Benin between 9°54′ and 11°45′ north latitude and between 2°28′ and 3°52′ east longitude (Figure 1). The Sota catchment covers an area of about 13,410 km2, i.e., 11% of Benin. The Sota catchment is shared by seven districts: Malanville, Ségbana, Kandi, Gogounou, Bembèrèkè, Kalalé, and Nikki (Figure 1). The climate of the catchment is tropical with a unimodal rainfall. The monthly average temperature varies between 24.9 °C and 32.5 °C, while the annual average revolves around 27.9 °C (for more details on the study area, refer to [22]).

2.2. Datasets

2.2.1. Climate Station Data

Historical daily rainfall, as well as maximum and minimum temperature data within the Sota catchment over the period 1960–2019 (Table 1) obtained from the Benin Meteorological Agency (Meteo Benin), were used. The daily rainfall data collected are from the six rainfall stations and the synoptic station of Kandi, located throughout the Sota catchment (Figure 1). Daily maximum and minimum temperature data are only available from the synoptic station of Kandi. Table 1 gives some details of the seven meteorological stations used in the study.
The longest rainfall observation record is 60 years at the station in Kandi and the shortest is 35 years at the station in Segbana.
The daily rainfall time series was aggregated into monthly, annual, and seasonal time series for each station. Following the studies of [26,27], aggregation was performed for the months of March, April, and May to correspond with the pre-monsoon season, then June, July, August, and September for the monsoon season.

2.2.2. Climate Data Quality Control

Data quality control was performed according to the method used by [21] who carried out a climate study in the Sota catchment. For each station, as per the method, years with 5–10% of missing data within the monsoon season (June–September) and those with more than 10% of missing records, regardless of the season, are excluded (Table 1). This method only establishes criteria for excluding years based on failures and is not a system for detecting suspicious values. The concern with data quality control is a common issue and was also highlighted in other studies in other parts of the world, such as the study of [28].

2.2.3. Gridded Data

The stations are poorly provided, and the data quality control process mentioned above results in more missing values (Table 1). As alternatives to ground-based observations, reanalysis products have received increasing attention in recent years [29]. A recent study carried out in 2022 in Benin by [29] revealed that among some reanalysis products, WFDE5 produces the best estimates for the annual precipitation (REPA є [−25, 25] and KGE > 50%), followed by ERA 5. REPA is the Relative Error in Precipitation Annual and KGE is the Kling–Gupta efficiency. In fact, WFDE5 is a debiased version of ERA5-Land with a 0.5° × 0.5° aggregated resolution [30]. ERA5 is the fifth major global reanalysis produced by the European Centre for Medium-Range Weather Forecasts reanalysis [31] with a 0.1° × 0.1° resolution [32]. The two products (WFDE5 and ERA5) have an hourly temporal resolution and are both available from the Copernicus climate data store service https://doi.org/10.24381/cds.20d54e34 (accessed on 5 December 2023). The performance of these two reanalysis products (which have proved to be the most effective in Benin) was specifically evaluated in the Sota catchment. This was done to check which one should be used to supplement the missing values in the stations’ dataset. To this end, they were downloaded and extracted at the Sota catchment scale, using the grid point closest to the coordinates of the catchment stations. Then, their performance was assessed by using various statistical indices: the P Pearson correlation coefficient (r), root mean square error (RMSE), and bias ratio (Pbias). The Pearson correlation coefficient (r) evaluates how well the estimates (from reanalysis products) correspond to the observed rainfall values, while RMSE measures the average magnitude of the estimate errors, and Pbias reflects how the estimated rainfall can either overestimate or underestimate the rainfall ground observations. The summary of performance indices is presented in Table 2.

2.2.4. Satellite Images

Three Landsat images were used to map and investigate the land cover changes over the last thirty years in the Sota catchment. These are Landsat 5, Landsat 7, and Landsat 8 images, respectively, acquired for the years 1990, 2005, and 2020. The scenes are available with a spatial resolution of 30 m and were freely downloaded from http://earthexplorer.usgs.gov (accessed on 8 September 2023). The approach selected for image analysis is based on a single acquisition rather than a time series approach. Similarly to the climate data period, we also wanted to analyze land use from 1960 to 2020. However, satellite images are not available in the region in the 1960s or even in the 1970s, making it difficult to make a LULC classification in these years. The Global LULC data over Africa available in 1975 could have been used, but they are less accurate since their image resolution is 2 km. Good-quality satellite images of the region are available from 1986 with a resolution of 30 m. Therefore, we proceeded to a LULC classification using the most recent available images of good quality. We found it better to split the study period into a 15-year period to have 3 dates (1990–2005–2020) with similar intervals, and especially to have the possibility to better identify and analyze the changes. The following nine land cover classes (hereafter) were considered in image classification: woodland, dense forest, gallery forest, savanna, waterbodies, agriculture, baresoil, rocky land, and settlements. The choice of these classes was guided by: (i) the previous work carried out in the study area [19,20], (ii) the knowledge of the study area, and (iii) the ease of identifying classes

2.3. Climate and Land Cover Data Analyses

2.3.1. Standardized Rainfall Anomaly Index

Inter-annual rainfall variability and dry and wet years were evaluated in the Sota catchment over the period 1960–2019, with the Standardized Anomaly Index (SAI) [33,34].
SAI formula is given as:
Z = X i µ σ
Z is the standardized anomaly of the variable for the year i; Xi is the annual mean of the variable for the year i; µ  is the mean of the variable over the observation period; and σ is the standard deviation of the variable over the observation period.
The computed SAI was interpreted for the dry and wet years with the scale of [34] (Table 3).

2.3.2. Mean Annual Rainfall Catchment Calculation and Break Points Detection

Mean annual rainfall at the catchment scale was calculated following the method of Thiessen [35]. To this end, ArcGIS software 10.1 was used.
Break point detection methods, namely the Pettitt test [36] and the E-Divisive means (EDM) algorithm [37], were performed to detect the change points in the rainfall and temperature time series. While the Pettitt test allows a single change point in a time series to be detected, the EDM algorithm can detect one or more statistically significant change points. EDM can detect both “mean shift” (sudden change) and “ramping” (gradual change) and is robust to the presence of anomalies, which is relevant in our case. To this end, the package BreakoutDetection (https://github.com/twitter/BreakoutDetection) (accessed on 3 December 2023) built on the EDM algorithm was used in R software (4.3.0). The Pettitt test was performed using the package Trend in R software (4.3.0).

2.3.3. Trend Analysis of Rainfall and Temperature

The non-parametric modified Mann–Kendall (MMK) test and Sen’s slope estimator were used for trend detection and trend magnitude in the time series.
Mann–Kendall is a rank-based non-parametric test for detecting a monotonic trend in a time series. The method was originally used by [38] and the test-statistic distribution was subsequently derived by [39] and then polished by [40]. The MK test assumes a null hypothesis (H0) that there is no trend which is tested against the alternative hypothesis (HA) of the presence of a trend.
The null hypothesis H0 is that a data series is serially independent and identically distributed with no trend. The alternative hypothesis, HA, is that the data follow a monotonic trend.
The Kendall test statistic S is calculated according to:
S = k = 1 n j = k + 1 n + 1 s g n x j x k
where xj and xk are the annual data values in years j and k, j > k, respectively. n is the dataset record length.
s g n x j x k = 1   i f   x j x k > 0 ; 0   i f   x j x k = 0 ; 1   i f   ( x j x k ) < 0
S is an approximately normal distributed random variable with a mean of 0 and the variance VAR(S).
V A R S = n n 1 2 n + 5 p = 1 q 1 t p t p 1 2 t p + 5 18
where n is the number of observations in the data series, q is the number of groups, and tp is the size of the pth tied group.
The statistic S is approximately normally distributed provided that the following Z-transformation is employed:
Z = s 1 V A R S   i f   S > 0 ; 0   i f   S = 0 ; s + 1 V A R S   i f   S < 0
The presence of a statistically significant trend is evaluated using the Z value. A positive Z indicates an increasing trend, while a negative value indicates a decreasing trend.
The MK test requires sample data to be serially independent. When sample data are serially correlated, the presence of serial correlation in time series will affect the ability of the test to correctly assess the significance of the trend. To eliminate the effect of serial correlation on the MK test, the modified Mann–Kendall test MMK is used:
The corrected variance is then calculated as:
V * ( S ) = V ( S ) . n n *
where n n * i s  the variance correction factor, and V(S) is from Equation (4). The rest is the same as in the MK test
n n * = 1 + 2 n ( n 1 ) ( n 2 ) × k = 1 n 1 ( n k ) ( n k 1 ) ( n k 2 ) ρ k
ρ k is the lag-k serial correlation coefficient.
The non-parametric test of Sen’s slope was employed to estimate the magnitude of the slope in the sample of N data pairs [41]. The slope estimates of each data pair Qi are computed as:
Q i = ( X i X j ) j i
For i = 1, 2, …, N
where Xi and Xj (j > i) are considered as data values at the times i and j, respectively.
If there are Xi-values in the time series, we have N = n (n − 1)/2 slope estimates. The values of Qi are ranked from small to large. Sen’s slope is defined as the median value (Qmed) of this series, which is computed as:
Q med   = T N + 1 2                                                         N   is   odd 1 2   T N 2 + T N + 2 2                 N   is   even
Sen’s estimator is computed as Qmed = T(N + 1)/2 if N appears odd, and it is considered as Qmed = [TN/2 + T(N + 2)/2]/2 if N appears even. At the end, Qmed is computed by a two-sided test at 100(1 − α)% confidence interval, and then a true slope can be obtained by the non-parametric test. A positive value of Qi indicates an upward or increasing trend and a negative value of Qi gives a downward or decreasing trend in the time series.

2.3.4. Land Cover Classification and Assessment of the Changes

The satellite images obtained for our study underwent a comprehensive pre-processing procedure to ensure their suitability and reliability. This meticulous pre-processing regimen encompassed radiometric, atmospheric, and georeferencing corrections, meticulously executed within the UTM-31 WGS-84 North datum reference framework. The primary objective of these corrections was to eliminate any undesired noise and artifacts present in the images, thereby substantially enhancing their visual clarity and information quality. Furthermore, these meticulous corrections primed the images for subsequent supervised classification [42,43,44]. Following the pre-processing phase, a series of operations encompassing image extraction and mosaicking were employed to generate consolidated and spatially consistent image datasets. Subsequently, a false-color compositing technique was systematically applied to enhance the visual interpretation and analysis of the information embedded within the images. To facilitate an accurate supervised classification process, training areas were meticulously delineated through the application of the maximum likelihood algorithm. Maximum likelihood is one of the most popular supervised classification methods used with remote sensing image data among several algorithms of supervised approach [44]. The maximum likelihood classification assumes that the statistics for each class in each band are normally distributed and calculates the probability that a given pixel belongs to a specific class [45]. Unless a probability threshold is selected, all pixels will be classified and each pixel is assigned to the class that has the highest probability [46].
The classification of the satellite images was executed by categorizing them into nine distinct land cover classes, namely agriculture, woodland, dense forest, gallery forest, settlements, waterbodies, savannah, baresoil, and rocky terrain. Typically, satellite image classification relies on a fusion of remotely sensed data with ground-based reference data or aerial photographs captured in close temporal proximity to the satellite pass [42,43]. However, in the context of Benin, the availability of such reference data was limited, necessitating the utilization of very high-resolution imagery sourced from various platforms within Google Earth [47] as the reference dataset for our classification efforts. To ensure the precision and validity of the classification results, points of interest were methodically established using Google Earth imagery for the years 1990, 2005, and 2020, with a keen emphasis on aligning these points with the spectral signatures characteristic of the land cover classes observed within the Landsat images. Additionally, supplementary points of interest were meticulously gathered in the field during December 2022, specifically tailored to the year 2020, thereby reinforcing the robustness and accuracy of the classification. For each of the three years, a substantial number of points of interest have been accurately considered for each land cover class, including a minimum of 100 points for 1990 and 2005, and an increased number of 150 points for the year 2020. This methodological approach proved instrumental in enhancing the differentiation of land cover classes that might exhibit spectral similarities during the supervised classification process [48].
Subsequently, the interpretative phase of our study involved visual analysis of the images employing Quantum GIS 2.18. A critical step in the validation process involved conducting on-site field verifications to authenticate the accuracy of the classification outcomes and the resultant land cover maps. The robustness and accuracy of the classification were methodically assessed by the two commonly used overall measures of accuracy: the Kappa coefficient and the overall accuracy (OA) indices [49]. These analytical metrics provided valuable insights into the quality and reliability of the classification, while simultaneously aiding in the identification and mitigation of any potential errors or uncertainties. In fact, OA shows the probability of correct classification of a randomly selected location on the map [50]. The Kappa coefficient varies between −1 and 1. A value of 0 implies that the classification is similar to a random classification. A negative value for Kappa indicates that the classification is significantly worse than random classification. A value close to 1 shows that the classification is correct [46].
To assess the land cover changes over the three periods, the areas of the different classes classified were calculated and then compared between the periods.

3. Results

3.1. Satellite Rainfall Data Validation

The results of statistical evaluation indices for the reanalysis products ERA5 and WFDE5 are summarized in Table 4.
Table 4 shows that generally WFDE5 performed better than the ERA5 product. WFDE5 and ERA5 reanalysis are available from 1979 and 1940, respectively. The missing values in the stations’ datasets are found after 1979, except for the station of Segbana where five missing years are found before 1979. Since WFDE5 has the best performance, the missing years in the stations were replaced with the WFDE5 reanalysis data. However, for the station of Segbana, the five missing years found before 1979 were replaced with the ERA5 data and those after 1979 with the WFDE5 data.

3.2. Rainfall Statistical Characteristics

Basic statistical properties (Mean, standard deviation, Maximum, Minimum, coefficient of variation, Skewness, and Kurtosis) of the rainfall time series are given for the seven rainfall stations of the Sota catchment in Table 5.
According to the analysis of the datasets in Table 5, the highest mean annual rainfall was recorded in Ina (1172 mm) and the lowest in Malanville (839 mm). Malanville station also recorded the lowest annual rainfall amount (472 mm). However, the highest annual rainfall (1695.9 mm) is observed for Bembereke station (located in the southern part of the Sota catchment). The minimum standard deviation (155 mm) is observed at the station of Kandi and the maximum (202 mm) in Kalale. The coefficient of variation (CV) varies between 15.22% (Kandi) and 18.81% (Malanville) with an average of 16.60% in the entire catchment and revealed less inter-annual variability of annual rainfall over the study area. In fact, CV values < 20% indicate low variation, while a CV between 20% and 30% indicates moderate variation, and CV > 30% indicates high variation [51,52]. The skewness varies between 0.06 and 0.75, with a prevalence of positive skewness and an average around 0.32 indicating that annual rainfall during the period is asymmetric and lies to the right of the mean over all the stations. Kurtosis varied from −0.44 to 0.93, with an average of around 0.26. The annual mean rainfall in the catchment (over the period 1960 to 2019), calculated using the Thiessen polygon method, is 1050.14 mm (±15.92).

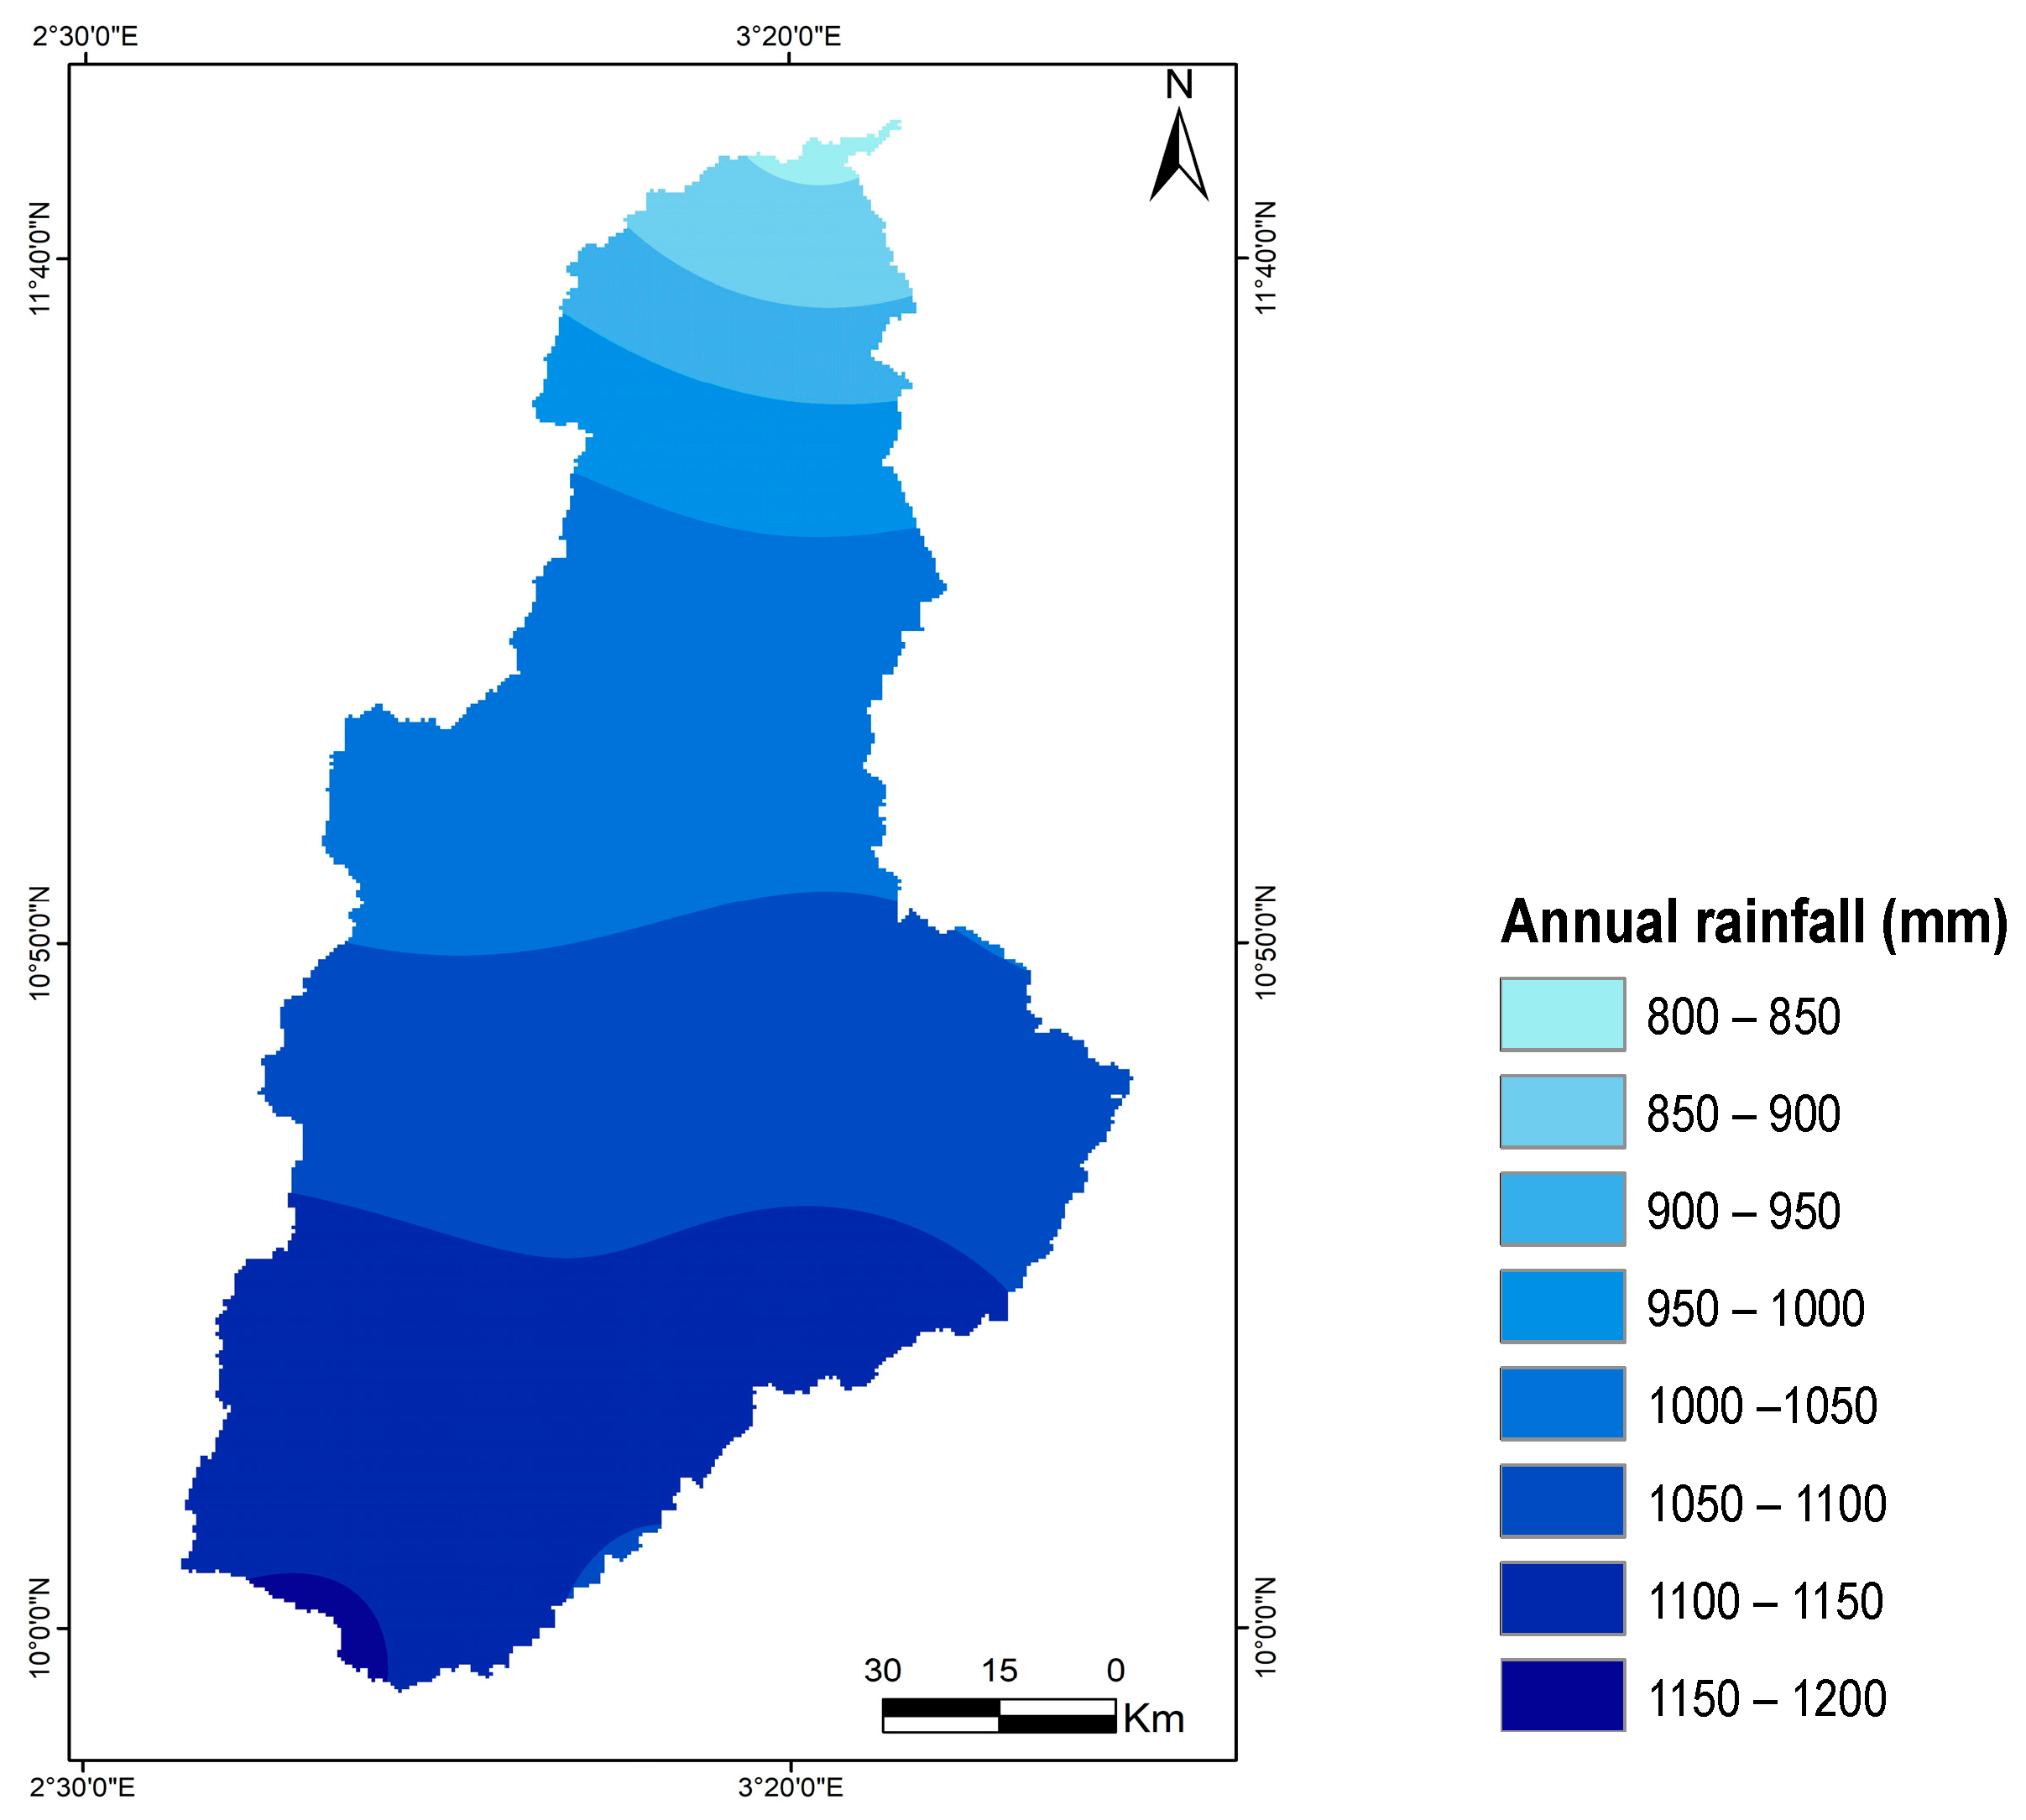
3.3. Spatial Distribution of Rainfall in the Sota Catchment from 1960–2019

The spatial distribution of annual rainfall over the period 1960–2019 was plotted (Figure 2 and Figure 3). From Figure 2, it is observed that the highest rainfall values were recorded in the southern part, and the lowest values were recorded in the northern part of the study area. As we progress from the south to the north of the Sota catchment, the rainfall amount decreases.

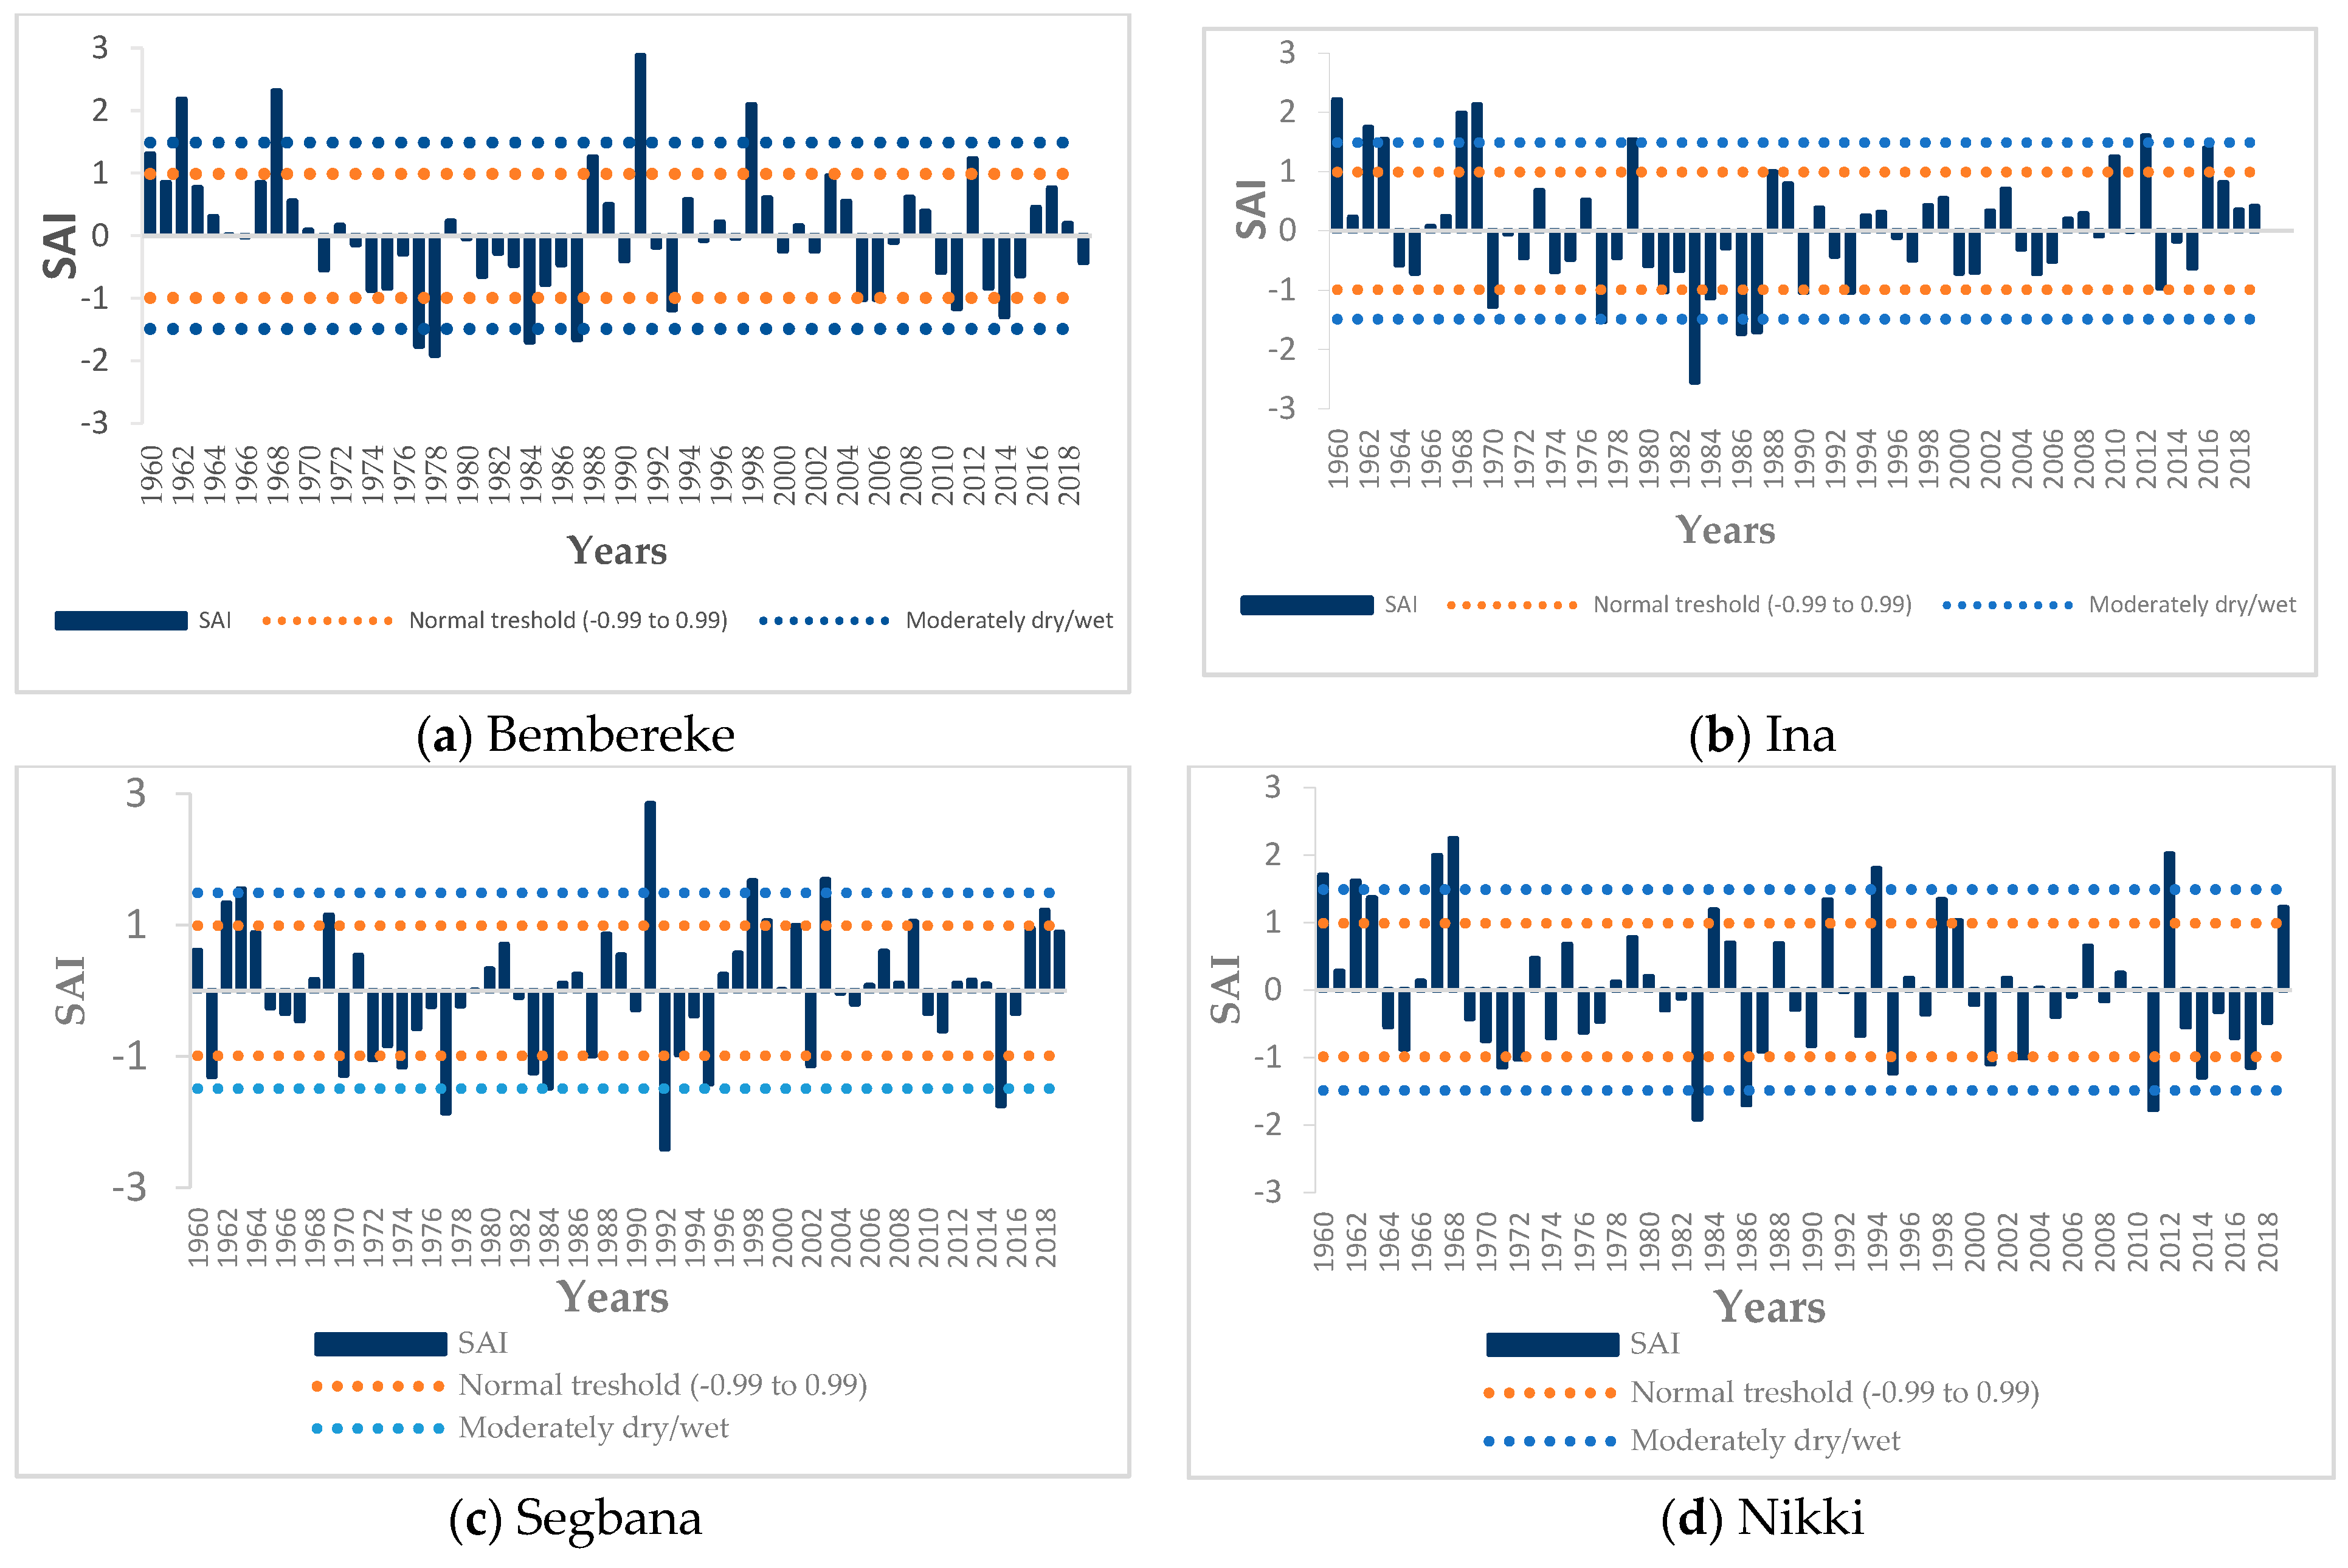
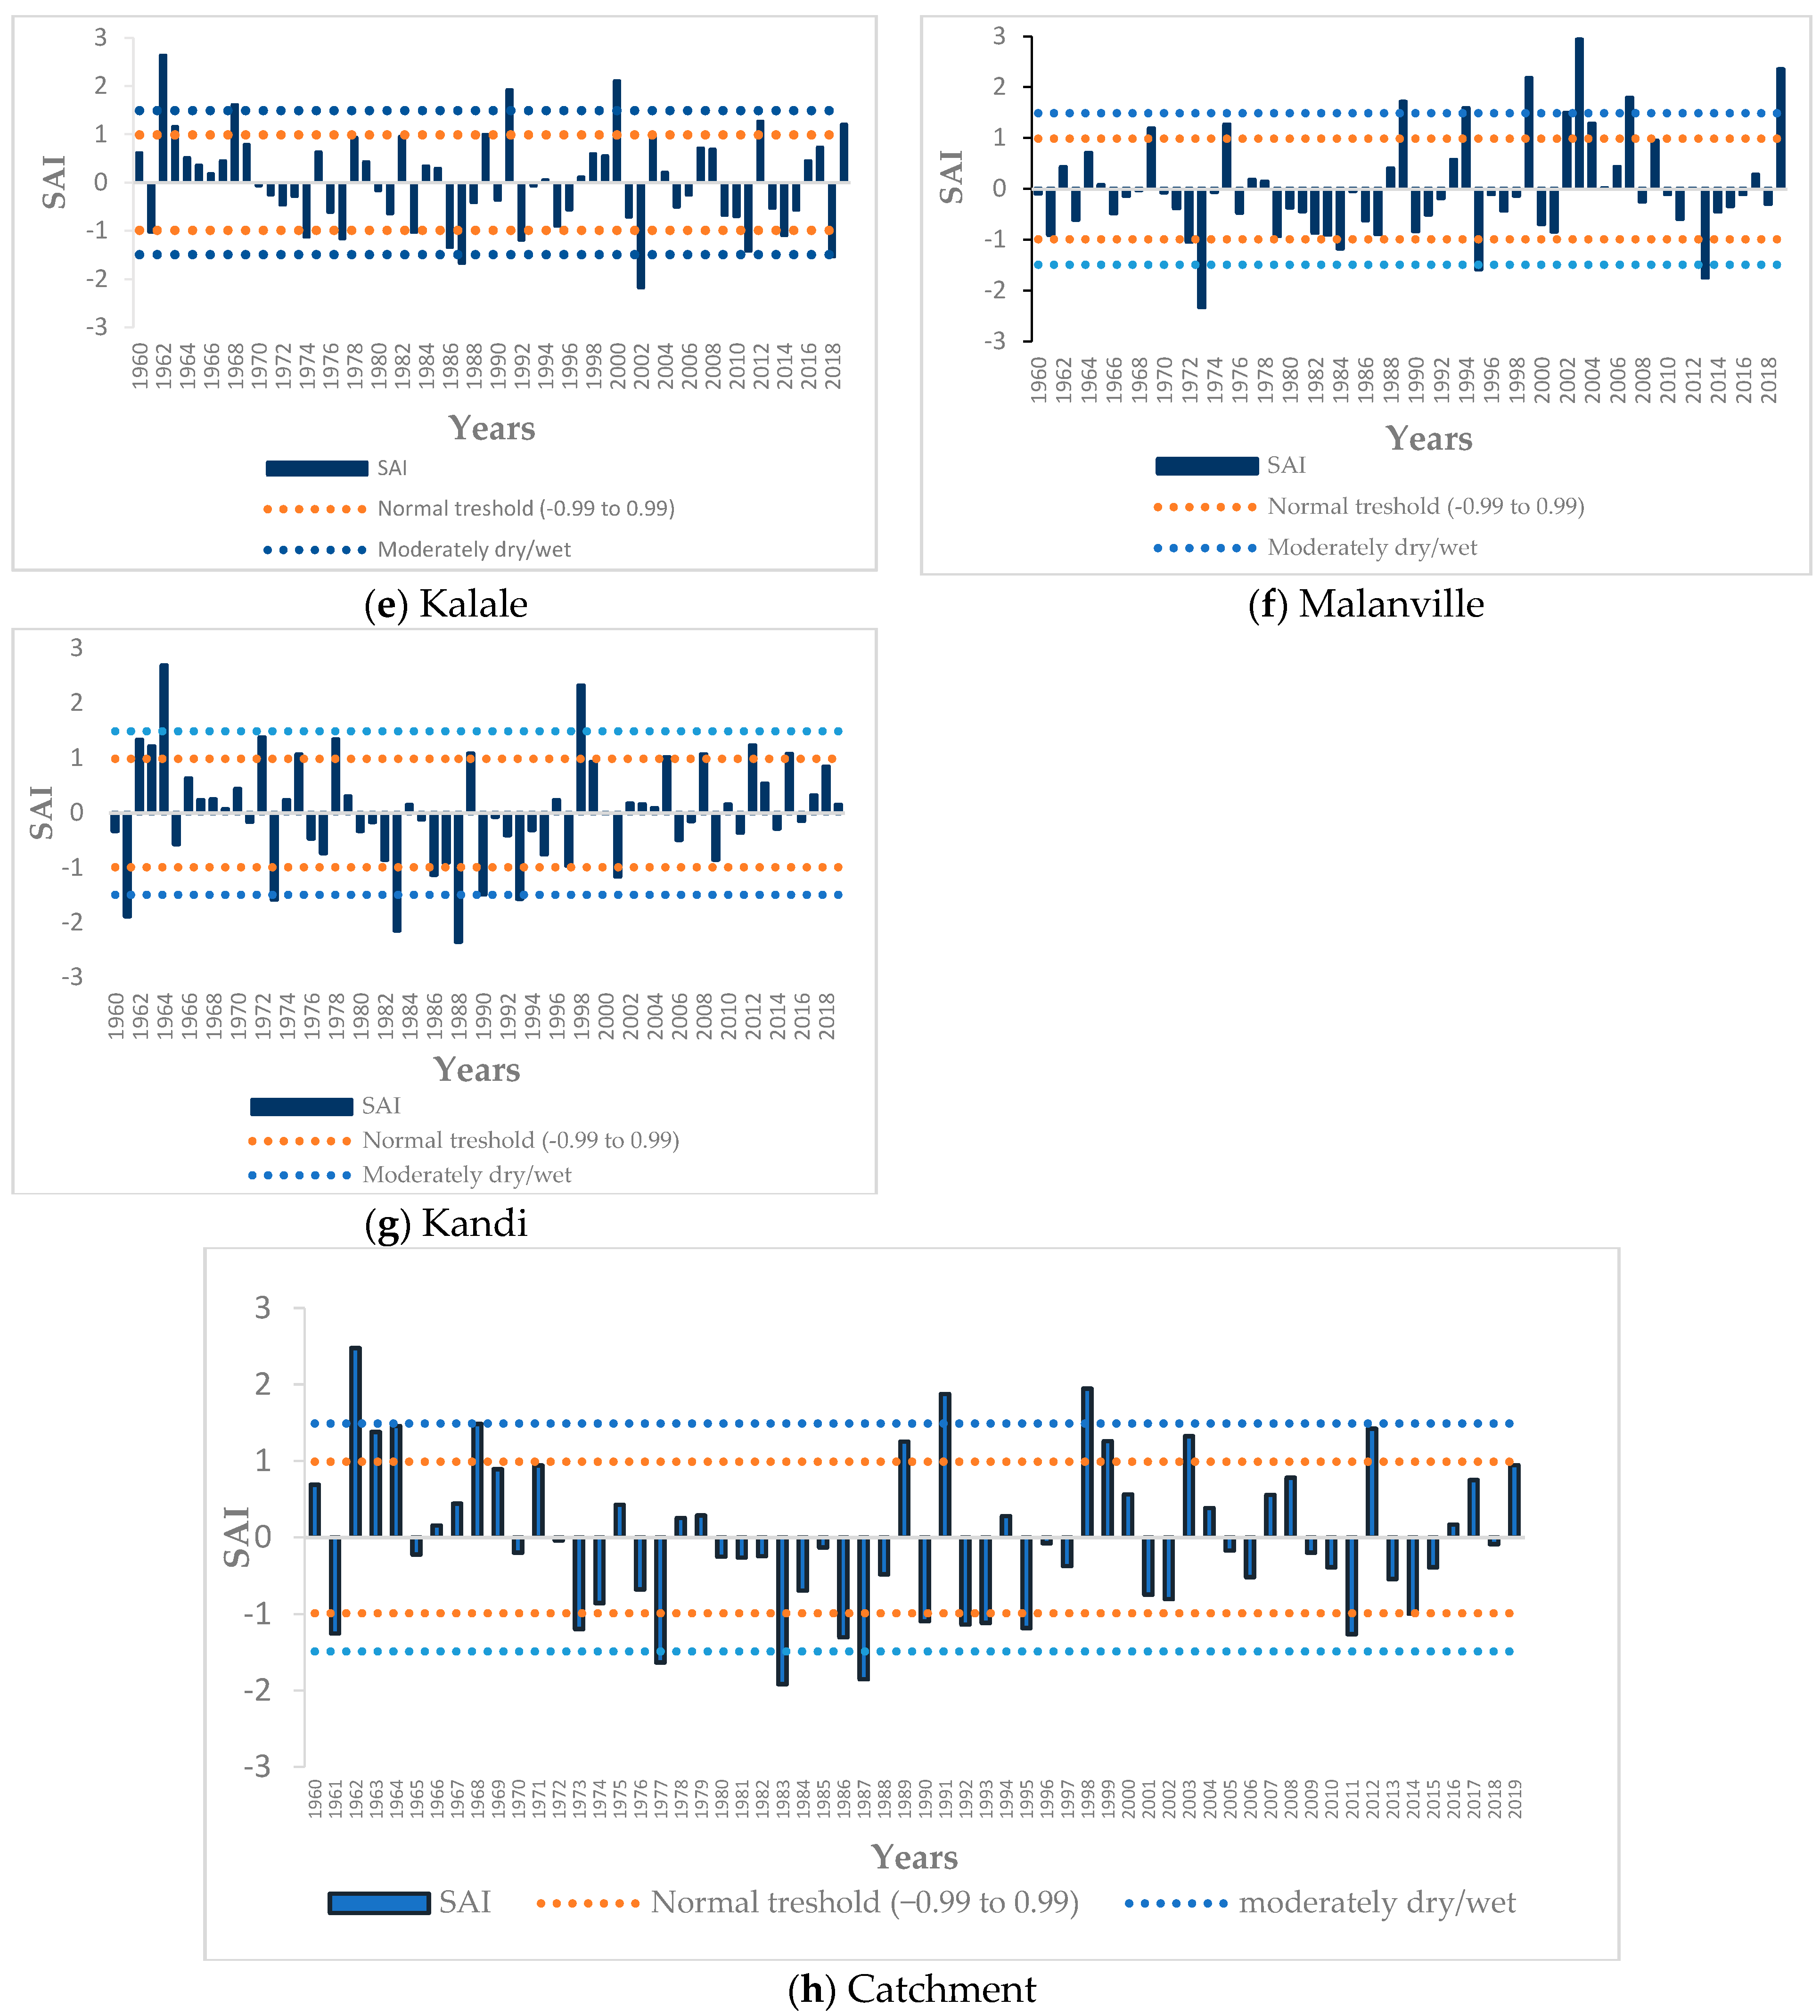
3.4. Rainfall Anomalies Analysis

The results of the Standardized Anomaly Index (SAI) analysis of annual rainfall for the individual stations are shown in Figure 3. The drier years are observed in 1983 at the stations of Nikki and Ina, and in 1973, 1978, 1988, 1992, and 2002, respectively, at the stations of Malanville, Bembereke, Kandi, Segbana, and Kalale. The extremely wet years were observed in 1991 at both the stations of Bembereke and Segbana, and in 1960, 1962, 1964, 1968, and 2003, respectively, at the stations of Ina, Kalale, Kandi, Nikki, and Malanville. At all the stations, a dry period is clearly identifiable in the 1970s and 1980s with the prevalence of negative rainfall anomalies. At the catchment scale, the extremely wet year is 1962, and the extremely dry year is 1983. A prevalence of negative rainfall anomalies is observed in the 1970s and 1980s, and the period before the 1970s and after the 1990s is characterized by the prevalence of positive anomalies.
The percentage of normal, wet, and dry periods in the different rainfall stations during the period 1960–2019 is presented in Table 6.
Table 6 indicates that normal years prevail (>60%) at all the stations and at the catchment scale. Four stations (57%) indicate a higher percentage of wet years compared to dry years. Two stations (28.57%) show a higher percentage of dry years compared to wet years, and one station shows an equal percentage of wet and dry years. The station of Malanville has the highest percentage of normal years and the station of Nikki has the smallest percentage of normal years. The stations of Kandi and Nikki both have the highest percentage of wet years. The stations of Segbana and Malanville have, respectively, the highest and the smallest percentage of dry years.

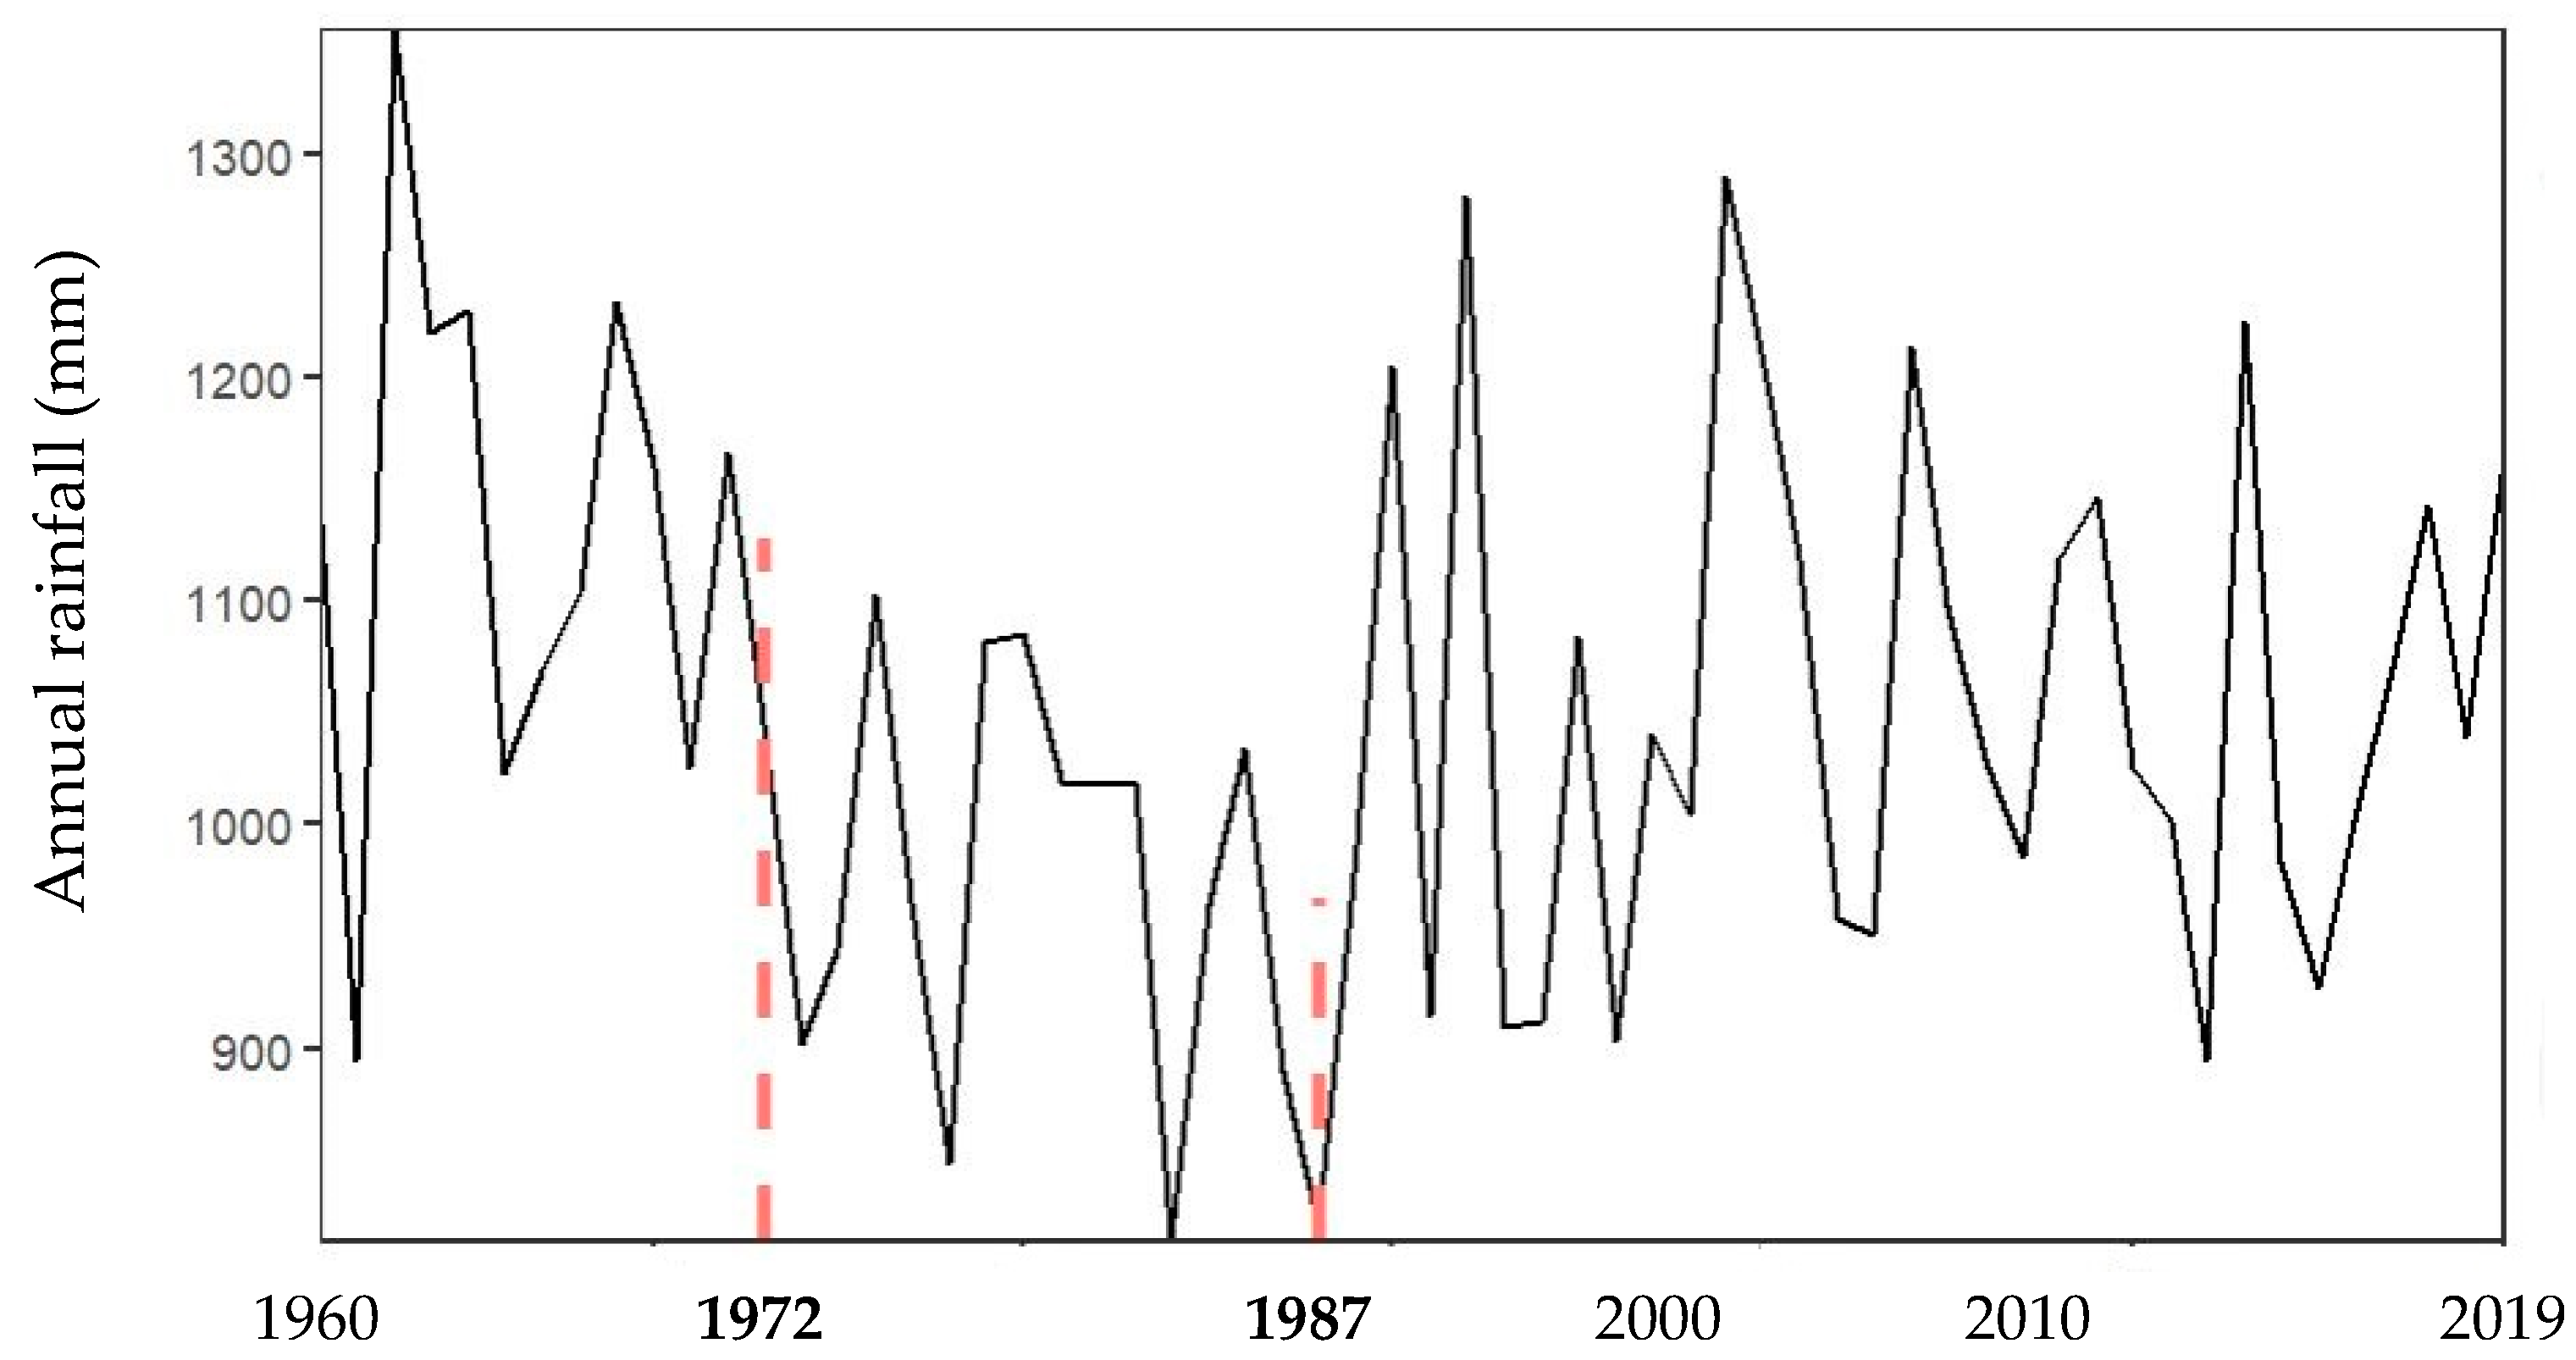
3.5. Rainfall Break Points Detection

The break points analyses applied to the annual mean rainfall times series at the catchment scale revealed two break points in 1972 and 1987 (Figure 4). The break point in 1972 marked the beginning of the dry period, while the break point in 1987 indicated a shift to a wet period.
The difference between the three periods is presented in Table 7.
Table 7 indicates that there is a reduction of 160.60 mm in the average rainfall between the first period (1960–1972) and the second period (1973–1987), while an increase of 105.13 mm is noted between the second (1973–1987) and the third periods (1988–2019). The t-Student test shows that the differences between the break points pre- and post-periods are significant (p ˂ 0.05).
From Figure 3 and Figure 4, and Table 7, we can see three periods characterized the rainfall pattern in the Sota catchment from 1960 to 2019. These are:
-
A wet period from 1960 to 1972 (with an average annual rainfall of 1127.85 mm),
-
A dry period from 1973–1987 (with an average annual rainfall of 967.24 mm)
-
A wet period from 1988–2019 (with an average annual rainfall of 1072.37 mm).

3.6. Rainfall Trend Analysis

The results of the trend detection and trend magnitude of annual and seasonal rainfall from the data of the seven stations, using Modified Mann–Kendall and Sen’s slope estimate, are shown in Table 8.
From the results in Table 8, the rainfall datasets at the stations of Nikki, Kalale, and Ina show a significant decreasing trend of annual rainfall, while the station of Bembereke shows an insignificant decreasing trend. However, the station of Segbana shows a significant increasing trend in annual rainfall. Malanville and Kandi recorded an increasing annual rainfall trend, though insignificant. At the catchment scale, the MMK test reveals that there is a non-significant decreasing trend of annual mean rainfall over the study period 1960–2019.
The stations with a decreasing rainfall trend represent 57% of the stations and are located in the southern part of the Sota catchment (Bembereke, Nikki, Kalale, and Ina). The stations with an increasing trend represent 43% of the stations and are located in the northern part of the Sota catchment (Kandi, Malanville, and Segbana).
Analysis of seasonal rainfall revealed a significant decreasing trend at the stations of Kalale and Bembereke for both the pre-monsoon and monsoon seasons, while an insignificant decreasing trend is noted at the stations of Nikki and Ina. The stations of Malanville and Kandi show a significant increasing trend of rainfall for the pre-monsoon season while a significant decreasing trend is noted at Segbana. Malanville and Segbana recorded an increasing rainfall trend for the monsoon season, though insignificant.
The magnitude of the Sen’s slope showed that Kalale station witnessed the most significant decreasing annual rainfall while the station of Nikki witnessed the most significant decreasing seasonal rainfall in the monsoon season over the period 1960–2019. The station of Bembereke witnessed the most decreasing seasonal rainfall in the pre-monsoon season. The station of Segbana witnessed the most significant increase in annual rainfall while the station of Malanville witnessed the most significant increasing seasonal rainfall in pre-monsoon season.
In order to better assess the change in rainfall within the Sota catchment, the two normals from 1960 to 1989 and 1990 to 2019 were calculated and compared (Table 9).
From the results in Table 9, a significant decreasing trend of annual rainfall is noted over the first normal 1960–1989, whereas a non-significant increasing trend of annual rainfall is noted over the normal 1990–2019. A slight increase of 9.24 mm in annual rainfall amount between the two normals (1960–1989; 1990–2019) is noted. However, the Student t-test revealed that this slight increase is not even significant (p value = 0.77). As a result, there is no significant difference between the two normals, and rainfall cannot be considered as having changed significantly within the Sota catchment over the 60 years between 1960 and 2019. What occurred during the past 60 years within the Sota catchment is therefore rainfall variability instead of rainfall change.

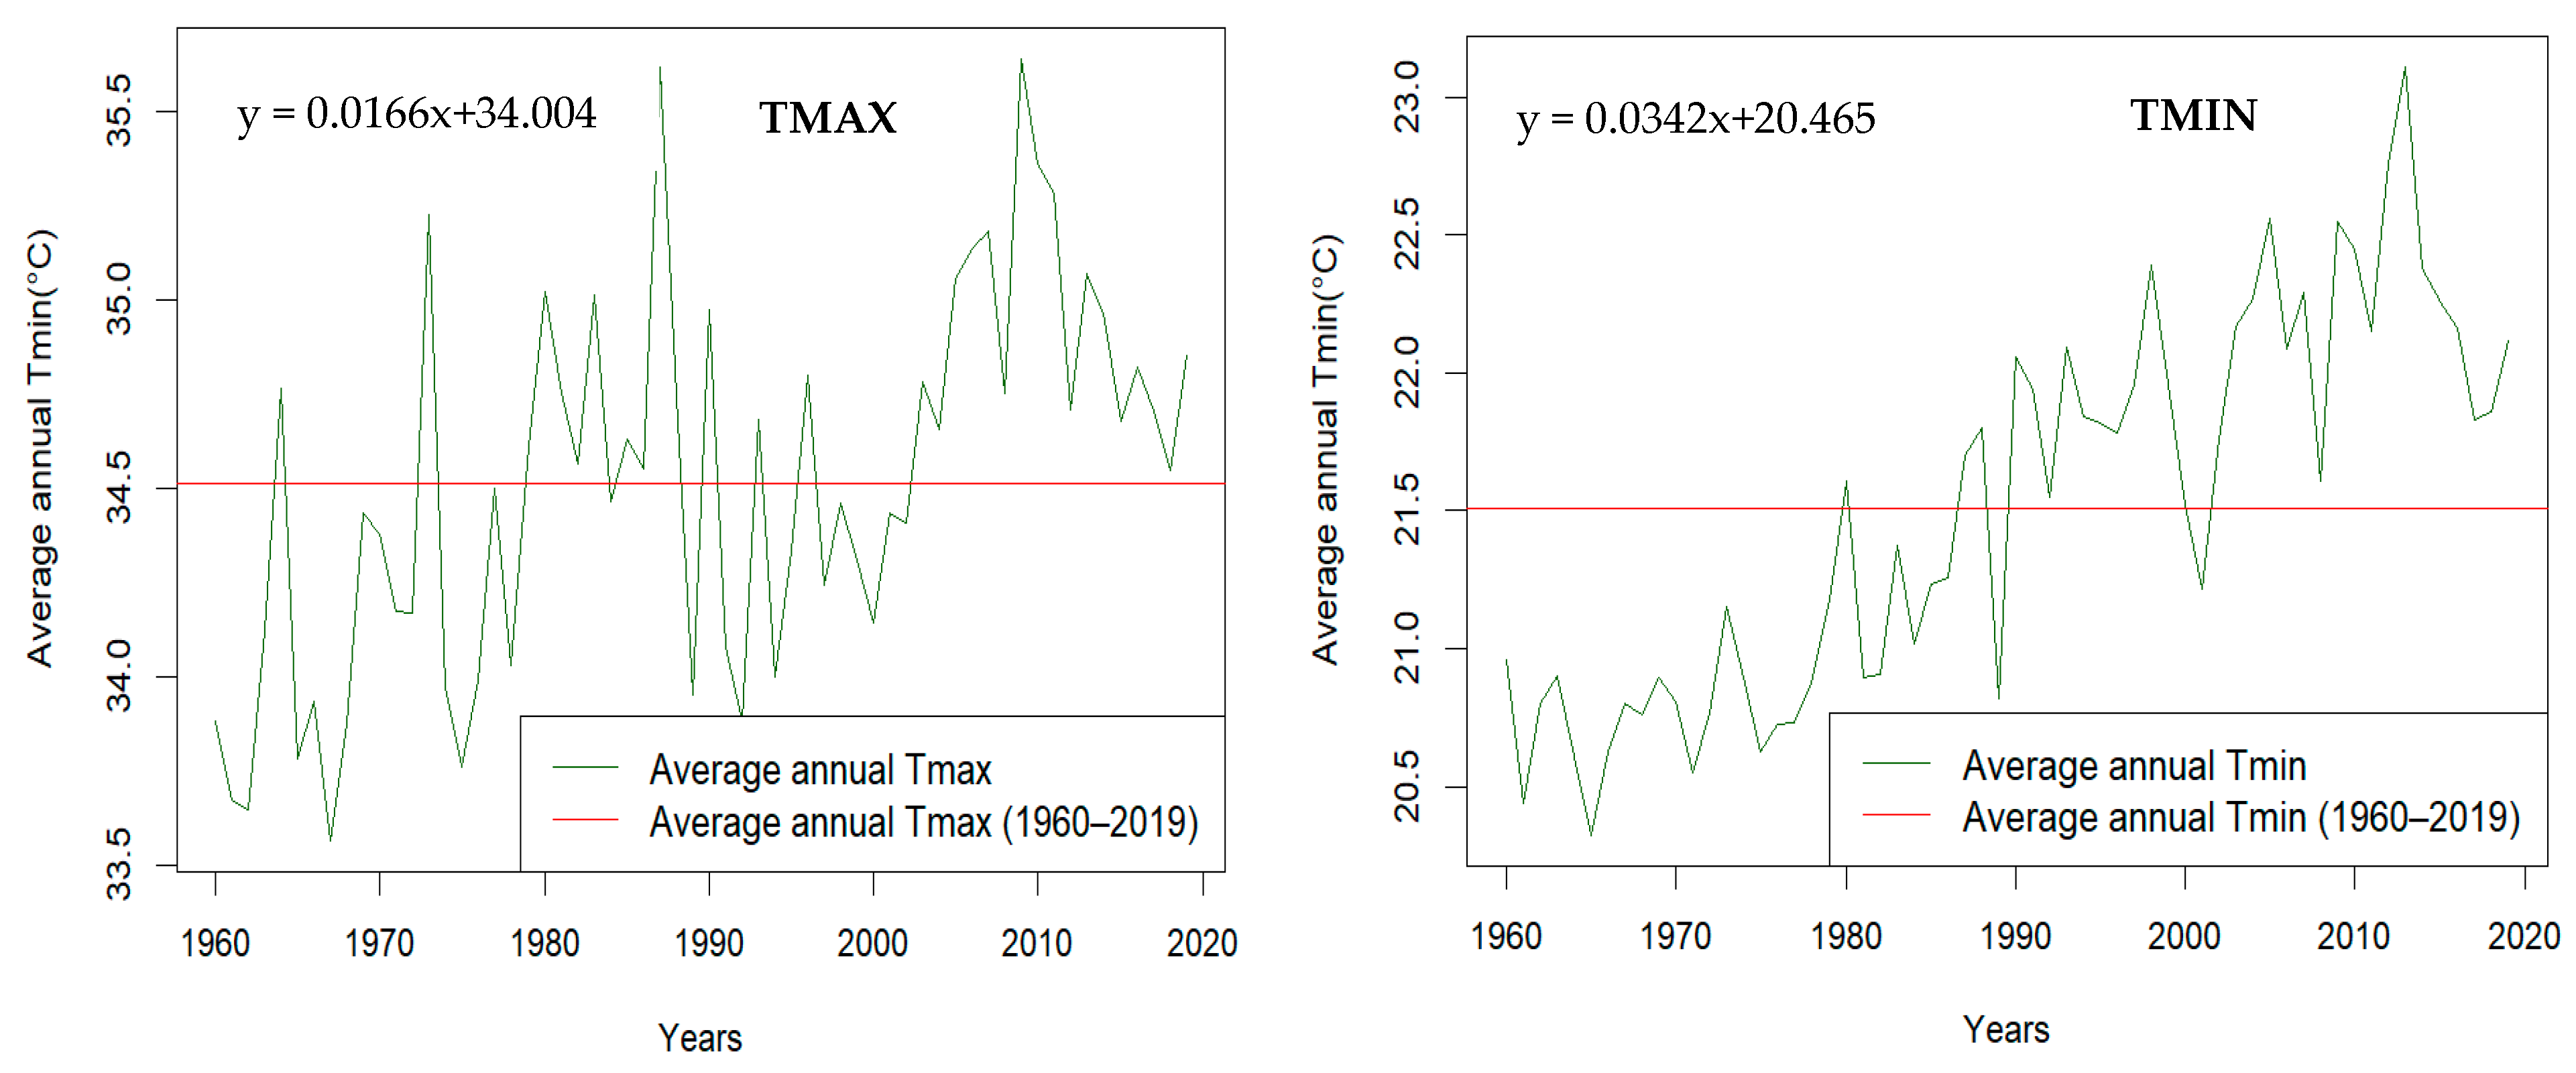
3.7. Temperature Trend Analysis

Changes in annual maximum and minimum temperature times series in the Sota catchment over the period 1960–2019 are presented in Figure 5.
Figure 5 shows a general increase in Tmax and Tmin within the Sota catchment over the period 1960–2019.
The results of the Modified Mann–Kendall test and Sen’s slope estimate, applied to the annual Tmax and Tmin time series, are presented in Table 10.
The MMK trend analysis showed that the mean annual Tmin and Tmax significantly increased, respectively, at the rate of +0.035 °C and +0.018 °C per year at the 95% confidence level over the study period. A significant increasing trend in minimum and maximum temperatures is also noted for each of the two periods 1960–1989 and 1990–2019. The rate of increase is higher for the Tmin than for the Tmax.
In order to better assess the change in temperatures within the Sota catchment, the two normals from 1960 to 1989 and 1990 to 2019 were calculated and compared (Figure 6 and Table 11).
Figure 6 and Table 11 reveal that the period 1990–2019 experienced higher temperatures (Tmax and Tmin) than the period 1960–1989. The rise of temperature is more pronounced in the minimum temperatures than in the maximum temperatures. A significant increase of 0.4 °C and 1.2 °C is observed, respectively, in the average annual Tmax and Tmin between the two periods.

3.8. Temperature Break Points Analysis

The break point analyses applied to the Tmax and Tmin time series reveal that the temperature was not stationary over the study period 1960–2019. Three significant break points were identified in the Tmax time series, respectively, in 1978, 1990, and 2004. The Tmin time series was marked by a single significant break point in 1989. The break point observed in 1990 in the maximum temperatures series marked a slight decrease in the maximum temperatures, while the two others observed in 1978 and 2004 marked an increase in the maximum temperatures.
The results of the break point analyses are presented in Table 12.
The Sota catchment became warmer in the last 60 years with significant changes which occurred from 1978, 1990, and 2004 in the maximum temperatures, and in 1989 in the minimum temperatures. The recent 30-year period (1990–2019) experienced higher temperatures than the previous 30-year period (1960–1989) and the difference between the two normals is significant, confirming a change in temperatures in the Sota region.

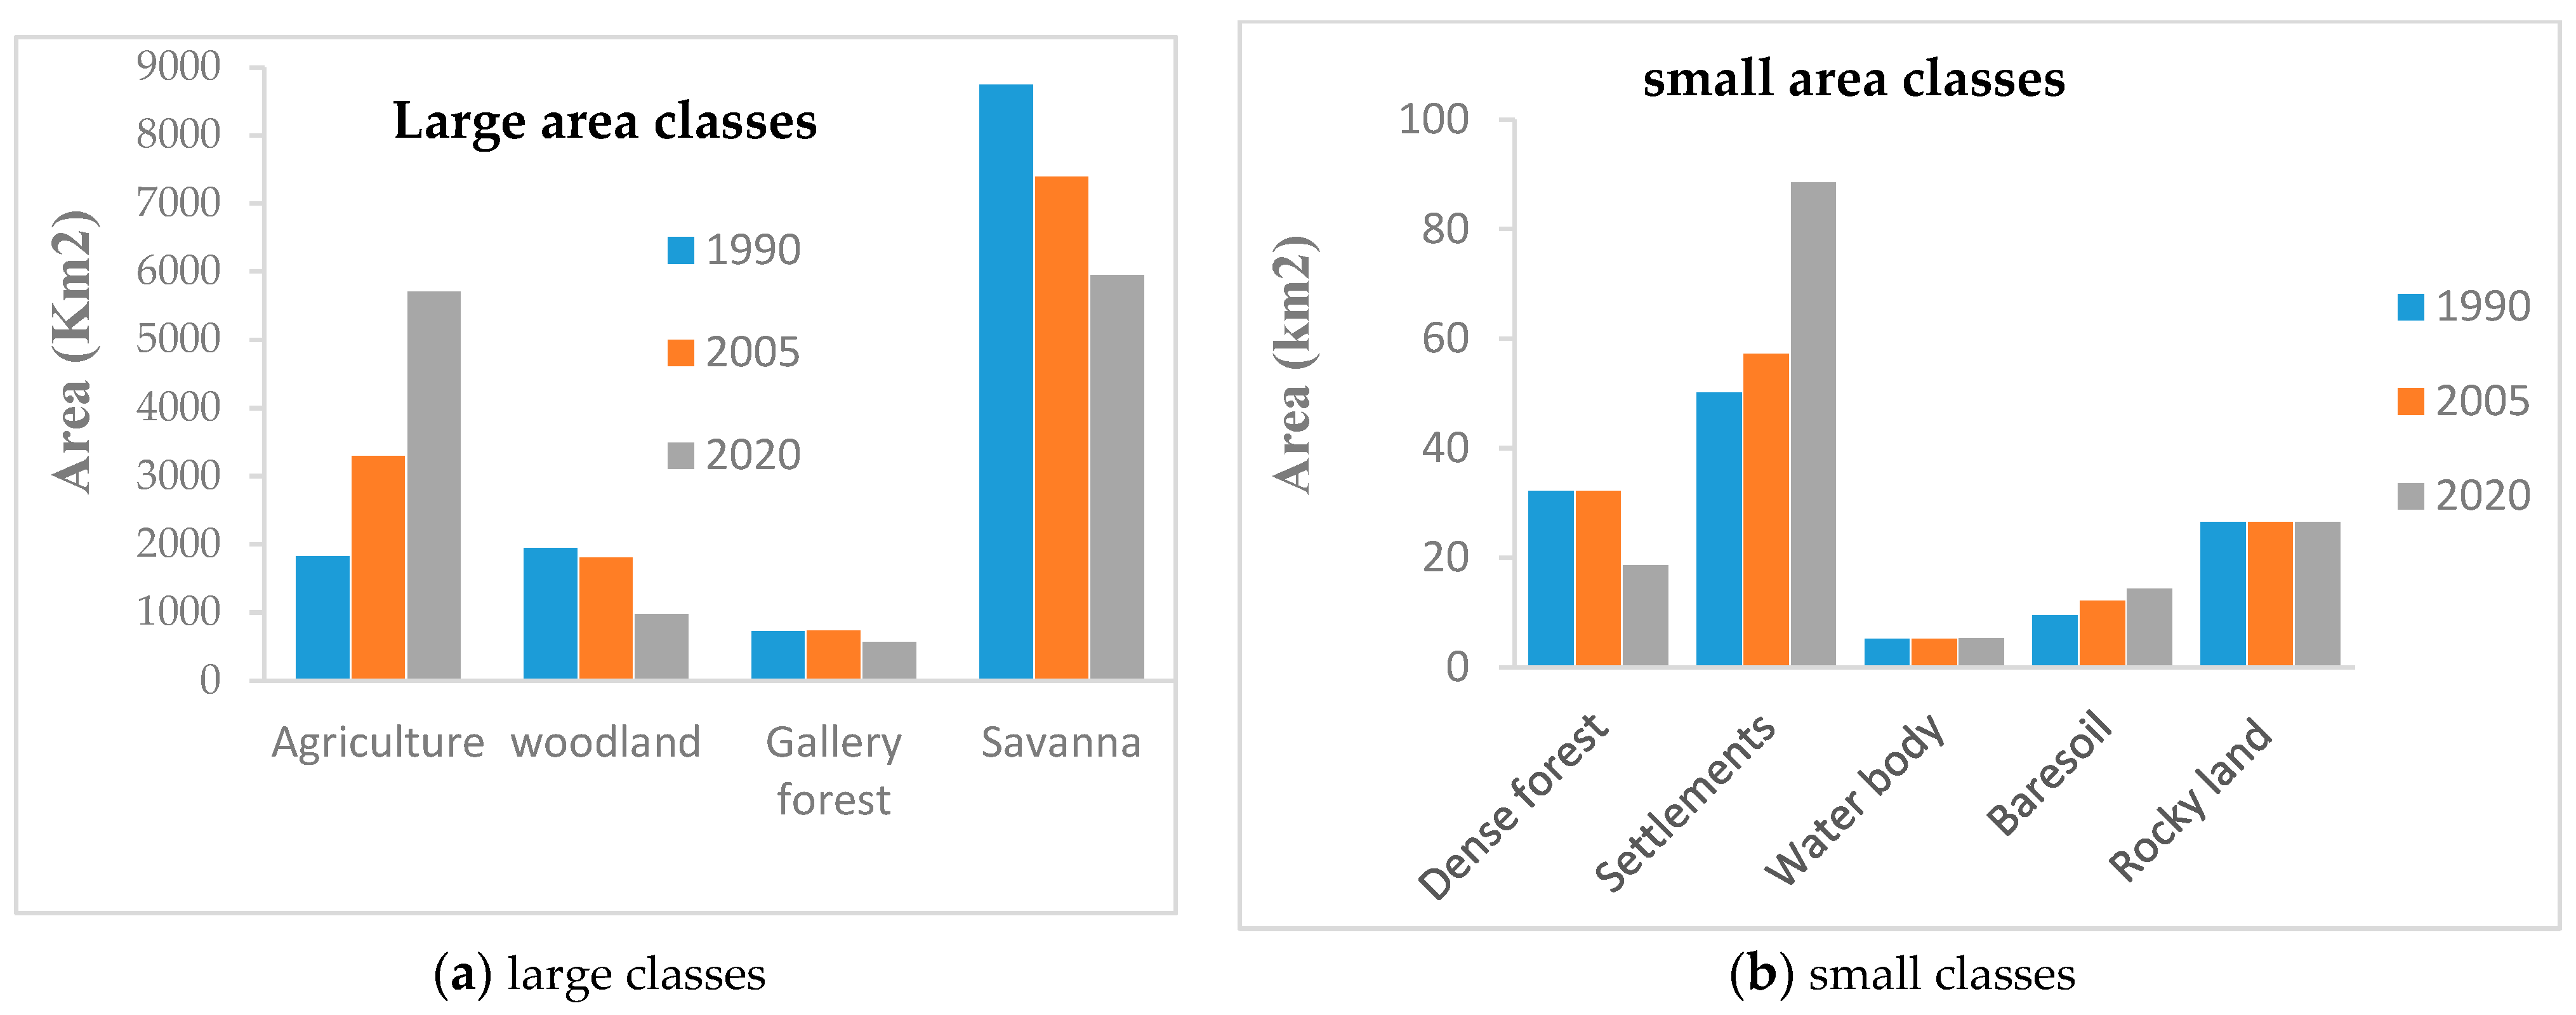
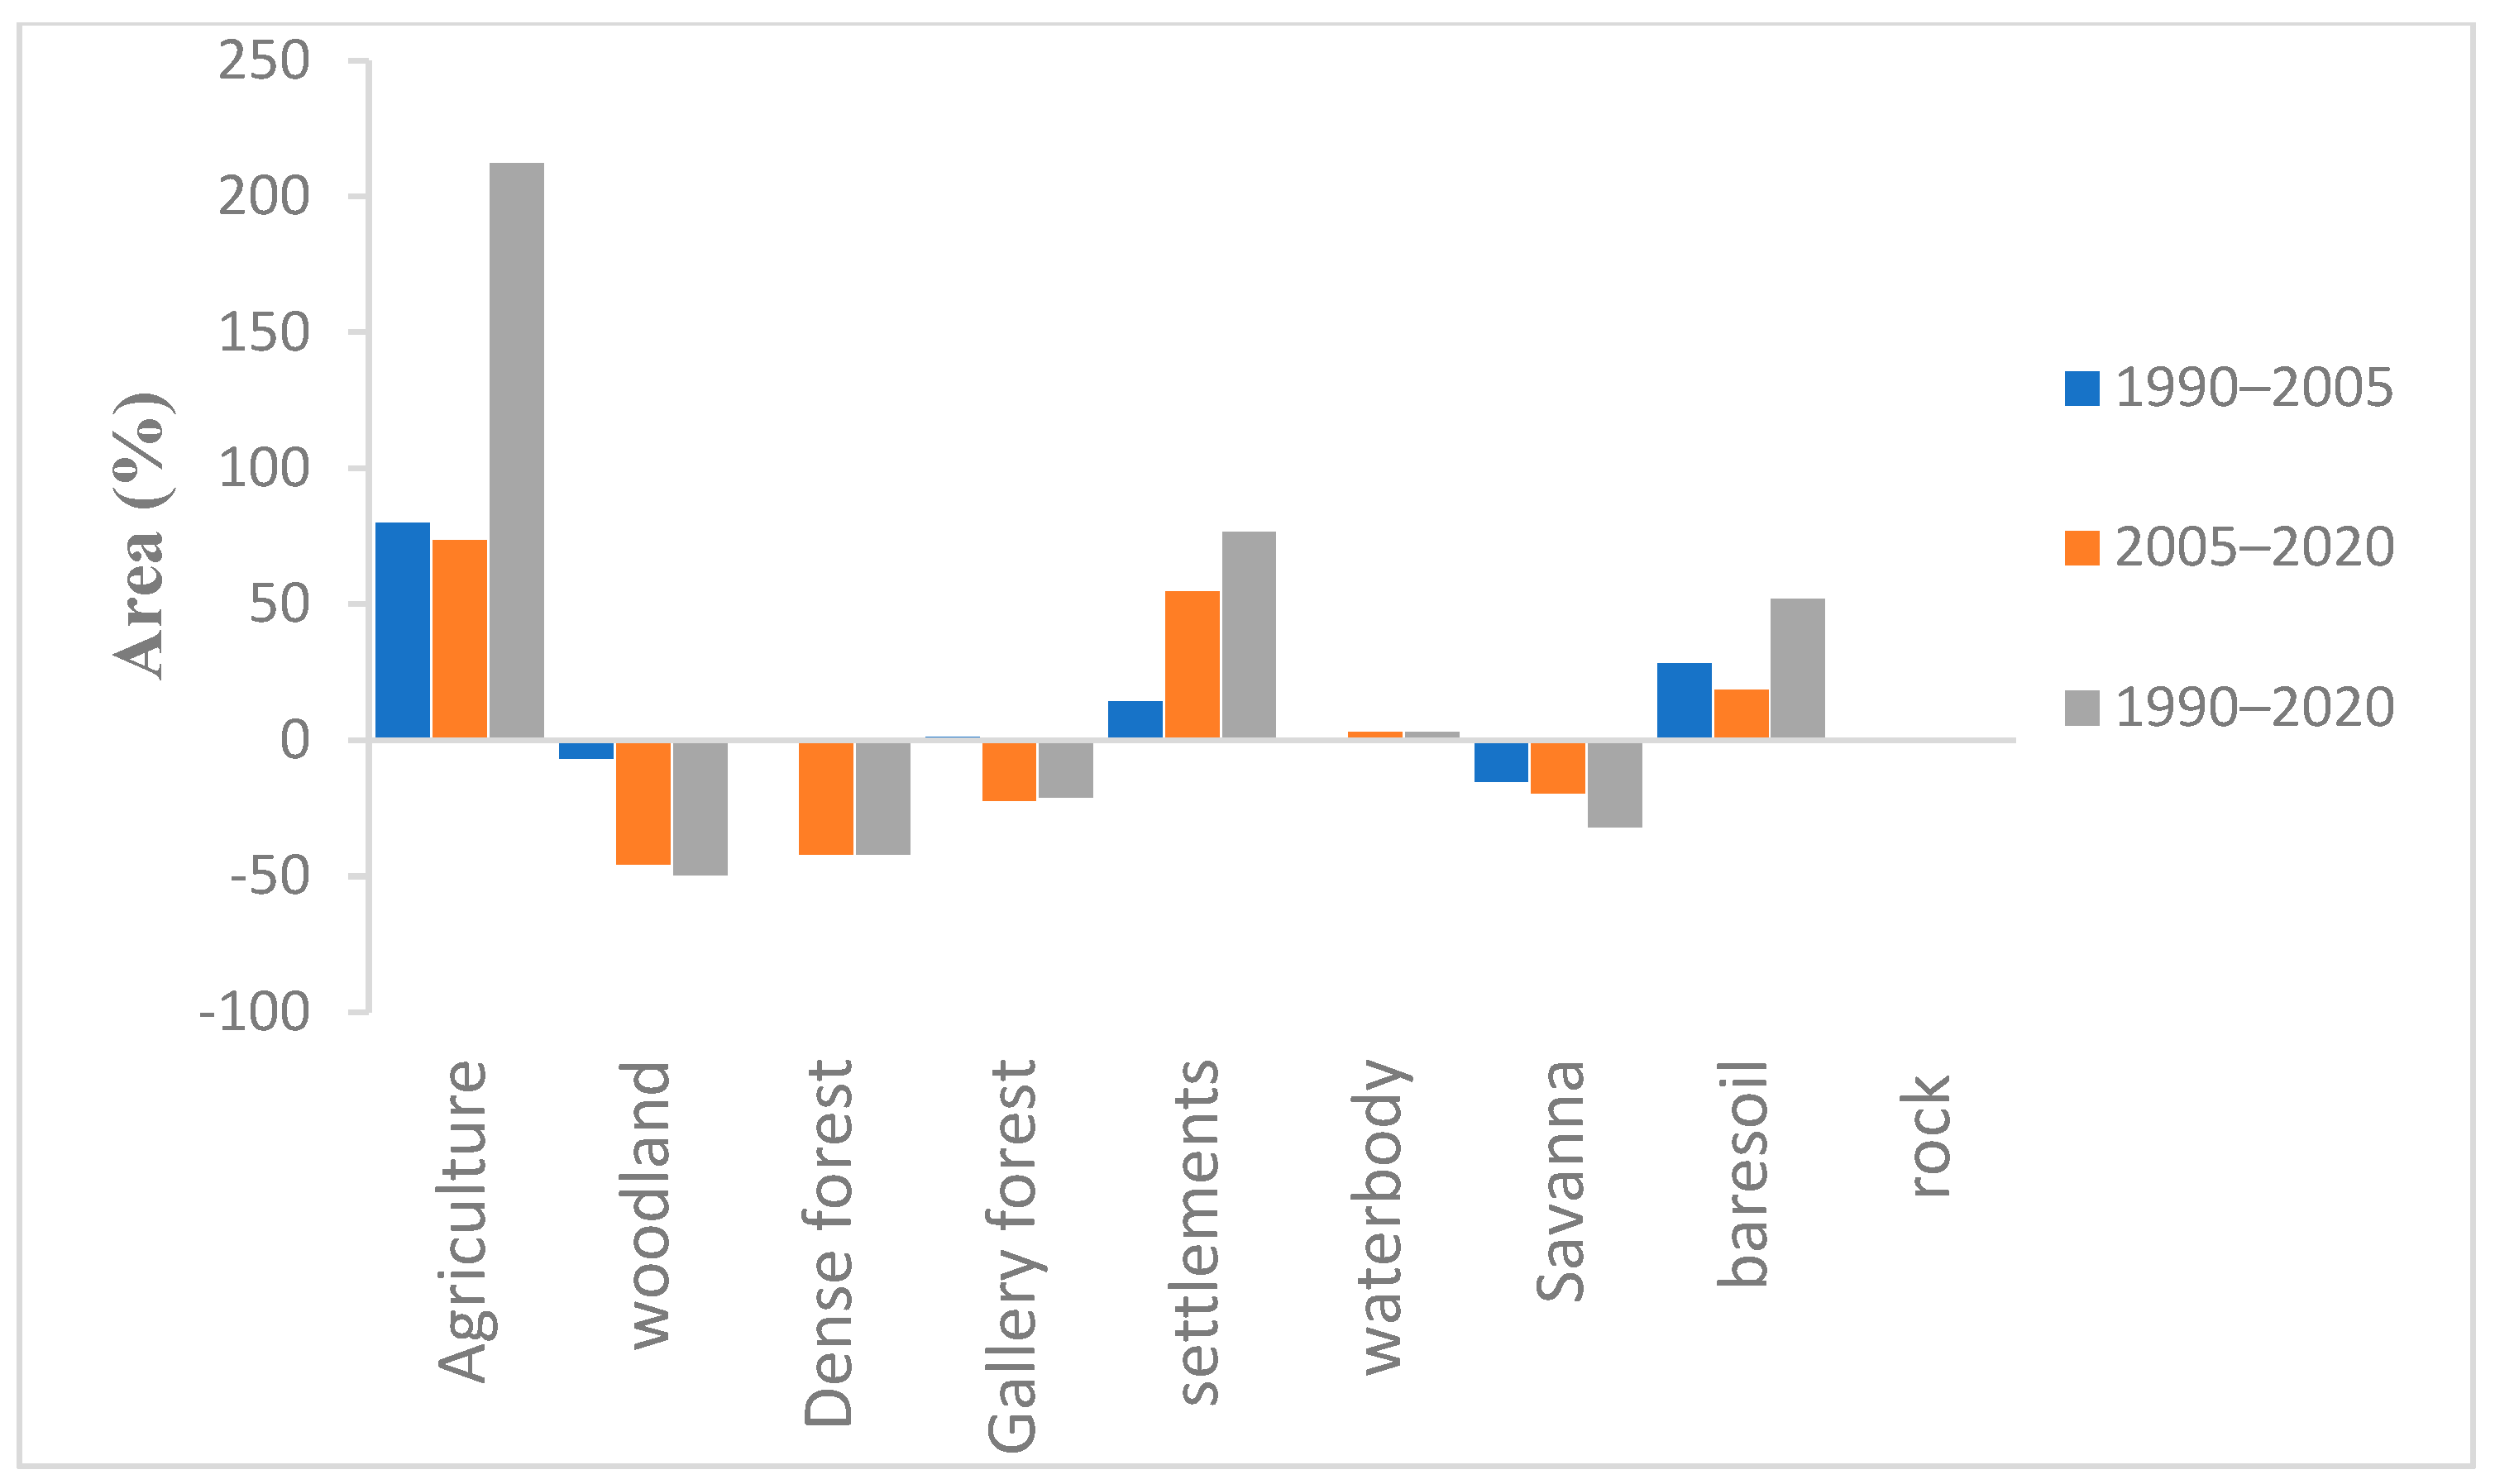
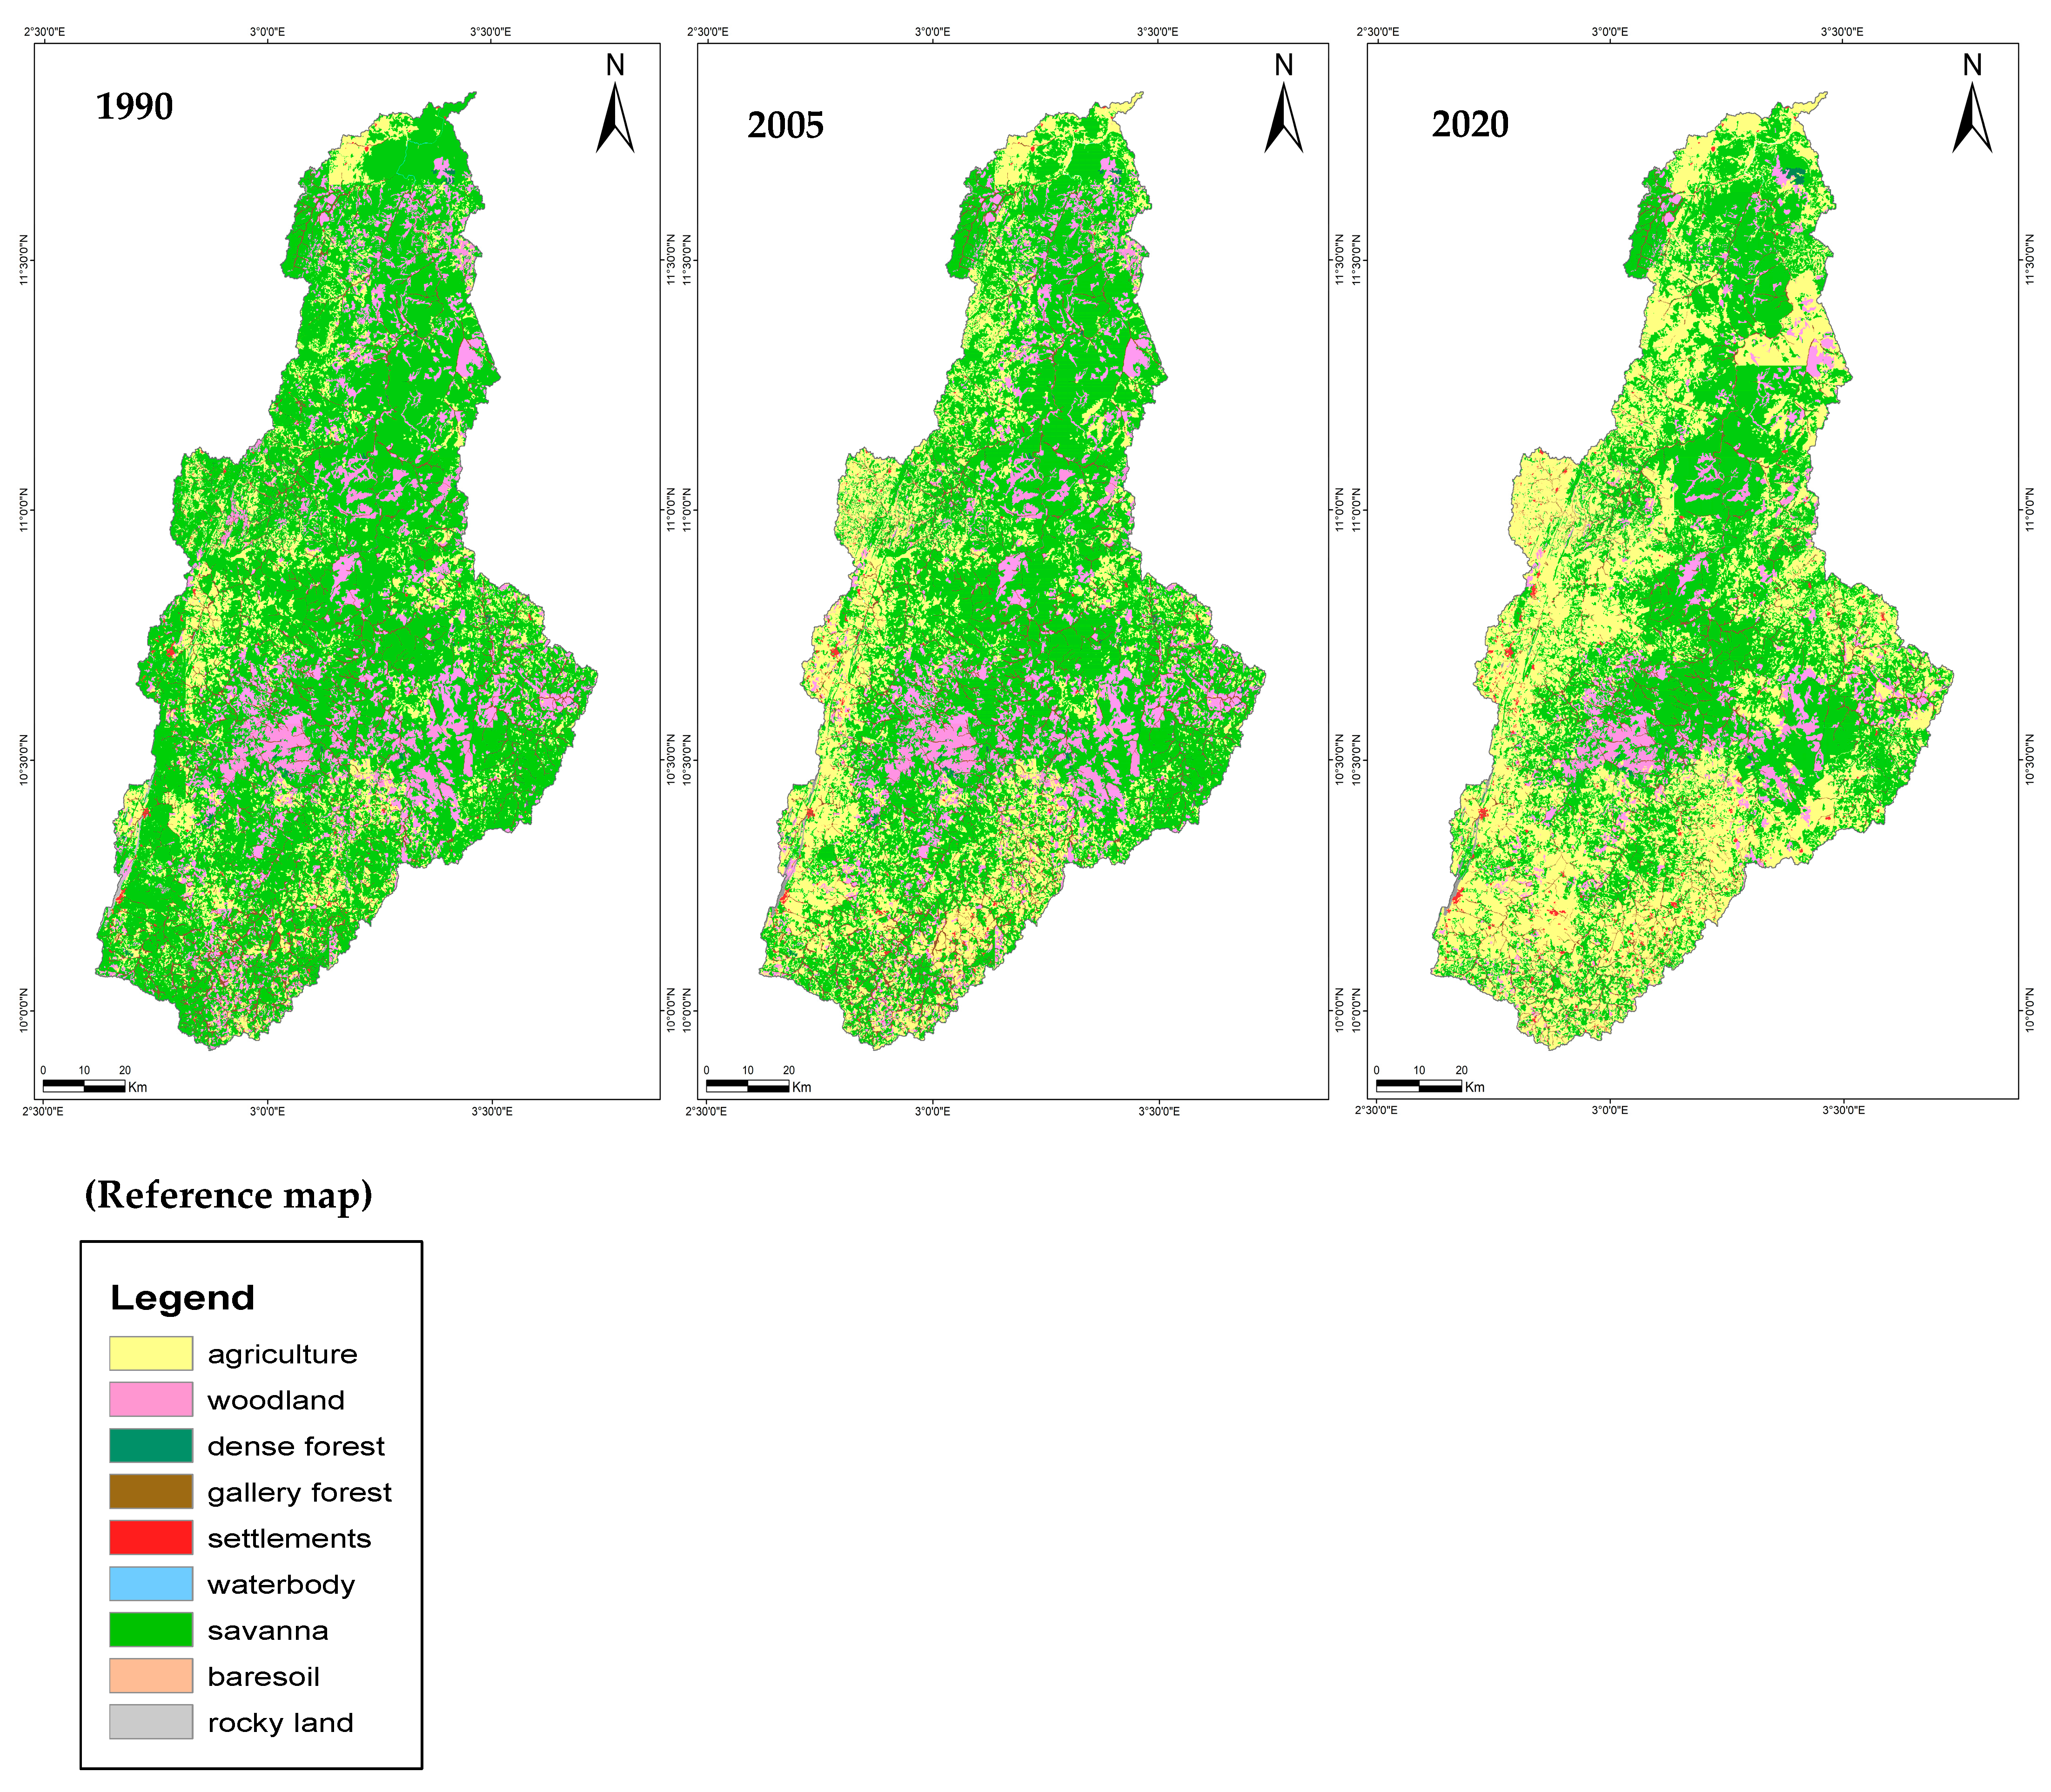
3.9. Land Cover Change Detection over the Sota Catchment

For producing land cover maps for 1990, 2005, and 2020 and to investigate changes that occurred between these three periods, the following nine land cover classes (hereafter) were considered in image classification: woodland, dense forest, gallery forest, savanna, waterbodies, agriculture, baresoil, rocky land, and settlements. The error matrix for the classified images in 1990, 2005, and 2020 is presented in Table 13.
The overall accuracy of the classification is equal to 90%, 96%, and 96% for 1990, 2005 and 2020, respectively. The Kappa index values obtained are 0.92, 0.94, and 0.93 for 1990, 2005, and 2020, respectively.
The land cover maps for 1990, 2005, and 2020 are presented in Figure 7, and the area under the nine land cover classes during the three periods is shown in Figure 8.
Table 13 and Figure 8 highlight that the classes occupying the majority of the study area since 1990 are: savanna, agriculture, gallery forest, and woodland, representing, respectively, 65.40%, 14.56%, 13.69%, and 5.43% of the study area in 1990, and 44.52%, 42.71%, 7.34%, and 4.28% in 2020. Small classes are represented by settlements, dense forest, rocky land, baresoil, and waterbodies, representing, respectively, 0.37%, 0.24%, 0.2%, 0.07%, 0.039%, and 1.5 × 10⁻⁵% of the study area in 1990, and 0.66%, 0.13%, 0.2%, 0.11%, 0.039%, and 1.09% in 2020.
The most dominant land cover class in the Sota catchment since 1990 is savanna with an area of 5949.9 km2 in 2020 (44.52% of the total area).
The area and proportion of changes in land cover from 1990 to 2020 are presented in Table 14.
Gains and losses and net change per land cover category are presented in Figure 9.
The analysis of the magnitude of changes for the periods 1990–2005, 2005–2020, and 1990–2020 (Table 14 and Figure 9) shows that the study area has undergone very significant changes, including increases in agriculture, settlements, waterbodies, and baresoil areas, and decreases in woodland, dense forest, gallery forest, and savanna areas. From 1990 to 2020, the most significant decreases were seen in woodland, which decreased by up to 49.6%, followed by dense forest, which decreased by up to 42.2%. The most significant increases were seen in agriculture, which increased by up to 212.1%, followed by settlements, which increased by up to 76.6%.

4. Discussion

4.1. Climate Assessment of the Sota Catchment

The rainfall analysis, based on the Standardized Anomaly Index (SAI) for the Sota catchment over the period 1960–2019, highlighted three main successive rainfall anomalies, i.e., wet, dry, and wet, respectively, for 1960–1972, 1973–1987, and 1988–2019. This result is almost in accordance with the findings of [18,20], who reported that the periods 1960–1972, 1973–1990, and 1991–2010 are, respectively, characterized by excess rainfall, deficit rainfall, and fluctuations within the Sota catchment. The study carried out by [16] over the period 1955–1992 in the whole Niger basin (the Sota catchment being a sub-basin of the Niger basin) shows the prevalence of wet years before 1970, deficit rainfall years from 1970, and a recovery to wet conditions from 1990.
Similarly, investigations carried out in three regions of the central and northern parts of Benin by [26] revealed that most negative anomalies occurred between 1970 and 1994. The author of [23] analyzed the rainfall variability in the whole of Benin, and identified three temporal characteristics of the rainfall variability in Benin; that is, a wet period (1940–1968), a severe dry period (1969–1990), and another wet period (1991–2015). The third national report on climate change in Benin from the Ministry of Environment [37] in Benin stated that significant droughts occurred over the period 1977–1983, and positive anomalies observed in general between 1994 and 2010 indicate the return of wet years. On a larger scale, a study carried out by [38] in the Sahelian region in Africa shows similar rainfall pattern results, structured into three main periods: a wet period called ‘fat cow’ from 1947 to 1969; secondly, a severe drought period from 1970; and a third period with a return to wet conditions from 1990. The rainfall pattern is almost the same in the whole of West Africa and is reported by the studies of [39,40,41] (Ozer & Perrin, 2014; Le Barbé et al., 2002; Nicholson S. E, 2001). According to [44,45,46], the variability of West African rainfall has been linked to several climate oscillation indices and to atmospheric factors such as the African Easterly Jet (AEJ), the Tropical Easterly Jet (TEJ), the position of the Inter-Tropical Convergence Zone (ITCZ), and regional SST. In the Niger basin in particular, the dry trends observed across the basin in the 1970s and 1980s might be the result of the approximately 150 to 250 km southward shift in isohyet lines observed in the whole Niger Basin which was attributed to global climate change [47].
The trend analysis of temperature indicates that maximum and minimum temperatures at Kandi station have increased over the study period at the Sota catchment, which confirms the study of [21] that observed an increase in temperature over the period 1970–2010 at this station. The present study highlighted that there is a significant change in temperature within the Sota catchment between the two normals of 30 years (1960–1989 and 1990–2019), proving that the climate in the area has warmed over the past 60 years.

4.2. Land Cover Assessment of the Sota Catchment

The land cover types in 1990, 2005, and 2020 showed large changes, including decreases in natural and increases in anthropogenic formation. Our land cover results are consistent with previous studies carried out in the Sota catchment by [20] assessing land cover in 1978, 1998, and 2010, as well as [19] who evaluated land cover within the Sota catchment in 1995 and 2013. These studies show that there has been a decrease in forest and savanna areas, and an increase in cultivated, urban land over the Sota catchment. The author of [20] for instance found a decrease in forest (11.42% of woodland, 0.17% of dense forest, and 0.70% of gallery forest) and savanna areas (30.61%) and an increase in cultivated land (42.50%) and urban land (72.07%) over the Sota catchment between 1978 and 2010.
In the whole Benin territory, a study carried out by the “Comité Inter-états de Lutte contre la Sécheresse dans le Sahel” [53] shows similar results and revealed that the most obvious change in land cover in Benin is the major expansion of agricultural land across most regions of Benin. Agricultural areas (including plantations and irrigated agriculture) progressed from 9.2 to 27.1% of the total country area, or an increase of over 5% (about 600 km2) per year between 1975 and 2013. The main cause of this land cover change is that Benin’s population tripled between 1975 and 2013, increasing from 3,263,000 to 10,600,000. As a result, the surface area of villages, towns, and cities has expanded by 241 percent. This led to the extension of agricultural areas, since agriculture is now considered ‘the motor of Benin development. Urban and agricultural landscapes extended to the detriment of Benin’s natural ecosystems, such as savannas, forests, and woodland, which have drastically decreased over the years.
The most dominant land cover class in the Sota catchment is savanna. This result is in accordance with the findings of [53] in Benin showing that even though the savanna area has decreased by 23% since 1975, it remains the dominant land cover type in Benin and still covers more than half of the country.
The land cover changes observed in the Sota catchment are common in West Africa. Referring to the large study carried out by [53] in the whole West Africa territory, between 1975 and 2013, the area covered by crops doubled, reaching a total of 1,100,000 km2 or 22.4% of the land surface. In every country, agriculture is exerting pressure on the natural landscapes, replacing and fragmenting savannas, woodlands, and forests. Only scattered protected areas are spared from the tide of change and stand out against the agricultural landscape. The loss of forest is an important land cover change in West Africa. Between 1975 and 2013, forest cover was reduced by 37%. For instance, Ivory Coast lost 60% (22,000 km2) of its forest in 38 years, Ghana lost 24% (4000 km2), and Nigeria lost 45% (9570 km2). West African countries have lost—and are still losing—large extents of their natural land cover classes, replaced by a heavily human-influenced landscape dominated by agriculture [53]. Some of the land cover changes in the Sota catchment are in accordance with the land cover changes revealed by the study of [54] in Reykjavik city, Iceland. This study mentions an increase in urban areas (21.5%) and waterbodies (3.4%) between 1987 and 2020.
Referring to a study carried out by the World Bank [55] in 2020, the decline in forest cover in Benin is mainly linked to the expansion of agriculture, timber harvesting, firewood and charcoal production, urbanization, and illegal hunting, which are direct factors in deforestation and forest degradation. Indirect factors are linked to population growth, poor forest governance and law application, land and forest rights, and the lack of incentives for the development of sustainable models for forestry and agricultural activities. Deforestation and the resulting land degradation are estimated to cost more than 3% of Benin’s gross domestic product (GDP) [55]. According to global estimations, between 2001 and 2018, Benin lost 0.55 million ha (equivalent to 70 million tons of CO2-eq emissions), a sign of alarming deforestation. Forest area per capita also fell from 1.63 ha in 1980 to 0.87 ha in 1995 and is expected to decline further to 0.29 ha in 2025 if current deforestation trends continue.
The Goungoun Sota forest located in the Sota catchment is under constant anthropogenic pressure, with a deforestation rate of 2.91% between 2000 and 2015 [56]. The slight increase in the surface area of waterbody observed in the Sota catchment between 1990 and 2020, is due to the increase in the construction of water reservoirs in the catchment between 1990 and 2003 [22].
In view of these significant land cover changes in the Sota catchment, in Benin and in West Africa in general, tree planting should be encouraged and incentives provided for local communities to protect new plantations and address further loss of forest cover. Indeed, efforts have been made by the Government of Benin through national and international funding for afforestation, and protection of forest areas.

4.3. Relationship between Climate and Land Use Changes in the Sota Catchment

Regarding climate change, the results revealed a significant increase in temperatures from 1960 to 2019 and a non-significant decreasing trend in rainfall. Regarding land cover changes, the Sota catchment underwent severe deforestation from 1990 to 2020. A recent World Resources Institute (WRI) [57] report shows that tropical deforestation increases the annual local average temperature. While the temperature increases due to greenhouse gas-driven warming happen gradually, those due to forest clearance happen abruptly. The depletion of trees increases the amount of carbon dioxide in the atmosphere. This leads to an increase in the temperature of the earth’s surface. Deforestation can lead to an average increase of 4.4 degrees C (7.9 degrees F) warming in daily high temperatures in the tropics. For instance, researchers found that by 2100 the heat stress caused by continued widespread deforestation in the Brazilian Amazon would be comparable to what is expected under the worst climate change scenarios [57]. Referring to this report, the rising temperatures in the Sota catchment could therefore be the result of the deforestation that is occurring in the region.

4.4. Implications of Climate and Land Cover Changes

The climate is becoming warmer in the Sota catchment with increasing anomalies in rainfall. It is crucial to find out the responses of farmers and herders in the region to these changes. According to the Intergovernmental Panel on Climate Change [58], temperatures will continue to rise in West Africa in the 21st century. As reported by [59], warmer temperatures will impact plant development and productivity. The increase in temperatures may trigger an increase in livestock water demand, and competition for water around reservoirs is likely. Rainfall anomalies in the Sota catchment are a great challenge for this semi-arid area, where water is a limiting factor for crop growth and livestock production [60]. However, the increasing temperature may also have a positive impact. The emergence, spread, and distribution of livestock diseases may all be affected by higher temperatures affecting the rate of development of pathogens or parasites, and shifts in disease distribution that may affect susceptible animal populations and the distribution and abundance of disease vectors. Excessive heat reduces the cycle of parasites [61].
One of the most crucial issues while carrying out a study within a watershed is the issue of water resources, including surface runoff, streamflow, base flow, flood regime of the watershed, and groundwater. It is important that land cover and climate change have a great influence on the hydrological response of a watershed. They may significantly modify the hydrological regime of basins, affecting the regional environment, ecosystems, and water resources in particular river flow regimes [62,63]. With the evidence of climate and land cover changes in the Sota catchment, Integrated Water Resource Management (IWRM) appears therefore as a needed approach for community resilience and sustainable development in the catchment.

5. Conclusions

Understanding changes in climate and land cover over West Africa is essential to local communities as their economies rely heavily on agriculture to supplement their livelihoods, food security, and water availability. This study focused on assessing climate and land cover changes over the Sota catchment. The results show that three periods are noted in the rainfall pattern over the catchment: a 1960–1972 wet period, a 1973–1987 dry period, and a 1988–2019 wet period. A return to wet conditions is noted after the severe drought of the 1970s and the 1980s. The four stations in the southern part showed a decreasing trend of rainfall and the three stations in the northern part of the basin showed an increasing trend. The Sota catchment has become warmer over the last 60 years. Regarding land cover change, the Sota catchment has undergone large changes, including an increase in cropland, urban area, plantation, waterbody, and baresoil areas, and a decrease in woodland, dense forest, gallery forest, and savanna areas. Based on these results, critical steps such as adapting to and mitigating the climate and land cover changes over the Sota catchment should be an important point of attention in decision-making for the communities who rely on water and land for their livelihoods. Actions promoting water harvesting and afforestation are required. Further research should address the combined effects of climate and land cover changes on the water resources of the Sota catchment. It can also be a valuable approach to understanding climate change in the catchment area by using only gridded data. In addition, Estimation of Land Surface Temperature and Departure rainfall analysis would help more to understand the variations in rainfall and the effect of land use. Moreover, it can also be a valuable approach not to compute the land cover area statistics, as well as the land cover change area statistics based on pixel counting. These limitations of the current study can be the target of further research in the Sota catchment.

Author Contributions

Conceptualization, K.S.S. and F.C.C.H.; methodology, K.S.S., F.C.C.H., L.O.S. and S.B.; validation, K.S.S. and F.C.C.H.; formal analysis, K.S.S., F.C.C.H., S.B.; investigation, K.S.S., N.F. and C.L.G.S.; resources, K.S.S., F.C.C.H., L.O.S. and N.F.; writing—original draft preparation, K.S.S.; writing—review and editing, K.S.S., F.C.C.H., S.B., N.F., L.O.S. and C.L.G.S.; visualization, K.S.S. and L.O.S.; supervision, F.C.C.H., L.O.S. and N.F.; project administration, K.S.S., F.C.C.H. and L.O.S.; funding acquisition, K.S.S. All authors have read and agreed to the published version of the manuscript.

Funding

This work, forming part of a Ph.D. research project, was supported by the West African Science Service Center on Climate Change and Adapted Land Use (WASCAL).

Data Availability Statement

Data will be made available on request.

Conflicts of Interest

The authors declare no conflict of interest.

References

  1. Aduah, M. Impacts of Global Changes on a Lowland Rainforest Region of West Africa. Doctoral Dissertation, University of KwaZulu-Natal, Durban, South Africa, 2016. [Google Scholar]
  2. IPCC. Climate Change 2014: Synthesis Report; Pachauri, R.K., Meyer, L.A., Eds.; IPCC: Geneva, Switzerland, 2015; Volume 151. [Google Scholar]
  3. Guo, J.; Kubli, D.; Saner, P. The Economics of Climate Change: No Action Not an Option. Swiss Re Institute. April 2021, p. 34. Available online: https://www.swissre.com/institute/research/topics-and-risk-dialogues/climate-and-natural-catastrophe-risk/expertise-publication-economics-of-climate-change.html (accessed on 5 October 2023).
  4. Benti, F. Spatiotemporal Attribution and Trends of Climate Variables in Iluababora Zone, Oromia National Regional State, Ethiopia. J. Sci. Sustain. Dev. 2019, 7, 52–64. [Google Scholar]
  5. Winkler, K.; Fuchs, R.; Rounsevell, M.; Herold, M. Global land use changes are four times greater than previously estimated. Nat. Commun. 2021, 12, 2501. [Google Scholar] [CrossRef]
  6. Pielke, R.A., Sr.; Pitman, A.; Niyogi, D.; Mahmood, R.; McAlpine, C.; Hossain, F.; Goldewijk, K.K.; Nair, U.; Betts, R.; Fall, S.; et al. Land use/land cover changes and climate: Modeling analysis and observational evidence. Wiley Interdiscip. Rev. Clim. Chang. 2011, 2, 828–850. [Google Scholar] [CrossRef]
  7. IPCC. Climate Change and Land. In An IPCC Special Report on Climate Change, Desertification, Land Degradation, Sustainable Land Management, Food Security, and Greenhouse Gas Fluxes in Terrestrial Ecosystems; IPCC: Geneva, Switzerland, 2019. [Google Scholar]
  8. Tong, S.T.Y.; Sun, Y.; Ranatunga, T.; He, J.; Yang, Y.J. Predicting plausible impacts of sets of climate and land use change scenarios on water resources. Appl. Geogr. 2012, 32, 477–489. [Google Scholar] [CrossRef]
  9. Bryan, E.; Ringler, C.; Okoba, B.; Roncoli, C.; Silvestri, S.; Herrero, M. Adapting agriculture to climate change in Kenya: Household strategies and determinants. J. Environ. Manag. 2013, 114, 26–35. [Google Scholar] [CrossRef]
  10. Fink, A.H.; Christoph, M.; Ermert, V.; Kuhn, A.; Heckelei, T.; Diekkrüger, B. Impacts of global change in South of the Sahara; Springer: Berlin/Heidelberg, Germany, 2010; pp. 16–23. [Google Scholar]
  11. Lawin, A.E. Analyse Climatologique et Statistique du Régime Pluviométrique de la Haute Vallée de l’Ouémé à Partir des Données Pluviographiques AMMACATCH Bénin. Ph.D. Thesis, Grenoble INPG (France) and Université d’Abomey-Calavi, Abomey-Calavi, Benin, 2007. [Google Scholar]
  12. Nicholson, S.E.; Grist, J.P. A conceptual model for understanding rainfall variability in the West African Sahel on interannual and interdecadal timescales. Int. J. Climatol. 2001, 21, 1733–1757. [Google Scholar] [CrossRef]
  13. Adejuwon, J.O.; Balogun, E.E.; Adejuwon, S.A. On the annual and seasonal patterns of rainfall fluctuations in sub-Saharan West Africa. Int. J. Climatol. 1990, 10, 839–848. [Google Scholar] [CrossRef]
  14. Hulme, M. African climate change: 1900–2100. Clim. Res. 2001, 17, 145–168. [Google Scholar] [CrossRef]
  15. Food and Agriculture Organization (FAO). Global Forest Resources Assessment 2010: Main Report; Food and Agriculture Organization of the United Nations: Rome, Italy, 2010; p. 378. [Google Scholar]
  16. Vissin, E. Impact de la Variabilité Climatique et de la Dynamique des États de Surface sur les Écoulements du Bassin Béninois du Fleuve Niger. Doctoral Dissertation, Université de Bourgogne, Bourgogne, France, 2007. [Google Scholar]
  17. CeRPA Borgou-Alibori. Centre Régional pour la Promotion Agricole de Parakou. Evolution des Statistiques de Production Cotonnière sur les 24 Dernières Campagnes Agricoles (1989–1990 à 2012–2013); CeRPA: Parakou, Bénin, 2014. [Google Scholar]
  18. Oyerinde, G.T.; Olowookere, B.T. Observed shift and merge of hydrological regimes in the sota catchment, Benin; an evidence of climate. Int. J. Res. Granthaalayah 2018, 6, 205–211. [Google Scholar] [CrossRef]
  19. Zakari, S.; Tente, B.A.H.; Imorou, I.T.; Yabi, I.; Afouda, F.; N’Bessa, B. Variabilité hydropluviométrique et dynamique de l’occupation des terres dans le bassin de la Sota à l’exutoire de Coubéri au Bénin (Afrique de l’Ouest). Int. J. Innov. Appl. Stud. 2015, 13, 235–250. [Google Scholar]
  20. Koumassi, D.H. Risques Hydroclimatiques et Vulnerabilites des Ecosystemes dans le Bassin Versant de la Sota a L’exutoire de Couberi. Doctoral Dissertation, Université d’Abomey Calavi, Abomey-Calavi, Benin, 2014. Available online: https://hal.archives-ouvertes.fr/tel-01572602 (accessed on 6 June 2023).
  21. Badou, D.F.; Kapangaziwiri, E.; Diekkrüger, B.; Afouda, A. Evaluation of recent hydro-climatic changes in four tributaries of the Niger River basin (West Africa). Hydrol. Sci. J. 2016, 62, 715–728. [Google Scholar] [CrossRef]
  22. Sambieni, K.S.; Hountondji, F.C.C.; Sintondji, L.O.; Fohrer, N. Spatial distribution of water reservoirs in the Sota catchment (Benin, West Africa) and implications for local development. Heliyon 2023, 9, e14458. [Google Scholar] [CrossRef]
  23. Ahokpossi, Y. Analysis of the rainfall variability and change in the Republic of Benin (West Africa). Hydrol. Sci. J. 2018, 63, 2097–2123. [Google Scholar] [CrossRef]
  24. Paul, A.; Bhowmik, R.; Chowdary, V.; Dutta, D.; Sreedhar, U.; Sankar, H. Trend analysis of time series rainfall data using robust statistics. J. Water Clim. Chang. 2017, 8, 691–700. [Google Scholar] [CrossRef]
  25. Yu, P.S.; Yang, T.C.; Wu, C.K. Impact of climate change on water resources in southern Taiwan. J. Hydrol. 2002, 260, 161–175. [Google Scholar] [CrossRef]
  26. Wabi, M.A.; Lucas, R.; Kakaï, G. Characterization of Spatio-temporal Trends in Long- term Rainfall of Three Weather Stations in Benin: Implications for Agricultural Decision Making. Res. Sq. 2021, 1–21. [Google Scholar] [CrossRef]
  27. Akinsanola, A.A.; Ogunjobi, K.O. Recent homogeneity analysis and long-term spatio-temporal rainfall trends in Nigeria. Theor. Appl. Climatol. 2017, 128, 275–289. [Google Scholar] [CrossRef]
  28. Costa, R.L.; Barros Gomes, H.; Cavalcante Pinto, D.D.; da Rocha Júnior, R.L.; dos Santos Silva, F.D.; Barros Gomes, H.; Lemos da Silva, M.C.; Luís Herdies, D. Gap Filling and Quality Control Applied to Meteorological Variables Measured in the Northeast Region of Brazil. Atmosphere 2021, 12, 1278. [Google Scholar] [CrossRef]
  29. Bodjrenou, R.; Cohard, J.M.; Hector, B.; Lawin, E.A.; Chagnaud, G.; Danso, D.K.; N’tcha M’po, Y.; Badou, F.; Ahamide, B. Evaluation of Reanalysis Estimates of Precipitation, Radiation, and Temperature over Benin (West Africa). J. Appl. Meteorol. Climatol. 2023, 62, 1005–1022. [Google Scholar] [CrossRef]
  30. Cucchi, M.; Weedon, G.P.; Amici, A.; Bellouin, N.; Lange, S.; Müller Schmied, H.; Hersbach, H.; Buontempo, C. WFDE5: Bias-adjusted ERA5 reanalysis data for impact studies. Earth Syst. Sci. Data 2020, 12, 2097–2120. [Google Scholar] [CrossRef]
  31. Hersbach, H.; Bell, B.; Berrisford, P.; Hirahara, S.; Horányi, A.; Muñoz-Sabater, J.; Nicolas, J.; Peubey, C.; Radu, R.; Schepers, D.; et al. The ERA5 global reanalysis. Q. J. R. Meteorol. Soc. 2020, 146, 1999–2049. [Google Scholar] [CrossRef]
  32. Muñoz-Sabater, J. ERA5-Land Hourly Data from 1981 to Present. Copernicus Climate Change Service Climate Data Store. 2019. Available online: https://cds.climate.copernicus.eu/cdsapp#!/dataset/10.24381/cds.e2161bac?tab=overview (accessed on 25 January 2021).
  33. Ali, A.; Lebel, T. The Sahelian standardized rainfall index revisited. Int. J. Climatol. 2009, 29, 1705–1714. [Google Scholar] [CrossRef]
  34. Mckee, T.B.; Doesken, N.J.; Kleist, J. The Relationship of Drought Frequency and Duration to Time Scales. In Proceedings of the 8th Conference on Applied Climatology, Anaheim, CA, USA, 17–22 January 1993; pp. 179–184. [Google Scholar]
  35. Thiessen, A.H. Precipitation Averages for Large Areas. Mon. Weather. Rev. 1911, 39, 1082–1084. [Google Scholar] [CrossRef]
  36. Pettitt, A.N. A non-parametric approach to the change-point problem. Appl. Statist. 1979, 28, 126–135. [Google Scholar] [CrossRef]
  37. James, N.A.; Kejariwal, A.; Matteson, D.S. Leveraging cloud data to mitigate user experience from ‘breaking bad’. In Proceedings of the 2016 IEEE International Conference on Big Data (Big Data), Washington, DC, USA, 5–8 December 2016; pp. 3499–3508. [Google Scholar] [CrossRef]
  38. Mann, H.B. Non-parametric tests against trend. Econometrica 1945, 33, 245–259. [Google Scholar] [CrossRef]
  39. Kendall, M. Multivariate Analysis; Charles Griffin & Company: London, UK, 1975; p. 309. [Google Scholar]
  40. Hirsch, R.M.; Slack, J.R. A nonparametric trend test for seasonal data with serial dependence. Water Resour. Res. 1984, 20, 727–732. [Google Scholar] [CrossRef]
  41. Sen, P.K. Estimates of the Regression Coefficient Based on Kendall’s Tau. J. Am. Stat. Assoc. 1968, 63, 1379–1389. [Google Scholar] [CrossRef]
  42. Dossa, L.O.S.N.; Dassou, G.H.; Adomou, A.C.; Ahononga, F.C.; Biaou, S. Dynamique spatio-temporelle et vulnérabilité des unités d’occupation du sol de la Forêt Classée de Pénéssoulou de 1995 à 2015 (Bénin, Afrique de l’Ouest). Sci. De La Vie De La Terre Et Agron. 2021, 9, 2. [Google Scholar]
  43. Ahononga, F.C.; Gouwakinnou, N.G.; Biaou, S. Vulnérabilité des terres des écosystèmes du domaine soudanien au Bénin de 1995 à 2015. Bois. Et Forêts. Des. Trop. 2020, 346, 35–50. [Google Scholar] [CrossRef]
  44. Biaou, S.; Houeto, F.; Gouwakinnou, G.; Biaou, S.S.H.; Awessou, B.; Tovihessi, S.; Tete, R. Dynamique spatio-temporelle de l’occupation du sol de la forêt classée de Ouénou-Bénou au Nord Bénin. Des Images Satellites Pour La Gestion Durable Des Territoires En Afrique. 2019, p. 22. Available online: https://hal.archives-ouvertes.fr/hal-02189367 (accessed on 12 November 2023).
  45. Kantakumar, L.N.; Neelamsetti, P. Multi-temporal land use classification using hybrid approach. Egypt. J. Remote Sens. Sp. Sci. 2015, 18, 289–295. [Google Scholar] [CrossRef]
  46. Jensen, J.R. Introductory Digital Image Processing: A Remote Sensing Perspective; Prentice Hall: Hoboken, NJ, USA, 1996. [Google Scholar]
  47. Houssoukpèvi, I.A.; Le Maire, G.; Aholoukpè, H.N.S.; Fassinou, D.J.M.; Amadji, G.L.; Chapuis-Lardy, L.; Chevallier, T. Effect of land use change on carbon stocks in an agricultural region of southern Benin. Land Degrad. Dev. 2023, 34, 1447–1463. [Google Scholar] [CrossRef]
  48. Bah, O.A.; One, T.; Yaffa, S.; Ndiaye, M.L. Land Use and Land Cover Dynamics in Central River Region of the Gambia, West Africa from 1984 to 2017. Am. J. Mod. Energy 2019, 5, 5. [Google Scholar] [CrossRef]
  49. Liu, C.; Frazier, P.; Kumar, L. Comparative assessment of the measures of thematic classification accuracy. Remote Sens. Environ. 2007, 107, 606–616. [Google Scholar] [CrossRef]
  50. Olofsson, P.; Foody, G.M.; Stehman, S.V.; Woodcock, C.E. Making better use of accuracy data in land change studies: Estimating accuracy and area and quantifying uncertainty using stratified estimation. Remote Sens. Environ. 2013, 129, 122–131. [Google Scholar] [CrossRef]
  51. Hare, W. Assessment of Knowledge on Impacts of Climate Change: Contribution to the Specification of Art, 2 of the UNFCCC; WBGU: Postdam, Germany; Berlin, Germany, 2003. [Google Scholar]
  52. Cherkos, A. The Rainfall Variability of an Area with Coefficient of Variation; CSA 2006/7 National Statistics; Central Statistical Agency: Addis Ababa, Ethiopia, 2001.
  53. CILSS. Landscapes of West Africa—A Window on a Changing World; U.S. Geological Survey EROS: Garretson, SD, USA, 2016.
  54. Mansourmoghaddam, M.; Rousta, I.; Zamani, M.; Haraldur, O. Investigating and predicting Land Surface Temperature (LST) based on remotely sensed data during 1987–2030 (A case study of Reykjavik city, Iceland). Urban Ecosyst. 2023, 26, 337–359. [Google Scholar] [CrossRef]
  55. World Bank. Report on the Forests in Benin; The World Bank Group: Washington, DC, USA, 2020. [Google Scholar]
  56. Zakari, S.; Mazo, I.; Toko Imorou, I.; Djaouga, M.; Arouna, O.; Thomas, O. Cartographie des changements spatio-temporels des unités d’occupation des terres dans la forêt classée de Goungoun et ses terroirs riverains, In Actes de la Conférence; OSFACO: Cotonou, Benin, 2018; pp. 229–246. [Google Scholar]
  57. World Research Institute. Global Emissions and Local Deforestation Are Combining to Create Dangerous Levels of Heat Stress in the Tropics; Report; World Research Institute: Washington, DC, USA, 2023. [Google Scholar]
  58. IPCC. Summary for Policymakers of IPCC Special Report on Global Warming of 1.5 °C Approved by Governments; IPCC: Geneva, Switzerland, 2018. [Google Scholar]
  59. Hatfield, J.L.; Prueger, J.H. Temperature extremes: Effect on plant growth and development. Weather Clim. Extrem. 2015, 10, 4–10. [Google Scholar] [CrossRef]
  60. Ahmed, K.F.; Wang, G.; Yu, M.; Koo, J.; You, L. Potential impact of climate change on cereal crop yield in West Africa. Clim. Chang. 2015, 133, 321–334. [Google Scholar] [CrossRef]
  61. Gitz, V.; Meybeck, A.; Lipper, L.; Young, C.; Braatz, S. Climate Change and Food Security: Risks and Responses; Food and Agriculture Organization of the United Nations (FAO) Report; FAO: Rome, Italy, 2016. [Google Scholar]
  62. Ayeni, A.; Kapangaziwiri, E.; Soneye, A.; Engelbrecht, F. Assessing the impact of global changes on the surface water resources of southwestern Nigeria. Hydrol. Sci. J. 2015, 60, 1956–1971. [Google Scholar] [CrossRef]
  63. Kashaigili, J.; Majaliwa, A. Implications of land use and land cover changes on hydrological regimes of the Malagarasi River, Tanzania. J. Agric. Sci. Appl. 2013, 2, 45–50. [Google Scholar] [CrossRef]
Figure 1. Map of the study area with (a) map of Africa showing Benin’s location, (b) map of Benin showing the Sota catchment location, and (c) map of the Sota catchment showing the drainage network, the DEM, and the location of meteorological stations.
Hydrology 11 00030 g001
Figure 2. Rainfall map of the Sota catchment (1960–2019).
Hydrology 11 00030 g002
Figure 3. Annual rainfall standardized anomaly index from 1960 to 2019 for the individual locations (ag) and the catchment (h).
Hydrology 11 00030 g003aHydrology 11 00030 g003b
Figure 4. Break points (in red dashed lines) in the annual rainfall time series at catchment scale from 1960 to 2019.
Hydrology 11 00030 g004
Figure 5. Average annual Tmax and Tmin time series over the Sota catchment (Kandi station) for the period 1960–2019.
Hydrology 11 00030 g005
Figure 6. Mean annual (a) Tmax and (b) Tmin time series of Kandi station for the two normals (1960–1989; 1990–2019).
Hydrology 11 00030 g006
Figure 7. Land cover maps of the study area for 1990, 2005, and 2020.
Hydrology 11 00030 g007
Figure 8. Land cover types and area coverage of the Sota catchment in km2 from 1990 to 2020 (a) large classes; (b) small classes.
Hydrology 11 00030 g008
Figure 9. Gains and losses and net change per land use category.
Hydrology 11 00030 g009
Table 1. List of the meteorological stations used in the study indicating the number of years of missing values, the percentage of missing data, and the number of years considered after data quality control.
StationsLongitudeLatitudeNumber of Years with Missing Data% of Missing DataNumber of Years Considered after Quality Control
Kandi (synoptic station)2.9311.13 0060
Malanville3.411.87216.5153
Segbana3.710.933233.6935
Kalale3.3810.3101.9656
Bembereke2.6710.271.2658
Nikki3.29.932313.1547
Ina2.739.972213.5749
Table 2. Reanalysis data evaluation indices, mathematical descriptions, and perfect scores.
IndicesMathematical ExpressionsDescriptionPerfect Score
Pearson
Correlation
r = R g R ¯ g R s R ¯ s R g R ¯ g 2 R s R ¯ s 2 Rg is gauge rainfall observation; Rs is satellite rainfall estimate
R ¯ g is average gauge rainfall observation
R ¯ s is average satellite rainfall estimate
The values range from −1 to 1.
1
Root mean
Square
R M S E = ( R g R s ) 2 n The number of data pairs is n; the value ranges from 0 to ∞. The lower the RMSE, the better a given model is able to “fit” a dataset.0
Percent bias (%) P B I A S = i = 1 n R g i = 1 n R s i = 1 n R g × 100 ≤±15% is very good0
Table 3. Classification and evaluation of different standardized Anomaly index (SAI) according to [34].
SAI Value Category
≥2.00Extremely wet
1.5 to 1.99Severely wet
1.0 to 1.49Moderately wet
−0.99 to 0.99Near normal
−1.00 to −1.49Moderately dry
−1.50 to −1.99Severely dry
≤2.00Extremely dry
Table 4. Statistical evaluation indices of annual rainfall for the satellite data for studied locations.
LocationsRPBIASRMSE
ERA5WFDE5ERA5WFDE5ERA5WFDE5
Kandi0.180.38−19.9910.11266.33178.39
Malanville0.130.53−23.3234.59240.43300.47
Segbana0.150.39−13.546.58242.41179.52
Kalale0.280.33−2.65−0.83222.87201.35
Bembereke0.420.64−4.99−2.46189.78150.28
Nikki0.680.485.681.85143.30156.97
Ina0.510.68−3.56−5.46168.74149.89
Table 5. Annual rainfall time series basic statistical properties for the seven stations in the Sota catchment.
StationsMeanStandard DeviationMaxMinCoefficient
of Variation
SkewnessKurtosis
Kandi1019.24155.121436.2655.115.220.060.44
Malanville838.83157.761301.48472.218.810.750.93
Segbana1046.21166.631479.767914.560.060.22
Kalale1119.87202.411661.6666.318.070.24−0.02
Bembereke1115.99200.581695.972517.970.540.71
Nikki1082.89168.171459.5761.915.530.41−0.44
Ina1171.73188.01585.7693.216.040.190.02
Table 6. Percentage of normal, wet, and dry periods in the rainfall locations during the period 1960–2019.
LocationsNormal Years
(%)
Wet Years
(%)
Dry Years
(%)
Bembereke73.3311.6715
Ina701515
Segbana66.671518.33
Nikki63.332016.67
Kalale68.3318.3313.34
Malanville7516.678.33
Kandi66.672013.33
catchment63.3316.6720
Table 7. Difference between the period before and after the break points in the rainfall time series.
PeriodsBreak PointsMean (mm)Difference (mm)Student t-Test
1960–197219721127.85−160.60p value = 0.000 ***
1973–1987967.24
1973–19871987967.24105.13p value = 0.03 **
1988–20191072.37
‘**’ means p value < 0.01, ‘***’ means p value < 0.001.
Table 8. Trends of seasonal and annual rainfall during 1960–2019.
StationsAnnual RainfallPre-Monsoon Monsoon
Zp ValueSenZp ValueSenZp ValueSen
Bembereke−0.950.06−1.65−5.670.000 ***−0.88−2.050.04−1.71
Nikki−3.740.0001 ***−1.64−1.240.21−0.39−3.660.000 ***−2.64
Kalale−3.350.0007 ***−1.99−2.910.003 **−0.64−2.580.009 **−1.31
Ina−3.740.0002 ***−1.64−0.110.91−0.030.190.840.15
Segbana2.660.008 **1.22−2.990.002 **−0.551.170.240.55
Malanville0.280.780.266.380.000 ***0.991.920.051.07
Kandi0.270.780.073.240.001 **0.5−0.350.73−0.31
catchment−0.830.40−0.49
significant trends are indicated by ‘**’ (p < 0.01); ‘***’ (p < 0.001).
Table 9. Trend analysis and Comparison of rainfall change between the two normals (1960–1989; 1990–2019) at the catchment scale.
PeriodsModified Mann KendallStatistical Characteristics
zp ValueSenAverage Annual Rainfall (mm)Max
(mm)
Min
(mm)
1960–1989−6.890.000 ***−8.751045.521355.43813.29
1990–20191.530.122.111054.761289.95894
‘***’ means p value < 0.001.
Table 10. Trend of the Tmax and Tmin time series over the period 1960–2019.
Modified Mann Kendall (MMK)
PeriodsTmaxTmin
Zp ValueSenZp ValueSen
1960–20199.200.000 ***0.01715.400.000 ***0.035
1960–198911.630.000 ***0.0368.280.000 ***0.02
1990–20194.170.000 ***0.033.540.000 ***0.01
*** means p value < 0.001.
Table 11. Comparison of temperature change between the two normals 1960–1989 and 1990–2019.
PeriodAverage Annual Tmax (°C)Average Annual Tmin (°C)Max Tmax
(°C)
Max Tmin
(°C)
1960–198934.320.935.6121.8
1990–201934.722.135.6423.1
Difference0.4+1.20.031.3
t-Student Testp value = 0.003 **p value = 0.0000 ***
** means p value < 0.01; *** means p value < 0.001.
Table 12. Difference between the periods before and after the break points in the Tmax and Tmin time series.
ParametersPeriodsBreak PointsMeanDifference (°C)Student t-Test
Tmax1960–1978197834.10.6p value = 0.0002 ***
1979–199034.7
1979–1990199034.7−0.3p value = 0.01 *
1991–200434.4
1991–2004200434.40.5p value = 0.000 ***
2005–201935
Tmin1960–1989198920.91.2p value = 0.000 ***
1990–201922.1
* means p value < 0.05; *** means p value < 0.001.
Table 13. Error matrix for classified images.
1990DFGFWLSAAGRIWTRSTLRLBLTOTAL
DF1010000002
GF017000000017
WL001820000020
SA000410000041
AGRI000047000047
WTR0000040004
STL00008050013
RL0000001203
BL0000000033
TOTAL1171943554623150
Global precision: 90%; Kappa Index: 0.92
2005DFGFWLSAAGRWTRUBRLBLTOTAL
DF1010000002
GF015000000017
WL001820000020
SA000440000044
AGR000052000052
WTR0000030003
UB00003060014
RL0000000202
BL0000000033
TOTAL1151946553623150
Global precision: 96%; Kappa Index: 0.94
2020DFGFWLSAAGRWTRSTLRLBLTOTAL
DF2010000003
GF01520000005
WL103020000010
SA001791000046
AGR0003125000051
WTR0000010003
STL00000027116
RL0000000303
BL0000000055
TOTAL315348412612746300
Global precision: 96%; Kappa Index: 0.93
DF: Dense forest; GF: Gallery forest; WL: woodland; SA: Savanna; AGR: Agriculture; WTR: Water; STL: Settlement; RL: Rocky land; BL: Baresoil.
Table 14. Land cover change of Sota catchment during 1990–2020.
Land Cover ClassesLand Cover Area (in km2)Changes in Land CoverType of Changes
1990200520201990–20052005–20201990–2020
(km2)(%)(km2)(%)(km2)(%)
Agriculture1829.13291.15708.21462.179.92417.173.43879.1212.1Increase
Woodland1944.91810.5981.0−134.4−6.9−829.4−45.8−963.8−49.6Decrease
Dense forest32.332.2518.660.0−0.1−13.6−42.2−13.6−42.2Decrease
Gallery forest725.3734.29571.628.91.2−162.7−22.2−153.7−21.2Decrease
Settlements50.157.288.497.114.131.354.738.476.6Increase
Waterbody5.25.185.330.00.00.22.90.22.9Increase
Savanna8739.27392.95949.9−1346.2−15.4−1443.1−19.5−2789.3−31.9Decrease
Baresoil9.412.114.362.728.22.218.54.952.0Increase
Rocky land26.626.626.60.00.00.00.00.00.0-
Total133621336213362
Disclaimer/Publisher’s Note: The statements, opinions and data contained in all publications are solely those of the individual author(s) and contributor(s) and not of MDPI and/or the editor(s). MDPI and/or the editor(s) disclaim responsibility for any injury to people or property resulting from any ideas, methods, instructions or products referred to in the content.

