Peer Review of Reviewers: The Author’s Perspective
by
 , , and
Ivana Drvenica
1 ,
,
Giangiacomo Bravo
2,
Lucija Vejmelka
3,
Aleksandar Dekanski
4 and
and
Olgica Nedić
5,* 1
Institute for Medical Research, University of Belgrade, 11000 Belgrade, Serbia
2
Department of Social Studies, Centre for Data Intensive Sciences and Applications, Linnaeus University, 35195 Växjö, Sweden
3
Department of Social Work, Faculty of Law, University of Zagreb, 10000 Zagreb, Croatia
4
Department of Electrochemistry, Institute of Chemistry, Technology and Metallurgy, University of Belgrade, 11000 Belgrade, Serbia
5
Institute for the Application of Nuclear Energy (INEP), University of Belgrade, 11080 Belgrade, Serbia
*
Author to whom correspondence should be addressed.
Publications 2019, 7(1), 1; https://doi.org/10.3390/publications7010001
Submission received: 30 October 2018
/
Revised: 7 December 2018
/
Accepted: 17 December 2018
/
Published: 24 December 2018
Abstract
:The aim of this study was to investigate the opinion of authors on the overall quality and effectiveness of reviewers’ contributions to reviewed papers. We employed an on-line survey of thirteen journals which publish articles in the field of life, social or technological sciences. Responses received from 193 authors were analysed using a mixed-effects model in order to determine factors deemed the most important in the authors’ evaluation of the reviewers. Qualitative content analysis of the responses to open questions was performed as well. The mixed-effects model revealed that the authors’ assessment of the competence of referees strongly depended on the final editorial decision and that the speed of the review process was influential as well. In Ordinary Least Squares (OLS) analysis on seven questions detailing authors’ opinions, perception of review speed remained a significant predictor of the assessment. In addition, both the perceived competence and helpfulness of the reviewers significantly and positively affected the authors’ evaluation. New models were used to re-check the value of these two factors and it was confirmed that the assessment of the competence of reviewers strongly depended on the final editorial decision.
1. Introduction
Peer review is a cornerstone of science and its quality and efficiency depend on a complex, large-scale collaborative process between authors, reviewers, and editors. The efficiency and effectiveness of peer-review cannot be easily shown [1] but both are under permanent examination and re-evaluation. Attempts at improvement have spread in many directions: scoring of reviewers by editors, checklists, and surveys created for reviewers, anonymity of authors for reviewers, educational training for reviewers, post-peer review surveys, etc. [2,3,4,5]. Feedback opinion from authors of the submitted articles about the review process may be another very useful source of information. This should contribute to evaluation of the process and creation of guidelines for improvement, but has received less attention than other approaches [4,6,7,8]. On the other hand, the number of authors who are not satisfied with reviewers’ reports may be considerable, as shown in a survey of journals dealing with chemistry and related subjects published in Serbia [9].
Recently, the Publons website [10] investigated several aspects of reviewer activity. According to their data, 300,000 individuals each spent about 5 h reviewing, but with large differences depending on the topic and the experience of the reviewer. Less time was dedicated to papers that were very bad or very good. According to Publons [10], reviewers from countries that are English-speaking or have a significant proportion of English speakers wrote longer reports than those from Asia and the Middle East. Review reports in scientific fields where articles are more discussion-based, such as in the social sciences, arts, and humanities, were the longest. When the quantity, variety and distribution of words were examined, it was observed that peer review reports were very different from usual texts [11]. A clear shift towards longer reviews was seen as the journal impact factor increased [10]. It was postulated that reviewers for high-quality journals considered their task as an investment in their own reputation. The effect of bias in peer review has been examined as well [12,13,14,15]. Authors suspected an influence of non-scientific factors on the decision-making process, such as institution of origin, country of origin, different conceptual approach, gender, personal reasons, competitiveness, religion, ethnicity, etc. It was noted that bias most often has negative consequences for the paper and very rarely positive. Thus, many factors influence the work of reviewers.
The aim of this study was to assess the opinion of authors on the overall quality and effectiveness of the peer review process and the reviewers’ contribution to their paper. Authors who submitted manuscripts to scientific journals were asked to complete a survey offering their perception of the reviewers’ work.
2. Methods
To gain insight into authors’ opinions about reviewers and their reports, an on-line survey (Supplementary Materials) was conducted in thirteen journals (after agreement with their editors). An invitation to participate in the survey was sent to more than 100 journals, aiming to cover different scientific disciplines and places of origin, but positive responses were received from just thirteen. Those enrolled in the study publish in the fields of life, social or technological sciences (Table 1). The survey started in April 2016 and lasted up to October 2017. Corresponding authors were requested to fill in the questionnaire when they received a final decision on their paper. Responses were received from 193 authors. No exact data could be retrieved on the number of invitations sent, as we could not obtain such information from individual journals. Answers to most questions had a semantic differential structure with 1 conveying the most negative opinion on the reviewers’ work and 5 the most positive one (Table 2) and were considered as interval-scale variables in the analysis below.
Authors also had the opportunity to add their impressions in the form of open answers, as additional comments. Qualitative data were examined by qualitative content analysis. Authors graded each reviewer’s report separately.
3. Results and Discussion
3.1. General Data
The majority of authors who answered the survey received the final decision “Accepted” for their papers (92.7%). More than half of the responses (54.9%) were received from one journal (Table 1). This result was consistent with the survey on authors’ perception of peer review in one leading medical journal [4]. Knowing that in most cases the rate of article acceptance is lower than the rate of article rejection [16,17,18], it may be concluded that after receiving a negative decision, authors are not willing to have anything else to do with the journal (including responding to the survey). Although, a reviewer’s failure to send a report on time is a major problem in the peer review process—as stated by both editors and authors [6,9,19,20,21]—in this survey the majority of authors responded that they received reports on time (57.5%) or even fast (29.0%). On average, review reports were received 8.8 weeks after submission. However, the average period for notifying rejection was 16.1 weeks. Almost half of the surveyed authors (45.6%) received two reports, 35.3% had only one, 16.0% received three, 2.6% had four reports, and 0.5% (a single author) five. Most authors stated that the editorial decision was coherent with the opinion of the reviewers (96.8%) and that they will submit another article to the same journal (95.8%).
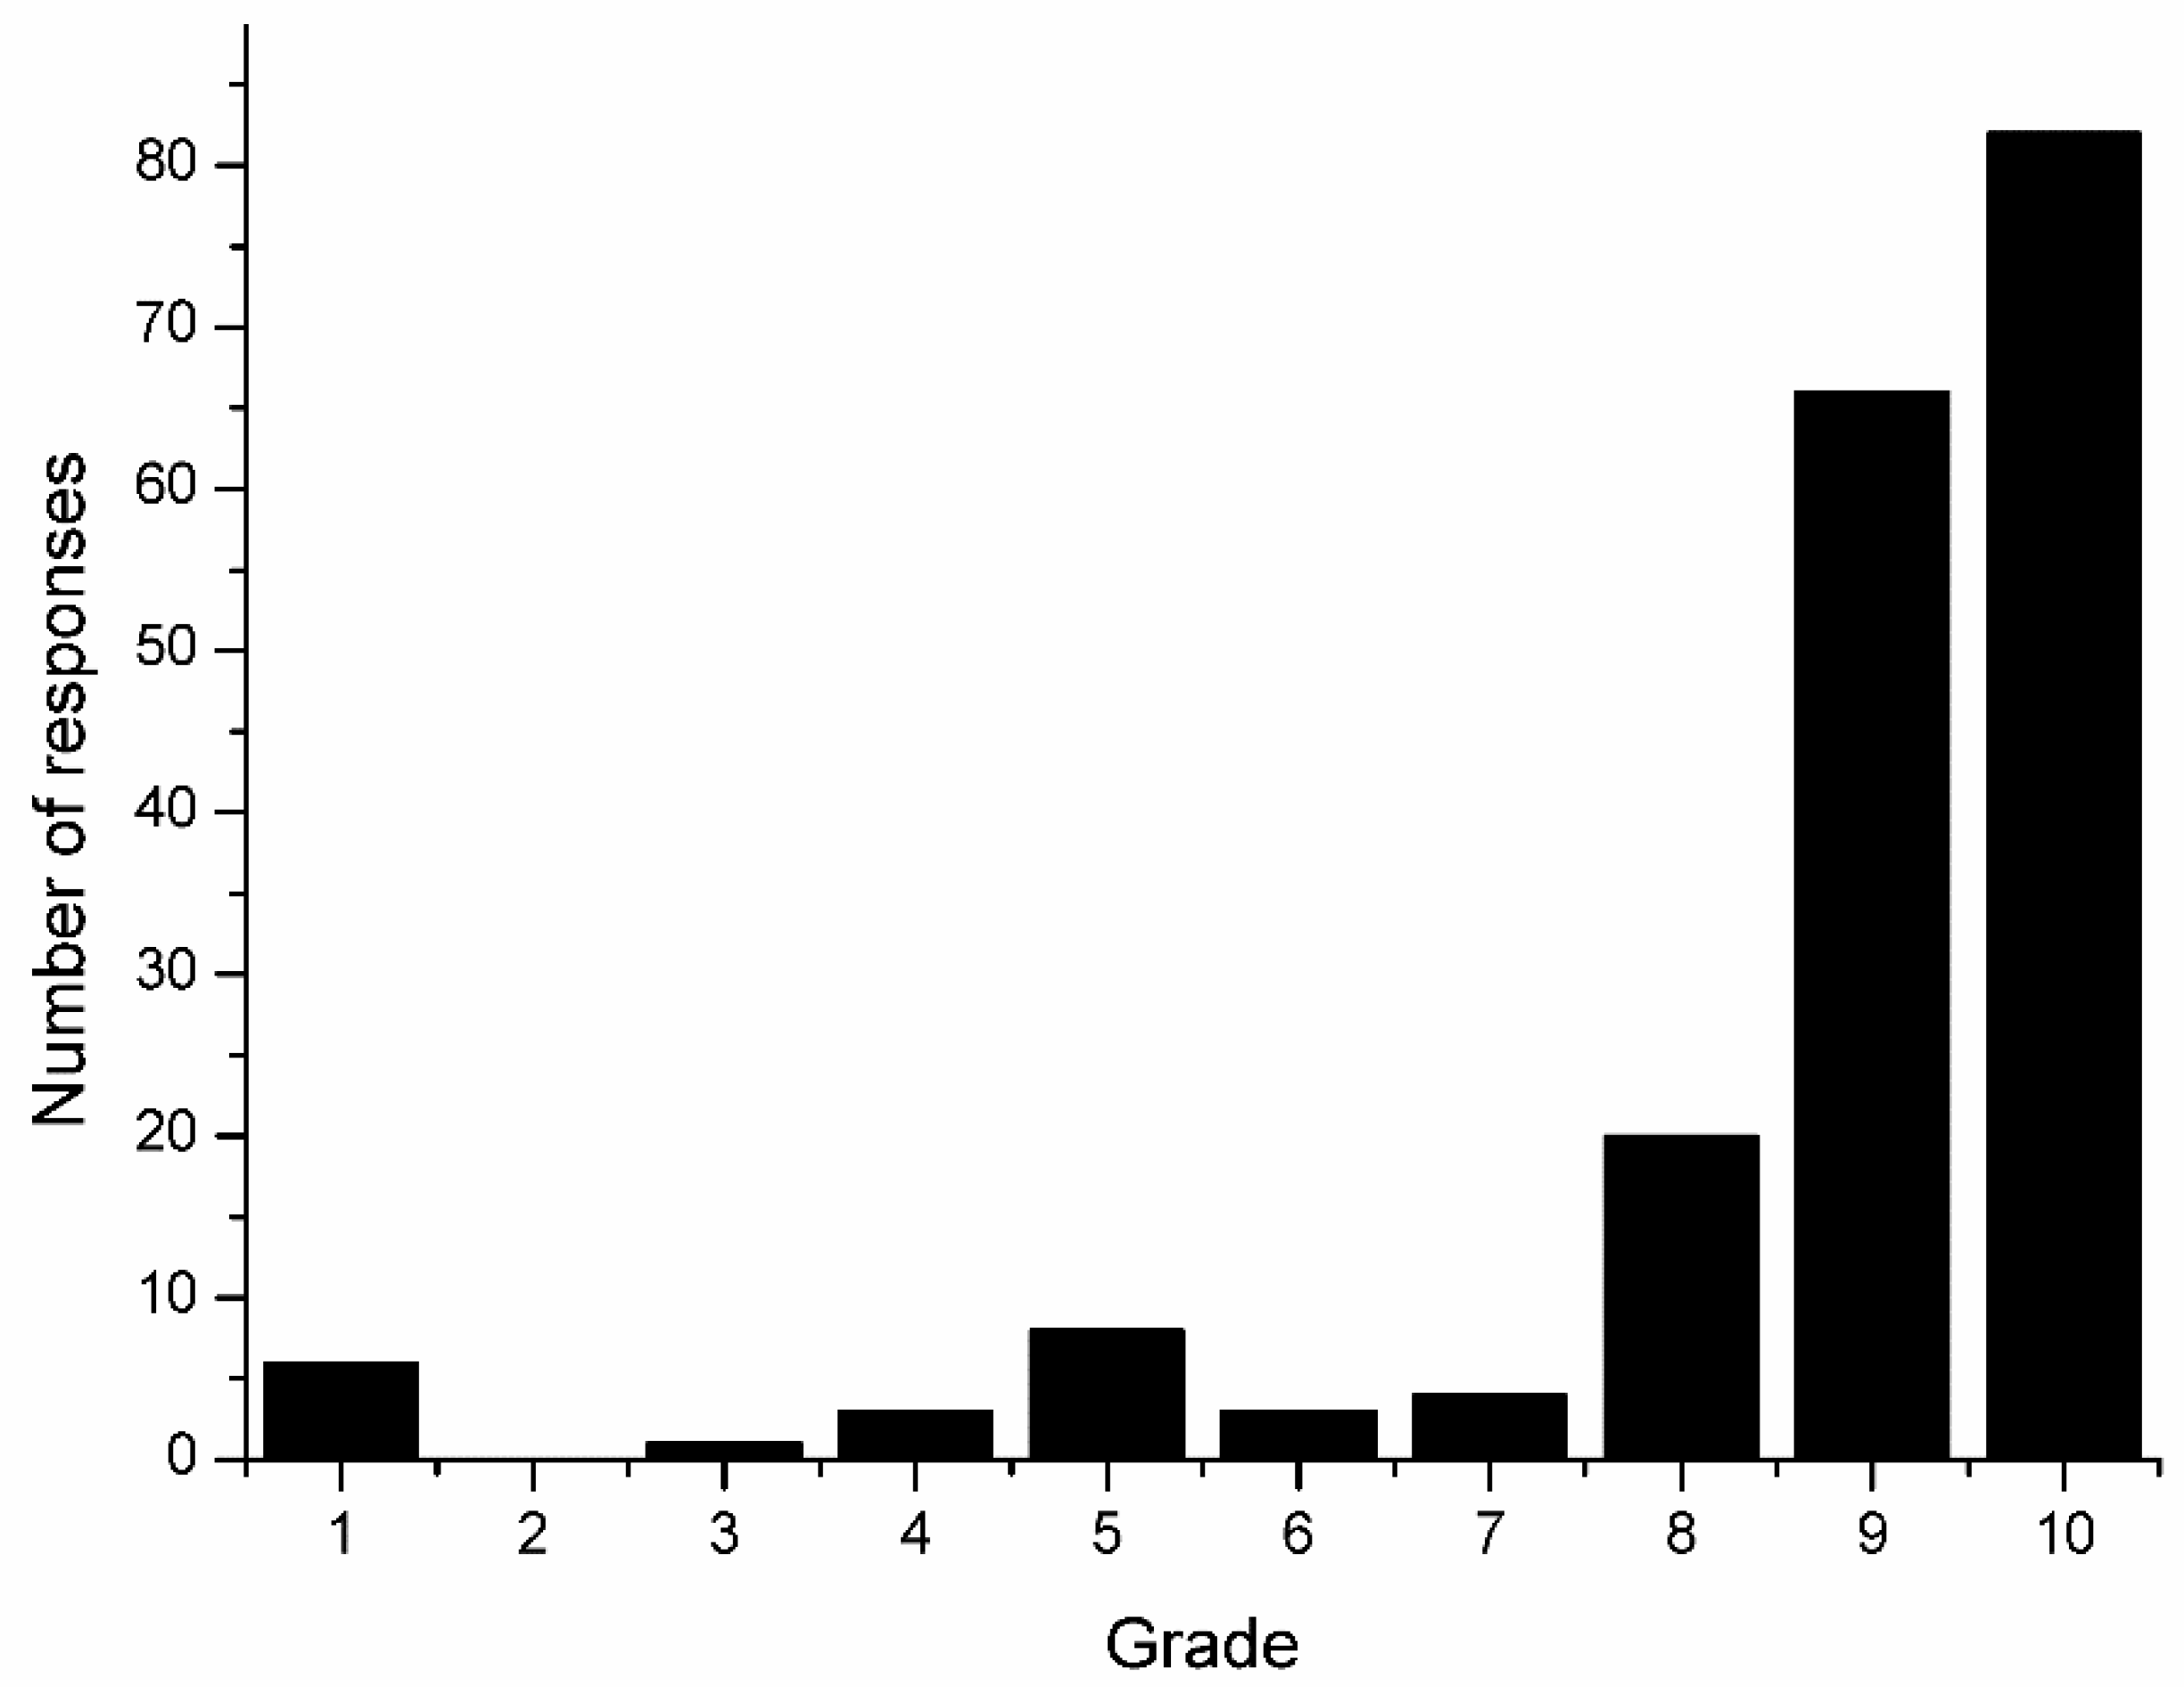
Most authors believed that reviewers fully understood their work, were competent in the subject, thoroughly read the manuscript, dedicated sufficient time to review and expressed clear comments, which helped the authors to improve their paper (Table 2). The average overall assessment grade for reviewers was 8.7 (on a 1–10 scale) and the distribution of grades is given in Figure 1. A larger range of grades was offered to the authors for overall assessment of the reviewers in order to enable more precise evaluation. Authors’ opinions on the review process may be influenced by many factors, such as the outcome (accepted or rejected paper), the journal impact factor and differences in expectations between scientific fields [6]. The first factor seemed to be much more influential than the others, as grades given by authors of rejected papers were lower than those given by authors of accepted manuscripts (Table 2). The data show that authors of rejected papers have less confidence in their reviewers. Authors of accepted papers, on the other hand, reacted positively as reviewers “agreed” with them [6,22,23]. Our experimental results confirm those of Garcia et al. [22] who employed a model in which authors were seen as Bayesian-rational individuals. They conducted a survey among 156 individual authors of papers published in Scientometrics in the period 2000–2012. The main conclusion was that authors tend to attribute acceptance of their manuscript to their own ability to write a good quality paper, whereas they blame negative bias in peer review as a cause of rejection, displaying a self-serving attributional bias. Since rejection undermines self-confidence and self-worth, authors tend to see external, situational factors as true causes for the negative decision. The same group of researchers created an online tool that can help authors to examine their beliefs about the causes of rejection, as they found that confirmatory bias induces overconfidence whereby one believes more strongly in a preferred hypotheses than one should [23]. Due to this confirmatory bias, authors may misinterpret review signals that do not agree with their current ideas. Bias can be defined as a psychological strategy employed to protect self-esteem [24] or as a behavioural tendency to take credit for personal success and deny responsibility for failure [25]. Therefore, the results obtained in this study can be explained from the more general aspect, as a protective attitude against self-threat.
Another difference between authors of accepted and rejected papers was seen in the time invested to fill-in the questionnaire (Table 2). Authors of rejected manuscripts took more time to complete the survey, which can be interpreted as a longer period needed for thought about their answers.
3.2. Data Analysis—Mixed-Effects Model
To determine which factors influenced the authors’ assessment of reviewers and their work, a mixed-effects model [26] was employed taking into account the overall assessment grade as outcome and including the review time (both in weeks and as authors’ perception), the number of referee reports and the editor’s final decision as predictors (fixed effects). To take into account that an author could have made more than one submission to these journals and that the papers themselves are grouped into journals sharing the same editorial team, publisher, etc., random effects (random intercepts) were included for both authors and journals. This relatively simple statistical technique allowed us to deal with the problem of non-independent observations in our data [26] (because of the repeated submissions to the same journal and, in some cases, by the same author) which prevented the use of the most common binary tests in the analysis. Moreover, it led to a more clear and comprehensive picture of the factors affecting the authors’ assessment (Table 3). Everything else being equal, authors of rejected papers expressed significantly worse opinions on the reviewers’ work, while the speed of the review process had a positive effect. Increases in the number of reviewers/reports negatively affected the assessment grade awarded to reviewers, although this effect was comparatively weak.
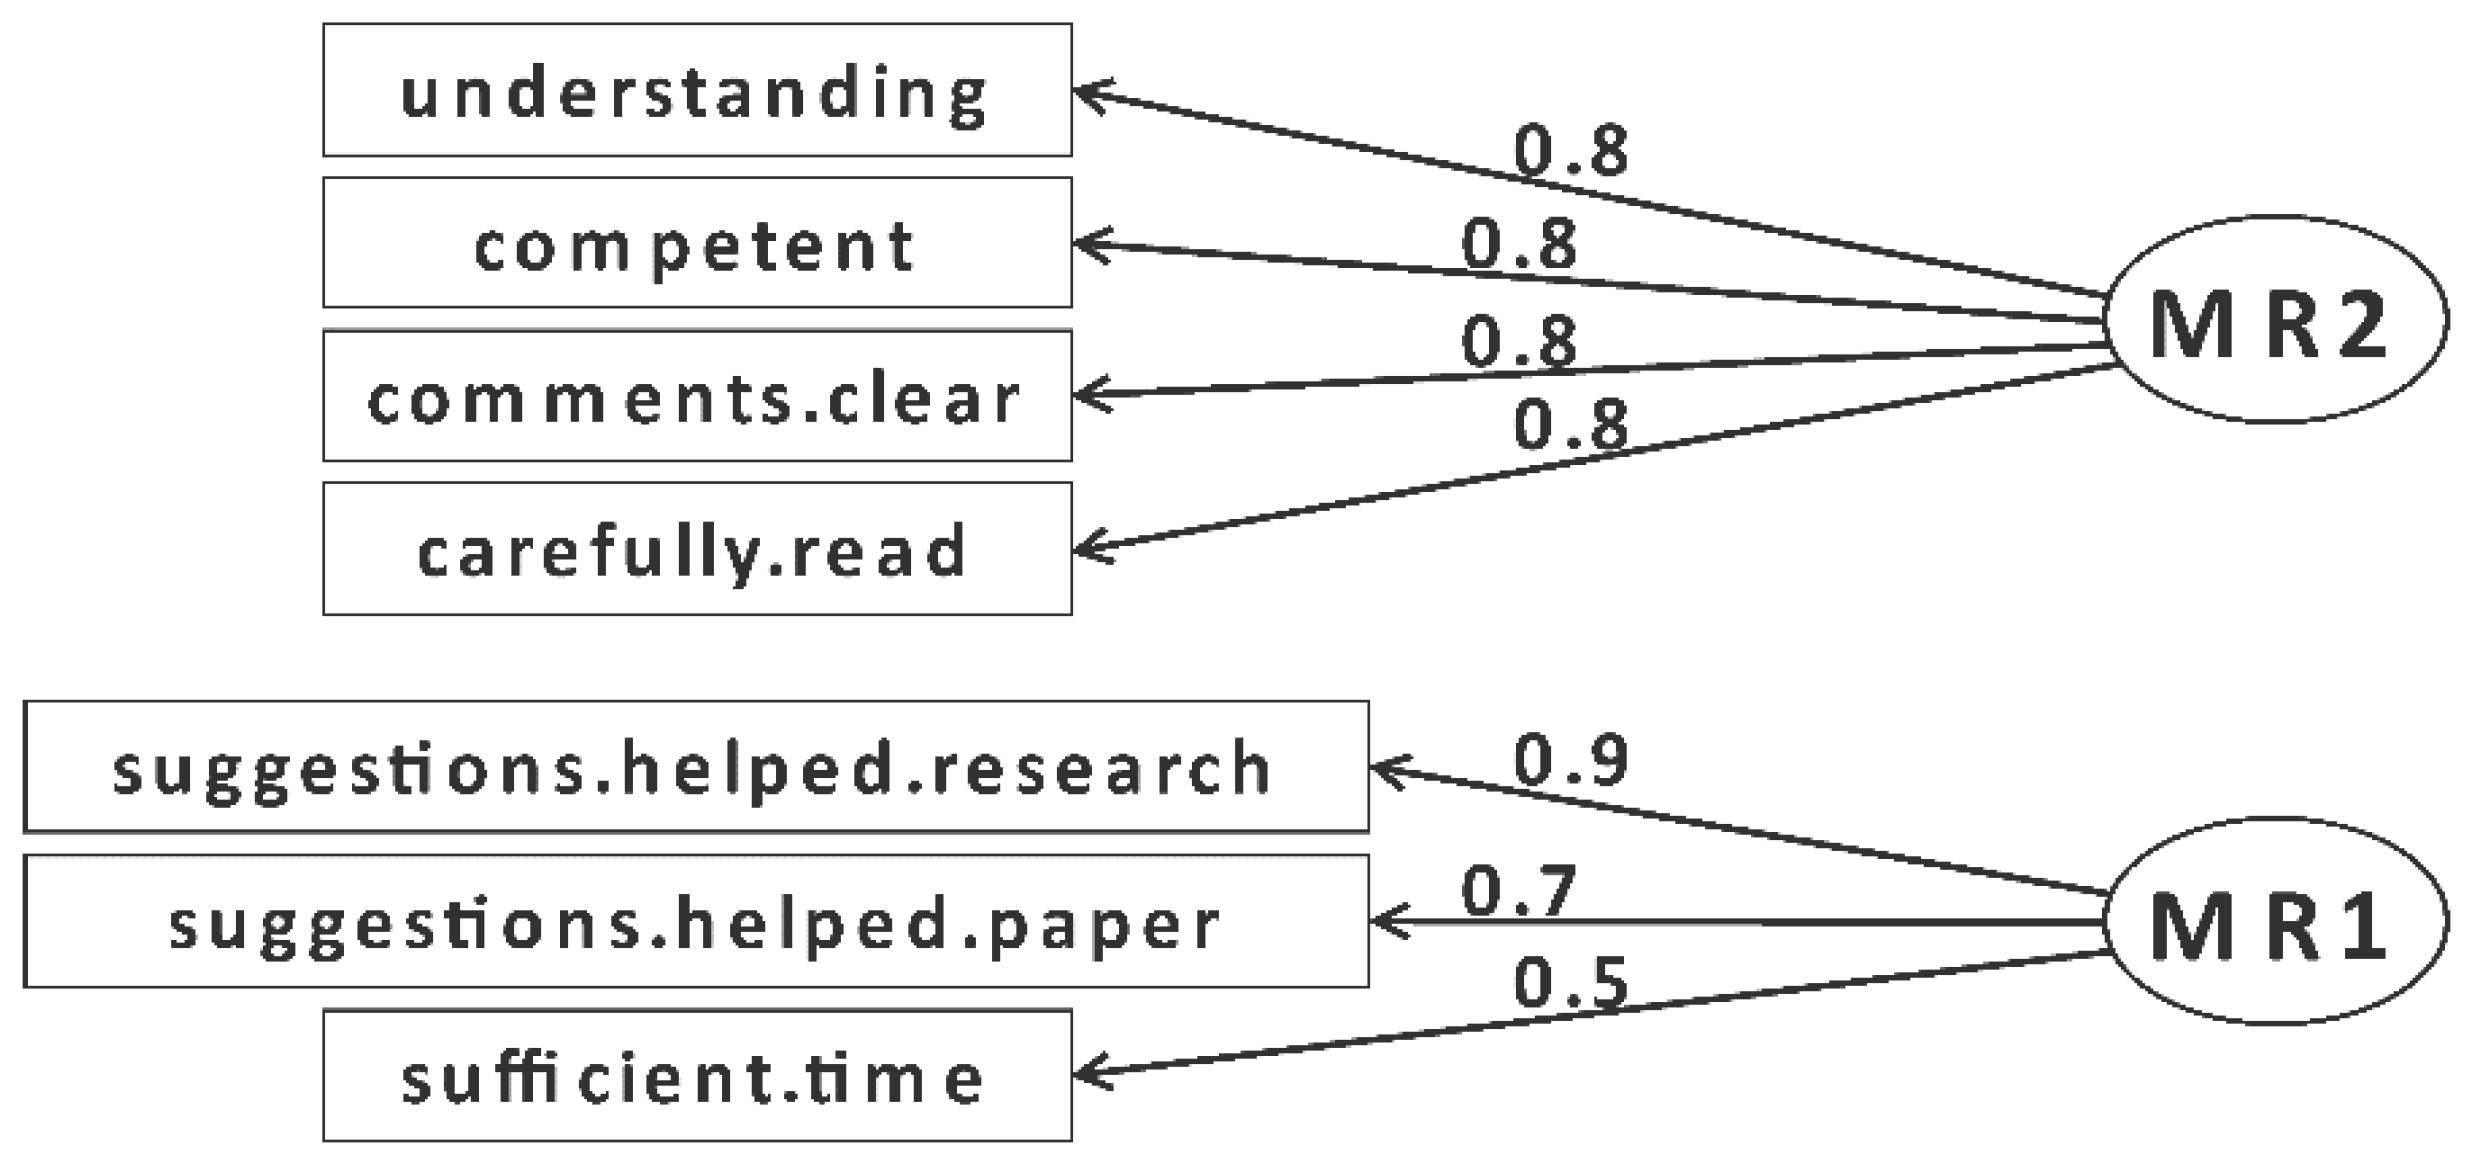
To deepen the analysis of factors leading to the authors’ assessment of their reviewers, we ran a factor analysis on seven questions detailing the authors’ opinions. Note, to avoid repeated observations of the same individual, we averaged the evaluation of reviewers given by authors, if more than one. This led to the definition of two latent constructs (factors) explaining a large part (81%) of the total variance. The most relevant (MR2, eigenvalue 5.26) was linked to the reviewers’ proficiency. More specifically, loadings were especially high for the reviewers’ competence, the fact that they carefully read and understood the paper, and the clarity of their comments (Figure 2). The second factor (MR1, eigenvalue 0.39) focused on the helpfulness of reviewers’ suggestions.
We used these two new factors as predictors, along with the variables already considered in Table 3, in a second model of the overall assessment of reviewers’ work as an outcome (Table 4). The review speed perception remained a significant predictor of the assessment. In addition, both the perceived competence and helpfulness of the reviewers significantly and positively affected authors’ assessments. It is also worth noting that the final decision was no longer significant in the new model.
Although most of the predictors highlighted in Table 3 turned out not to be significant in the new analysis, it is still possible that they affected the competence and helpfulness factors. To check that, we employed two new models using these two factors as outcomes. Besides the variables mentioned above, in the new models we also included the author’s opinion on the coherence of the editorial decision with the reviewers’ reports as a predictor (Table 5 and Table 6).
The model on the competence factor was able to explain only 37% of the observed variance (Table 5). In particular, the assessment of the competence of reviewers strongly depended on the final editorial decision. In addition, receiving more reports significantly reduced the assessment grade, possibly because of an unobserved disagreement among reviewers. On the other hand, the model on the helpfulness factor was much weaker, as only the final decision remained significant and the model as a whole explained only a small proportion (9%) of the observed variance (Table 6).
3.3. The Content Analysis of Textual Answers
The qualitative content analysis, which enabled systematic overview of textual information by its frequencies in specific categories, was performed using the responses given to the questions listed in Table 7, as well as the additional comments given by authors in free form.
The content analysis of the first question extracted three categories of responses: Authors’ satisfaction with reviewers’ comments (n = 34), Authors dissatisfaction with reviewers’ comments (n = 8) and Comments directed to proof reading (n = 8). Authors’ satisfaction was further sub-categorized as shown in Table 8. Approximately one third of the responses confirmed that reviewers’ input contributed to the quality of the scientific part of the paper. Authors who expressed dissatisfaction with the reviewers’ comments named four reasons for such a statement: lack of contribution in general (n = 3), lack of feedback (n = 2), lack of attention (n = 2), and lack of clarification (n = 1). Responses from authors of rejected papers were all within the category of author dissatisfaction with reviewers’ comments and suggestions. As can be noted by simply summing authors’ statements (n = 50), there were more statements than responses (n = 40), since some authors expressed satisfaction with one aspect of reviewing and dissatisfaction with another.
The second open question offered several options of choice in order to identify the possible influence of non-scientific factors on the review and the reviewer’s final suggestion, so the participants were limited to predefined answers. These were introduced to enable easier analysis of the data, but authors also had the option to mark “other” as a choice of the influential factor and name it. A category “personal reasons” was introduced, as editors occasionally receive comments from authors who suspect that negative comments/decisions originated from personal acquaintance between an author and a reviewer. A limitation of the survey is, of course, the inability to verify such statements. Authors highlighted specific subcategories: different conceptual approach (n = 4), personal reasons (n = 3), institution of origin (n = 2), competitiveness (n = 2) and country of origin (n = 1). Again, the number of statements (n = 12) exceeded the number of authors who responded (n = 8), indicating that some authors suspected an influence of more than one non-scientific factor on the review process. Additional comments revealed the authors’ opinion on other aspects of the process (e.g., difficulties with payment or the Journal web page, chances for resubmission), but the frequency of these comments was too low to enable further analysis.
To sum up, when evaluating a reviewer’s work and contribution, the authors seem to be strongly influenced by the final decision on their paper: if the paper is accepted, the authors are satisfied with the review reports; if it is rejected, they judge that the wrong reviewers were chosen or that they did not perform well (i.e., they did not review properly). This result is in agreement with that of Weber et al. [8], but contrary to the findings of Gibson et al. [4] (both surveys were performed on a single journal). Discrepancies can be explained by differences in the size of the studied population, questionnaire items, and the scale of rating [4].
4. Conclusions
Despite the limitations of our study (number of journals, uneven distribution of authors’ responses from different journals, most responses from authors of accepted papers), the following conclusions can be drawn from the data: authors were much less willing to participate in the survey if their paper was rejected, authors of rejected papers clearly expressed worse opinions about the reviewers’ work, assessment of the reviewers’ competence by authors strongly depended on the final editorial decision, more reports reduced the assessment grade, possibly due to disagreement among reviewers, and the answers to open questions from the authors of rejected papers were all within the category of an author’s dissatisfaction with reviewers’ comments and suggestions.
In the era of an exponentially increasing number of manuscript submissions, with a growing phenomenon of repeated evaluations and rejections of the same paper until it is finally accepted [27], greater pressure on reviewers may backfire and demotivate them to accept the task owing to lack of time or adequate recognition [28,29]. Hence our study provides useful information enabling better understanding of authors’ perceptions of the review process and could be used to target specific areas for improvement. Editors should pay more attention to reviewers and could introduce a scoring system in order to confirm or eliminate certain reviewers for future tasks, or they might organize educational training, if necessary. Editors could clarify instructions for reviewers or alter the invitation pattern in order to improve the efficiency (speed) and the effectiveness (acceptance of good quality papers, free of errors) of the scientific publishing process.
Supplementary Materials
The following are available online at https://www.mdpi.com/2304-6775/7/1/1/s1.
Author Contributions
Conceptualization, I.D., A.D., and O.N.; methodology, I.D., A.D., and O.N.; software, A.D. and G.B.; validation, I.D., L.V., and G.B.; formal analysis, A.D., L.V., and G.B.; investigation, I.D., A.D., and O.N.; data curation, A.D.; writing—original draft preparation, I.D. and O.N.; writing—review and editing, all of authors; visualization, A.D.; supervision, G.B.
Funding
This research received no external funding.
Statement
This investigation is part of scientific activities in the COST Action TD1306 “New Frontiers of Peer Review (PEERE)”.
Conflicts of Interest
The authors declare no conflict of interest.
References
- Fletcher, R.H.; Fletcher, S.W. Evidence for the Effectiveness of Peer Review. Sci. Eng. Ethics 1997, 3, 35–50. [Google Scholar] [CrossRef]
- Davidoff, F. Improving Peer Review: Who’s Responsible? BMJ 2004, 328, 657–658. [Google Scholar] [CrossRef] [PubMed]
- DiDomenico, R.J.; Baker, W.L.; Haines, S.T. Improving Peer Review: What Reviewers Can Do. Am. J. Health. Syst. Pharm. 2017, 74, 2080–2084. [Google Scholar] [CrossRef] [PubMed]
- Gibson, M.; Spong, C.Y.; Simonsen, S.E.; Martin, S.; Scott, J.R. Author Perception of Peer Review. Obstet. Gynecol. 2008, 112, 646–652. [Google Scholar] [CrossRef] [Green Version]
- Squazzoni, F.; Brezis, E.; Marušić, A. Scientometrics of Peer Review. Scientometrics 2017, 113, 501–502. [Google Scholar] [CrossRef] [PubMed]
- Huisman, J.; Smits, J. Duration and Quality of the Peer Review Process: The Author’s Perspective. Scientometrics 2017, 113, 633–650. [Google Scholar] [CrossRef] [PubMed]
- Korngreen, A. Peer-Review System Could Gain from Author Feedback. Nature 2005, 438, 282. [Google Scholar] [CrossRef]
- Weber, E.J.; Katz, P.P.; Waeckerle, J.F.; Callaham, M.L. Author Perception of Peer Review: Impact of Review Quality and Acceptance on Satisfaction. JAMA 2002, 287, 2790–2793. [Google Scholar] [CrossRef]
- Dekanski, A.; Drvenica, I.; Nedic, O. Peer-Review Process in Journals Dealing with Chemistry and Related Subjects Published in Serbia. Chem. Ind. Chem. Eng. Q. 2016, 22, 491–501. [Google Scholar] [CrossRef]
- It’s Not the Size that Matters. Available online: https://publons.com/blog/its-not-the-size-that-matters/ (accessed on 28 February 2018).
- Ausloos, M.; Nedic, O.; Fronczak, A.; Fronczak, P. Quantifying the Quality of Peer Reviewers through Zipf’s Law. Scientometrics 2016, 106, 347–368. [Google Scholar] [CrossRef]
- Tomkins, A.; Zhang, M.; Heavlin, W.D. Reviewer Bias in Single—Versus Double-Blind Peer Review. Proc. Natl. Acad. Sci. USA 2017, 114, 12708–12713. [Google Scholar] [CrossRef]
- Fiala, D.; Havrilová, C.; Dostal, M.; Paralič, J.; Fiala, D.; Havrilová, C.; Dostal, M.; Paralič, J. Editorial Board Membership, Time to Accept, and the Effect on the Citation Counts of Journal Articles. Publications 2016, 4, 21. [Google Scholar] [CrossRef]
- Walker, R.; Barros, B.; Conejo, R.; Neumann, K.; Telefont, M. Personal Attributes of Authors and Reviewers, Social Bias and the Outcomes of Peer Review: A Case Study. F1000Research 2015, 4, 21. [Google Scholar] [CrossRef] [PubMed]
- Zhao, Y.W.; Chi, C.-H.; van den Heuvel, W.-J. Imperfect Referees: Reducing the Impact of Multiple Biases in Peer Review. J. Assoc. Inf. Sci. Technol. 2015, 66, 2340–2356. [Google Scholar] [CrossRef]
- Siler, K.; Lee, K.; Bero, L. Measuring the Effectiveness of Scientific Gatekeeping. Proc. Natl. Acad. Sci. USA 2015, 112, 360–365. [Google Scholar] [CrossRef] [PubMed]
- Fein, C. Multidimensional Journal Evaluation of PLoS ONE. Libri 2013, 63, 259–271. [Google Scholar] [CrossRef]
- Moizer, P. Publishing in Accounting Journals: A Fair Game? Account. Organ. Soc. 2009, 34, 285–304. [Google Scholar] [CrossRef]
- Bornmann, L.; Daniel, H.-D. How Long Is the Peer Review Process for Journal Manuscripts? A Case Study on Angewandte Chemie International Edition. Chimia 2010, 64, 72–77. [Google Scholar] [CrossRef]
- Kljaković-Gašpić, M.; Hren, D.; Marušić, A.; Marušić, M. Peer Review Time: How Late Is Late in a Small Medical Journal? Arch. Med. Res. 2003, 34, 439–443. [Google Scholar] [CrossRef]
- Lyman, R.L. A Three-Decade History of the Duration of Peer Review. J. Sch. Publ. 2013, 44, 211–220. [Google Scholar] [CrossRef]
- García, J.A.; Rodriguez-Sánchez, R.; Fdez-Valdivia, J. Why the Referees’ Reports I Receive as an Editor Are so Much Better than the Reports I Receive as an Author? Scientometrics 2016, 106, 967–986. [Google Scholar] [CrossRef]
- García, J.A.; Rodriguez-Sánchez, R.; Fdez-Valdivia, J. Authors and reviewers who suffer from confirmatory bias. Scientometrics 2016, 109, 1377–1395. [Google Scholar] [CrossRef]
- Sedikides, C.; Strube, M. The multiply motivated self. Person. Soc. Psychol. Bull. 1995, 21, 1330–1335. [Google Scholar] [CrossRef]
- Coleman, M.D. Emotion and the Self-Serving Bias. Curr. Psychol. 2011, 30, 345–354. [Google Scholar] [CrossRef]
- Gelman, A.; Hill, J. Data Analysis Using Regression and Multilevel/Hierarchical Models; Cambridge University Press: Cambridge, UK, 2006; ISBN 9780511790942. [Google Scholar]
- Oosterhaven, J. Too Many Journals? Towards a Theory of Repeated Rejections and Ultimate Acceptance. Scientometrics 2015, 103, 261–265. [Google Scholar] [CrossRef] [PubMed]
- Starck, J.M. Scientific Peer Review; Springer Spektrum: Wiesbaden, Germany, 2017; ISBN 978-3-658-19915-9. [Google Scholar]
- Fox, C.W. Difficulty of Recruiting Reviewers Predicts Review Scores and Editorial Decisions at Six Journals of Ecology and Evolution. Scientometrics 2017, 113, 465–477. [Google Scholar] [CrossRef]
Figure 1.
Distribution of grades given for the overall assessment of reviewers by authors.
Figure 2.
Factor loadings in the analysis on the variables reflecting the authors’ assessment of the reviewers.
Figure 2.
Factor loadings in the analysis on the variables reflecting the authors’ assessment of the reviewers.

Table 1.
Journals involved in the survey and the number of responses obtained.
| Journal Name (ISSN) | No. of Responses | Portion, % |
|---|---|---|
| The Archives of Biological Sciences (1821-4339) | 11 | 5.7 |
| Chemical Industry & Chemical Engineering Quarterly (2217-7434) | 20 | 10.4 |
| Društvena istraživanja (1848-6096) | 2 | 1.0 |
| Hemijska industrija/Chemical Industry (2217-7426) | 7 | 3.6 |
| International Comparative Jurisprudence (2351-6674) | 2 | 1.0 |
| International Journal of the Commons (1875-0281) | 1 | 0.5 |
| Journal of Electrochemical Science and Engineering (1847-9286) | 16 | 8.3 |
| Journal of the Serbian Chemical Society (1820-7421) | 106 | 54.9 |
| Ljetopis socijalnog rada/Annual of Social Work (1848-7971) | 10 | 5.2 |
| Mljekarstvo (1846-4025) | 1 | 0.5 |
| Muzikologija (2406-0976) | 14 | 7.3 |
| Pravni zapisi (2406-1387) | 1 | 0.5 |
| Preventivna pedijatrija (2466-3247) | 2 | 1.0 |
Table 2.
Average grades which authors gave as a response to specific questions.
| Question | Average Grade (No. of Responses) | ||
|---|---|---|---|
| Acc. (179) | Rej. (14) | Total (193) | |
| After how many weeks, after submitting the manuscript, did you get reports? | 8.2 | 16.1 | 8.8 |
| How many reports have you received? | 1.9 | 1.2 | 1.8 |
| Did the reviewer show reasonable understanding of your work? (1—not at all… 5—fully) | 4.5 | 2.6 | 4.4 |
| Do you think that the reviewer was competent to review your paper? (1—not at all… 5—fully competent) | 4.6 | 2.8 | 4.5 |
| According to your estimation, did the reviewer carefully and thoroughly read the paper? (1—not at all… 5—yes, very carefully and thoroughly) | 4.7 | 3.0 | 4.6 |
| Were the reviewer’s comments clear? (1—not at all… 5—yes, completely clear) | 4.7 | 2.6 | 4.6 |
| Did the reviewer’s comments, suggestions… help you to improve the quality of the paper? (1—not at all… 5—yes, very much) | 4.5 | 2.5 | 4.4 |
| Do you think that the reviewer’s comments, suggestions… will be useful for your upcoming research? (1—not at all… 5—very useful) | 4.3 | 2.5 | 4.2 |
| According to your impression, did the reviewer dedicate sufficient time to review? (1—not at all… 5—adequate time) | 4.5 | 3.2 | 4.4 |
| Please give an overall assessment grade of the reviewer (1—Bad… 10—Excellent) | 8.9 | 4.7 | 8.7 |
| Duration of the survey completion (sec) | 1164 | 1381 | 1246 |
Acc.—authors of accepted papers, Rej.—authors of rejected papers (number of responses).
Table 3.
Mixed-effects model on the authors’ assessment of reviewers’ work with random effects (intercepts) for authors and journals. Reference classes were “accepted” for the final decision and “slow” for the speed of review. All t-tests used Satterthwaite’s approximation to compute the degrees of freedom.
| Random Effects | |||||
|---|---|---|---|---|---|
| Group Name | SD 1 | ||||
| Author (Intercept) | 0.968 | ||||
| Journal (Intercept) | 0.335 | ||||
| Residual | 1.418 | ||||
| Fixed Effects | Estimate | SE 2 | df | t | p |
| (Intercept) | 8.482 | 0.471 | 156.18 | 18.023 | 0.000 *** |
| No. of weeks | −0.027 | 0.013 | 220.33 | 2.037 | 0.043 * |
| No. of reports | −0.259 | 0.131 | 155.35 | 1.974 | 0.050 * |
| Final decision: Rejected | −4.106 | 0.484 | 248.66 | 8.491 | 0.000 *** |
| Speed: On time | 1.122 | 0.352 | 189.19 | 3.188 | 0.002 ** |
| Speed: Fast | 1.317 | 0.402 | 185.89 | 3.277 | 0.001 ** |
1 Standard deviation; 2 Standard Error Number of observations: 360 groups: reference 193; journals: 13. Significance codes: *** <0.001, ** <0.01, * <0.05.
Table 4.
Ordinary Least Squares (OLS) estimation of factors predicting authors’ assessment of reviewers’ work. Reference classes were “accepted” for the final decision and “slow” for the speed of review.
Table 4.
Ordinary Least Squares (OLS) estimation of factors predicting authors’ assessment of reviewers’ work. Reference classes were “accepted” for the final decision and “slow” for the speed of review.
| Coefficients | Estimate | SE | T | p |
|---|---|---|---|---|
| (Intercept) | 8.052 | 0.215 | 37.479 | 0.000 *** |
| No. of weeks | −0.005 | 0.006 | −0.890 | 0.375 |
| No. of reports | −0.026 | 0.066 | −0.392 | 0.695 |
| Final decision: Rejected | −0.165 | 0.259 | −0.637 | 0.525 |
| Speed: On time | 0.738 | 0.169 | 4.369 | 0.000 *** |
| Speed: Fast | 0.838 | 0.194 | 4.321 | 0.000 *** |
| Competence factor | 1.423 | 0.067 | 21.101 | 0.000 *** |
| Helpfulness factor | 1.024 | 0.055 | 18.678 | 0.000 *** |
Significance codes: *** <0.001, ** <0.01, * <0.05.
Table 5.
OLS estimation of factors predicting authors’ assessments of reviewers’ competence. Reference classes were “accepted” for the final decision, “slow” for the speed of review, and “yes” for the coherence of the editorial decision.
Table 5.
OLS estimation of factors predicting authors’ assessments of reviewers’ competence. Reference classes were “accepted” for the final decision, “slow” for the speed of review, and “yes” for the coherence of the editorial decision.
| Coefficients | Estimate | SE | t | p |
|---|---|---|---|---|
| (Intercept) | 0.336 | 0.237 | 1.422 | 0.157 |
| No. of weeks | −0.010 | 0.007 | −1.420 | 0.157 |
| No. of reports | −0.162 | 0.072 | −2.240 | 0.026 * |
| Final decision: Rejected | −2.173 | 0.245 | −8.867 | 0.000 *** |
| Speed: On time | 0.234 | 0.186 | 1.255 | 0.211 |
| Speed: Fast | 0.228 | 0.213 | 1.073 | 0.285 |
| Decision coherent: No | 0.298 | 0.372 | 0.801 | 0.424 |
Significance codes: *** <0.001, ** <0.01, * <0.05.
Table 6.
OLS estimation of factors predicting authors’ assessment of reviewers’ helpfulness. Reference classes were “accepted” for the final decision, “slow” for the speed of review, and “yes” for the coherence of the editorial decision.
Table 6.
OLS estimation of factors predicting authors’ assessment of reviewers’ helpfulness. Reference classes were “accepted” for the final decision, “slow” for the speed of review, and “yes” for the coherence of the editorial decision.
| Coefficients | Estimate | SE | T | p |
|---|---|---|---|---|
| (Intercept) | −0.216 | 0.290 | −0.743 | 0.459 |
| No. of weeks | −0.014 | 0.008 | −1.704 | 0.090 |
| No. of reports | 0.075 | 0.089 | 0.844 | 0.400 |
| Final decision: Rejected | −0.771 | 0.301 | −2.566 | 0.011 * |
| Speed: On time | 0.233 | 0.228 | 1.020 | 0.310 |
| Speed: Fast | 0.335 | 0.261 | 1.283 | 0.201 |
| Decision coherent: No | 0.576 | 0.456 | 1.264 | 0.208 |
Significance codes: *** <0.001, ** <0.01, * <0.05.
Table 7.
Average grades which authors gave as a response to open questions.
| Question | Average Grade (No. of Responses) | ||
|---|---|---|---|
| Acc. | Rej. | Total | |
| Did the reviewer’s comments, suggestions… help you to improve the quality of the paper? (1—not at all… 5—yes, very much). If you wish, please state how? | 4.6 (36) | 2.0 (4) | 4.3 (40) |
| Did you have an impression that some non-scientific factor influenced the review and the final reviewer’s suggestion? * Please explain. | Yes (5) | Yes (3) | Yes (8) |
Acc.—authors of accepted papers, Rej.—authors of rejected papers (number of responses). * If the answer was YES, the author could choose one of the options: institution of origin, country of origin, different conceptual approach, gender, personal reasons, competitiveness, religion, ethnicity, other, _________, and explain.
Table 8.
Subcategories of authors’ satisfaction with reviewers’ comments.
| Category | Subcategory | No. of Responses |
|---|---|---|
| Authors satisfaction with reviewers’ comments and suggestions for improvement of paper quality | Improvement of the specific part of the paper | 13 |
| General satisfaction | 7 | |
| Additional explanation | 5 | |
| Increase of actuality | 2 | |
| Benefit for future work | 2 | |
| Elimination of unnecessary data | 2 | |
| Different formulation | 2 | |
| Conceptual changes | 1 | |
| Total | 34 |
© 2018 by the authors. Licensee MDPI, Basel, Switzerland. This article is an open access article distributed under the terms and conditions of the Creative Commons Attribution (CC BY) license (http://creativecommons.org/licenses/by/4.0/).
Share and Cite
MDPI and ACS Style
Drvenica, I.; Bravo, G.; Vejmelka, L.; Dekanski, A.; Nedić, O. Peer Review of Reviewers: The Author’s Perspective. Publications 2019, 7, 1. https://doi.org/10.3390/publications7010001
AMA Style
Drvenica I, Bravo G, Vejmelka L, Dekanski A, Nedić O. Peer Review of Reviewers: The Author’s Perspective. Publications. 2019; 7(1):1. https://doi.org/10.3390/publications7010001
Chicago/Turabian StyleDrvenica, Ivana, Giangiacomo Bravo, Lucija Vejmelka, Aleksandar Dekanski, and Olgica Nedić. 2019. "Peer Review of Reviewers: The Author’s Perspective" Publications 7, no. 1: 1. https://doi.org/10.3390/publications7010001
Note that from the first issue of 2016, this journal uses article numbers instead of page numbers. See further details here.