1. Background and Rationale
Open access (OA) literature is digital, online, free of charge, and free of most copyright and licensing restrictions [
1]. As described in the Budapest Open Access Initiative [
2], OA offers a potential unprecedented public good, building on the capacity of the Internet for free sharing with everyone and the scholarly tradition of giving away academic articles and peer review services (BOAI). Also as described in BOAI, there are two basic approaches to open access, via archiving and publishing. There are compelling arguments for pursuing both approaches at the same time [
3]. This research focuses on one particular business method for open access publishing, article processing fees (APCs), used by a minority of fully open access journals. APCs are one of a wide variety of economic approaches for open access publishing [
4].
Over 2000 journals use the OA APC business model. As listed in the Open Access Directory [
5], many universities and other organizations have funds available for authors wishing to publish in open access journals. Tananbaum [
6] reports on a recent update on open access article processing funds in North America. On 8 November 2012 the Research Councils UK [
7] announced that they would be providing block grants to all universities in the UK to support APCs. The SCOAP
3 [
8] project which flips all of high energy physics publishing from a system based on subscriptions to an open access model was launched earlier this year. This trend towards providing economic support for open access suggests a need for ongoing research into potential approaches to facilitate prudent decision-making. This research updates and expands on previous work in this area, notably the works of Solomon and Björk [
9] and Björk and Solomon [
10] that summarize the history and previous work in this area. The unique contributions of this research include: (a) a snapshot of the journals listed in DOAJ as having APCs at a particular point in time (May 2014) that will be useful for forwards and backwards longitudinal studies; (b) descriptive statistics based on publishers’ APC title list size; (c) additional details and analysis of pricing variations; and (d) information about the methodological challenges involved in conducting this research at this point in time; in this case the challenges per se are one of the indicators of the volatility of this sector; and (e) descriptive analysis focusing on the variability of the data to support the argument that this sector is not stable at this point in time.
Morrison [
11] argues that behind the variety of models for economic support for open access journals, the basic underlying strategy involves shifting from demand-side to supply-side economics. Instead of charging readers and librarians for subscriptions, licenses, or purchase of scholarly works, open access business models involve supporting the production costs. Morrison argues that the average cost per article is a key factor in evaluating the affordability of an open access scholarly communication system. The majority of economic support for scholarly journals today is the global spend of academic libraries (68%–73%, with another portion coming from other types of libraries, including research and government libraries). If the average cost per article for an open access publishing system were $188 as reported by Edgar and Willinsky [
12] in a survey of over 900 journals using Open Journal Systems, globally academic libraries could fully fund open access scholarly article production at a small fraction of current actual spend on subscriptions for these journals. Significant savings could be achieved if the average cost per article were at the level of average OA APC of selected successful open access publishers using this business model (e.g., BioMedCentral, Hindawi, Public Library of Science), based on 2013 rates. However, caution is necessary as a high average OA APC, for example the $5000 charged by Elsevier’s Cell Press, would increase the cost of the system as a whole.
The focus of this study is open access article processing charges (APCs) for two reasons: (1) to establish and track the trajectory of this approach over time, e.g., to examine whether competition emerges or whether market forces result in the same dysfunction in this system that has long been evident in the subscriptions market; and (2) the APC is one of the best indicators of per-article cost, a key factor in macro analysis of the potential for transformation of the whole system of scholarly journal publishing from subscriptions to open access; this work will inform future macro level analyses (
i.e., an update of Morrison’s 2013 article [
11]) to support the economic shift from subscriptions to open access.
One difficulty in predicting the trajectory for average OA APCs is that this business is relatively new and the impact of various potential economic factors on what is charged is currently unknown. The APC is transparent at the per-article level; this could spur competition if authors have choices between equally desirable journals with different charges and/or prudent decision-making if authors and funders need to choose between APCs and other research expenditures. However, there is no a priori reason to assume that a scholarly publishing system based on OA APCs would be immune to the same factors causing dysfunction in the current scholarly publishing system, such as concentration and monopolistic factors leading to commercial publishers able to enjoy high profits and still raise prices at rates above inflation year after year [
13]. It is entirely possible that the current “must have” subscription journals that are immune to market forces will be replaced by “must publish in” open access journals enjoying a similar immunity.
This research will establish a baseline for longitudinal studies (forwards and backwards) of OA APCs charged by different publishers and publisher types, modeled on the long-standing annual review of journal subscription prices published by Library Journal. Second, this research will provide descriptive information about the journals and publishers currently identified as using the OA APC method. Third, this research will provide contextual trends related to the evolving landscape of business models of OA journals. As the results will illustrate, this model is more complex than a straightforward per-article charge and includes a number of sub-models worthy of investigation in their own right.
2. Method
A total of 1584 of the 2567 journals identified in DOAJ using a screen scrape as having charges as of 15 May 2014 were sampled using the following method. Full samples were obtained for almost all publishers that publish 40 or more journals using APCs. Some journals were sampled for all publishers that publish 5–29 journals using APCs. A selection of journals from publishers with four or fewer journals was included on a two-stage randomization process. Data was obtained for journals included in a random sample obtained during a November 2013 pilot project and additional journals were identified on a random basis. Specifics for sampling of each journal can be identified through the Sampling Factor field in the research dataset. A sampling factor of 1 indicates a full sample, while a sampling factor of 3 indicates that one in three journals was sampled. For journals from publishers publishing fewer than 10 journals, the sampling factor reflects this entire subset rather than the individual publisher.
There were significant methodological challenges. DOAJ’s downloadable metadata normally includes columns for whether the journal has publication charges with a link to further information. DOAJ staff had emptied these columns at the time of the sample. According to the DOAJ staff this was because this data had been determined to contain a number of errors and was in need of updating. For this reason, a DOAJ advanced search limited to journals with the publication charges section expanded was used in conjunction with a screen scrape to determine journals identified by DOAJ as having publication charges before the relevant columns were deleted from DOAJ’s downloadable metadata.
OA APC quantitative and qualitative data was gathered by members of the research team (one team member per publisher) from publisher websites during the census period of 15–31 May 2014. A variety of techniques were used, including screen scraping and copying of publisher PDF and html web pages for later data manipulation. In general, DOAJ searching was used to identify URLs for journal/publisher OA APCs. In some cases, additional searching was necessary as the URL in DOAJ no longer pointed to the publishers’ OA APC information. In one case it was necessary to register to view OA APC information.
Qualitative data was developed in an inductive fashion to develop categories for quantitative analysis of sub-models, initially developed through the pilot project with additions during the census period.
Currency conversion to the US dollar was based on the Bank of Canada’s 10-year currency conversion rate [
14] based on the census date of 15 May 2014. XE.com was used to convert the Ukrainian currency, which was not available through the Bank of Canada.
3. Results
On 15 May 2014 an advanced search of DOAJ limited to journals with the information on publication charges expanded resulted in
Table 1:
Table 1.
Directory of Open Access Journals (DOAJ) journals and publication charges May 2014.
Table 1.
Directory of Open Access Journals (DOAJ) journals and publication charges May 2014.
| Publication Charges Information | Number of Journals | Percentage of Journals |
|---|
| No charges | 6470 | 67% |
| Has charges | 2567 | 26% |
| Conditional charges | 520 | 5% |
| No information available | 145 | 1% |
| Total | 9702 * | |
The 1584 journals used to develop the sample were drawn from the 2567 or 26% of journals listed in DOAJ that have charges. For 152 journals the title was not found on the publisher’s website. This is a large percentage of the total (about 10%), but likely is an anomaly based on Hindawi’s recent collapse of a large ISRN series into a single journal. Titles not found were eliminated from the sample, leaving a total of 1432 journals sampled.
Publishers’ own lists of their journals using OA APCs and the DOAJ list for that publisher often did not closely match. For example, Hindawi’s own list of journals included 125 titles not included in DOAJ. This may be due to delay in adding new journals to DOAJ due to technical work at DOAJ and/or the DOAJ inclusion criteria (for example, DOAJ only includes journals after they have published some issues and only retains journals if they continue to publish above a minimum volume).
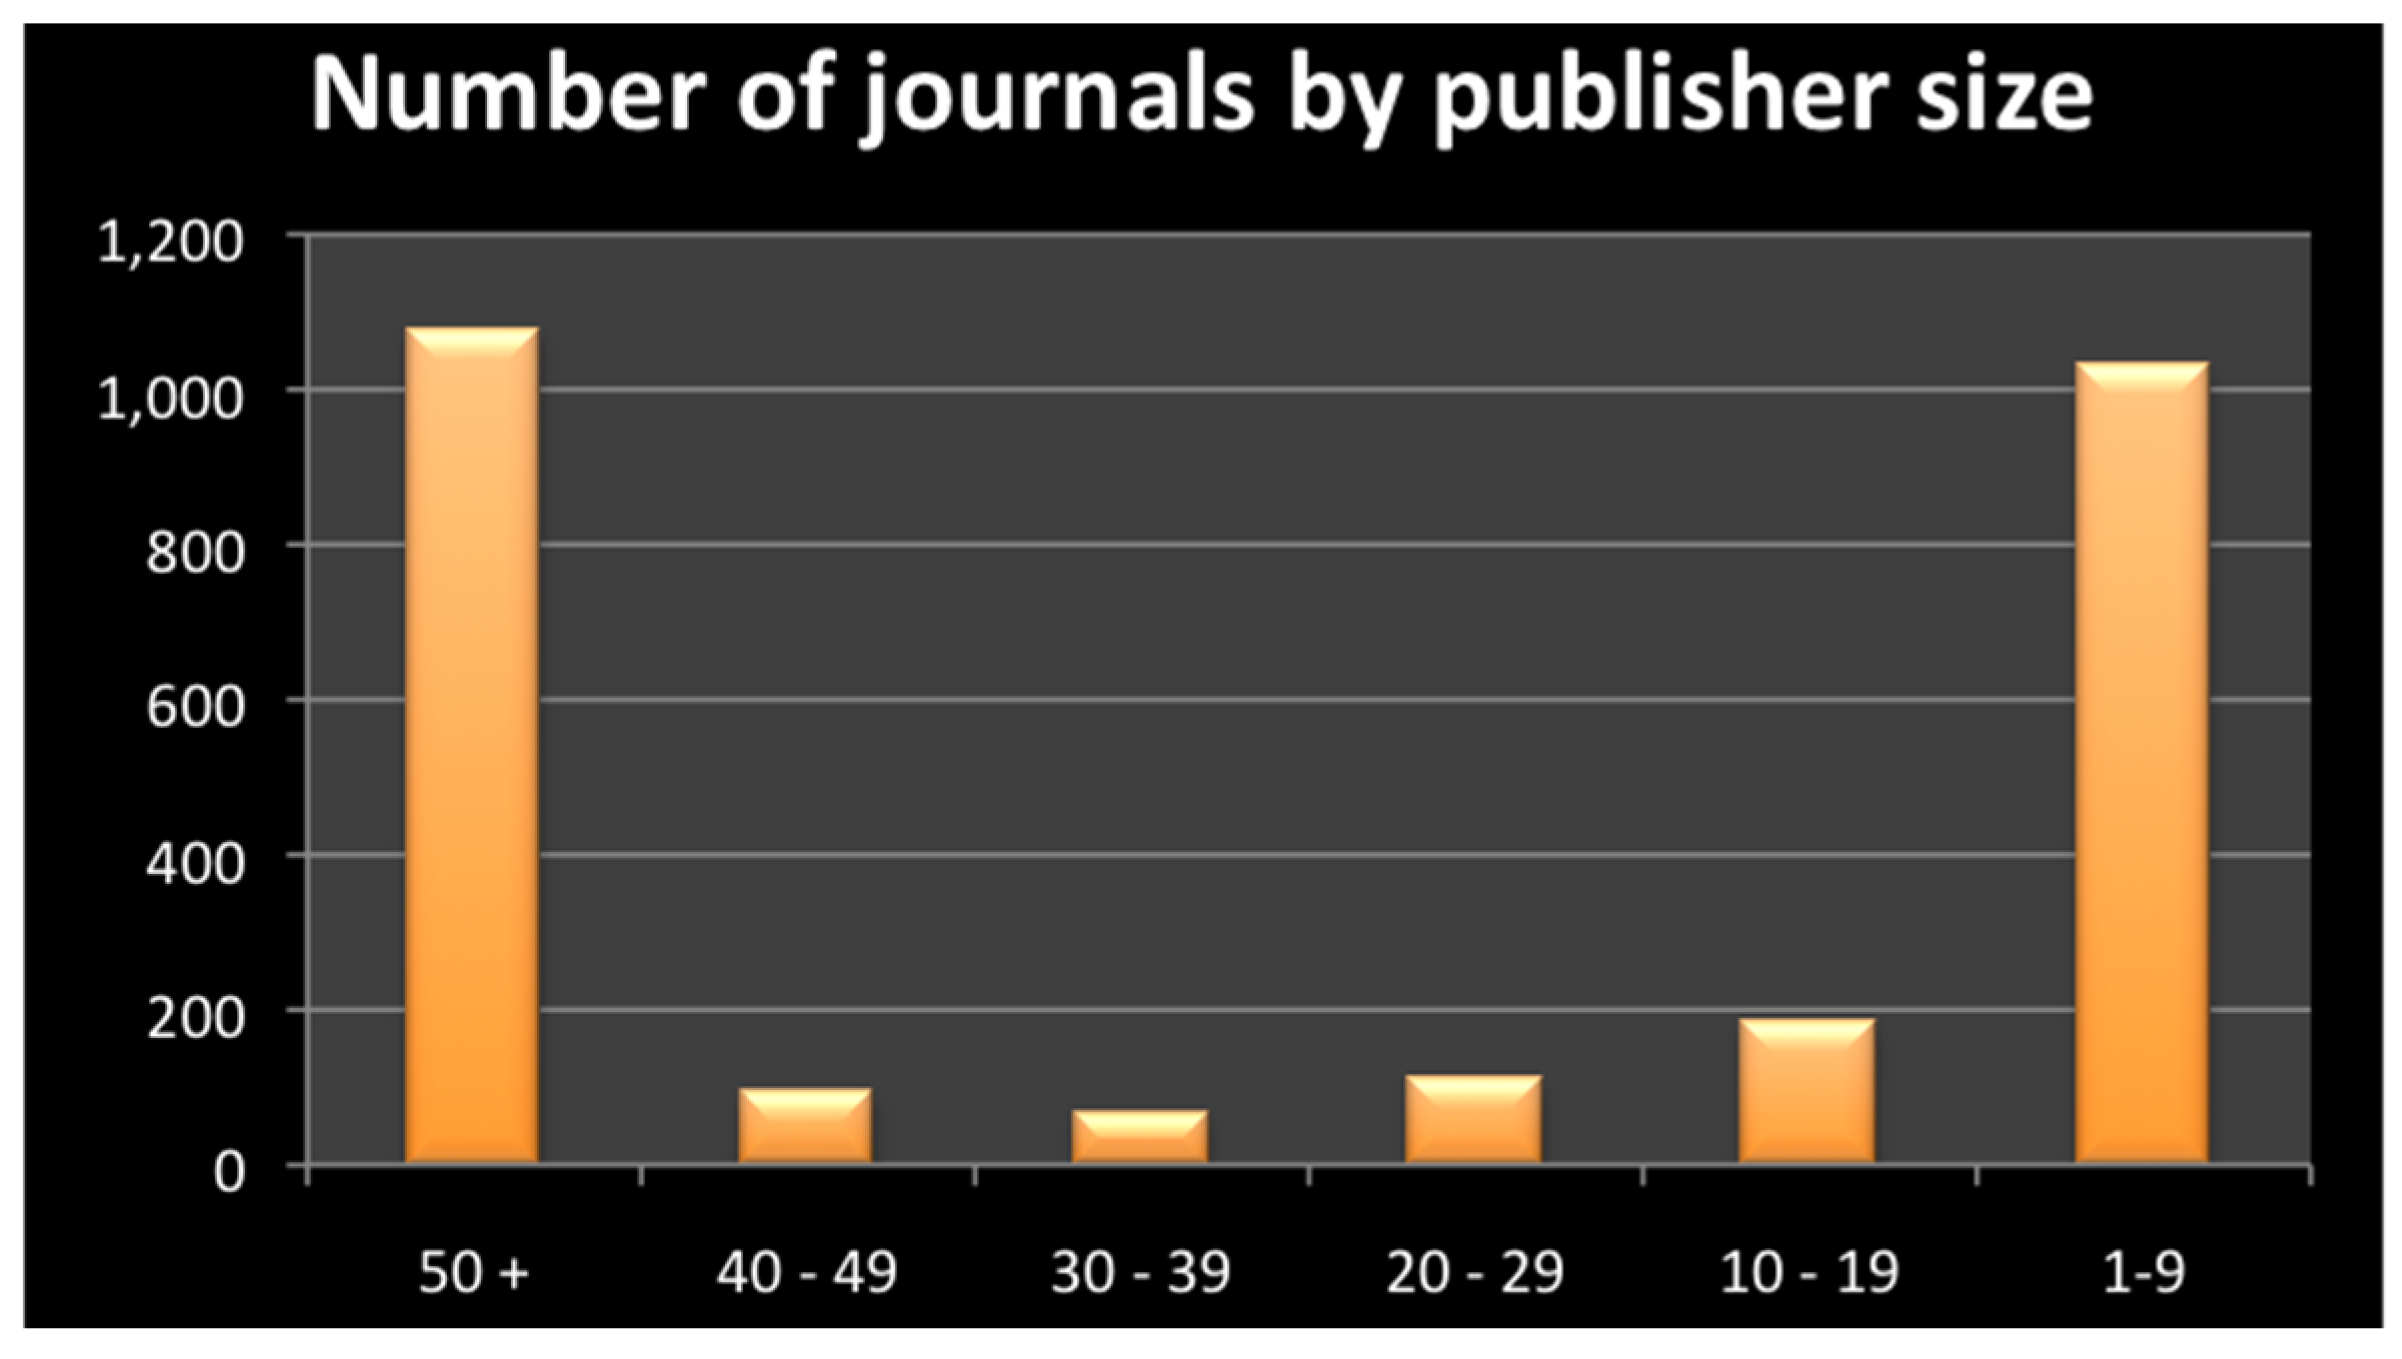
3.1. Publisher APC Journal Size
Of the 1432 journals sampled, most (80%) are published either by publishers that publish 50 or more journals that use APCs, or 1–9 journals that use APCs, with not much in the middle (
Figure 1).
Figure 1.
Article processing charge (APC) journals in DOAJ by publisher size.
Figure 1.
Article processing charge (APC) journals in DOAJ by publisher size.
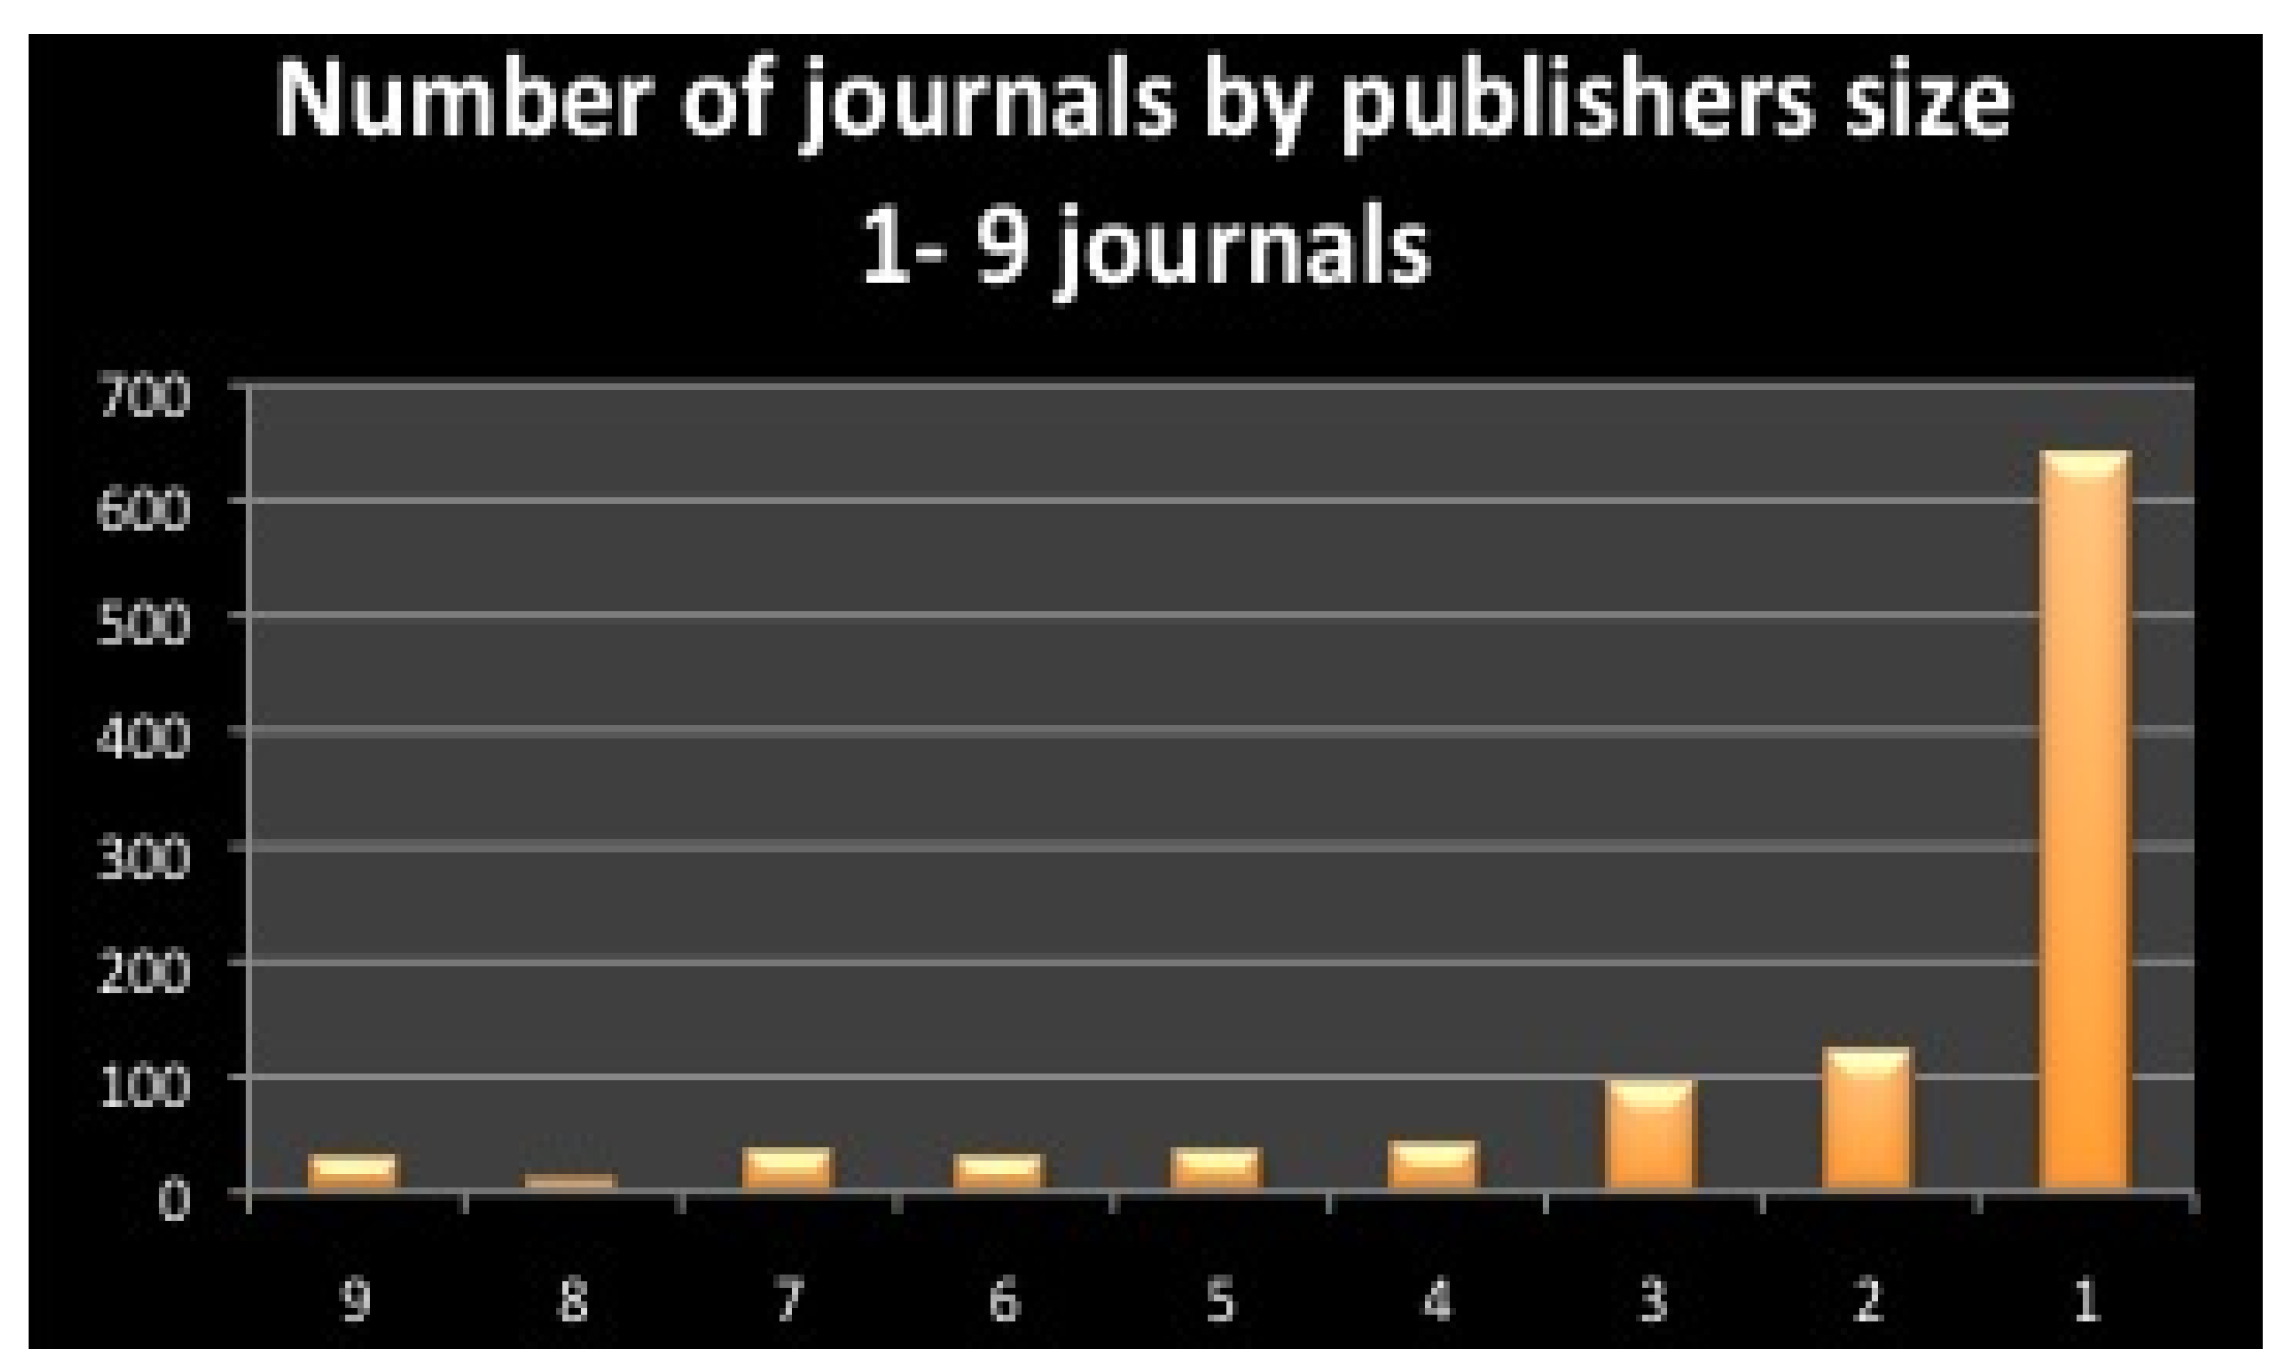
Of the publishers with 1–9 journals using APCs, by far the largest category of this group (83%) are one-off journals,
i.e., the publisher has only one journal using APCs. This is a skewed distribution (
Figure 2).
Figure 2.
APC journals in DOAJ by publisher size (1–9 journals).
Figure 2.
APC journals in DOAJ by publisher size (1–9 journals).
3.2. Publisher Type
Journals were categorized by publisher type based on information found at the publisher website. A publisher was considered commercial if language at the publisher site clearly indicated a for-profit commercial organization such as a corporation or registered company. Similarly, a publisher was considered university, society, government, or not-for-profit if the publisher website indicated this as the publishing body. In some cases journals were clearly produced by partnerships (e.g., university/society). The mixed types are likely underestimated as no attempt was made to identify any society partnerships of clearly commercial publishers; such partnerships are a common practice in traditional scholarly publishing. There are several categories of unknown or unidentifiable publisher types, including unknown, .com (presumably but not clearly commercial) and .org (presumably but not clearly not-for-profit). The following table (
Table 2) illustrates the distribution of publisher types.
Table 2.
Publishers by type.
Table 2.
Publishers by type.
| Publishers by Type | Number | Adjusted for Sampling Factor | Percentage of Total by Sampling Factor |
|---|
| commercial | 1246 | 1567 | 61% |
| university | 36 | 276 | 11% |
| unknown | 31 | 197 | 8% |
| .com | 45 | 185 | 7% |
| society | 13 | 110 | 4% |
| .org | 22 | 106 | 4% |
| not-for-profit | 27 | 52 | 2% |
| university/society | 5 | 37 | 1% |
| university/commercial | 2 | 16 | 1% |
| government | 2 | 11 | 0% |
| government/society | 1 | 10 | 0% |
| .org/university | 2 | 6 | 0% |
| Total | 1432 | 2573 * | 100% ** |
3.3. Article vs. Page Processing Charges
Two models were identified: article-based processing charges (one charge per article) and page processing charges. In some cases it was clear that the publisher used APCs but the exact amount was not specified. In some cases the research team could not find a cost or any language indicating that the publisher actually uses the APC method. In some cases it was very clear that the journal does not charge an APC; some of these instances could reflect errors in data entry in DOAJ, however in at least one case the journal had recently dropped the APC. The following tables (
Table 3) illustrate the breakdown in journals charging APCs, where no confirmation of APCs could be found, and journals using a page processing charge method (APPC). The latter is worthy of further examination, as some journals publish in both print and online edition; it is possible that print-based page charges have been conflated with OA APCs.
Table 3.
Article versus page processing charges.
Table 3.
Article versus page processing charges.
| Article and Page Processing Charges | Number | Adjusted for Sampling Factor | % |
|---|
| APC | 1326 | 2085 | |
| APC (not specified) | 20 | 47 | |
| Subtotal APC confirmed | 1346 | 2132 | 83% |
| APPC | 39 | 149 | 6% |
| No cost found | 38 | 275 | |
| No publication fees | 8 | 17 | |
| Now free | 1 | 7 | |
| Subtotal no APC or APPC (no cost found, no publication fees, now free) | 47 | 299 | 12% |
| Total | 1432 | 2580 * | 101% ** |
3.4. Article Processing Charges—Amounts
The range of article processing charges was from $0 to $4114 USD (
Table 4). The mode, or most common amount, was $0. This $0 factor reflects journals that use the article processing fee approach, but where publishing was free at the time the sample was collected. For example, Hindawi provides free publishing in their journals on a rotating basis. The differences between the mean, median, and mode are large indicating a sample with a large variation.
Table 4.
Article processing charges in USD: range and measures of average.
Table 4.
Article processing charges in USD: range and measures of average.
| Article Processing Charges in USD | |
|---|
| | with $0s | $0s Removed |
|---|
| Lowest | $0 | $1 |
| Highest | $4,114 | $4,114 |
| Average (mean) | $964 | $1,221 |
| Median | $800 | $1,145 |
| Mode | $0 | $800 |
| Standard deviation | $864 | $795 |
Of the 1326 journals with an amount specified for an APC, 279 or 21% had an amount of $0. If this seems unusual, as a reminder, this sample was drawn from journals identified in DOAJ as having an APC. Hindawi’s practice of rotating free publishing for their journals (as confirmed in an e-mail from Hindawi’s Paul Peters [
15]) is one of the reasons for the size of this factor. In other cases, publishers (e.g., MDPI’s journal
Publications) indicate that publication is free of charge for the first issue or few issues. It is useful to consider the amounts with these journals removed, as in many cases this will reflect a temporary free offer, e.g., free publishing in relatively new or small journals where the publisher intends to charge once the journal is successful. Removing these 279 journals results in a total of 1047 journals with an APC specified in an amount greater than $1. The following table shows key indicators for APCs with the $0 APCs removed. This table shows just as much variation (the $1 charge reflects a combination of a very low charge and conversion from Indonesian rupees to the US dollar). The average and median are still noticeably higher than the mode, indicated a skewed distribution.
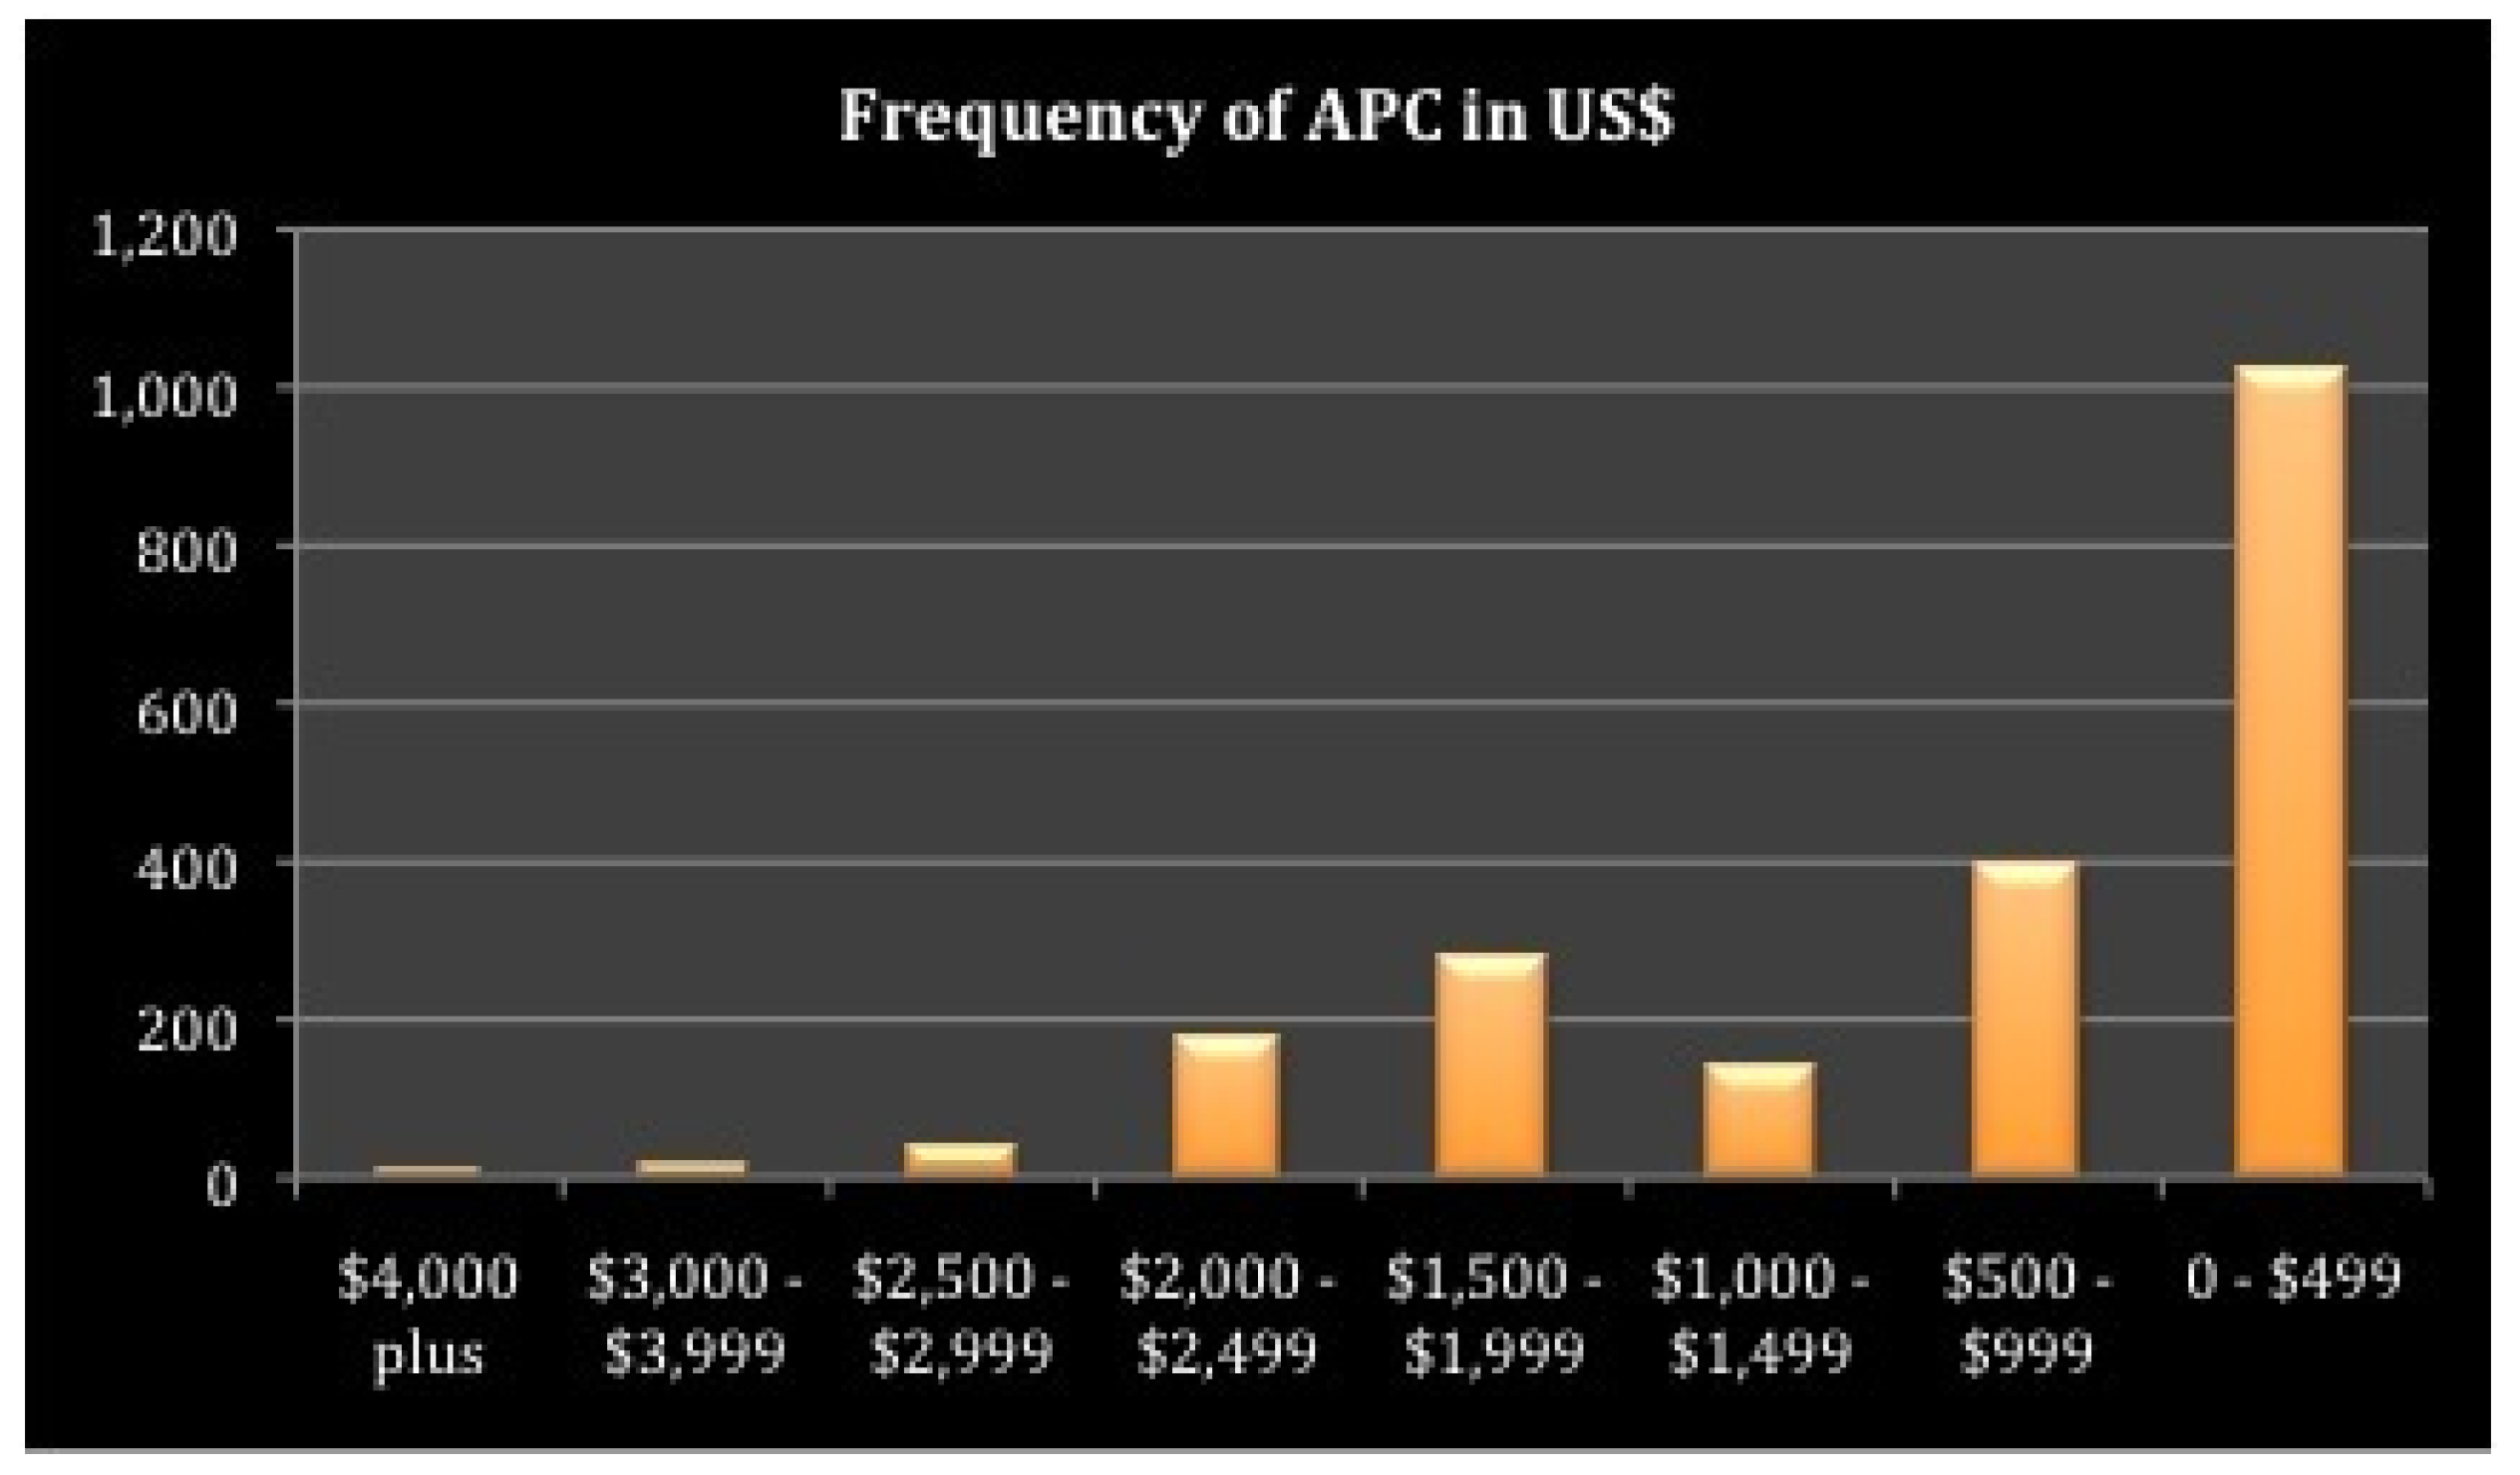
The following
Figure 3 illustrates the APCs by size range and frequency. Only one journal sampled had an APC of over $4000; only 6 had APCs of $3000 or higher, in contrast with 534 journals charging less than $500. This is another illustration of the skew in the distribution; the numbers are scattered over a wide size of ranges rather than being clustered in the middle.
Figure 3.
Frequency of OA APC by price range.
Figure 3.
Frequency of OA APC by price range.
APCs by Publisher Type
The following table illustrates the APC details by publisher with over 20 titles by publisher type, organized left to right by APC amount (lowest to highest). The lowest average prices are shown for .com, university, and unknown publisher types, while the highest average APCs are associated with the society and not-for-profit publishers. The total number of journals published by the latter included in this sample is small.
This table (
Table 5) illustrates a wide range in APC amounts for every publisher type. It should be noted that some categories have very small samples (e.g., society, not-for-profit), which means there is a high probability that the average is skewed. For example, PLOS journals make up almost all of the not-for-profit group, and the one very high priced society journal has a strong impact on the average in such a small sample.
Table 5.
APC by publisher type.
Table 5.
APC by publisher type.
| APC > $0 Details (in USD) | | | | | | APC by Publisher Type/Adjusted by Sampling Factor |
|---|
| | Overall | .com | Unknown | University | .org | University/Society | Commercial | Not-for-Profit | Society |
|---|
| Total # of journals by type | 1047 | 31 | 25 | 9 | 20 | 3 | 944 | 8 | 7 |
| Lowest | $1 | $120 | $17 | $1 | $100 | $261 | $40 | $85 | $20 |
| Highest | $1414 | $1168 | $1378 | $1100 | $1920 | $1371 | $3300 | $2900 | $4414 |
| Average (mean) | $1221 | $206 | $368 | $299 | $399 | $744 | $1295 | $2029 | $1562 |
| Average (mean) adjusted for sampling factor | $937 | $181 | $242 | $313 | $492 | $678 | $1150 | $1122 | $1568 |
| Median | $1145 | $195 | $500 | $250 | $200 | $600 | $1220 | $2250 | $1350 |
| Mode | $800 | $195 | $500 | n/a | $200 | n/a | $800 | $2250 | n/a |
The following table (
Table 6) illustrates the key finding, namely that 90% of journals charging APCs offer some variation on pricing (
Table 7).
Table 6.
Percentage of journals offering variations in pricing.
Table 6.
Percentage of journals offering variations in pricing.
| Variations | # of Journals | % of Journals |
|---|
| Yes | 1238 | 90% |
| No | 99 | 7% |
| Not mentioned | 36 | 3% |
| Total | 1373 | 100% |
3.5. Variations in Article Processing Charges
Variations in APCs ranging from discounts to extra charges for optional services were explored for each of the journals and publishers. The sample for variations was drawn from the 1432 journals considered to be using the APC approach. Journals for which no APC was specified, no cost was found or there was no publication fee were omitted from this sample, resulting in a total of 1373 journals (
Table 6). For each of these journals, an assessment was made as to whether variations were present, with the response choices being Y (yes), N (no), or NM (not mentioned). N was chosen only where sufficient detail was provided about the article processing charge that it seemed appropriate to assess that variations were not an option.
4. Discussion
The methodological challenges to conducting this study and the results suggest that the open access article processing fee approach is a model in an early and still highly volatile phase. At the time of the census, DOAJ had removed the information in the downloadable metadata file pertaining to OA APCs, as this information was known to DOAJ to be in need of updating. Of the 2567 found to “have charges” according to a DOAJ screen scrape, 1584 titles were sampled. Of these, 152 titles were not found on the publisher websites, 10% of the total (likely an anomaly due to Hindawi collapsing a suite of journals into one title). Of the remaining 1432 titles sampled, in 38 cases we were not able to confirm that the publisher was using APCs (no cost found), in eight cases there were clearly no publication fees, in one instance the journal website indicated that the APC had been recently dropped, and in 39 cases the model was per-page rather than per-article. This leaves a total of 1346 journals with APCs, of which 20 did not specify the amount. Weighting the total 1346 to account for sampling gives an approximate total of 2132 of the 2567 journals that “have charges” in DOAJ for which the APC model could be verified as of 15 May 2014, or 83% of the total. Of the 1326 journals with an amount specified for an APC, 279 or 21% had an amount of $0, leaving a total of 1047 journals with an APC with an amount specified over $0.
When information on the titles listed in DOAJ was sought on the publisher’s website, the number and names of titles listed in DOAJ as having an APC and the number on the publishers’ websites frequently varied and sometimes by a large percentage. For example, of the 444 titles listed under Hindawi with APCs as per DOAJ data, 135 titles were not found on the Hindawi website (a substantial portion of the 152 titles not found), while 125 titles with APCs listed on the Hindawi website were not listed in DOAJ. The difference in names and numbers of titles between publisher websites and DOAJ could be due to delays in inclusion in DOAJ due to technical work at DOAJ, or the effect of DOAJ inclusion criteria, which requires (for example) publication of a minimum number of articles.
The finding that most journals are published either by publishers with many journals using OA APCs (50 journals plus) or very few journals (1–9 with one-off journals being the largest single category by far) supports the distribution found by Frantsvåg in 2010 [
16]. Frantsvåg considered the large number of small publishers as a problem. Edgar and Willinsky [
12] suggested this could be perceived as an indication of a renaissance of scholar-led publishing. This distribution also fits the pattern for scholarly journal publishers overall described by Crow [
17]. This is very similar to the findings of Thompson ([
18], p. 63], who found through a major study of scholarly monograph publishers in several English-speaking countries, a tendency towards concentration and larger publishers combined with a healthy system of very small publishers, but not much in the middle. This has important implications for the long-term sustainability of a healthy scholarly publishing ecosystem, if the landscape is dominated by the very large and very small players, with not much in between.
The lack of mid-sized publishers is a trend that may be worth keeping an eye on, as this may suggest market forces that make it difficult for publishers to survive at the middle level. In future, this could lead to a consolidated open access journal market not unlike today’s consolidated serials subscriptions market which features a very small number of very large publishers that publish a disproportionate share of the world’s scholarly journals.
The largest group of publishers using APCs, by far, were clearly commercial in nature, a total of 1246 journals, or approximately 1567 (61% of the total) after adjusting for sampling. The second largest group was universities, with 36 titles or about 276 after adjusting for sampling factor, about 11% of the total. Other categories of publisher types may be too small to draw any conclusions. It is important to note that the categories of mixed publisher types such as commercial/society partnerships is likely understated as commercial publishers’ title lists were not examined in detail to identify these mixed types.
Two basic models were identified: per-article fees and per-page fees. Thirty nine of the journals sampled (approximately 149 after adjusting for sampling factor) had page charges but no article-level charge. Some of the journals sampled publish in both print and electronic versions; it is possible that some of these charges refer to traditional print-based page charges rather than open access publication charges. For example, some journals refer to colour printing costs.
The article processing amounts per se also suggest a business sector in a very volatile state. Prices ranged from $0 to $4114 USD; even with the zero factor removed the price range was $1 to $4114. The mean, median and mode were quite different. With the zero APCs, the mean was $964, median $800 and mode $0. With the $0 APCs removed, the mean was $1221, median $1145 and the mode $800. This is a skewed distribution. When the mean or average is higher than both the median and the mode, this suggests that the average is skewed by a small number of relatively high APCs. This makes it very difficult to suggest that there is, at the present time, an effective average APC usable for budgeting purposes. The analysis of APC by publisher types shows a wide range and noticeable differences in mean, median and mode for every publisher type.
The average (mean) APC of $964 USD is only slightly higher than the average of $906 USD found by Solomon and Björk in 2010 [
9], a cumulative increase of 6% over four years. The range of $1 to $4414 is also very similar to the $8–$3900 USD range found in this study by Solomon and Björk. It should be noted however that the sampling techniques were different. Solomon and Björk included journals from single journal publishers based on number of articles published while this was not a factor considered in this study. This average is quite a bit less than the $1,418 USD reported by Björk and Solomon in 2014 [
10], however Björk and Solomon’s 2014 $1418 USD was based on a very different sample, namely that of established open access publishers listed in Scopus.
The average of $964 is quite a bit lower than the average APC for hybrid subscription/open access journals of $2727 USD reported by Outsell in 2013 [
19]. Outsell estimated the average APC at $660 in 2011 and predicted an increase to roughly $950 in 2015, “due in part to the increased number of well-branded journal publishers offering OA options at higher price points”.
The highest costs by publisher type were for society and not-for-profit publishers, with commercial publishers not far behind. However, the small numbers of publisher types outside of the commercial sector suggests caution in making too much of this.
Variations in Pricing
Most of the journals sampled that actually have APCs (1238 journals or 90% of the total of 1373) have variations in pricing (
Table 7). Only 7% of journals have no indication whatsoever of variations in pricing.
Table 7.
Frequency of sub-types of variations.
Table 7.
Frequency of sub-types of variations.
| Variations Sub-Types | | |
|---|
| Number and Percentage of 1238 Journals with Variations Indicating Particular Sub-Type | # of Journals | Percentage of Journals |
|---|
| Discounts based on (presumed) ability to pay | | |
| Waivers/discounts for low/medium income countries | 990 | 80% |
| Waivers/discounts based on income | 602 | 49% |
| Discounts for Students | 1 | 0% |
| Waivers/discounts based on Institutional Memberships | 867 | 70% |
| Discounts based on work involved | | |
| Waivers/discounts based on contributions of work to journal (editing/reviewing) | 310 | 25% |
| Discounts for high quality | 1 | 0% |
| Discounts for manuscript/review transfer | 5 | 0% |
| Other pricing variations except extra charges | | |
| Differential pricing by article type | 481 | 39% |
| Waivers/discounts based on individual membership in society or association | 24 | 2% |
| Differential pricing for local authors | 8 | 1% |
| Temporary discounts | 5 | 0% |
| Using publisher‘s template | 13 | 1% |
| Differential pricing by format Latex/Word/PDF | 15 | 1% |
| Extra charges | | |
| Language editing | 122 | 10% |
| Extra charge based on number of pages | 13 | 1% |
| Premium price for fast track | 19 | 2% |
| Extra charge for repository deposit | 3 | 0% |
| Extra charge for CC-BY (or varies by license type) | 3 | 0% |
| APC only if there is no author fund | 3 | 0% |
| Submission fee | 3 | 0% |
Several sub-types of variations were identified. With respect to variations, the qualitative information about the choices of different publishers may be just as important, or even more important, than the quantitative information about the number of journals using a particular variation. That is, a variation that could increase efficiency in publishing or enhance the sustainability of journals or their publishers may be worth considering even if only one, or a small number of journals, currently uses this particular approach.
Some of the patterns for pricing variation found were similar to those identified by Björk and Solomon [
20], although Björk and Solomon characterize these variations differently. For example, their society membership variation is included with an author dependent category while this study differentiates between discounts that appear to be based on ability to pay and the society membership that is likely intended to support the ongoing health of the society per se.
Björk and Solomon [
20] reported a range of 8%–11% multi-tier country pricing based on size of publisher, a much lower figure than the 80% of journals found in this study to provide waivers or discounts for authors from low to medium income countries.
Björk and Solomon’s range of 4%–28% for institutional membership was much lower than our 70% range.
The analysis of variations in publication practices in the present study is more inclusive than that of Björk and Solomon. For example, this study includes such elements as contributions to the work (editing and/or reviewing) and efficiencies in publishing (such as language editing, quality discounts, and discounts based on format). These experiments in variations in pricing would be interesting to study in their own right as indications of potential efficiencies in publishing that would appear to have potential to lower the work requirements (and hence cost) of publishing.
It is not clear whether the differences in variations in pricing between this study and that of Björk and Solomon reflect changes in the marketplace (e.g., increasing tendency to offer discounts for authors from low and middle income countries) or differences in sampling.
5. Limitations
The DOAJ criteria for inclusion restrict the sample. Hybrid journals that include both free and subscription content are not included; for example, Genome Biology and Genome Medicine, two well-established journals generally considered to be OA journals, using OA APCs published by BioMedCentral are not listed in DOAJ because only research articles in these journals are open access, while other content is available only through subscription. This sample of fully open access journals will be useful for comparison purposes with other samples of open access journals including hybrids that are likely to have different economic dynamics due to the subscriptions revenue and are likely to have other differing tendencies as well. For example, many traditional journals that rely primarily on subscriptions are experimenting with hybrid open access, a very different scenario than journals relying primarily or exclusively on OA APCs.
DOAJ also does not include large numbers of fully open access journals as illustrated by the differences between the DOAJ list for a number of publishers and the publishers’ own lists. This may reflect a large number of new open access journals not yet included in DOAJ.
6. Further Research
The data from this research is intended to form the basis of backwards and forwards longitudinal studies to examine trends in article processing charges. For example, the current plan is to conduct another census of DOAJ journals charging APCs in May 2015, which will permit analysis of trends in pricing and variations, both overall and by individual publishers.
The data will also be used to explore factors in OA article processing fee approaches and pricing using inferential statistical methods such as multiple regression analysis. Analyses will be conducted based on the full set of DOAJ metadata as of May 2014 (e.g., including country of publication, subject headings, licensing information), additional information in the sample per se such as publisher type and qualitative information, and additional data such as journal impact factor and similar metrics and number of articles published. It is important to clarify that the present research is envisaged as part of a suite of research projects rather than a single analysis.
The skewed distribution of publishers by OA APC title size may be worthy of examination as an indication of a potential future problem with market concentration in the OA APC market, similar to market concentration in subscriptions journals as described by Crow (2006).
7. Conclusions
This study found the article processing approach to funding open access to be a business sector very much in a volatile state likely reflecting its relatively early development. This would make it difficult to predict APCs for budgeting purposes for libraries, authors and research funders. Academic libraries (and the universities to which they report) operate on fixed annual operating budgets and find it difficult to budget in advance for changing amounts. For example, at the authors’ institution, the University of Ottawa, the success of the local authors’ fund managed by the library in the current fiscal year (May to April) resulted in the fund being exhausted by September and temporary stoppage of acceptance of applications for funds. The volatility of OA APCs contrasts with the current trend towards multi-year negotiations for subscriptions to journal Big Deals by libraries and library consortia. Authors wishing to take advantage of research funding for article processing fees may need to specify amounts at the time of application for funding which may be years before the publication date. Research funders wishing to support open access article processing fees, like universities, tend to operate with fixed annual budgets and limited flexibility to accommodate pricing fluctuations.
Finding an authoritative list of journals charging article processing fees is a challenge, illustrated by the finding that 10% of the titles in the original sample from DOAJ were not found on the publisher’s website and noticeable numbers of titles from publisher websites were not included in DOAJ. The average of $964 USD per title obscures the high variability of pricing reflected in the overall mode (most common amount) of $0, that is, free publishing for today provided by publishers obviously committed to the APC approach. The high percentage of commercial publishers using APCs is perhaps not surprising given that this sector would not have the same choices available to other types of publishers (e.g., it is highly unlikely that commercial publishers would have access to subsidy funding). Most publishers and journals sampled offered variations on pricing, ranging from discounts based on income, quality or contributions to the work of the journal, institutional memberships, or extra charges for extra services. Some of the experiments currently underway suggest approaches to more efficient and effective publishing, such as guiding authors to submit works in formats and using templates that simplify the work of the publisher, which may have the potential to lower the cost of publishing. Some of these experiments may also save the time of busy editors and reviewers. For example, consider the inefficiencies involved in having articles that need English editing go through several stages of editing and review before the language editing. Would it not be a better use of everyone’s time to provide authors with the help that they need in this area before they even submit their work?
Given the volatility of this sector and the potential to find better and most cost-effective ways of publishing, budgeting and support for this sector should probably be considered as tentative and somewhat experimental for the short term.


