Article

Nanostructure and Luminescent Properties of Bimetallic Lanthanide Eu/Gd, Tb/Gd and Eu/Tb Coordination Polymers

1
Institute of Materials Research, Slovak Academy of Sciences, Watsonova 47, 040 01 Kosice, Slovakia
2
Universidade de Franca, Science &Technology, Av. Armando Salles Oliveira 201, Franca 14404-600, Brazil
3
Institute of Catalysis, Bulgarian Academy of Sciences, Acad. G. Bonchev St., BU-1113 Sofia, Bulgaria
*
Author to whom correspondence should be addressed.
Inorganics 2021, 9(10), 77; https://doi.org/10.3390/inorganics9100077
Submission received: 6 September 2021 / Revised: 12 October 2021 / Accepted: 13 October 2021 / Published: 15 October 2021

Abstract

:
This study presents the synthesis, structural and luminescence properties for lanthanide metal–organic frameworks (LnMOFs), which belong to the sub-class of coordination polymers. The series of nanosized LnMOFs (Ln = Eu, Gd, Tb, Eu0.5Gd0.5, Tb0.5Gd0.5 and Eu0.5Tb0.5) was prepared by solvothermal synthesis using a modulator (sodium acetate). We investigated the various surface chemistry compositions of the isostructural LnMOFs with a [Ln(btc)] structure (BTC: Benzene-1,3,5-tricarboxylate) by X-ray photoelectron spectroscopy (XPS). The XPS confirmed the mixed-valent Eu3+ and Eu2+ compounds, and the presence of Tb in both +3 and +4 valence states, and one +3 valency of Gd. A nanostructure of mixed LnMOFs (EuGd, TbGd and EuTb) with a rod-like shape is related to luminescence properties. The MOFs (EuTb and EuGd) presented Comission Internationale de l’Éclairage (CIE) chromaticities of x = 0.666 and y = 0.331, and x = 0.654 and y = 0.348, respectively, in the red region. They were better than the values desired for use in commercial phosphors, which are x = 0.64 and y = 0.35. For [Tb/Gd(btc)], the CIE coordinates were x = 0.334 and y = 0.562, presenting emissions in the green region. Bimetallic LnMOFs are very promising UV light sensors for biological applications.

Graphical Abstract

1. Introduction

Coordination polymers (CPs) are constructed of metal ions and bridging ligands that combine them into solid-state structures extending in one (1D), two (2D), or three dimensions (3D). Two- and three-dimensional CPs with potential voids are often designated as metal–organic frameworks (MOFs) [1,2,3,4,5]. MOFs are a well-recognized sort of attractive blended materials built from varied metal centers and multidentate organic ligands via coordination bonds [6]. MOFs are a remarkable type of porous materials because of their potential in many uses, such as gas absorption, molecular segregation, storage, optics and catalysts [7,8]. Lanthanide metal–organic frames (LnMOF) are recognized as specific types due to their special coordination characteristics and excellent optical properties resulting from 4f electrons [9]. LnMOFs are well known for their great Stokes’ shifts, high color purity, and rather prolonged luminescence lifetimes outgoing from f-f transitions trough the “antenna effect” [9,10]. LnMOFs display sharp and intense luminescence, emissions in the primal color scale (red, green and blue) that entirely cover the whole visible spectrum and therefore can be well combined for the design of white-light emitting materials [11]. Luminescent LnMOFs are now of great benefit and significance due their technical importance as sensors [6]. Trivalent lanthanides (Ln3+) are an ideal selection, as the inorganic metal cation in the construction of nano-MOFs and Ln centers allows for multimodal imaging [12]. The trivalent ions of europium and terbium radiate intensive red and green light, respectively, while the Gd3+ complex emits in the blue zone due to its high lowest level of emitting [10,13]. As a result, varied lanthanide complexes (Gd3+, Tb3+ and Eu3+) possess eventual applications in the creation of white-light emission [10].
Lanthanide MOFs built using coordination bonds among Ln ions and organic ligands are hopeful materials due to their porous crystalline structures, rich mixtures and simple preparation [14,15]. The set of LnMOFs [Ln(btc)] was prepared by solvothermal synthesis via classical H3BTC, and was used for the luminescence sensing of benzene homologue solutions [16]. [Eu(btc)] and [Tb(btc)] show acute and stark emissions in the visible light range. [Eu(btc)] was prepared by solvothermal synthesis using N, N-dimethylformamide (DMF) as the solvent, with modulator sodium acetate (NaOAc) [6,16,17]. In an effort to optimize the preparation requirements, the luminescent properties of [Eu(btc)(H2O)(dmf)] with different morphologies, which show similar red light emissions and different intensities of short ultraviolet radiation, were investigated [6]. Ren et al. [18] studied the influence of the MOF size as sensors, and prepared bulk TbMOF and distinct sizes of nano-TbMOFs by the ultrasound-supported method via NaOH as a modulating agent, and demonstrated that these [Tb(btc)] have the same structure. Bimetallic MOF has two luminescence centers into this network, similarly to [Eu/Tb/(btc)] [17], [Eu/Gd(btc)] and [Tb/Gd(btc)] [10,12]. The [Eu/Tb/(btc)] emission color is orange–red [17] and Eu/GdMOF results in strong red emissions [19]. The [Ln(btc)] sets were built with trivalent lanthanide (Ce3+, Y3+, or a combination thereof) [8]. Heterometallic Eu/Tb-MOF exhibits luminescence, and was obtained by solvothermal synthesis with various ligands, such as 2-phenylsuccinate (psa) [20], 4,4′-oxybis(benzoate) acid (H2OBA) [21], furan-2,5-dicarboxylic acid (H2FDA) [22] and 1,3-bis (3,5-dicarboxyphenyl) imidazolium chloride (H4L+Cl) [23]. A series of hybrid LnMOFs as [EuxGd1-x(ndc)] (x = 0.0005 − 0.01; H2NDC = 1,4-naphthalene dicarboxylic acid) using aback power transmission were fabricated for the physiologic sensing of the temperature [24].
The aim of the work was to characterize the chemical content, binding structures and morphologies on the surface of the LnMOF series (Ln = Eu, Gd, Tb) and mixed (Ln = Eu0.5Gd0.5, Tb0.5Gd0.5 and Eu0.5Tb0.5) prepared by solvothermal synthesis using DMF/H2O solution and adding sodium acetate as modulator. Moreover, the effect of mixed different bimetallic lanthanides in [Ln(btc)(dmf)(H2O)] nanostructures on the surface chemistry composition was studied. The novelty of this research is the TEM characterization of different nanostructures of bimetallic LnMOFs. The luminescence property of fabricated bimetallic LnMOFs were explored. Luminescence spectra presented high excitation bands and intense emissions. The resulting luminescent LnMOFs can be applied in the production of various optical equipment.

2. Materials and Methods

2.1. Materials and Chemicals

All of the chemical agents and dissolvents were purchased from Sigma-Aldrich at analytical grade and applied without another purgation. Europium(III) nitrate hydrate Eu(NO3)3·5H2O, gadolinium(III) nitrate hydrate Gd(NO3)3·6H2O, terbium(III) nitrate hydrate Tb(NO3)3·6H2O, N,N-dimethylformamide (DMF), 1,3,5-benzenetricarboxylic acid (BTC), sodium acetate (NaOAc) and deionized water were availed to the solvothermal synthesis.

2.2. Preparation of the LnMOFs

The LnMOFs were prepared via modified solvothermal synthesis [6,16,17] pursuant to the previous work [25]. Lanthanide(III) nitrate hydrate Ln(NO3)3·xH2O (1.0 mmol) and H3BTC (0.21 g, 1.0 mmol) were dissolved in a 30 mL mixture of DMF/H2O (1:1v/v) solvents (Ln = Eu, Gd, Tb) together with the modulator NaOAc (0.3 mmol). The preparation procedures for the Eu, Gd and Tb lanthanide MOFs were the same, and were performed using different starting nitrates using Eu(NO3)3. 5H2O (0.443 g), Gd(NO3)3. 6H2O (0.448 g) and Tb(NO3)3. 5H2O (0.449 g). The ratio of Ln:TBC was 0.36. The three solutions of [Eu(btc)] (Eu-1), [Gd(btc)] (Gd-2) and [Tb(btc)] (Tb-3) were mixed at 25 °C for 1 h and heated at 60 °C for 48 h, and then cooled to room temperature to give white (Eu-1 and Gd-2) and colorless (Tb-3) crystals. After the synthesis, the products were isolated by centrifugation and washed several times with ethanol and water, respectively, and then dried in air. The prepared Eu-1, Gd-2 and Tb-3 resulted in a yield of 66% (0.319 g), 69% (0.270 g) and 70% (0.339 g), respectively, without elemental analysis. The preparation of the mixed bimetallic [Eu0.5Gd0.5(btc)] (EuGd-4), [Tb0.5Gd0.5(btc)] (TbGd-5) and Eu0.5Tb0.5(btc)] (EuTb-6) was the same as that for simple [Ln(btc)], only the pure Ln nitrate was exchanged via a mixture of two corresponding nitrates. For the preparation of the EuGd-4 powder, the nitrate of Eu (0.223 g, 0.5 mmol) and Gd (0.224 g, 0.5 mmol) with BTC (0.21 g, 1.0 mmol) and NaOAc (0.03 g, 0.3 mmol) was dissolved in 30 mL DMF/H2O. For TbGd-5 or EuTb-6 syntheses were used Tb(NO3)3·6H2O (0.225 g, 0.5 mmol) separately. The bimetallic LnMOF powders were formed after heating at 60 °C for 48 h. The preparation procedures for the other lanthanide MOFs were analogous. The experimental synthesis of each sample was repeated three times. The syntheses of Tb-3 and TbGd-5 MOFs were performed without the NaOAc modulator for the SEM and TEM analysis.
The comparison with the other methods and procedures for solvothermal synthesis of LnBTC (Ln = Eu0.5/Gd0.5 or Tb0.5/Gd0.5) used the selected lanthanide chloride salts, sodium trifluoroacetate (NaTFA), and BTC in a ~1:0.9:0.6 Ln:TFA:BTC ratio, with the solvents water and DMF [12] and a ball milling preparation of [Eu0.5/Gd0.5(btc)] or [Tb0.5/Gd0.5(btc)] with the H3BTC and the respective lanthanide carbonate hydrates Ln2(CO3)3·xH2O in a 2:1 molar ratio. The other solvothermal syntheses of LnMOFs have been reported with various ligands, such as psa [20], H2OBA [21], H2FDA acid [22], H4L+Cl [23] and NDC [24].

2.3. Characterization of the LnMOFs

The FTIR analysis of the LnMOF compounds was performed using the FTIR spectrometer Shimadzu IRAffinity1 (KBr pellets). The composition and structure of the samples were obtained using an X-ray diffraction (XRD) instrument (X’ Pert Pro, Philips, Amsterdam, Netherlands) via Cu Kα radiation. The surface morphologies were characterized using scanning electron microscopy (SEM) (Auriga Compact, Jena, Carl Zeiss Germany) and high resolution transmission electron microscopy (TEM), (JEOL-JEM 2100F), using a scanning transmission electron microscope (STEM) and energy dispersive X-ray (EDS, Oxford Energy TEM 250) spectroscopy. The additional composition and valence state inquiry were obtained by X-ray photoelectron spectroscopy (XPS). The energy range was scaled using a standardizing C 1s line of acquired hydrocarbons to 285.0 eV for the electrostatical sample. The luminescence spectra were characterized at room temperature, using a continuous Xenon lamp or a flash Xenon lamp in a Horiba Jobin Yvon Fluorolog-3 spectrofluorimeter equipped with a double excitation monochromator and a single emission monochromator. The excitation and emission spectra were obtained at various emission and excitation wavelengths, respectively.

3. Results and Discussion

3.1. Structural Characterization of the LnMOFs

The TG and DSC curves of LnMOFs (Eu-1, Gd-2, Tb-3) prepared by sovothermal synthesis using the modulator (NaOc) are shown in Figure 1. The TG curves are similar, and all of them display a two-step or three-step weight loss [6]. The initial weight loss—starting at around 100 °C and continuing up to 160 °C—observed for all of the samples can be ascribed to the loss of coordinated solvent molecules (DMF and H2O) [25]. The TG curves of Eu-1and Gd-2 show the two main steps of gradual weight loss process before 220 °C, attributed to the release of H2O and two DMF molecules, and 7.0% in 220–410 °C temperature range, corresponding to the loss of coordinated DMF molecules. Above 410 °C, the complete framework sequentially begins to collapse upon further heating. All of the samples had similar thermal stability up to 540–600 °C. The weight loss at higher temperatures of 540–600 °C was attributed to the thermal decomposition of [Ln(BTC)] to Ln oxides. The DSC curves result show that the end point of the endo peak depends on chemical component of the lanthanides (Eu-1: 620 °C, Gd-2: 658 °C and Tb-3: 673 °C).
Figure S1 presents the FTIR spectra of LnMOF isostructural compounds prepared using solvothermal synthesis [25]. The wide peak at 3420 cm−1 is assigned to ν(O-H) groups. The effect of acetate groups from sodium acetate can be noticed in the regions at 2983, 2786 and 2441 cm−1, which are assigned to stretching ν(C-H) vibrations. In the spectrum of H3BTC acid, the characteristic bands of the carboxyl group of BTC are at 3090, 1720, and 537 cm−1. In the spectra of MOFs, no band at 1720 cm−1 corresponding to the COOH groups can be seen, designating the complete deprotonation of the carboxylic acid and coordination of COO groups to the lanthanide centre. The peak at 1678 cm−1 belongs to ν (C=O) of DMF. In the spectra, the bands in the zones of 1568–1538 cm−1 and 1386 cm−1 were marked as stretching vibrations of the COO groups νas and νs, respectively. The powerful peaks provide the C-H bending benzene vibrations that shifted to the region of 775 and 710 cm−1 [8,26]. The peak which appeared at 563 cm−1 can be assigned to the stretching vibration of Eu, Gd and Tb-O [1,27]. The structural designation of the LnMOFs is marked as [Ln(btc)(H2O)(dmf)] [6,9,25].
The XRD diffractograms of the samples are shown in Figure S2. The XRD peaks are in good compliance with previous report indicating that the obtained MOFs are isostructural [25]. The XRD diffractograms are in good agreement with patterns of [Ln(btc)], which have a tetragonal structure, as [La(btc)] simulated [28]. The diffraction patterns indicate the formation of [Ln(btc)], (Ln = Eu, Gd, Tb, Eu0.5Gd0.5, Tb0.5Gd0.5 and Eu0.5Tb0.5) in 2θ of 10.5°, 18.3°, 20.3°, 27.5° and 32° of the most important peaks [25,28]. The other peaks also match the [La(btc)] structure. The [Eu(btc)(H2O)(dmf)], built with a Eu3+ cation and the organic linker BTC via coordination bonding, is a 3D framework with a tetragonal structure [6,9,16]. XRD showed that the [Eu(btc)(H2O)(dmf)] structure is not changed using a slight addition of NaOAc, but it will be transformed to a monoclinic structure with the effect of a major quantity of modulator agent [6,8].

3.2. XPS Characterization on the Surface of the LnMOF

The XPS survey spectra of the samples are presented in Figure S3, with all of the peaks congruent to the typical electronic Eu, Gd, Tb, C, O and N transitions. The total concentration of the elements in the atomic percentage on the surface of the powders was obtained. The composition of the powders on the surface was determined from the intensities of the signals, and is summarized in Table S1. The relative atomic concentration of Eu, Gd and Tb on the surface of the Eu-1 (5.9 at.%), Gd-2 (4.1 at.%) and Tb-3 (3.8 at.%) MOFs was higher than mixed EuGd-4 (2.5 at.%), TbGd-5 (1.9 at.%) and EuTb (2.0 at.%), respectively. The surface composition for EuTb-6 in at.% of Eu, Tb, C, O and N was determined as 1.8, 2.0, 53.7, 33.8 and 8.7, respectively. The values calculated for the assumed formulae of [Ln(btc)(dmf)2(H2O)], {Ln[C6H3(CO2)3](C3H7NO)2(H2O), and C15H19N2O9Ln are C7HxN2O7Eu, C11.6HxN2.8O9Gd, C12.4HxN3.5O9.4Tb, C10.8HxN1.4O7.6 Eu0.52Gd0.48, C14.1HxN2.6O10.6 Tb0.47Gd0.53 and C14.1HxN2.3O8.9 Eu0.47Tb0.53.
In Figure 2, the high resolution HR XPS Eu 3d, Gd 3d, Tb 3d and C 1s, O 1s and N 1s spectra of [Ln(btc)] powders can be observed. The XPS Eu 3d spectrum of Eu-1, EuGd-4 and EuTb-6 contains two significant peaks at 1135 eV (Eu3+ 3d5/2) and 1165 eV (Eu3+ 3d3/2) binding energies, together with two minor satellites that appear at 1128 eV (Eu2+ 3d5/2) and 1155 eV (Eu2+ 3d3/2) [10,29]. The XPS spectrum of Gd-2, EuGd-4 and Tb-Gd-5 shows peaks centered at 1088 eV (Gd 3d5/2) and 1220 eV (Gd 3d3/2), with one (+3) valence state of gadolinium. The XPS Tb 3d spectrum for the Tb-3, TbGd-5 and EuTb-6 samples represents two peaks at 1242 and 1277 eV, assigned to 3d5/2 and 3d3/2 of Tb3+, respectively. The presence of Tb4+ was found in a small peak at 1250 eV [10,14,30,31]. XPS corroborated the coordination impact among europium, gadolinium and terbium ions and the BTC ligand. The XPS spectrum of O 1s, C 1s and N 1s in all of the LnMOF powders showed peaks centered at 532, 285 and 402–407 eV, respectively.
In Figure S4, XPS presents evidence of the attendance of two valency states for Eu (Eu3+/Eu2+) and Tb (Tb3+/Tb4+) at the surface of the MOFs. In the [Eu(btc)] and [Eu0.5Tb0.5(btc)] (MOFs), the Eu3+ and Eu2+ valency states were noticed at 135 and 130 eV, respectively. The states of Tb3+ and Tb4+ in [Tb(btc)], [Tb0.5Gd0.5(btc)] and [Eu0.5Tb0.5(btc)] were confirmed. The spectrum of Tb 4d acquired for the Tb-3 and EuTb-6 sample shows a strong peak at 150 eV and a small peak at 155 eV, attributed Tb3+ and Tb4+, respectively. The Eu2+ concentration of Eu-1 and EuTb-6 was detected to be 0.8 and 0.1 at.%. In the Tb-3 and EuTb-6 samples, the Tb4+ amount was determined to be 0.2 and 0.1 at.%. The presence of the two valence states, Eu3+/Eu2+ and Tb3+/Tb4+, in the corresponding samples was confirmed. This could also be caused by the preparation of samples and drying in air.
The XPS core-level spectra of the O 1s, C 1s and N 1s of Eu-1 and EuTb-6 are shown in Figure 3. The total atomic percentage concentrations of C, O and N in the EuTb-6 powder on the surface were determined to be 53.7, 33.8 and 8.7 %, respectively. The C 1s peak for EuTb-6 can be sectioned into three peaks at 285.0, 286.8 and 288.9 eV, which were assigned to C-H, C-C (35.4 at.%), C-O, C-O-H (8.2 at.%) and C=O. C-O-C (10.1 at.%), respectively [32,33]. The O 1s peak can be composed of three peaks at 531.3, 531.8 and 533.1 eV, which were ascribed to C-O (8.8 at.%), H-C-O (17.2 at.%) and O-H, with Ln-C-O (7.8 at.%) bindings of EuTb-6 [33,34]. The N 1s peak of the EuTb-6 sample, as shown in Figure 3, contains three peaks assigned to the subsequent bands: 400.6 eV (N-H-N-O, C-H-OH), 405.6 eV (N-O), and 407.2 eV (O-N-C-H) [34,35]. The XPS results for C 1s and N 1s are in good agreement with the FTIR ν(C=O) and δ (O=C-N) from coordinated DMF, respectively.

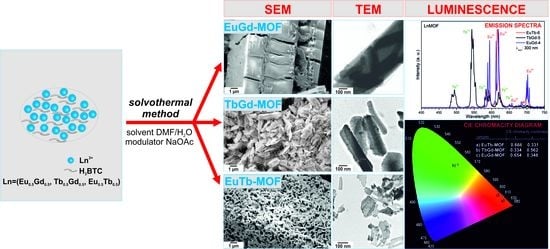
3.3. Surface Morphologies of LnMOFs

The surface morphology of the as-synthesized powders was characterized using SEM and TEM. The images of the SEM and EDS analysis of LnMOF in Tb-3, TbGd-5 and EuTb-6 (insert TEM images) are shown in Figure S5 and Figure 4. The TbMOF morphology formed typical rods in the range of 2 to 10 μm without a modulator (Figure S5a [15]. In Figure S5b, needle-shaped nanocrystals of TbMOF after the addition of the modulator NaOAc can be observed [18]. The EDS spectra (Figure S5c,d) of [Tb(btc)] disclosed the presence of C, O, N and Tb elements in at.% [36]. The EDS spectra of [Tb(btc)] confirmed that the large rods and nano-rods possess equal molar ratios of C, O, N and Tb [6]. Similarly, the crystals of the TbGd-5 (Figure 4a) are evenly spaced, and form pillar-like rods with a size of 10–30 μm (without a modulator). In the EuTb-6 sample (synthetized using the modulator NaOac), well-distributed nano-rods were observed (Figure 4c). The EDS spectra are shown in Figure 4b,d. The elements are compliant with the composition of the required LnMOF {[Tb0.5Gd0.5(btc)] and [Eu0.5b0.5(btc)]} structures.
The TEM micrographs of the Eu-1, Gd-2 and Tb-3 samples and the hybrid MOF (EuGd-4, TbGd-5, and EuTb-6) are displayed in Figure 5. It is absorbing to comment that all of the LnMOF samples prepared using the modulator NaOc exhibit a uniform morphology of their rods, with a size of 100–400 nm [11]. Figure 5d presents one rod with a length of 850 nm and a width of 400 nm, within which small nanorods (length 300–450 nm and width 50–100 nm) are incorporated. In Table 1, the variation of the lanthanide in the LnMOFs results in quite uniform rod-like nanocrystals with a length and width of 850 nm and 400 nm, respectively (EuGd-4), included smaller particles with a length of 300 nm and a width of 50 nm. The size of the nanorods decreases in this order: EuGd-4, TbGd-5 and EuTb-6. The records acquired using TEM were fully alike and agreed well with the results of samples prepared using solvothermal synthesis with the addition of a modulator (NaOAc) gained from SEM. The various SEM and TEM morphologies of the bimetallic [Ln(btc)] (Eu0.5Gd0.5, Gd0.5Tb0.5 and Eu0.5Tb0.5) were changed depending on the synthesis chemistry composition of the Ln3+ ions from the nanorods (100–300 nm) for [Eu0.5Gd0.5(btc)] and [Gd0.5Tb0.5(btc)] to nanoparticles (20–100 nm) for [Eu0.5Tb0.5(BTC)].
The STEM and EDS mapping of the elements in the LnMOFs (Figure 6) elucidate the homogeneous partition of the Ln, O and C elements through the surface of the samples [37]. The STEM images and EDS mapping (Figure 6a) of TbMOF further detected the presence of Tb, O and C as incorporated elements in the respective particles [35]. In Figure 6b–d, at different magnifications, are shown the nanorods of mixed EuGd-4, TbGd-5 and EuTb-6, respectively. The concentration of the elements (in at.%) from the EDS spectra and the mapping of the Tb-3, EuGd-4, TbGd-5 and EuTb-6 samples from the STEM/EDS are summarized in Table S2. The elemental proportions on the surface of the LnMOFs are distinct from the bulk content acquired using SEM/EDS analysis, while the values of the carbon gained with the STEM are rather higher (carbonized sample).

3.4. Luminescence of the LnMOFs

The luminescence tests were performed at room temperature. The excitation and emission spectra of the samples were recorded in a solid state. The excitation spectra of all of the LnMOFs provided a wide peak between 250 and 320 nm, which contained two top bands at 260 and 300 nm, cognated to the Ln3+-O2- charge-transfer (CT) band and to the π–π* electron transformation of the organic ligand, respectively [25,38,39].
When monitored at 543 nm (Figure 7a), the EuTb-6 and TbGd-5 MOF samples presented terbium transitions from the 7F6 ground to the 5D1 (325 nm); 5L7,8,5G3 (340 nm); 5L9,5D2,5G5 (351 nm); 5L10 (368 nm); and 5G6,5D3 (376 nm) and 5D4 (487 nm) [25,40], whereas when monitoring at 617nm (Figure 7b), EuTb-6 and EuGd-4 presented bands attributed to europium transitions from the 7F1 state to the 5D1 excited state at 535 nm, and from the 7F0 ground state to the 5D1 (524 nm); 5D2 (464 nm); 5D3 (417 nm); 5L6 (392 nm); 5G2 (383 nm); 5D4 (361 nm) and 5H6 (317 nm) [41,42,43,44]. However, for the EuTb-6 MOF sample, even monitoring the Eu3+ ion at 617 nm, Tb3+ transitions were found from the 7F6 ground to the 5D1 (325 nm); 5L7,8,5G3 (340 nm); 5L9,5D2,5G5 (351 nm); 5L10 (368 nm); 5G6,5D3 (376 nm) and 5D4 (487 nm), consequent from the energy between the Tb3+ and Eu3+ ions [25,38].
Figure 8a presents the emission spectra of the Eu3+ and Tb3+ ions of the mixed LnMOF samples. The spectra include the characteristic peaks of the Eu3+ ion for the EuTb-6 and EuGd-4 samples, which were assigned to transitions from the 5D0 excited state to the 7FJ (J = 0, 1, 2, 3 and 4) ground states at 579, 591, 617, 653 and 702 nm, respectively. Although the 5D07F0 transformation is exactly forbidden according to the standard Judd–Ofelt theory, its occurrence can be explicated using J-mixing due to the crystal-field disorder, and its attendance shows that the Eu3+ ion takes place with Cnv, Cn or Cs symmetry [44,45,46]. The symmetrical profile of this band indicates only one component, confirming that the emission of the Eu3+ ion occurs from a single site in the matrix. Furthermore, as the band corresponding to the hypersensitive transition 5D07F2 is more intense than the band due to the magnetic dipole transition 5D07F1, the Eu3+ occupies a site without an inversion center [44,46]. For the EuTb-6 and TbGd-5 samples, bands related to the Tb3+ ion were observed at 492, 543, 585, 620 and 656 nm, and they were ascribed to the 5D47FJ (J = 6, 5, 4, 3 and 2) transitions, respectively [25,40].
The CIE chromaticity coordinates were created by Spectra Lux 2.0 software [47] and the corresponding emission spectra acquired at room temperature (Figure 8b). As anticipated, the EuTb-6 and EuGd-4 samples showed CIE chromaticity coordinates closer to the default NTSC values (x = 0.670 and y = 0.330) [48], but were better than the values desired for use in commercial phosphors than Y2O2S:Eu3+, which presents x = 0.64 and y = 0.35 [49]. The values of the CIE coordinates were x = 0.666 and y = 0.331, and x = 0.654 and y = 0.348 for the EuTb-6 and EuGd-4 samples, respectively. For the TbGd-5 sample, the CIE chromaticity coordinates were x = 0.334 and y = 0.562, presenting emissions in the green region of the chromaticity diagram. The applications of the LnMOFs are listed in Table S3. The bimetallic LnMOFs can be used for applications as light-emitting materials [10,38], thermal sensors [20] or prototypical sensor to determine the concentrations of mixed organic compounds [17,21,22,24] and Fe3+ ions [23].

4. Conclusions

In summary, the isostructural lanthanide metal–organic frameworks (LnMOFs (Ln = Eu, Gd, Tb, Eu0.5Gd0.5, Gd0.5Tb0.5 and Eu0.5Tb0.5)) were prepared by the solvothermal synthesis route. The series of nanostructured [Ln(btc)] (BTC: 1,3,5-benzenetricarboxylate) were obtained using sodium acetate as a modulator. XPS corroborated the coordination impact among the europium, gadolinium and terbium ions and the BTC ligand. XPS established the presence of two valence—Eu and Tb—states (Eu3+/Eu2+) and (Tb3+/Tb4+) and a single valence, Gd, state (Gd3+). The various SEM and TEM morphologies of bimetallic [Ln(btc)] (Eu0.5Gd0.5, Gd0.5Tb0.5 and Eu0.5Tb0.5) were changed depending on the synthesis chemistry composition of Ln3+ ions from nanorods (100–300 nm) for [Eu0.5Gd0.5(btc)] and [Gd0.5Tb0.5 (btc)] to nanoparticles (50–100 nm) for [Eu0.5Tb0.5(btc)]. The characteristic transitions within the 4f shells of the Ln3+ ions were shown in the luminescence spectra. The MOFs (EuTb and EuGd) presented CIE chromaticity coordinates in the red region. This CIE result (x = 0.666 and y = 0.331) for the EuTb-MOF was expected due to its emissions from the europium ion, which were more intense than the terbium ion emissions. For TbGd-MOF, the CIE coordinates showed emissions in the green region of the chromaticity diagram. The mixed LnMOFs were prepared in order to extend their potential application in bifunctional luminescent sensors.

Supplementary Materials

The following are available online at https://www.mdpi.com/article/10.3390/inorganics9100077/s1. Figure S1: FTIR spectra of LnMOFs prepared by solvothermal synthesis. Figure S2: XRD patterns of LnMOFs prepared by solvothermal synthesis. Figure S3: XPS survey spectra of LnMOFs prepared by solvothermal synthesis. Table S1: XPS elemental atomic % of the LnMOF samples. Figure S4: SEM morphology and TEM images (in insert) of TbMOF powders prepared by solvothermal synthesis (a) (DMF/H2O) and (c) (DMF/H2O/NaOAc), and (b,d) EDS spectra of TbBTC. Table S2: EDS analysis of Tb-3, EuGd-4, TbGd-5 and EuTb-6 samples from the TEM/EDS spectra.

Author Contributions

Investigation, conceptualization, resources, writing—original draft preparation, H.B.; writing—review and editing, methodology, H.B., E.M. and L.R.; investigation and formal analysis, E.N., W.N., H.K., M.L., A.K., Z.M., M.S. and L.M. All authors have read and agreed to the published version of the manuscript.

Funding

The research was supported by the Grant Agency of the Slovak Academy of Sciences through project VEGA No. 2/0037/20 and APVV-20-0299. The authors thank Coordenação de Aperfeiçoamento de Pessoal de Nível Superior-Brasil (CAPES)-Finance Code 001, Conselho Nacional de Desenvolvimento Científico e Tecnológico (CNPq, grants: 302702/2018-0 L.A.R. and 302668/2017-9 E.J.N.).

Data Availability Statement

The data presented in this study are available on request from the corresponding author. This data is not publicly available due to its excessive size and complex format.

Conflicts of Interest

The authors declare no conflict of interest.

References

  1. Batten, S.R.; Champness, N.R.; Chen, X.M.; Garcia-Martinez, J.; Kitagawa, S.; Öhrström, L.; O’Keeffe, M.; Suh, M.P.; Reedijk, J. Terminology of metal-organic frameworks and coordination polymers (IUPAC Recommendations 2013). Pure Appl. Chem. 2013, 85, 1715–1724. [Google Scholar] [CrossRef] [Green Version]
  2. Peedikakkal, A.M.P.; Adarsh, N.N. Coordination Polymers. In Porous Coordination Polymers; Mazumder, M.J., Sheardown, H., Al-Ahmed, A., Eds.; Springer: Berlin/Heidelberg, Germany, 2018; pp. 2–6. [Google Scholar] [CrossRef]
  3. Lee, J.S.M.; Otake, K.; Kitagawa, S. Transport properties in porous coordination polymers. Coord. Chem. Rev. 2020, 421, 213447. [Google Scholar] [CrossRef]
  4. Kuznetsova, A.; Matveevskaya, V.; Pavlov, D.; Yakunenkov, A.; Potapov, A. Coordination Polymers Based on Highly Emissive Ligands: Synthesis and Functional Properties. Materials 2020, 13, 2699. [Google Scholar] [CrossRef] [PubMed]
  5. Kovalenko, K.A.; Potapov, A.S.; Fedin, V.P. Micro- and mesoporous metal-organic coordination polymers for separation of hydrocarbons. Rus. Chem. Rev. 2021, 90. [Google Scholar] [CrossRef]
  6. Xu, B.; Guo, H.; Wang, S.; Li, Y.; Zhang, H.; Liu, C. Solvothermal synthesis of luminescent Eu(BTC)(H2O)DMF hierarchical architectures. CrystEngComm 2012, 14, 2914–2919. [Google Scholar] [CrossRef]
  7. Neufeld, M.J.; Winter, H.; Landry, M.R.; Goforth, A.M.; Khan, S.; Pratx, G.; Sun, C. Lanthanide Metal-Organic Frameworks for Multispectral Radioluminescent Imaging. ACS Appl. Mater. Interfaces 2020, 12, 26943–26954. [Google Scholar] [CrossRef]
  8. Huang, Z.; Zhao, F.; Fan, L.; Zhao, W.; Chen, B.; Chen, X.; Zhou, S.F.; Xiao, J.; Zhan, G. Improved hydrolytic robustness and catalytic performance of flexible lanthanide-based metal-organic frameworks: A mater of coordination environments. Mater. Des. 2020, 194, 108881. [Google Scholar] [CrossRef]
  9. Dang, S.; Song, S.; Feng, J.; Zhang, H. Microwave-assisted synthesis of nanoscale Eu(BTC)(H2O)·DMF with tunable luminescence. Sci. China Chem. 2015, 58, 973–978. [Google Scholar] [CrossRef]
  10. Alammar, T.; Hlova, I.Z.; Gupta, S.; Balema, V.; Pecharskya, V.K.; Mudring, A.V. Luminescent Properties of Mechanochemically Synthesized Lanthanide Containing MIL-78 MOF. Dalton Trans. 2018, 47, 7594–7601. [Google Scholar] [CrossRef] [PubMed] [Green Version]
  11. Ramya, A.R.; Varughese, S.; Reddy, M.L.P. Tunable white-light emission from mixed lanthanide (Eu3+, Gd3+, Tb3+) coordination polymers derived from 4-(dipyridin-2-yl)-aminobenzoate. Dalton Trans. 2014, 43, 10940–10946. [Google Scholar] [CrossRef]
  12. Gonzalez, A.; Chu, X.M.; Pitton, K.A.; Crichton, R.; Einkauf, J.D. Developing Luminescent Lanthanide Coordination Polymers and Metal-Organic Frameworks for Bioimaging Applications. Springs 2017, 6, 37–43. [Google Scholar]
  13. Zhao, Y.; Li, D. Lanthanide-functionalized metal-organic frameworks as ratiometric luminescent sensors. J. Mater. Chem. C 2020, 8, 12739–12754. [Google Scholar] [CrossRef]
  14. Wang, M.; Hu, M.; Li, Z.; He, L.; Song, Y.; Jia, Q.; Zhang, Z.; Du, M. Construction of Tb-MOF-on-Fe-MOF conjugate as a novel platform for ultrasensitive detection of carbohydrate antigen 125 and living cancer cells. Biosens. Bioelectron. 2019, 142, 111536. [Google Scholar] [CrossRef]
  15. Nasruddin; Zulys, A.; Yulia, F.; Buhori, A.; Muhadzib, N.; Ghiyats, M.; Saha, B.B. Synthesis and characterization of a novel microporous lanthanide based metal-organic framework (MOF) using napthalenedicarboxylate acid. J. Mater. Res. Technol. 2020, 9, 7409–7417. [Google Scholar] [CrossRef]
  16. Lian, X.; Yan, B. A lanthanide metal–organic framework (MOF-76) for adsorbing dyes and fluorescence detecting aromatic pollutants. RSC Adv. 2016, 6, 11570–11576. [Google Scholar] [CrossRef]
  17. Zhang, Y.; Li, B.; Ma, H.; Zhang, L.; Jiang, H.; Song, H.; Zhang, L.; Luo, Y. A nanoscaled lanthanide metal-organic framework as a colorimetric fluorescent sensor for dipicolinic acid based on modulating energy transfer. J. Mater. Chem. C 2016, 4, 7294–7301. [Google Scholar] [CrossRef]
  18. Ren, K.; Guo, X.F.; Tang, Y.J.; Huang, B.H.; Wang, H. Size-controlled synthesis of metal-organic frameworks and their performance as fluorescence sensors. Analyst 2020, 145, 7349–7356. [Google Scholar] [CrossRef] [PubMed]
  19. Nascimento, J.F.S.D.; Barros, B.S.; Kulesza, J.; de Oliveira, J.B.L.; Leite, A.K.P.; de Oliveira, R.S. Influence of synthesis time on the microstructure and photophysical properties of Gd-MOFs doped with Eu3+. Mater. Chem. Phys. 2017, 190, 166–174. [Google Scholar] [CrossRef]
  20. Gomez, G.E.; Kaczmarek, A.M.; Van Deun, R.; Brusau, E.V.; Narda, G.E.; Vega, D.; Iglesias, M.; Gutierrez-Puebla, E.; Monge, M.A. Photoluminescence, Unconventional-Range Temperature Sensing, and Efficient Catalytic Activities of Lanthanide Metal-Organic Frameworks. Eur. J. Inorg. Chem. 2016, 10, 1577–1588. [Google Scholar] [CrossRef]
  21. Chen, D.M.; Sun, C.X.; Peng, Y.; Zhang, N.N.; Si, H.H.; Liu, C.S.; Du, M. Ratiometric fluorescence sensing and colorimetric decoding methanol by a bimetallic lanthanide-organic framework. Sens. Actuators B 2018, 265, 104–109. [Google Scholar] [CrossRef]
  22. Zhou, J.; Li, H.; Zhang, H.; Li, H.; Shi, W.; Cheng, P. A Bimetallic Lanthanide Metal–Organic Material as a Self-Calibrating Color-Gradient Luminescent Sensor. Adv. Mater. 2015, 27, 7072–7077. [Google Scholar] [CrossRef] [PubMed]
  23. Cheng, X.; Hu, J.; Li, J.; Zhang, M. Tunable emission and selective luminescence sensing for nitro-pollutants and metal ions based on bifunctional lanthanide metal-organic frameworks. J. Lumin. 2020, 221, 117100. [Google Scholar] [CrossRef]
  24. Xia, T.; Wang, J.; Jiang, K.; Cui, Y.; Yang, Y.; Qian, G. A Eu/Gd-mixed metal-organic framework for ultrasensitive physiological temperature sensing. Chin. Chem. Lett. 2018, 29, 861–864. [Google Scholar] [CrossRef]
  25. Brunckova, H.; Mudra, E.; Rocha, L.; Nassar, E.; Nascimento, W.; Kolev, H.; Kovalcikova, A.; Molcanova, Z.; Podobova, M.; Medvecky, L. Preparation and characterization of isostructural lanthanide Eu/Gd/Tb metal-organic framework thin films for luminescent applications. Appl. Surf. Sci. 2021, 542, 148731. [Google Scholar] [CrossRef]
  26. Che, H.; Li, Y.; Zhang, S.; Chen, W.; Tian, X.; Yang, C.; Lu, L.; Zhou, Z.; Nie, Y. A portable logic detector based on Eu-MOF for multi-target, on-site, visual detection of Eu3+ and fluoride in groundwater. Sens. Actuators B Chem. 2020, 324, 128641. [Google Scholar] [CrossRef]
  27. Binh, N.T.; Tien, D.M.; Giang, L.T.K.; Khuyen, H.T.; Huong, N.T.; Huong, T.T.; Lam, T.D. Study on preparation and characterization of MOF based lanthanide doped luminescent coordination polymers. Mater. Chem. Phys. 2014, 143, 946–951. [Google Scholar] [CrossRef]
  28. Song, K.; Yu, H.; Zhang, J.; Bai, Y.; Guan, Y.; Yu, J.; Guo, L. Rosebengal-Loaded Nanoporous Structure Based on Rare Earth Metal-Organic-Framework: Synthesis, Characterization and Photophysical Performance. Crystals 2020, 10, 185. [Google Scholar] [CrossRef] [Green Version]
  29. Li, G.; Tong, C. Dual-functional lanthanide metal organic frameworks for visual and ultrasensitive ratiometric fluorescent detection of phosphate based on aggregation-induced energy transfer. Anal. Chimica Acta 2020, 1133, 11–19. [Google Scholar] [CrossRef] [PubMed]
  30. Colomer, M.T.; Rodríguez, E.; Moran-Pedroso, M.; Vattier, F.; de Andres, A. Impact of Tb4+ and morphology on the thermal evolution of Tb-doped TiO2 nanostructured hollow spheres and nanoparticles. J. Alloys Compd. 2020, 853, 156973. [Google Scholar] [CrossRef]
  31. Balaguer, M.; Yoo, C.Y.; Bouwmeester, H.J.M.; Serra, J.M. Bulk transport and oxygen surface exchange of the mixed ionic–electronic conductor Ce1−xTbxO2−δ (x = 0.1, 0.2, 0.5). J. Mater. Chem. A 2013, 1, 10234–10242. [Google Scholar] [CrossRef]
  32. Cheng, J.; Liang, J.; Dong, L.; Chai, J.; Zhao, N.; Ullah, S.; Wang, H.; Zhang, D.; Imtiaz, S.; Shan, G.; et al. Self-assembly of 2D-metal–organic framework/graphene oxide membranes as highly efficient adsorbents for the removal of Cs+ from aqueous solutions. RSC Adv. 2018, 8, 40813–40822. [Google Scholar] [CrossRef] [Green Version]
  33. Li, X.; Zhang, J.; Han, Y.; Zhu, M.; Shang, S.; Li, W. MOF-derived various morphologies of N-doped carbon composites for acetylene hydrochlorination. J. Mater. Sci. 2018, 53, 4913–4926. [Google Scholar] [CrossRef]
  34. Jiang, T.; Sun, X.; Wei, L.; Li, M. Electrochemical determination of artemisinin based on signal inhibition for the reduction of hemin. Anal. Bioanal. Chem. 2021, 413, 565–576. [Google Scholar] [CrossRef] [PubMed]
  35. Fechler, N.; Fellinger, T.P.; Antonietti, M. One-pot synthesis of nitrogen–sulfur-co-doped carbons with tunable composition using a simple isothiocyanate ionic liquid. J. Mater. Chem. A 2013, 1, 14097–14102. [Google Scholar] [CrossRef] [Green Version]
  36. Sheta, S.M.; El-Sheikh, S.M.; Abd-Elzaher, M.M.; Wassel, A.R. A novel nano-size lanthanum metal–organic framework based on 5-amino-isophthalic acid and phenylenediamine: Photoluminescence study and sensing applications. Appl. Organometal Chem. 2019, 33, 4777. [Google Scholar] [CrossRef]
  37. Du, S.Z.; Sun, Z.; Han, L.; Qing, M.; Luo, H.Q.; Li, N.B. Two 3d-4f metal-organic frameworks as fluorescent sensor array for the discrimination of phosphates based on different response patterns. Sens. Actuators B. Chem. 2020, 324, 128757. [Google Scholar] [CrossRef]
  38. Zheng, Y.; Liu, K.; Sun, X.; Guan, R.; Su, H.; You, H.; Qi, C. A series of nano/micro-sized metal-organic frameworks with tunable photoluminescence properties. CrystEngComm 2015, 17, 2321–2326. [Google Scholar] [CrossRef]
  39. Medina-Velazquez, D.Y.; Alejandre-Zuniga, B.Y.; Loera-Serna, S.; Ortiz, E.M.; Morales-Ramirez, J.; Garfias-Garcia, E.; Garcia-Murillo, A.; Falcony, C. An alkaline one-pot reaction to synthesize luminescent Eu-BTC MOF nanorods, highly pure and water-insoluble, under room conditions. J. Nanoparticle Res. 2016, 18, 352–362. [Google Scholar] [CrossRef]
  40. Moscardini, S.B.; Sverzut, L.; Massarotto, W.L.; Nassar, E.J.; Rocha, L.A. Multi-color emission from lanthanide ions doped into niobium oxide. J. Mater. Sci. Mater Electron. 2020, 31, 5241–5252. [Google Scholar] [CrossRef]
  41. Miura, B.A.; Ferreira, N.H.; Oliveira, P.F.; Faria, E.H.; Tavares, D.C.; Rocha, L.A.; Ciuffi, K.J.; Nassar, E.J. Functionalization of luminescent YVO4:Eu3+ nanoparticles by sol-gel. J. Lumin. 2015, 159, 93–99. [Google Scholar] [CrossRef]
  42. Rocha, L.A.; Ciuffi, K.J.; Sacco, H.C.; Nassar, E.J. Influence on deposition speed and stirring type in the obtantion of titania films. Mater. Chem. Phys. 2004, 85, 245–250. [Google Scholar] [CrossRef]
  43. Haugland, R.P. Handbook of Fluorescent Probes and Research Products, 9th ed.; Molecular Probes: Eugene, OR, USA, 2002. [Google Scholar]
  44. Binnemans, K. Interpretation of europium(III) spectra. Coord. Chem. Rev. 2015, 295, 1–45. [Google Scholar] [CrossRef] [Green Version]
  45. Matias, C.R.; Nassar, E.J.; Verelst, M.; Rocha, L.A. Synthesis and Characterization of Nb2O5:La3+,Eu3+ Phosphors Obtained by the Non-Hydrolytic Sol-Gel Process. J. Braz. Chem. Soc. 2015, 26, 2558–2570. [Google Scholar] [CrossRef]
  46. Pereira, P.F.S.; Matos, M.G.; Ferreira, C.M.A.; De Faria, E.H.; Calefi, P.S.; Rocha, L.A.; Ciuffi, K.J.; Nassar, E.J. Aluminate matrix doped with Tm3+/Tb3+/Eu3+ obtained by non-hydrolytic sol-gel route: White light emission. J. Lumin. 2014, 146, 394–397. [Google Scholar] [CrossRef]
  47. Santa-Cruz, P.A.; Teles, F.S. Spectra Lux Software v.1.0, Ponto Quântico Nanodispositivos/Renami; SciELO: São Paulo, Brazil, 2003. [Google Scholar]
  48. Zhou, L.; Huang, J.; Gong, F.; Lan, Y.; Tong, Z.; Sun, J. A new red phosphor LaNb0.70V0.30O4:Eu3+ for white light-emitting diodes. J. Alloys Compd. 2010, 495, 268–271. [Google Scholar] [CrossRef]
  49. Huang, J.; Zhou, L.; Liang, Z.; Gong, F.; Han, J.; Wang, R. Promising red phosphors LaNbO4:Eu3+, Bi3+ for LED solid-state lighting application. J. Rare Earths 2010, 28, 356–360. [Google Scholar] [CrossRef]
Figure 1. DSC/TG curves of LnMOF (Ln = Eu, Gd, Tb) prepared by solvothermal synthesis.
Inorganics 09 00077 g001
Figure 2. HR XPS spectra of the Eu 3d, Gd 3d, Tb 3d, C 1s, O 1s and N 1s of [Ln(btc)] (Eu-1, Gd-2, Tb-3, EuGd-4, TbGd-5 and EuTb-6) powders.
Inorganics 09 00077 g002
Figure 3. HR XPS spectra of C 1s, O 1s and N 1s, and curve-fitted peaks for [Eu(btc)] and [Eu0.5Tb0.5(btc)] powders.
Inorganics 09 00077 g003
Figure 4. SEM morphology and TEM images (in insert) of LnMOF powders prepared by the solvothermal synthesis of (a) TbGd-5 (DMF/H2O) and (c) EuTb-6 (DMF/H2O/NaOAc); and the EDS spectra of (b) [Tb0.5Gd0.5(btc)] and (d) [Eu0.5Tb0.5(btc)].
Inorganics 09 00077 g004
Figure 5. TEM images of the LnMOF powders: (a) Eu-1, (b) Gd-2, (c) Tb-3, (d) EuGd-4, (e) TbGd-5 and (f) EuTb-6.
Inorganics 09 00077 g005
Figure 6. STEM images and EDS elemental mapping of the LnMOF powders: (a) Tb-3, (b) EuGd-4, (c) TbGd-5 and (d) EuTb-6 samples.
Inorganics 09 00077 g006
Figure 7. Excitation spectra of the LnMOF sample:s (a) EuTb-6 and TbGd-5 (λem = 543 nm), and (b) EuTb-6 and EuGd-4 (λem = 617 nm).
Inorganics 09 00077 g007
Figure 8. (a) Emission spectra and (b) CIE chromaticity diagrams of bimetallic lanthanide MOFs.
Inorganics 09 00077 g008
Table 1. The variation in sizes of the nanorods obtained from the TEM images (Figure 5).
LnMOFSize of Nanorod (nm)Size of Included Particles (nm)
LengthWidthLengthWidth
Eu-1820280350100
60015020050
Gd-273015015050
60015010040
Tb-34005015060
2505010050
EuGd-4850400450100
30050
TbGd-540015015030
3003013020
EuTb-6140204020
110203020
Publisher’s Note: MDPI stays neutral with regard to jurisdictional claims in published maps and institutional affiliations.

