Article

Direct Control of Spin Distribution and Anisotropy in Cu-Dithiolene Complex Anions by Light

1
Graduate School of Science and Engineering, Ehime University, 2-5, Bunkyo-cho, Matsuyama 790-8577, Japan
2
Division of Material Science, Advanced Research Support Center (ADRES), Ehime University, 2-5, Bunkyo-cho, Matsuyama 790-8577, Japan
*
Author to whom correspondence should be addressed.
Inorganics 2016, 4(2), 7; https://doi.org/10.3390/inorganics4020007
Submission received: 15 January 2016 / Revised: 16 March 2016 / Accepted: 21 March 2016 / Published: 30 March 2016

Abstract

:
Electrical and magnetic properties are dominated by the (de)localization and the anisotropy in the distribution of unpaired electrons in solids. In molecular materials, these properties have been indirectly controlled through crystal structures using various chemical modifications to affect molecular structures and arrangements. In the molecular crystals, since the energy band structures can be semi-quantitatively known using band calculations and solid state spectra, one can anticipate the (de)localization of unpaired electrons in particular bands/levels, as well as interactions with other electrons. Thus, direct control of anisotropy and localization of unpaired electrons by locating them in selected energy bands/levels would realize more efficient control of electrical and magnetic properties. In this work, it has been found that the unpaired electrons on Cu(II)-complex anions can be optically controlled to behave as anisotropically-delocalized electrons (under dark) or isotropically-localized electrons like free electrons (under UV), the latter of which has hardly been observed in the ground states of Cu(II)-complexes by any chemical modifications. Although the compounds examined in this work did not switch between conductors and magnets, these findings indicate that optical excitation in the [Cu(dmit)2]2− salts should be an effective method to control spin distribution and anisotropy.

Graphical Abstract

1. Introduction

Electrical and magnetic properties are based on unpaired electrons in solids. Delocalized unpaired electrons can exhibit electrical conduction, while localized unpaired electrons can exhibit magnetism. This trend is true for any solid, including molecular materials. In addition, the (an)isotropy in the interactions among unpaired electrons also matters in these properties. Thus, the control of conduction and/or magnetism requires the control of the (de)localization and anisotropy of the unpaired electrons. If one can switch unpaired electrons between localized and delocalized states, then one may switch the solids between conductive and magnetic materials. This point of view is different from that of light-induced excited spin-state trapping (LIESST), where the spin states of transition-metal complexes are switched between high- and low-spins by photoexcitations at low temperature [1,2,3,4,5,6,7,8,9]. Additionally, the abovementioned point of view is also different from that of photo-induced phase transitions (PIPTs), where phase transitions, such as metal-insulator and ionic-neutral transitions at certain temperatures (TCs), are brought about by photo-irradiation near the TCs [10,11]. The purpose of the present work is the control of spin distribution and anisotropy independent of thermodynamic conditions, unlike PIPTs. Thus far, most of the studies to control the electrical and magnetic properties have utilized chemical modifications to affect molecular structures and arrangements. However, after tens of years of worldwide extensive research, this strategy has turned out to be challenging for the fine and precise control of conduction and magnetism [12,13,14]. In both organic and inorganic materials, the slightest chemical modifications often result in unexpectedly marked differences in crystal structures [15,16]. In addition, the slightest differences in crystal structures would sometimes make qualitative differences in the physical properties. In particular, in molecular crystals, there are many kinds of weak intermolecular interactions with keeping a subtle balance to form complicated electronic and crystal structures. Because of this characteristic situation, molecular crystals containing unpaired electrons often have several metastable states, as well as unique excited states with peculiar relaxation mechanisms [17] and are sensitive to perturbation, such as photo-irradiation [18]. All of these properties are interesting in the development of electrical and magnetic materials. However, a precise control of atomic/molecular arrangements in crystals remains impossible. Accordingly, it is interesting, as well as important to develop new methods to control the conductive and magnetic properties of the molecular crystals.
Paying attention to such unique features of molecular crystals, the control of conduction [19,20], or magnetism [21,22], or other physical properties [23,24,25,26,27,28] was carried out using photochemical redox reactions in solid states. In the reactions, photo-induced electron transfer occurs between two different kinds of molecular species in the crystal, e.g., the cations and the anions; one species is responsible for conduction and/or magnetism, and the other serves as the charge reservoir in high-TC cuprates [29]. The latter species is not involved in either conductive or magnetic properties. As photochemical reactions generally have high spatial resolutions, this method is utilized to make junction structures of a molecular single crystal for electronic devices when the electron transfer is irreversible [19,30]. Furthermore, reversible and simultaneous control of conduction and magnetism has been recently realized using charge transfer (CT) transition between two different molecular species in salts [31,32], instead of chemical reactions. In this case, one of the molecular species accommodates localized spins for magnetism, in addition to serving as the charge reservoir. The remaining species is optically doped to have excited carriers, like photoconductors. “Giant photoconductivity”, which possibly originates from reversible melting of charge order, has been observed by UV irradiation upon a related molecular crystalline salt [33]. The advantage of this photochemical or optical method lies in the fact that control of the crystal structure is not required at any level. Now that a crystal with an appropriate structure and physical properties, which are known under dark conditions, is selected, nothing but photo-irradiation is required to excite and produce localized and/or delocalized unpaired electrons in the crystal. As long as the electronic band structure and the solid state spectra are known, selected photoexcitation with appropriate wavelength and intensity can take place with accidental or uncontrollable factors being minimized in the control of conduction and magnetism. In addition to the abovementioned sensitivity to light and unique photo-physics of molecular crystals, this kind of photo-control is based on the fact that molecular crystals often contain different kinds of molecules for different roles and also the fact that they have well-defined crystal and band structures, which are clarified by standard experimental and calculation techniques. This idea will make a step forward when a single kind of molecule is responsible for both magnetism and conduction. This will be realized when the distribution of unpaired electrons on the molecule can be controlled by irradiation. In other words, the desired molecular orbitals for unpaired electrons should be selected by appropriate photoexcitation. If the unpaired electrons are excited to be localized, the magnetic properties dominate, and vice versa. Based on this idea, a unique Cu(II)-dithiolene complex anion has been found to be suitable for this purpose, after a number of transition-metal complexes were examined.
Metal-dithiolene complex molecules, M(dmit)2 (M = Ni, Pd, Pt, Au, etc., dmit2− = 1,3-dithiole-2-thione-4,5-dithiolate, Figure 1), have attracted attention for a long time as building blocks for conducting, magnetic and optical materials [34,35,36,37,38,39,40,41,42,43,44,45,46,47,48]. Among a great number of molecular species, M(dmit)2 and their derivatives have always shown us new possibilities of states of matter, such as single-component metals/superconductors [49,50,51,52,53,54,55,56,57,58,59] and spin liquids [60]. This is because M(dmit)2 have uniquely many degrees of freedom, i.e., spin, charge and orbital degrees of freedom, originating from d-orbitals at the metal centers and π-orbitals of the dmit-ligands. The M(dmit)2 species often become stable radical anions with fractional formal charges in solid states. In the solid states, they closely interact with each other through the overlap of the molecular orbitals (MOs) accommodating the unpaired electrons. Among the M(dmit)2 and related complexes, the Cu(dmit)2 anions [61,62,63,64,65,66,67] are unique in that the number and distribution of the unpaired electrons may be reversibly controlled with UV radiation [68]. In this work, the electronic and spin densities of [Cu(dmit)2]2− anions are compared in detail in salts with various cations. Among them, three salts, (nBu4N)2[Cu(dmit)2] (1), [(DABCO)H]2[Cu(dmit)2]CH3CN (DABCO = 1,4-diazabicyclo[2.2.2]octane) (2) and BP2DBF[Cu(dmit)2] (BP2DBF2+ = dibenzofuran-2,2′-bis(N-methylene-4,4′-bipyridinium)) (3) (Figure 1), exhibited systematic differences in structural and physical properties. The following are discussed in this paper for 13: the crystal and molecular structures, the temperature-dependent electrical resistivities, the calculated charge and spin densities, the electron spin resonance (ESR) spectra and the temperature-dependent magnetic susceptibilities.

2. Results and Discussion

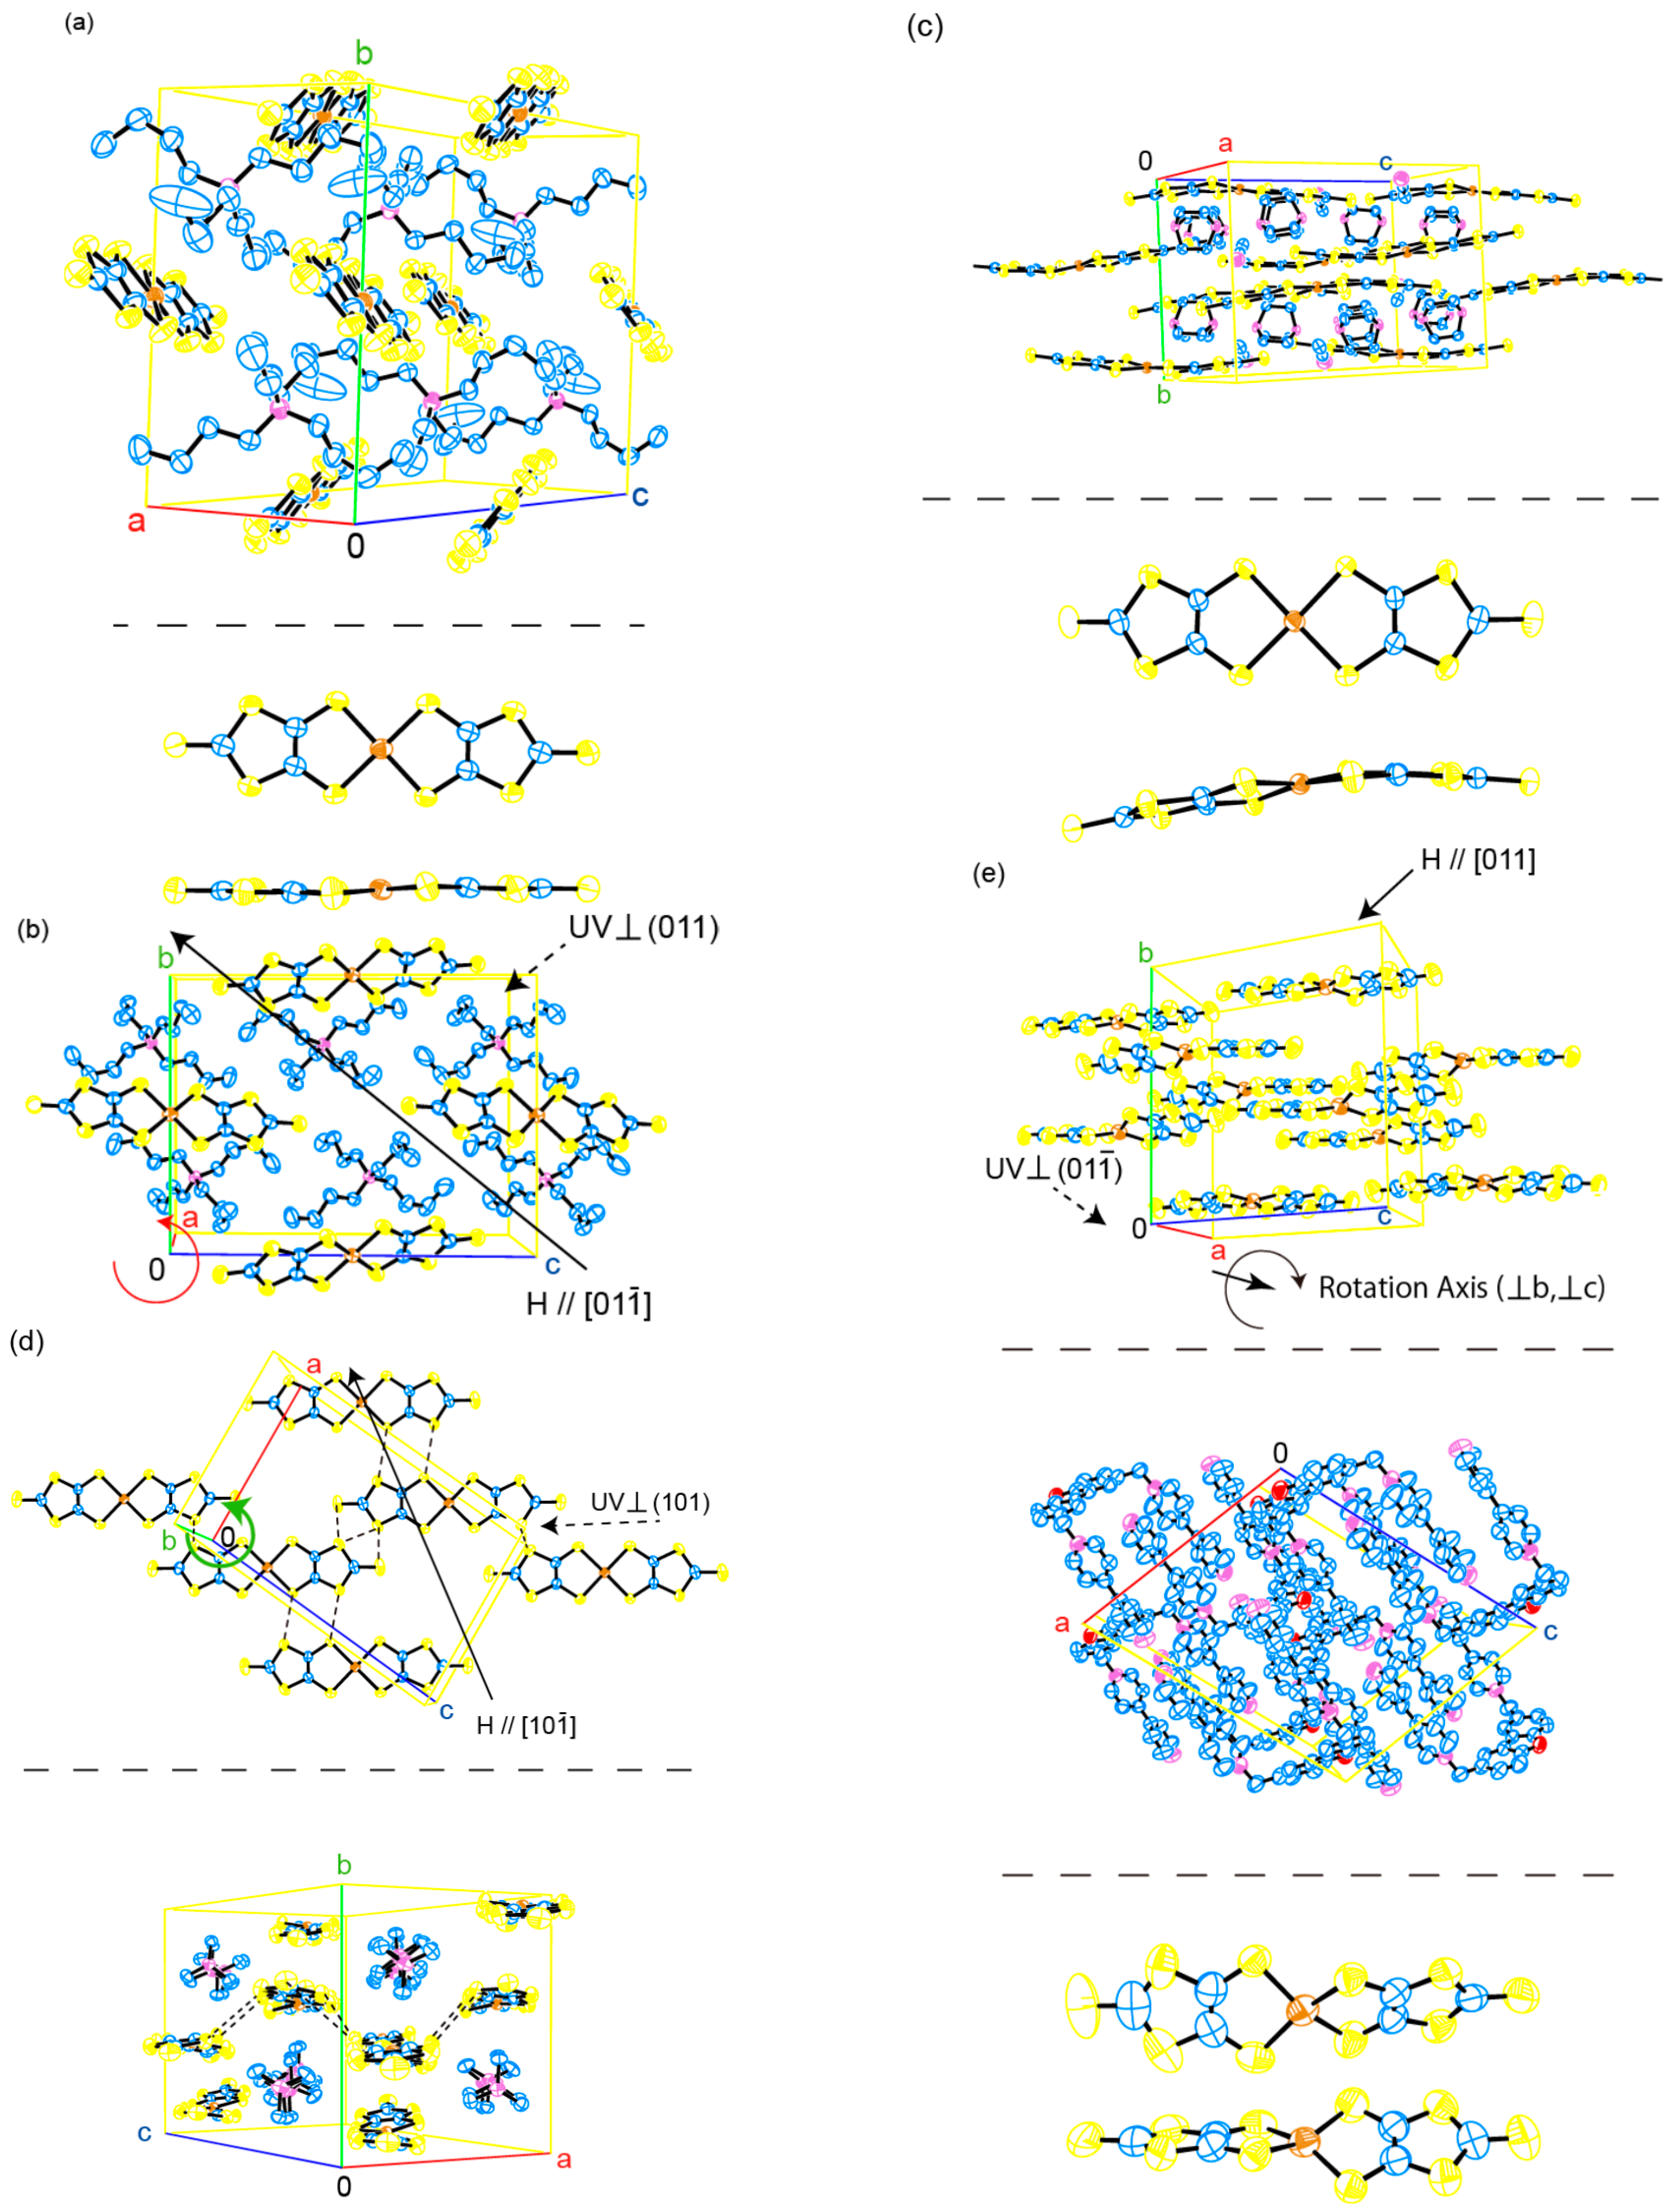
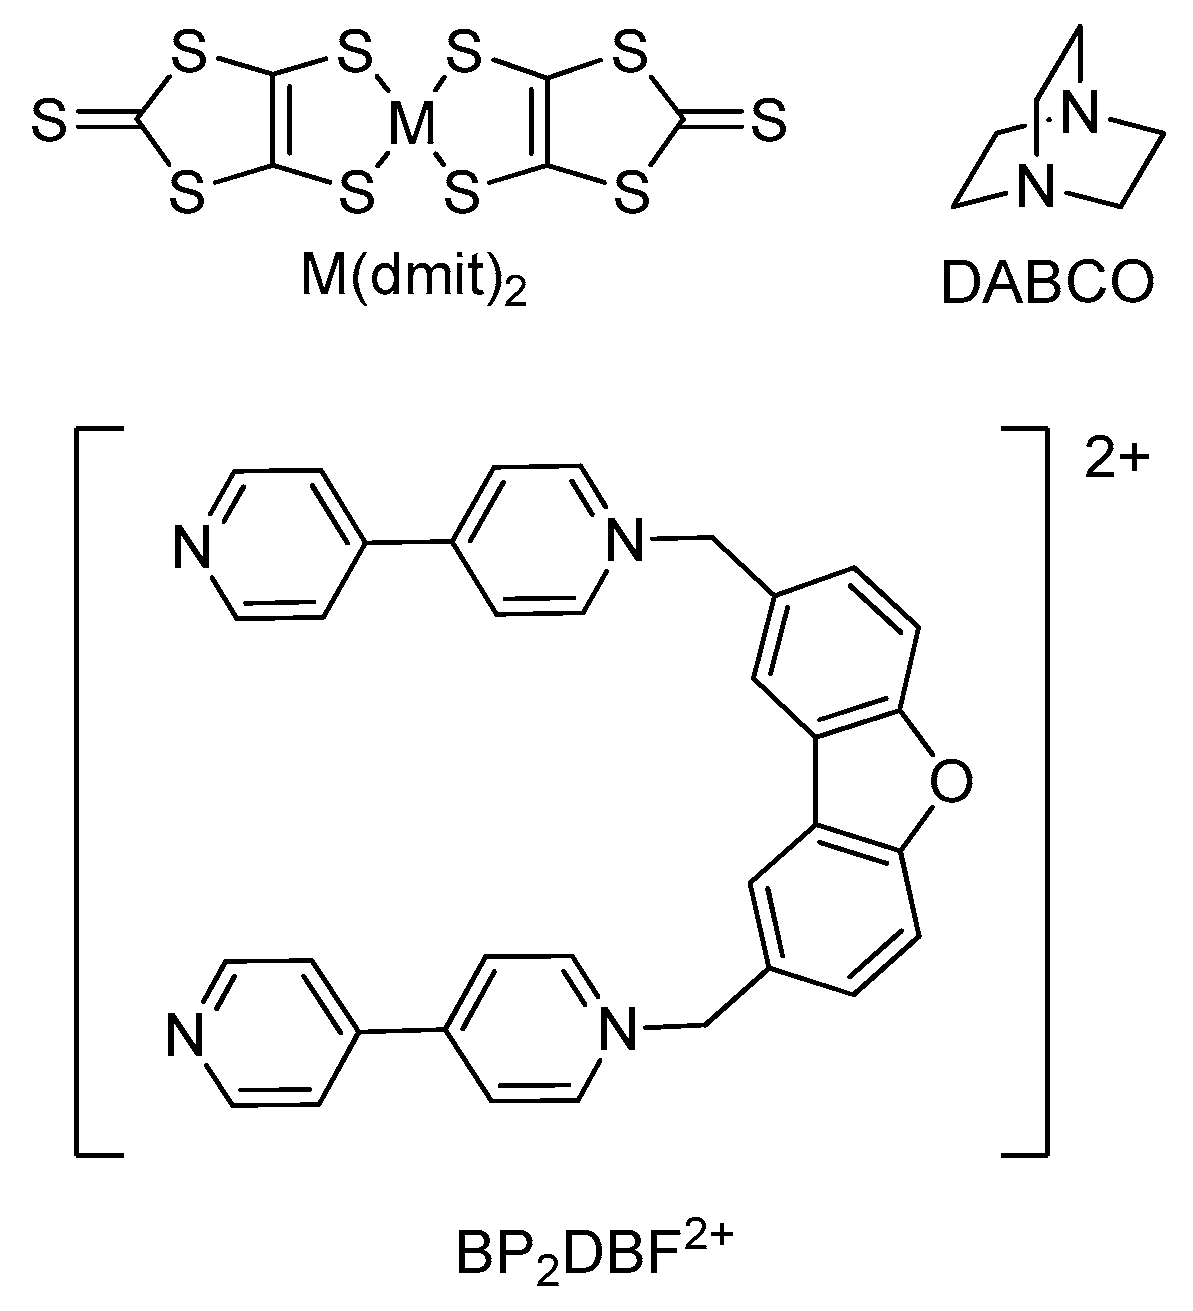
2.1. Crystal and Molecular Structures

The crystal and molecular structures of 13 are shown in Figure 2, and the crystal data are summarized in Table S1 in the Supplementary Materials. The crystal and molecular structures of 13 remain unchanged from room to low temperature, except for a few percentage of thermal shrinkage in the unit cell volumes V (V(100 K)/V(296 K) = 96.6%, 97.5% and 97.9% for 13, respectively). The electrical and magnetic properties are cooperative phenomena and are mainly based on intermolecular interactions through sulfur–sulfur (S–S) interatomic contacts in 13. With respect to the arrangement of the [Cu(dmit)2]2 anions, the shortest intermolecular S–S distances at 296/100 K in 13 are 6.138(1)/5.8082(7) Å in 1, 3.499(1)/3.429(1) Å in 2 and 3.921(3)/3.848(5) Å in 3. Those in 1 and 3 are larger than twice the van der Waals radius of a sulfur atom (1.85 × 2 = 3.70 Å; simply called the “van der Waals distance” below). Thus, there should hardly be any interaction through the overlap of MOs between adjacent [Cu(dmit)2]2 anions in 1 and 3. This suggests that both salts should be insulators, which is supported by electrical measurements below. A tight-binding band calculation (TBBC) was carried out for 2 (Figure 3). The calculated band is slightly dispersive along such lines as Г(0,0,0)–X(0.5,0,0), Y(0,0.5,0)–Z(0,0,0.5) and Z(0,0,0.5)–R(0.5,0.5,0.5). There are no partially-filled bands, and there is a band gap of ~0.07 eV (~800 K) at the Fermi level EF. These results mean that 2 should be an insulator in its ground state, but around room temperature (RT), it can become semiconductive. As for the remaining salts, a TBBC suggests that 1 and 3 should also be either semiconductors or insulators, since the calculated bands are too narrow to exhibit metallic conduction (1, Figure S1c in the Supplementary Materials) or do not include partially-filled bands (3, Figure S1o in the Supplementary Materials). These results are consistent with the observed electrical properties (see below).

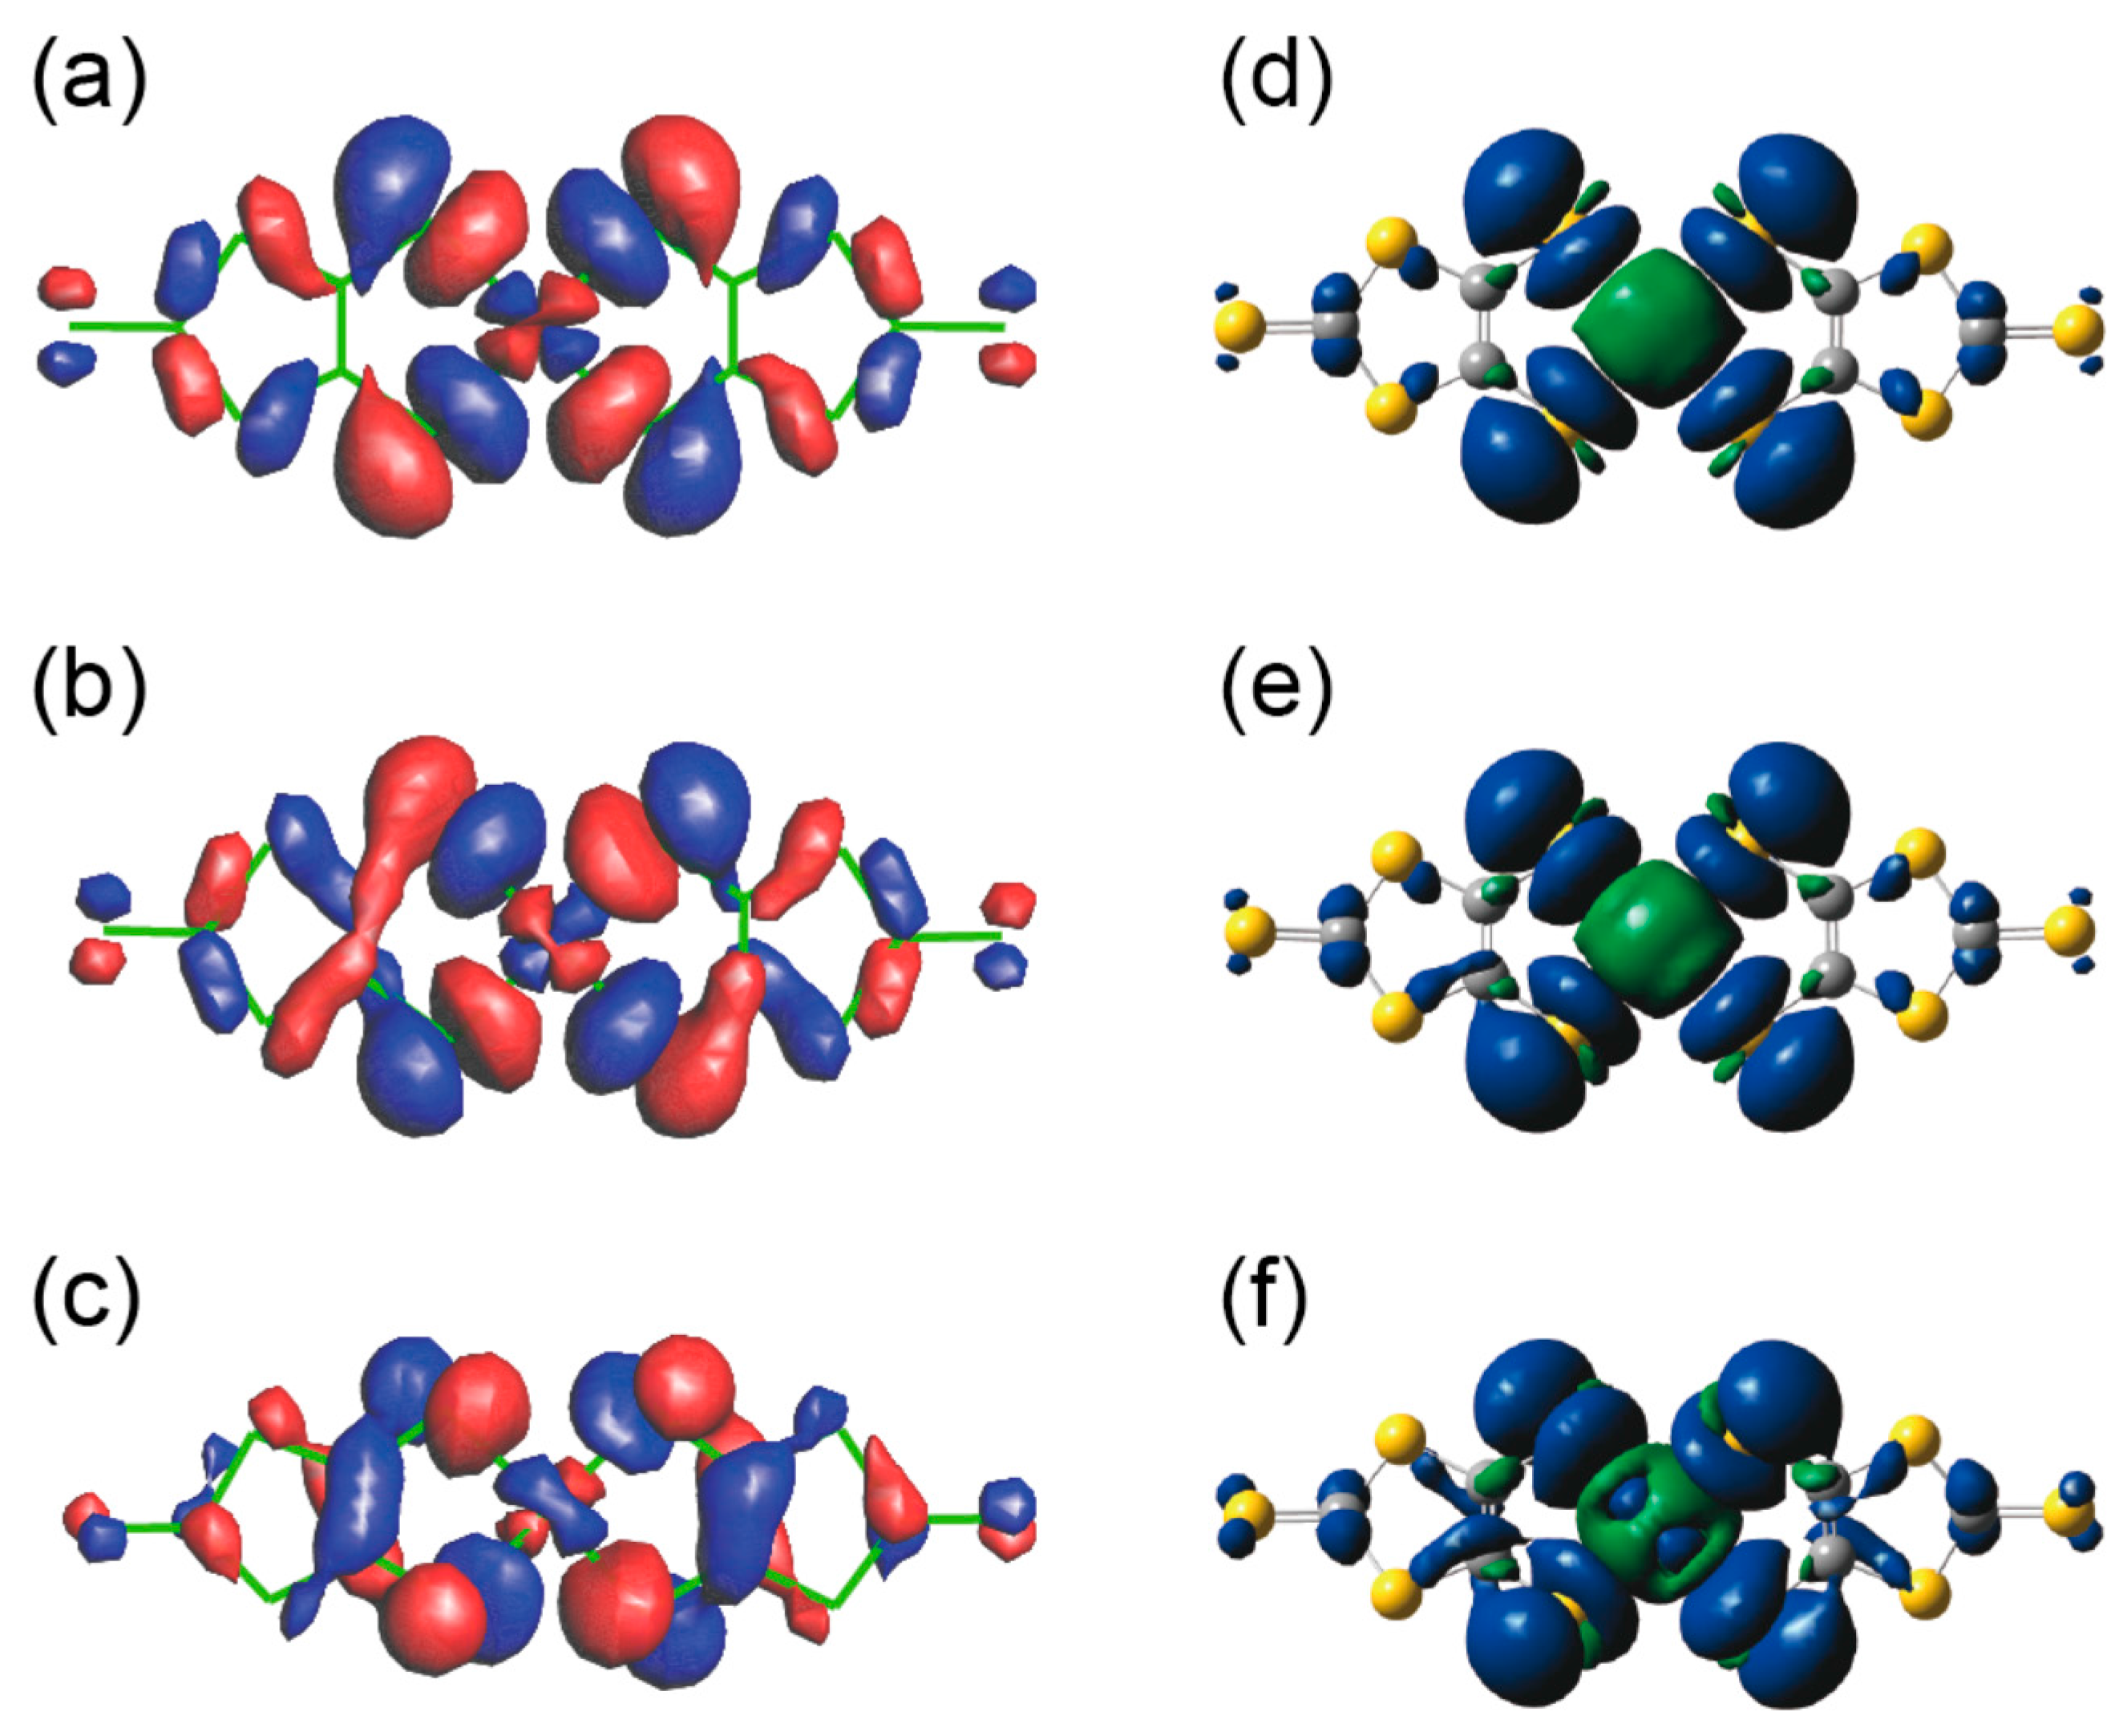
2.2. Molecular Structures and Spin Delocalization

Unlike other kinds of metal-dithiolene-complex anions, not only the crystal structures, but also the molecular structures of the [Cu(dmit)2]2− anions vary with the counter-ion (Figure 2). The geometries at the metal center (CuS4) are almost square-planar, slightly distorted square-planar and distorted-tetrahedral in 13, respectively. Such flexibility of the CuS4 geometry has been known for long [56,57,58,59,61,62,63,64,65,66,67,68], yet the reason for their thermodynamical stabilities has never been discussed by considering both crystal and molecular structures. The structure of the [Cu(dmit)2]2− anions in 2 is unique in that it is also distorted along the long molecular axis, which is disadvantageous for delocalization energy of the dmit ligands. In order to elucidate whether the crystal structures affect the coordination geometries or not, the structural optimization of the [Cu(dmit)2]2− anions as isolated molecules was carried out using Gaussian 09 [69]. The results indicate that both the planar and non-planar coordination geometries are stable and that the stable structure depends on the initial structure (Figure S2). Assuming the initial structures to exist as observed in 1 and 3, the optimized structures do not significantly differ from the initial structures, respectively. This means that the molecular structures of the [Cu(dmit)2]2− anions are governed by their own stability and are not governed by intermolecular interactions in the solid state. The calculation results indicate that the differences in stability between the square-planar (like that in 1) and distorted-tetrahedral (like that in 3) coordination geometries are small (~0.1 eV) and are subject to subtle conditions of crystallization. This situation realizes the flexibility and variety of the coordination geometries, i.e., the degrees of freedom in the molecular structures of the [Cu(dmit)2]2− anions. However, the same calculation for 2 gave a rather different molecular structure from the initial, i.e., the observed structure in the crystal (Figure S2). The optimized structure is close to that for 3, a distorted-tetrahedral geometry with planar ligands. Thus, the molecular structure in 2 is affected by surrounding chemical species in the solid state, resulting in a uniquely-distorted structure. Such a “frustrated” molecular structure can be related to unusually small g-values observed for 2 discussed below. Figure 4 shows the SOMOs (SOMO = the singly-occupied MO) and spin densities calculated for 13 using Gaussian 09. The electron densities are distributed with high symmetry over the entire molecule in all three salts 13. Similarly, the spin distributions do not differ from each other in 13. The extent of delocalization of the unpaired electrons at the Cu2+ ions was experimentally examined by measurement of the electrical resistivity, the magnetic susceptibility and the electron spin resonance (ESR), as discussed in the next section.

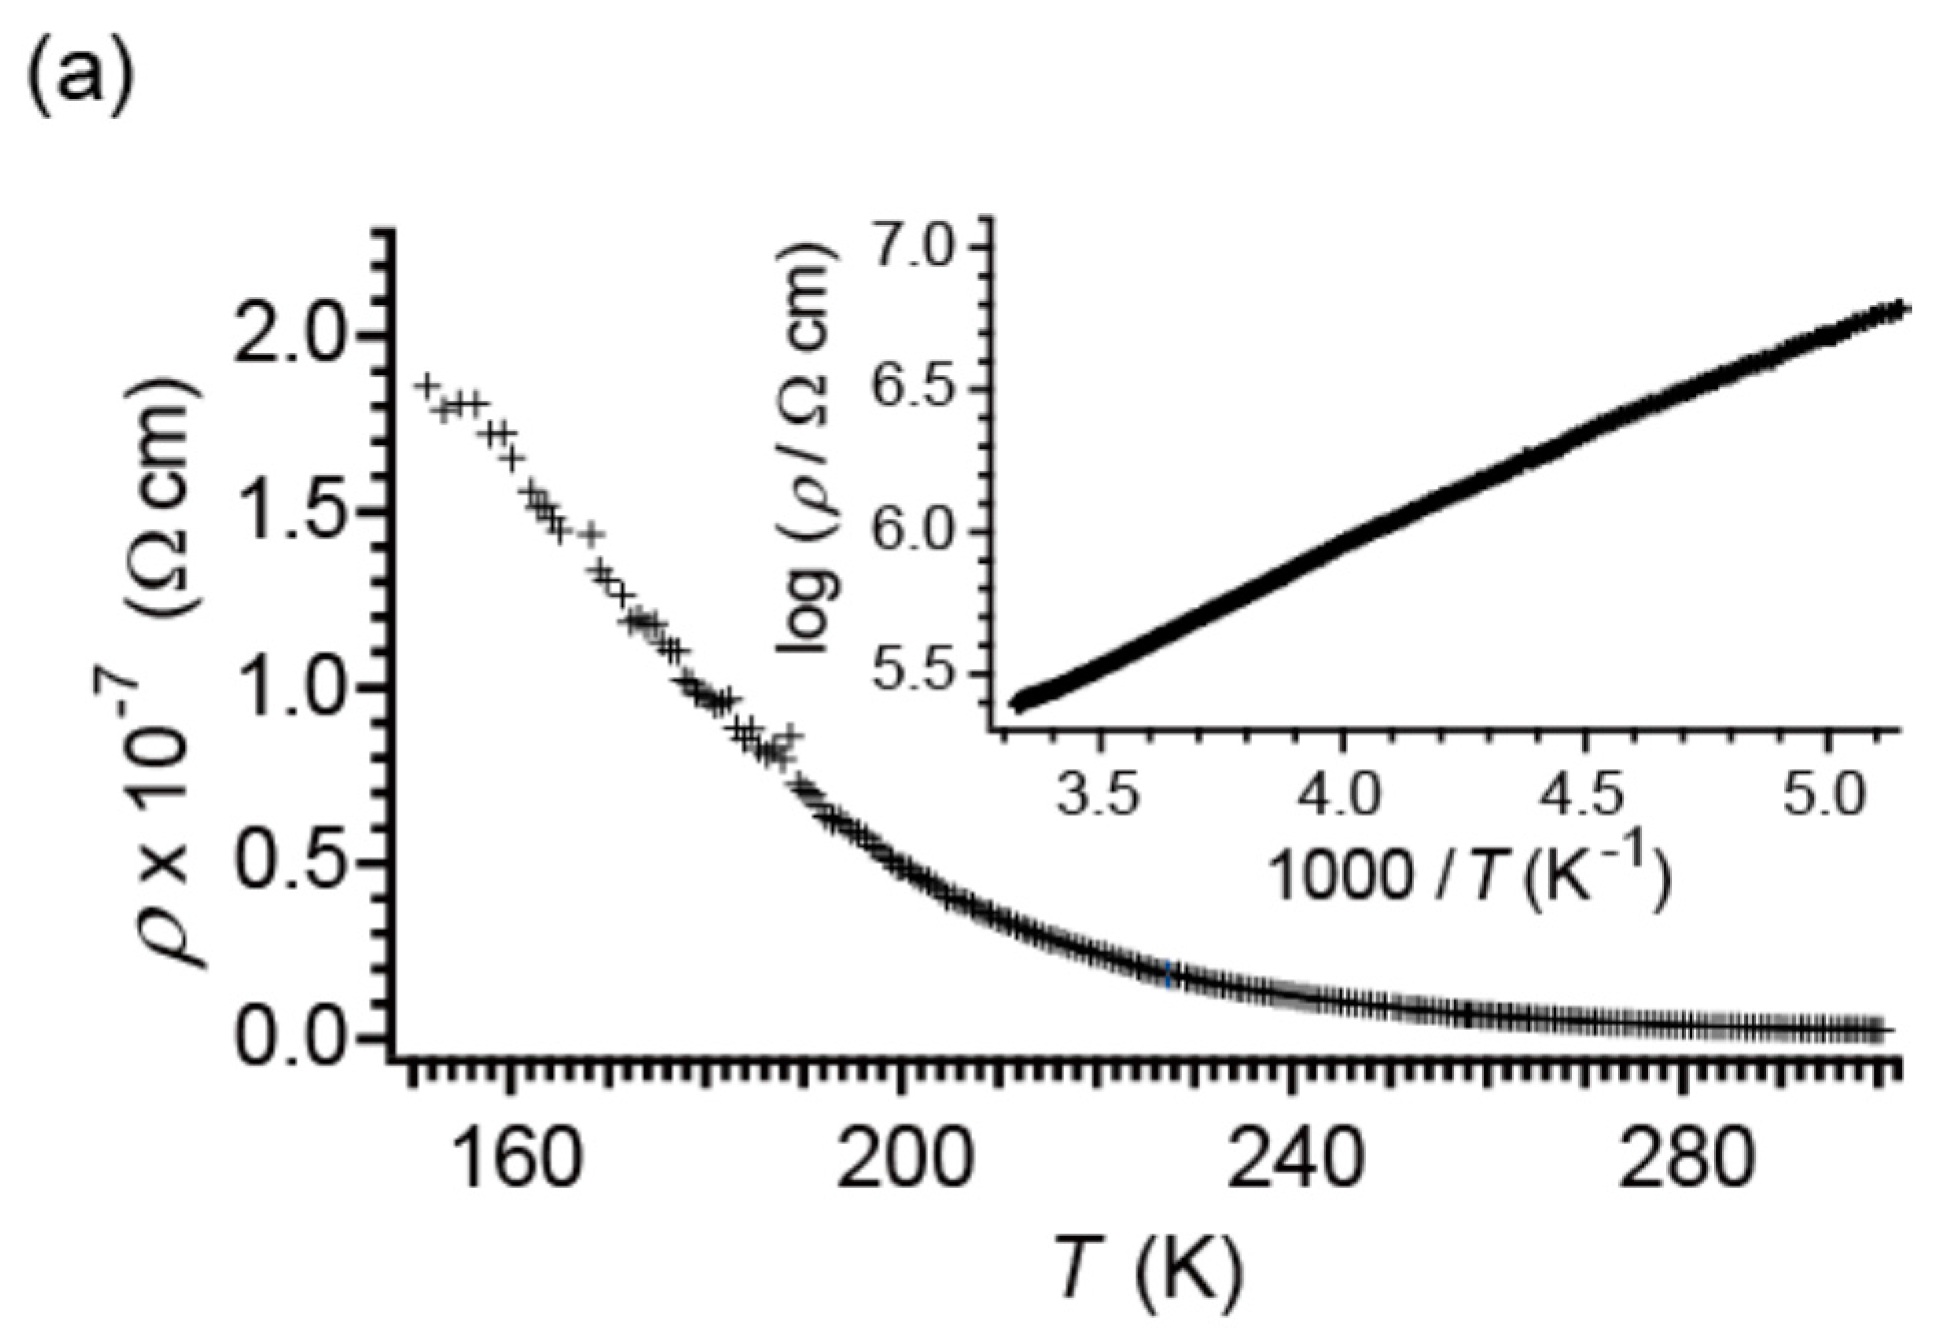
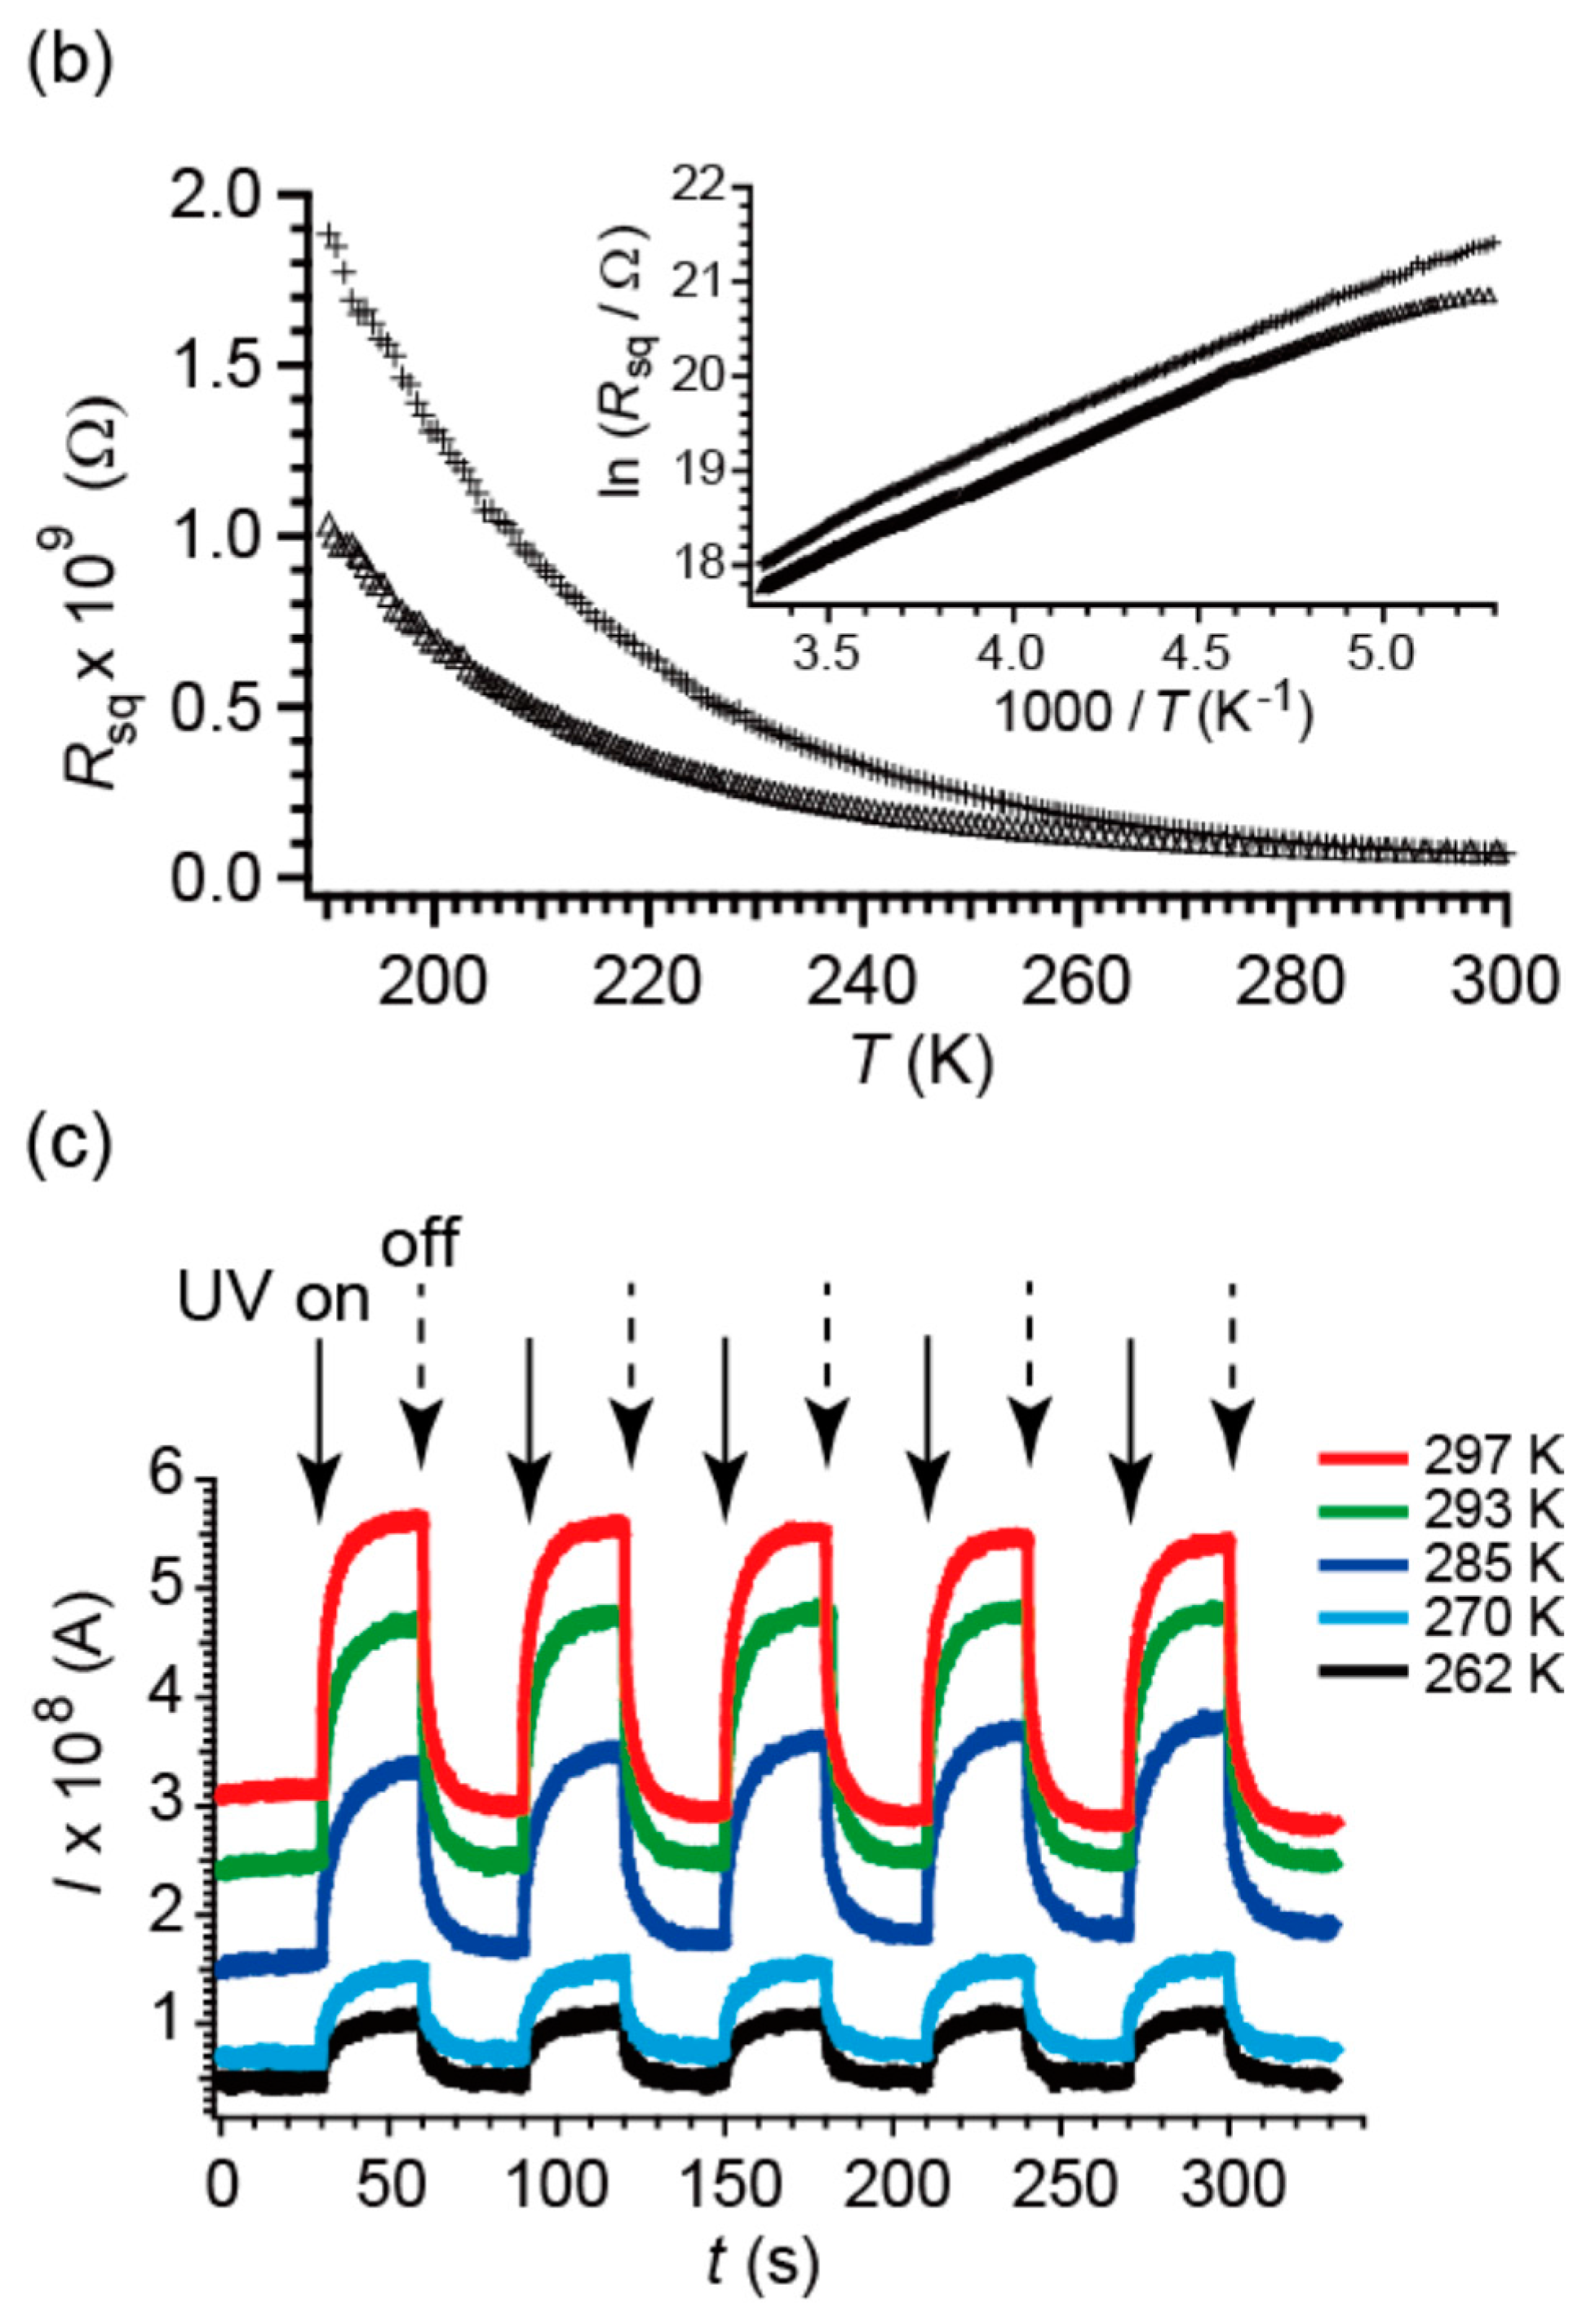
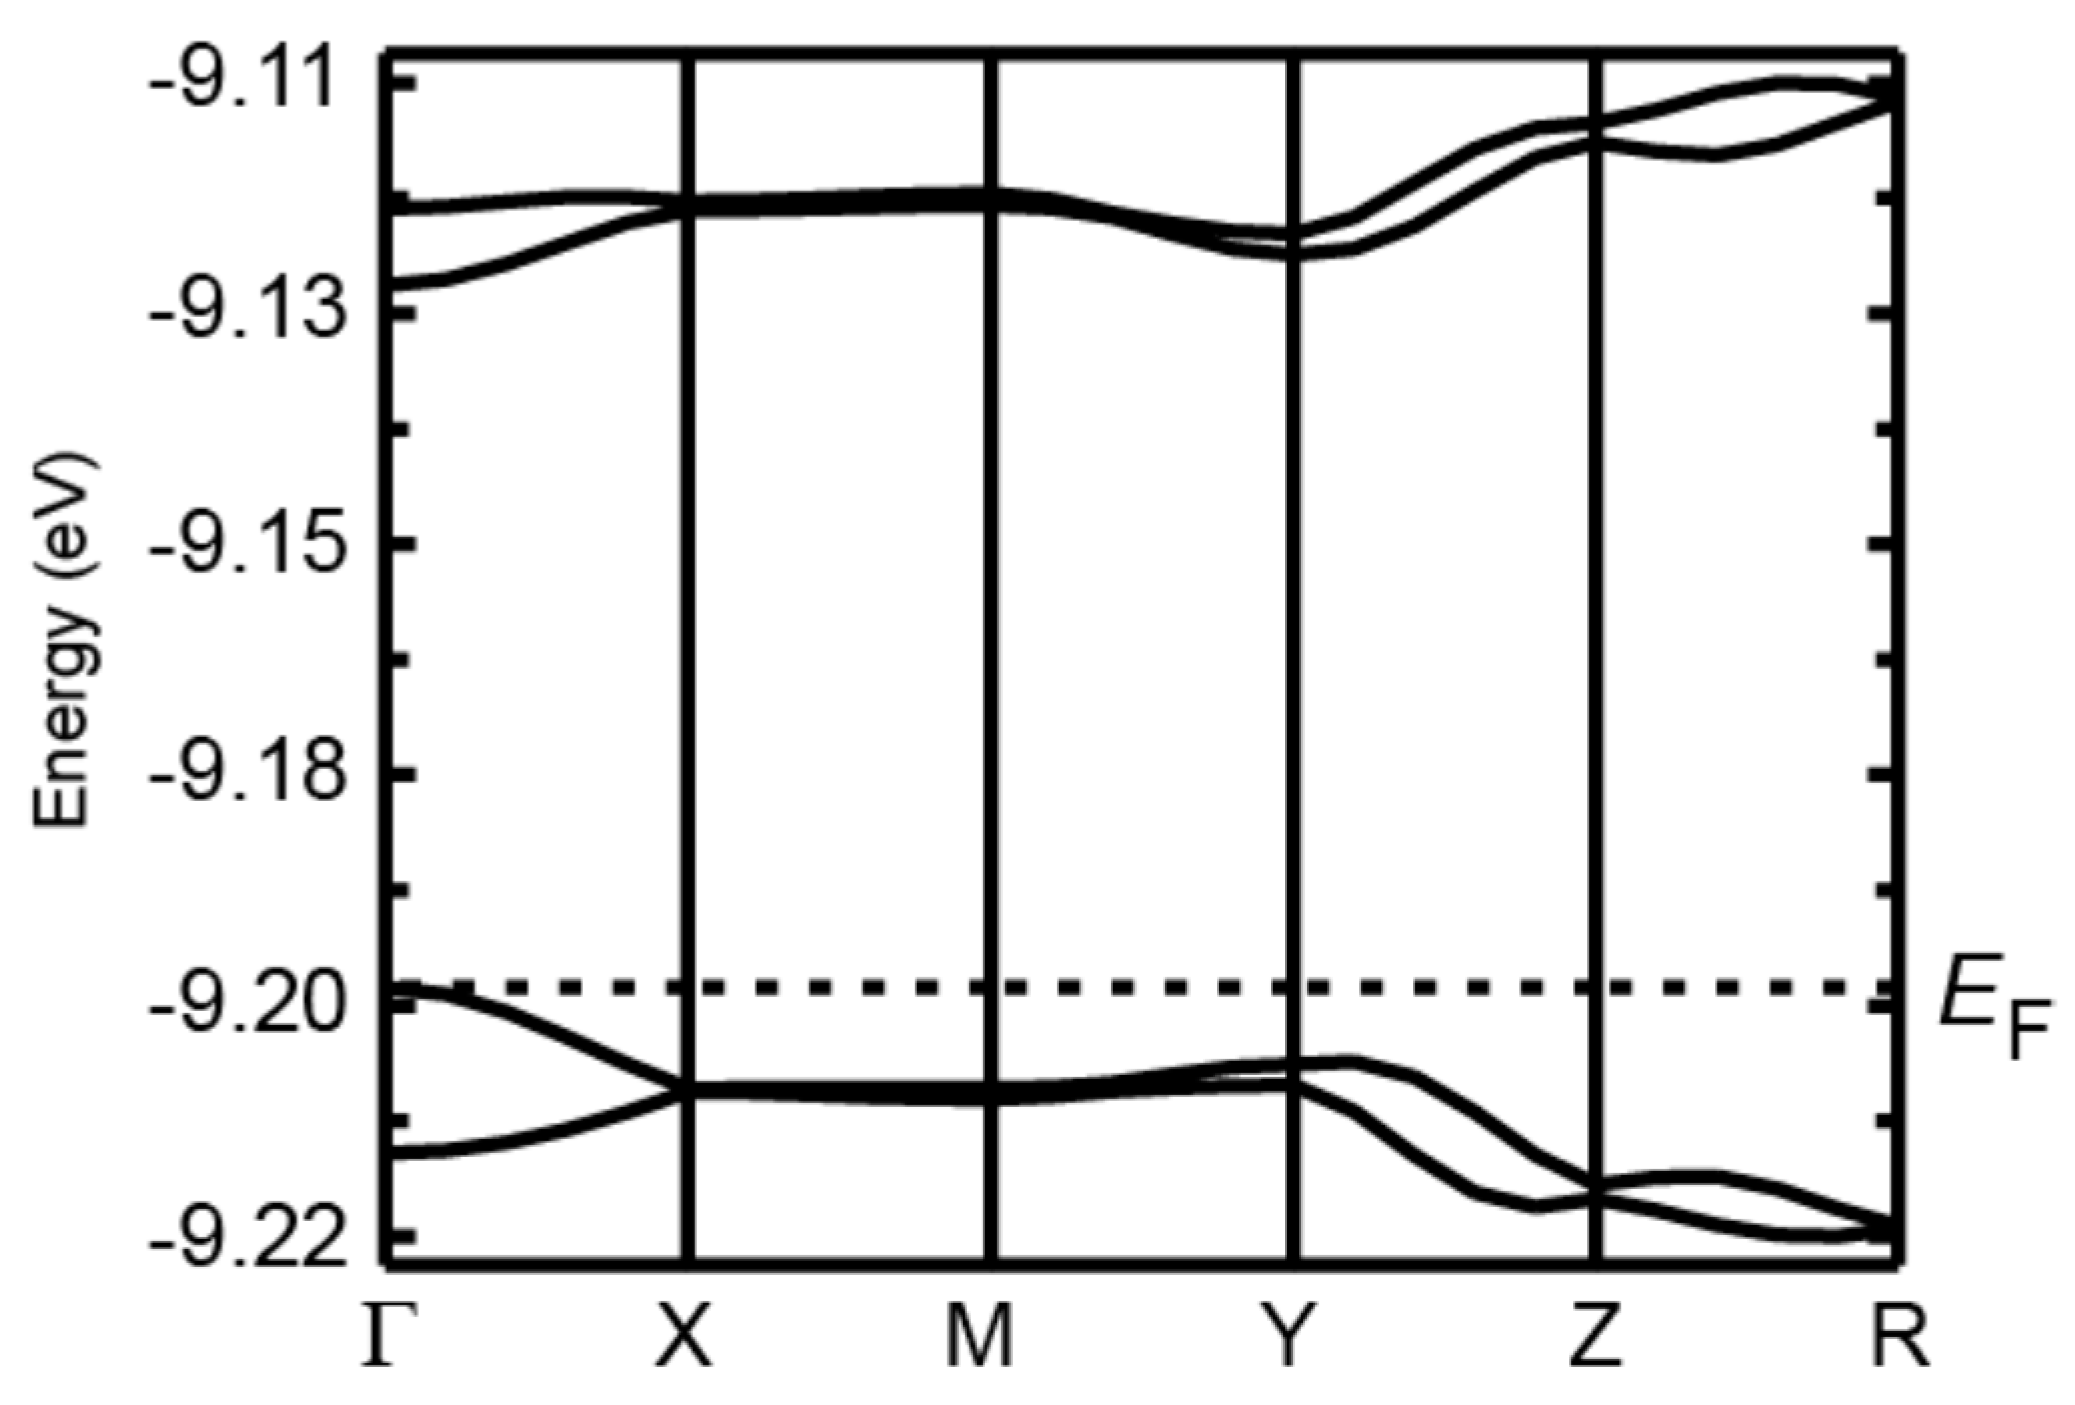
2.3. Electrical Properties under Dark Conditions

Irrespective of the relative direction of the applied electric field, salts 1 and 3 are insulators (>107 ohm·cm at 300 K). On the other hand, resistivity measurements along the b-axis indicate that 2 is a semiconductor at room temperature (298 K), with a resistivity ρRT of = (6.5 ± 3.5) × 105 ohm·cm and an activation energy Ea of = 0.15 ± 0.02 eV (Figure 5a). These observations are qualitatively consistent with the crystal structures described above. However, the calculated energy gap (~0.06 eV) is significantly smaller than that estimated from the observed Ea, i.e., the gap is estimated to be 2Ea~0.30 eV. This inconsistency suggests that electron correlation effects are strong in 2, since the tight-binding approximation does not take them into consideration. The correlation effects originate from electron–electron Coulombic repulsion and often open a band gap at EF [70].

2.4. Electrical Properties under UV Irradiation

Upon UV irradiation (250–450 nm; 3 Wcm−2), only 2 exhibited a response; the resistivity clearly decreased. The temperature dependence of the resistivity under continuous UV irradiation is shown in Figure 5b. As shown in Figure 5c, the change in the resistivity was quick and reversible upon the commencement/cessation of UV irradiation; the resistivity instantly increased/decreased. The observed current ratio between dark and UV irradiated conditions IUV/Idark gradually increased with decreasing temperature: ~1.7 at 297 K, ~1.8 at 293 K, ~1.9 at 285 K, ~2.0 at 270 K and ~2.1 at 262 K. This is quantitatively consistent with the temperature dependency of the resistivity under dark and UV irradiated conditions (Figure 5b). Since the activation energy remains fundamentally unchanged during irradiation and since the resistivity change upon irradiation is small, the thermally-excited carriers and the photoexcited carriers are considered to coexist, and the former should be dominant in 2. This observation suggests that the molecular and crystal structures in the photoexcited states remain practically unchanged, since both activation energy and conductivity remain practically unchanged under irradiation. This interpretation is experimentally corroborated by the ESR measurements discussed below.

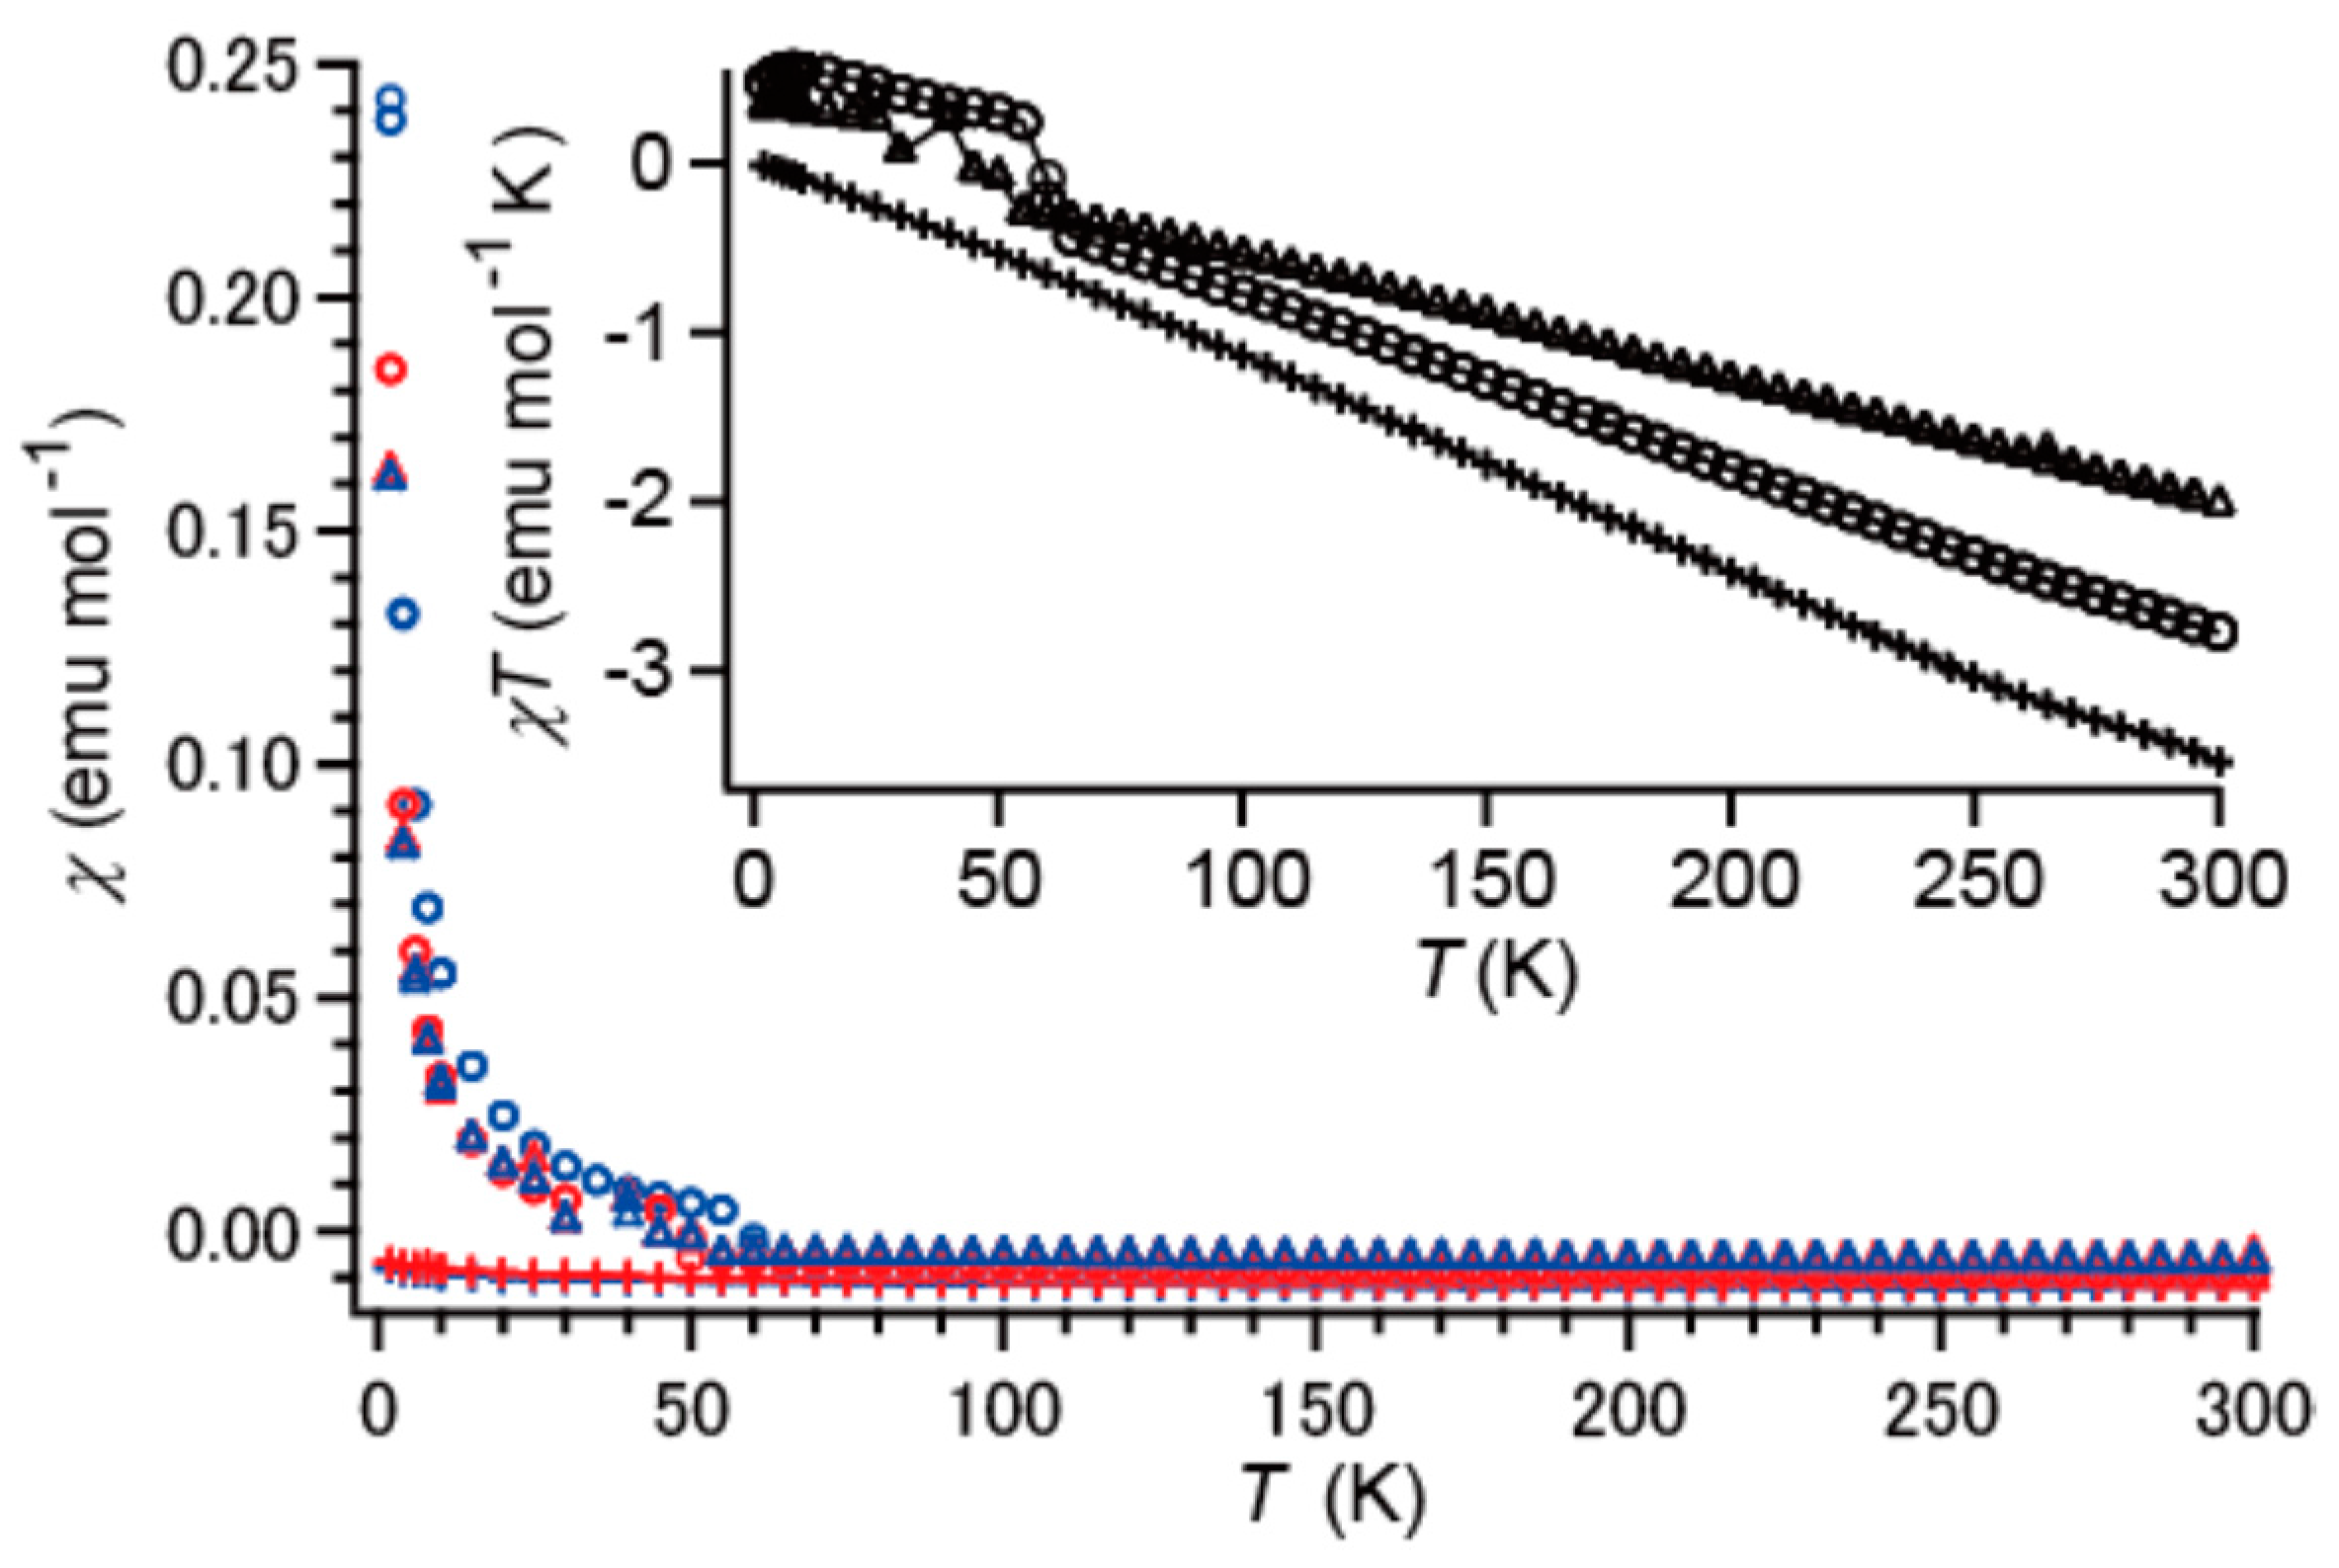
2.5. Magnetic Susceptibilities under Dark Conditions

The temperature (T) dependence of the magnetic susceptibilities (χ) of 13 clearly shows that all are diamagnetic (Figure 6). Both the zero-field-cooling and field-cooling processes were examined and were confirmed to yield identical results within experimental error. The increases in χ at low temperature (T ≤ 50–60 K), as well as small jumps in χ at ~50 K suggest that 1 and 2 contained impurities, such as oxygen adsorbed on the sample. Curve-fitting analyses using Equations (1) (for χ vs. T) and (2) (for χT vs. T) consistently and unambiguously distinguished the intrinsic behavior from those of impurities:
χ o b s = C T + χ d i a
χ o b s T = χ d i a T + C
where χ o b s ,   χ d i a and C designate the observed χ, the diamagnetic contribution from the samples and the paramagnetic contribution from impurities, respectively. The diamagnetic susceptibilities obtained ( χ d i a × 10 2 (emu mol−1)) for 13 are −1.06 ± 0.05, −1.24 ± 0.03 and −0.80 ± 0.08, respectively. The observed diamagnetism of 13 means that the unpaired electrons on the [Cu(dmit)2]2− anions interact with each other rather strongly in antiferromagnetic ways in all three of the salts and that there are no phase transitions at 2–300 K in any of them. The diamagnetism is a rather unexpected result, since all of the intermolecular distances in the [Cu(dmit)2]2− anions of 13 are long. Such long-range spin–spin interactions are known as “through-space” interactions [71]. The observed diamagnetism for the three salts is consistent with their insulating properties at the ground states.

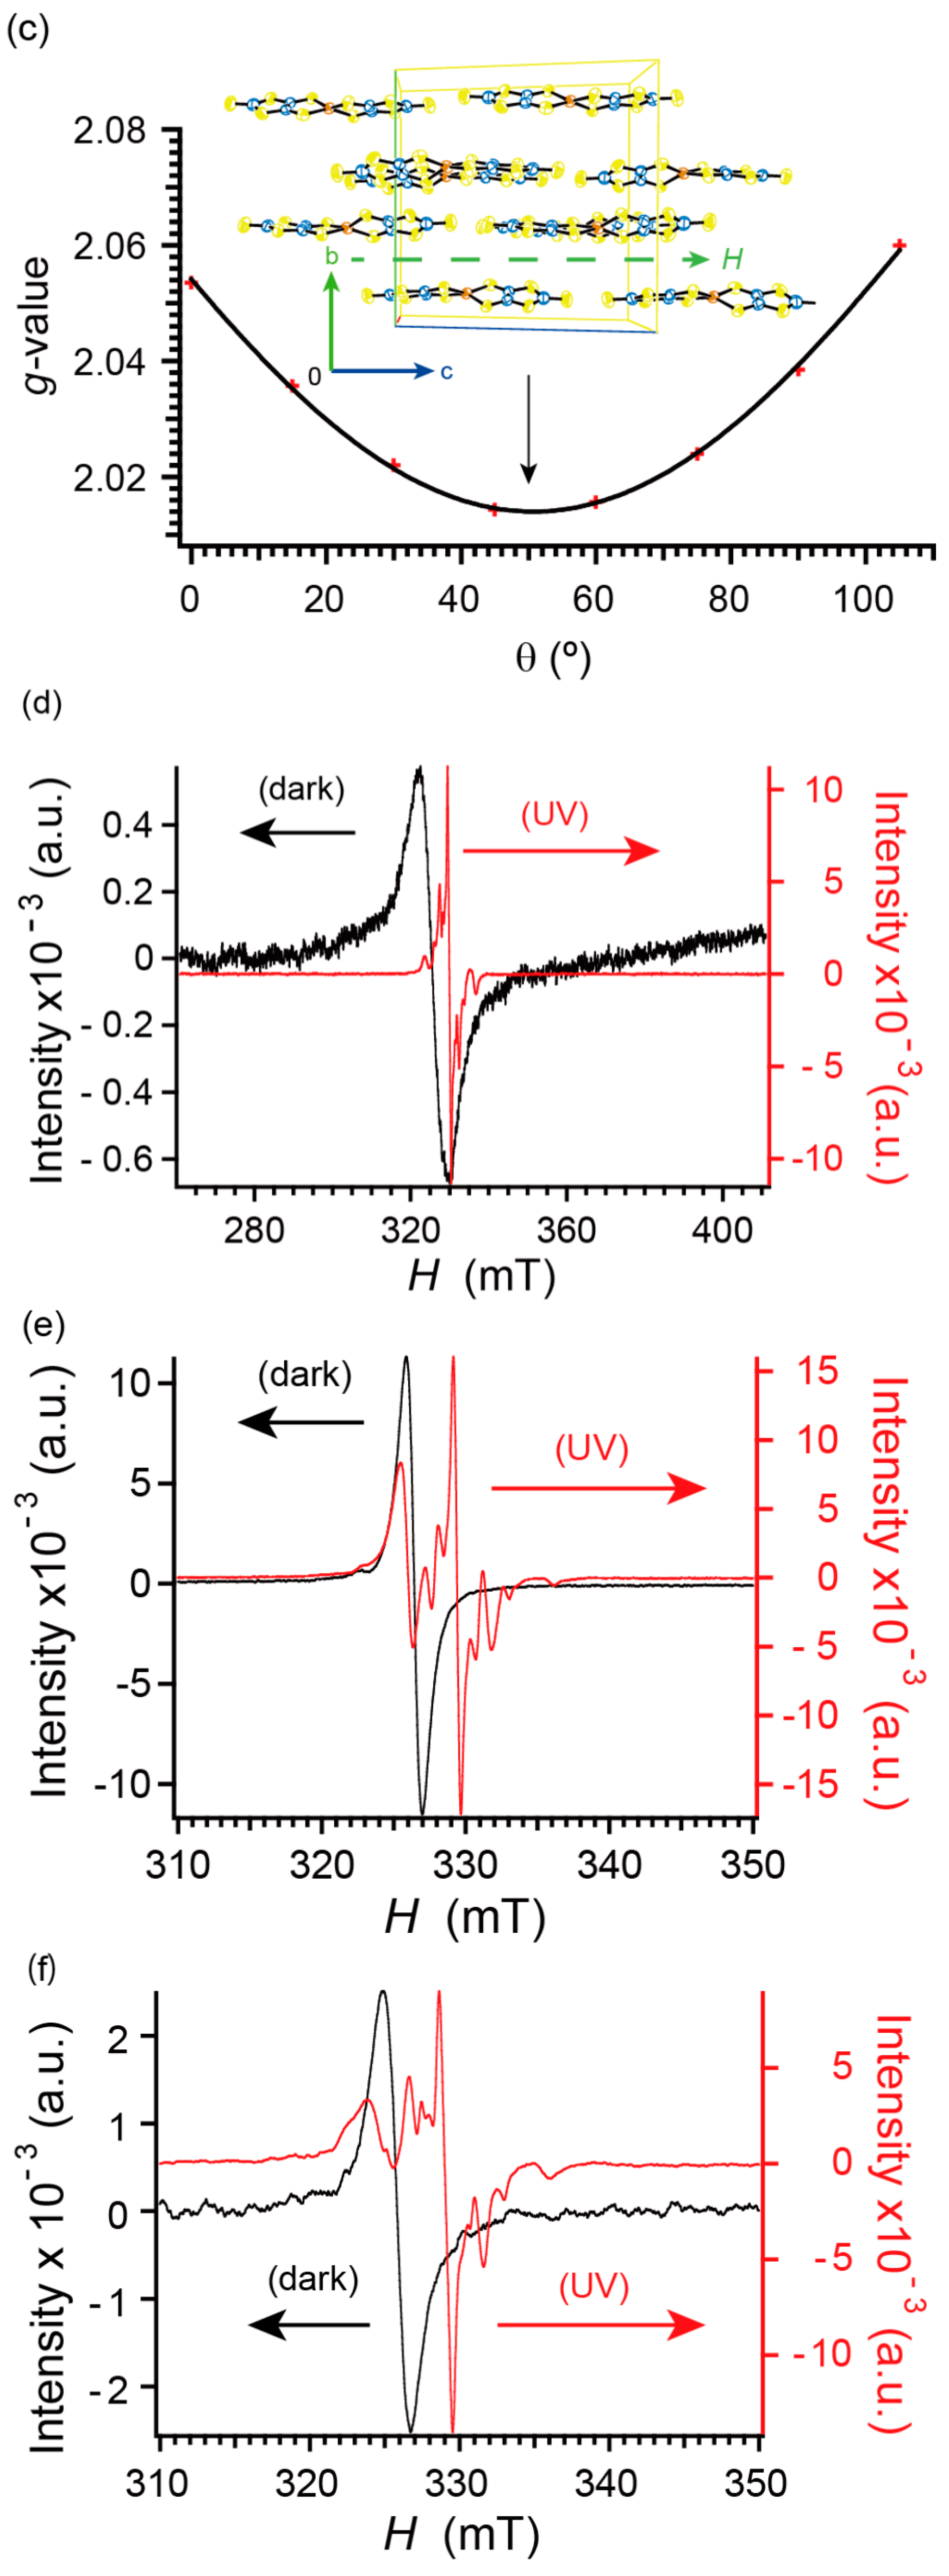
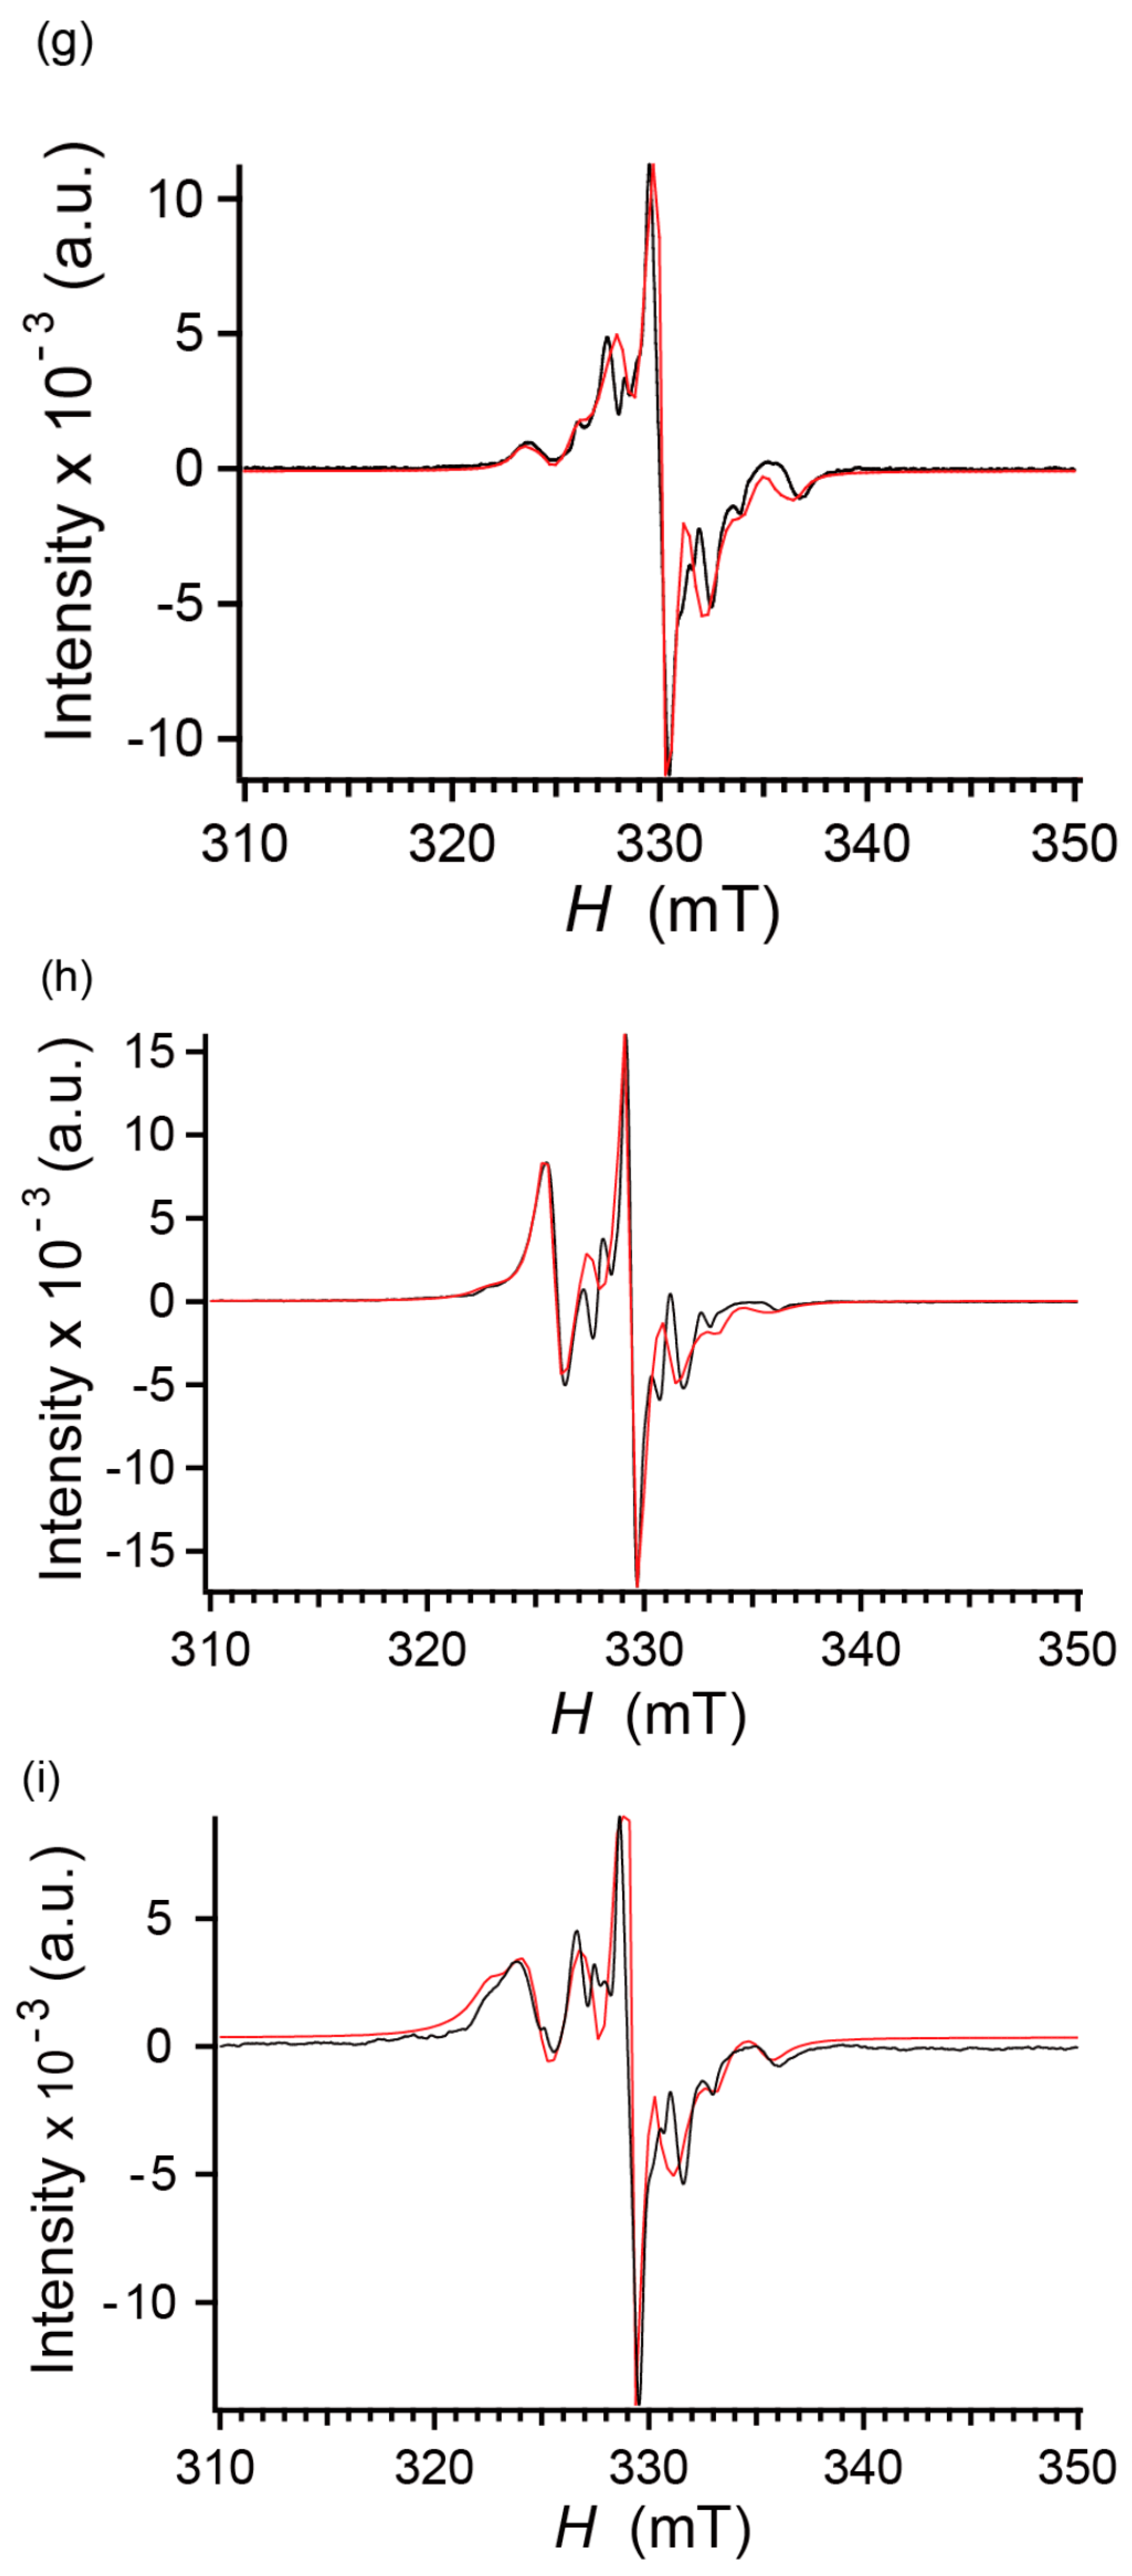
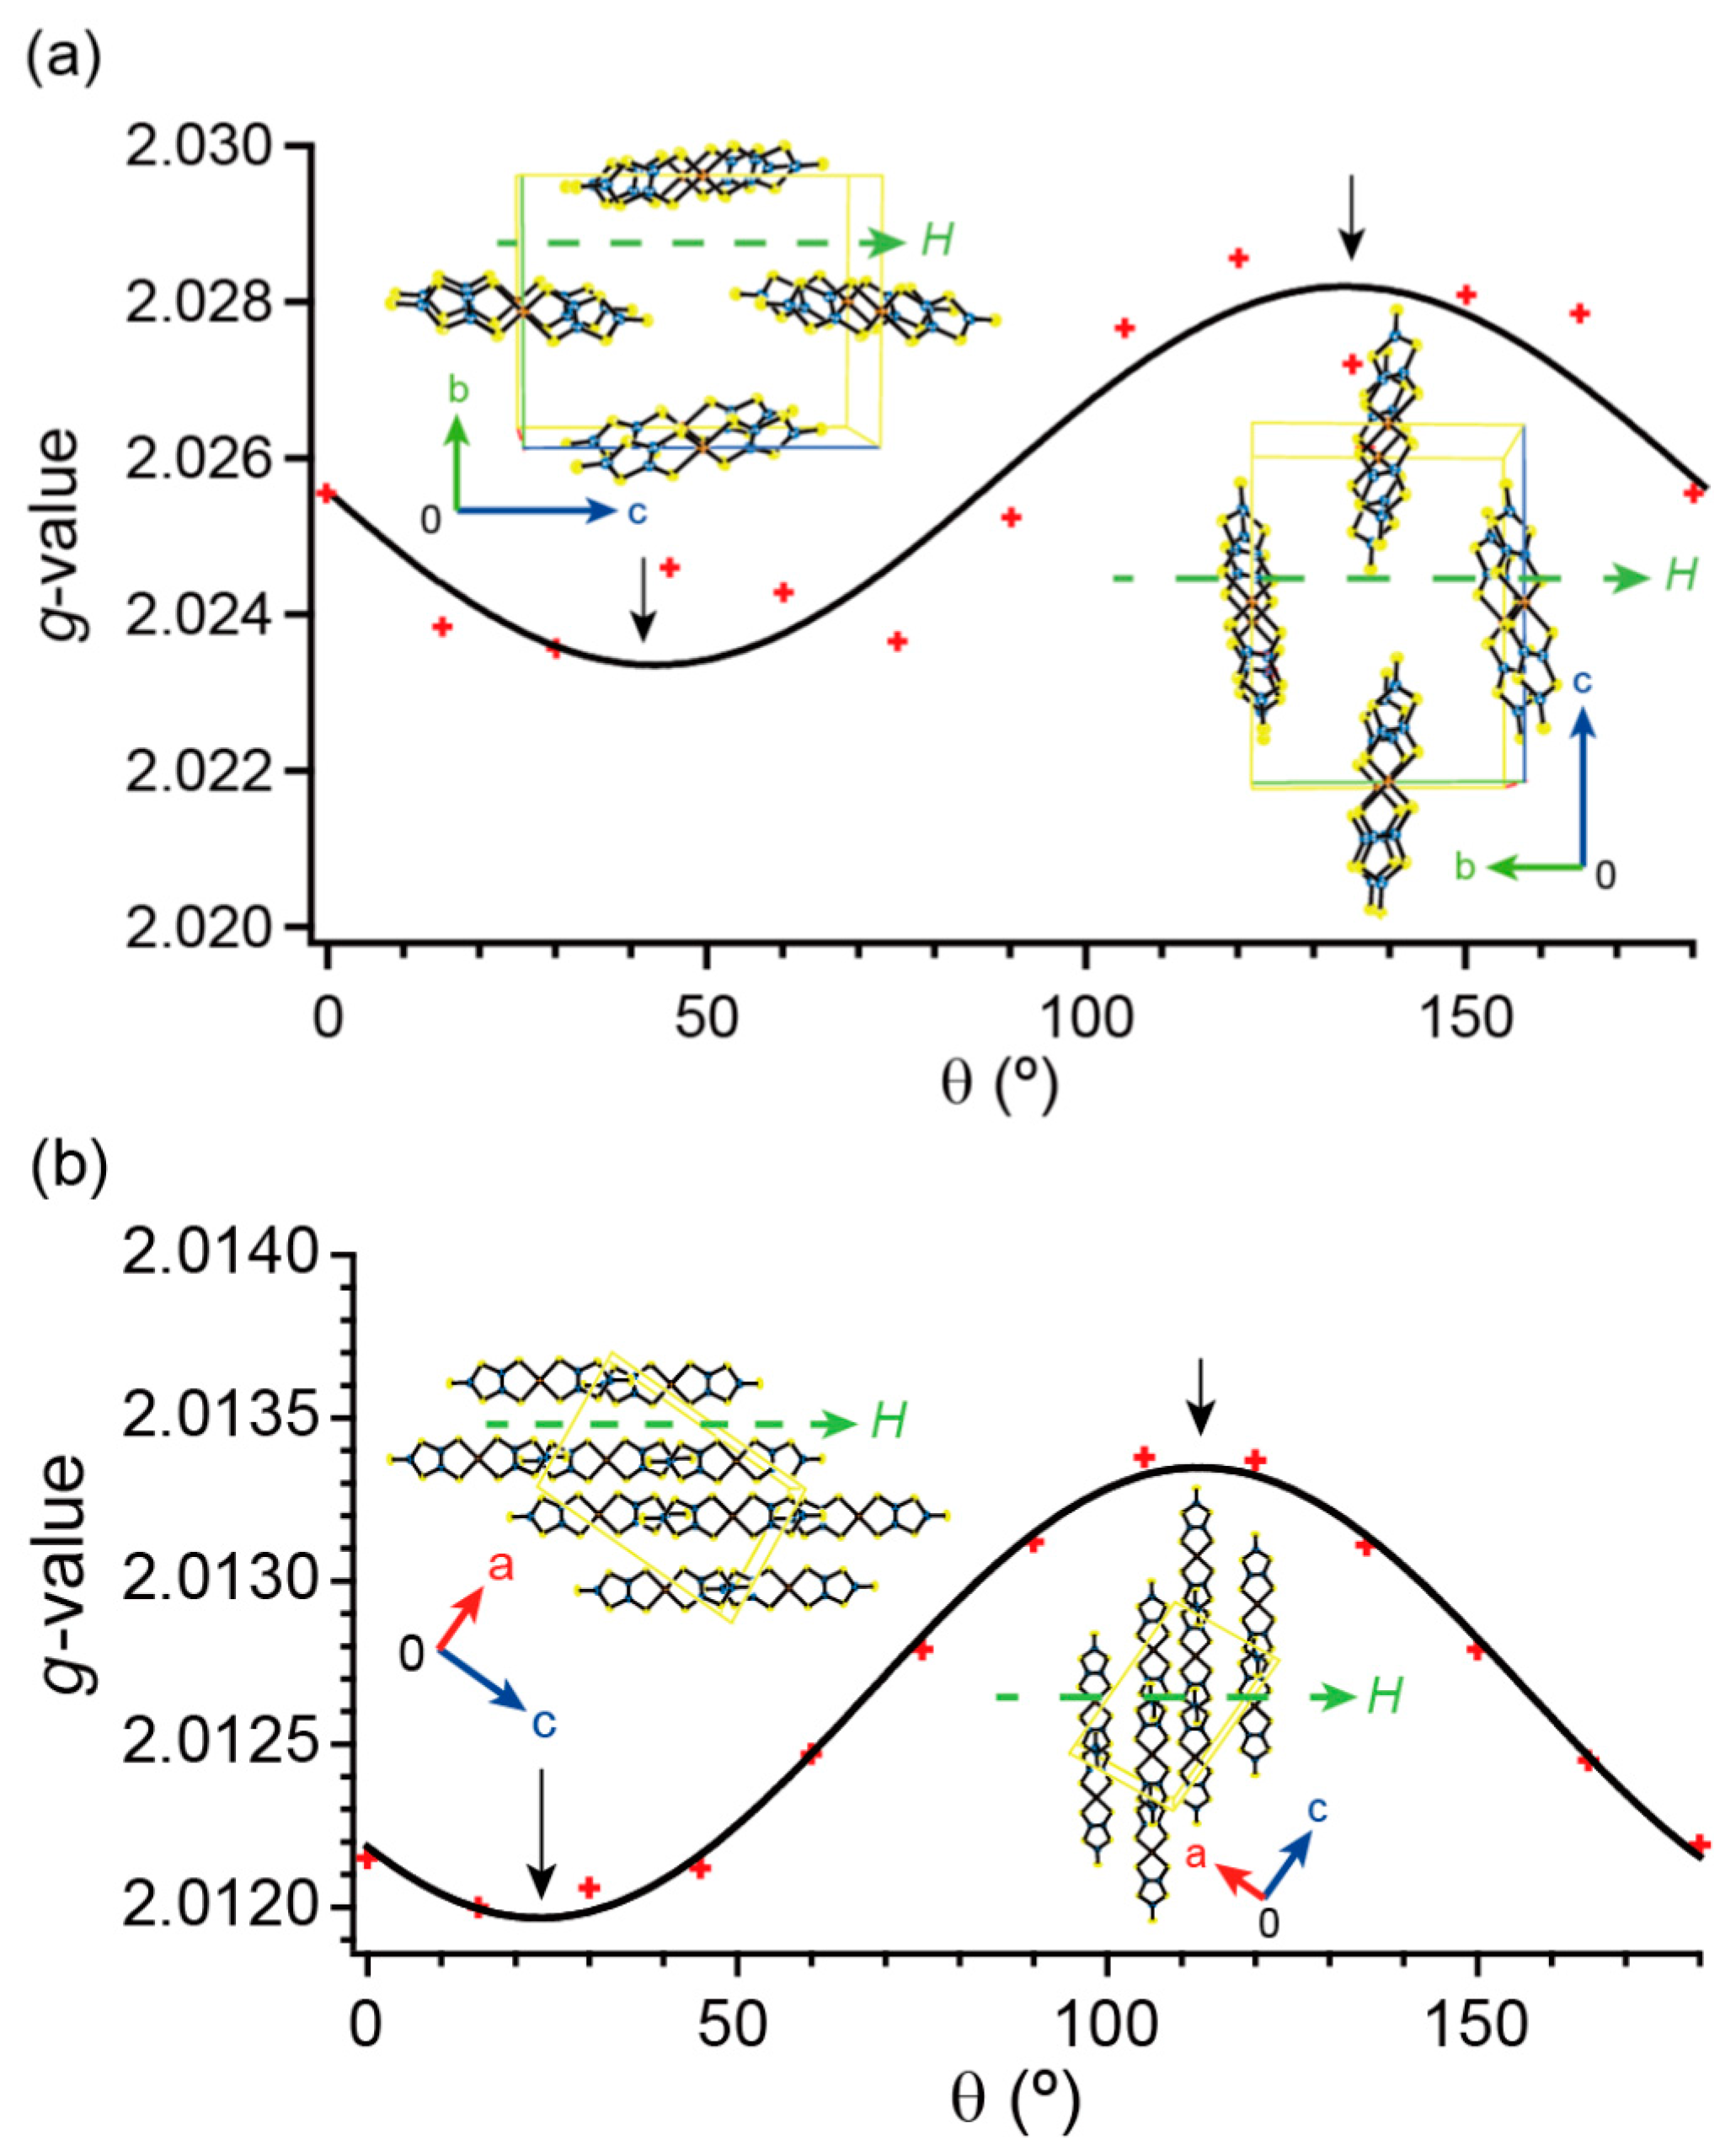
2.6. Electron Spin Resonance under Dark Conditions

Next, we should discuss the ESR spectra under dark conditions. In the following discussion, g-values and their anisotropies in this work mean those averaged in an entire crystal instead of those for isolated molecules. The latter properties of [Cu(dmit)2]2− are reported using solution- [63] or magnetically-diluted single-crystalline samples [62]. The angle (θ)-dependence of the g-values for 13 is shown in Figure 7a–c. Since all of the spectra under dark conditions were symmetric without fine structures, the g-values were approximately estimated from the maxima of the integrated ESR spectra. The θ-dependence indicates that the g-values are in the range of ~2.01–2.06, depending on the relative angle of the applied field and the salts. For comparison, the calculated g-values, i.e., the principal values of g-tensors for the isolated [Cu(dmit)2]2− anions, using Gaussian 09 based on the optimized molecular structures are gxx = 2.0403, 2.0314, gyy = 2.0644, 2.0407 and gzz = 2.0919, 2.1210 for 1 and 3, respectively. The observed g-values for 1 (2.024–2.028) and 3 (~2.02–2.06) are smaller than the calculated values and those generally observed for Cu(II)-complexes (for the spectra measured with internal standards, see Figure S7 in the Supplementary Materials). Larger g-values were observed in other directions under dark conditions (2.02–2.04 for 1, 2.02–2.09 for 2 and 2.02–2.05 for 3; Figure S8 in the Supplementary Materials). Thus, the observed g-values indicate rather large anisotropy of the three salts under the dark conditions. Both observed g-values and their θ-dependence are smaller in 2 than in 1 and 3, because the single crystals were rotated in such a way that the magnetic field was always approximately in the molecular plane of the [Cu(dmit)2]2− anions in 2, while the magnetic field was rotated between nearly parallel and nearly perpendicular to the molecular planes in 1 and 3. The minima and maxima of the g-values are consistent with the crystal structures. For 1, θ~45° (minimum) and θ~135° (maximum) coincide with where the long molecular axis of all of the [Cu(dmit)2]2− anions becomes nearly parallel with and perpendicular to H, respectively. For 2, θ~25° (minimum) and θ~115° (maximum) also coincide with where the long molecular axis of [Cu(dmit)2]2− becomes nearly parallel with and perpendicular to H, respectively. Similarly, for 3, θ~50°(minimum) coincides with where the long molecular axis of [Cu(dmit)2]2− becomes nearly parallel with H. ESR signals were observed only for ~15° ≤ θ ≤ ~90° in 3. The signal almost disappeared in other directions (Figure S3 in the Supplementary Materials). This is consistent with the following explanation. In 3, the observed S–S distances (<4.0 Å) (Figure S6 in the Supplementary Materials) suggest that every pair of [Cu(dmit)2]2− anions should closely interact with each other to form a weak dimer. The overlap and the transfer integrals within the dimer are calculated to be 1.5 × 10⁻³ and −0.03 eV via an extended Hückel method. The calculated values of these integrals suggest that the interactions should be moderately strong and antiferromagnetic, which is supported by the observed diamagnetism (Figure 6). The best fitting parameters for a simulation of the observed ESR spectra (Tables S4, S6 and S8 in the Supplementary Materials) are comparable or consistent with those of related compounds [35,37]. The observed and simulated ESR spectra under dark conditions for 13 well agree with each other (Figure S4 in the Supplementary Materials). The ESR spectra under dark conditions can be interpreted as follows. The signals observed for 13 in the dark originate from the spin delocalized over the [Cu(dmit)2]2− anions. The anisotropy mainly originates from that of the molecular orbital geometries. The hyperfine structures characteristic of the spin on Cu(II) generally observed in various Cu(II)-complexes were not observed in 13. The reason is considered to be a broadening effect caused by the following two kinds of interaction; intermolecular antiferromagnetic interactions and spin-orbit coupling on the sulfur atoms in the ligands (dmit).

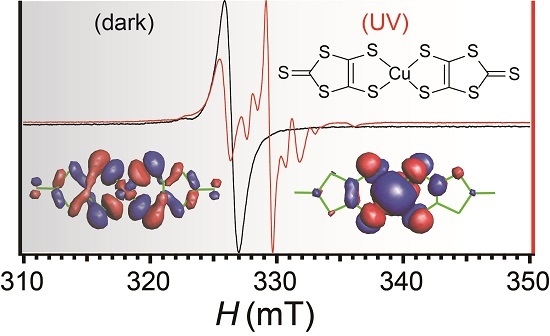
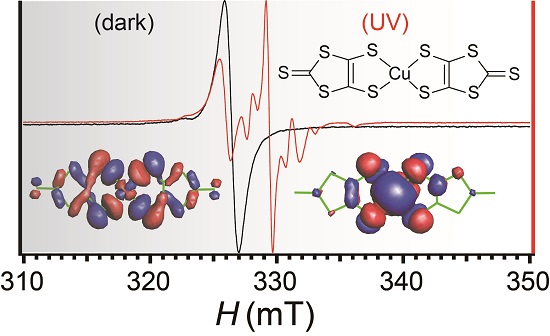
2.7. Electron Spin Resonance under UV Irradiation

Under UV irradiation (250–450 nm), clearly different ESR spectra were obtained for all three salts from those obtained in the dark (Figure 7d–f); the intensities obviously increased, and hyperfine structures appeared for 13. This means that the UV excitation of the unpaired electrons alters their distribution from delocalized to localized pictures. After ceasing irradiation, the spectra recovered their original shapes, and the reversibility was confirmed via repeated measurements on different single crystals. In 13, an energy of 250–450 nm (2.75–5.00 eV) brings about excitation from an orbital φb to a higher orbital φa, comprised of Cu2+ d-orbitals and dmit2− π-orbitals from a molecular orbital perspective (Figure S9 in the Supplementary Materials). Firstly, we should consider the origin of ESR signals under UV irradiation. As for 1 and 2, the possible final states, i.e., φa, by the excitation of 250–450 nm are limited to several groups of degenerate bands. They are those around −5.02 eV (#311–312), −5.94 eV (#309–310) and −5.96 eV (#307–308) in 1 (Figure S1a,b in the Supplementary Materials) and those around −4.83 eV (#429–432) and −5.56–6.14 eV (#421–428) in 2 (Figure S1e,f) in the Supplementary Materials, respectively. Their energies from the Fermi levels correspond to the wavelengths of 299, 384 and 386 nm for 1, while 284, 342 and 407 nm for 2, respectively. These excitation energies are consistent with the solution spectra containing the [Cu(dmit)2]2− anions (Figure 8a). All of these excited states are almost purely (>99.9%) comprised of the MOs of the [Cu(dmit)2]2− anions, and the cations’ contribution is negligible. For 1 and 2, all of the ESR spectral features under UV irradiation must originate from the excited [Cu(dmit)2]2− anions, because the cations do not absorb light in 250–450 nm (Figure 8). On the other hand, in 3, the TBBC results suggest that there should be anion-cation mixed bands around −5.9 eV (Figure S1k in the Supplementary Materials), i.e., 3.5 eV ≈ 355 nm above the EF (~−9.4 eV). This means that CT transitions from the anion to the cation can occur under UV radiation of 250–450 nm for 3. In addition, the solution spectra (Figure 8a) show that the cation in 3 strongly absorbs UV light shorter than ~300 nm (≥4.1 eV). Thus, UV radiation of 250–450 nm can cause local excitations in the BP2DBF2+ cations. The possibilities of the CT transitions and the local excitations consistently suggest the existence of unpaired electrons on the BP2DBF2+ cations during UV irradiation upon 3. On the other hand, the orbitals, located immediately below EF, are primarily comprised of a dmit2− contribution (70%, 71% and 78% for 1, 2 and 3, respectively, based on a TBBC). There are several degenerate bands at EF or immediately below EF in 13 originating from the fact that there are several [Cu(dmit)2]2− in their unit cells. However, their dmit contributions are almost equal in the respective materials; the differences are less than 0.1% among the degenerate bands. All spectra were analyzed on this basis and were reproduced by simulations considering anisotropy, nuclear magnetic moments and natural abundances of isotopes of the magnetic nuclei in the [Cu(dmit)2]2− anions (for 1 and 2) or in both the anions and the cations (for 3) (Figure 7g,i). The following factors are considered; 63Cu:65Cu = 69.09:30.91; nuclear magnetic moment βn = 2.2206 (63Cu) and 2.3790 (65Cu); 14N (I = 1, 99.635%). In the meantime, 33S (I = 3/2, 0.74%), 13S (I = 1/2, 1.108%) and 15N (I = 1/2, 0.365%) are ignored. Next, we shall discuss the spin distribution on the [Cu(dmit)2]2− anions based on the simulation results from a molecular orbital perspective. UV (250–450 nm) radiation reversibly increases the contribution from the spins on the copper atoms in all of the ESR spectra for 13; during UV irradiation, the Cu contribution increased from Irel (Cu) = 9%–38% for 1, 17%–31% for 2, and 13%–33% for 3, respectively (Tables S4–S9 in the Supplementary Materials). This observation is qualitatively consistent with the calculated band structures in that the copper atomic d-orbitals have larger contributions in the excited states φa than in the ground (dark) states φb; ψ(Cu) = 91% vs. 30% (the bands #307–312 at −5.97~−5.02 eV for 1), 89% vs. 29% (the bands #421–432 at −6.14~−4.83 eV for 2) and 82% vs. 22% (the bands #589–624 at −6.56~−4.96 eV for 3), respectively. Here is a point worthy of note. Now, the approximate g-values under UV irradiation are tentatively defined by the centers of the newly-emerged peaks during UV irradiation. This is confirmed to be a valid approximation by detailed analyses using spectral simulation (Figure S5 in the Supplementary Materials). Then, the observed g-values under UV irradiation are even smaller than those under dark conditions. They are comparable with that of free electrons (~2.0023) irrespective of the relative direction of H (Figure S7 in the Supplementary Materials). Such small g-values with almost no anisotropy have never been reported either for Cu(II)-complexes or transition-metal-dithiolene complexes. This can be explained by the characteristics of SOMOs of various [M(dmit)2] radical anions in excited and ground states in a unified picture. Unpaired electrons either delocalized in the extended dithiolene π-orbitals or localized in the metal (except for Cu) d-orbitals generally exhibit larger g-values due to spin-orbit coupling with many sulfur atoms or with anisotropic d-orbitals. In both cases, the spin-orbit coupling enhances the anisotropy of the g-values at the same time. This trend is slightly observed in the dark states of 13 and is more evident in the M(dmit)2 radical anions (M = Ni, Pd, Pt, etc.) under dark conditions, where the hybridization between ligands’ π- and metals’ d-orbitals (π–d mixing) is less important than that in the [Cu(dmit)2]2− anions (Table S14 in the Supplementary Materials) [68,72,73,74,75,76,77,78,79]. In contrast, whether under dark or UV irradiated conditions, the SOMOs of [Cu(dmit)2]2− anions have a much higher degree of π–d mixing than that in other metal-dithiolene complex anions. As shown in Figure S9 in the Supplementary Materials, some of the excited MOs (e.g., MO#52 of all three salts) are localized around the Cu atoms with rather spherical geometries because of the π–d mixing. Thus, the orbital angular momentum is practically quenched, which makes spin-orbit coupling negligible. The findings in this work mean that UV excitation in [Cu(dmit)2]2− can realize an unusual spin state, which cannot be realized by thermal excitation, the variation of counter cations or chemical modification of the metal center and/or ligands.

3. Experimental Section

3.1. Materials and Methods

All chemicals were purchased as the highest grade and used as received. Compound 1 was synthesized according to the literature [80]. [(DABCO)H]PF6 and BP2DBF(PF6)2 were provided by Solid-State Chemistry Laboratory, Department of Chemistry, Faculty of Science, Hokkaido University, Sapporo, Japan. Single crystals of 1 suitable for X-ray structural analysis and physical property measurements were obtained during the recrystallization of the crude product from CH3CN. Single crystals of 2 and 3 were obtained from slow, double decompositions of saturated solutions. DABCO·HPF6 (3 mg) in CH3CN (Wako, Osaka, Japan; 10 mL) (for 2) or (BP2DBF)(PF6)2 (3 mg) in CH3CN (20 mL) (for 3) and 1 (3 mg) in CH3CN (10 mL for both 2 and 3) were dissolved using a supersonic wave machine (AS ONE, Osaka, Japan, Ultrasonic Cleaner US-5A) for 1 min. After filtration, one of the solutions was added to the other. The mixed solution was sealed and left to stand in the dark for 14–17 days at −30 °C (2) or at 24 °C (3) to yield shiny black blocks ~0.5 mm on the longest side. Single crystal X-ray structural analysis was carried out with a Rigaku R-AXIS RAPID Cu-Kα radiation (λ = 1.54187 Å) or Rigaku Saturn724 Mo-Kα radiation (λ = 0.71075 Å) diffractometer at (296 ± 1) and (100 ± 1) K. Cambridge Crystallographic Data Centre (CCDC) numbers 991696 (1, 296 K), 994604 (1, 100 K), 1037127 (2, 296 K), 1037128 (2, 100 K), 1037129 (3, 296 K) and 991697 (3, 100 K) contain supplementary crystallographic data for this paper. These can be obtained free of charge from the CCDC via the internet (www.ccdc.cam.ac.uk/data_request/cif). Details of the molecular orbital and band structure calculations are described in the Supplementary Materials.

3.2. UV Irradiation

UV irradiation of the samples was carried out in a He atmosphere (ESR) or in liquid N2 (resistivity measurements at low temperatures). A Hg/Xe lamp (SAN-EI Electric, Osaka, Japan, SUPERCURE-203S; 200 W, 220–1100 nm) equipped with a band pass filter (transparent only at 250–450 nm) and a quartz light guide of a multimode optical fiber (5 mm in the core diameter) were employed. The actual power at a particular wavelength was estimated from the spectrum of the light source (I (mW cm−2 nm−1) vs. λ (nm)) provided by the supplier. The specifications of the light source used in this work have been described in previous papers [19,25]. In 2 and 3, the most developed crystal surfaces were selected for irradiation. For 3, the radiation was incident on the ( 01   1 ¯ )-planes, which do not belong to any crystal surface.

3.3. Physical Property Measurements: General

Except for the magnetic susceptibility measurements, all of the single crystals used in the measurements were briefly checked using X-ray oscillation photographs to identify the crystal quality and the directions of the crystallographic axes. For the magnetic susceptibility measurements, several of the single crystals were subjected to X-ray oscillation photographs to identify the crystal phase. The data are shown as averaged values, and the errors were estimated based on scattering of the data of independent measurements. After the measurements under UV radiation, the sample crystals were again checked with X-ray photographs and/or by the same measurements in the dark to confirm that there was no crystallographic deterioration upon irradiation. To check reproducibility and sample dependence, the magnetic susceptibility and resistivity measurements were examined repeatedly using the same samples, as well as different samples independently prepared/irradiated.

3.4. Magnetic Susceptibility Measurements

The temperature dependence of the magnetic susceptibility was measured on polycrystalline samples using a superconducting quantum interference device (SQUID) MPMS-XL7minBXR3 (Quantum Design, San Diego, CA, USA) using the DC method at 300–2 K. The measurements were carried out under a low pressure He atmosphere in the dark. The polycrystalline sample (typical amount, ~1 mg; 1 × 10⁻⁶ mol) was set in the field. The sample was placed in a gelatin capsule (5 mm in inner diameter, 13.9 mm in height, EM Japan, Tokyo, Japan No. G7330, No.4), which was fixed in the middle of a polyethylene straw (Quantum Design). The data correction for the sample holder was negligibly small (ca. 1 × 10⁻⁸ cm3·mol−1) across the temperature range, as proven by measuring its susceptibility from room temperature to 4 K. The temperature was varied by 0.5–2 K/min. The applied fields were 0.8–1 T. Linearity of the magnetization up to 1.2 T was checked at 300 K by measuring the magnetization curves.

3.5. Electrical Resistivity Measurements

The electrical resistivity measurements were carried out using a personal computer-controlled home-made cryostat system. The system is composed of an insertion module with a high-vacuum jacket and a pumping/helium gas inlet valve, a Keithley 2400 SourceMeter, a Keithley 2182A Nanovoltmeter, a Keithley 6487 Picoammeter/Voltage Source, a Keithley 7001 Switch System (Keithley, Cleveland, Ohio, USA) and a LakeShore 331 Temperature Controller (Lake Shore Cryotronics, Inc., Westerville, Ohio, USA) with a silicon diode thermometer DT-470-SD. Linearity between the applied current and the observed voltage drop in a sample (the ohmic contact) was checked at the beginning of every set of measurements. The electrical resistivity was measured via a two-probe method along the longitudinal direction of the needle (1); elongated hexagonal plate (2); or irregularly-shaped block (3) single crystal. These directions approximately coincide with the crystallographic a-axis for 1, the b-axis for 2 and nearly the a-axis for 3 (the a-axis makes an angle of 20° with the long axis of the crystal in 3). The resultant currents were measured under a constant applied voltage. The resistivity of 2 was also measured along the a-axis at RT and gave a similar value of resistivity to that along the b-axis, both in the dark and under UV radiation. Gold wires (25 μm in diameter) and gold paste (No.8560, Tokuriki Chemical Research Co., Ltd., Tokyo, Japan) were used as electrical contacts.

3.6. Electron Spin Resonance

The electron spin resonance spectra of the X-band (9.3 GHz) were measured on a single crystal in the temperature range 120–300 K using a JEOL JES FA100 equipped with a continuous flow-type liquid N2 cryostat with a digital temperature controller (JEOL, Tokyo, Japan). The temperature was controlled so as not to allow the temperature variation to exceed ±0.5 K during the field sweep. A single crystal of 13 was mounted on a Teflon piece settled with a minimal amount of Apiezon N grease, sealed in a 5 mm diameter quartz sample tube in a low-pressure (~20 mmHg) helium atmosphere. In some measurements, a single crystal of DPPH (1,1-diphenyl-2-picrylhydrazyl; g = 2.00366 ± 0.00004) [81,82,83] was also mounted on the Teflon piece beside 13 as an internal standard of g-values. In the measurements under UV irradiation, the standard sample was mounted on the opposite face of the Teflon piece in order to avoid UV irradiation on the standard sample. The magnetic field was applied perpendicular to the directions where the closest intermolecular interactions were expected based on the TBBC. They were parallel to the [ 01   1 ¯ ]-direction for 1, parallel to the [ 10   1 ¯ ]-direction for 2 and parallel to the [011]-direction for 3. The magnetic field was corrected by a gauss meter (JEOL NMR Field Meter ES-FC5) at the end of every measurement. The UV light was incident on the (011)-planes for 1, on the (101)-planes for 2 and on the ( 01   1 ¯ )-planes for 3. In the measurements of anisotropy, the angle θ defines the rotation angle around the a-axis in 1, the b-axis in 2 and the axis normal to the bc-plane in 3. With θ increasing, the single crystals were rotated around the fixed H in the direction indicated by the circular arrows in Figure 2b,d,e, respectively. Magnetic fields (H) are initially (θ = 0) applied parallel to [ 01   1 ¯ ] for 1, [ 10   1 ¯ ] for 2 and [011] for 3. The molecular orientations relative to H at the maximum and minimum values of g-values are shown in Figure 7. The time constant, sweep time and the modulation were common for 13: 0.01 s, 30 s and 100 kHz, respectively. Both dark and UV irradiated spectra were measured under identical amplitudes, modulations and time constants for all three salts. The spectra simulation was carried out using Anisotropic Simulation software AniSim/FA ver. 2.2.0 by JEOL. In the simulation of the ESR spectra containing both signals from DPPH and the Cu(dmit)2 salts, the parameters for the DPPH-signal of g-value, hyperfine coupling constant A (mT) of 14N, linewidth Г (mT) and the ratio between Lorentzian and Gaussian were unified among different spectra, which was obtained from the independent measurement and simulation analysis on the single crystal of DPPH alone (Figure S7n), and only the relative intensity Irel (%) of the DPPH-signal was varied to reproduce the observed spectra. Under UV irradiation, the ESR signals generally contain both contributions from dark and irradiated parts of each sample, as UV does not always penetrate the single crystals. Thus, it was required in the simulation to assume many oscillators to reproduce the observed spectra under UV irradiation. However, the number of oscillators thus required was always beyond the limitation of the software. Therefore, we tentatively carried out the simulation assuming a few (a maximum of four) oscillators to reproduce a part of the spectrum and then carried out the simulation again for the same observed spectrum assuming different parameters in order to reproduce a different part of the spectrum. This procedure was repeated until all spectral features were covered. Finally, all of the obtained simulated spectra were overlapped to compare to the observed spectrum, and the parameters were modified to reproduce the observed spectrum better. These procedures were repeated until the simulated spectra best agreed with the observed spectrum. As a result, the spectral features were sensitive to the parameters concerning Cu(II), and reproduction of the observed spectra required two independent parameter sets for Cu(II) corresponding to the dark and UV irradiated states. However, the separation of contribution from the dmit ligands into dark and UV irradiated states had arbitrariness, and one could not determine the unique parameter sets of the dmit ligands corresponding to the dark and UV irradiated states in each spectrum. Such a difference between Cu(II) and the dmit ligands probably originates from the differences in the linewidths, the hyperfine structures and spectral differences between dark and UV irradiated conditions of their ESR signals. Therefore, in the simulation of the ESR spectra under UV irradiation, two sets of parameters were obtained for Cu(II), while only one set of parameters was obtained for the dmit ligands (Tables S5, S9 and S10–S12). The former corresponds to the contributions from dark and UV irradiated parts, respectively, while the latter contains both contributions from the dark and UV irradiated parts.

3.7. Calculations

The tight-binding band calculation was carried out via an extended Hückel method using Caesar 1.0 and 2.0 (PrimeColor Software, Inc., Raleigh, North Carolina, USA). The quantum chemistry calculations of the molecular orbitals, structural optimization and Mulliken analyses for spin and electron densities were carried out using Gaussian 09, and the results were illustrated using GaussView 5.0 [84]. The parameter- and calculation-level dependencies were examined, and it was confirmed that there were no significant differences among the calculation results with different parameters, basis sets or levels of calculation. For example, Mulliken analyses of the [Cu(dmit)2]2− using Gaussian 09 gave nearly identical results to those from an extended Hückel method using Caesar 2.0. A series of quantum chemistry calculations for isolated [Cu(dmit)2]2− anions, B3LYP/6-31G(3d), B3LYP/6-31G+(3d), B3LYP/6-311G+(3d) and B3LYP/6-311G+(3df), were utilized as basis sets and gave nearly identical results to each other. Thus, the discussion and conclusion above are not considered to be affected or altered in any qualitative way by different parameters/basis sets or different levels of calculations within the range we studied. In the calculation of g-values for 1 and 2, B3LYP/6-31+G(3d) was utilized as the basis set, and the optimized molecular structures were assumed, which were nearly identical to the observed structures in the crystals. The contributions of dmit ψ(dmit) and Cu ψ(Cu) to the MOs φa and φb were respectively estimated based on the summation of the squares of the coefficients (ai and bi in Equations (3) and (4), respectively) of the atomic orbitals (φi in Equations (3) and (4)) involved in the extended Hückel MOs of [Cu(dmit)2]2−:
φ a = i a i ϕ i
φ b = i b i ϕ i
where summation in Equations (3) and (4) is carried out on the atomic orbitals Cu 4s, 4p, 3d; S 3s, 3p; C 2s, 2p.
ψ ( A ) = j A c j 2 i c i 2
where A designates dmit or Cu, the summation on j is carried out on the atomic orbitals belonging to the molecular fragment A in regard to φa or φb orbitals and the summation on i is carried out on all of the atomic orbitals involved in φa or φb. In 3, there are mixed bands of [Cu(dmit)2]2− and BP2BDF2+ in the possible final states under UV radiation of 250–450 nm. For simplicity, the corresponding mixing was ignored in the estimation of ψ(Cu), since such approximation does not significantly alter the contribution ratio between Cu and dmit in any band.

4. Conclusions

The [Cu(dmit)2]2− anions in 13 adapt the flexible coordination geometries in concert with different counter-ions. Calculations show that this is not because of intermolecular interactions, but because of the thermodynamic stability of the anion for 1 and 3, while this is because of the intermolecular interactions for 2. Although such a change of the counter cations alters the molecular structures and the electrical properties, the charge and spin distributions on [Cu(dmit)2]2− are not different from each other at their ground states. This is because [Cu(dmit)2]2− flexibly changes its molecular structure in the given solid states using the many degrees of freedom to have the lowest energy possible at ambient temperature (T ≤ 300 K). As the charge and spin distributions on [Cu(dmit)2]2− dominate the anion’s energy, the same thermodynamic condition gives similar charge and spin distributions. On the other hand, UV irradiation alters the spin distribution and anisotropy in a qualitative and reversible way, because the excited states have rather different molecular orbitals from that of the ground state. Such photo-response in spin degrees of freedom is characteristic of [Cu(dmit)2]2− anions. Although Compounds 13 did not switch between conductors and magnets, these findings indicate that optical excitation in the [Cu(dmit)2]2− anions should be an effective method to control spin distribution and anisotropy.

Supplementary Materials

Supplementary materials can be accessed at www.mdpi.com/2304-6740/4/2/7/s1.

Acknowledgments

The authors are grateful for Tamotsu Inabe at Hokkaido University for providing us DABCO·HPF6 and BP2DBF(PF6)2. The authors acknowledge financial support from Grant-in-Aid for Research Promotion, Ehime University, from The Dean’s Research Grant, Faculty of Science, Ehime University, from Collaborative Research Grant, Graduate School of Science and Engineering, Ehime University, and also technical support from the Integrated Center for Sciences, Ehime University. The magnetic susceptibility measurements were carried out using the SQUID at the Department of Physics, Faculty of Science, Ehime University.

Author Contributions

Toshio Naito conceived of and designed the experiments; Hiroki Noma performed the experiments. Toshio Naito and Hiroki Noma analyzed the data; Keishi Ohara contributed with the ESR measurements and their analysis tools. Toshio Naito wrote the paper.

Conflicts of Interest

The authors declare no conflict of interest.

References

  1. Tissot, A. Photoswitchable spin crossover nanoparticles. New J. Chem. 2014, 38, 1840–1845. [Google Scholar] [CrossRef]
  2. Hatcher, L.E.; Lauren, E.; Raithby, P.R. Dynamic single-crystal diffraction studies using synchrotron radiation. Coord. Chem. Rev. 2014, 277–278, 69–79. [Google Scholar] [CrossRef]
  3. Gütlich, P.; Gasper, A.B.; Garcia, Y. Spin states switching in iron coordination compounds. Beilstein J. Org. Chem. 2013, 9, 342–391. [Google Scholar] [CrossRef] [PubMed]
  4. Letard, J.-F. Photomagnetism of iron(II) spin crossover complexes—The T(LIESST) approach. J. Mater. Chem. 2006, 16, 2550–2559. [Google Scholar] [CrossRef]
  5. Varret, F.; Boukheddaden, K.; Codjovi, E.; Enachescu, C.; Linares, J. On the competition between relaxation and photoexcitations in spin crossover solids under continuous irradiation. In Spin Crossover in Transition Metal Compounds II, Topics in Current Chemistry; Springer-Verlag Berlin: Berlin, Germany, 2004; Volume 234, pp. 199–229. [Google Scholar]
  6. Gütlich, P.; Garcia, Y.; Spering, H. Spin transition phenomena. In Magnetism: Molecules to Materials IV; Miller, J.S., Drillon, M., Eds.; Wiley-VCH Verlag GmbH & Co.: Weinheim, Germany, 2003; pp. 271–344. [Google Scholar]
  7. Spiering, H.; Kohlhaas, T.; Romstedt, H.; Hauser, A.; Bruns-Yilmaz, C.; Kusz, J.; Gütlich, P. Correlations of the distribution of spin states in spin crossover compounds. Coord. Chem. Rev. 1999, 190–192, 629–647. [Google Scholar] [CrossRef]
  8. Hauser, A.; Jeftic, J.; Romstedt, H.; Hinek, R.; Spiering, H. Cooperative phenomena and light-induced bistability in iron(II) spin-crossover compounds. Coord. Chem. Rev. 1999, 190–192, 471–491. [Google Scholar] [CrossRef]
  9. Gütlich, P.; Ensling, J.; Tuczek, F. Metastable electronic states induced by nuclear decay and light. Hyperfine Interact. 1994, 84, 447–469. [Google Scholar] [CrossRef]
  10. Koshihara, S. Photo-induced phase transitions in organic and inorganic semiconductors. J. Lumin. 2000, 87–89, 77–81. [Google Scholar] [CrossRef]
  11. Först, M.; Hoffmann, M.C.; Dienst, A.; Kaiser, S.; Rini, M.; Tobey, R.I.; Gensch, M.; Manzoni, C.; Cavalleri, A. THz control in correlated electron solids: Sources and applications. In Terahertz Spectroscopy and Imaging; Peiponen, K.-E., Zeitler, A., Kuwata-Gonokami, M., Eds.; Springer Berlin Heidelberg: Berlin, Germany, 2013; pp. 611–631. [Google Scholar]
  12. Mori, T. Structural genealogy of BEDT-TTF-based organic conductors I. Parallel molecules: β and β″ phases. Bull. Chem. Soc. Jpn. 1998, 71, 2509–2526. [Google Scholar] [CrossRef]
  13. Mori, T.; Mori, H.; Tanaka, S. Structural genealogy of BEDT-TTF-based organic conductors II. Inclined molecules: θ, α and κ phases. Bull. Chem. Soc. Jpn. 1999, 72, 179–197. [Google Scholar] [CrossRef]
  14. Mori, T. Structural genealogy of BEDT-TTF-based organic conductors III. Twisted molecules: δ and α′ phases. Bull. Chem. Soc. Jpn. 1999, 72, 2011–2027. [Google Scholar] [CrossRef]
  15. West, A.R. Electrical properties. In Basic Solid State Chemistry; John Wiley & Sons: Chichester, UK, 1994; pp. 281–375. [Google Scholar]
  16. Cox, P.A. Electronic structure of solids. In Solid State Chemistry: Compounds; Cheetham, A.K., Day, P., Eds.; Clarendon Press: Oxford, UK, 1992; pp. 1–30. [Google Scholar]
  17. Ishikawa, T.; Hayes, S.A.; Keskin, S.; Corthey, G.; Hada, M.; Pichugin, K.; Marx, A.; Hirscht, J.; Shionuma, K.; Onda, K.; et al. Direct observation of collective modes coupled to molecular orbital-driven charge transfer. Science 2015, 350, 1501–1505. [Google Scholar] [CrossRef] [PubMed]
  18. Naito, T. (Ed.) Molecular Electronic and Related Materials: Control and Probe with Light; Transworld Research Network: Kerala, India, 2010; pp. 1–320.
  19. Naito, T.; Inabe, T.; Niimi, H.; Asakura, K. Light-induced transformation of molecular materials into devices. Adv. Mater. 2004, 16, 1786–1790. [Google Scholar] [CrossRef]
  20. Miyamoto, T.; Niimi, H.; Chun, W.-J.; Kitajima, Y.; Sugawara, H.; Inabe, T.; Naito, T.; Asakura, K. Chemical states of Ag in Ag(DMe-DCNQI)2 photoproducts and a proposal for its photoinduced conductivity change mechanism. Chem. Lett. 2007, 36, 1008–1009. [Google Scholar] [CrossRef]
  21. Naito, T.; Kakizaki, A.; Wakeshima, M.; Hinatsu, Y.; Inabe, T. Photochemical modification of magnetic properties in organic low-dimensional conductors. J. Solid State Chem. 2009, 182, 2733–2742. [Google Scholar] [CrossRef]
  22. Naito, T.; Kakizaki, A.; Inabe, T.; Sakai, R.; Nishibori, E.; Sawa, H. Growth of nanocrystals in a single crystal of different materials: A way of giving function to molecular crystals. Cryst. Growth Des. 2011, 11, 501–506. [Google Scholar] [CrossRef]
  23. Miyamoto, T.; Kitajima, Y.; Sugawara, H.; Naito, T.; Inabe, T.; Asakura, K. Origin of photochemical modification of resistivity of Ag(DMe-DCNQ)2 studied by X-Ray absorption fine structure. J. Phys. Chem. C 2009, 113, 20476–20480. [Google Scholar] [CrossRef]
  24. Miyamoto, T.; Niimi, H.; Kitajima, Y.; Naito, T.; Asakura, K. Ag L3-edge X-Ray absorption near-edge structure of 4d10 (Ag+) compounds: Origin of the edge peak and its chemical relevance. J. Phys. Chem. A 2010, 114, 4093–4098. [Google Scholar] [CrossRef] [PubMed]
  25. Naito, T.; Sugawara, H.; Inabe, T.; Kitajima, Y.; Miyamoto, T.; Niimi, H.; Asakura, K. UV-VIS induced vitrification of a molecular crystal. Adv. Funct. Mater. 2007, 17, 1663–1670. [Google Scholar] [CrossRef]
  26. Naito, T.; Sugawara, H.; Inabe, T. Mechanism of spatially resolved photochemical control of resistivity of a molecular crystalline solid. Nanotechnology 2007, 18, 424008. [Google Scholar] [CrossRef] [PubMed]
  27. Tsutsumi, T.; Miyamoto, T.; Niimi, H.; Kitajima, Y.; Sakai, Y.; Kato, M.; Naito, T.; Asakura, K. Energy-filtered X-Ray photoemission electron microscopy and its applications to surface and organic materials. Solid State Electron. 2007, 51, 1360–1366. [Google Scholar] [CrossRef]
  28. Saiki, T.; Mori, S.; Ohara, K.; Naito, T. Capacitor-like behavior of molecular crystal β-DiCC[Ni(dmit)2]. Chem. Lett. 2014, 43, 1119–1121. [Google Scholar] [CrossRef]
  29. Burdett, J.K. Structural and compositional basis of high-temperature superconductivity: Properties of the magic electronic state. Inorg. Chem. 1993, 32, 3915–3922. [Google Scholar] [CrossRef]
  30. Yamamoto, H.M.; Ito, H.; Shigeto, K.; Tsukagoshi, K.; Kato, R. Direct formation of micro-/nanocrystalline 2,5-dimethyl-N,N′-dicyanoquinonediimine complexes on SiO2/Si substrates and multiprobe measurement of conduction properties. J. Am. Chem. Soc. 2006, 128, 700–701. [Google Scholar] [CrossRef] [PubMed]
  31. Naito, T.; Karasudani, T.; Mori, S.; Ohara, K.; Konishi, K.; Takano, T.; Takahashi, Y.; Inabe, T.; Nishihara, S.; Inoue, K. Molecular photoconductor with simultaneously photocontrollable localized spins. J. Am. Chem. Soc. 2012, 134, 18656–18666. [Google Scholar] [CrossRef] [PubMed]
  32. Naito, T.; Karasudani, T.; Ohara, K.; Takano, T.; Takahashi, Y.; Inabe, T.; Furukawa, K.; Nakamura, T. Simultaneous control of carriers and localized spins with light in organic materials. Adv. Mater. 2012, 24, 6153–6157. [Google Scholar] [CrossRef] [PubMed]
  33. Naito, T.; Karasudani, T.; Nagayama, N.; Ohara, K.; Konishi, K.; Mori, S.; Takano, T.; Takahashi, Y.; Inabe, T.; Kinose, S.; et al. Giant photoconductivity in NMQ[Ni(dmit)2]. Eur. J. Inorg. Chem. 2014, 2014, 4000–4009. [Google Scholar] [CrossRef]
  34. Alvarez, S.; Vicente, R.; Hoffmann, R. Dimerization and stacking in transition-metal bisdithiolenes and tetrathiolates. J. Am. Chem. Soc. 1985, 107, 6253–6277. [Google Scholar] [CrossRef]
  35. Cassoux, P.; Valade, L.; Kobayashi, H.; Kobayashi, A.; Clark, R.A.; Underhill, A.E. Molecular metals and superconductors derived from metal complexes of 1,3-dithiole-2-thione-4,5-dithiolate (dmit). Coord. Chem. Rev. 1991, 110, 115–160. [Google Scholar] [CrossRef]
  36. Williams, J.M.; Schultz, A.J.; Geiser, U.; Carlson, K.D.; Kini, A.M.; Wang, H.H.; Kwok, W.-K.; Whangbo, M.-H.; Schirber, J.E. Organic superconductors—New benchmarks. Science 1991, 252, 1501–1508. [Google Scholar] [CrossRef] [PubMed]
  37. Olk, R.-M.; Olk, B.; Dietzsch, W.; Kirmse, R.; Hoyer, E. The chemistry of 1,3-dithiole-2-thione-4,5-dithiolate (dmit). Coord. Chem. Rev. 1992, 117, 99–131. [Google Scholar] [CrossRef]
  38. Svenstrup, N.; Becher, J. The organic chemistry of 1,3-dithiole-2-thione-4,5-dithiolate (DMIT). Synthesis 1995, 3, 215–235. [Google Scholar] [CrossRef]
  39. Canadell, E. Electronic structure of two-band molecular conductors. New J. Chem. 1997, 21, 1147–1159. [Google Scholar]
  40. Kato, R.; Liu, Y.-L.; Hosokoshi, Y.; Aonuma, S.; Sawa, H. Se-substitution and cation effects on the high-pressure molecular superconductor, β-Me4N[Pd(dmit)2]2—A unique two-band system. Mol. Cryst. Liq. Cryst. 1997, 296, 217–244. [Google Scholar] [CrossRef]
  41. Rosa, A.; Ricciardi, G.; Baerends, E.J. Structural properties of M(dmit)2-based (M = Ni, Pd, Pt; dmit2− = 2-thioxo-1,3-dithiole-4,5-dithiolato) molecular metals. Insights from density functional calculations. Inorg. Chem. 1998, 37, 1368–1379. [Google Scholar] [CrossRef] [PubMed]
  42. Pullen, A.E.; Olk, R.-M. The coordination chemistry of 1,3-dithiole-2-thione-4,5-dithiolate (dmit) and isologs. Coord. Chem. Rev. 1999, 188, 211–262. [Google Scholar] [CrossRef]
  43. Kato, R. Conducting metal dithiolene complexes: Structural and electronic properties. Chem. Rev. 2004, 104, 5319–5346. [Google Scholar] [CrossRef] [PubMed]
  44. Mori, H. Materials viewpoint of organic superconductors. J. Phys. Soc. Jpn. 2006, 75, 051003. [Google Scholar] [CrossRef]
  45. Valade, L.; Tanaka, H. Molecular inorganic conductors and superconductors. In Molecular Materials; Bruce, D.W., O'Hare, D., Walton, R.I., Eds.; John Wiley & Sons Ltd: West Sussex, UK, 2010; pp. 211–280. [Google Scholar]
  46. Mercuri, M.L.; Deplano, P.; Pilia, L.; Serpe, A.; Artizzu, F. Interaction modes and physical properties in transition metal chalcogenolene-based molecular materials. Coord. Chem. Rev. 2010, 254, 1419–1433. [Google Scholar] [CrossRef]
  47. De Bonneval, B.G.; Ching, K.I.M.-C.; Alary, F.; Bui, T.-T.; Valade, L. Neutral d8 metal bis-dithiolene complexes: Synthesis, electronic properties and applications. Coord. Chem. Rev. 2010, 254, 1457–1467. [Google Scholar] [CrossRef]
  48. Papavassiliou, G.C.; Anyfantis, G.C.; Mousdis, G.A. Neutral metal 1,2-dithiolenes: Preparations, properties and possible applications of unsymmetrical in comparison to the symmetrical. Crystals 2012, 2, 762–811. [Google Scholar] [CrossRef]
  49. Tanaka, H.; Okano, Y.; Kobayashi, H.; Suzuki, W.; Kobayashi, A. A Three-dimensional synthetic metallic crystal composed of single-component molecules. Science 2001, 291, 285–287. [Google Scholar] [CrossRef] [PubMed]
  50. Kobayashi, A.; Tanaka, H.; Kobayashi, H. Molecular design and development of single-component molecular metals. J. Mater. Chem. 2001, 11, 2078–2088. [Google Scholar] [CrossRef]
  51. Kobayashi, A.; Fujiwara, E.; Kobayashi, H. Single-component molecular metals with extended-TTF dithiolate ligands. Chem. Rev. 2004, 104, 5243–5264. [Google Scholar] [CrossRef] [PubMed]
  52. Yamamoto, K.; Fujiwara, E.; Kobayashi, A.; Fujishiro, Y.; Nishibori, E.; Sakata, M.; Tanaka, M.; Tanaka, H.; Okano, Y.; Kobayashi, H. Single-component molecular conductor [Zn(tmdt)2] and related Zn complexes. Chem. Lett. 2005, 34, 1090–1091. [Google Scholar] [CrossRef]
  53. Kobayashi, A.; Okano, Y.; Kobayashi, H. Molecular design and physical properties of single-component molecular metals. J. Phys. Soc. Jpn. 2006, 75, 051002. [Google Scholar] [CrossRef]
  54. Zhou, B.; Shimamura, M.; Fujiwara, E.; Kobayashi, A.; Higashi, T.; Nishibori, E.; Sakata, M.; Cui, H.B.; Takahashi, K.; Kobayashi, H. Magnetic transitions of single-component molecular metal [Au(tmdt)2] and its alloy systems. J. Am. Chem. Soc. 2006, 128, 3872–3873. [Google Scholar] [CrossRef] [PubMed]
  55. Zhou, B.; Kobayashi, A.; Okano, Y.; Nakashima, T.; Aoyagi, S.; Nishibori, E.; Sakata, M.; Tokumoto, M.; Kobayashi, H. Single-component molecular conductor [Pt(tmdt)2] (tmdt = trimethylenetetrathiafulvalenedithiolate)—An advanced molecular metal exhibiting high metallicity. Adv. Mater. 2009, 21, 3596–3600. [Google Scholar] [CrossRef]
  56. Zhou, B.; Yajima, H.; Kobayashi, A.; Okano, Y.; Tanaka, H.; Kumashiro, T.; Nishibori, E.; Sawa, H.; Kobayashi, H. Single-component molecular conductor [Cu(tmdt)2] containing an antiferromagnetic heisenberg chain. Inorg. Chem. 2010, 49, 6740–6747. [Google Scholar] [CrossRef] [PubMed]
  57. Zhou, B.; Idobata, Y.; Kobayashi, A.; Cui, H.-B.; Kato, R.; Takagi, R.; Miyagawa, K.; Kanoda, K.; Kobayashi, H. Single-component molecular conductor [Cu(dmdt)2] with three-dimensionally arranged magnetic moments exhibiting a coupled electric and magnetic transition. J. Am. Chem. Soc. 2012, 134, 12724–12731. [Google Scholar] [CrossRef] [PubMed]
  58. Idobata, Y.; Zhou, B.; Kobayashi, A.; Kobayashi, H. Molecular alloy with diluted magnetic moments—Molecular kondo system. J. Am. Chem. Soc. 2012, 134, 871–874. [Google Scholar] [CrossRef] [PubMed]
  59. Cui, H.B.; Kobayashi, H.; Ishibashi, S.; Sasa, M.; Iwase, F.; Kato, R.; Kobayashi, A. A single-component molecular superconductor. J. Am. Chem. Soc. 2014, 136, 7619–7622. [Google Scholar] [CrossRef] [PubMed]
  60. Yamashita, S.; Yamamoto, T.; Nakazawa, Y.; Tamura, M.; Kato, R. Gapless spin liquid of an organic triangular compound evidenced by thermodynamic measurements. Nat. Commun. 2011, 2, 275. [Google Scholar] [CrossRef] [PubMed]
  61. Steimecke, G.; Kirmse, R.; Hoyer, E. Dimercaptoisotrithione. New, unsaturated 1,2-dithiolate ligand. Z. Chem. 1975, 15, 28–29. [Google Scholar] [CrossRef]
  62. Stach, J.; Kirmse, R.; Dietzsch, W.; Olk, R.M.; Hoyer, E. Single-crystal EPR spectra of tetra-n-butylammonium bis(isotrithione-3,4-dithiolato)cuprate(II) (copper-63). Inorg. Chem. 1984, 23, 4779–4780. [Google Scholar] [CrossRef]
  63. Matsubayashi, G.; Takahashi, K.; Tanaka, T. X-ray crystal structure of bis(N-ethylpyridinium) bis[4,5-dimercapto-1,3-dithiole-2-thionate(2-)]copper(II) and electrical properties of its oxidized salts. J. Chem. Soc. Dalton Trans. 1988, 967–972. [Google Scholar] [CrossRef]
  64. Guo, W.F.; Sun, X.B.; Sun, J.; Yu, W.T.; Wang, X.Q.; Zhang, G.H.; Xu, D. Preparation, single crystal growth and characterization of bis(tetrabutylammonium)bis(4,5-dithiolato-1,3-dithiole-2-thione)copper. Cryst. Res. Technol. 2007, 42, 349–335. [Google Scholar]
  65. Guo, W.F.; Sun, X.B.; Sun, J.; Yu, W.T.; Wang, X.Q.; Zhang, G.H.; Xu, D. Synthesis, crystal structure and third order nonlinear optical properties of bis(tetra-n-propylammonium) bis(2-thioxo-1,3-dithiole-4,5-dithiolato)cuprate(II). Cryst. Res. Technol. 2007, 42, 522–528. [Google Scholar] [CrossRef]
  66. Wang, X.-Q.; Yu, W.-T.; Xu, D.; Wang, Y.-L.; Li, T.-B.; Zhang, G.-H.; Sun, X.-B.; Ren, Q. Bis(tetraethylammonium) bis(2-thioxo-1,3-dithiole-4,5-dithiolato)cuprate(II). Acta Crystallogr. E 2005, 61, m717–m719. [Google Scholar] [CrossRef]
  67. Li, T.; Hu, Y.; Ma, C.; He, G.; Zhao, R.; Li, J. Crystal structure and third-order nonlinear optical property study of a copper complex constructed by DMIT ligand. Mater. Chem. Phys. 2011, 130, 835–838. [Google Scholar] [CrossRef]
  68. Noma, H.; Ohara, K.; Naito, T. [Cu(dmit)2]2− Building block for molecular conductors and magnets with photocontrollable spin distribution. Chem. Lett. 2014, 43, 1230–1232. [Google Scholar] [CrossRef]
  69. Frisch, M.J.; Trucks, G.W.; Schlegel, H.B.; Scuseria, G.E.; Robb, M.A.; Cheeseman, J.R.; Scalmani, G.; Barone, V.; Mennucci, B.; Petersson, G.A.; et al. Gaussian 09, Revision C.01; Gaussian, Inc.: Wallingford, CT, USA, 2009. [Google Scholar]
  70. Mott, N.F. Metal-Insulator Transitions, 2nd ed.; Taylor & Francis: London, UK, 1990; pp. 123–144. [Google Scholar]
  71. Jazwinski, J. Theoretical aspects of indirect spin-spin couplings. Nucl. Magn. Res. 2014, 43, 159–182. [Google Scholar]
  72. Kirmse, R.; Stach, J.; Dietzsch, W.; Steimecke, G.; Hoyer, E. Single-crystal EPR studies on nickel(III), palladium(III), and platinum(III) dithiolene chelates containing the ligands isotrithionedithiolate, o-xylenedithiolate, and maleonitriledithiolate. Inorg. Chem. 1980, 19, 2679–2685. [Google Scholar] [CrossRef]
  73. Teschmit, G.; Strauch, P.; Barthel, A.; Reinhold, J.; Kirmse, R. A single crystal EPR investigation on (n-Bu4N)2[Cu(dmit)2] in the antiferro-magnetically coupled host lattice (n-Bu4N)2[(dmit)Cu(tto)Cu(dmit)]: A contribution to the nature of the so-called “paramagnetic impurities”. Z. Naturforsch. B 1999, 54, 832–838. [Google Scholar] [CrossRef]
  74. Nakamura, T.; Takahashi, T.; Aonuma, S.; Kato, R. EPR investigation of the electronic states in β′-type [Pd(dmit)2]2 compounds (where dmit is 2-thioxo-1,3-dithiole-4,5-dithiolate). J. Mater. Chem. 2001, 11, 2159–2162. [Google Scholar] [CrossRef]
  75. Hoffmann, S.K.; Goslar, J.; Lijewski, S.; Zalewska, A. EPR and ESE of CuS4 complex in Cu(dmit)2: g-Factor and hyperfine splitting correlation in tetrahedral Cu–sulfur complexes. J. Magn. Reson. 2013, 236, 7–14. [Google Scholar] [CrossRef] [PubMed]
  76. Hoffmann, S.K.; Goslar, J.; Lijewski, S.; Tadyszak, K.; Zalewska, A.; Jankowska, A.; Florczak, P.; Kowalak, S. EPR and UV-VIS study on solutions of Cu(II) dmit complexes and the complexes entrapped in zeolite A and ZIF-Cu(IM)2. Microporous Mesoporous Mater. 2014, 186, 57–64. [Google Scholar] [CrossRef]
  77. Schmitt, R.D.; Maki, A.H. Electronic ground state of bis(maleonitrile-dithiolene)nickel monoanion. Sulfur-33 hyperfine interaction. J. Am. Chem. Soc. 1968, 90, 2288–2292. [Google Scholar] [CrossRef]
  78. Kirmse, R.; Dietzsch, W. A single crystal EPR study of the palladium(III)-bis(maleonitriledithiolate)monoanion. J. Inorg. Nucl. Chem. 1976, 38, 255–257. [Google Scholar] [CrossRef]
  79. Kirmse, R.; Dietzsch, W.; Solovev, B.V. A single crystal EPR study of the platinum (III)-bis(maleonitriledithiolate)-monoanion. J. Inorg. Nucl. Chem. 1977, 39, 1157–1160. [Google Scholar] [CrossRef]
  80. Steimecke, G.; Sieler, H.-J.; Kirmse, R.; Hoyer, E. 1,3-dithiole-2-thione-4,5-dithiolate from carbon disulfide and alkali metal. Phosphorus Sulfur 1979, 7, 49–55. [Google Scholar] [CrossRef]
  81. Yordanov, N.D. Quantitative EPR spectrometry—“State of the art”. Appl. Magn. Reson. 1994, 6, 241–257. [Google Scholar] [CrossRef]
  82. Kai, A.; Miki, T. Electron spin resonance of sulfite radicals in irradiated calcite and aragonite. Radiat. Phys. Chem. 1992, 40, 469–476. [Google Scholar] [CrossRef]
  83. Inokuchi, H.; Kinoshita, M. The oxygen effect on electronic properties of α,α′-diphenyl-β-picrylhydrazyl. Bull. Chem. Soc. Jpn. 1960, 33, 1627–1629. [Google Scholar] [CrossRef]
  84. Dennington, R.; Keith, T.; Millam, J. GaussView, Version 5; Semichem Inc.: Shawnee Mission, KS, USA, 2009. [Google Scholar]
Figure 1. Molecular structures of abbreviated chemical species. dmit2− = 1,3-dithiole-2-thione-4,5-dithiolate; DABCO, 1,4-diazabicyclo[2.2.2]octane; BP2DBF2+ = dibenzofuran-2,2′-bis(N-methylene-4,4′-bipyridinium).
Inorganics 04 00007 g001
Figure 2. Crystal and molecular structures of 13 at 297 K: (a,b) 1; (c,d) 2; and (e) 3. Yellow lines designate the edges of the unit cells. Hydrogen atoms are omitted for clarity. Yellow, blue, brown, pink and red octants designate S, C, Cu, N and O atoms, respectively. In (d), broken lines designate S–S short contacts, and only [Cu(dmit)2]2− anions are drawn in order to show the conduction pathways in the ac-planes (upper). In (e), [Cu(dmit)2]2− and BP2DBF2+ are drawn separately in the upper and middle parts, respectively, for clarity. In (b,d,e), the directions of the magnetic fields (H), those of the UV irradiation and the rotation axes of the single crystals relative to H (circular arrows around the a-axis in 1, around the b-axis in 2 and around the axis perpendicular to both the b- and c-axes in 3) in angle-dependent ESR measurements are shown.
Inorganics 04 00007 g002
Figure 3. Calculated band structure of 2 using a tight-binding approximation. The broken line (EF) designates the Fermi level. Г, X, M, Y, Z and R designate points in reciprocal space located at (0,0,0), (0.5,0,0), (0.5,0.5,0), (0,0.5,0), (0,0,0.5) and (0.5,0.5,0.5), respectively. Band structures of other salts and those of wider energy ranges are shown in Figure S1 in the Supplementary Materials.
Inorganics 04 00007 g003
Figure 4. Calculated singly-occupied molecular orbitals (SOMO) ((a) 1; (b) 2; and (c) 3) via extended Hückel calculation and spin densities ((d) 1; (e) 2; and (f) 3) for [Cu(dmit)2]2− anions via Gaussian 09 (B3LYP/6-31+G(3d)). Red and blue in (a)–(c) and green and blue in (d)–(f) designate different orbital lobes. Green lines in (a)–(c) and grey lines in (d)–(f) designate chemical bonds. In (d)–(f) yellow and grey spheres designate S and C atoms, respectively. For each molecular structure, see Figure 2. MOs of excited states are shown in Figure S9 in the Supplementary Materials.
Inorganics 04 00007 g004
Figure 5. Temperature dependence of electrical resistivity along the b-axis of 2. (a) Resistivity ρ in the dark; (inset) Arrhenius plot of the same data; (b) surface resistivity Rsq in the dark (crosses) and under UV radiation (triangles); (inset) Arrhenius plot of the same data; (c) response of photoconduction to switching the light source on/off.
Inorganics 04 00007 g005aInorganics 04 00007 g005b
Figure 6. Temperature (T) dependence of the magnetic susceptibility (χ) of 1 (circles), 2 (crosses) and 3 (triangles). Both field-cooling (blue) and zero-field-cooling (red) processes are shown. (Inset) χT vs. T of 13 for the same field-cooling data as those in the main panel; the small jumps around 50 K in 1 and 3 are extrinsic, possibly due to residual adsorbed oxygen.
Inorganics 04 00007 g006
Figure 7. Electron spin resonance (ESR) spectra for 13, measured on single crystals. Anisotropy of the g-values at RT in: (a) 1; (b) 2; and (c) 3; observed (red crosses) and best fit (black sine curves). Black arrows designate the angle θ corresponding to the orientation of the crystal shown by the arrows. Comparison of the ESR spectra under dark (black) and UV irradiated (red) conditions at 123 K for: (d) 1 (θ = 0); (e) 2 (θ = 0); and (f) 3 (θ = 45°). Comparison of the observed (black) and simulated (red) ESR spectra under UV irradiated conditions for: (g) 1 (from [68]); (h) 2; and (i) 3. The UV irradiated spectra are the same as those in (df). The comparison between the observed and simulated ESR spectra in the dark for 13 and the parameters for all spectral simulation are shown in the Supplementary Materials (Figures S4 and S5 and Tables S4 and S9, respectively).
Inorganics 04 00007 g007aInorganics 04 00007 g007bInorganics 04 00007 g007c
Figure 8. Solution and powder spectra for 13 (20 °C). (a) UV-VIS absorption (ε) spectra in CH3CN for 13; (b) UV-VIS-NIR diffuse reflectance (R) spectra in KBr pellets for 13. The solution spectrum (A) for 1 (same spectrum as that in (a)) is also shown for comparison.
Inorganics 04 00007 g008

