1. Introduction
Mg
2Si-based thermoelectric (TE) materials were reported in the early 1960s [
1,
2] as promising devices for heat-into-electricity-conversion in the middle temperature range, because of their attractive figure-of-merit
ZT = 1.3 [
3,
4,
5]. Compared with PbTe and CoSb
3 or other TEs usable in the same temperature range, silicides have advantages as they are considered as environmental-friendly materials, because they consist of elements which are abundant in the earth’s crust and they are nontoxic. In addition, since they are composed of light metals, they have low densities in the range of 2–3.6 g/cm
3 which is a particularly favorable feature for heat recovery in automobile applications. Processing is a challenge, as the Mg
2Si phase melts at 1358 K, which is extremely close to the boiling point of pure Mg (1363 K) [
1]. This close difference prevents the easy-to-use arc-melting method which is popular for intermetallic TE processing [
6,
7]. Hence, as soon as new processing routes were established from the 1990s on, such as ball-milling [
8,
9,
10,
11], hydrogen synthesis [
12,
13], combustion methods [
14], spark-plasma sintering (SPS) [
15,
16,
17,
18], Mg
2Si came into focus again in the search for efficient TEs.
While pure Mg
2Si can reach a negative Seebeck coefficient of up to
S = −0.5 mV/K but only
ZT = 0.1 [
1,
19], the thermoelectric performance can be significantly improved with proper dopants. The best dopants, with which the best results for n-type Mg
2Si have been achieved, are 0.3 at% Bi which exhibits
S = −0.2 mV/K and
ZT =1.4 [
5,
19], and doping with 3% Ag for p-type Mg
2Si with
S = 0.4 mV/K and
ZT = 0.7 [
19,
20] The values do not change very much when industrial raw material [
20] or processing conditions are used [
21], 3at% Bi yield to
S = −0.2 mV/K and
ZT = 0.8 [
20], or 0.5 [
21] and 3a% Ag to
S = +0.2 mV/K and
ZT = 0.6 [
20], or 0.3 [
21]. The present study aims to confirm such results when using a new processing technique, the principle of which is briefly summarized below.
Hydrogen sorption [
22,
23,
24,
25,
26,
27] on Mg-alloys has been studied not only for the purpose of removing Oxygen from intermetallics, but also extensively over the last two decades for the purpose of finding an easy-to-use Hydrogen storage alloy in order to promote the usage of Hydrogen as alternative fuel for vehicles or energy storage. Besides FeTi [
28], Pd [
29,
30], rare earth elements [
25,
31], Mg-Fe [
32] and MgAl-alloys [
26,
27] have been considered. On the other hand, Hydrogen causes severe embrittlement at grain boundaries in Al-alloys [
33].
In this paper we report a new chemical route for preparing Mg
2Si starting from hydrides and describe the characterization of the powder. The next section describes the finding of proper sintering conditions for bulk materials’ processing. Finally, measurements of Seebeck coefficient [
34,
35,
36] and electric output power are described, and all results are discussed.
2. Results and Discussion
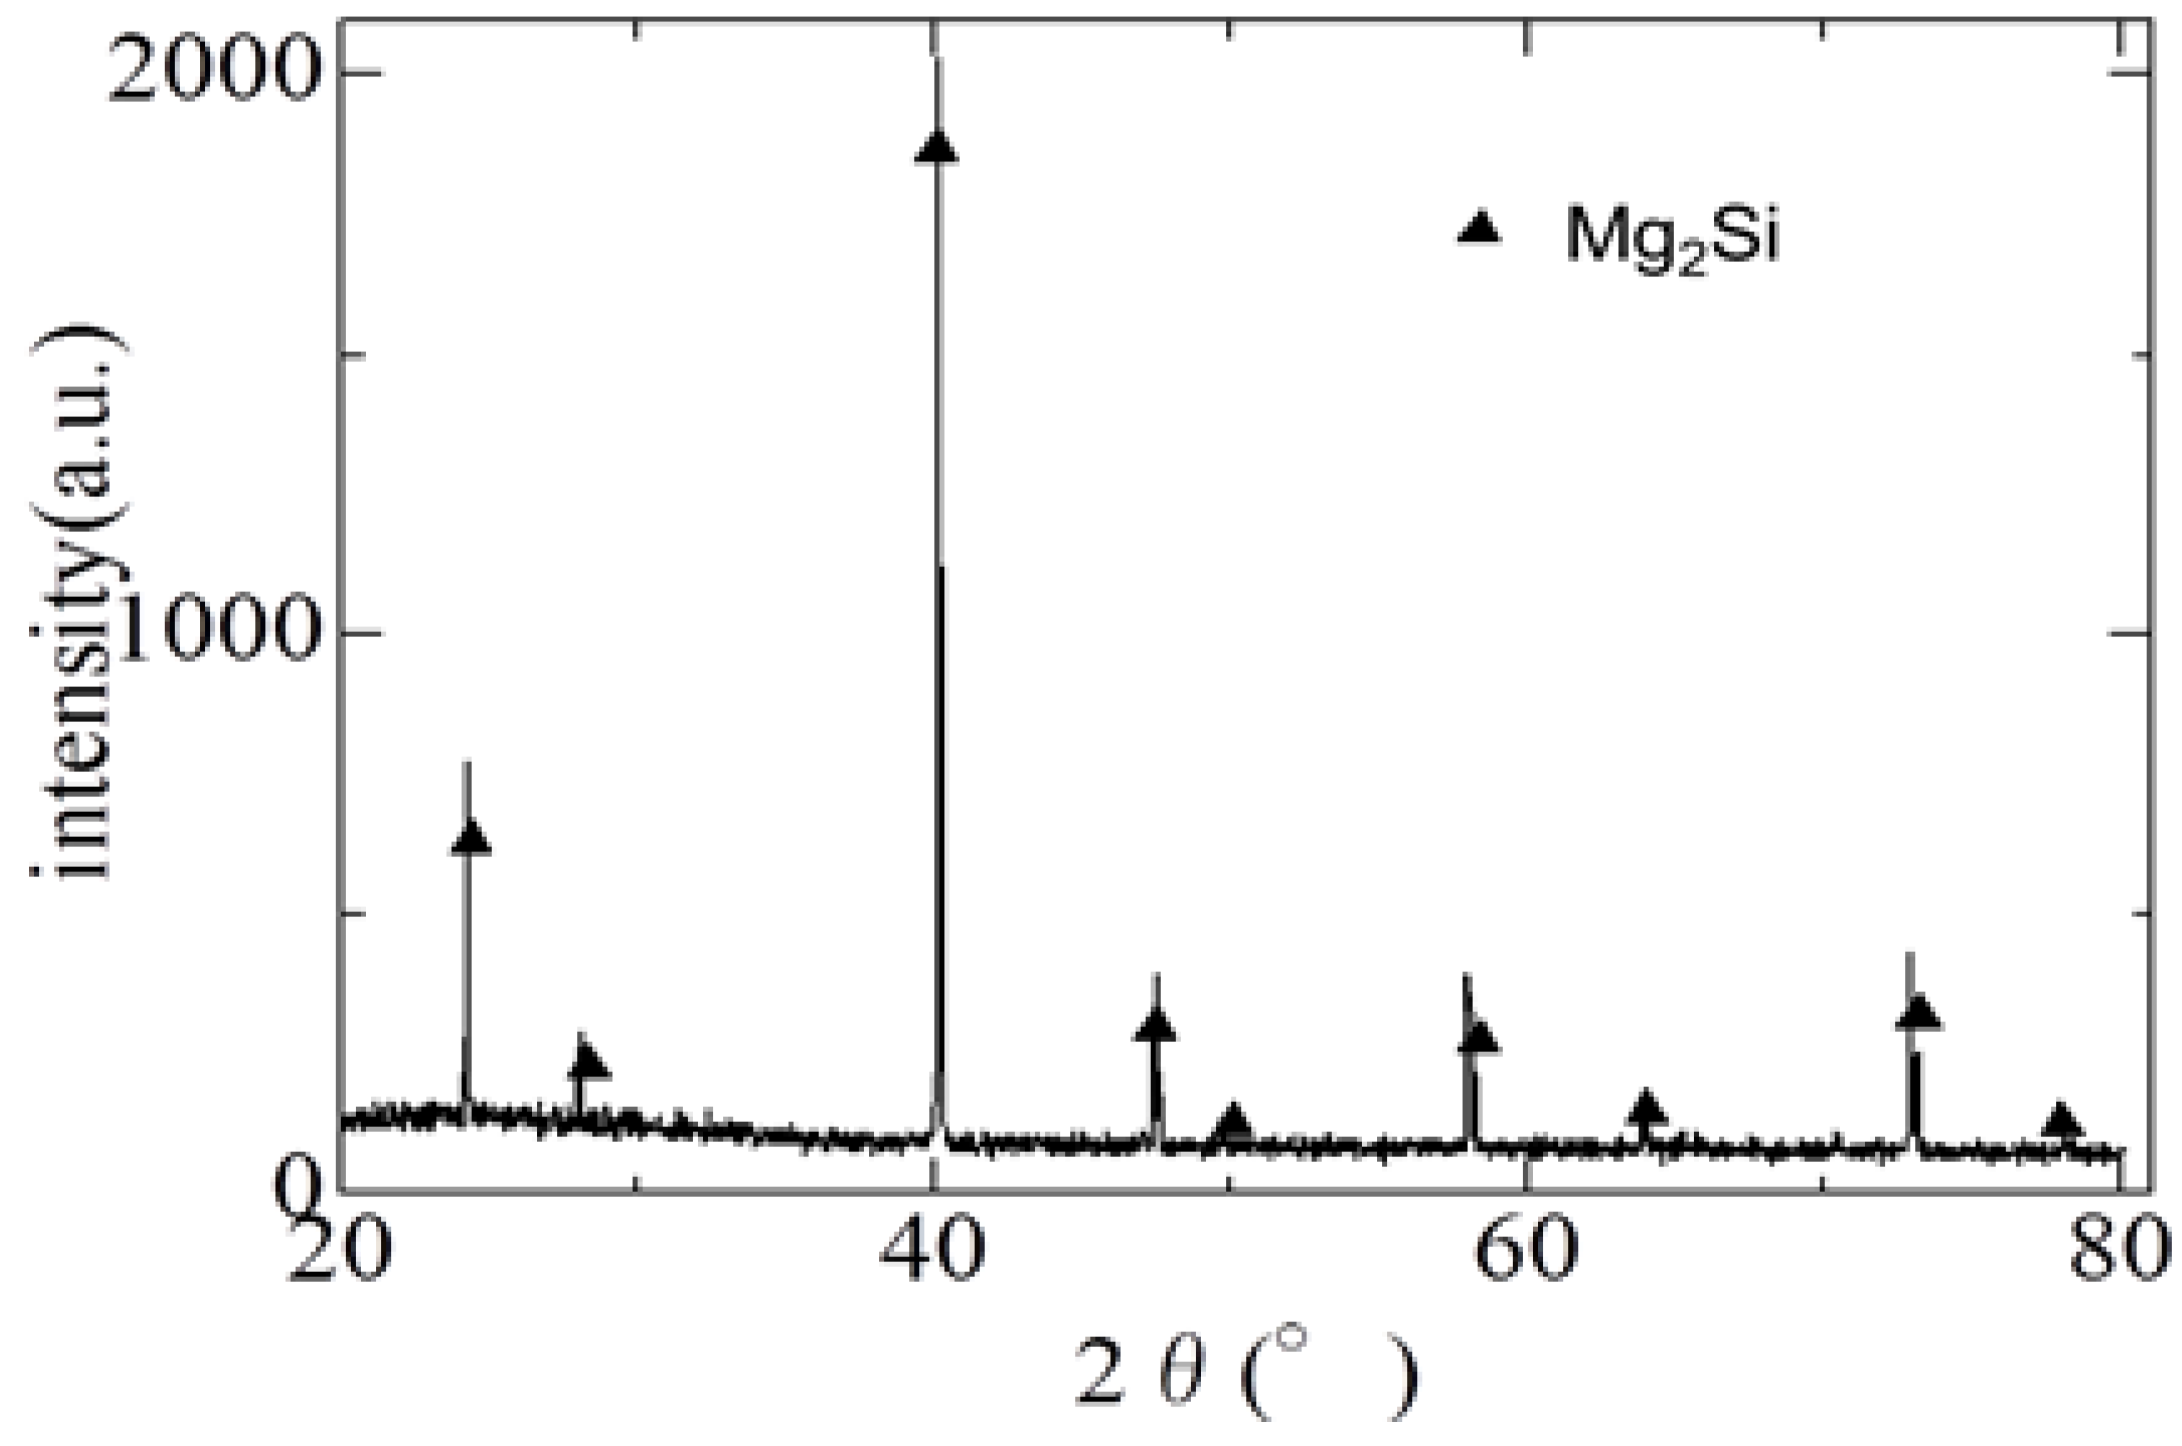
XRD studies as shown in
Figure 1 confirmed the occurrence of single phase Mg
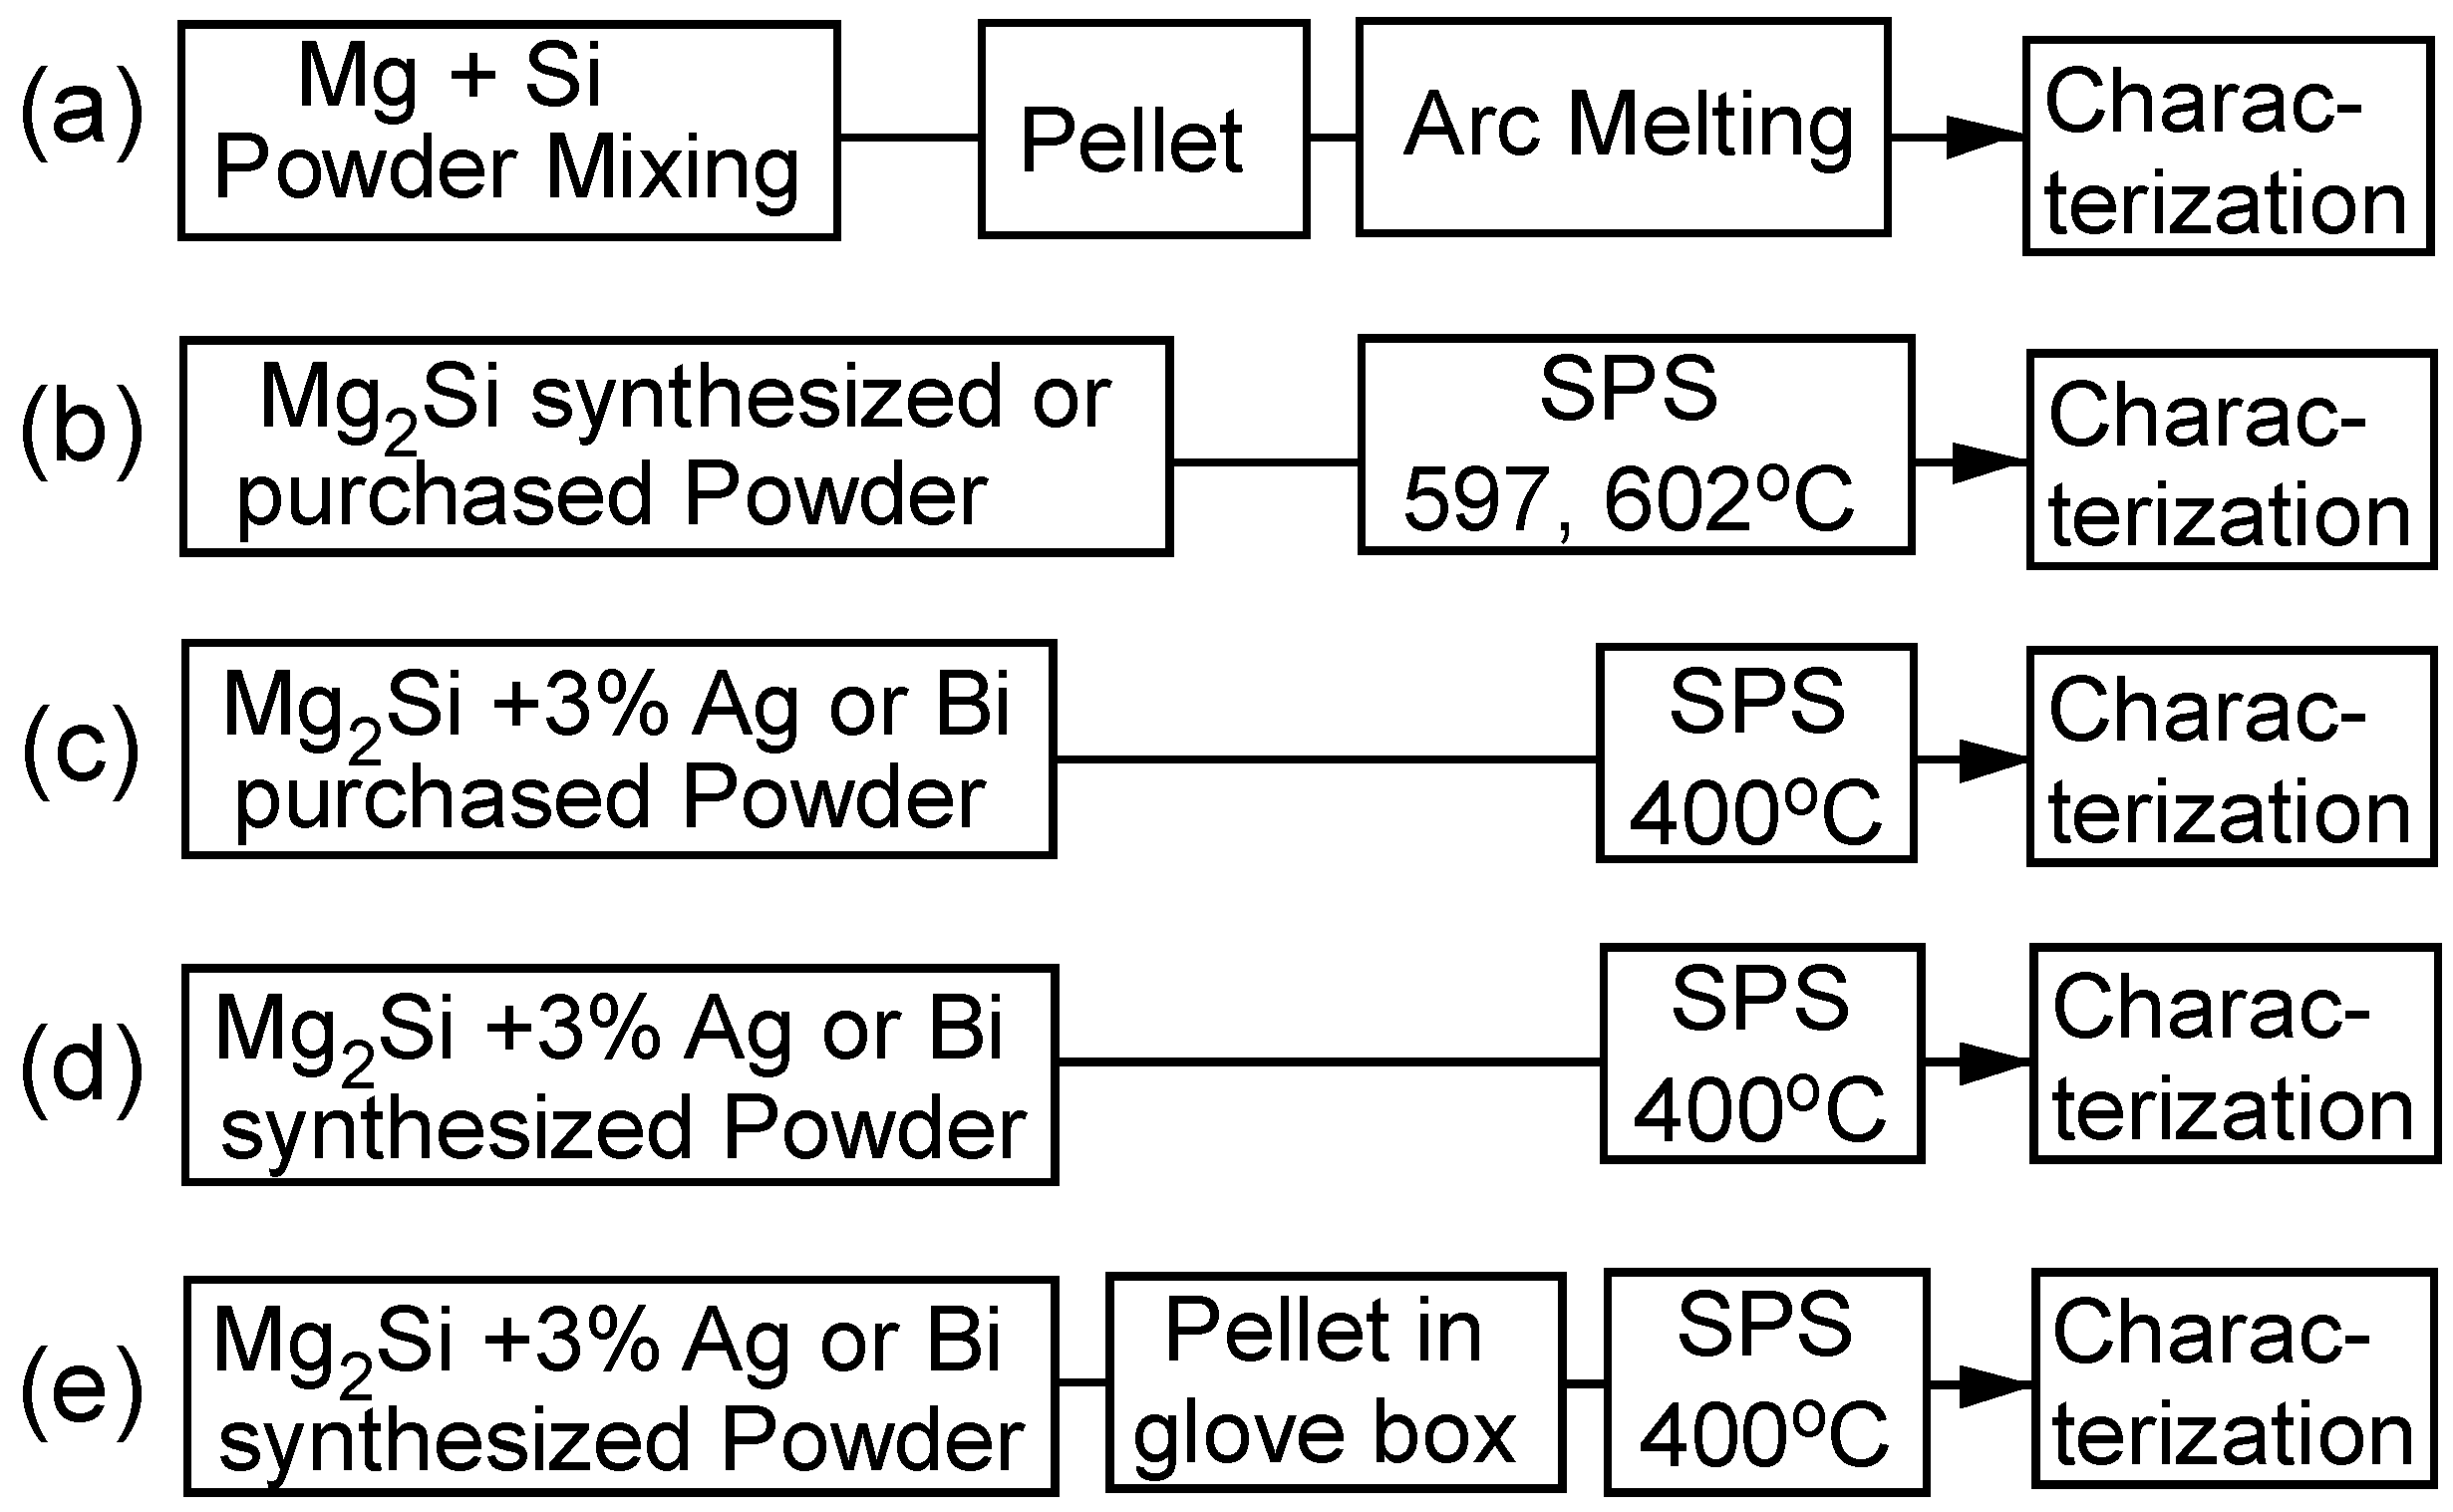
2Si powder by the new synthesizing method of cyclic hydrogen loading. There was no evidence for remaining starting materials Mg, Si, or their hydrides. The flow chart in
Figure 2 describes the different processing steps of this study. The first trial was conventional arc-melting (
Figure 2a). Although powder metallurgy is a popular processing method for many alloys, the direct processing from Mg and Si powder is not applicable for Mg
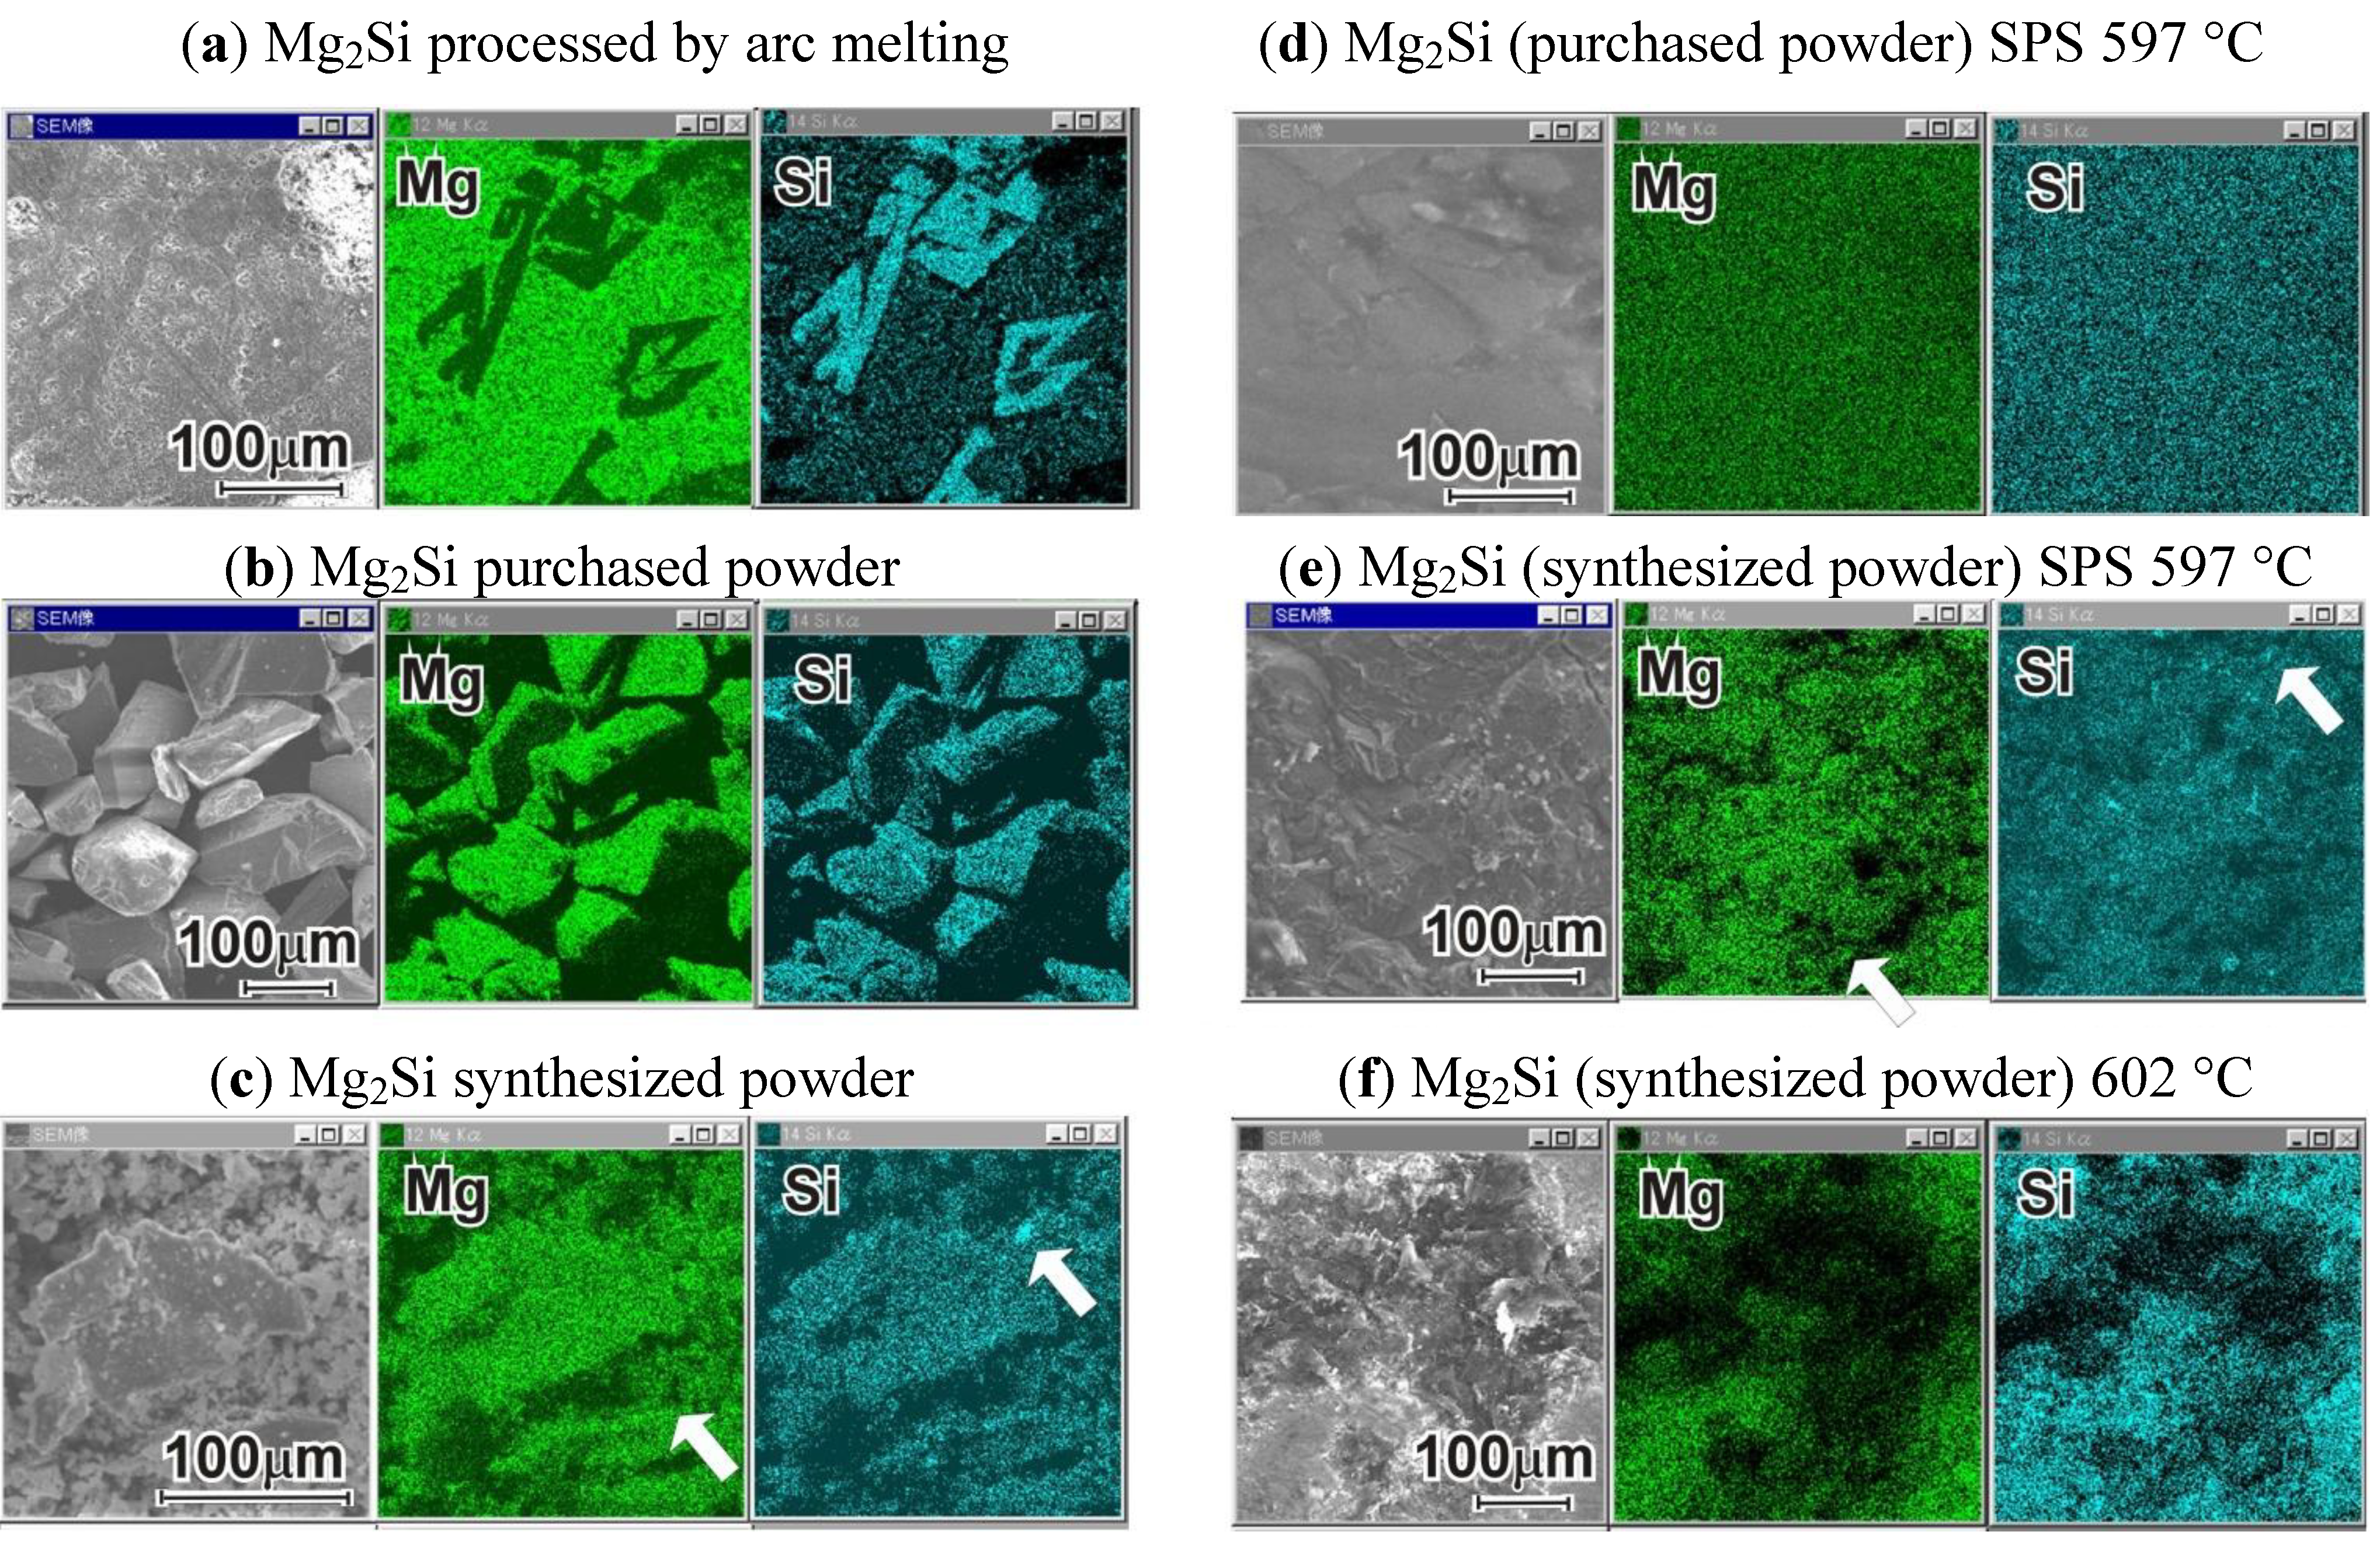
2Si, because the high vapor pressure of Mg prevents complete compaction. The microstructure (
Figure 3a) still consists of many parts which were not melted.
Figure 1.
XRD pattern of synthesized Mg2Si powder.
Figure 1.
XRD pattern of synthesized Mg2Si powder.
Figure 2.
Processing scheme for the different bulk specimens produced in this project.
Figure 2.
Processing scheme for the different bulk specimens produced in this project.
The next step (
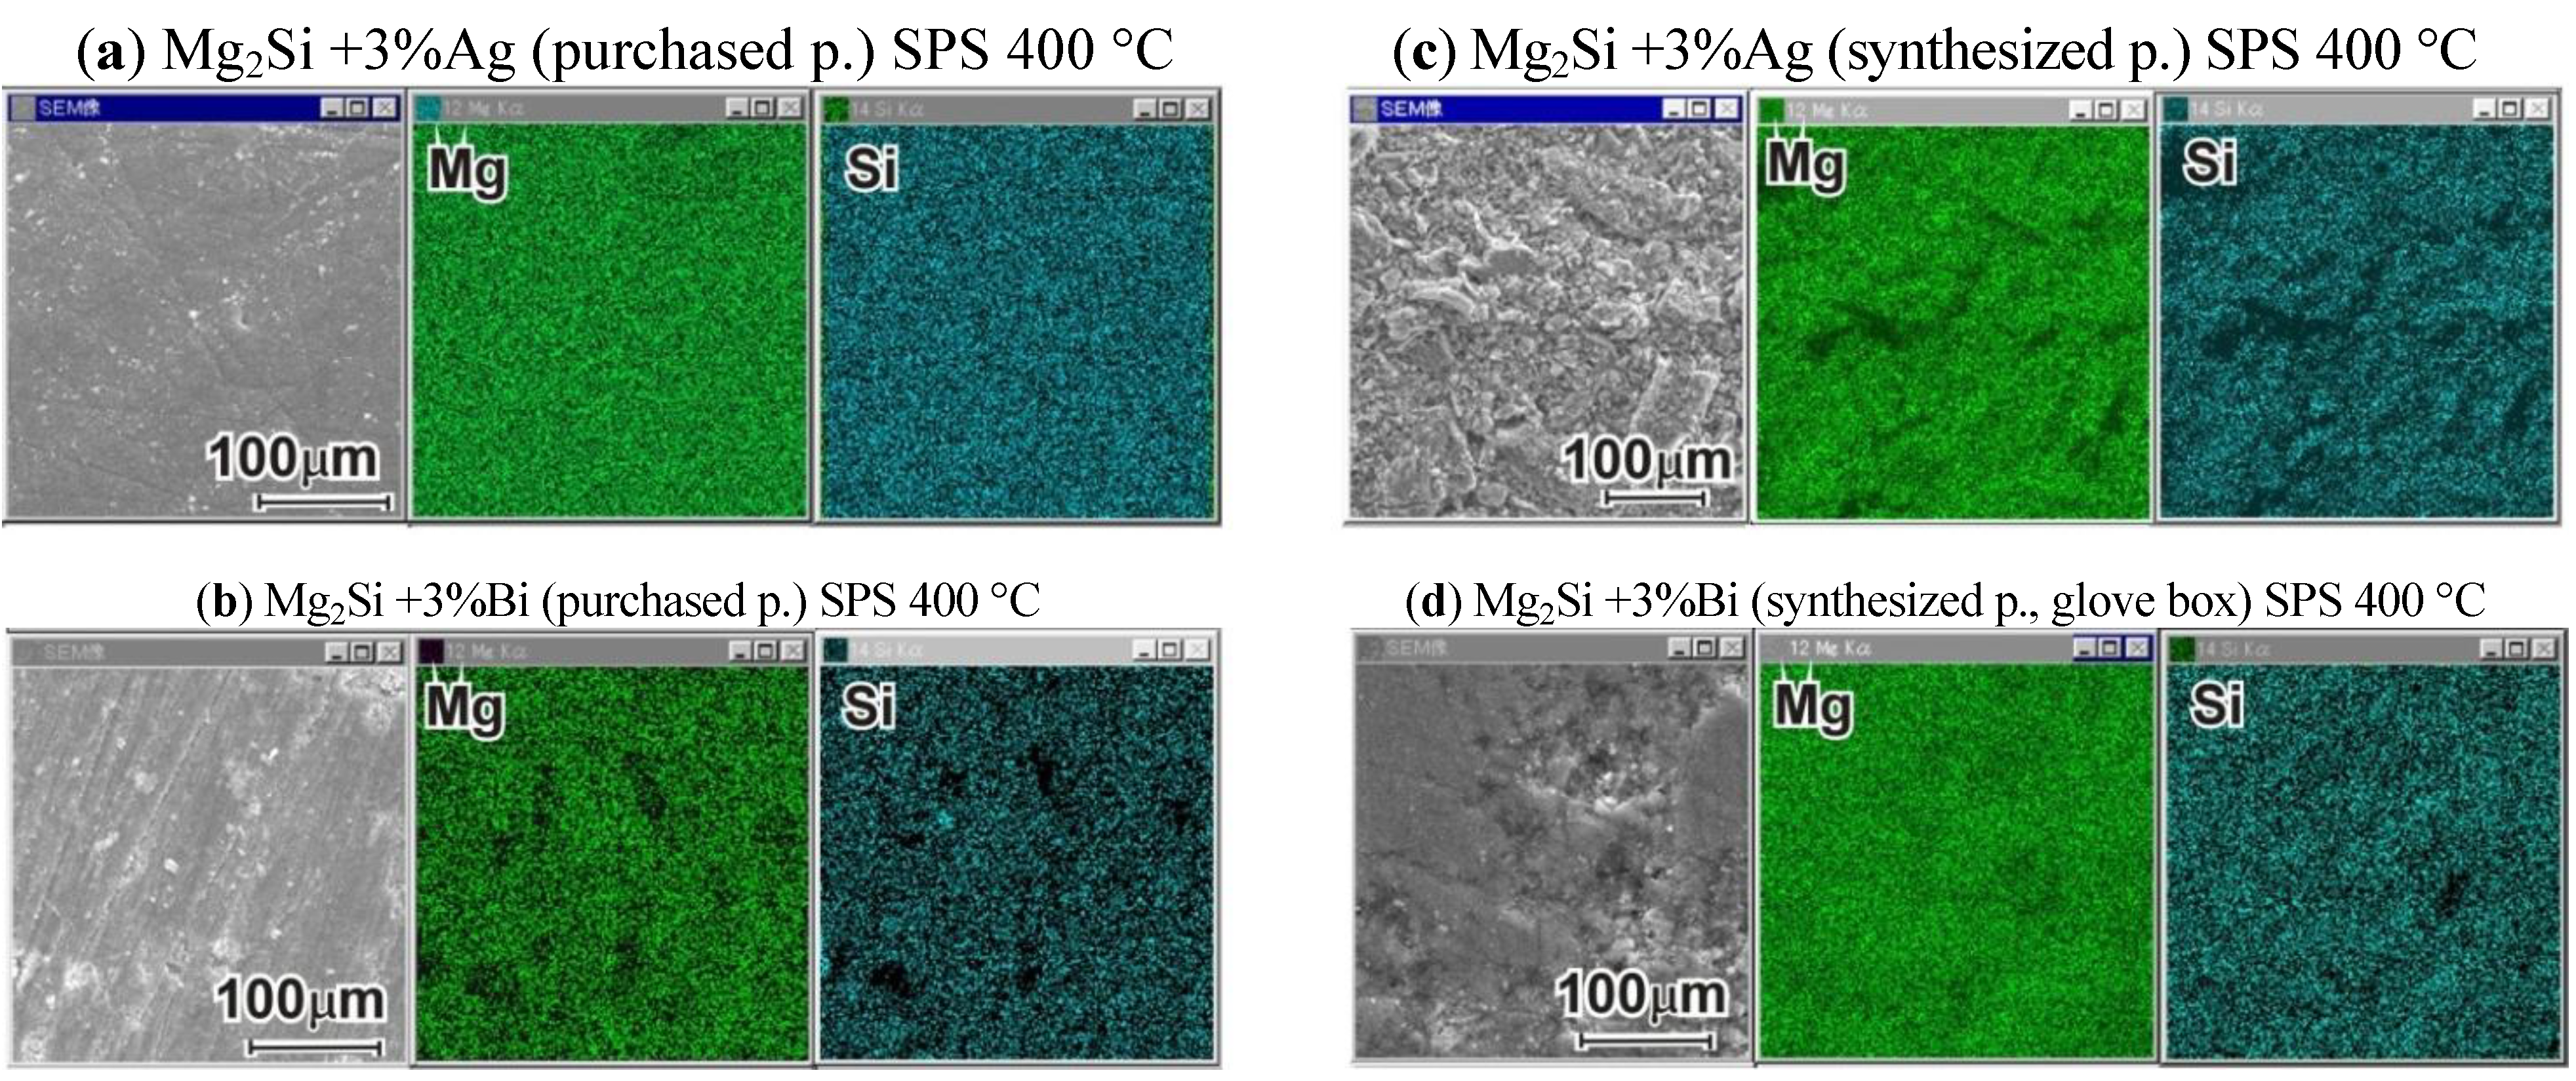
Figure 2b) was using both synthesized and purchased powders for optimization of the SPS sintering temperature. Previously, both types of powders were characterized by SEM. The EDX mapping confirmed the high degree of homogenization in close agreement with the XRD results. The fuzzy appearance of the synthesized powder (
Figure 3c) is caused by a higher surface area and hence higher reactivity compared to the sharp, crystalline surfaces of the purchased powder particles (
Figure 3b). The particle size was almost the same (100 µm) for both types of Mg
2Si powders. Then, the powders were compacted by SPS at temperatures of 627, 602, 597 and 400 °C for 600 s with compressive stress of 80 MPa [
34,
35]. At the sintering temperature 627 °C the vapor pressure of Mg was so high, that the container burst apart. The specimens produced from purchased powder showed a homogeneous microstructure (
Figure 3d), while those from synthesized powder shows a small amount of unreacted Si or Mg (
Figure 3c,e) as marked by arrows. The amount is less than 1%, so it could not be detected in XRD (
Figure 1). The larger surface area of the powder causes the remaining of nanometer-sized pores.
Figure 3.
SEM-EDX characterization of the (a) arc melted specimen; (b) purchased powder; (c) synthesized powder (d) Spark plasma sintering (SPS) specimen from purchased powder sintered at 597 °C; (e) SPS specimen from synthesized powder sintered at 597 °C; (f) SPS specimen from synthesized powder sintered at 602 °C.
The most serious problem of the samples from synthesized powder was, however, that these specimens (processing step
Figure 2b–d) showed radial cracks running outwards from a 1 mm un-cracked disc-shaped area at the center. The fast cooling rate after SPS is apparently a severe condition for bulk Mg
2Si with its extremely low fracture toughness of
KIC = 0.8 MPa/m
1/2 [
37]. Another reason, as confirmed by EDX, was the presence of a small amount of oxygen and carbon. As standard EDX measurements cannot quantitatively detect such low weight elements [
38], we estimate the amount as less than 2%. The number of cracks is further reduced when the SPS temperature was reduced to 400 °C (
Figure 4). Under this condition, only the Bi-doped specimens fall apart. Cracks were completely absent when the synthesized powder was compacted directly in the glove box attached to the reactor (processing step
Figure 2e). In these specimens EDX confirmed that C and O was now absent. The microstructure is almost identical to those produced from purchased powder, as seen in comparison of
Figure 4. We conclude that a reduction in the SPS sinter-temperature to 400 °C helped in preventing cracks, while this condition is still sufficiently high for successful processing of homogenous bulk specimens.
Figure 4.
SEM-EDX characterization of the bulk specimen produced from (a,b) purchased powder (a) Mg2Si + 3% Ag; (b) Mg2Si + 3% Bi, pellet in glove box and from (c,d) synthesized powder (c) Mg2Si + 3% Ag; (d) Mg2Si + 3% Bi, pellet in glove box.
Figure 4.
SEM-EDX characterization of the bulk specimen produced from (a,b) purchased powder (a) Mg2Si + 3% Ag; (b) Mg2Si + 3% Bi, pellet in glove box and from (c,d) synthesized powder (c) Mg2Si + 3% Ag; (d) Mg2Si + 3% Bi, pellet in glove box.
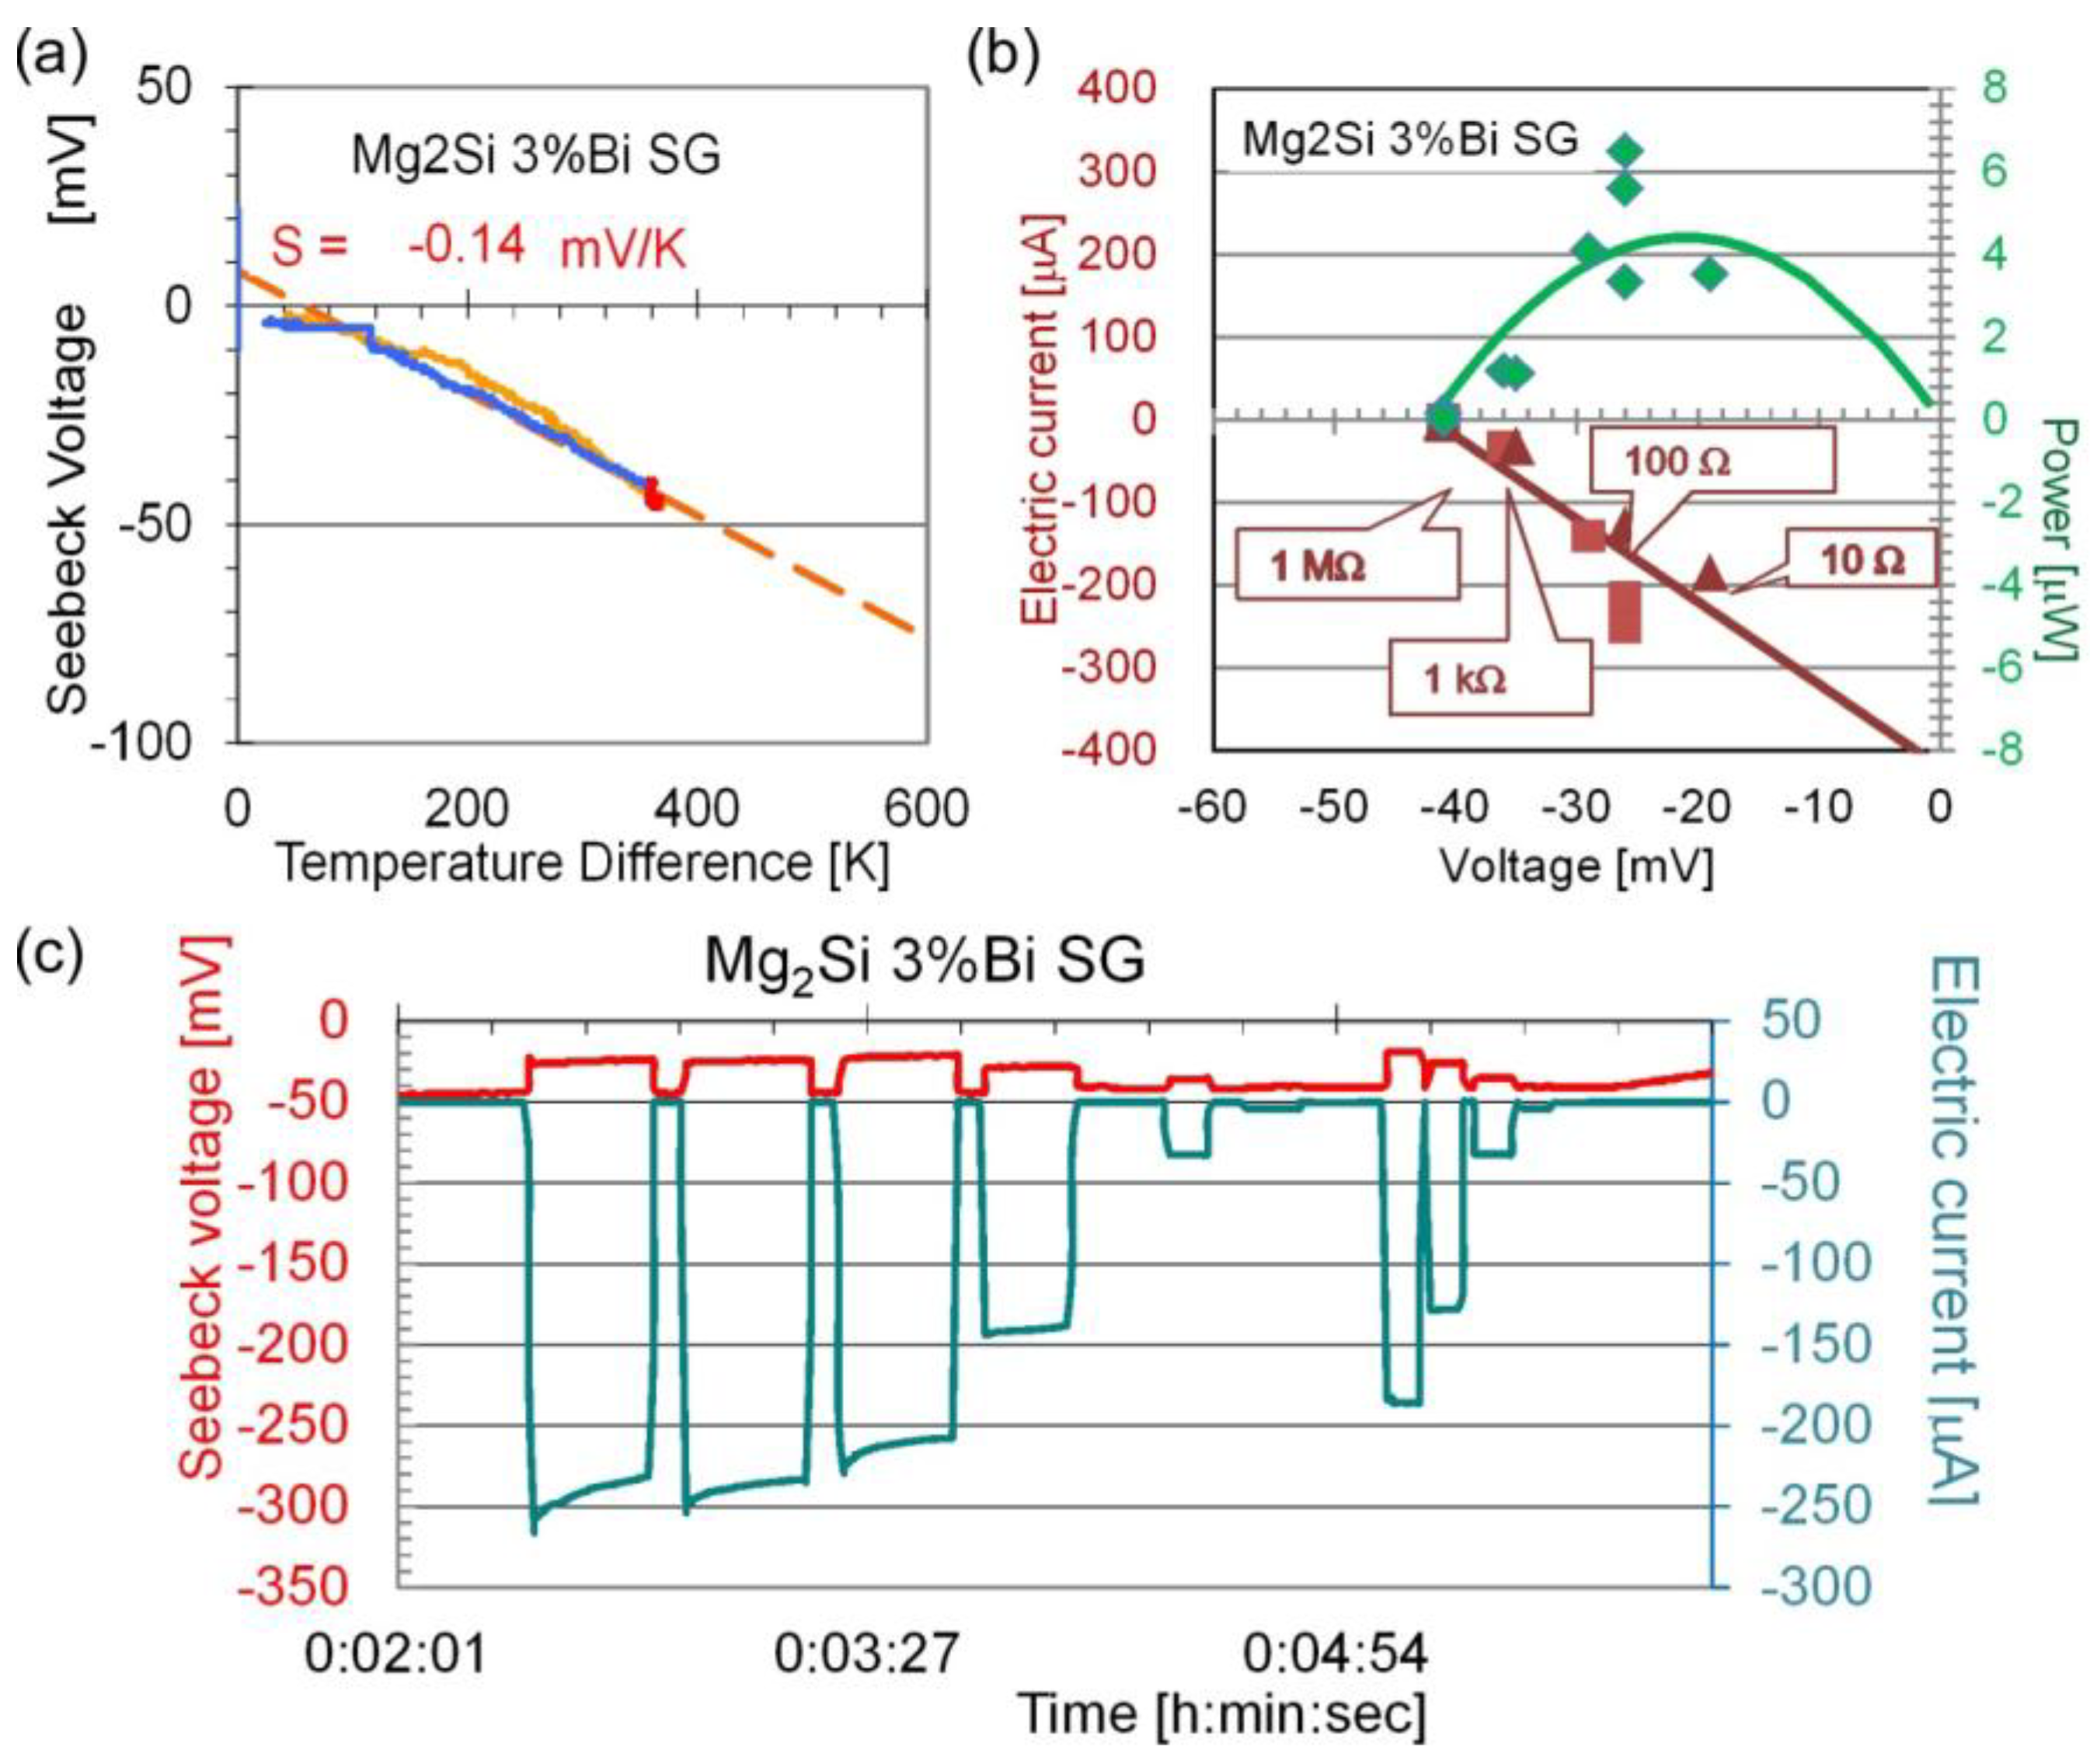
Figure 5.
Measurement of (a) Seebeck coefficient; (b) electric current and out-put power at ΔT = 363 K under load resistors as marked; (c) time dependence of voltage and electric current at ΔT = 363 K of the Mg2Si + 3%Bi specimen, which was SPS sintered at 400 °C from synthesized powder pressed under glove box.
The thermoelectric characterization was performed under conditions for applications with a large temperature gradient Δ
T =
Thot −
Tcold ≤ 600 K, where
Thot is the heated side, while
Tcold is kept at room temperature in the beginning and increases during the experiment to 200 °C due to heat flow. At first we show the results for the bulk specimen with the homogeneous microstructure. The specimen, which was produced from synthesized powder and compacted in the glove box, exhibits a Seebeck voltage of −40 mV at Δ
T = 400 K (
Figure 5a). In this figure the orange line represents heating, red line constant temperature for electric current measurements, and the blue line cooling. The hatched line marks the average slope which correspond to a Seebeck coefficient
S = −0.14 mV/K. When closing the electric circuit, an electric current is generated and the voltage drops as shown in
Figure 5b by red color. The generated power was calculated from
P =
I×
U and is displayed in green color. It reaches 5 µW for the fitted values marked as a line with maximum value of 6.5 µW. A phenomenon which was observed for all Mg
2Si, but not on most other materials tested in our laboratory [
6,
7,
34,
35,
36], is the decrease of electric current with time (
Figure 5c). The reason for this current drop, which is observed mostly at the beginning of the measurement, could be a mutual scattering of charge carriers during their generation. Another explanation is simply the negative temperature dependence of the Seebeck coefficient, when the measurement occurs beyond the peak temperature.
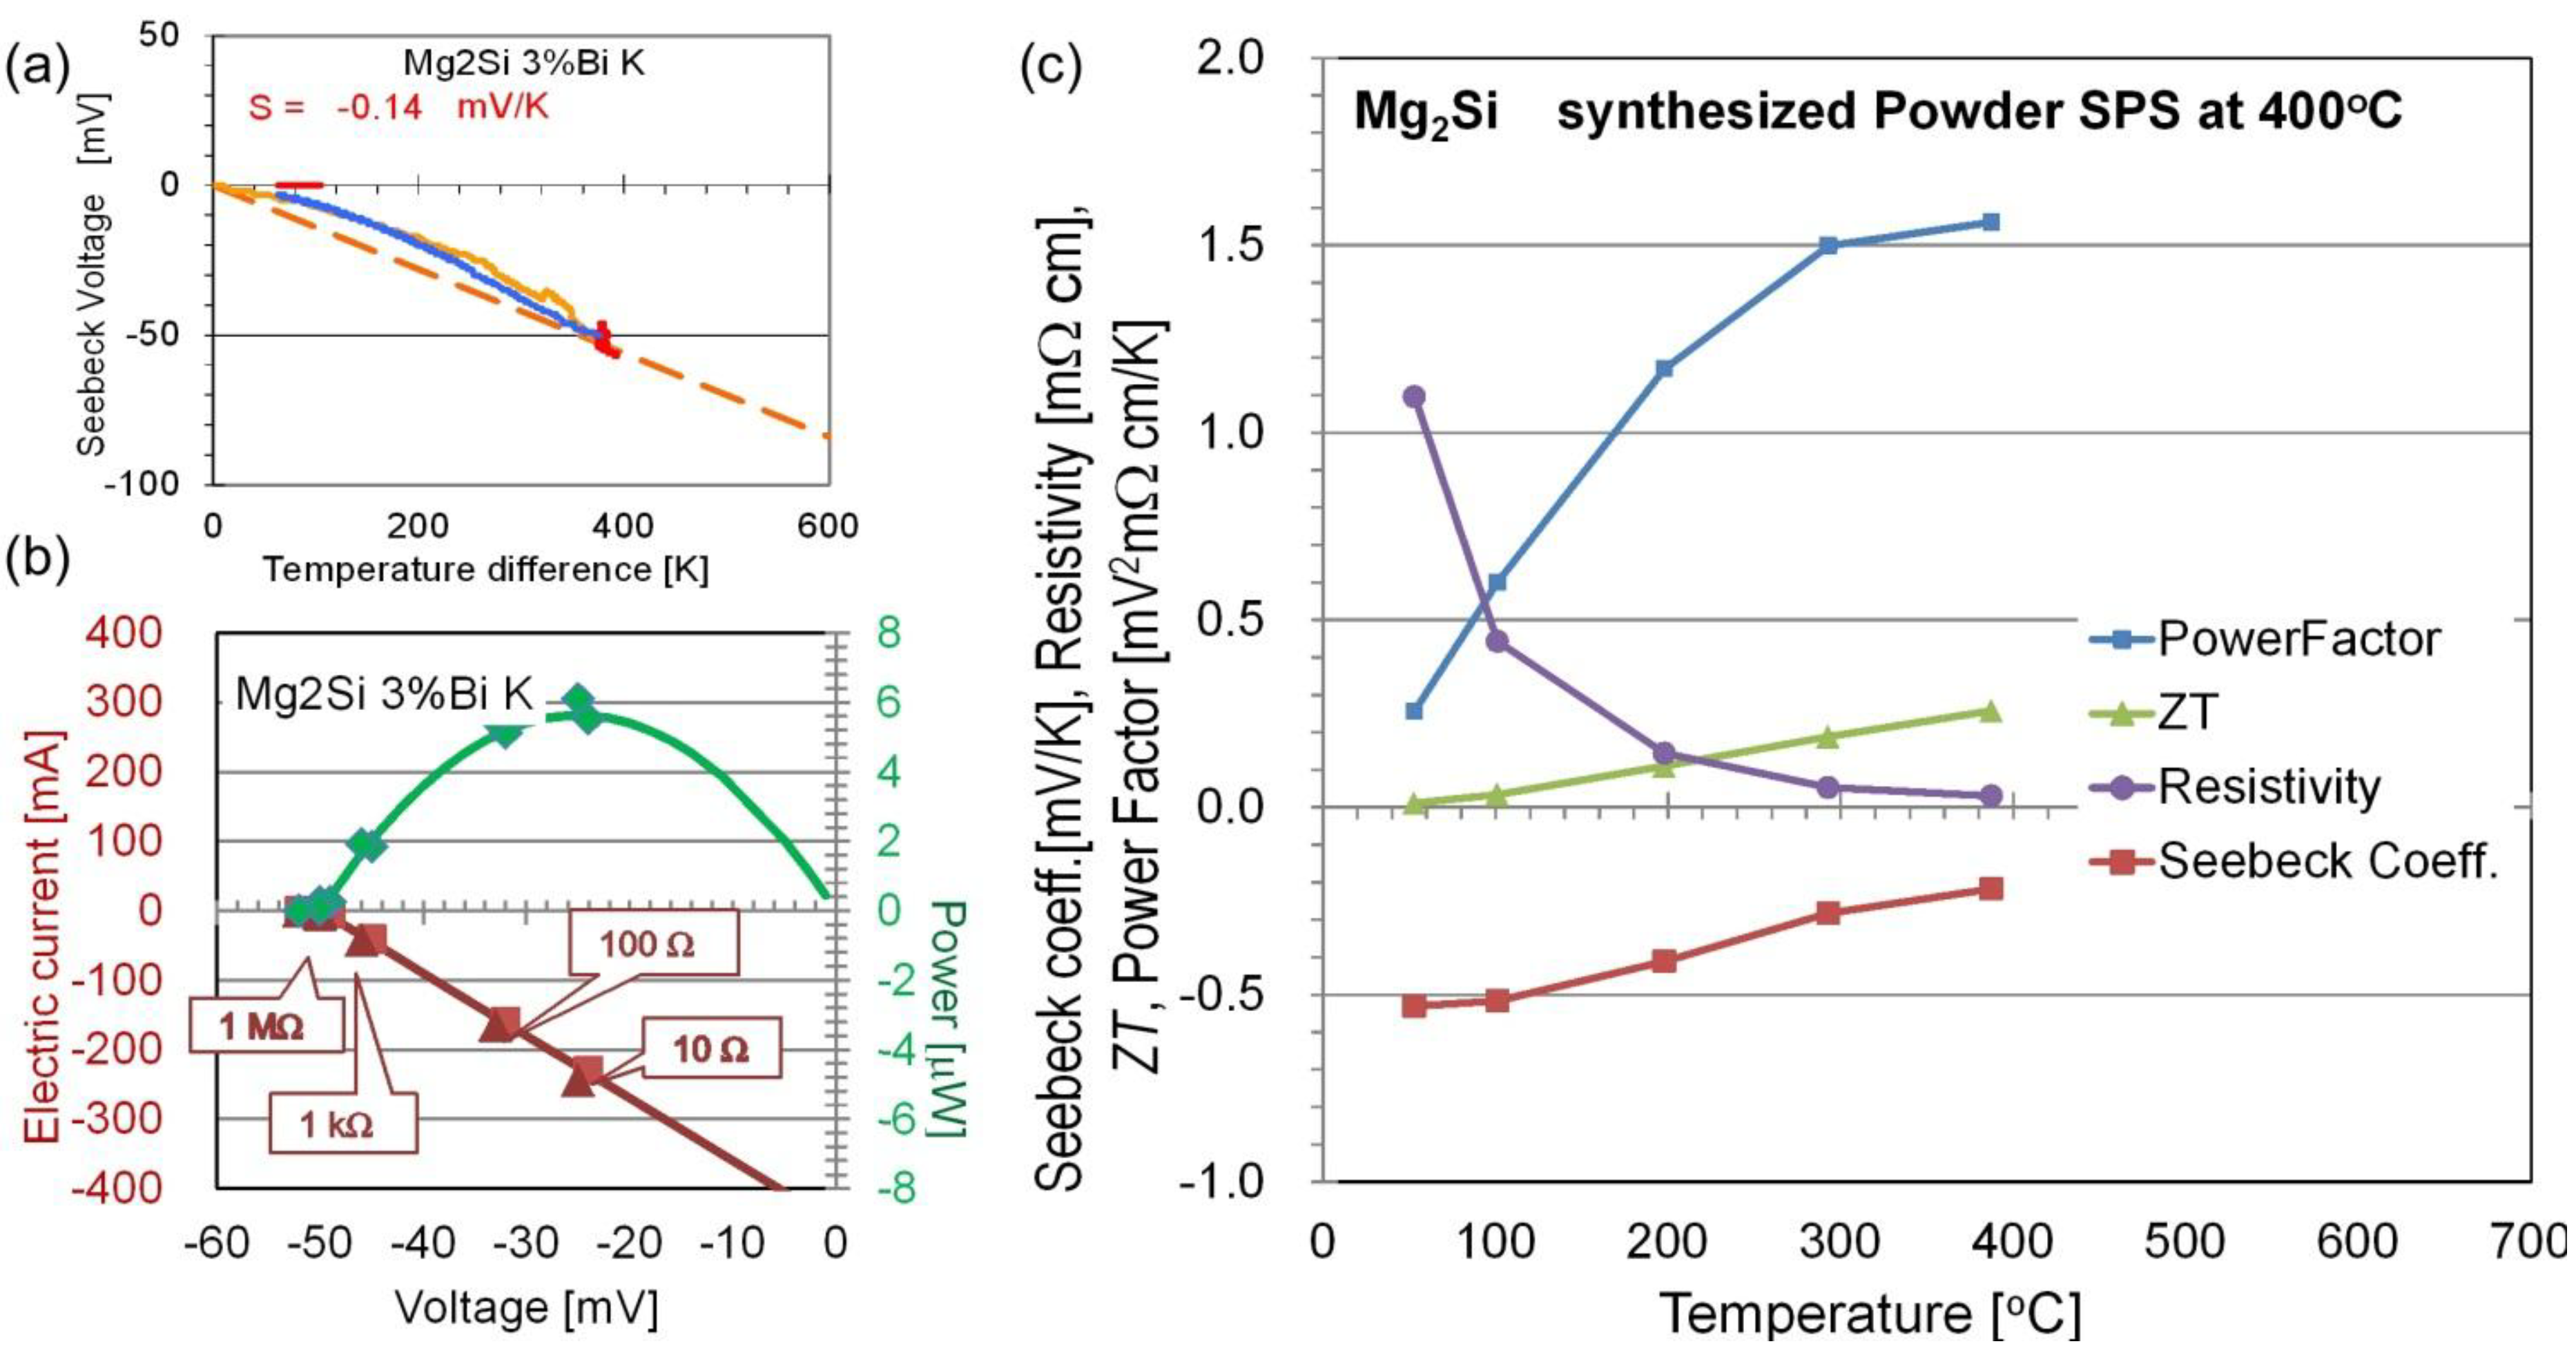
Figure 6.
Measurement of (a) Seebeck coefficient; (b) out-put power of the Mg2Si +3% Bi specimen SPS sintered at 400 °C from purchased powder; (c) Seebeck coefficient, resistivity, power factor (PF) and figure-of-merit ZT of the pure Mg2Si specimen SPS sintered at 400 °C from synthesized powder.
Figure 6.
Measurement of (a) Seebeck coefficient; (b) out-put power of the Mg2Si +3% Bi specimen SPS sintered at 400 °C from purchased powder; (c) Seebeck coefficient, resistivity, power factor (PF) and figure-of-merit ZT of the pure Mg2Si specimen SPS sintered at 400 °C from synthesized powder.
When compared with other specimens, the Bi-doped specimens show almost the same behavior regardless of which method they were produced by.
Figure 5 confirms
S = −0.14 mV/K,
Pmax = 6.0 µW for the specimen produced from purchased powder, and the same values for specimens produced by the route in
Figure 2d, and for pure Mg
2Si.
Figure 6c shows small Δ
T-measurements using ZEM3 on pure Mg
2Si sintered at 400 °C from synthetic powder. Mg2Si is known for its n-type behavior, and the Seebeck coefficient decreases from
S = −0.5 mV/K at room temperature to
S = −0.2 mV/K at
T = 400 °C. The resistivity shows the typical decrease for semiconductors with increasing temperature and intrinsic carrier concentration. Both temperature dependences can explain the nonlinear effects and time-dependent behavior of Seebeck voltage for the large Δ
T-measurements. The figure-of-merit reached
ZT = 0.258 at
T = 660 K, and was estimated using typical values for thermal conductivity 7.8 to 4.0 W/m/K at
T = 323 K and 623 K [
20,
21].
The Mg
2Si specimen produced by arc melting according to route in
Figure 2a shows a small
S = −0.10 mV/K (not shown), but a rather high electric current,
Imax = 180 µA, yielding an output power of
P = 2.8 µW, in spite of its inhomogeneous microstructure (
Figure 3a). The high density of the arc-melted specimen yielded low resistivity, hence large electric current, but the occurrence of several phases is responsible for the small decrease in the Seebeck coefficient. Other specimens produced according to the SPS-routes as summarized in
Figure 2b, and
Figure 4b,c behave similarly as the above shown SPS-specimens exhibited Seebeck coefficients of
S = −0.19 mV/K,
Imax= −100 µA and
Pmax = 4 µW. In parti-cular, there is not much difference in the Seebeck coefficient, when comparing between synthesized or purchased powder.
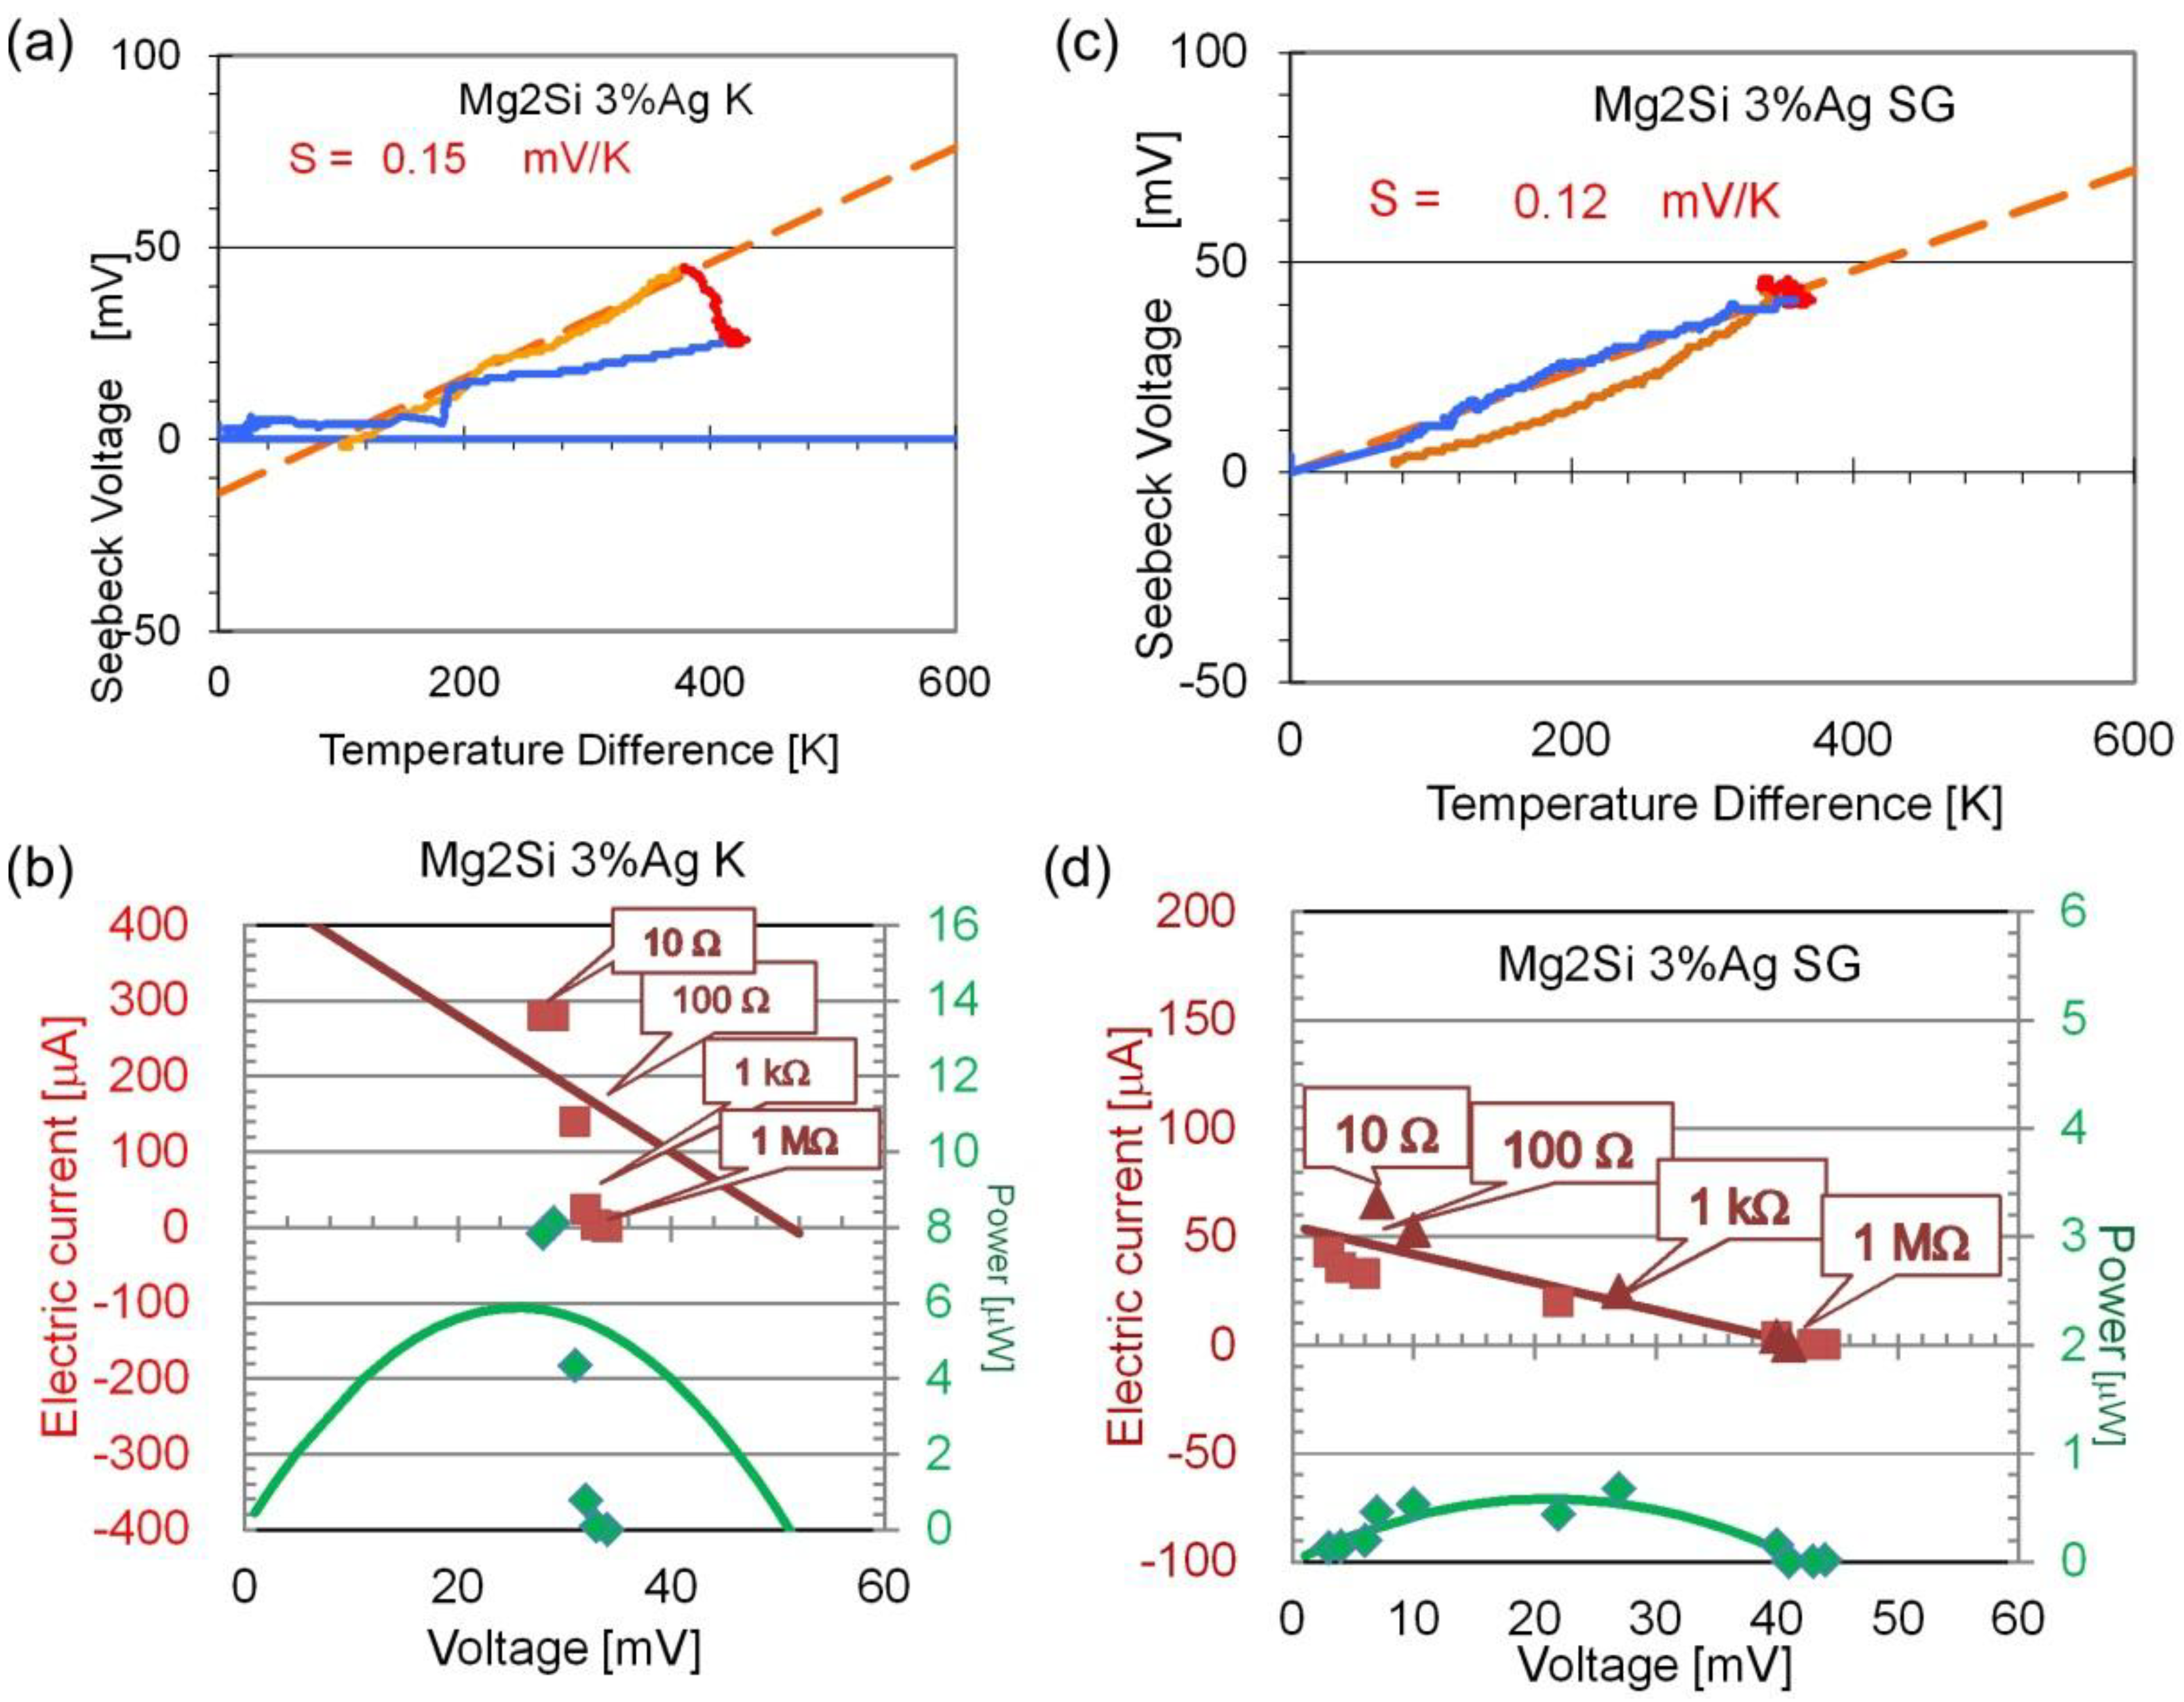
Figure 7.
Measurement of (a,c) Seebeck coefficient; (b,d) out-put power for the (a,b) Mg2Si + 3%Ag specimen SPS sintered at 400 °C from purchased powder, and (c,d) for the Mg2Si + 3%Ag specimen SPS sintered at 400 °C from synthesized powder pressed in glove box.
Figure 7.
Measurement of (a,c) Seebeck coefficient; (b,d) out-put power for the (a,b) Mg2Si + 3%Ag specimen SPS sintered at 400 °C from purchased powder, and (c,d) for the Mg2Si + 3%Ag specimen SPS sintered at 400 °C from synthesized powder pressed in glove box.
Finally, the p-type Mg
2Si doped with 3 at% Ag as shown in
Figure 7a,b, confirmed
S = +0.15 mV/K and very large electric current of
Imax = 300 µA, resulting in output power of
Pmax = 8 µW for the purchased powder according to route in
Figure 2c. For synthesized power according to route in
Figure 2d,e, the Seebeck coefficient is similar.
S = +0.12 mV/K, but electric current is reduced to
Imax = 50 µA, yielding an output power of less than
P = 1 µW (
Figure 7d). A shallow inclination of the
I-
U curve (
Figure 7d) means a large inner resistance of a power source and is obviously caused either by
O-, or
C-impurities or remaining pores. On the other hand, a steep inclination as in
Figure 6d is typical for dense specimens or those with metallic-like behavior, e.g., (Ti,Zr)NiSn half Heusler-alloys [
6] or clathrathes [
7]. Checking this issue at n-type specimens, it should be noted that the slope is in between the two extremes. However, it is remarkable that all measured data points lay on the left side of the arch-type power dependence curve (
Figure 5b,
Figure 6b). In n-type materials, electrons are considered to be the majority of the carriers, while in p-type materials the holes are in majority. As Mg
2Si is one of the best-characterized materials concerning carrier concentration and their mobility, an explanation would be easily found if more data on p-type materials with different impurity levels were available. Another fact deduced form this measurement is that the temperature dependence of the Seebeck voltage is almost linear even under large temperature gradient, when the material consists of single phase. For phase mixtures as in
Figure 3a, or
Figure 7a, the Seebeck voltage increases during heating with fast heating rate, but decreases with a smaller slope during cooling. These differences are considered to be caused by charges on grain boundaries. Our research results confirmed that Mg
2Si is a robust thermoelectric material with large and constant
S = +/−0.15 mV/K,
Imax and
Pmax values under different processing routes. Assuming the same thermal conductivity behavior [
20,
21], we could confirm the improvement of σ by adding 3% Bi [
21] and reached a figure of merit
ZT around 0.45.
3. Experimental Section
Mg
2Si powder was produced by a novel method starting from MgH
2, to which Si is added in a vacuum vessel. By isothermal increase of the H
2-pressure, the sorption rate of the mixed powder increases, a phenomenon that is known by its inventor as Sieverts’ method or manometric method. Powders of Mg (3N, 180 µm) and Si (2N, 300 µm) were put in the stainless reactor. After raising the temperature to 623 K, H
2 (99.99999%) flows into the reactor from the gas collector system. When the pressure was reduced towards a constant value, the reactor was evacuated. Such loading and de-loading cycles were repeated 10 times. The system starts initially from the separated phases
The backward reaction occurs during releasing the hydrogen pressure, the system changes its behavior after about five or six cycles. The backward reaction transforms under the gain of enthalpy towards mixture of both phases
This behavior has been discovered on MgAl alloys [
26,
27] and was initially investigated for the purpose of hydrogen storage. In the presence of Si, the initial H
2 absorption by Mg is significantly lower than that of the pure Mg-H system, so the number of cycles needed for the formation of Mg
2Si phase from Mg and Si phases is higher than for other Mg alloys, such as MgAl. We report here for the first time that this synthesis method works efficiently as a new method for producing Mg
2Si alloys.
For comparison, the following compaction processing was also performed for pure Mg2Si powder (Fine Chemicals Ltd., Tokyo, Japan) as purchased. For n- and p-doping 3 at% of either, Bi- or Ag-powders were added. In these experiments, an excess amount of 2% Si was added. To avoid exposure of the highly reactive synthesized powder it was found to be advantageous to load the carbon crucible and compact the powder directly in the glove box attached to the reactor. The synthesized powder was characterized by X-ray diffraction (XRD) analysis using a Rigaku Miniflex (Tokyo, Japan) device with Cu-source and wavelength of 1.514 nm. Simulation of the XRD-patterns was performed with the CaRine V3 software (Divergent S.A., Compiegne, France).
The powder was then compacted in a carbon crucible with a diameter of 15 mm and attached into a spark-plasma machine “Dr Sinter 1080” (SPS-Syntex Inc, Tokyo, Japan). A maximum pressure of 80 MPa was applied and kept constant, while temperature, spark plasma voltage and current were increased during 180 s heating and kept constant during the 600 s sintering time; for details see a similar experiment on other materials [
34,
35].
Both the synthesized powders as well as the sintered bulk specimens were characterized concerning their microstructure and composition by using a Hitachi (Tokyo, Japan) 3200-N scanning electron microscope (SEM) operated at 20 kV and equipped with an electron dispersive X-ray spectrometer (EDX, Horiba, Tokyo, Japan) EMAX-2770). The thermoelectric voltage was measured against nickel wires with a distance of 10 mm in a home-made device when applying a temperature difference between the micro-ceramic heater (Sakaguchi Ltd, Tokyo, Japan) MS 1000, error bar +/−5 mV) up to Δ
T = 650 K, by maintaining the cold end at around 200 °C [
35,
36]. Measurements on other thermoelectrics confirmed good agreement compared to the usual TE-characterization at Δ
T = 10 K using the device ZEM 3 from Ulvac Ltd, Yokohama, Japan [
4,
13,
20], which was also used for reference measures. When undertaking the measurement with large Δ
T, the electric circuit is closed with different resistor loads (10 Ω, 100 Ω, 1 kΩ, 1 MΩ), the voltage drops, and the electric current starts to flow. Four electric multi-meters PC510 (Sanwa, Tokyo, Japan) recorded these data simultaneously on a computer. The
I-
U characteristics were fitted with a straight line, which is proportional to the internal resistance, and the output power was calculated. The densities of the specimens were calculated from their mass-to-volume ratio, where the specimen dimensions were measured by a caliper.

